
Damage Evaluation of T-Stub Connected to Hollow Section Column Using Blind Bolts under Tension

Abstract
:1. Introduction
2. Experimental Investigation
2.1. Test Specimens
2.2. Material Properties
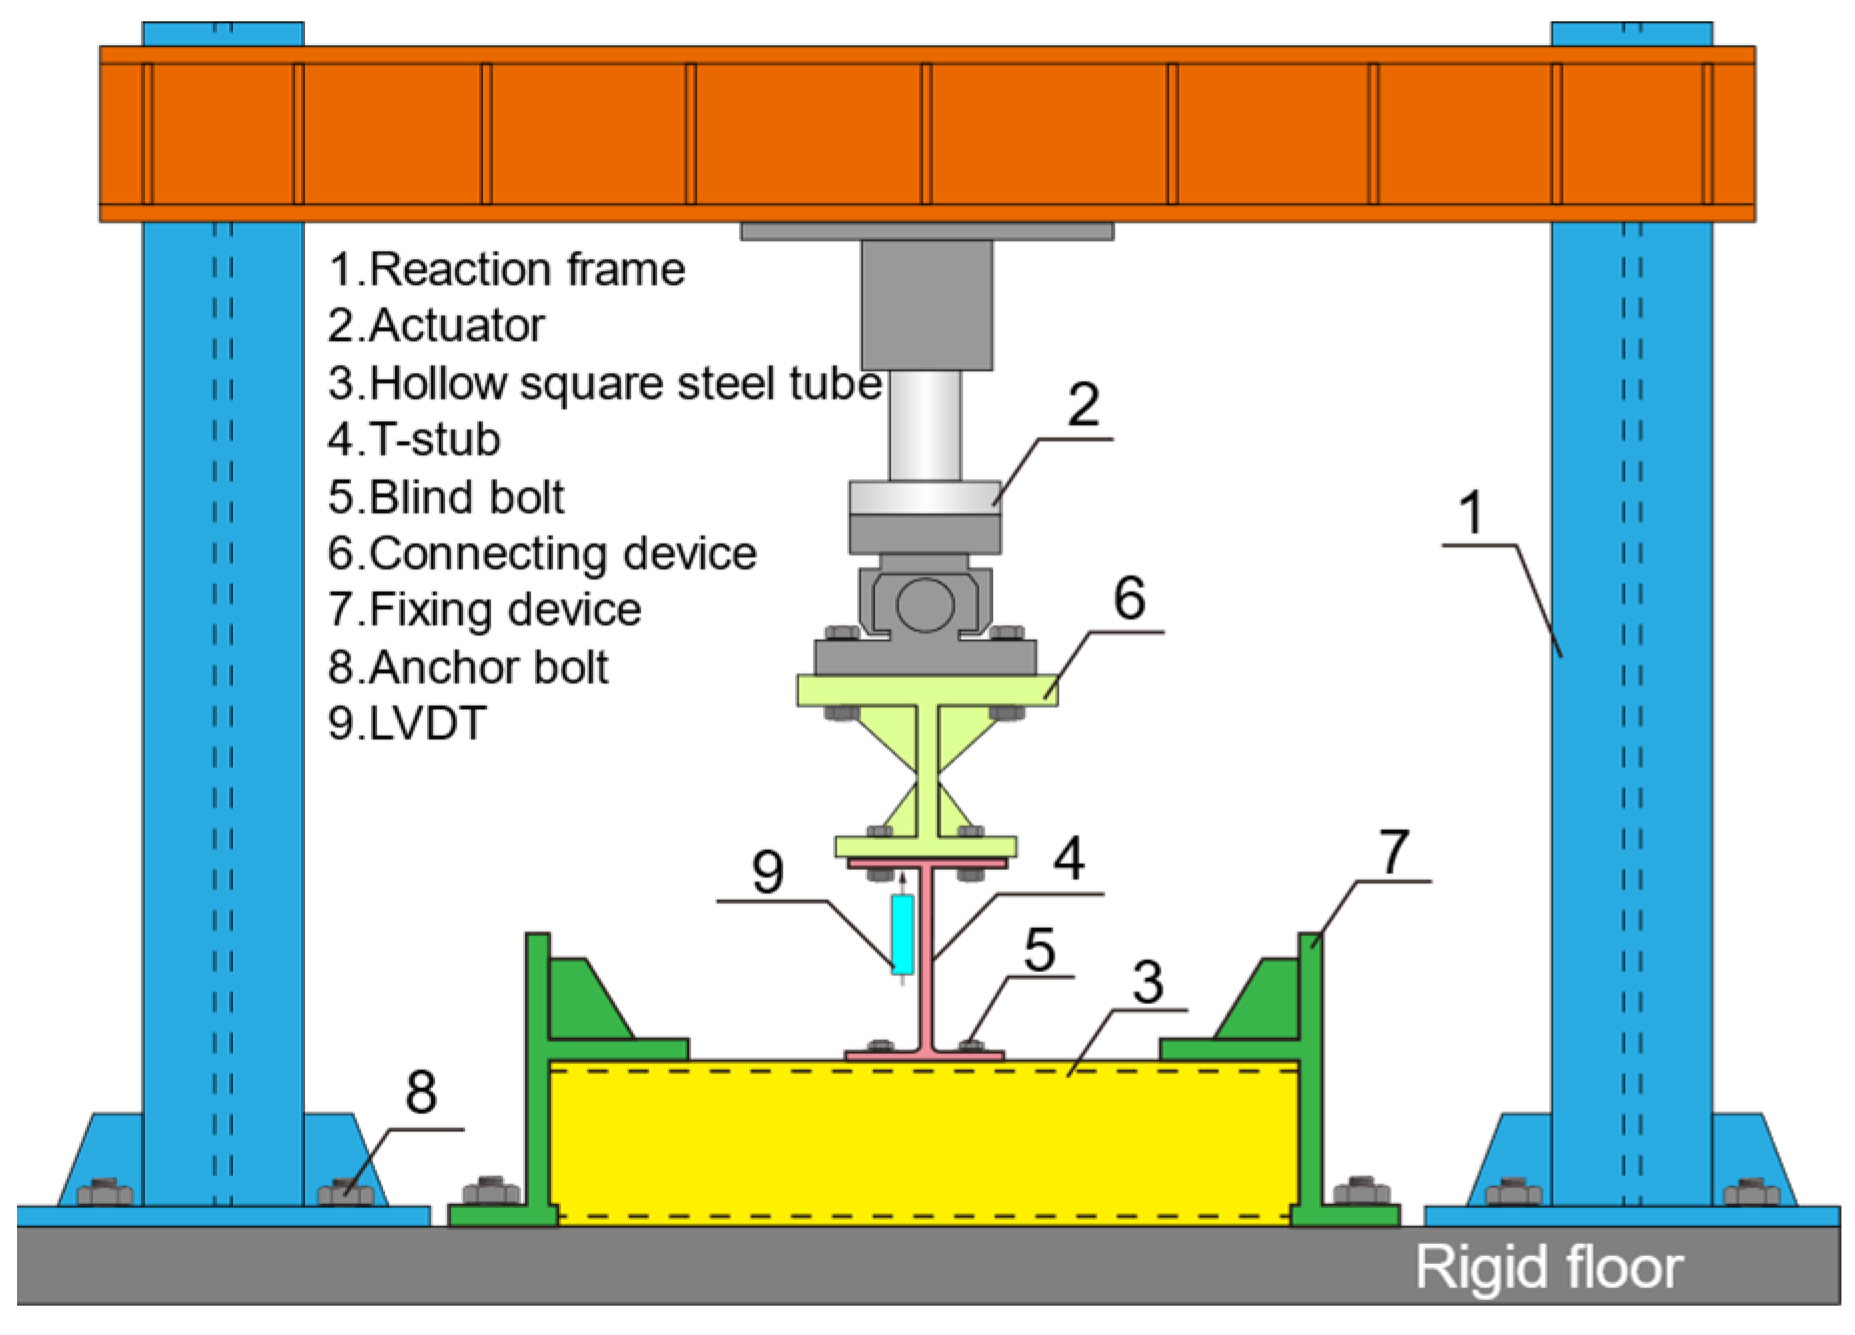
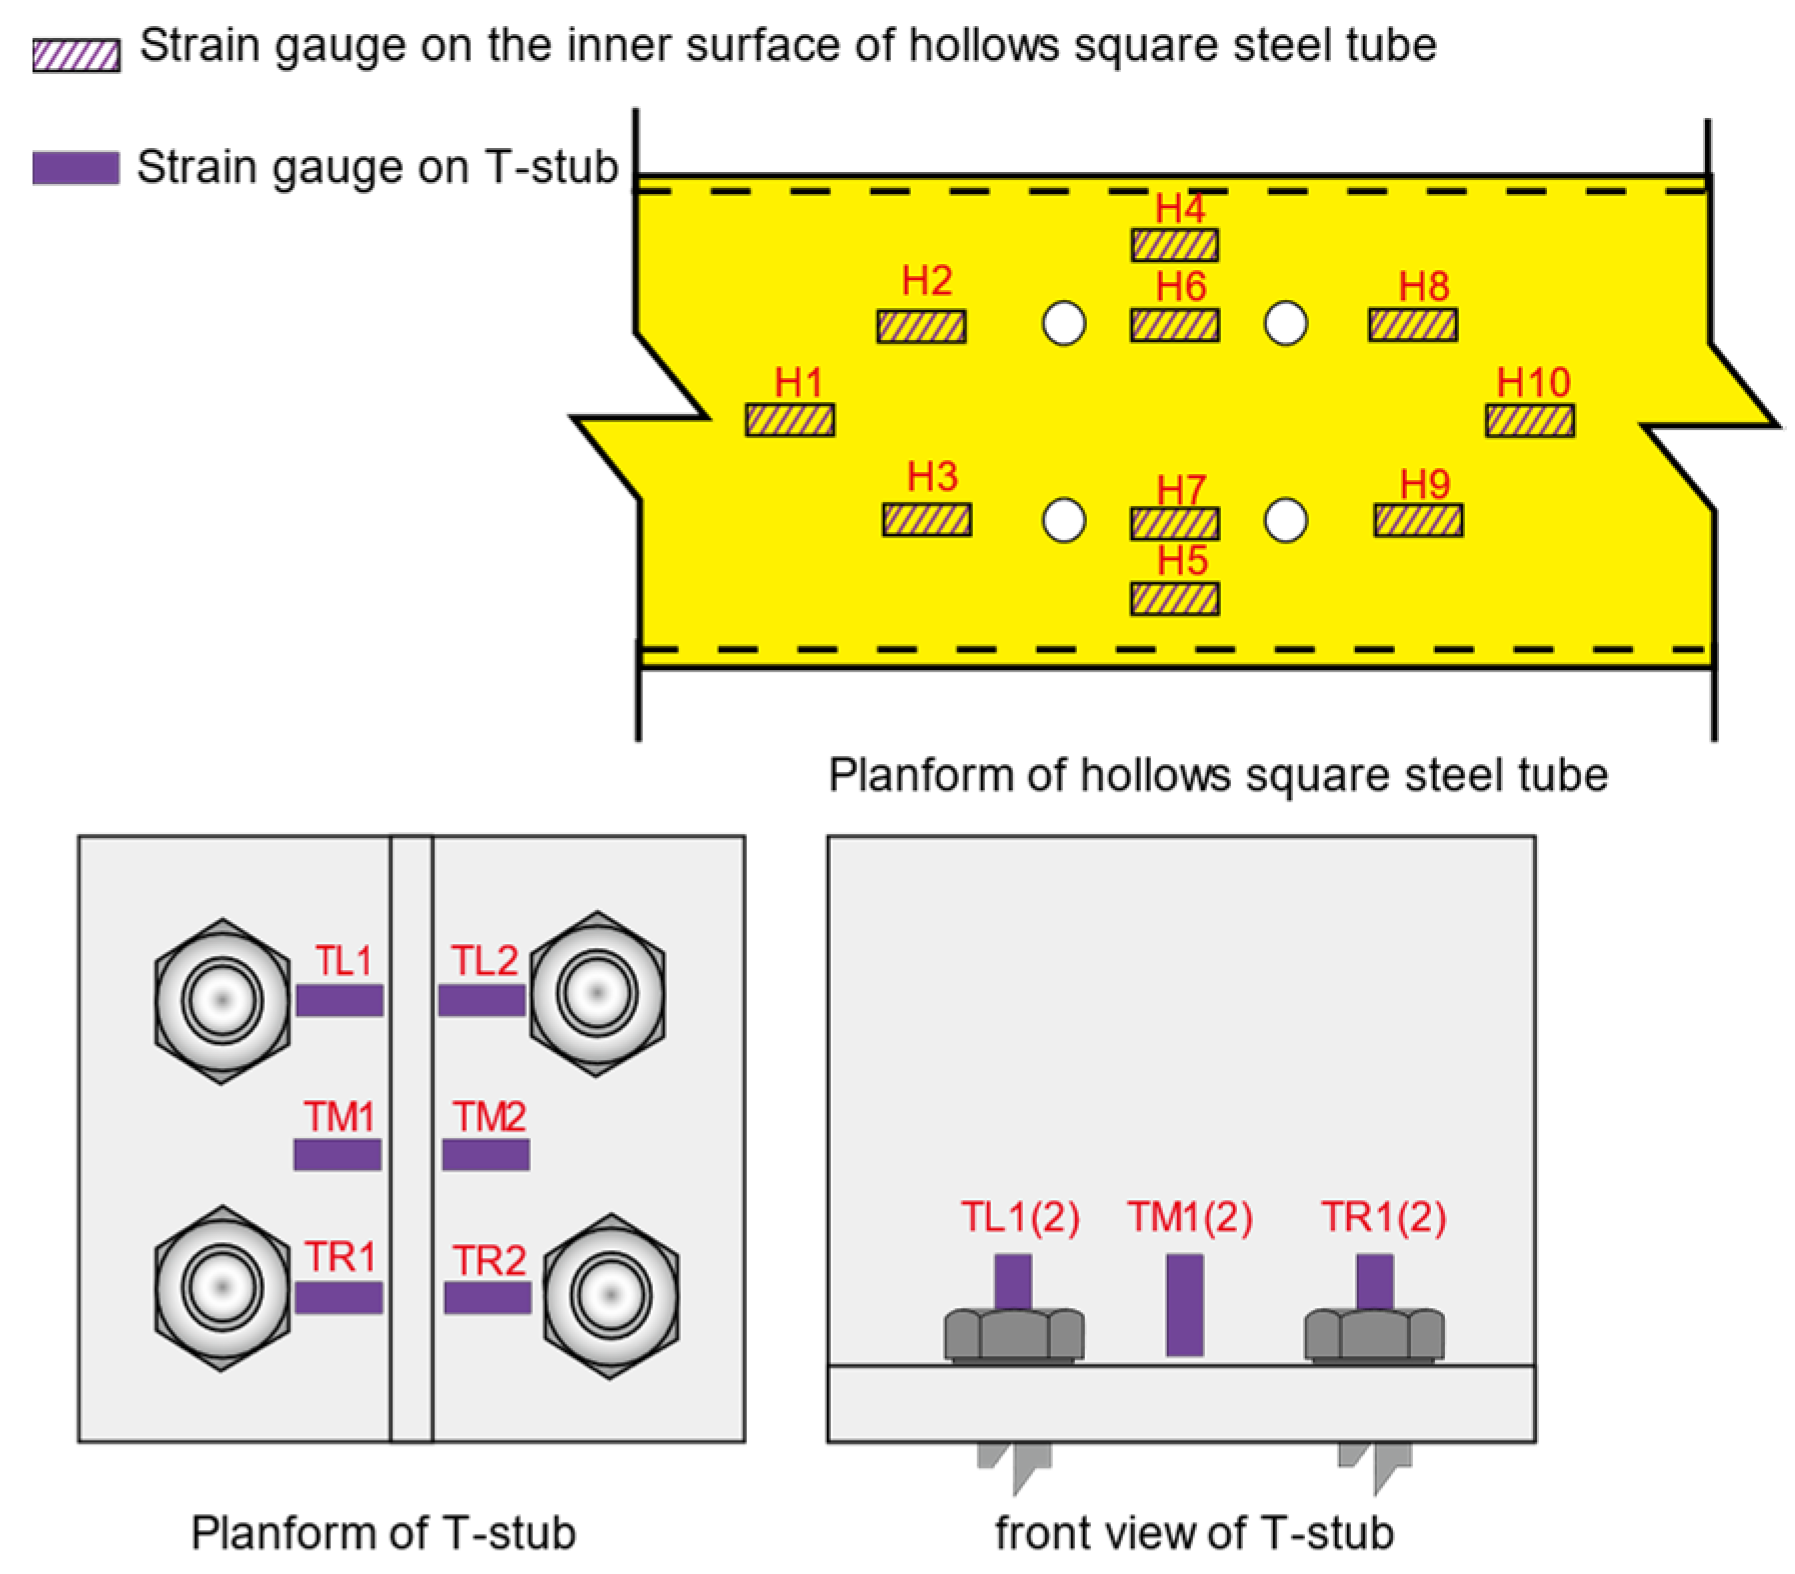
2.3. Test Setup and Instrumentation
3. Test Results
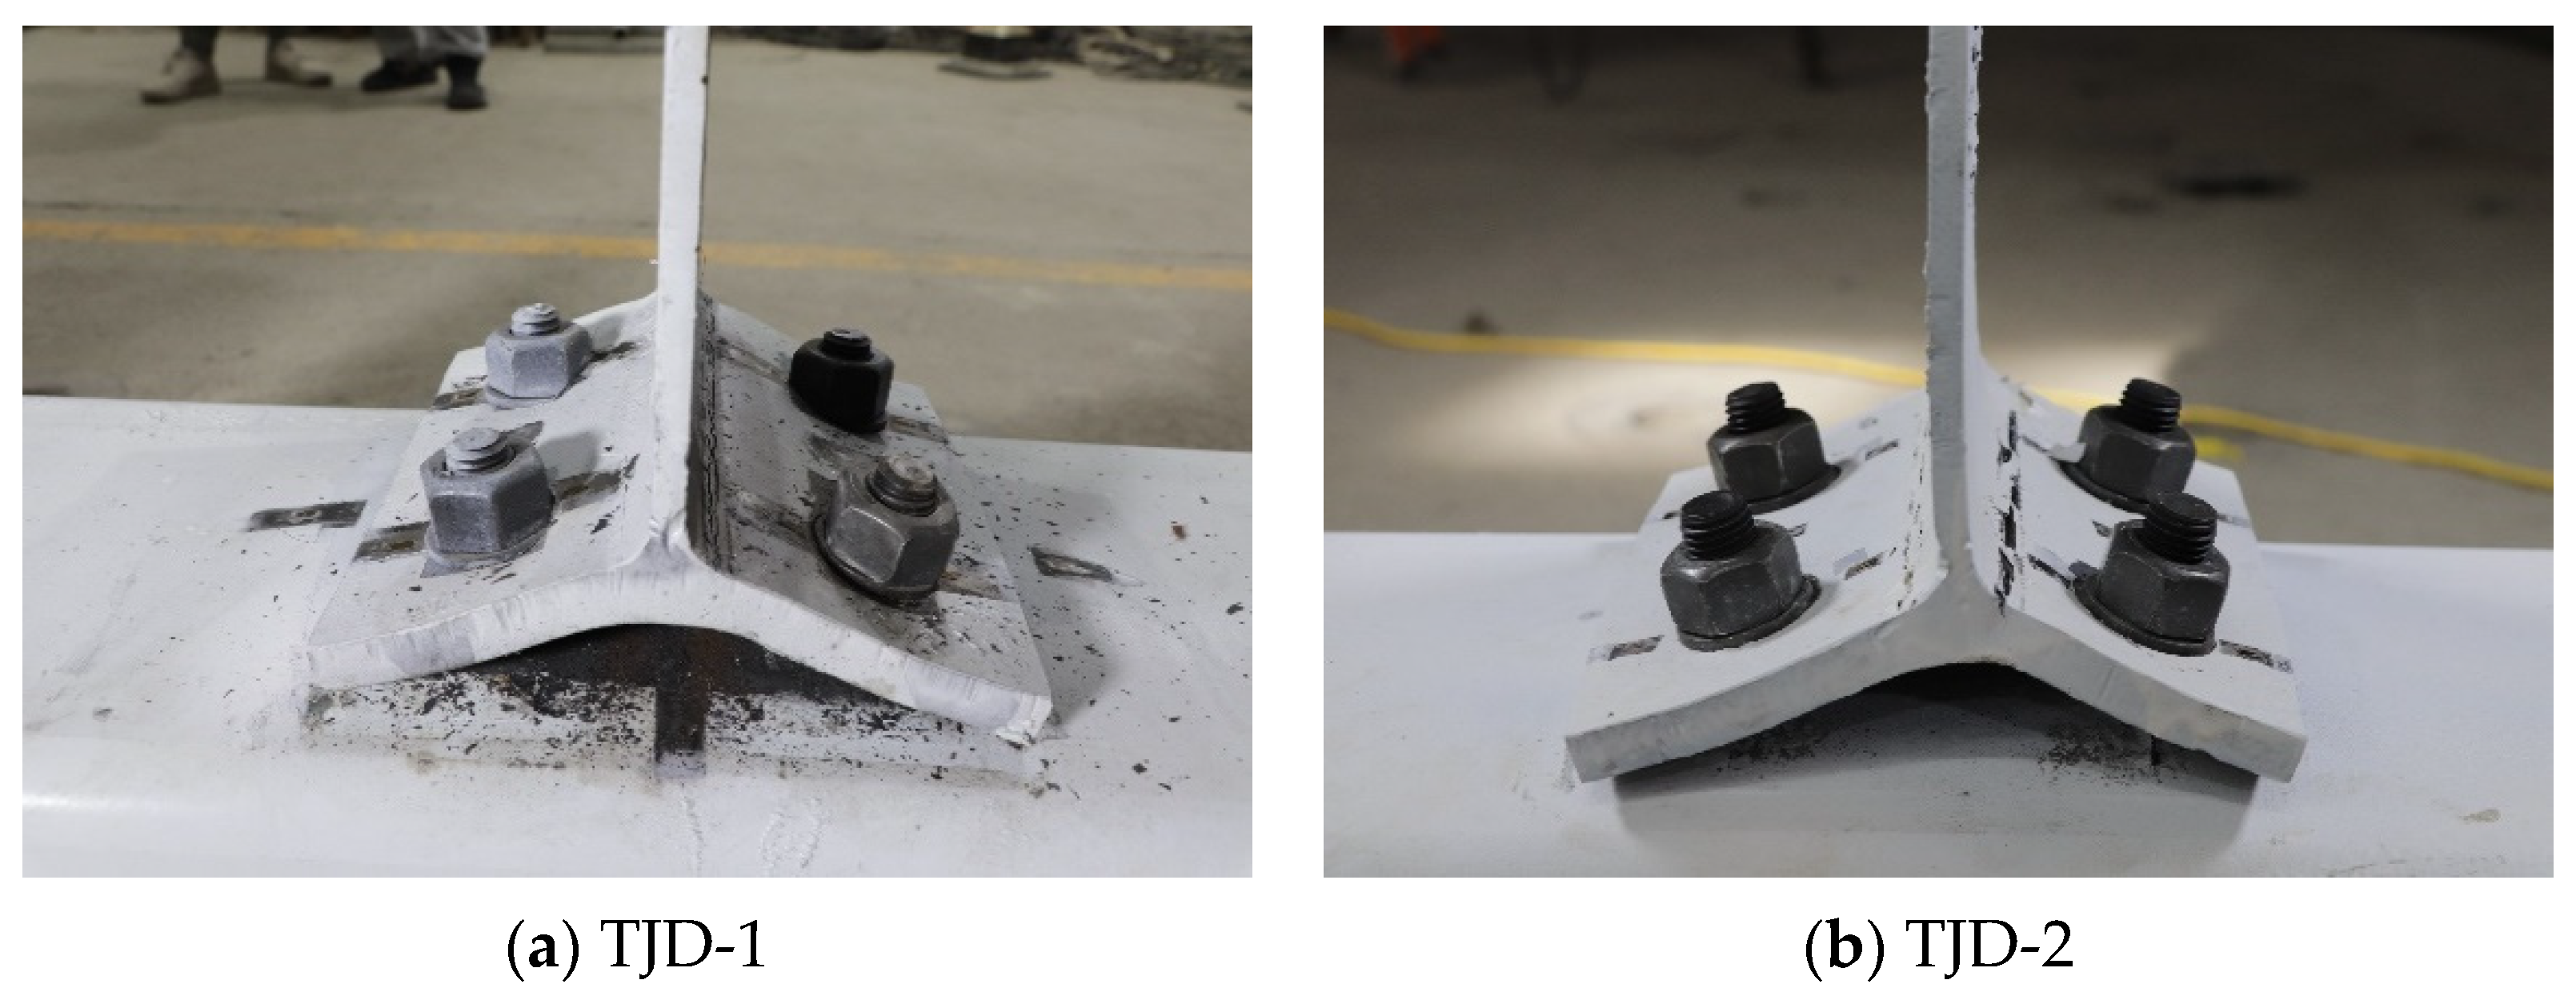
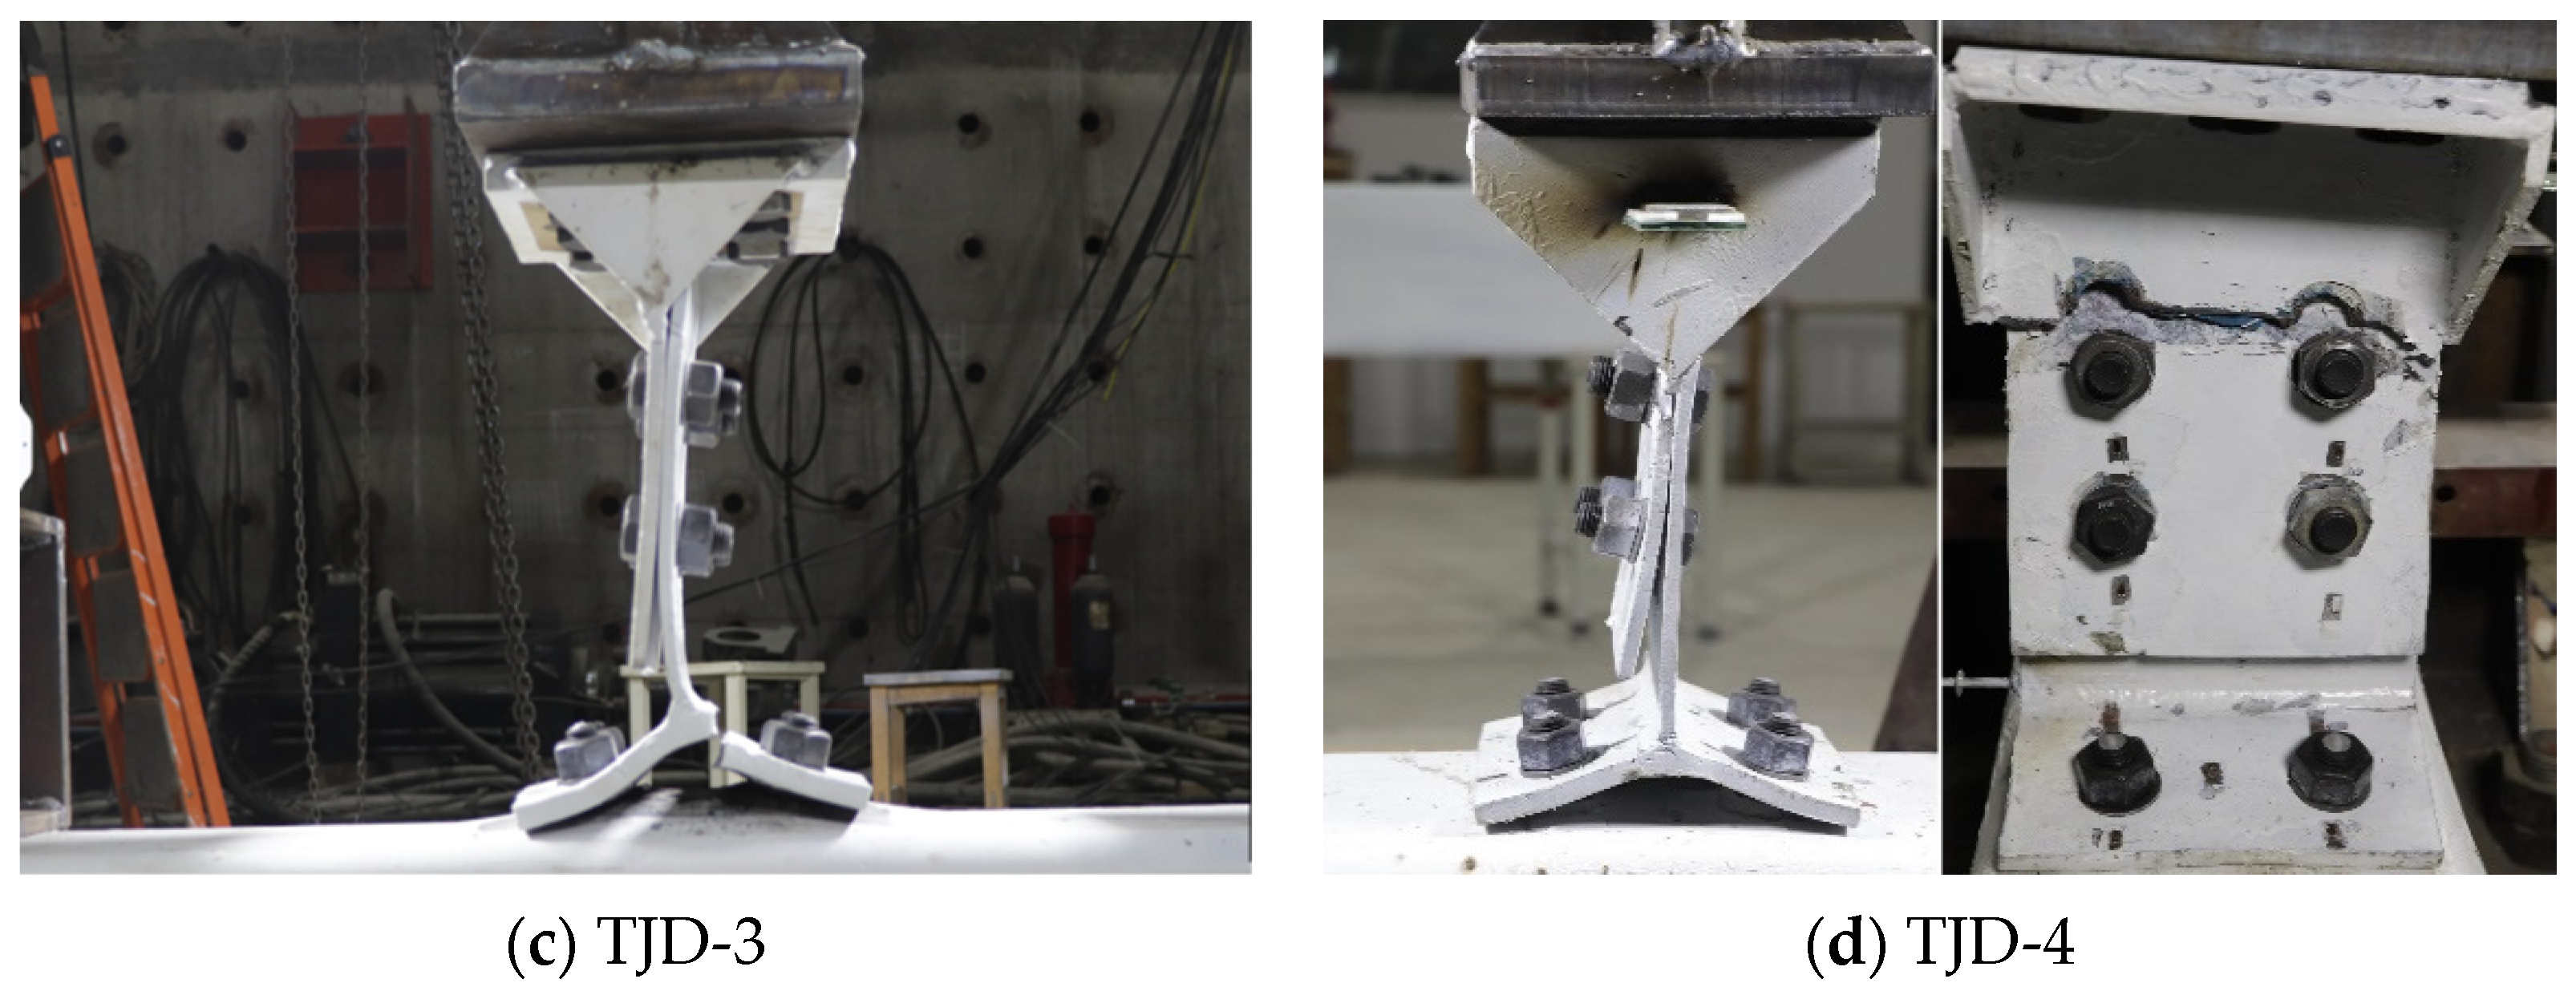
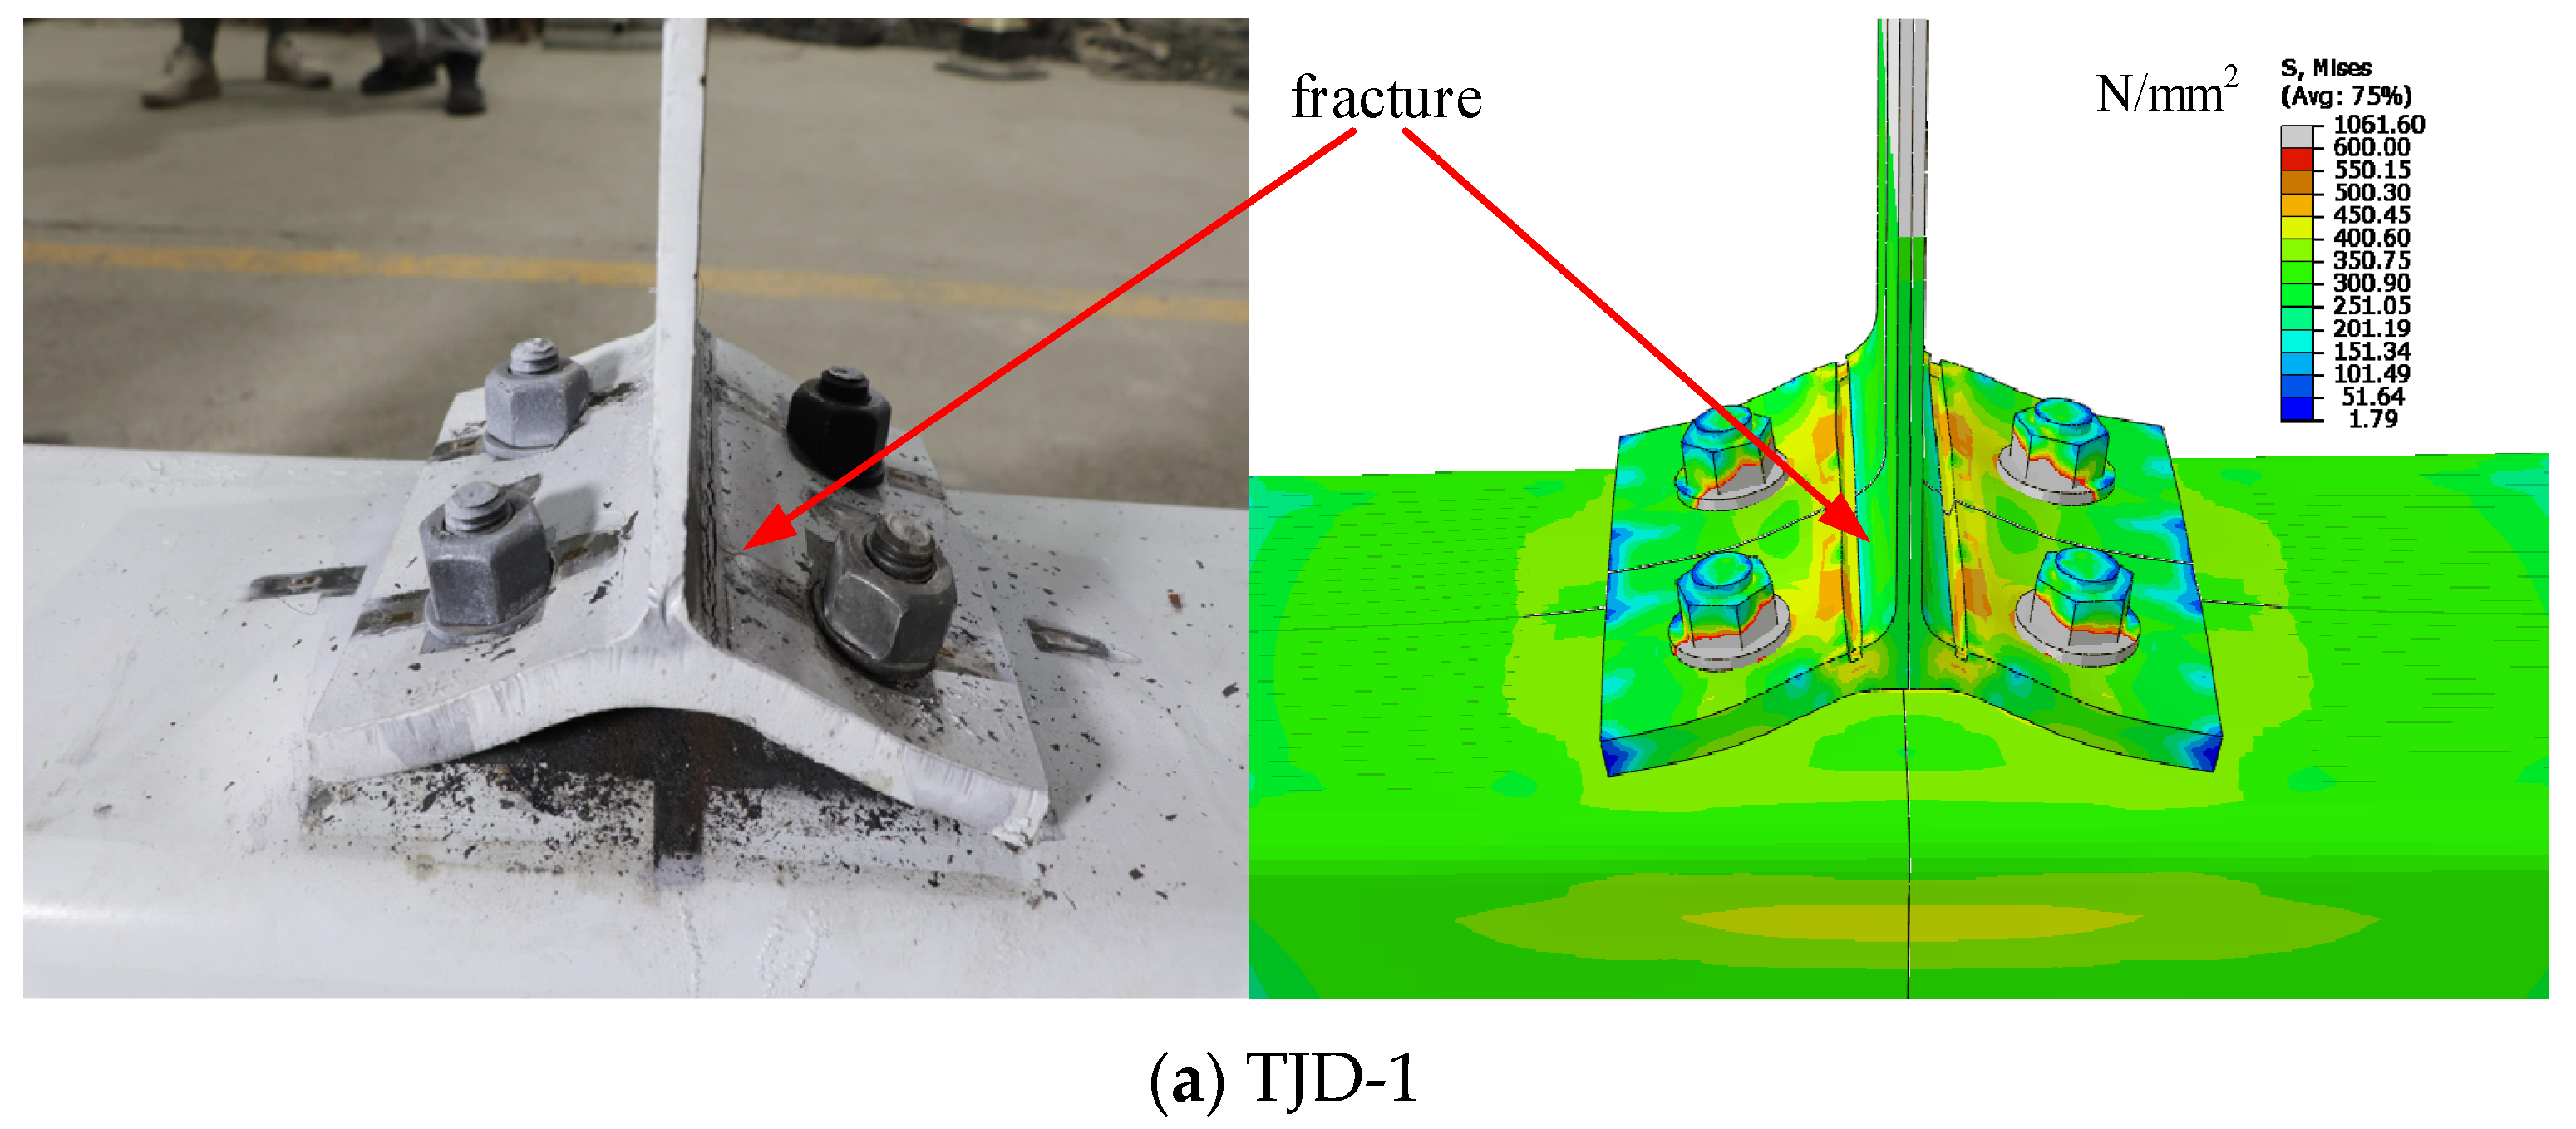
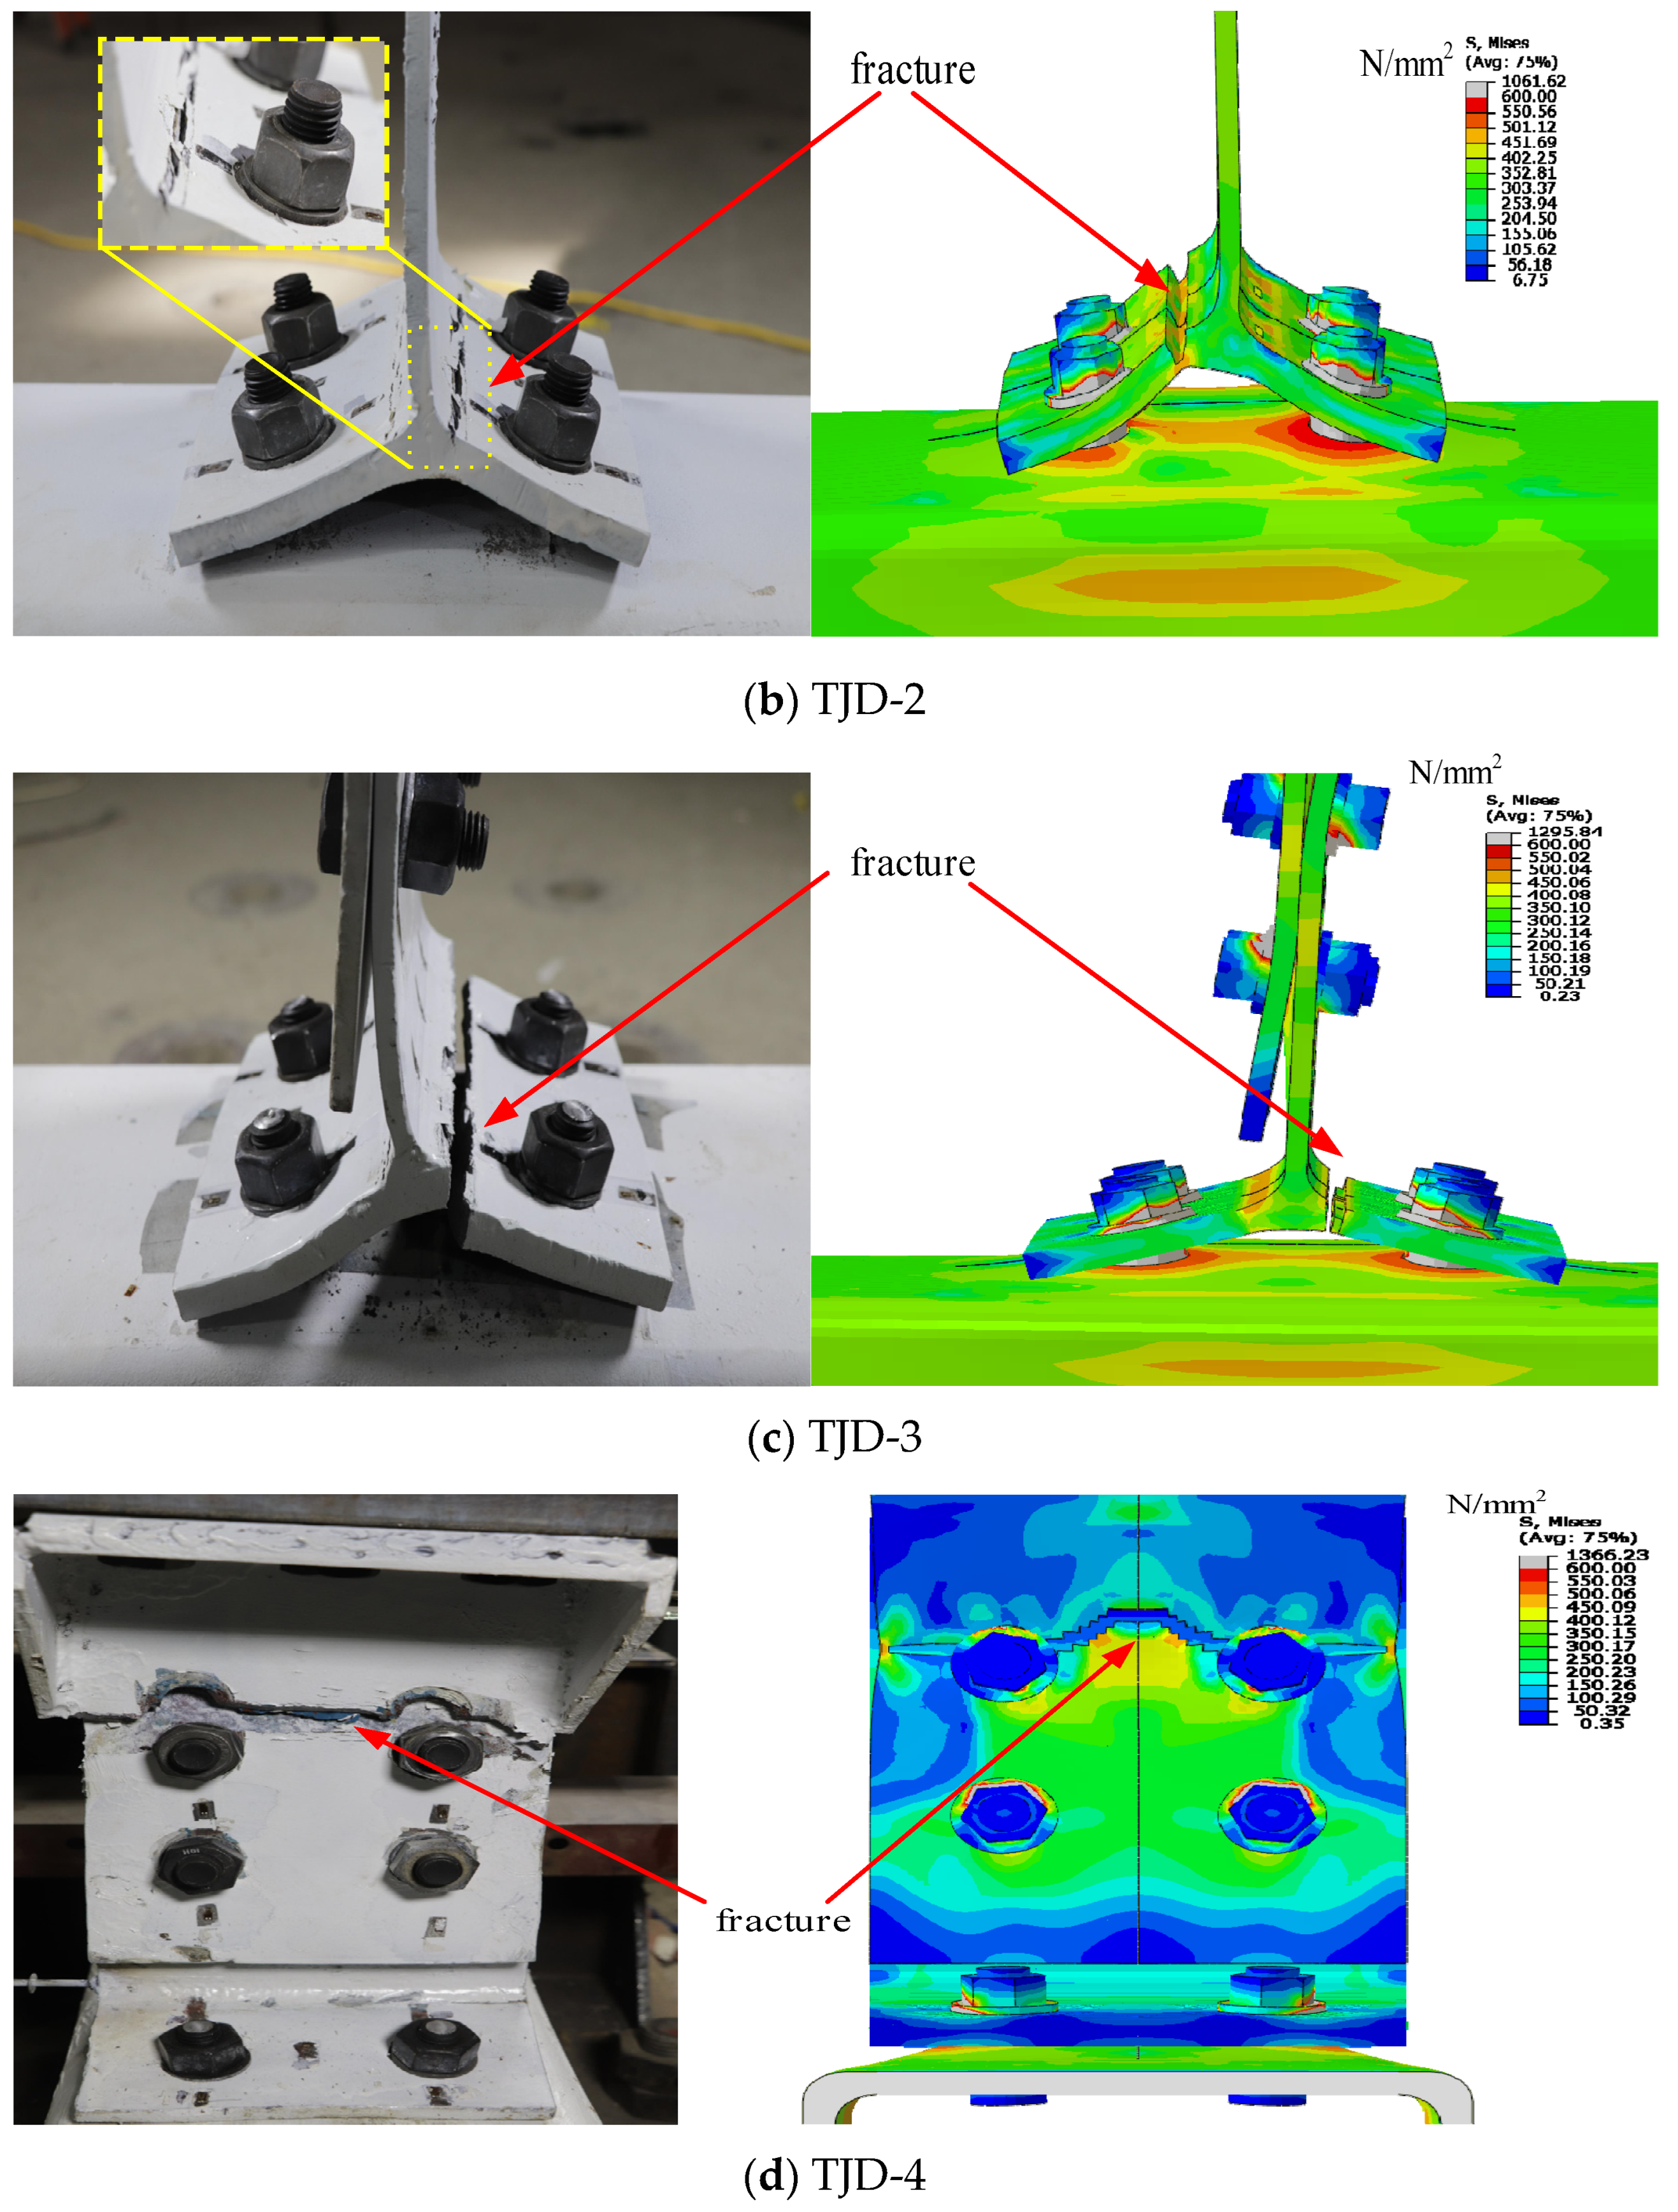
3.1. Failure Mode
3.1.1. HSST Wall Yielding
3.1.2. T-Stub Steel Fracture
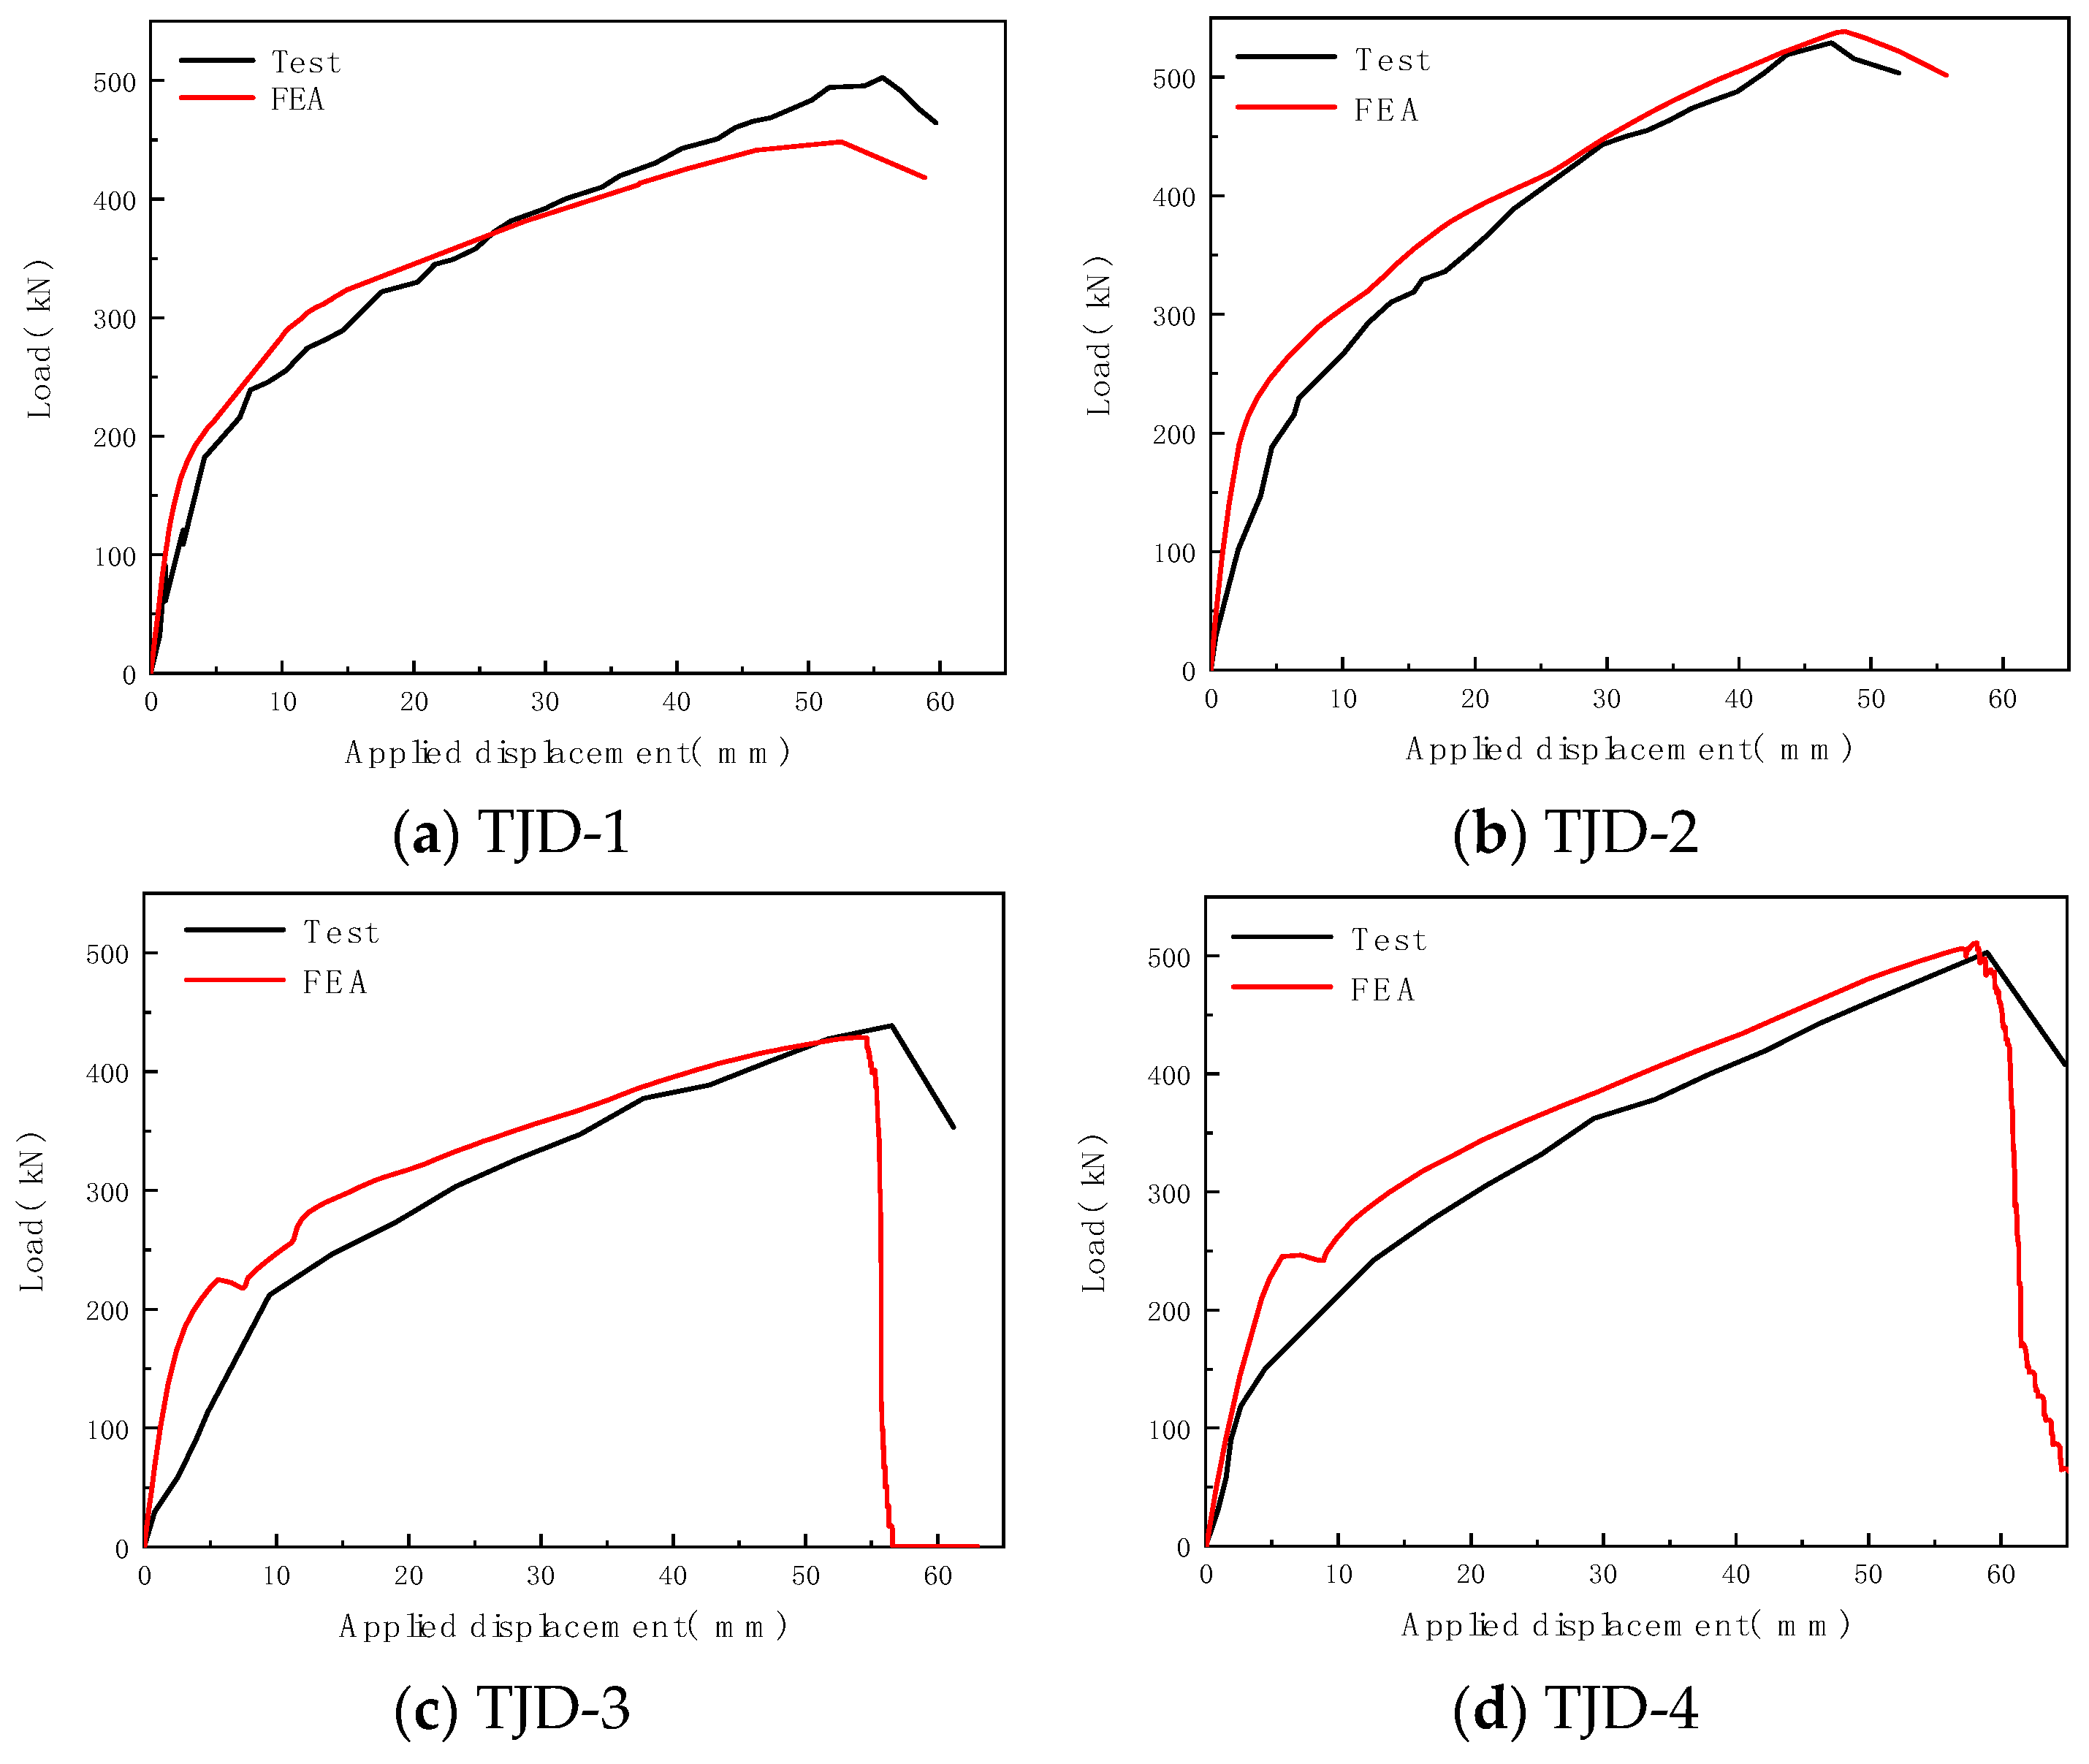
3.2. Load–Displacement Curves
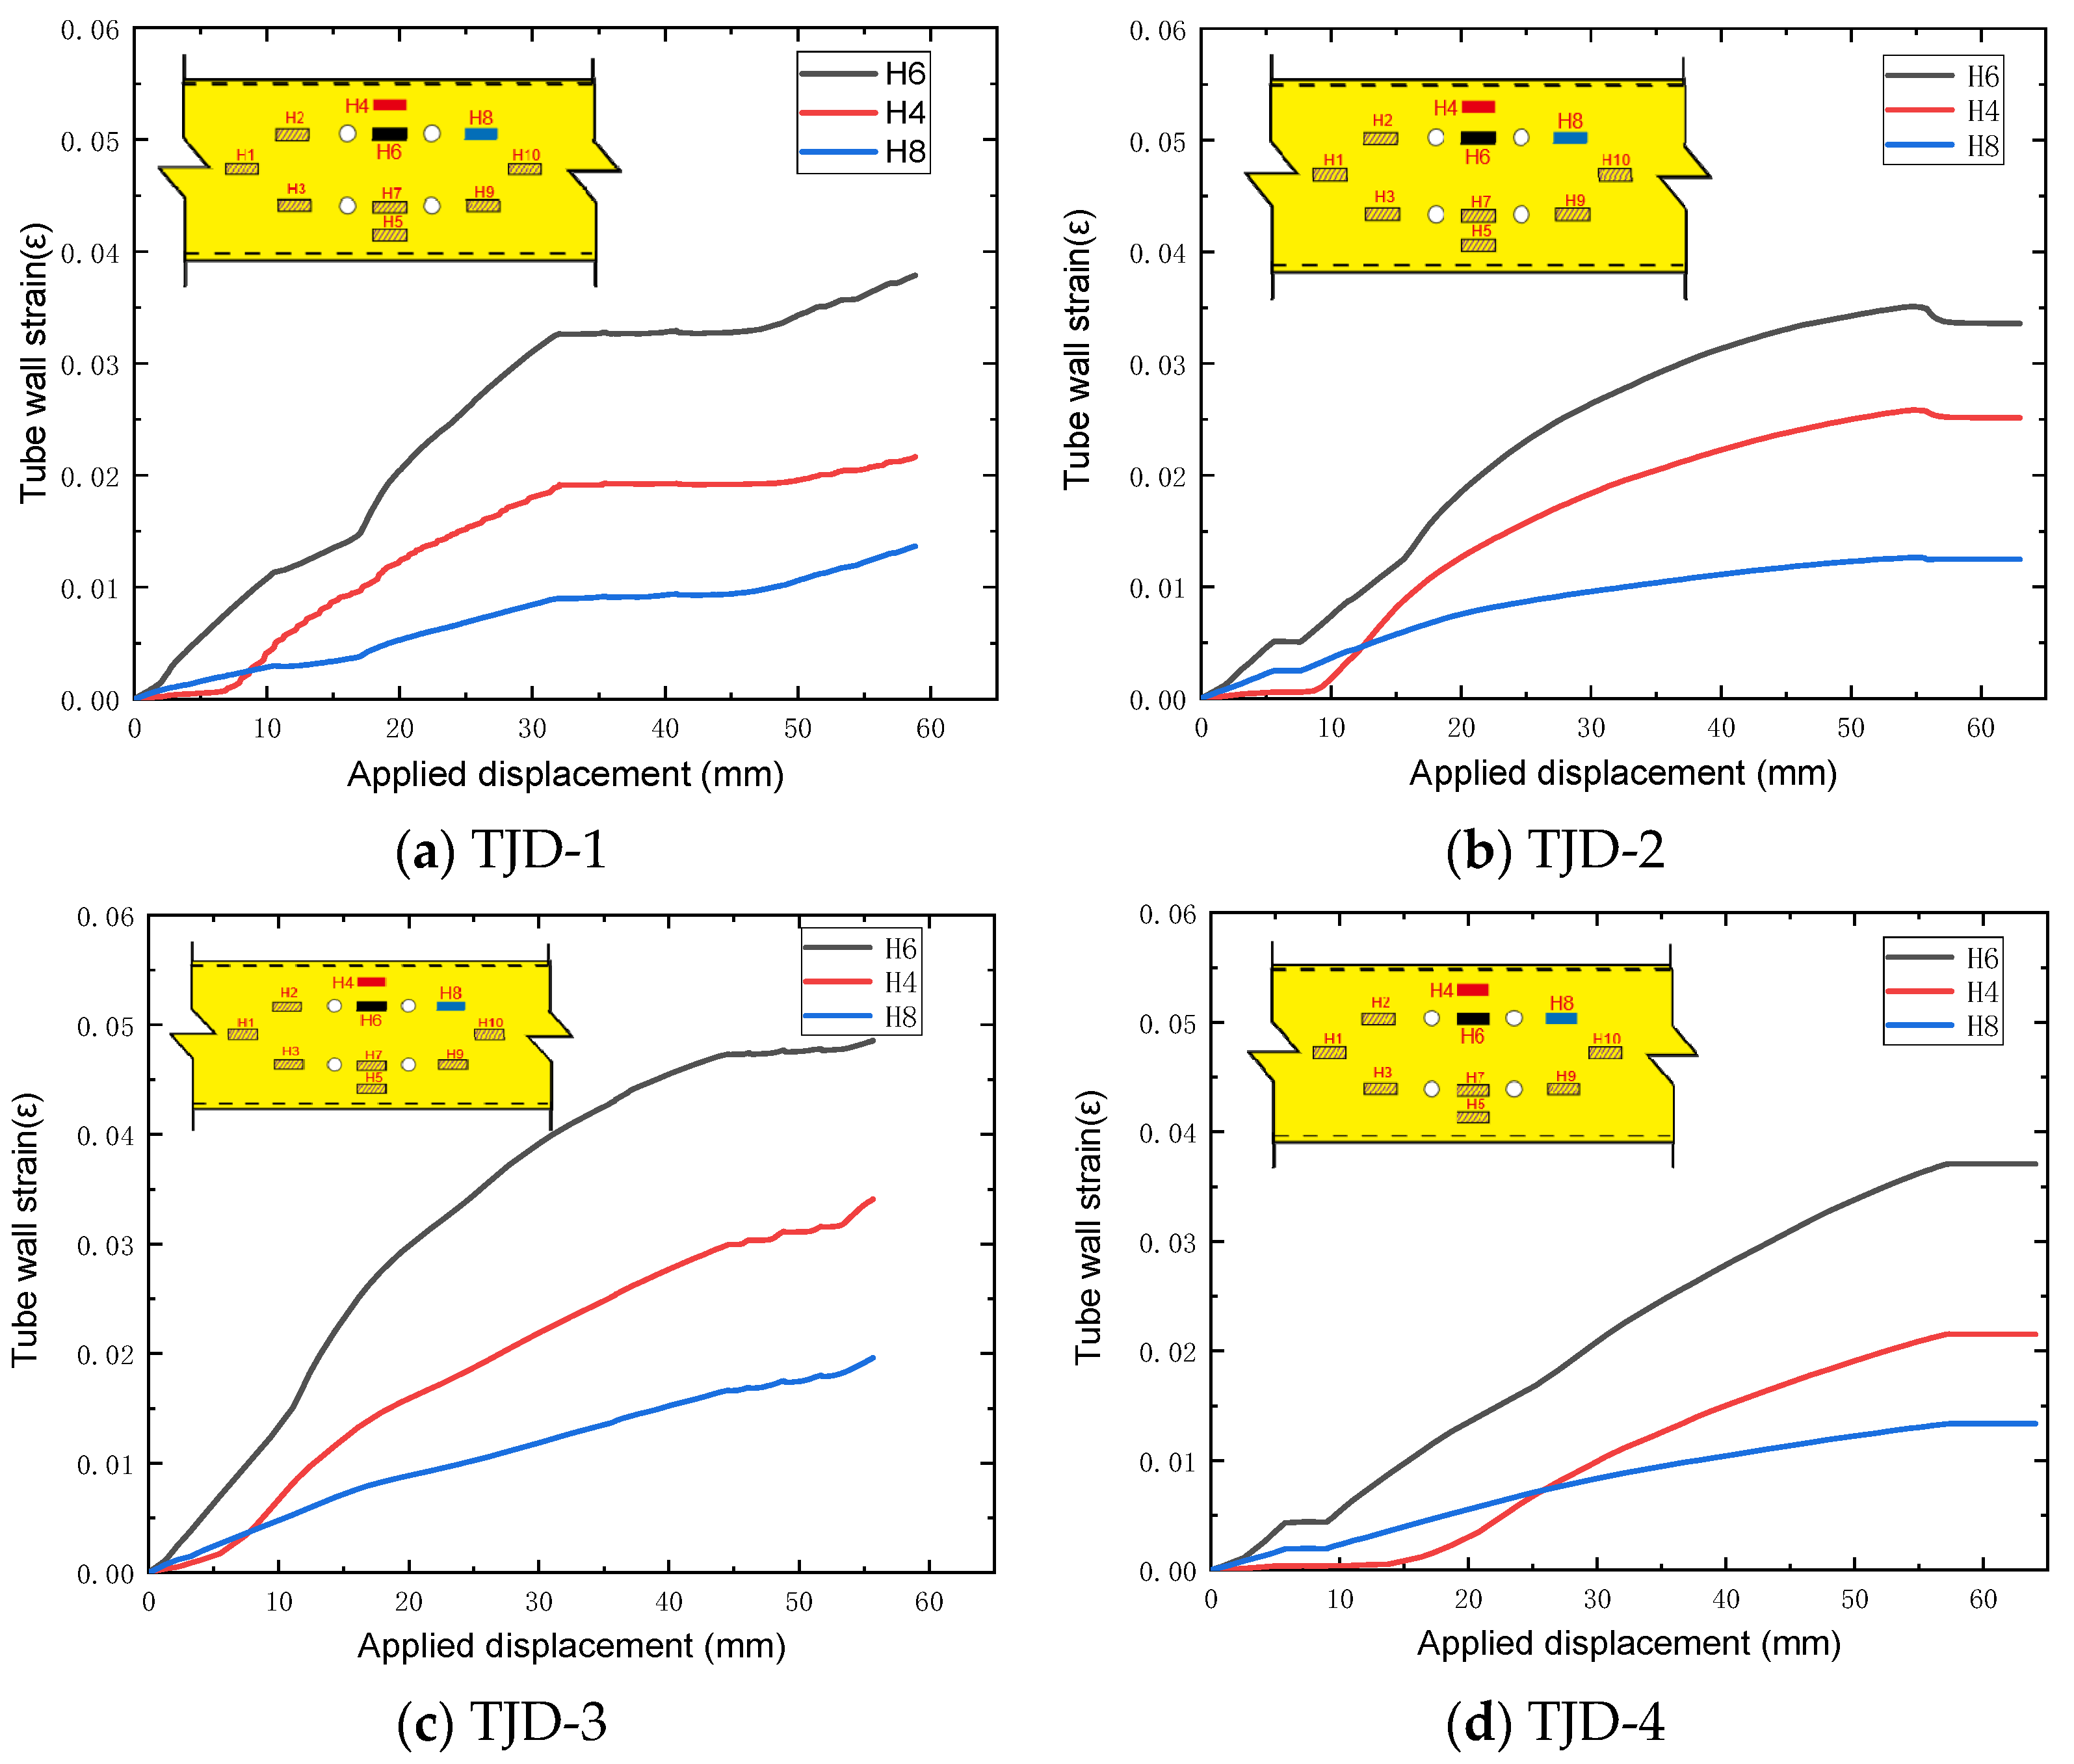
3.3. Strain Response
4. Finite Element Analysis
4.1. Finite Element Model
4.2. Material Models
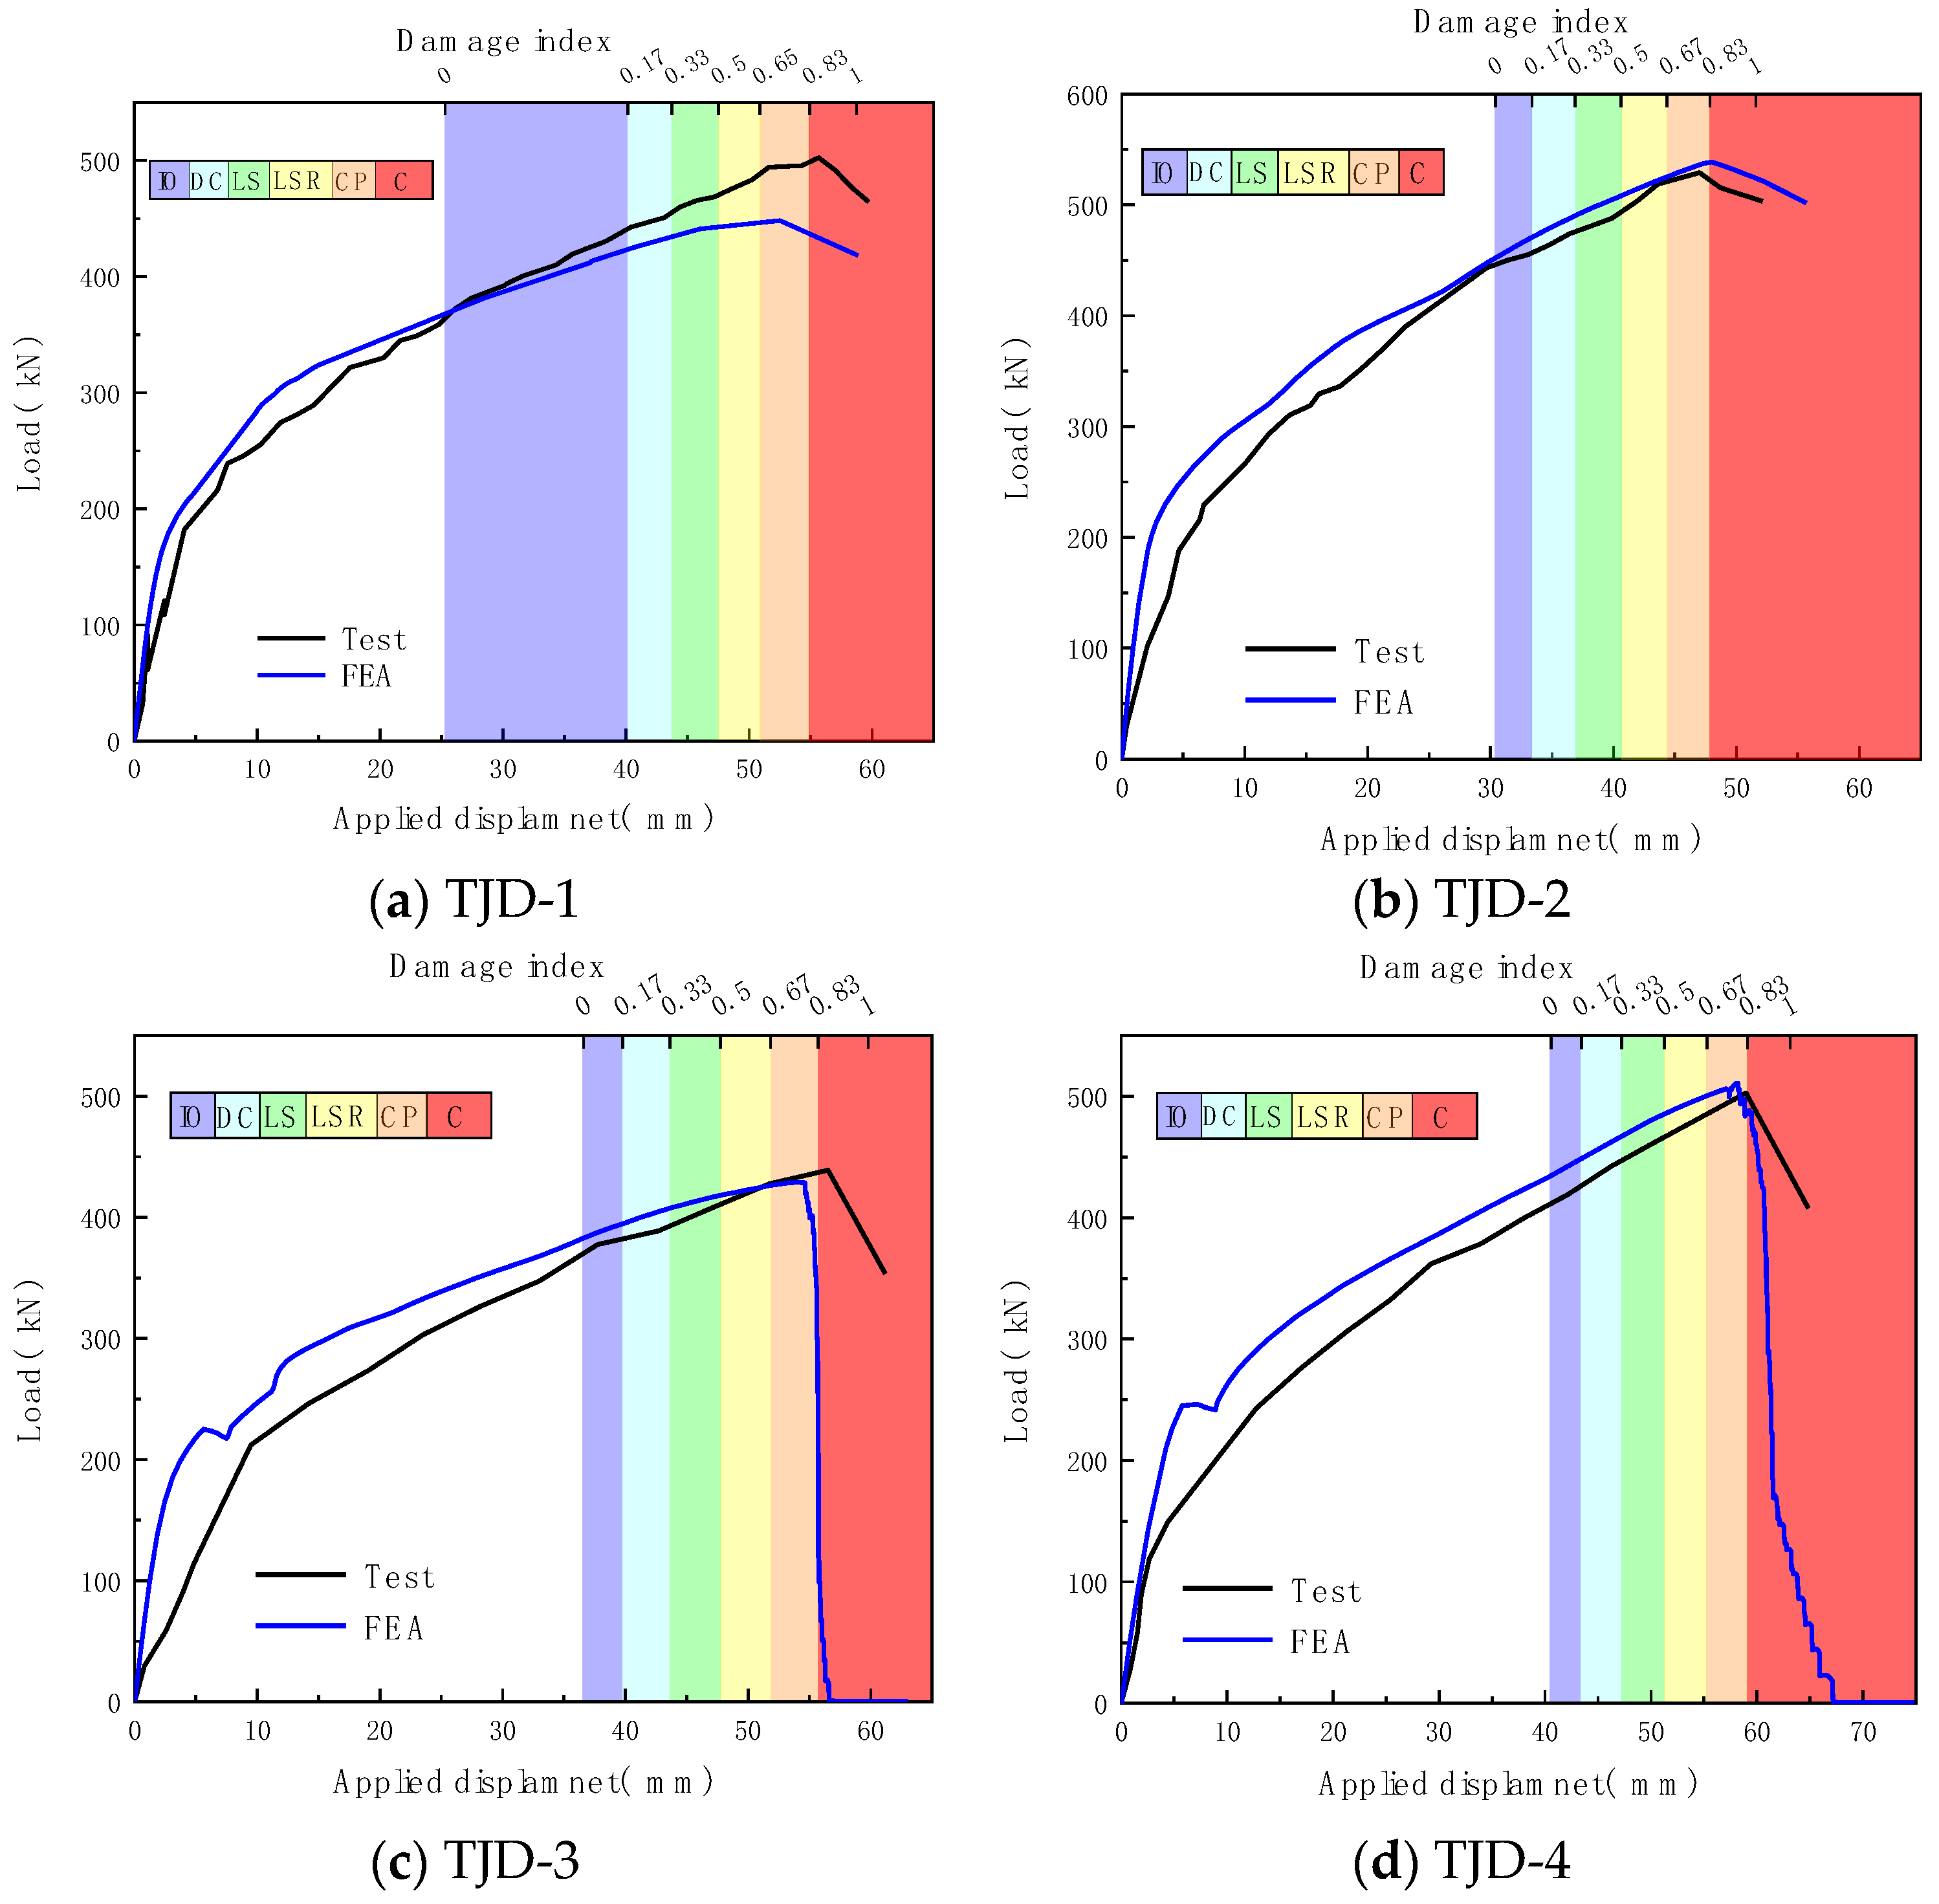
4.3. Validation of Numerical Results
5. Damage Process Analysis
- Linear limit (A-B): the structure response restricted to the linear limit;
- Immediate occupancy structural performance level (IO): the structure will be safe to occupy after the earthquake;
- Damage control structural performance range (DC): a damage state between life safety and immediate occupancy performance level;
- Life safety structural performance level (LS): structure is damaged, but retains a margin against onset of partial or total collapse;
- Limited safety structural performance range (LSR): a damage state between collapse prevention and life safety performance level;
- Collapse prevention structural performance level (CP): the structure continues to support gravity loads, but retains no margin against collapse;
- Collapsed (C).
6. Conclusions
- There are three main failure modes of this connection: the out-of-plane plastic deformation of the wall of HSST and the bending fracture failure of the T-stub’s flange. When the T-stub’s web contains shear-loaded connecting bolts, it will cause the fracture of the web.
- Increasing the thickness of the T-stub can improve the tensile-bearing capacity of the connection. Under the condition that the wall thickness of the hollow square steel tube is not changed, the initial tensile stiffness is not increased significantly, which indicates that the out-of-plane deformation and tensile force of the wall of the hollow square steel tube have a dominant effect on the initial tensile stiffness of the connection under the yielding state.
- For a connection with a T-stub containing shear-loaded connecting bolts, the tensile force of the web is transmitted through the shear-loaded connecting bolts to the web of the T-stub, causing the bolt holes on the web to be squeezed. As the load gradually increases with the increase in the squeezing effect, the plastic deformation generated by the bolt hole reduces the force transmission effect, which is the main reason for the decrease in the mechanical performance of the connection.
- Finite element analysis considering ductile damage can effectively simulate the plastic deformation process and failure mode of T-stubs connected to hollow section columns.
- The damage index model adopted in this study can accurately reflect the damage characteristics of the T-stub–hollow-section column connections and can accurately reflect the seven damage stages specified by FEMA. The damage indices are all smaller than 0.17 before the connections yield, and are beyond 0.83 when the connections enter the failure stage. The quantitative assessment conducted here established a correlation between damage states and damage characteristics, thereby enabling a quantitative evaluation of this specific type of connection’s damage.
Author Contributions
Funding
Data Availability Statement
Conflicts of Interest
References
- Ferdous, W.; Bai, Y.; Ngo, T.D.; Manalo, A.; Mendis, P. New advancements, challenges and opportunities of multi-storey modular buildings–A state-of-the-art review. Eng. Struct. 2019, 183, 883–893. [Google Scholar] [CrossRef]
- Lawson, R.M.; Ogden, R.G. ‘Hybrid’ light steel panel and modular systems. Thin-Walled Struct. 2008, 46, 720–730. [Google Scholar] [CrossRef]
- Swanson, J.A.; Leon, R.T. Bolted Steel Connections: Tests on T-Stub Components. J. Struct. Eng. 2000, 126, 50–56. [Google Scholar] [CrossRef]
- Bayat, M.; Zahrai, S.M. Seismic performance of mid-rise steel frames with semi-rigid connections having different moment capacity. Steel Compos. Struct. 2017, 25, 1–17. [Google Scholar]
- Piluso, V.; Rizzano, G. Experimental analysis and modelling of bolted T-stubs under cyclic loads. J. Constr. Steel Res. 2008, 64, 655–669. [Google Scholar] [CrossRef]
- Bruneau, M. Performance of steel bridges during the 1995 Hyogoken–Nanbu (Kobe, Japan) earthquake—A North American perspective. Eng. Struct. 1998, 20, 1063–1078. [Google Scholar] [CrossRef]
- Kılıç, M.; Maali, M.S.; Maali, M.; Aydın, A.C. Experimental and numerical investigation of semi-rigid behavior top and seat T-Section connections with different triangular designed stiffener thicknesses. Eng. Struct. 2023, 289, 116216. [Google Scholar] [CrossRef]
- Liu, X.C.; Pu, S.H.; Zhang, A.L.; Zhan, X.X. Performance analysis and design of bolted connections in modularized prefabricated steel structures. J. Constr. Steel Res. 2017, 133, 360–373. [Google Scholar] [CrossRef]
- Liu, X.C.; He, X.N.; Wang, H.X.; Yang, Z.W.; Pu, S.H.; Zhang, A. Bending-shear performance of column-to-column bolted-flange connections in prefabricated multi-high-rise steel structures. J. Constr. Steel Res. 2018, 145, 28–48. [Google Scholar] [CrossRef]
- Wang, W.; Li, L.; Chen, D. Progressive collapse behaviour of endplate connections to cold-formed tubular column with novel Slip-Critical Blind Bolts. Thin-Walled Struct. 2018, 131, 404–416. [Google Scholar] [CrossRef]
- Tizani, W.; Al-Mughairi, A.; Owen, J.S.; Pitrakkos, T. Rotational stiffness of a blind-bolted connection to concrete-filled tubes using modified Hollo-bolt. J. Constr. Steel Res. 2013, 80, 317–331. [Google Scholar] [CrossRef]
- Wang, P.; Sun, L.; Liu, M.; Zhang, B.; Hu, X.; Yu, J. Experimental studies on thread-fixed one-side bolted connection of beam to hollow square steel tube under static bending moment. Eng. Struct. 2020, 214, 110655. [Google Scholar] [CrossRef]
- Wang, P.; Sun, L.; Zhang, B.; Yang, X.; Liu, F.; Han, Z. Experimental studies on T-stub to hollow section column connection bolted by T-head square-neck one-side bolts under tension. J. Constr. Steel Res. 2021, 178, 106493. [Google Scholar] [CrossRef]
- EN 1993-1-8; Design of Steel Structures—Part 1–8: Design of Joints. European Committer for Standardization: Brussel, Belgium, 2005.
- Guo, H.; Liang, G.; Li, Y.; Liu, Y. Q690 high strength steel T-stub tensile behavior: Experimental research and theoretical analysis. J. Constr. Steel Res. 2017, 139, 473–483. [Google Scholar] [CrossRef]
- Liang, G.; Guo, H.; Liu, Y.; Yang, D.; Li, S. A comparative study on tensile behavior of welded T-stub joints using Q345 normal steel and Q690 high strength steel under bolt preloading cases. Thin-Walled Struct. 2019, 137, 271–283. [Google Scholar] [CrossRef]
- Sun, F.F.; Xue, X.Y.; Xiao, Y.; Le, Y.M.; Li, G. Effect of welding and complex loads on the high-strength steel T-stub connection. J. Constr. Steel Res. 2018, 150, 76–86. [Google Scholar] [CrossRef]
- Yapici, O.; Theofanous, M.; Afshan, S.; Yuan, H.; Dirar, S. Numerical modelling of stainless steel bolted T-stubs in tension. Thin-Walled Struct. 2022, 177, 109432. [Google Scholar] [CrossRef]
- Yapici, O.; Theofanous, M.; Yuan, H.; Dirar, S.; Afshan, S. Numerical simulation and design of ferritic stainless steel bolted T-stubs in tension. J. Constr. Steel Res. 2022, 198, 107555. [Google Scholar] [CrossRef]
- Wang, P.; Sun, L.; Xia, C.; Gu, H.; Liu, Y.; Liu, M.; Liu, F. Cyclic behavior of T-stub connection to hollow section steel column using TSOBs. J. Constr. Steel Res. 2021, 185, 106874. [Google Scholar] [CrossRef]
- Wang, P.; Wulan, T.; Liu, M.; Qu, H.; You, Y. Shear behavior of lap connection using one-side bolts. Eng. Struct. 2019, 186, 64–85. [Google Scholar] [CrossRef]
- Sun, L.; Liu, M.; Liu, Y.; Wang, P.; Zhao, H.; Sun, J.; Shang, Y. Studies on T-shaped one-side bolted connection to hollow section column under bending. J. Constr. Steel Res. 2020, 175, 106359. [Google Scholar] [CrossRef]
- Yu, H.; Burgess, I.W.; Davison, J.B.; Plank, R.J. Numerical simulation of bolted steel connections in fire using explicit dynamic analysis. J. Constr. Steel Res. 2008, 64, 515–525. [Google Scholar] [CrossRef]
- Irvani, M.; Ezati, H.; Khafajeh, R.; Jaari, V.R.K. Numerically study on the seismic response of partially restrained moment connection with structural fuse T-stub for European sections. Structures 2022, 35, 82–105. [Google Scholar] [CrossRef]
- D’Aniello, M.; Cassiano, D.; Landolfo, R. Simplified criteria for finite element modelling of European preloadable bolts. Steel Compos. Struct. 2017, 24, 643–658. [Google Scholar]
- Trattnig, G.; Antretter, T.; Pippan, R. Fracture of austenitic steel subject to a wide range of stress triaxiality ratios and crack deformation modes. Eng. Fract. Mech. 2008, 75, 223–235. [Google Scholar] [CrossRef]
- Rice, J.R.; Tracey, D.M. On the ductile enlargement of voids in triaxial stress fields. J. Mech. Phys. Solids 1969, 17, 201–217. [Google Scholar] [CrossRef]
- Bonora, N.; Ruggiero, A.; Esposito, L.; Gentile, D. CDM modeling of ductile failure in ferritic steels: Assessment of the geometry transferability of model parameters. Int. J. Plast. 2006, 22, 2015–2047. [Google Scholar] [CrossRef]
- Lemaitre, J. A Continuous Damage Mechanics Model for Ductile Fracture. J. Eng. Mater. Technol. 1985, 107, 83–90. [Google Scholar] [CrossRef]
- GB/T 1231-2006; Specifications of High Strength Bolts with Large Hexagon Head, Large Hexagon Nuts, Plain Washers for Steel Structures. Standards Press of China: Beijing, China, 2006.
- Kunnath, S.K.; Reinhorn, A.M.; Park, Y.J.; Kunnath, A.M.S.K.; Member, A.A. Analytical Modeling of Inelastic Seismic Response of R/C Structures. J. Struct. Eng. 1990, 116, 996–1017. [Google Scholar] [CrossRef]
- Park, Y.J.; Ang, A.H.-S.; Wen, Y.K. Damage-Limiting Aseismic Design of Buildings. Earthq. Spectra 1987, 3, 1–26. [Google Scholar] [CrossRef]
- FEMA-356; Prestandard and Commentary for the Seismic Rehabilitation of Buildings. Federal Emergency Management Agency: Washington, DC, USA, 2000.
- Williams, M.S.; Sexsmith, R.G. Seismic damage indices for concrete structures: A state-of-the-art review. Earthq. Spectra 1995, 11, 319–349. [Google Scholar] [CrossRef]


| Specimen ID | T-Stub | HSST | Bolt | ||||||
|---|---|---|---|---|---|---|---|---|---|
| H | B | tw | tf | Section | tc | l | T-Stub Flange | T-Stub Web | |
| TJD-1 | 270 | 200 | 8 | 12 | 250 × 250 | 12 | 1200 | Blind bolt | - |
| TJD-2 | 270 | 200 | 9 | 14 | 250 × 250 | 12 | 1200 | Blind bolt | - |
| TJD-3 | 270 | 200 | 8 | 12 | 250 × 250 | 12 | 1200 | Blind bolt | High-strength bolt |
| TJD-4 | 270 | 200 | 9 | 14 | 250 × 250 | 12 | 1200 | Blind bolt | High-strength bolt |
| Samples | Sample Thickness/mm | fy/MPa | fu/MPa | E/GPa | Elongation/% |
|---|---|---|---|---|---|
| HSST | 12 | 283 | 456 | 203 | 30.0 |
| T-stub flange | 12 | 266 | 423 | 201 | 38.7 |
| 14 | 287 | 448 | 198 | 36.3 | |
| T-stub web | 8 | 281 | 453 | 208 | 33.5 |
| 9 | 313 | 464 | 206 | 32.1 |
| Specimen ID | Sc,ini/kN/mm | Fy/kN | δy/mm | Fu/kN | δu/mm | μ |
|---|---|---|---|---|---|---|
| TJD-1 | 14.64 | 370.26 | 25.28 | 502.74 | 60.45 | 2.39 |
| TJD-2 | 14.67 | 446.02 | 30.41 | 529.08 | 52.12 | 1.71 |
| TJD-3 | 9.77 | 358.29 | 36.61 | 438.95 | 61.19 | 1.67 |
| TJD-4 | 10.15 | 411.75 | 40.57 | 502.85 | 64.83 | 1.60 |
| FEMA Performance Level | A-B | IO | DC | LS | LSR | CP | C |
| FEMA Damage Index | 0 | 0.17 | 0.33 | 0.50 | 0.67 | 0.83 | 1 |
Disclaimer/Publisher’s Note: The statements, opinions and data contained in all publications are solely those of the individual author(s) and contributor(s) and not of MDPI and/or the editor(s). MDPI and/or the editor(s) disclaim responsibility for any injury to people or property resulting from any ideas, methods, instructions or products referred to in the content. |
© 2023 by the authors. Licensee MDPI, Basel, Switzerland. This article is an open access article distributed under the terms and conditions of the Creative Commons Attribution (CC BY) license (https://creativecommons.org/licenses/by/4.0/).
Share and Cite
Bu, X.; Xiao, S.; Wu, Z.; Li, X.; Wang, X. Damage Evaluation of T-Stub Connected to Hollow Section Column Using Blind Bolts under Tension. Buildings 2023, 13, 2603. https://doi.org/10.3390/buildings13102603
Bu X, Xiao S, Wu Z, Li X, Wang X. Damage Evaluation of T-Stub Connected to Hollow Section Column Using Blind Bolts under Tension. Buildings. 2023; 13(10):2603. https://doi.org/10.3390/buildings13102603
Chicago/Turabian StyleBu, Xin, Shixiang Xiao, Zhanjing Wu, Xiaolu Li, and Xinwu Wang. 2023. "Damage Evaluation of T-Stub Connected to Hollow Section Column Using Blind Bolts under Tension" Buildings 13, no. 10: 2603. https://doi.org/10.3390/buildings13102603
APA StyleBu, X., Xiao, S., Wu, Z., Li, X., & Wang, X. (2023). Damage Evaluation of T-Stub Connected to Hollow Section Column Using Blind Bolts under Tension. Buildings, 13(10), 2603. https://doi.org/10.3390/buildings13102603