Abstract
Outdoor environment exchanges heat with indoor environment, enabling pollutants to infiltrate indoors, affecting buildings’ energy efficiency, comfort, and indoor air quality. Investigating the impact of the outdoor environment on the indoor thermal environment is crucial. Firstly, this paper reviews the coupling method to link the outdoor environment with the indoor environment. Secondly, it examines the impact of the outdoor physical environment, including neighboring buildings, greening, road surface, water body, and sky, on the indoor thermal environment. During the hottest summer, an increase of 17% in trees can reduce indoor temperature by 1.1 °C. Thirdly, the impact of weather conditions, including outdoor temperature, outdoor humidity, external wind, global warming, extreme weather conditions, and solar radiation, on the indoor thermal environment is studied. Due to global warming, cooling energy consumption and heating energy consumption in 2050 could increase by 223% to 1050%, and heating demand could decrease by 36% to 58%. Finally, the impact of outdoor air pollution on indoor environment and energy consumption is analyzed. For every 75 μg/m3 increase in PM2.5 concentration, average power consumption could increase by 11.2%. Recommendations for future research are provided. This study contributes to the understanding of the outdoor–indoor thermal relationship and offers insights into enhancing indoor thermal comfort and reducing building energy consumption.
1. Introduction
Outdoor environment includes the natural environment and the built environment. The natural environment includes land, water, forest, climate, etc. With the social development and intervention of human activities, e.g., land reclamation and deforestation, land usage has undergone tremendous changes, leading to a series of problems, such as increased environmental pollution and urban heat island (UHI) [1]. As early as the 1980s, it was noticed that vegetation can lead to a reduction in cooling costs in hot climate and heating costs in cold climate [2]. Temperature, humidity, solar radiation, etc., can be considered as a natural thermal environment, where temperature is the most important factor affecting building energy consumption, followed by humidity and solar radiation [3]. The changes in the natural and outside built environment have a non-negligible impact on the indoor thermal environment.
People spend over 90% of their time indoors, and the indoor environment has a direct impact on occupants’ thermal comfort [4]. It is very important to investigate the impacts of the outdoor environment on the indoor thermal environment and how to optimize the outdoor environment so as to improve the indoor thermal environment. Through the literature survey, the outdoor environment can be divided into the surrounding physical environment, climatic conditions, and pollutants (see Figure 1). The impacts of the outdoor environment on the indoor environment are mainly reflected by the changes in the indoor air temperature, relative humidity, thermal comfort, pollutant concentration level, and building energy consumption.
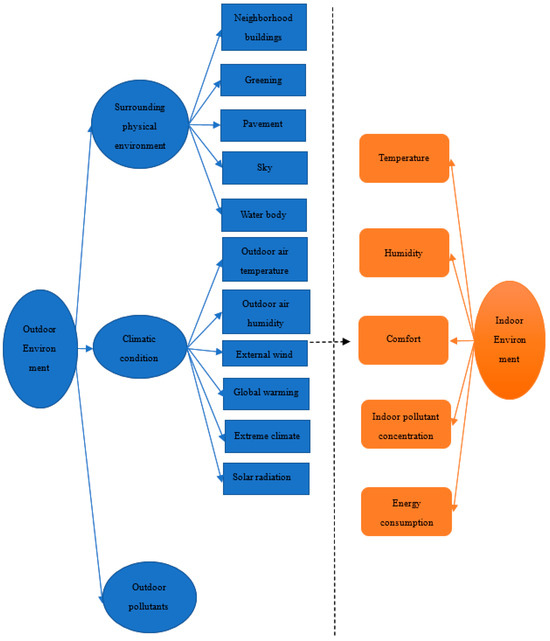
Figure 1.
Interaction between indoor and outdoor environment.
More and more high-rise high-density buildings are constructed due to insufficient land for housing in big cities [5]. The shading effects of the buildings vary with height and density, thus affecting the indoor air temperature. According to the research from Singapore, if the building density increases from 0.0625 to 0.766, the indoor air temperature drops by 4.7 °C, and if the building height increases from 12 m to 72 m, the indoor air temperature drops by 1.7 °C [6]. The building density is closely associated with the building layout. Compared with urban areas in four cities of Canada, the building density in rural areas is low with higher cooling energy consumption and lower heating energy consumption, because the wind speed is lower with lower building density, leading to less energy loss in cold weather conditions in winter [7].
Greenery can help improve the indoor thermal environment to offset the impact of global warming [8]. Pérez et al. [9] performed a systematic review on vertical greening and concluded that weather conditions not only affect the building’s thermal performance but also the transpiration of plants, etc. Vertical greening has shading, cooling, thermal insulation, and wind barrier effects, which help reduce the building energy consumption. Vertical greening has the potential to mitigate the effect of heat waves, and simulation results from Alsaad et al. [10] reported a reduction in the indoor air temperature by 3.77 °C and an increase in the indoor relative humidity ratio by 5.07% in central European cities. However, Li et al. [11] reported a maximum reduction in indoor air temperature of 0.56 °C by considering the window-to-wall ratios of the buildings and five greening scenarios of vertical greening. They concluded that some studies ignore the window components, which led to exaggeration of the effect of greening. Outdoor greening can help lower the outdoor air temperature, which indirectly affects the building’s energy consumption. Normally, the cooling energy consumption will drop, but the heating energy consumption will increase [12]. Therefore, outdoor greening should be carefully considered as it is twofold.
Other than greening, road surface reflectance and water bodies also play important roles in mitigating climate change. Using cool materials with high albedo as road pavement can effectively decrease the ambient and road surface temperatures [13], indoor temperatures, and cooling demand [14]. The existence of a water body increases the humidity of buildings [15]. Litardo et al. [16] discussed measures to mitigate UHI and reduce building energy consumption, considering site coverage ratio (SCR), facade to site ratio (FSR), tree coverage ratio (TCR), and vegetation coverage ratio (VCR), and the effect of albedo and sensible anthropogenic heat from traffic on building energy needs. Greening was considered as the solution of first priority, and changing the albedo of sidewalks can be used as an auxiliary approach.
Meanwhile, climate change has become a global problem. Extreme climates have also occurred frequently, which have a non-negligible effect on the indoor thermal environment. How to deal with global climate changes and prepare for extreme climates would be the focus of future research [17]. The Weather Research and Forecasting (WRF) model can be used to simulate the interaction between meteorological processes in the atmosphere and the earth’s surface, thus predicting climate change [18]. The UHI phenomenon is a reflection of climate change. It has been concluded that UHIs not only cause overheating indoors but also increase cooling energy consumption. When the average UHI intensity increases from 2 °C to 4 °C, the cooling energy demand rises from 12% to 70% [16].
Indoor air quality is also affected by the outdoor environment, and excessive outdoor air pollutants not only lead to the degradation of indoor air quality but also high building energy consumption as the air filtration device is needed to lower the indoor air pollutant concentration level.
A few review articles have been published in the past on the impact of the outdoor environment on the indoor environment. For example, Vardoulakis et al. [19] reviewed the impact of climate change on the indoor environment in the United Kingdom, such as overheating, thermal comfort, indoor air quality, indoor allergens and infections, as well as the impact of flood hazards and water pollution on the indoor environment. Pacini et al. [20] reviewed the impact of greening on the indoor environment of the school campus. Those articles only considered the impact of one outdoor environmental factor on the indoor environment. So far, very few papers have been found that consider the impact of different outdoor environmental factors on the indoor environment. Therefore, this paper presents a systematic review on the impact of various outdoor environmental factors on the indoor thermal environment. Firstly, it introduces the coupling methods that were used to link the indoor environment with the outdoor environment. Then, it presents the impacts of the physical environment, climatic environment, and outdoor air pollutants on the indoor environment. Finally, recommendations for the improvement of the outdoor environment and future studies are provided.
2. Methods
This paper presents a systematic review on the impact of the outdoor environment on the indoor environment. First, literature from 1988 to 2022 was collected in relevant databases such as ScienceDirect, EI, and nature with “indoor environment” and “outdoor environment” as the keywords. Through an extensive literature survey, the papers collected are divided into three aspects: the physical environment of the surrounding neighborhood, climatic conditions, and outdoor pollutants. They can be further classified as greening, road surface, water body, climate change, extreme climate, solar radiation, etc. A total of 150 papers were found in the first round, and then they were screened to remove those irrelevant to the research topic and only 127 high-quality papers remained in the end, which focus on a variety of factors that affect the indoor thermal environment. Figure 2 presents the publication trends from 1988 to 2022. It can be found that there were fewer than 3 papers per year before 2011. However, the number of papers is on the rise, especially after 2019, meaning it is becoming a hot topic in recent years. Table 1 presents the relevant outdoor impact factors and their contribution to the literature, among which the articles on the surrounding physical environment, climatic conditions, and outdoor pollutants account for 55.7%, 38.3%, and 6.0%, respectively. By studying the impact of the outdoor environmental condition on the indoor environment, the indoor environmental condition can be improved and energy consumption can be reduced through optimization of the outdoor environment in future research.
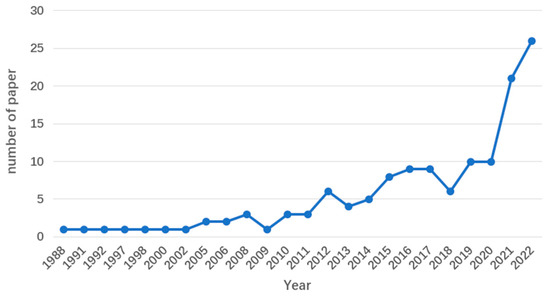
Figure 2.
Publication trends from 1988 to 2022.

Table 1.
Relevant outdoor impact factors and their contribution to the literature.
3. Coupling Method to Evaluate the Impact of Outdoor Environment on Indoor Environment
Two methods are often employed to study the relationship between indoor and outdoor environments, i.e., the numerical simulation method and the data-driven modeling approach. The former is based on developing thermal and airflow models on the physical environments, which requires a large amount of computational effort to find the numerical solutions. The latter finds the relationship based on comparative analysis from a large amount of data, which requires less amount of computational effort but is restricted by the ranges of variables provided by the data as well as the data quality.
The numerical simulation is typically performed by coupling an outdoor environment simulation program with an indoor environment simulation program (Figure 3). Firstly, the outdoor physical environment properties and climatic conditions are used as inputs to the outdoor environment simulation program to perform simulation on the microclimate, and then the outputs of the microclimate are used as inputs for indoor environment simulation software. Finally, the results (building energy consumption, indoor air temperature, etc.) from the indoor environment simulation are obtained. Yang et al. [21] used the Building Controls Virtual Test Bed (BCTVB) to couple urban microclimate simulation software ENVI-met with building energy simulation software EnergyPlus and evaluate the impact of microclimate on the building energy performance. Djedjig et al. [22] integrated a green envelop model written in Python into the TRNSYS simulation tool to predict the impact of vegetation modules on building energy performance. City Building Energy Saver (CityBES) provides an open platform to generate urban building energy models based on the Geographical Information System (GIS), which can be used to perform analysis on building energy performance after retrofit [23]. The weather data profiles close to the buildings are assigned based on their locations. In the future, it can be combined with urban microclimate models to study the influence of microclimate on building energy performance. Ahmadian et al. [24] used CitySim to study the correlation between built forms, density, and building energy performance. Four customary urban built forms with different density indicators were selected as examples to help select the most suitable built form in temperate climates. De Luca et al. [25] proposed a method to study the impact of reciprocal distances among tall buildings, and their relative position on the outdoor and indoor comfort, and energy consumption of buildings. Ladybug Tools were used to couple the indoor and thermal models. Computational fluid dynamic (CFD) simulation was performed to obtain the micro wind profiles, and EnergyPlus was used to perform building energy analysis.
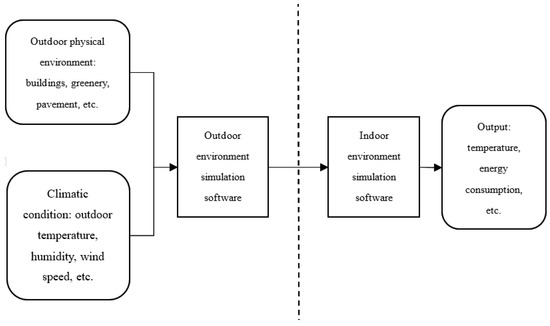
Figure 3.
Schematic diagram of coupling methods between indoor and outdoor.
Table 2 presents the different numerical simulation methods to couple the indoor environment with the outdoor environment and evaluates the advantages and disadvantages of the associated method.
Table 2.
Introduction to different numerical simulation methods.
When a data-driven approach is employed, usually a back-box model between the inputs and outputs is developed, e.g., a neural network model. The development of a neural network model requires the collection of actual operation data in buildings to predict building energy consumption [28], indoor temperature [29,30], etc. Mihalakakou et al. [28] developed a neural network model using outdoor temperature and solar radiation as inputs to predict the building energy consumption for a period of several days during the heating season. Ruano et al. [29] developed a radial basis function (RBF) neural network model to predict indoor air temperature. Compared with the results from the physical model, the ones from the neural network model were more accurate. Mirzaei et al. [30] also developed an artificial neural network model to predict the indoor temperature using the surrounding environment parameters as inputs. The results show that the neighborhood characteristics have a significant effect on building interior temperature when the radius of distance is in the range of 320–380 m. Within this range, increasing the proportion of vegetation and reducing the proportions of asphalt on the road and exposed roofs can result in a decrease in indoor temperature. Neo et al. [31] developed multiple linear regression (MLR) and geographically weighted regression (GWR) models to analyze the effects of building characteristics (e.g., number of residential units and floors) and urban landscape factors (e.g., average temperature, building height, etc.) on building energy consumption. It was shown that building characteristics are more influential than urban landscape factors. Chen et al. [32] combined CityGML files and data-driven models to simulate microclimate. Compared with traditional regression models, the results were more accurate. The results show that the street aspect ratio has a greater impact on the street temperature during the day than at night. A negative logarithmic relationship between the green plot ratio and the daily temperature was found. The limitation of this method is its failure to consider the effects of anthropogenic heat, green roofs, and green facades.
Based on the above literature survey, it can be summarized that the numerical model can simulate the relationship between indoor and outdoor thermal environments through physical modeling; however, it needs a great amount of computational effort. The data-driven approaches rely on a large amount of data for training and validation and cannot produce reliable output results if the values of the inputs are beyond the ranges in modeling.
4. Influence of Surrounding Physical Environment on Indoor Thermal Environment and Energy Consumption
Buildings are usually surrounded by neighboring buildings, green plants, road surface, water body, sky, etc., all of which have an impact on the microclimate of the buildings. In turn, the changes in microclimate indirectly affect the indoor temperature, humidity, thermal comfort, and energy consumption of the buildings.
4.1. Neighboring Buildings
The neighboring buildings have a great impact on the energy consumption of the surrounding buildings. Building layout and the ratio of the height of surrounding buildings to the width of the street (H/W) and façade albedo are the main influencing factors that affect the absorption of solar radiation and, hence, the indoor thermal environment and building energy consumption.
Lam [33] investigated the shading effect of neighborhood buildings of 120 commercial buildings in Hong Kong. It was found that under peak cooling load design conditions, the shading effects range from 25% to 31%. Through simulation on a normal office building in Hong Kong, it was found that the solar heat gain through the window was reduced by 14%, representing a 2% reduction in the total building cooling load. Since the central plant is oversized due to neglecting the shading effects of the nearby building, it consumed 1.2% more in annual energy consumption due to inefficient operation during part load conditions. Further studies revealed that the H/W ratio has an impact on the amount of solar radiation transmitted into the indoor environment and, hence, affects the cooling load and heating load of the building [34,35]. A higher H/W ratio results in a lower building cooling load, higher heating load, and higher lighting energy consumption. This is due to the increased obstruction of solar radiation, resulting in decreased daylighting and solar heat gain through the building envelope. Compared with no obstacle condition, when H/W = 1, the lighting energy consumption is doubled, leading to high building energy consumption. Visual comfort decreases with the increase in building height and density [36], which requires more artificial lighting to improve the indoor environment and results in more energy consumption. Ichinose et al. [35] studied the impact of neighborhood buildings on the cooling and heating energy needs of buildings in hot summer and cold winter regions in China. It was found that the reduction in cooling energy needs and heating energy needs is almost equal in Shanghai and Wuhan. However, in Changsha, Chengdu, and Chongqing, the cooling energy needs are reduced and heating energy needs almost stay unchanged due to little solar radiation in winter in the three cities. Liu et al. [37] also found a similar impact of surrounding buildings on cooling and heating energy needs in different community forms.
The layout of the neighborhood buildings has an impact on building energy consumption. The study carried out by De Luca et al. [25] showed that the indoor air temperature of the compact office buildings was about 4 °C lower than the spaced office buildings, which has a significant impact on the indoor cooling demand. Shi et al. [38] conducted a survey on 30 hospitals in the cold regions of China and found that different building layouts for the general outpatient department, the medical technology department, and the inpatient department can help improve building energy efficiency. Deng et al. [39] investigated the heating energy consumption of residential buildings in Jinan in the cold region of China under the courtyard, staggered, and row layouts. They found that the heating energy consumption per unit area of the courtyard layout was the lowest due to high wind resistance in winter, however, with the highest annual energy consumption. The compact layout results in poor ventilation and heat dissipation but also has a good insulation effect. However, the solar radiation in summer is high, leading to the highest total energy consumption in this type of building.
Table 3 presents the effect of H/W on the cooling and heating demand of the building. It can be found that the cooling energy needs decrease with the increase in the H/W ratio due to a better shading effect with higher neighborhood buildings. When the H/W ratio is low (<0.52), meaning building spacing is large or the building height is low, the neighborhood buildings have little impact on the cooling and heating demand of the surrounding building.
Table 3.
Impact of building height to street width (H/W) ratio on cooling and heating demand.
Other than the building layouts and H/W ratio, the wall reflectivity of the neighborhood buildings also has an impact on the energy consumption of the surrounding building. For walls with low reflectivity, the solar radiation entering the building depends almost entirely on the sky view factor (SVF), while for walls with high reflectivity, the solar beam can be reflected multiple times, allowing the floor space to receive more solar radiation, thereby reducing the lighting energy needs [34]. Walls with reflective materials (cool walls) can help reduce their external surface temperatures, thereby lowering the indoor air temperature. A study carried out by Salvati et al. [42] showed that the east cool wall leads to a 0.6 °C decrease in the indoor operative temperature during the hottest day while a 0.2 °C decrease in the temperature could be achieved by the west wall. Battista et al. [43] developed an urban street canyon model and performed a simulation under the TRNSYS environment. They found that multiple reflections of short-wave and long-wave radiation by walls can result in an increase in the cooling demand of buildings in the street canyon by 50% and a decrease in the heating demand by 20%.
Based on the literature survey, it can be seen that the aspect ratio, density, and layout of the neighborhood buildings and the albedo of the walls of the surrounding buildings play important roles in the energy consumption of the surrounding building. Therefore, to improve the building’s energy performance, it is very important to take into account the building layout and reflectivity of the external walls in the early design phase. Furthermore, previous research work mostly focuses on their impact on energy consumption, but few studies focus on indoor visual comfort, which could be the direction for future research.
4.2. Greening
Greening can not only help reduce indoor temperature but also increase indoor relative humidity, which eventually has an impact on building energy consumption. Greening can be divided into urban green space and vertical greening. The former is to grow grass, shrubs, trees, etc., outdoors, and the latter is on the building envelope. For urban space greening, the canopy can provide shade for the building. Meanwhile, the transpiration of trees helps increase the relative humidity in the building. Pastore et al. [44] used ENVI-met to simulate urban space greening with different leaf area indices (LAI) and found that the influence of lawn on solar radiation entering the building is almost negligible while trees can help reduce the amount of indoor solar radiation. Greening can help improve indoor thermal comfort by reducing indoor air temperature by 3.4 °C on hot days through shading and blocking solar radiation. Using building-integrated vegetation combined with window replacements leads to a reduction in indoor temperatures by up to 4.8 °C. Morakinyo et al. [45] coupled ENVI-met and EnergyPlus to develop building models with/without tree shading to analyze the effect of greening. The results show that the indoor temperature is lower and the indoor relative humidity is higher for the buildings with tree shading due to the transpiration of the trees. The shade cover percentage and the solar irradiation received by the external walls of the building directly affect the indoor temperature [46]. The shade cover percentage not only varies with the variation in the solar altitude during the day but also is greatly affected by the distance between the trees and the buildings. The difference in the LAI and leaf area density (LAD) between evergreen and deciduous trees also has an impact on the changes in indoor air temperature due to different solar shading effects. Taleghani et al. [47] used ENVI-met to simulate the microclimate of a university campus in Manchester under normal conditions and the scenario of adding more trees during the hottest summer. The results show that an increase of 17% in tree cover can reduce the temperature by 1.1 °C.
For high-density cities, the cooling effect of greening is not obvious due to the lack of land for outdoor greening and the low sunshine level due to the shading effect of neighborhood buildings. Shade-tolerant plants should be selected, and the reduction in transpiration and photosynthesis caused by low sunshine should also be considered [27]. In this case, vertical greening is a good choice to replace urban space greening. Li et al. [48] evaluated the performance of different greening schemes in hot summer and cold winter regions in China and found that the use of linear green walls and modular green walls leads to significant improvement in indoor thermal comfort in the hot summer season and lower indoor comfort in the cold winter season. Furthermore, the green facade helps reduce the indoor air temperature in the hot summer season. However, it only marginally warms up the indoor air in the cold winter season, and the period of people feeling “very cold” in winter is longer than the reference wall. Djedjig et al. [22] integrated the green module written in Python into TRNSYS and performed an evaluation on the performance of green walls. Through simulation, they found that green walls could effectively reduce cooling and heating loads for La Rochelle with a maritime climate and Athens with a Mediterranean climate. Meanwhile, the west façade with vegetation performed better in reducing the indoor air temperature than the east façade. Zhang et al. [49] considered the net photosynthesis of leaves and the influence of the vertical green façade on the indoor and outdoor environment during transpiration. Through measurement, they found that the indoor operative temperature with a vertical west green façade was 3.6 °C lower than the one with a normal west wall. Through field measurement, Widiastuti et al. [50] found that green facades with different leaf coverage areas had different effects on indoor temperature, humidity, and thermal comfort. Greater leaf coverage area led to a lower indoor temperature. In addition, due to the transpiration of the leaves, the indoor relative humidity also increased, thus the indoor comfort was not necessarily improved. Similarly, Hao et al. [51] also found that a green façade with a green roof led to higher indoor humidity and a reduction in mean operative temperature from 0.4 °C to 2.1 °C. In addition, the fluctuation amplitudes of the indoor air temperature and relative humidity in transitional seasons were reduced by 39.3% and 28.8%, respectively [52], and the indoor discomfort hours were also reduced. In addition to improving the outdoor microclimate and indoor thermal environment, Viecco et al. [53] also found that plants on exterior walls and roofs could absorb outdoor particulate matter to improve urban air quality. However, a higher greening rate might not lead to higher absorption efficiency, which depends on a number of factors, such as building height and traffic conditions. In addition, trees and green façade could lead to a lower wind speed which increases the concentration level of particulate matter.
Greening can lead to a decrease in indoor air temperature, which has an impact on the cooling and heating loads of the building. Tree shade has been found to cause an increase in the heating load and a decrease in the cooling load [2]. Planting trees in different directions also has different effects on the reduction in the indoor cooling load [54]. Planting trees on the west wall direction has a greater impact on the cooling load reduction in summer, while planting trees on the south and east walls has more impact on the heating load in winter. Different tree species have different effects on the indoor thermal environment. Deciduous trees can block sunlight in summer to reduce indoor temperature and can allow sunlight to transmit in winter to reduce heating demand, while coniferous trees can help reduce indoor heat loss in winter [55]. Li et al. [56] compared the building energy consumption of a courtyard building after greening in Ningbo, China, through simulation using DesignBuilder software and smart meter reading. It was found that the simulated results differed from the actual reading due to the lack of vertical greening modules in DesignBuilder and the difference between actual occupants’ behaviors and the assumed occupancy pattern.
Table 4 lists the impact of different greening schemes on building energy consumption.
Table 4.
The impact of different greening schemes on building energy consumption.
Based on the literature survey, it can be found that greening can help reduce the indoor air temperature and cooling load in summer and, if properly used, might also help to reduce heat loss in winter. The transpiration of green plants also increases the indoor relative humidity level and thus, has an impact on indoor thermal comfort. Meanwhile, greenery in different directions also has an impact on the indoor thermal environment. All the factors need to be taken into account for outdoor greening. In addition, there are still some limitations when conducting field experiments and numerical simulations. For example, when simulating the impact of different greening areas on the interior environment using the scaling model, the impact of occupancy usually is not taken into account. The existing vegetation database still needs to be improved to include more plant species. When considering the impact of greening on the ambient climate of the buildings throughout the year, variations in LAI and changes in LAD over time need to be considered [44]. Both parameters have an impact on the solar shading rate, and the degree of influence needs further discussion.
4.3. Road Surface
Buildings are not only surrounded by other buildings and urban green spaces but also roads. The road surface also has an impact on the indoor and outdoor thermal environment as it can reflect the solar radiation back to the sky, building surface, and indoors. The higher the albedo of the road surface, the more solar radiation is reflected, which results in lower road surface temperature as well as outdoor air temperature and, in turn, reduces the cooling load of the building [59,60,61]. Part of the reflected sunlight is absorbed by the exterior walls surface of the building, which leads to an increase in the indoor air temperature [42].
The increase in the albedo of the pavement leads to a decrease in the pavement and outdoor environment temperature. Santamouris et al. [13] used a cool material with an albedo of about 0.6 for paving in a park in Athens with about 4500 m2 paving area. The outdoor air temperature and road surface temperature dropped by 1.9 °C and 12 °C, respectively, on a typical summer day, which effectively improves the outdoor thermal comfort. Synnefa et al. [59] developed a CFD model under the PHOENICS environment to simulate the temperature around a road in Athens using gray-white asphalt (albedo 0.55) and black asphalt (albedo 0.04) pavements. The results show that the average temperature at the height of 1.5 m above the road surface using gray-white asphalt pavement was 5 °C lower than the black asphalt pavement. Carnielo and Zinzi [60] conducted field measurements in Rome and found that under the same conditions, compared with black asphalt, the highest and average temperatures over the gray-white asphalt surface were 18.5 °C and 8.3 °C lower, respectively. The effect of gray-white asphalt (with albedo = 0.65), gray asphalt (with albedo = 0.4), and black asphalt (with albedo = 0.1) over the outdoor temperature were simulated under the ENVI-met environment. The simulation outcomes show that at the height of 4.5 m above the road surface, the air temperatures over the gray-white asphalt road and gray asphalt road were 5.4 °C and 2.9 °C lower than that of the black asphalt road, respectively. Replacing the conventional pavement with cooling pavement (with reflectance = 0.69) can lower the road surface temperature and outdoor air temperature by 2–4 °C and 0.3 °C, respectively [62].
The use of high albedo materials can lower the pavement temperature by about 15 °C in summer and 8 °C in winter, but the surface temperature is also affected by other factors, such as near-surface wind speed [63]. The experiments carried out by Wu et al. [64] show that with the same albedo, a higher wind speed led to a lower road surface temperature. The impact of high albedo materials on the decrease in the pavement temperature and ambient temperature varies in different locations [61]. For example, the increase in pavement albedo has little effect on the outdoor temperature in Cairo, where the use of concrete with an albedo of 0.5 can only lower the outdoor temperature by 0.1–0.5 °C.
High albedo pavement can lower the ambient temperature and alleviate climate change pressure. Many studies have also confirmed that cool pavement could help reduce the cooling energy consumption of buildings in summer. Through computer simulation under the TRNSYS environment, it was shown that compared with black asphalt, gray asphalt and gray-white asphalt could lead to peak building cooling load reduction by 7.8–10.2% and 14.6–18.9%, respectively [60]. In addition, the effect of the pavement material on buildings with heat insulation is not as obvious as those without heat insulation [60]. Aboelata [61] conducted a study and found that the use of high albedo concrete could reduce cooling energy in Cairo by 0.2% to 2.5%. Jandaghian and Berardi [18] combined the weather research and forecasting model (WRF), building effect parameterization (BEP), and building energy model (BEM) to study the impact of cool pavement on building energy consumption and found that using pavement with an albedo of 0.45 can reduce the energy consumption of the heating ventilation and air conditioning system (HAVC) by an average of 1 W/m2, compared with an initial albedo of 0.2. The increase in albedo could save 7% to 10% of cooling energy in the Toronto area during heat waves [18]. Santamouris et al. [14] also found that when the albedo of the road surface increased from 0.1 to 0.6, the maximum ambient temperature could drop by 0.4–1.4 °C, and the building cooling energy consumption decreased by 0.04–0.025% for every 10% increase in the albedo.
However, studies from some researchers have come to the opposite conclusion that a higher albedo of the pavement leads to more solar radiation being reflected onto the wall surfaces of the building. As a result, the temperature of the surrounding building surfaces increases and more cooling energy is required. In urban street canyons with large aspect ratios, i.e., deep or narrow urban street canyons, the influence of pavement reflectivity on the interior is small because only a small portion of shortwave radiation can reach the ground [40]. Qin [65] developed a numerical model to study the relationship between the aspect ratio and albedo of the pavement. It was found that only when H/W < 1 the solar radiation can be effectively reflected by the road surface, which is similar to the results found by Yaghoobian et al. [40]. Salvati et al. [42] found that the incident radiation on the building envelope surface increased with the increase in road reflectivity. Increasing the road pavement material reflectance from 0.19 to 0.5 resulted in the increase in incident solar radiation on the building surface by 14%, which led to an increase in the external wall surface temperature, and a 0.5 °C increase in the indoor operative temperature on the hottest day. Xu et al. [41] also found that when the aspect ratio H/W is low, the cooling load decreases with the increase in the road surface albedo, and when the H/W increases to a certain value, the cooling load begins to increase. Yaghoobian et al. [66] found that the overall building design cooling loads near artificial turf (AT) could decrease by 15–20% compared with other common ground surface materials (asphalt, concrete, and grass).
Previous studies have also shown that in some places such as Cairo [61] the road pavement has little impact on the indoor thermal environment. In such cases, the combination of greening and high albedo pavement materials can be effective in reducing the cooling energy need [67,68]. Shahidan et al. [68] compared the indoor thermal environment under current conditions and with trees of different densities and high-albedo material pavements. They found that ambient temperature dropped significantly by up to 3.5 °C and indoor temperature by up to 1.9 °C, resulting in 29% of energy saving.
Based on the literature survey, it can be found that more studies focus on the effect of high albedo in summer but fewer in winter. Meanwhile, the aspect ratio of H/W plays an important role in the reflection of solar irradiation. The optimization of the pavement albedo, H/W ratio, and combination with greening could be the focus of future research.
4.4. Water Body
Water bodies refer to the lakes, rivers, fountains, etc., near the buildings and are an important part of the built environment. The water body acts as a thermal mass to accumulate heat and maintain stable outdoor temperature. Meanwhile, water can evaporate and absorb heat from the surroundings, lowering the outdoor air temperature and increasing the humidity, thus improving thermal comfort in summer.
In the past, many scholars have noticed the cooling effect of water bodies on the surrounding microclimate. Murakawa et al. [15] found that in clear weather, the water in the rivers could help reduce the ambient temperature by 3–5 °C. Syafii et al. [69] found that solar radiation and wind speed have great impacts on the cooling effect of water bodies. Tan et al. [70] found that increasing the coverage of water bodies by 10% could reduce the average ground surface temperature by 0.42 °C and that the existence of water bodies could also increase the ambient humidity level, and the amount of evaporation was much larger than that of greening plants. Yang et al. [71] found that water bodies could not only lower the ambient temperature but also increase the surrounding air humidity and wind speed. Jin et al. [72] found that the centralized water body could lower the ambient temperature by 2 °C and increase the relative humidity by 5% within 10 m of the water body, and the dispersed water body could improve the uniformity of the surrounding microclimate. A better cooling effect and a higher relative air humidity increase were found on the leeward side, and setting the water body on the windward side was suggested.
Water bodies can lower the ambient air temperature in summer by acting as a natural thermal storage system and increase the relative air humidity through evaporation, thus indirectly affecting the energy consumption of surrounding buildings. Xu et al. [73] studied the cooling effect of a garden with a water body in Beijing using ENVI-met for simulation. The garden was divided into 92 × 92 grids, 2.25 m2 each. It was shown that the water body led to a heat reduction from 500 J to 1400 J for each grid [73]. Lower ambient temperature results in lower cooling energy needs to maintain indoor thermal comfort [74]. However, there are relatively few studies on the energy-saving effects of water bodies. The location, area, geometry, and surrounding built-up proportions all have an impact on the cooling effect of the water body [75]. In general, larger water body has a better cooling effect, and square and round water bodies help to enhance their cooling effects.
Based on the literature survey, it can be seen that most of the studies focus on the cooling effects of water bodies on the ambient environment, fewer of which focus on energy reduction. In addition, few studies have evaluated the impact of the water bodies in winter. Furthermore, the combination effects of water bodies, greening, and road surface have not been studied, which could be considered as a future research direction.
4.5. Sky
The impact of the sky on the indoor thermal environment depends on two factors. The first factor is the sky temperature, which is lower than the ambient temperature. The long-wave radiation between the sky and the building has an impact on the building’s energy demand [76]. Some studies considered the sky as a cooling source for radiative cooling, which can significantly reduce the roof surface temperature and building cooling load [77]. The second factor is the sky view factor (SVF), which refers to the proportion of visible sky above the observation point. A larger SVF also allows more solar radiation to reach the building enclosure, which affects the visual comfort and building energy needs for cooling/heating [78].
Studies on the sky temperature started very early. Some researchers focused on the development of clear sky models, which can be used to estimate solar irradiance, and others developed sky temperature models to study the radiation heat transfer between the sky and buildings. Antonanzas-Torres et al. [79] developed a clear sky model, which can be used to estimate the ground surface solar irradiance by combining the model with satellite images and cloud cover predicted by sky imagers. Up to now, there are over 70 clear sky models to predict solar irradiance under different sky conditions. Evangelisti et al. [76] conducted a review of articles on sky temperature from 1918 to 2019 and found that annual building energy consumption differed using different sky temperature models.
Visual comfort is a very important indicator of a healthy building. When the daylighting level is low, artificial lighting is often used, leading to an increase in building energy consumption. If daylighting is used instead, energy saving can be achieved without sacrificing visual comfort. The amount of sunlight entering indoors depends on the solar altitude and atmospheric composition (aerosols, precipitable water, ozone, nitrogen dioxide, etc.) [79] and SVF [79]. Wang et al. [80] found that cloud condition has an impact on the indoor light environment. Glare appears on sunny days but not on cloudy days. Natural lighting reduces the indoor light and heat environment, but on cloudy days there is not enough natural lighting to maintain the indoor light and heat environment. Using the curtains to avoid glare on sunny days lowers the indoor light level, while on cloudy days there is not enough daylight to maintain indoor visual comfort. De Rosa et al. [81] defined a cloudy day as there is no direct sunlight throughout the day, and the indoor natural illuminance comes entirely from diffuse sunlight. They used different INLUX codes to calculate the indoor natural illuminance under cloudy days.
Based on the literature survey, it can be seen that most of the studies focus on the development of sky models to predict solar irradiation and sky temperature. The combination impact of the sky temperature on the indoor environment and building energy consumption could be the direction of future research.
5. Weather Condition
The surrounding physical environment mainly affects the outdoor microclimate and indirectly the indoor thermal environment. Meteorological conditions also have a non-negligible effect on the indoor thermal environment. Meteorological conditions include outdoor temperature, humidity, wind speed, global warming phenomenon, extreme climate, solar radiation, etc. This paper mainly reviews the influence of outdoor temperature, outdoor humidity, external wind, global warming, extreme climate, and solar radiation.
5.1. Outdoor Temperature
The indoor air temperature is positively correlated with the outdoor air temperature. In hot summer and cold winter regions, when air conditioners are not used in summer, despite shading and natural ventilation, the indoor temperature increases with the outdoor temperature. Due to the thermal mass of the building envelope, the peak indoor temperature is usually 3 to 5 h lagging behind the peak outdoor temperature. Asumadu-Sakyi et al. [82] found that without turning on the air conditioner, a 1 °C increase in outdoor temperature leads to an increase in indoor temperature of about 0.4 °C (0.41 °C in the warm season and 0.42 °C in the cool season) in Brisbane under the subtropical climate. The relationship can be affected by the building age, building type, and roof insulation level [82]. For special buildings, such as temporary prefabricated houses (PHs), heating or cooling equipment is generally not used, and there is a similar relationship between indoor and outdoor temperatures [83]. During the daytime in summer, when doors and windows are closed, the variation trend in the indoor temperature synchronized with the variation in the outdoor air temperature. The indoor temperature is much higher than the outdoor temperature with a maximum temperature difference of 7.85 °C, which differed from naturally ventilated residential buildings [83].
Lee and Lee [84] recorded the indoor air temperature, outdoor air temperature, and relative humidity of 14 houses in Seoul, South Korea, for a period of one year. It was found that when the outdoor temperature was higher than 15 °C, there was a strong correlation (r = 0.95) between the indoor and outdoor temperatures, and when the outdoor temperature was below 15 °C, the correlation between indoor and outdoor temperature is weaker (r = 0.89) due the use of heating equipment. Yan et al. [85] conducted experiments in Baotou, Yinchuan, Jiaozuo, etc., and found that in the cold season, people would use heating equipment to obtain a more comfortable indoor temperature. Therefore, when the outdoor temperature was below 10 °C, the indoor air temperature gradually increased as the outdoor air temperature decreased.
The increase in outdoor temperature leads to an increase in indoor temperature and thus requires more cooling energy to maintain indoor thermal comfort. Ang et al. [86] estimated that the total electricity consumption in Singapore and Hong Kong will increase by 2.9~3.7% and 4.3~5%, respectively, if the outdoor temperature rises by 1 °C. The increase in energy needs in the residential building sector is higher than that in the industrial building sector. Fung et al. [87] developed a multiple linear regression model to compare the relationship between outdoor temperature, relative humidity, wind speed, wind direction, solar radiation, and precipitation with building energy consumption, where outdoor temperature accounted for 73% of the total variance. Wangpattarapong et al. [88] estimated that electricity consumption would increase by 6.79% for every 1 °C increase in outdoor temperature in Bangkok.
Based on the literature survey, it can be found that most of the studies focus on the indoor–outdoor temperature relationship and its impact on building energy consumption. More research should focus on the building’s adaptivity to the variation of outdoor conditions for sustainable development.
5.2. Outdoor Humidity
For buildings in a high-humidity environment, hot and humid air will infiltrate into the building. The outdoor air temperature rises rapidly; however, the increase within the building envelope is much slower. Therefore, the wall temperature is lower than the indoor temperature, resulting in moisture condensation on the indoor surface [89].
As condensation is caused by the infiltration of high-humid outside air, extra energy is required to remove the moisture from the air. High humidity also affects the indoor thermal comfort and air quality. Moon et al. [90] performed a hygrothermal simulation on energy efficiency and indoor air quality (IAQ) for selected residential buildings. They found that when moisture is considered, the building energy consumption increases by about 4%. The moisture also affects indoor thermal comfort, reduces IAQ, and increases mold growth risk. Their statements were supported by Cho et al. [91], who pointed out that moisture condensation can promote the growth of microorganisms and increase the health risk of indoor occupants. Indoor moisture condensation rate is correlated with outdoor humidity. You et al. [92] found that a higher outdoor air humidity ratio leads to a shorter indoor moisture condensation time, a longer condensation duration time, and a larger amount of condensation water.
Moisture condensation in a high-humidity environment will lead to a series of adverse effects. In order to prevent condensation, He et al. [89] proposed to close the window of rural buildings in Changsha to alleviate moisture condensation when outdoor air temperature and indoor humidity are high. The indoor humidity can also be reduced by turning on the air conditioner and dehumidifier to reduce the risk of indoor condensation [92,93].
Based on the literature survey, it can be found that many of the studies focus on the adverse effects of high outdoor air humidity on the indoor environment. Future research should pay more attention to how to control the indoor environment to reduce these adverse effects under high outdoor humidity conditions through intelligent control.
5.3. External Wind
External wind is a renewable energy source, which is not only widely used in power generation but also in ventilation engineering, such as natural ventilation, which can reduce building energy consumption and improve indoor air quality. However, it may bring outdoor air pollutants to the indoors, which increases the indoor pollutant concentration and adversely affects the health of indoor occupants [94,95].
Wind towers can be used to introduce outdoor air into the indoors, which helps improve the natural ventilation efficiency. For example, Dehghani-sanij [96] proposed a new design of wind towers which can reduce electricity consumption during the peak period by 20%–80% in windy regions, such as most parts of Italy. Although the utilization of external wind for natural ventilation can help reduce building energy consumption, it could also lead to an increase in the space cooling load. Through WRF modeling, Takebayashi et al. [97] analyzed the thermal environment index distribution of coastal cities, such as Tokyo, Daban, and Nagoya, and found that in these coastal cities, the space cooling load may increase due to the increase in humidity caused by the sea breeze. The outdoor wind speed has an impact on indoor moisture condensation. You et al. [93] compared the indoor moisture condensation under different wind speeds through CFD simulation and found that although low wind speed can delay the moisture condensation time, the final condensation state is the same as that at high wind speed.
Based on the literature survey, external wind can be used to reduce building energy consumption, but improper utilization of external wind could increase indoor pollutant concentration, cause thermal discomfort, and even increase the health risk of the indoor occupants. Therefore, more studies can focus on the utilization of external wind while considering the combined effects of outdoor air humidity, pollutant concentration level, and temperature for indoor environmental control optimization.
5.4. Global Warming
Global warming poses a threat to buildings. As the life span of buildings usually lasts for over 30 years, the warming climate has a great impact on the indoor temperature, thermal comfort, and energy consumption of buildings.
Constantly rising outdoor temperatures lead to increasing indoor temperatures, which can increase the risk of overheating indoors. Taylor et al. [98] simulated the overheating risk of 15 residential buildings in the UK under six different design summer years and the 2050 Medium Emissions scenario. They concluded that the overheating risk of residential buildings is affected by climate change, and the relative risk varies in different climate zones, with warmer regions at a higher risk of overheating than cooler regions. Escandón et al. [99] generated the climate files under the 2050 Medium Emission scenario based on 30 min interval temperature and relative humidity data in Spain from 2014 to 2015. It was seen that the percentage of overheated hours in the current climate is 0–60%. By 2050, the percentage of overheating hours will rise to 30–90%. According to the standard of CIBSE TM52 [100], under the current climate, 38% of the existing buildings in Spain have already experienced overheating risks. By 2050, the overheating risks will rise to 100%. Hamdy et al. [101] introduced a method to assess the impact of climate change on the overheating risk, using IDA-ICE to simulate 9216 design cases under 4 climate scenarios (average, extreme, future, and extreme future scenarios). They found that higher overheating risk exists with the houses with higher solar gain, at upper floors, and low ventilation rates. WRF models combined with BEM can be used to predict the future state of buildings [18]. Stone et al. [102] used the WRF model to simulate three climate scenarios in Phoenix, Arizona, BASE (heat wave scenario), COOL (scenario with high albedo or cool roofs on all structures), TREE (50% of all pavement covered, canopy coverage), and their impact on the indoor thermal environment during power outages. They found over 15 °C increase in indoor air temperature during the power outage when the indoor air temperature setpoint was 24 °C; the use of cool roofs and greening has little effect on the indoor temperature at night; a cool roof can both lower the indoor temperature and offset the solar heat gain through the building envelope while greenery can only lower the indoor temperature.
Climate warming leads to an increase in cooling load in summer and a decrease in heating load in winter. Tootkaboni et al. [103] investigated the impact of climate change on residential building energy performance under two scenarios: (1) RCP4.5 scenario (by 2070, CO2 emissions will decrease, and by the end of the century, CO2 concentrations are two times of that at the pre-industrial level) and (2) RCP 8.5 scenario (by the end of the century, CO2 concentrations are three to four times of that at the pre-industrial level). They also found that indoor dry-bulb temperatures are most likely to change, and for single-family homes, multi-family homes, and condominiums, the energy required for cooling is rising dramatically and decreases for heating. Multi-family homes and apartments have a higher risk of overheating, possibly due to larger windows. Din and Brotas [104] studied the indoor environment of an apartment in the UK up to 2080, modeled with different materials (plasterboard, concrete, cement board, etc.). They found that the overheating risk in the living room is higher than that in the bedroom which is not affected by the sun. Heatwave events will increase by 20 times in 2080 and can be mitigated by using ceiling fans [104]. Hosseini et al. [105] simulated the changes in indoor comfort and building energy performance of two-family houses in Sweden from 2010 to 2099 under typical decay years (TDY) and found that the indoor heating degree days (HDD) decreased by 4%, while the number of cooling degree days (CDD) increased by 16%. The degree-day method does not consider the impact of solar radiation, humidity, and thermal mass on energy performance and could lead to large errors. Therefore, Wang et al. [106] used hourly energy simulation and found that although generally, heating energy decreased while cooling energy increased, in tropical areas, the impact of climate change on cooling was greater than that on heating, and it is vice versa for areas with cold climates. Chan et al. [107] also found that under the same emission scenarios, the increase in energy consumption in residential buildings is more than that in office buildings.
Table 5 presents the impact of climate change on building energy consumption in different locations.
Table 5.
The impact of climate change on building energy consumption in different locations.
Based on the literature survey, it can be concluded that most of the studies focus on the impact of high temperatures in future scenarios on the indoor environment and energy performance of the building. For example, the WRF model can be used to predict future scenarios, but the model resolution has a certain impact on the outcomes of the simulation. In addition, the impact of climate alleviation measures such as building energy conservation to reach carbon neutrality should be taken into account in future studies.
5.5. Extreme Weather Conditions
Extreme weather conditions refer to some extremely harsh climates, which rarely occur in general. However, they have happened frequently in recent years. The emergence of extreme climates is a severe test for the indoor thermal environment and indoor occupants.
Liu et al. [112] studied the applicability of four extreme weather datasets, including Summer Reference Year (SRY), Extreme Meteorological Year (XMY), Typical Hot Year-Intensity (THY-I), and Typical Hot Year-Event (THY-E), in assessing indoor overheating in summer. It was found that THY-I can be used to identify severest daytime overheating but may fail in evaluating the maximum heat intensity, while THY-E can be used to identify the longest duration of overheating during the daytime, SRY is not suitable for evaluating nighttime overheating. They suggested using a combination of two weather datasets for overheating assessment. Ji et al. [113] proposed the selection of an extreme hot year (EHY) based on the “Percentage of Synchronization” (POS) of outdoor and indoor-based extreme years. They concluded that the thermal-based index, which considers factors such as temperature, relative humidity, wind speed, and a person’s thermal response characteristics, was more suitable than the temperature-based index in evaluating indoor overheating, and heat wave intensity and severity are more important than its duration. For underground mines, once a problem occurs, the thermal environment of the refuge chamber plays a vital role in the safety and protection of the occupants. In addition to extreme high temperatures, some researchers have carried out studies on the impact of extreme cold climates on indoor comfort. For example, Rija [114] conducted a 9-point scale survey on the indoor thermal comfort evaluation in Roman Pond in the cold climate area of Niebuhr. Most of the houses in the area do not have heated rooms, but the results showed that even if the indoor temperature is very low, people in the room would not feel “extremely cold”, indicating that the occupants would adapt to the living environment. Similar results were found by Huang et al. [115] from their research in Tibet, in cold and severe climate zone in China, where about 90% of them were found to be satisfied with the overall indoor thermal environment.
Based on the literature survey, it can be found that most of the studies focused on the impact of extreme weather conditions on the indoor environment. Future research could focus on making buildings more adaptive to mitigate the impact of extreme weather conditions on the indoor environment.
5.6. Solar Radiation
The impact of direct solar radiation on the human body and thermal comfort sensation has not been taken into consideration by most of the indoor thermal environment standards. SolarCal was proposed by Arens et al. [116] to calculate solar radiation for environments with simple geometries, and it was validated against a lab study and showed good agreement with actual Predicted Mean Vote (PMV) testing results. However, SolarCal does not take into account the glazing orientation which has a certain impact on the evaluation outcomes. Marino et al. [117] studied the impact of solar radiation components on the thermal comfort of the occupants. The direct and diffuse solar radiation greatly affects the asymmetry of the radiation field, causing thermal discomfort to the occupants.
Song et al. [118] studied the impact of solar radiation on the thermal comfort of office buildings in five climate zones in China and found that the impacts varied in different directions, mainly concentrated in the east, south, and west directions. High influence was observed in the severe cold and the cold zones, especially in the east and west directions. High discomfort could be found near the window due to solar heat gain. Reducing the transmittance and solar heat gain coefficient of the windows can significantly improve indoor thermal comfort. MeshkinKiya et al. [119] applied a mixed uncertainty processing method to study the uncertainty of solar radiation in urban street canyons. The building height ratio, window-to-wall ratio, exterior shadow, external wall reflectivity, crown diameter, light transmittance of the tree, and reflectivity of the car were taken into account. The indoor environmental conditions of a room in the middle of a seven-story building were simulated. The results show that the complex street canyon model had little effect on the top-floor buildings. For the middle floors, the solar radiation was blocked, which significantly affected the indoor thermal and visual comfort. The uncertainty of the summer solar radiation had little effect on the PMV; however, it could cause the Daylight Glare Probability (DGP) to be reduced by 0.28 throughout the day.
Based on the literature survey, it can be concluded that the outdoor solar radiation has an important impact on the indoor thermal environment. Future research could focus on developing prediction models of the relationship between outdoor solar radiation and indoor thermal comfort and applying the prediction models to optimal air-conditioning system operation to reduce building energy consumption.
6. Outdoor Air Pollutants
Outdoor air pollutants can penetrate the indoors through the building envelope; therefore, extra air purification is required to maintain the indoor air quality, which leads to higher building energy consumption.
6.1. Correlation of Indoor and Outdoor Pollutants
The concentration of outdoor pollutants has a positive correlation with the concentration of indoor pollutants. Xu et al. [120] performed chemical analysis on the indoor and outdoor samples of very fine particles (VFPs) matter in a school in Xi’an and found that the indoor VFP species mainly came from outdoor, e.g., from motor vehicle emissions and coal burning. Ji et al. [121] estimated the contribution of outdoor particulate matter, indoor particulate matter, and indoor secondary organic aerosols to indoor PM2.5 concentrations in 90 residential buildings in China based on a mass balance model. The contribution of outdoor particulate matter to indoor particulate matter exceeded 92% when windows were opened. Even when the windows were closed, the contribution of outdoor particulate matter accounted for 54–63%. The concentration of indoor PM2.5 increased with the concentration of outdoor PM2.5. Wang et al. [122] studied the variations in indoor PM2.5 and CO2 concentrations in residential buildings under different ventilation modes and found that in addition to window openings, the use of air purification equipment can also help reduce indoor PM2.5 concentrations. Liu et al. [123] studied the relationship between the indoor and outdoor formaldehyde concentration ratios in five developing countries and nine developed countries and found that for most developed countries, outdoor formaldehyde concentration was not the main source of indoor formaldehyde. For developing countries such as China, indoor formaldehyde mainly comes from outdoors, which can be emitted by the biosphere, atmospheric reactions of volatile organic compounds, and especially the combustion of biomass and fuels, and compared with public buildings, the contribution of indoor formaldehyde in residential buildings from outdoor was smaller than from indoors, which may be due to the frequent use of wooden furniture and decorations in residential buildings.
6.2. Impact of Outdoor Pollutants on Building Energy Consumption
The increase in outdoor pollutants not only leads to decreased indoor environmental quality but also high building energy consumption [124,125,126]. Eom [124] found a linear relationship between the electricity consumption of 853 households in South Korea and outdoor PM2.5 concentration. The average power consumption increased by 11.2% when the concentration of PM2.5 increased by 75 μg/m3. Due to the increase in the concentration of outdoor pollutants, people tended to stay indoors, resulting in an increase in energy consumption during the day. More increase in the hot season was observed than in other seasons. He et al. [125] also showed that energy consumption increased with the increase in outdoor pollutant concentration in the United States. In addition, the increase in high-income families was greater than the middle-income and low-income households; commercial buildings were less affected than residential buildings. Zhong et al. [126] studied the impact of outdoor PM2.5 concentration on indoor energy consumption using an energy recovery ventilator (ERV) under different ventilation modes, air filtration efficiencies, and ventilation rates. The results show that the operation costs under energy exchange mode and the hybrid mode were 28% and 43% lower than that under bypass mode; combining ERV and high-efficiency filters (0.65 or 0.96) could reduce operation costs; for ground floor, a combination of 1000% of the minimum mechanical ventilation airflow rate as required by ASHRAE 62.2 [127] and a PM2.5 filter with a filtration efficiency of 0.96 under hybrid ventilation mode is recommended.
Based on the literature survey, it can be found that many of the studies focus on the indoor–outdoor correlations; however, very few studies focus on optimal control of the indoor environment by considering outdoor air pollution, which could be the focus of future research.
7. Conclusions
The outdoor environmental conditions have important impacts on the indoor thermal environment, e.g., temperature, relative humidity, thermal comfort, and building energy consumption. Improving the outdoor environment, such as enhancing the immediate surroundings of a building or controlling certain aspects of the outdoor environment in proximity to it, can have a positive impact on indoor thermal conditions. In the past, scholars have studied the effect of single or multiple outdoor environmental factors on the indoor environment using numerical or experimental approaches. The following conclusions can be made:
(1) There are certain differences between the physical model and the numerical model. For example, ENVI-met uses the jagged wall to simulate sloped and curved walls and the model accuracy increases with the increase in the resolution and computational effort. For example, the leaf area index and leaf area density of green plants vary with time, especially for deciduous plants, which is often ignored in numerical modeling. Both parameters greatly affect the solar shading rate, thereby the indoor environment. The degree of impact of the two parameters on the indoor environment is worthy of further discussion.
(2) It has been proved in the literature that the energy performance of a certain building can be improved by optimizing the surrounding building layout, density, aspect ratio, etc. However, the impact of surrounding buildings on indoor visual comfort and the relationship between daylight utilization and passive solar heat utilization, and facade engineering such as double skins and airflow windows deserves further studies.
(3) Greening can lower the indoor temperature and increase indoor humidity, but indoor comfort can not necessarily be improved, and indoor energy consumption might not be reduced (while cooling demand can be reduced, heating demand can increase). Therefore, multi-objective optimization on thermal comfort and building energy consumption is necessary. It is also noted that energy-efficient measures, such as thermal insulation, solar radiation shielding, and solar radiation acquisition, could potentially mitigate the impact of greenery. Therefore, a deeper inquiry into this matter is recommended for future research.
(4) There are many factors affecting the physical environment, such as the surrounding buildings, greenery, road surface, water body, and sky, but previous studies only considered one factor and ignored the influence of other factors, leading to an exaggeration of the effect of this particular factor. Meanwhile, the influence of each factor on the indoor environment can provide references for environmental facility engineers to control the indoor environment.
(5) Many studies focus on the impact of meteorological conditions, e.g., outdoor temperature, outside air humidity, external wind, global warming, extreme climate, solar radiation, etc., on the indoor thermal environment. The outcomes of the studies can provide particle guidelines on building cooling and energy conservation.
(6) Global warming will increase the frequency of overheating or extreme weather in hot areas and may increase indoor and outdoor comfort in cold areas. When mesoscale models are used for global weather prediction, a smaller resolution of the model may result in more accurate results but require a larger amount of computational effort. In addition, the impact of climate alleviation measures such as building energy conservation to reach carbon neutrality should be taken into account in future studies.
Author Contributions
Conceptualization, Y.L. and W.Y.; methodology, Y.L.; formal analysis, T.H.; investigation, T.H.; resources, Y.L. and W.Y.; writing—original draft preparation, T.H.; writing—review and editing, Y.L., W.Y., X.H., and C.L.; supervision, Y.L.; project administration, Y.L.; funding acquisition, Y.L. All authors have read and agreed to the published version of the manuscript.
Funding
This research was funded by the National Natural Science Foundation of China, under a grant 51878408.
Data Availability Statement
Not applicable.
Acknowledgments
The authors acknowledge the support from the R&D center of the transportation industry of health and epidemic prevention technology, the Ministry of Transportation of the People’s Republic of China.
Conflicts of Interest
The authors declare no conflict of interest.
Abbreviations
| AT | Artificial turf |
| BCTVB | Building controls virtual test bed |
| BEM | Building energy model |
| BEP | Building effect parameterization |
| CDD | Cooling degree days |
| CFD | Computational fluid dynamic |
| CityBES | City building energy saver |
| DGP | Daylight glare probability |
| EHY | Extreme hot year |
| ERV | Energy recovery ventilator |
| FSR | Facade to site ratio |
| GIS | Geographical information system |
| GWR | Geographically weighted regression |
| H/W | Height to street width |
| HAVC | Heating ventilation and air conditioning system |
| HDD | Heating degree days |
| IPCC | Intergovernmental panel on climate change |
| LAD | Leaf area density |
| LAI | Leaf area indices |
| MLR | Multiple linear regression |
| PH | Prefabricated house |
| PMV | Predicted mean vote |
| POS | Percentage of Synchronization |
| RBF | Radial basis function |
| RCM | Regional climate model |
| SCR | Site coverage ratio |
| SRY | Summer reference year |
| SVF | Sky view factor |
| TCR | Tree coverage ratio |
| TDY | Typical decay years |
| THY-E | Typical Hot Year-Event |
| THY-I | Typical Hot Year-Intensity |
| UGBE | Urban greening and built environment modeling |
| UHI | Urban heat island |
| VCR | Vegetation coverage ratio |
| VFP | Very fine particulate |
| WRF | Weather research and forecasting |
| XMY | Extreme meteorological year |
References
- Foley, J.A.; DeFries, R.; Asner, G.P.; Barford, C.; Bonan, G.; Carpenter, S.R.; Chapin, F.S.; Coe, M.T.; Daily, G.C.; Gibbs, H.K.; et al. Global Consequences of Land Use. Science 2005, 309, 570–574. [Google Scholar] [CrossRef]
- Simpson, J.R.; McPherson, E.G. Simulation of tree shade impacts on residential energy use for space conditioning in Sacramento. Atmos. Environ. 1998, 32, 69–74. [Google Scholar] [CrossRef]
- Li, L.; Sun, W.; Hu, W.; Sun, Y. Impact of natural and social environmental factors on building energy consumption: Based on bibliometrics. J. Build Eng. 2021, 37, 102136. [Google Scholar] [CrossRef]
- Enescu, D. A review of thermal comfort models and indicators for indoor environments. Renew. Sustain. Energy Rev. 2017, 79, 1353–1379. [Google Scholar] [CrossRef]
- Pan, X.Z.; Zhao, Q.G.; Chen, J.; Liang, Y.; Sun, B.J.S. Analyzing the variation of building density using high spatial resolution satellite images: The example of Shanghai City. Sensors 2008, 8, 2541–2550. [Google Scholar] [CrossRef]
- Li, J.; Zheng, B.; Bedra, K.B.; Li, Z.; Chen, X. Effects of residential building height, density, and floor area ratios on indoor thermal environment in Singapore. J. Environ. Manag. 2022, 313, 114976. [Google Scholar] [CrossRef]
- Akbari, H.; Taha, H.J.E. The impact of trees and white surfaces on residential heating and cooling energy use in four Canadian cities. Energy 1992, 17, 141–149. [Google Scholar] [CrossRef]
- Wang, Y.; Bakker, F.; de Groot, R.; Wörtche, H. Effect of ecosystem services provided by urban green infrastructure on indoor environment: A literature review. Build Environ. 2014, 77, 88–100. [Google Scholar] [CrossRef]
- Pérez, G.; Coma, J.; Martorell, I.; Cabeza, L.F. Vertical Greenery Systems (VGS) for energy saving in buildings: A review. Renew Sustain. Energy Rev. 2014, 39, 139–165. [Google Scholar] [CrossRef]
- Alsaad, H.; Hartmann, M.; Hilbel, R.; Voelker, C. The potential of facade greening in mitigating the effects of heatwaves in Central European cities. Build Environ. 2022, 216, 109021. [Google Scholar] [CrossRef]
- Li, J.; Zheng, B. Does Vertical Greening Really Play Such a Big Role in an Indoor Thermal Environment? Forests 2022, 13, 358. [Google Scholar] [CrossRef]
- Zhu, S.; Yang, Y.; Yan, Y.; Causone, F.; Jin, X.; Zhou, X.; Shi, X. An evidence-based framework for designing urban green infrastructure morphology to reduce urban building energy use in a hot-humid climate. Build Environ. 2022, 219, 109181. [Google Scholar] [CrossRef]
- Santamouris, M.; Gaitani, N.; Spanou, A.; Saliari, M.; Giannopoulou, K.; Vasilakopoulou, K.; Kardomateas, T. Using cool paving materials to improve microclimate of urban areas—Design realization and results of the flisvos project. Build Environ. 2012, 53, 128–136. [Google Scholar] [CrossRef]
- Santamouris, M.; Haddad, S.; Saliari, M.; Vasilakopoulou, K.; Synnefa, A.; Paolini, R.; Ulpiani, G.; Garshasbi, S.; Fiorito, F. On the energy impact of urban heat island in Sydney: Climate and energy potential of mitigation technologies. Energy Build. 2018, 166, 154–164. [Google Scholar] [CrossRef]
- Murakawa, S.; Sekine, T.; Narita, K.-i.; Nishina, D. Study of the effects of a river on the thermal environment in an urban area. Energy Build. 1991, 16, 993–1001. [Google Scholar] [CrossRef]
- Litardo, J.; Palme, M.; Borbor-Cordova, M.; Caiza, R.; Macias, J.; Hidalgo-Leon, R.; Soriano, G. Urban Heat Island intensity and buildings’ energy needs in Duran, Ecuador: Simulation studies and proposal of mitigation strategies. Sustain. Cities Soc. 2020, 62, 102387. [Google Scholar] [CrossRef]
- Saeed, K.H.; Paolini, R.; Caccetta, P.; Santamouris, M. On the combined impact of local, regional, and global climatic change on the building’s energy performance and indoor thermal comfort—The energy potential of adaptation measures. Energy Build. 2022, 267, 112152. [Google Scholar] [CrossRef]
- Jandaghian, Z.; Berardi, U. Analysis of the cooling effects of higher albedo surfaces during heat waves coupling the Weather Research and Forecasting model with building energy models. Energy Build. 2020, 207, 109627. [Google Scholar] [CrossRef]
- Vardoulakis, S.; Dimitroulopoulou, C.; Thornes, J.; Lai, K.M.; Taylor, J.; Myers, I.; Heaviside, C.; Mavrogianni, A.; Shrubsole, C.; Chalabi, Z.; et al. Impact of climate change on the domestic indoor environment and associated health risks in the UK. Environ. Int. 2015, 85, 299–313. [Google Scholar] [CrossRef]
- Pacini, A.; Edelmann, H.G.; Großschedl, J.; Schlüter, K. A Literature Review on Facade Greening: How Research Findings May Be Used to Promote Sustainability and Climate Literacy in School. Sustainability 2022, 14, 4596. [Google Scholar] [CrossRef]
- Yang, X.; Zhao, L.; Bruse, M.; Meng, Q. An integrated simulation method for building energy performance assessment in urban environments. Energy Build. 2012, 54, 243–251. [Google Scholar] [CrossRef]
- Djedjig, R.; Bozonnet, E.; Belarbi, R. Analysis of thermal effects of vegetated envelopes: Integration of a validated model in a building energy simulation program. Energy Build. 2015, 86, 93–103. [Google Scholar] [CrossRef]
- Chen, Y.; Hong, T.; Piette, M.A. Automatic generation and simulation of urban building energy models based on city datasets for city-scale building retrofit analysis. Appl. Energy 2017, 205, 323–335. [Google Scholar] [CrossRef]
- Ahmadian, E.; Sodagar, B.; Bingham, C.; Elnokaly, A.; Mills, G. Effect of urban built form and density on building energy performance in temperate climates. Energy Build. 2021, 236, 110762. [Google Scholar] [CrossRef]
- de Luca, F.; Naboni, E.; Lobaccaro, G. Tall buildings cluster form rationalization in a Nordic climate by factoring in indoor-outdoor comfort and energy. Energy Build. 2021, 238, 110831. [Google Scholar] [CrossRef]
- Martin, M.; Wong, N.H.; Ignatius, M.; Hii, D.J.C.; He, Y.; Yu, Z.; Deng, J.Y.; Srivatsan, V.R.; Nguyen, N.S. A physically-based model of interactions between a building and its outdoor conditions at the urban microscale. Energy Build. 2021, 237, 110788. [Google Scholar]
- Huang, J.; Hao, T.; Wang, Y.; Jones, P. A Street-Scale Simulation Model for the Cooling Performance of Urban Greenery: Evidence from a High-Density City. Sustain. Cities Soc. 2022, 82, 103908. [Google Scholar] [CrossRef]
- Mihalakakou, G.; Santamouris, M.; Tsangrassoulis, A. On the energy consumption in residential buildings. Energy Build. 2002, 34, 727–736. [Google Scholar] [CrossRef]
- Ruano, A.E.; Crispim, E.M.; Conceição, E.Z.E.; Lúcio, M.M.J.R. Prediction of building’s temperature using neural networks models. Energy Build. 2006, 38, 682–694. [Google Scholar] [CrossRef]
- Mirzaei, P.A.; Olsthoorn, D.; Torjan, M.; Haghighat, F. Urban neighborhood characteristics influence on a building indoor environment. Sustain. Cities Soc. 2015, 19, 403–413. [Google Scholar] [CrossRef]
- Neo, H.Y.R.; Wong, N.H.; Ignatius, M.; Yuan, C.; Xu, Y.; Cao, K. Spatial analysis of public residential housing’s electricity consumption in relation to urban landscape and building characteristics: A case study in Singapore. Energy Environ. 2023, 34, 233–254. [Google Scholar] [CrossRef]
- Chen, S.; Zhang, W.; Wong, N.H.; Ignatius, M. Combining CityGML files and data-driven models for microclimate simulations in a tropical city. Build Environ. 2020, 185, 107314. [Google Scholar] [CrossRef]
- Lam, J.C. Shading effects due to nearby buildings and energy implications. Energy Convers. Manag. 2000, 41, 647–659. [Google Scholar] [CrossRef]
- Strømann-Andersen, J.; Sattrup, P.A. The urban canyon and building energy use: Urban density versus daylight and passive solar gains. Energy Build. 2011, 43, 2011–2020. [Google Scholar] [CrossRef]
- Ichinose, T.; Lei, L.; Lin, Y. Impacts of shading effect from nearby buildings on heating and cooling energy consumption in hot summer and cold winter zone of China. Energy Build. 2017, 136, 199–210. [Google Scholar] [CrossRef]
- Chan, I.Y.S.; Liu, A.M.M. Effects of neighborhood building density, height, greenspace, and cleanliness on indoor environment and health of building occupants. Build Environ. 2018, 145, 213–222. [Google Scholar] [CrossRef] [PubMed]
- Liu, H.; Pan, Y.; Yang, Y.; Huang, Z. Evaluating the impact of shading from surrounding buildings on heating/cooling energy demands of different community forms. Build Environ. 2021, 206, 108322. [Google Scholar] [CrossRef]
- Shi, Y.; Yan, Z.; Li, C.; Li, C. Energy consumption and building layouts of public hospital buildings: A survey of 30 buildings in the cold region of China. Sustain. Cities Soc. 2021, 74, 103247. [Google Scholar] [CrossRef]
- Deng, Q.; Wang, G.; Wang, Y.; Zhou, H.; Ma, L. A quantitative analysis of the impact of residential cluster layout on building heating energy consumption in cold IIB regions of China. Energy Build. 2021, 253, 111515. [Google Scholar] [CrossRef]
- Yaghoobian, N.; Kleissl, J. Effect of reflective pavements on building energy use. Urban Clim. 2012, 2, 25–42. [Google Scholar] [CrossRef]
- Xu, X.; AzariJafari, H.; Gregory, J.; Norford, L.; Kirchain, R. An integrated model for quantifying the impacts of pavement albedo and urban morphology on building energy demand. Energy Build. 2020, 211, 108459. [Google Scholar] [CrossRef]
- Salvati, A.; Kolokotroni, M.; Kotopouleas, A.; Watkins, R.; Giridharan, R.; Nikolopoulou, M. Impact of reflective materials on urban canyon albedo, outdoor and indoor microclimates. Build Environ. 2022, 207, 108459. [Google Scholar] [CrossRef]
- Battista, G.; de Lieto Vollaro, E.; Ocłoń, P.; Vallati, A. Effect of mutual radiative exchange between the surfaces of a street canyon on the building thermal energy demand. Energy 2021, 226, 120346. [Google Scholar] [CrossRef]
- Pastore, L.; Corrao, R.; Heiselberg, P.K. The effects of vegetation on indoor thermal comfort: The application of a multi-scale simulation methodology on a residential neighborhood renovation case study. Energy Build. 2017, 146, 1–11. [Google Scholar] [CrossRef]
- Morakinyo, T.E.; Dahanayake, K.W.D.K.C.; Adegun, O.B.; Balogun, A.A. Modelling the effect of tree-shading on summer indoor and outdoor thermal condition of two similar buildings in a Nigerian university. Energy Build. 2016, 130, 721–732. [Google Scholar] [CrossRef]
- Berry, R.; Livesley, S.J.; Aye, L. Tree canopy shade impacts on solar irradiance received by building walls and their surface temperature. Build Environ. 2013, 69, 91–100. [Google Scholar] [CrossRef]
- Taleghani, M.; Marshall, A.; Fitton, R.; Swan, W. Renaturing a microclimate: The impact of greening a neighbourhood on indoor thermal comfort during a heatwave in Manchester, UK. Sol. Energy 2019, 182, 245–255. [Google Scholar] [CrossRef]
- Li, J.; Zheng, B.; Chen, X.; Qi, Z.; Bedra, K.B.; Zheng, J.; Li, Z.; Liu, L. Study on a full-year improvement of indoor thermal comfort by different vertical greening patterns. J. Build. Eng. 2021, 35, 101969. [Google Scholar] [CrossRef]
- Zhang, L.; Deng, Z.; Liang, L.; Zhang, Y.; Meng, Q.; Wang, J.; Santamouris, M. Thermal behavior of a vertical green facade and its impact on the indoor and outdoor thermal environment. Energy Build. 2019, 204, 109502. [Google Scholar] [CrossRef]
- Widiastuti, R.; Zaini, J.; Caesarendra, W. Field measurement on the model of green facade systems and its effect to building indoor thermal comfort. Measurement 2020, 166, 108212. [Google Scholar] [CrossRef]
- Hao, X.; Xing, Q.; Long, P.; Lin, Y.; Hu, J.; Tan, H. Influence of vertical greenery systems and green roofs on the indoor operative temperature of air-conditioned rooms. J. Build Eng. 2020, 31, 101373. [Google Scholar] [CrossRef]
- Hao, X.; Liu, L.; Tan, H.; Lin, Y.; Hu, J.; Yin, W. The Impacts of Greenery Systems on Indoor Thermal Environments in Transition Seasons: An Experimental Investigation. Buildings 2022, 12, 506. [Google Scholar] [CrossRef]
- Viecco, M.; Jorquera, H.; Sharma, A.; Bustamante, W.; Fernando, H.J.S.; Vera, S. Green roofs and green walls layouts for improved urban air quality by mitigating particulate matter. Build Environ. 2021, 204, 108120. [Google Scholar] [CrossRef]
- McPherson, E.G.; Herrington, L.P.; Heisler, G.M. Impacts of vegetation on residential heating and cooling. Energy Build. 1988, 12, 41–51. [Google Scholar] [CrossRef]
- Darvish, A.; Eghbali, G.; Eghbali, S.R. Tree-configuration and species effects on the indoor and outdoor thermal condition and energy performance of courtyard buildings. Urban Clim. 2021, 37, 100861. [Google Scholar] [CrossRef]
- Li, Z.; Chow, D.H.C.; Yao, J.; Zheng, X.; Zhao, W. The effectiveness of adding horizontal greening and vertical greening to courtyard areas of existing buildings in the hot summer cold winter region of China: A case study for Ningbo. Energy Build. 2019, 196, 227–239. [Google Scholar] [CrossRef]
- Akbari, H.; Kurn, D.M.; Bretz, S.E.; Hanford, J.W. Peak power and cooling energy savings of shade trees. Energy Build. 1997, 25, 139–148. [Google Scholar] [CrossRef]
- Donovan, G.H.; Butry, D.T. The value of shade: Estimating the effect of urban trees on summertime electricity use. Energy Build. 2009, 41, 662–668. [Google Scholar] [CrossRef]
- Synnefa, A.; Karlessi, T.; Gaitani, N.; Santamouris, M.; Assimakopoulos, D.N.; Papakatsikas, C. Experimental testing of cool colored thin layer asphalt and estimation of its potential to improve the urban microclimate. Build Environ. 2011, 46, 38–44. [Google Scholar] [CrossRef]
- Carnielo, E.; Zinzi, M. Optical and thermal characterisation of cool asphalts to mitigate urban temperatures and building cooling demand. Build Environ. 2013, 60, 56–65. [Google Scholar] [CrossRef]
- Aboelata, A. Reducing outdoor air temperature, improving thermal comfort, and saving buildings’ cooling energy demand in arid cities—Cool paving utilization. Sustain. Cities Soc. 2021, 68, 102762. [Google Scholar] [CrossRef]
- Kolokotsa, D.D.; Giannariakis, G.; Gobakis, K.; Giannarakis, G.; Synnefa, A.; Santamouris, M. Cool roofs and cool pavements application in Acharnes, Greece. Sustain. Cities Soc. 2018, 37, 466–474. [Google Scholar] [CrossRef]
- Li, H.; Harvey, J.; Kendall, A. Field measurement of albedo for different land cover materials and effects on thermal performance. Build Environ. 2013, 59, 536–546. [Google Scholar] [CrossRef]
- Wu, H.; Sun, B.; Li, Z.; Yu, J. Characterizing thermal behaviors of various pavement materials and their thermal impacts on ambient environment. J. Clean. Prod. 2018, 172, 1358–1367. [Google Scholar] [CrossRef]
- Qin, Y. Urban canyon albedo and its implication on the use of reflective cool pavements. Energy Build. 2015, 96, 86–94. [Google Scholar] [CrossRef]
- Yaghoobian, N.; Kleissl, J.; Krayenhoff, E.S. Modeling the Thermal Effects of Artificial Turf on the Urban Environment. J. Appl. Meteorol. Clim. 2010, 49, 332–345. [Google Scholar] [CrossRef]
- Falasca, S.; Ciancio, V.; Salata, F.; Golasi, I.; Rosso, F.; Curci, G. High albedo materials to counteract heat waves in cities: An assessment of meteorology, buildings energy needs and pedestrian thermal comfort. Build Environ. 2019, 163, 106242. [Google Scholar] [CrossRef]
- Shahidan, M.F.; Jones, P.J.; Gwilliam, J.; Salleh, E. An evaluation of outdoor and building environment cooling achieved through combination modification of trees with ground materials. Build Environ. 2012, 58, 245–257. [Google Scholar] [CrossRef]
- Syafii, N.I.; Ichinose, M.; Wong, N.H.; Kumakura, E.; Jusuf, S.K.; Chigusa, K. Experimental Study on the Influence of Urban Water Body on Thermal Environment at Outdoor Scale Model. Procedia Eng. 2016, 169, 191–198. [Google Scholar] [CrossRef]
- Tan, X.; Sun, X.; Huang, C.; Yuan, Y.; Hou, D. Comparison of cooling effect between green space and water body. Sustain. Cities Soc. 2021, 67, 102711. [Google Scholar] [CrossRef]
- Yang, L.; Liu, X.; Qian, F. Research on water thermal effect on surrounding environment in summer. Energy Build. 2020, 207, 109613. [Google Scholar] [CrossRef]
- Jin, H.; Shao, T.; Zhang, R. Effect of water body forms on microclimate of residential district. Energy Procedia 2017, 134, 256–265. [Google Scholar] [CrossRef]
- Xu, X.; Liu, S.; Sun, S.; Zhang, W.; Liu, Y.; Lao, Z.; Guo, G.; Smith, K.; Cui, Y.; Liu, W.; et al. Evaluation of energy saving potential of an urban green space and its water bodies. Energy Build. 2019, 188–189, 58–70. [Google Scholar] [CrossRef]
- Krüger, E.L.; Pearlmutter, D. The effect of urban evaporation on building energy demand in an arid environment. Energy Build. 2008, 40, 2090–2098. [Google Scholar] [CrossRef]
- Sun, R.; Chen, L. How can urban water bodies be designed for climate adaptation? Landsc. Urban Plan. 2012, 105, 27–33. [Google Scholar] [CrossRef]
- Evangelisti, L.; Guattari, C.; Asdrubali, F. On the sky temperature models and their influence on buildings energy performance: A critical review. Energy Build. 2019, 183, 607–625. [Google Scholar] [CrossRef]
- Wu, Y.; Zhao, H.; Sun, H.; Duan, M.; Lin, B.; Wu, S. A review of the application of radiative sky cooling in buildings: Challenges and optimization. Energy Convers. Manag. 2022, 265, 115768. [Google Scholar] [CrossRef]
- Nasrollahi, N.; Shokri, E. Daylight illuminance in urban environments for visual comfort and energy performance. Renew. Sustain. Energy Rev. 2016, 66, 861–874. [Google Scholar] [CrossRef]
- Antonanzas-Torres, F.; Urraca, R.; Polo, J.; Perpiñán-Lamigueiro, O.; Escobar, R. Clear sky solar irradiance models: A review of seventy models. Renew. Sustain. Energy Rev. 2019, 107, 374–387. [Google Scholar] [CrossRef]
- Wang, S.; Chen, B.; Suo, J.; Zhao, J.R. Impact of building morphology and outdoor environment on light and thermal environment in campus buildings in cold region during winter. Build Environ. 2021, 204, 108074. [Google Scholar] [CrossRef]
- de Rosa, A.; Ferraro, V.; Kaliakatsos, D.; Marinelli, V. Calculating indoor natural illuminance in overcast sky conditions. Appl. Energy 2010, 87, 806–813. [Google Scholar] [CrossRef]
- Asumadu-Sakyi, A.B.; Barnett, A.G.; Thai, P.; Jayaratne, E.R.; Miller, W.; Thompson, M.H.; Roghani, R.; Morawska, L. The relationship between indoor and outdoor temperature in warm and cool seasons in houses in Brisbane, Australia. Energy Build. 2019, 191, 127–142. [Google Scholar] [CrossRef]
- Wang, Y.; Wang, L.; Long, E.; Deng, S. An experimental study on the indoor thermal environment in prefabricated houses in the subtropics. Energy Build. 2016, 127, 529–539. [Google Scholar] [CrossRef]
- Lee, K.; Lee, D. The Relationship Between Indoor and Outdoor Temperature in Two Types Of Residence. Energy Procedia 2015, 78, 2851–2856. [Google Scholar] [CrossRef]
- Yan, H.; Yang, L.; Zheng, W.; Li, D. Influence of outdoor temperature on the indoor environment and thermal adaptation in Chinese residential buildings during the heating season. Energy Build. 2016, 116, 133–140. [Google Scholar] [CrossRef]
- Ang, B.W.; Wang, H.; Ma, X. Climatic influence on electricity consumption: The case of Singapore and Hong Kong. Energy 2017, 127, 534–543. [Google Scholar] [CrossRef]
- Fung, W.; Lam, K.; Hung, W.; Pang, S.; Lee, Y. Impact of urban temperature on energy consumption of Hong Kong. Energy 2006, 31, 2623–2637. [Google Scholar] [CrossRef]
- Wangpattarapong, K.; Maneewan, S.; Ketjoy, N.; Rakwichian, W. The impacts of climatic and economic factors on residential electricity consumption of Bangkok Metropolis. Energy Build. 2008, 40, 1419–1425. [Google Scholar] [CrossRef]
- Yecong, H.; Qi, D.; Xiaofeng, Z.; Huaican, L. Simulation of thermal and humid environment of rural residence envelope inner surface during the plum rains season in Changsha China. Energy Built Environ. 2023, 4, 195–205. [Google Scholar] [CrossRef]
- Moon, H.J.; Ryu, S.H.; Kim, J.T. The effect of moisture transportation on energy efficiency and IAQ in residential buildings. Energy Build. 2014, 75, 439–446. [Google Scholar] [CrossRef]
- Cho, W.; Iwamoto, S.; Kato, S. Condensation Risk Due to Variations in Airtightness and Thermal Insulation of an Office Building in Warm and Wet Climate. Energies 2016, 9, 875. [Google Scholar] [CrossRef]
- You, S.; Li, W.; Ye, T.; Hu, F.; Zheng, W. Study on moisture condensation on the interior surface of buildings in high humidity climate. Build. Environ. 2017, 125, 39–48. [Google Scholar] [CrossRef]
- Lee, H.-H.; Oh, H.-R.; Lim, J.-H.; Song, S.-Y. Evaluation of the Thermal Environment for Condensation and Mold Problem Diagnosis Around Built-in Furniture in Korean Apartment Buildings during Summer and Winter. Energy Procedia 2016, 96, 601–612. [Google Scholar] [CrossRef]
- Ahmed, T.; Kumar, P.; Mottet, L. Natural ventilation in warm climates: The challenges of thermal comfort, heatwave resilience and indoor air quality. Renew. Sustain. Energy Rev. 2021, 138, 110669. [Google Scholar] [CrossRef]
- Chen, J.; Brager, G.S.; Augenbroe, G.; Song, X. Impact of outdoor air quality on the natural ventilation usage of commercial buildings in the US. Appl. Energy 2019, 235, 673–684. [Google Scholar] [CrossRef]
- Dehghani-sanij, A.R.; Soltani, M.; Raahemifar, K. A new design of wind tower for passive ventilation in buildings to reduce energy consumption in windy regions. Renew. Sustain. Energy Rev. 2015, 42, 182–195. [Google Scholar] [CrossRef]
- Takebayashi, H. Effects of air temperature, humidity, and wind velocity distribution on indoor cooling load and outdoor human thermal environment at urban scale. Energy Build. 2022, 257, 111792. [Google Scholar] [CrossRef]
- Taylor, J.; Davies, M.; Mavrogianni, A.; Chalabi, Z.; Biddulph, P.; Oikonomou, E.; Das, P.; Jones, B. The relative importance of input weather data for indoor overheating risk assessment in dwellings. Build Environ. 2014, 76, 81–91. [Google Scholar] [CrossRef]
- Escandón, R.; Suárez, R.; Alonso, A.; Mauro, G.M. Is indoor overheating an upcoming risk in southern Spain social housing stocks? Predictive assessment under a climate change scenario. Build Environ. 2022, 207, 108482. [Google Scholar] [CrossRef]
- Nicol, F. The Limits of Thermal Comfort: Avoiding Overheating in European Buildings; Page Bros. (Norwich) Ltd.: Norwich, UK, 2013. [Google Scholar]
- Hamdy, M.; Carlucci, S.; Hoes, P.-J.; Hensen, J.L.M. The impact of climate change on the overheating risk in dwellings—A Dutch case study. Build Environ. 2017, 122, 307–323. [Google Scholar] [CrossRef]
- Stone, B.; Mallen, E.; Rajput, M.; Broadbent, A.; Krayenhoff, E.S.; Augenbroe, G.; Georgescu, M. Climate change and infrastructure risk: Indoor heat exposure during a concurrent heat wave and blackout event in Phoenix, Arizona. Urban Clim. 2021, 36, 109627. [Google Scholar] [CrossRef]
- Tootkaboni, M.P.; Ballarini, I.; Corrado, V. Analysing the future energy performance of residential buildings in the most populated Italian climatic zone: A study of climate change impacts. Energy Rep. 2021, 7, 8548–8560. [Google Scholar] [CrossRef]
- Din, A.; Brotas, L. Assessment of climate change on UK dwelling indoor comfort. Energy Procedia 2017, 122, 21–26. [Google Scholar] [CrossRef]
- Hosseini, M.; Javanroodi, K.; Nik, V.M. High-resolution impact assessment of climate change on building energy performance considering extreme weather events and microclimate—Investigating variations in indoor thermal comfort and degree-days. Sustain. Cities Soc. 2022, 78, 103634. [Google Scholar] [CrossRef]
- Wang, H.; Chen, Q. Impact of climate change heating and cooling energy use in buildings in the United States. Energy Build. 2014, 82, 428–436. [Google Scholar] [CrossRef]
- Chan, A.L.S. Developing future hourly weather files for studying the impact of climate change on building energy performance in Hong Kong. Energy Build. 2011, 43, 2860–2868. [Google Scholar] [CrossRef]
- Frank, T. Climate change impacts on building heating and cooling energy demand in Switzerland. Energy Build. 2005, 37, 1175–1185. [Google Scholar] [CrossRef]
- Lam, T.N.T.; Wan, K.K.W.; Wong, S.L.; Lam, J.C. Impact of climate change on commercial sector air conditioning energy consumption in subtropical Hong Kong. Appl. Energy 2010, 87, 2321–2327. [Google Scholar] [CrossRef]
- Wan, K.K.W.; Li, D.H.W.; Pan, W.; Lam, J.C. Impact of climate change on building energy use in different climate zones and mitigation and adaptation implications. Appl. Energy 2012, 97, 274–282. [Google Scholar] [CrossRef]
- Calama-González, C.M.; Suárez, R.; León-Rodríguez, Á.L. Mitigation of climate change in Mediterranean existing social dwellings through numerical optimization of building stock models. Energy Build. 2022, 266, 112109. [Google Scholar] [CrossRef]
- Liu, S.; Kwok, Y.-T.; Lau, K.; Ng, E. Applicability of different extreme weather datasets for assessing indoor overheating risks of residential buildings in a subtropical high-density city. Build Environ. 2021, 194, 107711. [Google Scholar] [CrossRef]
- Ji, L.; Laouadi, A.; Shu, C.; Gaur, A.; Lacasse, M.; Wang, L. Evaluating approaches of selecting extreme hot years for assessing building overheating conditions during heatwaves. Energy Build. 2022, 254, 111610. [Google Scholar] [CrossRef]
- Rijal, H.B. Thermal adaptation of buildings and people for energy saving in extreme cold climate of Nepal. Energy Build. 2021, 230, 110551. [Google Scholar] [CrossRef]
- Huang, L.; Hamza, N.; Lan, B.; Zahi, D. Climate-responsive design of traditional dwellings in the cold-arid regions of Tibet and a field investigation of indoor environments in winter. Energy Build. 2016, 128, 697–712. [Google Scholar] [CrossRef]
- Arens, E.; Hoyt, T.; Zhou, X.; Huang, L.; Zhang, H.; Schiavon, S. Modeling the comfort effects of short-wave solar radiation indoors. Build Environ. 2015, 88, 3–9. [Google Scholar] [CrossRef]
- Marino, C.; Nucara, A.; Pietrafesa, M. Thermal comfort in indoor environment: Effect of the solar radiation on the radiant temperature asymmetry. Sol. Energy 2017, 144, 295–309. [Google Scholar] [CrossRef]
- Song, B.; Bai, L.; Yang, L. Analysis of the long-term effects of solar radiation on the indoor thermal comfort in office buildings. Energy 2022, 247, 123499. [Google Scholar] [CrossRef]
- MeshkinKiya, M.; Paolini, R. Uncertainty of solar radiation in urban canyons propagates to indoor thermo-visual comfort. Sol. Energy 2021, 221, 545–558. [Google Scholar] [CrossRef]
- Xu, H.; Guinot, B.; Cao, J.; Li, Y.; Niu, X.; Ho, K.F.; Shen, Z.; Liu, S.; Zhang, T.; Lei, Y.; et al. Source, health risk and composition impact of outdoor very fine particles (VFPs) to school indoor environment in Xi’an, Northwestern China. Sci. Total Environ. 2018, 612, 238–246. [Google Scholar] [CrossRef]
- Ji, W.; Zhao, B. Contribution of outdoor-originating particles, indoor-emitted particles and indoor secondary organic aerosol (SOA) to residential indoor PM2.5 concentration: A model-based estimation. Build Environ. 2015, 90, 196–205. [Google Scholar] [CrossRef]
- Dai, X.; Liu, J.; Li, X.; Zhao, L. Long-term monitoring of indoor CO2 and PM2.5 in Chinese homes: Concentrations and their relationships with outdoor environments. Build Environ. 2018, 144, 238–247. [Google Scholar] [CrossRef]
- Liu, C.; Miao, X.; Li, J. Outdoor formaldehyde matters and substantially impacts indoor formaldehyde concentrations. Build Environ. 2019, 158, 145–150. [Google Scholar] [CrossRef]
- Eom, J.; Hyun, M.; Lee, J.; Lee, H. Increase in household energy consumption due to ambient air pollution. Nat. Energy 2020, 5, 976–984. [Google Scholar] [CrossRef]
- He, P.; Liang, J.; Qiu, Y.; Li, Q.; Xing, B. Increase in domestic electricity consumption from particulate air pollution. Nat. Energy 2020, 5, 985–995. [Google Scholar] [CrossRef]
- Zhong, X.; Wu, W.; Ridley, I.A. Assessing the energy and indoor-PM2.5-exposure impacts of control strategies for residential energy recovery ventilators. J. Build Eng. 2020, 29, 101137. [Google Scholar] [CrossRef]
- Standard, 62.2; ANSI/ASHRAE. Ventilation and Indoor Air Quality in Residential Buildings. ASHRAE: Atlanta, GA, USA, 2010.
Disclaimer/Publisher’s Note: The statements, opinions and data contained in all publications are solely those of the individual author(s) and contributor(s) and not of MDPI and/or the editor(s). MDPI and/or the editor(s) disclaim responsibility for any injury to people or property resulting from any ideas, methods, instructions or products referred to in the content. |
© 2023 by the authors. Licensee MDPI, Basel, Switzerland. This article is an open access article distributed under the terms and conditions of the Creative Commons Attribution (CC BY) license (https://creativecommons.org/licenses/by/4.0/).