Abstract
The public areas of airports are often bustling, raising the risk of infectious diseases spreading through fomites. We recorded 21.3 h of video at three airports, focusing on nine common areas (e.g., boarding and check-in areas) where people touch surfaces. We analyzed 25,925 touches to create a model for how microbes spread from surfaces to humans through touch. The airport mask-wearing rate is high (96.1% in non-restaurant areas), but it is lower (22%) in restaurants. Passengers touch their mucous membranes more often (10.3 times/hour) in restaurants compared to other areas (1.6 times/hour on average). Wearing a mask can significantly reduce the risk of obtaining a virus through direct contact with hands and mucous membranes. If everyone in non-restaurant areas wore masks, the viral intake fraction could be reduced by up to 97.4% compared to not wearing masks. People touch public surfaces the most in self-service check-in areas, at a rate of 473.5 times per hour. Disinfecting public surfaces or hands twice per hour could reduce the viral intake fraction in each area by 27.7% or 15.4%, respectively. The findings of this study provide valuable data support and a scientific foundation for implementing interventions aimed at mitigating fomite transmission within airport settings.
1. Introduction
Fomites comprise both porous and non-porous surfaces or objects that are susceptible to contamination by pathogenic microorganisms, serving as potential vehicles for transmission [1]. A wealth of research underscores the pivotal role of fomites in propagating respiratory and gastrointestinal diseases [2,3,4,5,6].
The transfer of viruses from contaminated surfaces to clean hands, followed by the potential cross-contamination of seven additional pristine surfaces by virus-laden hands, can contribute to the widespread contamination of indoor environments [7]. For instance, a study conducted in aircraft cabins revealed that viruses can contaminate nearly all accessible surfaces within a short span of 6 h [8]. In office environments, if a door handle is contaminated, it could result in over 300 surfaces being infected in just a mere two hours [9]. Touching mucous membranes plays a pivotal role in determining the exposure risk through fomite transmission. When both contaminated hands and fomites are present, viruses can easily enter mucous membranes.
Airports serve as crucial hubs connecting different cities and countries, characterized by crowded environments and extensive interpersonal interactions. Viruses can persist on surfaces within airport environments, potentially exposing passengers to infection during their stay. Assessing the infection risk in various areas of the airport becomes paramount when dealing with significant outbreaks, as it allows for the development of effective preventive and control measures tailored to different risk levels. However, the comprehensive cleaning of all environmental surfaces can impose a heavy burden on airport cleaning personnel. Therefore, focusing on “critical” environmental surfaces at airports can help reduce operational costs [10].
When assessing the risks of indoor infectious disease transmission through fomites, mathematical [11,12] and conceptual models [13] are often employed to forecast exposure risks. However, current research presents two primary limitations. Firstly, these studies frequently overlook the impact of human touch behaviors, leading to inaccuracies in simulating fomite transmission. Secondly, investigations tend to focus solely on hand hygiene and surface disinfection, with minimal consideration for interventions that address human behaviors to mitigate parasite transmission. Hence, there is an imminent need to integrate surface transmission models that encompass real human behaviors, offering a more precise comprehension of individual exposure risks and the effectiveness of intervention measures.
This study involved gathering real touch data from airports, establishing a surface touch database and constructing a Markov chain-based fomite transmission model. We conducted quantitative analyses of passengers’ infection risks in different airport areas and assessed the effectiveness of interventions such as mask-wearing, handwashing, and surface disinfection. This model is applicable to all viruses transmitted through surfaces [14].
2. Methods
2.1. Data Collection
2.1.1. Video Recording and Analysis
Six participants were employed to collect videos, capturing passenger surface touching behavior in nine designated areas (manual check-in area, self-service check-in area, escalator, restaurant, charging area, shopping area, waiting area, boarding area, and baggage claim area) across two airports in the north and one airport in the south. The 9 areas are represented in Figure 1. By handholding or employing tripods to support mobile devices such as smartphones and a Gopro, we ensured that these devices were positioned at the same ground level as the experimenter’s eyes. We selected areas with a higher concentration of passengers for recording, such as waiting areas near boarding areas where flights were scheduled to depart. When capturing passenger touch behavior, we typically used side angles to minimize obstructions that might obscure the passengers’ hand movements. We recorded a total of approximately 21 h of video footage. A team of six trained video analysts systematically analyzed each second, recording every visible touch within the designated areas. A 64-bit Pot Player multimedia player (https://potplayer.daum.net/ accessed on 23 September 2021) was utilized to view the videos, allowing for pausing and the analysis of every second. During the analysis of personnel behavior data, we assigned a numerical ID to each passenger to distinguish them, with our analysis focusing primarily on passenger touch behavior data. After completing the analysis of passenger touch behavior data in various airport areas, we took measures to delete all videos to ensure that the video content remained confidential. Additionally, video analysts signed confidentiality agreements regarding the content of their video analyses. It is noteworthy that our research has received approval from the Ethics Committee of Beijing University of Technology (No: CJXB03). The resulting data were then accurately recorded in a table (samples shown in Table S1). To ensure quality control, the author randomly verified 0.1% of the data, achieving an accuracy rate of 98.9%. The detailed records include time, individual’s ID (each analyzed passenger has an independent numerical ID), gender (male or female), the specific surface touched by their hand (whether left or right), the owner of the surface (categorized into four groups: surfaces belonging to the passenger who touched it, people accompanying the passenger, strangers, or public surfaces), and the mask status of the passenger (whether they were wearing a mask or not). The personal information of passengers, including their names, ages, and contact details such as phone numbers and emails, was not collected. As the type of mask (e.g., N95 respirator, surgical mask) does not impact exposure risk via fomite transmission, we chose not to collect this information. Instead, we recorded whether passengers were wearing masks or not, allowing us to determine the mask-wearing rate, defined as the proportion of time passengers wore masks during their stay.
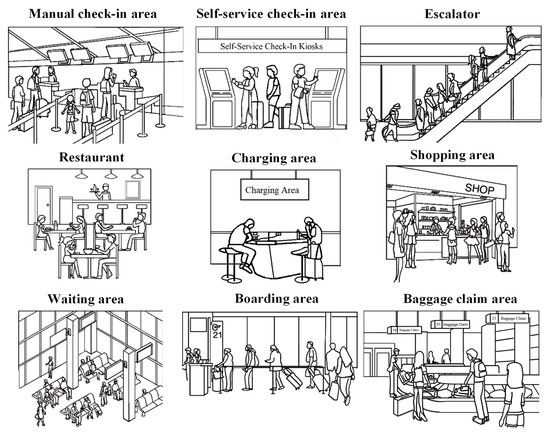
Figure 1.
Nine areas of the airport.
Through video analysis, we classified a total of 108 surfaces into 5 primary categories across 9 areas. The 5 primary categories include mucosa (mouth, nose, eyes), hands, body (encompassing the trunk, arms, legs, as well as the face and neck), private surfaces (such as mobile phones and backpacks), and public surfaces (such as check-in counters and restaurant tables). Table S2 offers detailed information concerning fomite transmission, including the virus transfer rate between surfaces and hands [15], as well as surface area. The number of primary surfaces in each area is recorded in Table S3.
The surface touch was defined as any contact lasting for one second or longer between the hand and a solid surface [16]. The average surface contact frequency was calculated as the ratio of the surface contact times and the total time all passengers spent in that area. Personal touch frequency refers to the ratio of a passenger’s surface touch times to the duration of their stay in the area.
2.1.2. Online Survey
From 31 March 2022 to 21 April 2022, we administered a survey on the personal behaviors of passengers on China’s largest online survey platform (https://www.wjx.cn accessed on 31 March 2022). The survey consisted of 11 questions related to this study, including the total duration of time spent in airports, the length of time spent in each area of the airport (with 0 indicating no stay), the number of people accompanying the respondent on their trip, and the method of check-in (manual or self-service). If any of the following conditions were met, the questionnaire was considered invalid.
One respondent could only submit the questionnaire once. As per the stated requirements, a total of 1536 valid questionnaires were collected online. The comprehensive questionnaire is provided in Part I in Supplementary Materials.
2.1.3. Flight Information
We collected a total of 383 non-stop flight details, including flight departure time, arrival time, and aircraft model for a certain workday in April 2022 at a northern airport in China, via one of the leading online ticketing platforms in China, Ctrip Travel (https://flights.ctrip.com/online/channel/domestic accessed on 12 April 2022). Assuming that all cabins were fully occupied and using the known aircraft models, we estimated that there were a total of 67,050 passengers at the airport on that day. While surface touch behaviors were collected at three airports, we focused on analyzing the exposure risk and effectiveness of non-pharmaceutical interventions (NPIs) solely at the airport for which we had flight information.
Based on the personnel flight information, we were able to determine the departure time of the passenger’s flight. From the questionnaire, we could determine the duration of time a passenger stayed at the airport, which eventually enabled us to ascertain the time of their arrival at the airport. For instance, if a passenger’s flight departed at 10:00 and they spent 2.5 h at the airport, it could be inferred that their arrival time at the airport was 7:30.
2.2. Fomite Transmission Model
In this study, we only considered the exposure risk through fomite transmission route. In the initial parameter setting, the following assumptions were made:
(1) After conducting a sensitivity analysis of the initial number of infected passengers among airport travelers (Figure S1), we assumed that the proportion of initially infected passengers was 1/1000. This suggests that out of the 67,050 passengers, 67 individuals were infected with the virus. These infected passengers were identified based on an interval system, where all passengers were assigned an ID number from 1 to 67,050 according to the order in which they entered the airport. The index patients were selected based on their ID numbers, which followed a pattern of 1, 1001, 2001, and so on up to 67,001.
(2) At the start of the simulation, 1 unit of virus was initially placed on each of the index patients’ left and right hands. Upon each contact with their mucosa, 1 unit of virus was transferred and evenly spread throughout their hands.
(3) Not all areas of an object can be touched by hands (for instance, the back of a table is seldom touched). Therefore, this study defines the valid contact area as the area that was frequently touched [16]. It is assumed that all viruses on the valid contact area were uniformly distributed.
(4) Once susceptible individuals touch their mucosa, the viruses on their hands enter it at a certain transfer rate. However, the viruses on the mucosa do not transfer onto their hands.
(5) The transfer rate of viruses between hands and surfaces, which refer to the proportion of pathogens transmitted from hands/surfaces to surfaces/hands after hand–surface contact [15], can be influenced by various factors, including pressure and humidity, among others [17]. Since we had insufficient data, we assumed a constant transfer rate between hands and a specific surface in this simulation (Table S2).
(6) The disinfection frequency refers to the number of disinfection procedures conducted per hour [18]. In this study, we set the surface disinfection frequencies at 0.2, 0.5, 1, and 2 times per hour, with a disinfection efficiency of 99.99% [19,20,21]. Surface virus load was cleared to zero at the designated time.
(7) When a person wearing a mask touches their own nose and mouth, it is considered as touching the outer surface of the mask.
The fomite transmission of the virus can be expressed by the following equation [14]:
In this equation, the variables and represent the hand and the surface; and are the viral loads on the hand and surface at time , while represents the specific surface that was touched by the hand at that time; indicates the total number of surfaces that were touched by hands at time ; represents the valid contact area between the hand and surface; and are the total areas of the surface and hand, respectively; and are the virus transfer rates from the surface/hand to hand/surface, respectively; and represent the inactivation rates (min−1) of the virus on the surface and hands, respectively.
To simulate the behavior of passengers touching surfaces in a specific area of an airport, we utilized the following discrete-time Markov chain to model the sequence of surface touches made by airport passengers:
where represents the surface touched at time , and refer to the respective surfaces, and represents the conditional probability. For instance, in the case where represents a phone and represents a backpack, stands for the probability of a person touching the backpack after touching the phone.
The flow chart of the fomite transmission model is shown in Figure 2.
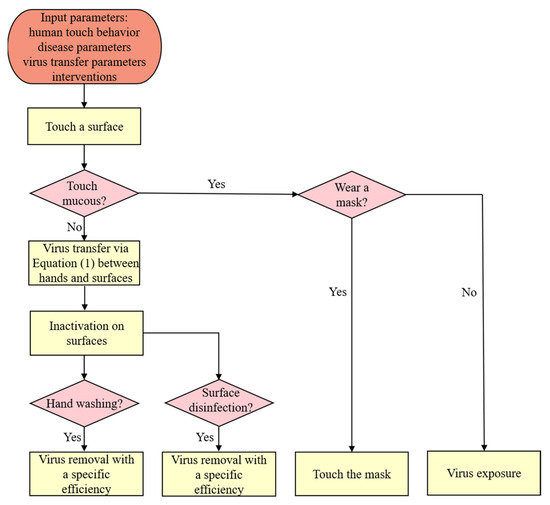
Figure 2.
Fomite transmission model flowchart.
Viral load refers to the quantity of active viruses present in the mucosa. In the case of a passenger who has been exposed to a virus, their personal exposed virus load refers to the amount of the virus that has been absorbed by their mucous membranes. To evaluate the risk of exposure, we utilized a metric known as the viral intake fraction, which is calculated as the ratio of the viral load on the mucosa of each susceptible person to the total amount of virus generated by the index patients. The personal exposed viral intake fraction is defined as the ratio of personal exposed virus load to the total amount of virus produced by the index patients. Meanwhile, the virus fraction is defined as the ratio of the viral load on each surface to the total amount of virus produced by the index patients.
3. Results
3.1. Video and Questionnaire Results
A total of 21.3 h of video footage was recorded, and over 240,000 pieces of data on human touch behaviors were collected (samples are shown in Table S1), concerning 1760 passengers in nine different areas (Table 1). A total of 25,925 touch events (an example of which is shown in Table S4) were recorded across nine areas.

Table 1.
Surface touch data volume.
The mask-wearing rate was 96.1% (95% CI 87.9–99.9%) in all areas except for restaurants, where it was only 22.0% due to meal consumption (Table 2). The probability of passenger stay in various airport areas was 80.5% (95% CI 48.1–99.9%), and the mean duration of stay was 18.0 min (95% CI 0.25–60 min). The boarding area had the highest passenger stay probability, which was 100%, as passengers checked in and boarded there. Conversely, the manual check-in area had the lowest probability, which was 46.9%, due to the availability of self-service check-in. Finally, the waiting area, manual check-in area, and charging area had the longest average stay durations of 28.5 min, 22.9 min, and 22.2 min, respectively.

Table 2.
Personnel wearing masks and staying status.
3.2. Surface Touching Behavior
The highest mucosal touch frequency (10.3 times/hour) was observed among passengers in restaurants, followed by charging areas (4.6 times/hour) and waiting areas (1.9 times/hour) (Table 3). Self-service check-in areas recorded the highest touch frequency on public surfaces (473.5 times/hour) due to passengers repeatedly touching the screen of the machine to retrieve their flight tickets (Table 3). Passengers in self-service check-in areas also exhibited the highest personal touch frequency (1315.5 times/hour), followed by those in boarding areas (615.8 times/hour), as these areas require a quick ticket pickup or check-in process (Table 3). Additionally, Figure S2 portrays the probability of duration per touch for passengers in different airport areas. Waiting areas, baggage claim areas, and boarding areas have the longest average duration per touch (36.2 s, 95% CI 1–274.0 s; 30.3 s, 95% CI 1–182.5 s; and 23.2 s, 95% CI 1–77.0 s, respectively) (Figure S2). Passengers waiting for their flights typically use their cell phones to pass the time, leading to longer durations per touch. Approximately 40.8% of touches last for no more than 3 s, with less than 0.5% lasting longer than 5 min (Figure S2). Gender differences were observed in surface touching behavior in the baggage claim area, with female passengers touching surfaces 165.9 times more frequently than male passengers per hour (Table 3). The waiting, baggage claim, and boarding areas had the highest personal touch rates, with rates of 99.3%, 98.8%, and 97.3%, respectively (Table 3).

Table 3.
Passenger touch behavior.
The Markov touch probability matrix of the entire airport is presented in Figure 3, which comprises 9 areas and a total of 108 surfaces (matrices in different areas can be viewed in Figure S3). It is evident from the matrix that passengers have a substantial likelihood of touching the same surface consecutively, as indicated by the light blue diagonal grids. Furthermore, passengers tend to touch their mobile phone surface (surface 11) after contacting a specific surface.
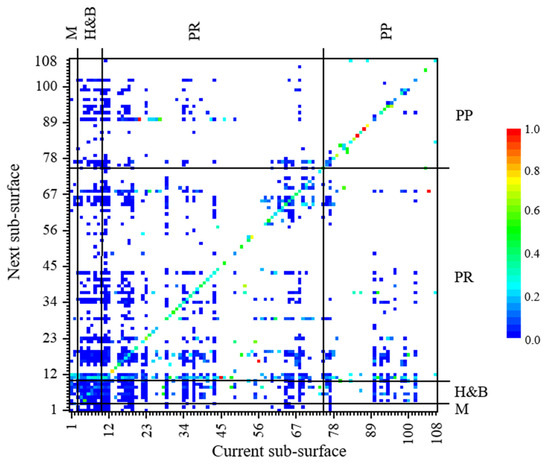
Figure 3.
The Markov touch probability matrix for 9 areas of the airport. (Surface ID 1 to 108 could be referred to in Table S2. In the picture, M—mucosa, H&B—hand and body, PR—private surface, PP—public surface. White grid shows the value of to 0).
In various areas of the airport, passengers touched their body surfaces at an average rate of 112.4 times per hour, with an average of 59.8% of passengers engaging in such contact (Figure 4a,b). On personal surfaces, the surface of mobile phones emerged as the most frequently touched surface in the majority of areas. It boasted an average touch frequency of 173.1 times per hour, and approximately 67.4% of passengers chose to interact with their mobile phone surfaces. When it comes to public surfaces, the machine screens in the self-service check-in area were touched at a rate of 371.7 times per hour (95% CI 73.9–974.7 times per hour), and this surface attracted the engagement of 82.0% of passengers. Similarly, the touch frequency of escalator handrails was measured at 214.6 times per hour (95% CI 76.0–600.0 times per hour), with 36.9% of passengers opting to interact with this surface.
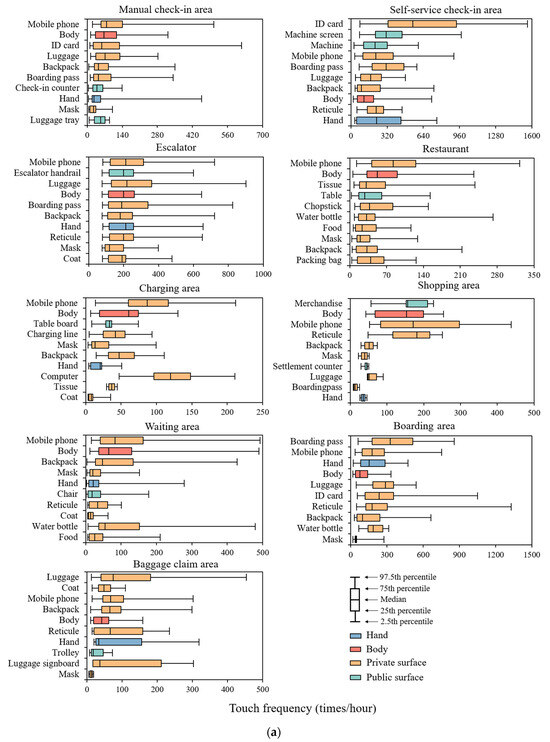
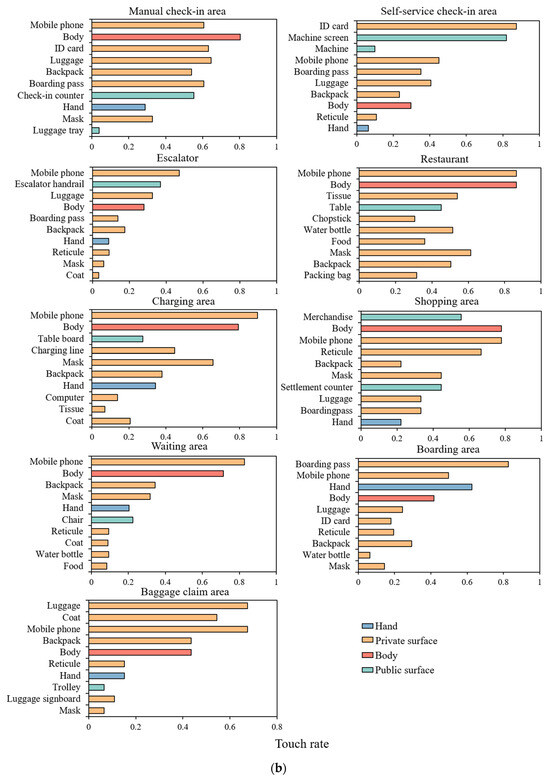
Figure 4.
(a) Personal touch frequency distribution of the top 10 highly touched surfaces in different areas. (Touch frequency is calculated only considering passengers who touched the surface). (b) Touch rate of the top 10 highly touched surfaces in different areas. (Touch rate is the percentage of passengers who touched the surface to the total number of passengers in the area.)
3.3. Exposure Risk
As shown in Table 4, among the 9233 data recorded in the baggage claim areas, no instances were observed of individuals touching their mucous membranes. Consequently, the viral intake fraction for all passengers in this area was considered to be 0. On the other hand, it was found that in escalators, exposure risks (viral load) for passengers who were exposed were greater than in other areas, but only 0.01% of passengers were exposed. The percentage of exposed passengers was highest in restaurants (95%), followed by waiting areas (25.3%) and shopping areas (22.9%). The distribution of the personal virus intake fraction by location is presented in Figure S4.

Table 4.
Viral intake fraction, viral load, and proportion of exposed passengers in each area.
Taking norovirus as an example, during the peak infection period, the number of virus particles in each gram of feces can exceed 1011. It is estimated that an infection can occur with as few as 10 to 100 norovirus particles [22,23]. Assuming a patient has 0.1 g of virus particles on their hands after using the restroom [24], and susceptible individuals only need to be exposed to 100 virus particles to become infected, the infection threshold for the virus intake fraction is approximately 10−8 (Figure 5). This means that in the restaurant area, there might be approximately 3.8% of passengers infected, and in the charging area, there might be approximately 0.3% of infections.
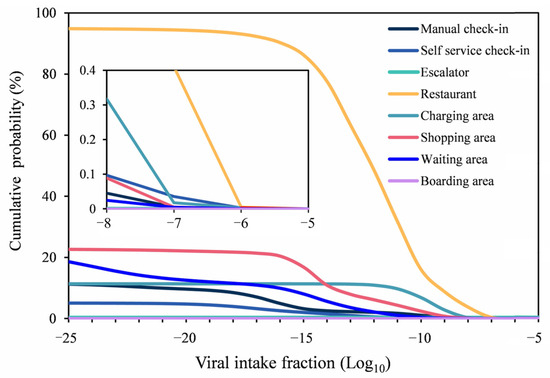
Figure 5.
The cumulative probability of viral intake fraction in different areas. (For the proportion of people with a viral fraction greater than a certain viral intake fraction, such as a viral fraction of 1 × 10⁻¹⁰, the corresponding proportion in the restaurant area is 16.1%, which means that 16.1% of the people staying in the restaurant have a viral fraction of 1 × 10⁻¹⁰ or above.)
Table 5 presents the average virus fraction on hands, bodies, private surfaces, and public surfaces across various areas. Interestingly, public surfaces in certain areas (excluding the self-service check-in area) were found to have a higher virus fraction than that on human bodies and private surfaces. In escalators, the virus fraction on hands was greater than that of human bodies and private surfaces, potentially because commuters rarely came into contact with other surfaces after being exposed to viruses on public surfaces, such as escalator handrails during their brief rides.

Table 5.
Virus fraction on human body, private surface, and public surface in different areas a.
3.4. Interventions
It is worth noting that, except for the restaurant, if all passengers wore masks in other areas, the virus intake fraction could be reduced by 97.4% (Figure 6). In restaurants where passengers cannot wear masks during their meals, when 20% of passengers wore masks in restaurants, the virus intake fraction decreased by 32.0% in comparison to no mask-wearing. The virus exposure rate for different mask-wearing rates in nine areas is presented in Table S5.
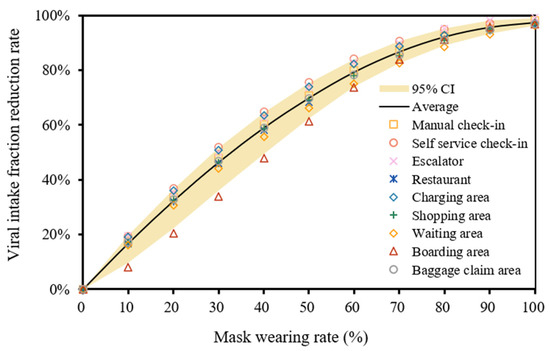
Figure 6.
Intake fraction reduction rate by mask wearing rate.
Figure 7 illustrates how disinfection frequency influences individual virus intake fraction reduction. Targeting the most frequently touched surfaces in each area, the optimal disinfection efficacy is achieved with a frequency of twice per hour. Under this regimen, there was a reduction in passenger intake fraction by 5.8% (95%CI 0.0–18.1%). By disinfecting the surfaces with the highest viral scores on both body and personal surfaces, a disinfection frequency of two times per hour led to a decrease in passenger intake fraction by 1.7% (95%CI 0.0–6.9%). However, adopting the practice of replacing masks every half hour resulted in a minimal reduction of only 0.9% (SD, 0.1%) in passenger intake fraction. Conducting disinfection on public surfaces or performing handwashing twice per hour led to reductions in the virus intake fraction of 27.7% (95%CI 3.1–65.2%) and 15.4% (95%CI 0.9–38.5%), respectively, in each area. Based on the simulation results, we found that in areas such as escalators, restaurants, charging areas, shopping areas, and boarding areas, the disinfection of public surfaces proved more effective than handwashing when the disinfection frequency was lower than twice per hour. Conversely, in the self-service check-in areas, handwashing surpassed public surface disinfection in effectiveness.
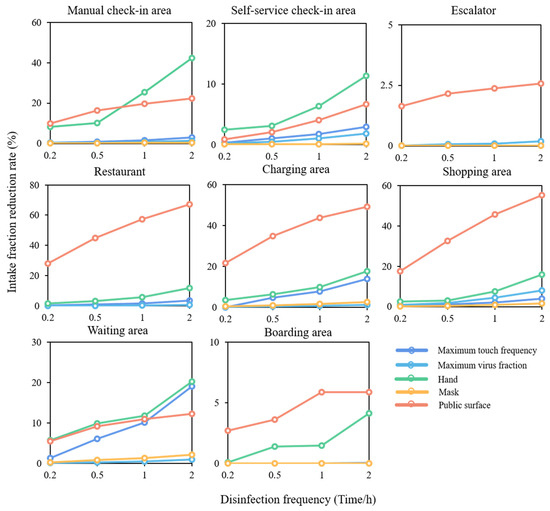
Figure 7.
Personal virus exposure reduction by disinfection frequency.
4. Discussion
This study focused on airport settings and examined human touching behaviors, personal preferences in airports, and mask wearing in nine different airport areas. By establishing a surface transmission model that incorporates these factors, the study analyzed the exposure risk and effectiveness of interventions in each area.
Mucous membrane touch behavior directly determined the risk of surface infection, but it was influenced by factors such as occupation and indoor environment. In our study, passengers exhibited a mucous membrane touch frequency of 10.3 times per hour in airport restaurants, whereas in non-dining areas of the airport, the mucous membrane touch frequency was 1.6 times per hour. When compared to other studies on mucous membrane contact frequencies, such as those conducted in classroom environments with students, they were observed to have a mucous membrane contact rate of approximately 10.1 times per hour, with 36.3%, 31.1%, 26.7%, and 6.0% of contacts involving the mouth, nose, eyes, and combinations of these areas, respectively [25], and in office settings, research indicated that graduate students had an average mucous membrane contact rate of 35.0 times per hour (eyes: 2.8 times/hour; nose: 14.9 times/hour; mouth: 17.1 times/hour) [16]. Furthermore, customers and staff dining in restaurants had an average mucous membrane touch frequency of 40.0 times and 7.0 times per hour, respectively [14]. Therefore, our study found that passengers at the airport demonstrated relatively lower mucous membrane contact frequencies. This observation could be related to passengers wearing masks. Studies during the COVID-19 pandemic showed that wearing masks can reduce the frequency of touching mucous membranes. For example, Chen et al. compared tourism marketing videos on “Youtube” before and during the pandemic and found that wearing masks reduced the frequency of people touching their mucous membranes [26]. Shiraly et al. observed the number of times people in public places touched their faces and mucous membranes and concluded that non-mask wearers were more likely to touch mucous membrane areas than mask wearers [27]. This indicates that wearing masks can not only effectively block airborne and large droplet transmission [28] but can also significantly reduce the frequency of mucous membrane contact.
In hospitals, 20% to 40% of healthcare-associated infections involve cross-contamination through the hands of medical staff, who can become contaminated from direct contact with patients or indirect contact with environmental surfaces [29]. High-touch surfaces in medical settings, such as doorknobs, medical equipment, etc., are potential sources of infection [30,31]. During the COVID-19 pandemic, da Silva et al. sampled high-touch surfaces in public transport areas, including counters, seats, etc., and found a positivity rate of 55.9% [32]. By observing the touch behaviors of passengers in different areas of the airport, we identified several high-touch surfaces, including counters for manual check-in and seats in waiting areas. The significance of these high-touch surfaces in the transmission of pathogens cannot be overlooked, as they can become reservoirs for viruses and bacteria. Therefore, the thorough cleaning and disinfection of high-touch surfaces, along with the promotion of personal hygiene awareness, are crucial measures to reduce the risk of infection.
Maintaining hand hygiene and regularly cleaning environmental surfaces are closely associated with reducing viral infections. In a community that highly emphasizes reinforcing hand hygiene, the incidence of gastrointestinal and respiratory diseases significantly decreased by 31% and 21%, respectively [33]. Moreover, research on the impact of environmental cleaning on the risk of virus transmission through fomites indicated that a single cleaning activity can reduce the average risk of viral infection by 6.98% to 17.06% [34]. In our simulation of disinfecting public surfaces in different areas of the airport, we conducted frequent disinfection of all public surfaces, a practice that may prove challenging to implement in real-world public transport settings. Currently, researchers are focusing on antimicrobial surfaces to reduce the risk of pathogen transmission. The application of antimicrobial surfaces can rapidly deactivate certain bacteria or viruses, thereby lowering the risk of passenger exposure to contaminants in public areas [35,36,37,38].
However, this study has several limitations. Firstly, our primary focus was on the transmission of the virus through hand-to-surface contact, and we did not consider the deposition of the virus from exhaled air or speech-generated droplets onto surfaces. This scenario could lead to a reduction in the viral load on surfaces, thereby lowering the risk of passenger-to-passenger transmission via contaminated surfaces. Secondly, the collection of passenger touch behavior data took place during the COVID-19 pandemic. Due to strict national regulations during this period, passengers were mandated to wear masks in public spaces [39]. Wearing masks reduced the likelihood of passengers coming into contact with mucous membranes, consequently lowering the risk of infection through fomite transmission. Finally, due to the lack of absolute data on the quantity of viruses transferred from mucous membranes to hands, our study relied on virus intake fractions, providing relative estimates associated with exposure risk rather than specific infection risk calculations.
In the future, we can employ Computational Fluid Dynamics (CFD) simulations to more precisely estimate the virus deposition on surfaces resulting from passengers’ talking and breathing. By integrating these data with our contamination spread model, we can accurately determine the viral load on public surfaces and assess the risk of infection to individuals. Additionally, we can conduct experiments by applying a known quantity of MS2 or ϕX174 bacteriophages to simulate passenger touch behaviors in different airport areas [40]. Subsequently, we can measure the bacteriophage levels on surfaces in various airport areas to validate our simulations of surface viral loads. This approach will provide a more accurate foundation for developing preventive and control strategies for contamination spread within airports.
5. Conclusions
This article conducted an analysis of passengers’ touch behaviors in different areas of the airport, utilizing real human touch behaviors as input parameters to establish a fomite transmission model. The objective was to assess the relative infection risks across various airport areas and the effectiveness of intervention measures. Passengers exhibited the highest frequency of mucous membrane contact in the restaurant area, with an average of 10.3 occurrences per hour. Additionally, passengers most frequently touched public surfaces in self-service check-in areas, shops, and escalators, with frequencies of 473.5, 156.4, and 68.8 occurrences per hour, respectively. Using norovirus as an example, high-risk areas were identified, notably the restaurant and charging areas, with infection rates of 3.8% and 0.3% among passengers in these respective areas. Requiring 100% mask-wearing in non-restaurant areas can reduce passengers’ virus intake fraction through surface transmission by 97.4%. Furthermore, disinfecting public surfaces or hands twice an hour can reduce the virus intake fraction by 27.7% or 15.4% in each respective area. This research can assist airports in developing precise cleaning and disinfection plans for frequently touched public surfaces, particularly in high-risk regions. This will contribute to reducing the risk of pathogen transmission and ensuring a safer and more hygienic airport environment.
Supplementary Materials
The following supporting information can be downloaded at: https://www.mdpi.com/article/10.3390/buildings13102582/s1, Table S1: Passenger behavior data; Table S2: Surface information: Introduce the surface area, transfer rate from surface to hands/surface to surface, surface material, and virus inactivation rate of the surface; Table S3: The number of surfaces of different categories in different area; Table S4: Passenger touch behavior; Table S5: Virus exposure rate (10−5 unit virus/person/second) in 9 areas under different mask wearing rates; Figure S1: The impact of the proportion of initial infected individuals on (a) virus load, (b)virus intake fraction; Figure S2: Probability distribution of duration per contact; Figure S3: Markov probability matrix of surface touch; Figure S4: Personal exposed virus intake fraction by area. Part I: Questionnaire on epidemic prevention and control behavior of airport personnel. References [41,42,43,44,45,46,47,48,49,50,51] are cited in the supplementary materials.
Author Contributions
Conceptualization, N.Z.; methodology, L.Z. (Linan Zhuang) and N.Z.; software, N.Z.; validation, L.Z. (Linan Zhuang) and N.Z.; formal analysis, L.Z. (Linan Zhuang); investigation, L.Z. (Linan Zhuang), Y.D., L.Z. (Linlin Zhou), R.L., J.D., R.W., W.H. and S.S.; resources, N.Z.; data curation, L.Z. (Linan Zhuang) and N.Z.; writing—original draft preparation, L.Z. (Linan Zhuang); writing—review and editing, L.Z. (Linan Zhuang) and N.Z.; visualization, L.Z. (Linan Zhuang) and N.Z.; supervision, N.Z. and H.Q.; project administration, N.Z. and H.Q.; funding acquisition, N.Z. All authors have read and agreed to the published version of the manuscript.
Funding
This work was supported by the National Natural Science Foundation of China (grant numbers: 52108067).
Institutional Review Board Statement
This experiment was authorized by the Ethics Committee of Beijing University of Technology (No. CJXB03).
Data Availability Statement
The original details of the data presented in this study are available upon request from the corresponding author.
Conflicts of Interest
The authors declare that they have no known competing financial interest or personal relationships that could have appeared to influence the work reported in this paper.
References
- Reynolds, K.A.; Watt, P.M.; Boone, S.A.; Gerba, C.P. Occurrence of bacteria and biochemical biomarkers on public surfaces. Int. J. Environ. Health Res. 2005, 15, 225–234. [Google Scholar] [CrossRef] [PubMed]
- Boone, S.A.; Gerba, C.P. Significance of fomites in the spread of respiratory and enteric viral disease. Appl. Environ. Microbiol. 2007, 73, 1687–1696. [Google Scholar] [CrossRef] [PubMed]
- Stephens, B.; Azimi, P.; Thoemmes, M.S.; Heidarinejad, M.; Allen, J.G.; Gilbert, J.A. Microbial exchange via fomites and implications for human health. Curr. Pollut. Rep. 2019, 5, 198–213. [Google Scholar] [CrossRef] [PubMed]
- Siegel, J.D.; Rhinehart, E.; Jackson, M.; Chiarello, L. 2007 guideline for isolation precautions: Preventing transmission of infectious agents in health care settings. Am. J. Infect. Control 2007, 35, S65–S164. [Google Scholar]
- Repp, K.K.; Keene, W.E. A point-source norovirus outbreak caused by exposure to fomites. J. Infect. Dis. 2012, 205, 1639–1641. [Google Scholar] [CrossRef]
- Gunn, H.M. Role of fomites and flies in the transmission of bovine viral diarrhoea virus. Vet. Rec. 1993, 132, 584–585. [Google Scholar] [CrossRef] [PubMed]
- Barker, J.; Vipond, I.B.; Bloomfield, S.F. Effects of cleaning and disinfection in reducing the spread of Norovirus contamination via environmental surfaces. J. Hosp. Infect. 2004, 58, 42–49. [Google Scholar] [CrossRef] [PubMed]
- Lei, H.; Li, Y.; Xiao, S.; Yang, X.; Lin, C.; Norris, S.L.; Wei, D.; Hu, Z.; Ji, S. Logistic growth of a surface contamination network and its role in disease spread. Sci. Rep. 2017, 7, 14826. [Google Scholar] [CrossRef]
- Zhang, N.; Li, Y.; Huang, H. Surface touch and its network growth in a graduate student office. Indoor Air 2018, 28, 963–972. [Google Scholar] [CrossRef]
- Xiao, S.; Jones, R.M.; Zhao, P.; Li, Y. The dynamic fomite transmission of Methicillin-resistant Staphylococcus aureus in hospitals and the possible improved intervention methods. Build. Environ. 2019, 161, 106246. [Google Scholar] [CrossRef]
- Lei, H.; Xiao, S.; Cowling, B.J.; Li, Y. Hand hygiene and surface cleaning should be paired for prevention of fomite transmission. Indoor Air 2020, 30, 49–59. [Google Scholar] [CrossRef]
- King, M.F.; Wilson, A.M.; López-García, M.; Proctor, J.; Peckham, D.G.; Clifton, I.J.; Dancer, S.J.; Noakes, C.J. Why is mock care not a good proxy for predicting hand contamination during patient care? J. Hosp. Infect. 2021, 109, 44–51. [Google Scholar] [CrossRef] [PubMed]
- Sobolik, J.S.; Newman, K.L.; Jaykus, L.A.; Bihn, E.A.; Leon, J.S. Norovirus transmission mitigation strategies during simulated produce harvest and packing. Int. J. Food Microbiol. 2021, 357, 109365. [Google Scholar] [CrossRef] [PubMed]
- Jin, T.; Chen, X.; Nishio, M.; Zhuang, L.; Shiomi, H.; Tonosaki, Y.; Yokohata, R.; King, M.F.; Kang, M.; Fujii, K.; et al. Interventions to prevent surface transmission of an infectious virus based on real human touch behavior: A case study of the norovirus. Int. J. Infect. Dis. 2022, 122, 83–92. [Google Scholar] [CrossRef] [PubMed]
- Anderson, C.E.; Boehm, A.B. Transfer rate of enveloped and nonenveloped viruses between fingerpads and surfaces. Appl. Environ. Microbiol. 2021, 87, e01215–e01221. [Google Scholar] [CrossRef] [PubMed]
- Zhang, N.; Wang, P.; Miao, T.; Chan, P.; Jia, W.; Zhao, P.; Su, B.; Chen, X.; Li, Y. Real human surface touch behavior based quantitative analysis on infection spread via fomite route in an office. Build. Environ. 2021, 191, 107578. [Google Scholar] [CrossRef]
- Zhao, P.; Chan, P.; Gao, Y.; Lai, H.; Zhang, T.; Li, Y. Physical factors that affect microbial transfer during surface touch. Build. Environ. 2019, 158, 28–38. [Google Scholar] [CrossRef]
- Lei, H.; Jones, R.M.; Li, Y. Exploring surface cleaning strategies in hospital to prevent contact transmission of methicillin-resistant Staphylococcus aureus. BMC Infect. Dis. 2017, 17, 85. [Google Scholar] [CrossRef]
- Pickering, A.J.; Boehm, A.B.; Mwanjali, M.; Davis, J. Efficacy of waterless hand hygiene compared with handwashing with soap: A field study in Dar es Salaam, Tanzania. Am. J. Trop. Med. Hyg. 2010, 82, 270. [Google Scholar] [CrossRef]
- Chiu, S.; Skura, B.; Petric, M.; McIntyre, L.; Gamage, B.; Isaac-Renton, J. Efficacy of common disinfectant/cleaning agents in inactivating murine norovirus and feline calicivirus as surrogate viruses for human norovirus. Am. J. Infect. Control 2015, 43, 1208–1212. [Google Scholar] [CrossRef]
- Wilson, A.M.; Reynolds, K.A.; Jaykus, L.A.; Escudero-Abarca, B.; Gerba, C.P. Comparison of estimated norovirus infection risk reductions for a single fomite contact scenario with residual and nonresidual hand sanitizers. Am. J. Infect. Control 2020, 48, 538–544. [Google Scholar] [CrossRef] [PubMed]
- Abad, F.X.; Villena, C.; Guix, S.; Caballero, S.; Pintó, R.M.; Bosch, A. Potential role of fomites in the vehicular transmission of human astroviruses. Appl. Environ. Microbiol. 2001, 67, 3904–3907. [Google Scholar] [CrossRef] [PubMed]
- Vipond, I.B. The role of viruses in gastrointestinal disease in the home. J. Infect. 2001, 43, 38–41. [Google Scholar] [CrossRef] [PubMed]
- Gibson, L.L.; Rose, J.B.; Haas, C.N.; Gerba, C.P.; Rusin, P.A. Quantitative assessment of risk reduction from hand washing with antibacterial soaps. J. Appl. Microbiol. 2002, 92, 136S–143S. [Google Scholar] [CrossRef]
- Kwok, Y.L.A.; Gralton, J.; McLaws, M.L. Face touching: A frequent habit that has implications for hand hygiene. Am. J. Infect. Control 2015, 43, 112–114. [Google Scholar] [CrossRef]
- Chen, Y.J.; Qin, G.; Chen, J.; Xu, J.L.; Feng, D.Y.; Wu, X.Y.; Li, X. Comparison of face-touching behaviors before and during the coronavirus disease 2019 pandemic. JAMA Netw. Open 2020, 3, e2016924. [Google Scholar] [CrossRef]
- Shiraly, R.; Shayan, Z.; McLaws, M.L. Face touching in the time of COVID-19 in Shiraz, Iran. Am. J. Infect. Control 2020, 48, 1559–1561. [Google Scholar] [CrossRef]
- Miao, D.; Zhang, N. Human close contact behavior-based interventions for COVID-19 transmission. Buildings 2022, 12, 365. [Google Scholar] [CrossRef]
- Weber, D.J.; Rutala, W.A.; Miller, M.B.; Huslage, K.; Sickbert-Bennett, E. Role of hospital surfaces in the transmission of emerging health care-associated pathogens: Norovirus, Clostridium difficile, and Acinetobacter species. Am. J. Infect. Control 2010, 38, S25–S33. [Google Scholar] [CrossRef]
- Cobrado, L.; Silva-Dias, A.; Azevedo, M.M.; Rodrigues, A.G. High-touch surfaces: Microbial neighbours at hand. Eur. J. Clin. Microbiol. Infect. Dis. 2017, 36, 2053–2062. [Google Scholar] [CrossRef]
- Weber, D.J.; Anderson, D.; Rutala, W.A. The role of the surface environment in healthcare-associated infections. Curr. Opin. Infect. Dis. 2013, 26, 338–344. [Google Scholar] [CrossRef] [PubMed]
- Da Silva, S.J.R.; do Nascimento, J.C.F.; dos Santos Reis, W.P.M.; da Silva, C.T.A.; da Silva, P.G.; Mendes, R.P.G.; Mendonca, A.A.; Santos, B.N.R.; de Magalhaes, J.J.F.; Kohl, A.; et al. Widespread contamination of SARS-CoV-2 on highly touched surfaces in Brazil during the second wave of the COVID-19 pandemic. Environ. Microbiol. 2021, 23, 7382–7395. [Google Scholar] [CrossRef] [PubMed]
- Aiello, A.E.; Coulborn, R.M.; Perez, V.; Larson, E.L. Effect of hand hygiene on infectious disease risk in the community setting: A meta-analysis. Am. J. Public Health 2008, 98, 1372–1381. [Google Scholar] [CrossRef] [PubMed]
- Wilson, A.M.; Reynolds, K.A.; Canales, R.A. Estimating the effect of hand hygiene compliance and surface cleaning timing on infection risk reductions with a mathematical modeling approach. Am. J. Infect. Control 2019, 47, 1453–1459. [Google Scholar] [CrossRef]
- Hasan, J.; Crawford, R.J.; Ivanova, E.P. Antibacterial surfaces: The quest for a new generation of biomaterials. Trends Biotechnol. 2013, 31, 295–304. [Google Scholar] [CrossRef]
- Wang, Y.; Wang, F.; Zhang, H.; Yu, B.; Cong, H.; Shen, Y. Antibacterial material surfaces/interfaces for biomedical applications. Appl. Mater. Today 2021, 25, 101192. [Google Scholar] [CrossRef]
- Navaratnam, S.; Nguyen, K.; Selvaranjan, K.; Zhang, G.; Mendis, P.; Aye, L. Designing post COVID-19 buildings: Approaches for achieving healthy buildings. Buildings 2022, 12, 74. [Google Scholar] [CrossRef]
- Kırgız, M.S.; Mirza, J.; Cuc, S.; Prodan, D.; Saroşi, C.; Perhaiţă, I.; Carpa, R.; Moldovan, M.; Popa, D.; Varvara, S.; et al. Physico-Antibacterial Feature and SEM Morphology of Bio-Hydraulic Lime Mortars Incorporating Nano-Graphene Oxide and Binary Combination of Nano-Graphene Oxide with Nano Silver, Fly Ash, Zinc, and Titanium Powders. Buildings 2023, 13, 172. [Google Scholar] [CrossRef]
- Chen, H.; Shi, L.; Zhang, Y.; Wang, X.; Jiao, J.; Yang, M.; Sun, G. Response to the COVID-19 pandemic: Comparison of strategies in six countries. Front. Public Health 2021, 9, 708496. [Google Scholar] [CrossRef]
- Julian, T.R.; Leckie, J.O.; Boehm, A.B. Virus transfer between fingerpads and fomites. J. Appl. Microbiol. 2010, 109, 1868–1874. [Google Scholar] [CrossRef]
- Bloomfield, S.F.; Aiello, A.E.; Cookson, B.; O’Boyle, C.; Larson, E.L. The effectiveness of hand hygiene procedures in reducing the risks of infections in home and community settings including handwashing and alcohol-based hand sanitizers. Am. J. Infect. Control 2007, 35, S27–S64. [Google Scholar] [CrossRef]
- Cannon, J.L.; Papafragkou, E.; Park, G.W.; Osborne, J.; Jaykus, L.A.; Vinjé, J. Surrogates for the study of norovirus stability and inactivation in the environment: A comparison of murine norovirus and feline calicivirus. J. Food Prot. 2006, 69, 2761–2765. [Google Scholar] [CrossRef] [PubMed]
- Centers for Disease Control and Prevention (CDC). Norovirus Worldwide. Available online: https://www.cdc.gov/norovirus/worldwide.html (accessed on 31 October 2021).
- Fujimura, K.E.; Demoor, T.; Rauch, M.; Faruqi, A.A.; Jang, S.; Johnson, C.C.; Boushey, H.A.; Zoratti, E.; Ownby, D.; Lukacs, N.W.; et al. House dust exposure mediates gut microbiome Lactobacillus enrichment and airway immune defense against allergens and virus infection. Proc. Natl. Acad. Sci. USA 2014, 111, 805–810. [Google Scholar] [CrossRef]
- Kanamori, H.; Weber, D.J.; Rutala, W.A. The role of the healthcare surface environment in SARS-CoV-2 transmission and potential control measures. Clin. Infect. Dis. 2020, 28, ciaa1467. [Google Scholar]
- Lopez, G.U. Transfer of Microorganisms from Fomites to Hands and Risk Assessment of Contaminated and Disinfected Surfaces; The University of Arizona: Tucson, AZ, USA, 2013. [Google Scholar]
- Lopez, G.U.; Kitajima, M.; Havas, A.; Gerba, C.P.; Reynolds, K.A. Evaluation of a disinfectant wipe intervention on fomite-to-finger microbial transfer. Appl. Environ. Microbiol. 2014, 80, 3113–3118. [Google Scholar] [CrossRef]
- Meadow, J.F.; Altrichter, A.E.; Kembel, S.W.; Moriyama, M.; O’Connor, T.K.; Womack, A.M.; Brown, G.Z.; Green, J.L.; Bohannan, B.J. Bacterial communities on classroom surfaces vary with human contact. Microbiome 2014, 2, 7. [Google Scholar] [CrossRef]
- Mokhtari, A.; Jaykus, L.A. Quantitative exposure model for the transmission of norovirus in retail food preparation. Int. J. Food Microbiol. 2009, 133, 38–47. [Google Scholar] [CrossRef]
- Rheinbaben, F.V.; Schünemann, S.; Gross, T.; Wolff, M.H. Transmission of viruses via contact in ahousehold setting: Experiments using bacteriophage φX174 as a model virus. J. Hosp. Infect. 2000, 46, 61–66. [Google Scholar] [CrossRef]
- Zhou, S.; Zhou, S.; Zheng, Z.; Lu, J.; Song, T. Risk assessment for precise intervention of COVID-19 epidemic based on available big data and spatio-temporal simulation method: Empirical evidence from different public places in Guangzhou. China. Appl. Geogr. 2020, 143, 102702. [Google Scholar] [CrossRef]
Disclaimer/Publisher’s Note: The statements, opinions and data contained in all publications are solely those of the individual author(s) and contributor(s) and not of MDPI and/or the editor(s). MDPI and/or the editor(s) disclaim responsibility for any injury to people or property resulting from any ideas, methods, instructions or products referred to in the content. |
© 2023 by the authors. Licensee MDPI, Basel, Switzerland. This article is an open access article distributed under the terms and conditions of the Creative Commons Attribution (CC BY) license (https://creativecommons.org/licenses/by/4.0/).