
Research on the Modulus Decay Model under a Three-Dimensional Stress State of Asphalt Mixture during Fatigue Damage


 ,
, 
Abstract
:1. Introduction
1.1. Background
1.2. Objective
- (1)
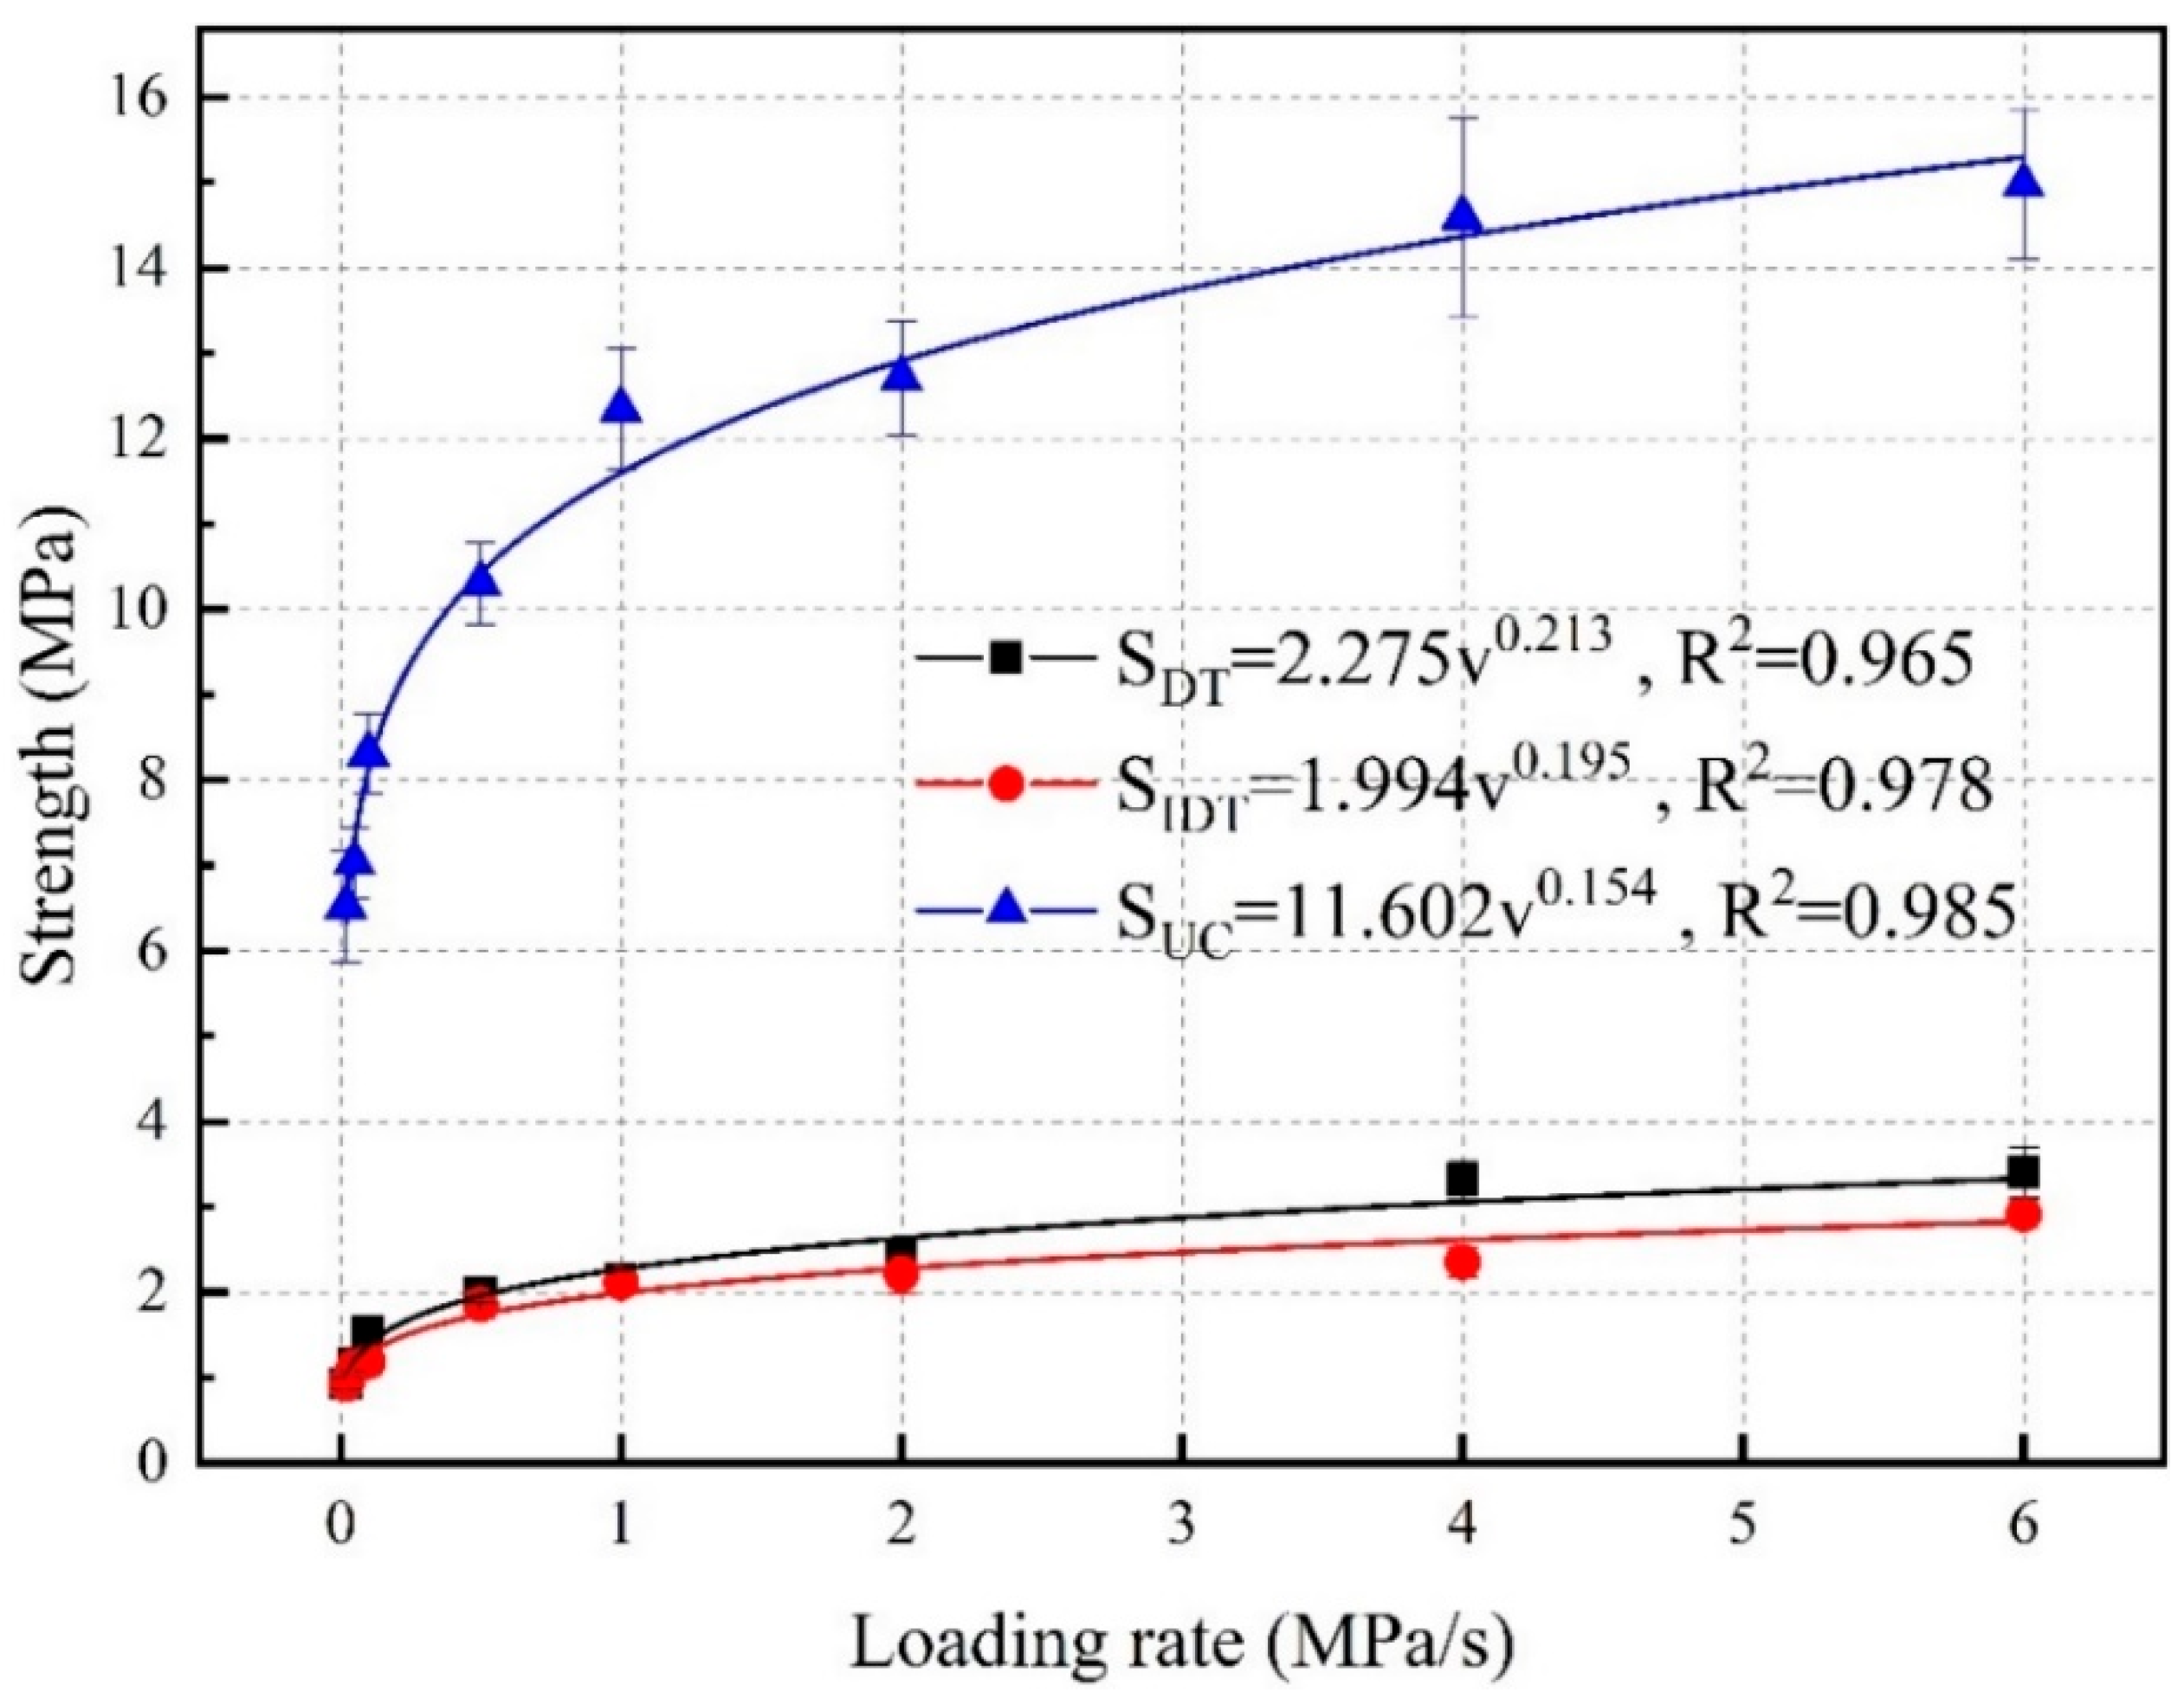
- The relationship between the asphalt mixtures’ strength and loading rate was established.
- (2)
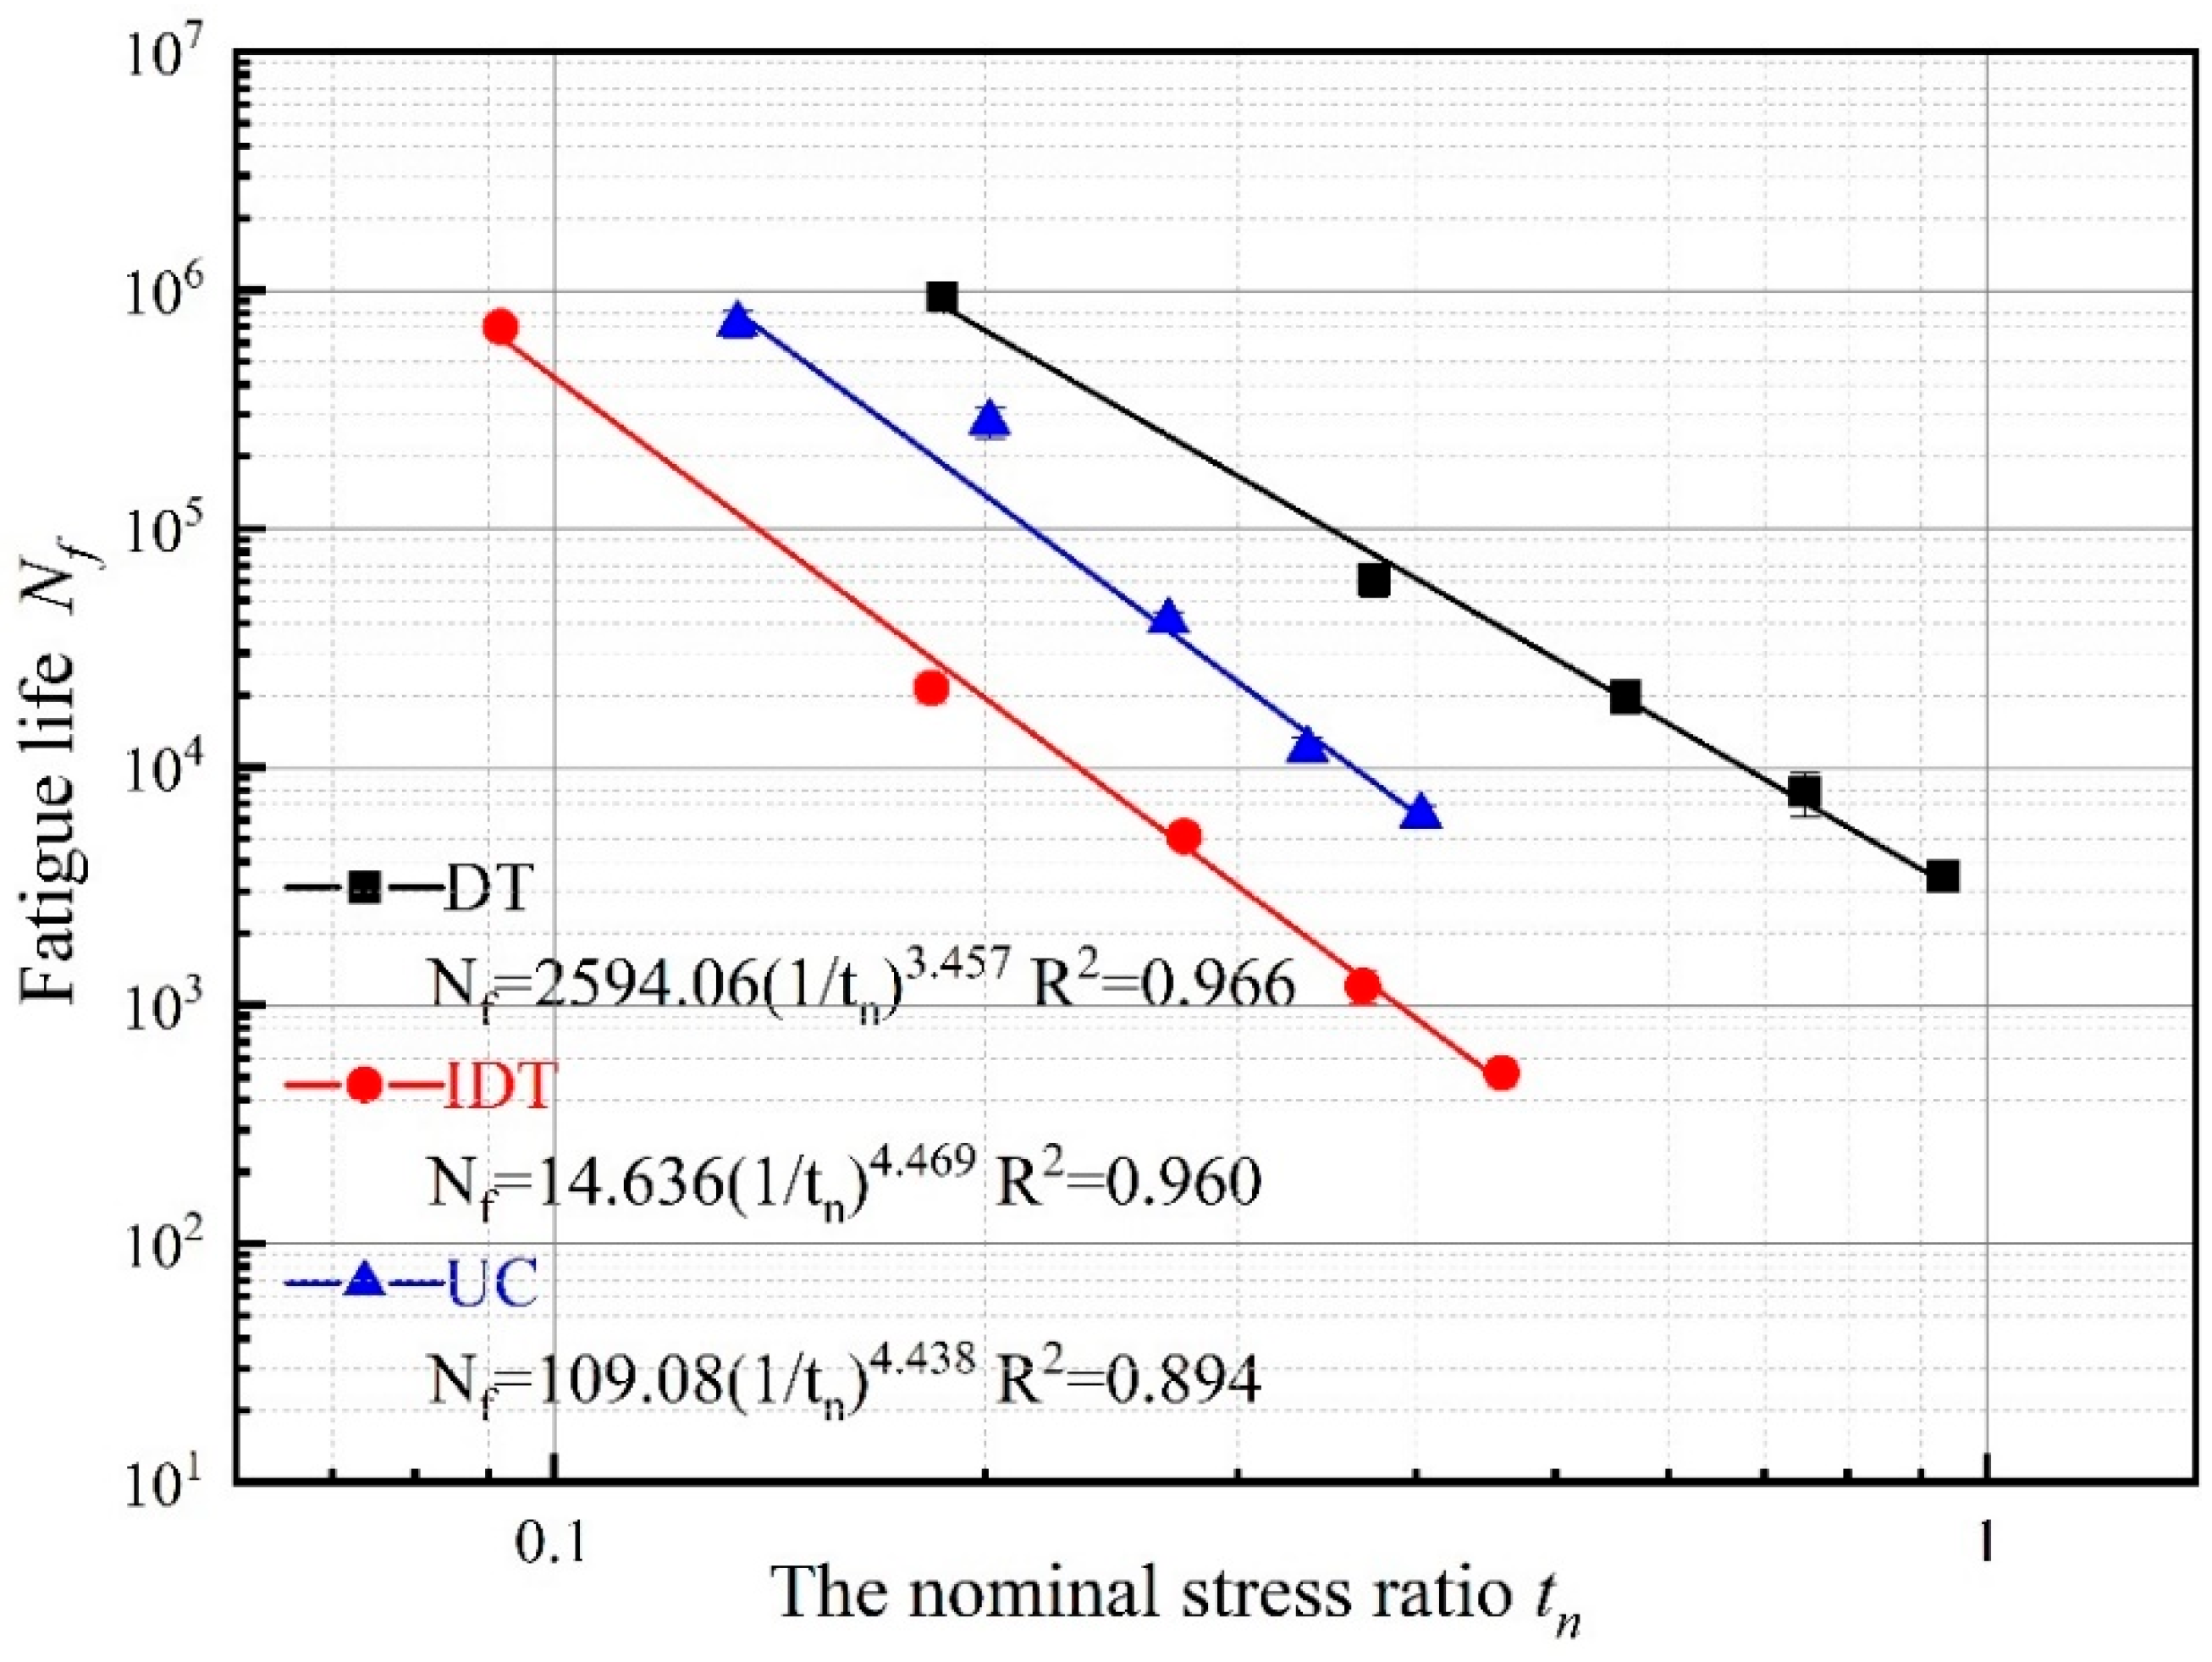
- The conventional S-N fatigue equations for asphalt mixtures under the DT, IDT, and UC modes were obtained and analyzed. Additionally, the normalized fatigue equation for asphalt mixtures under the various modes was established based on the fatigue stress strength ratio Δ.
- (3)
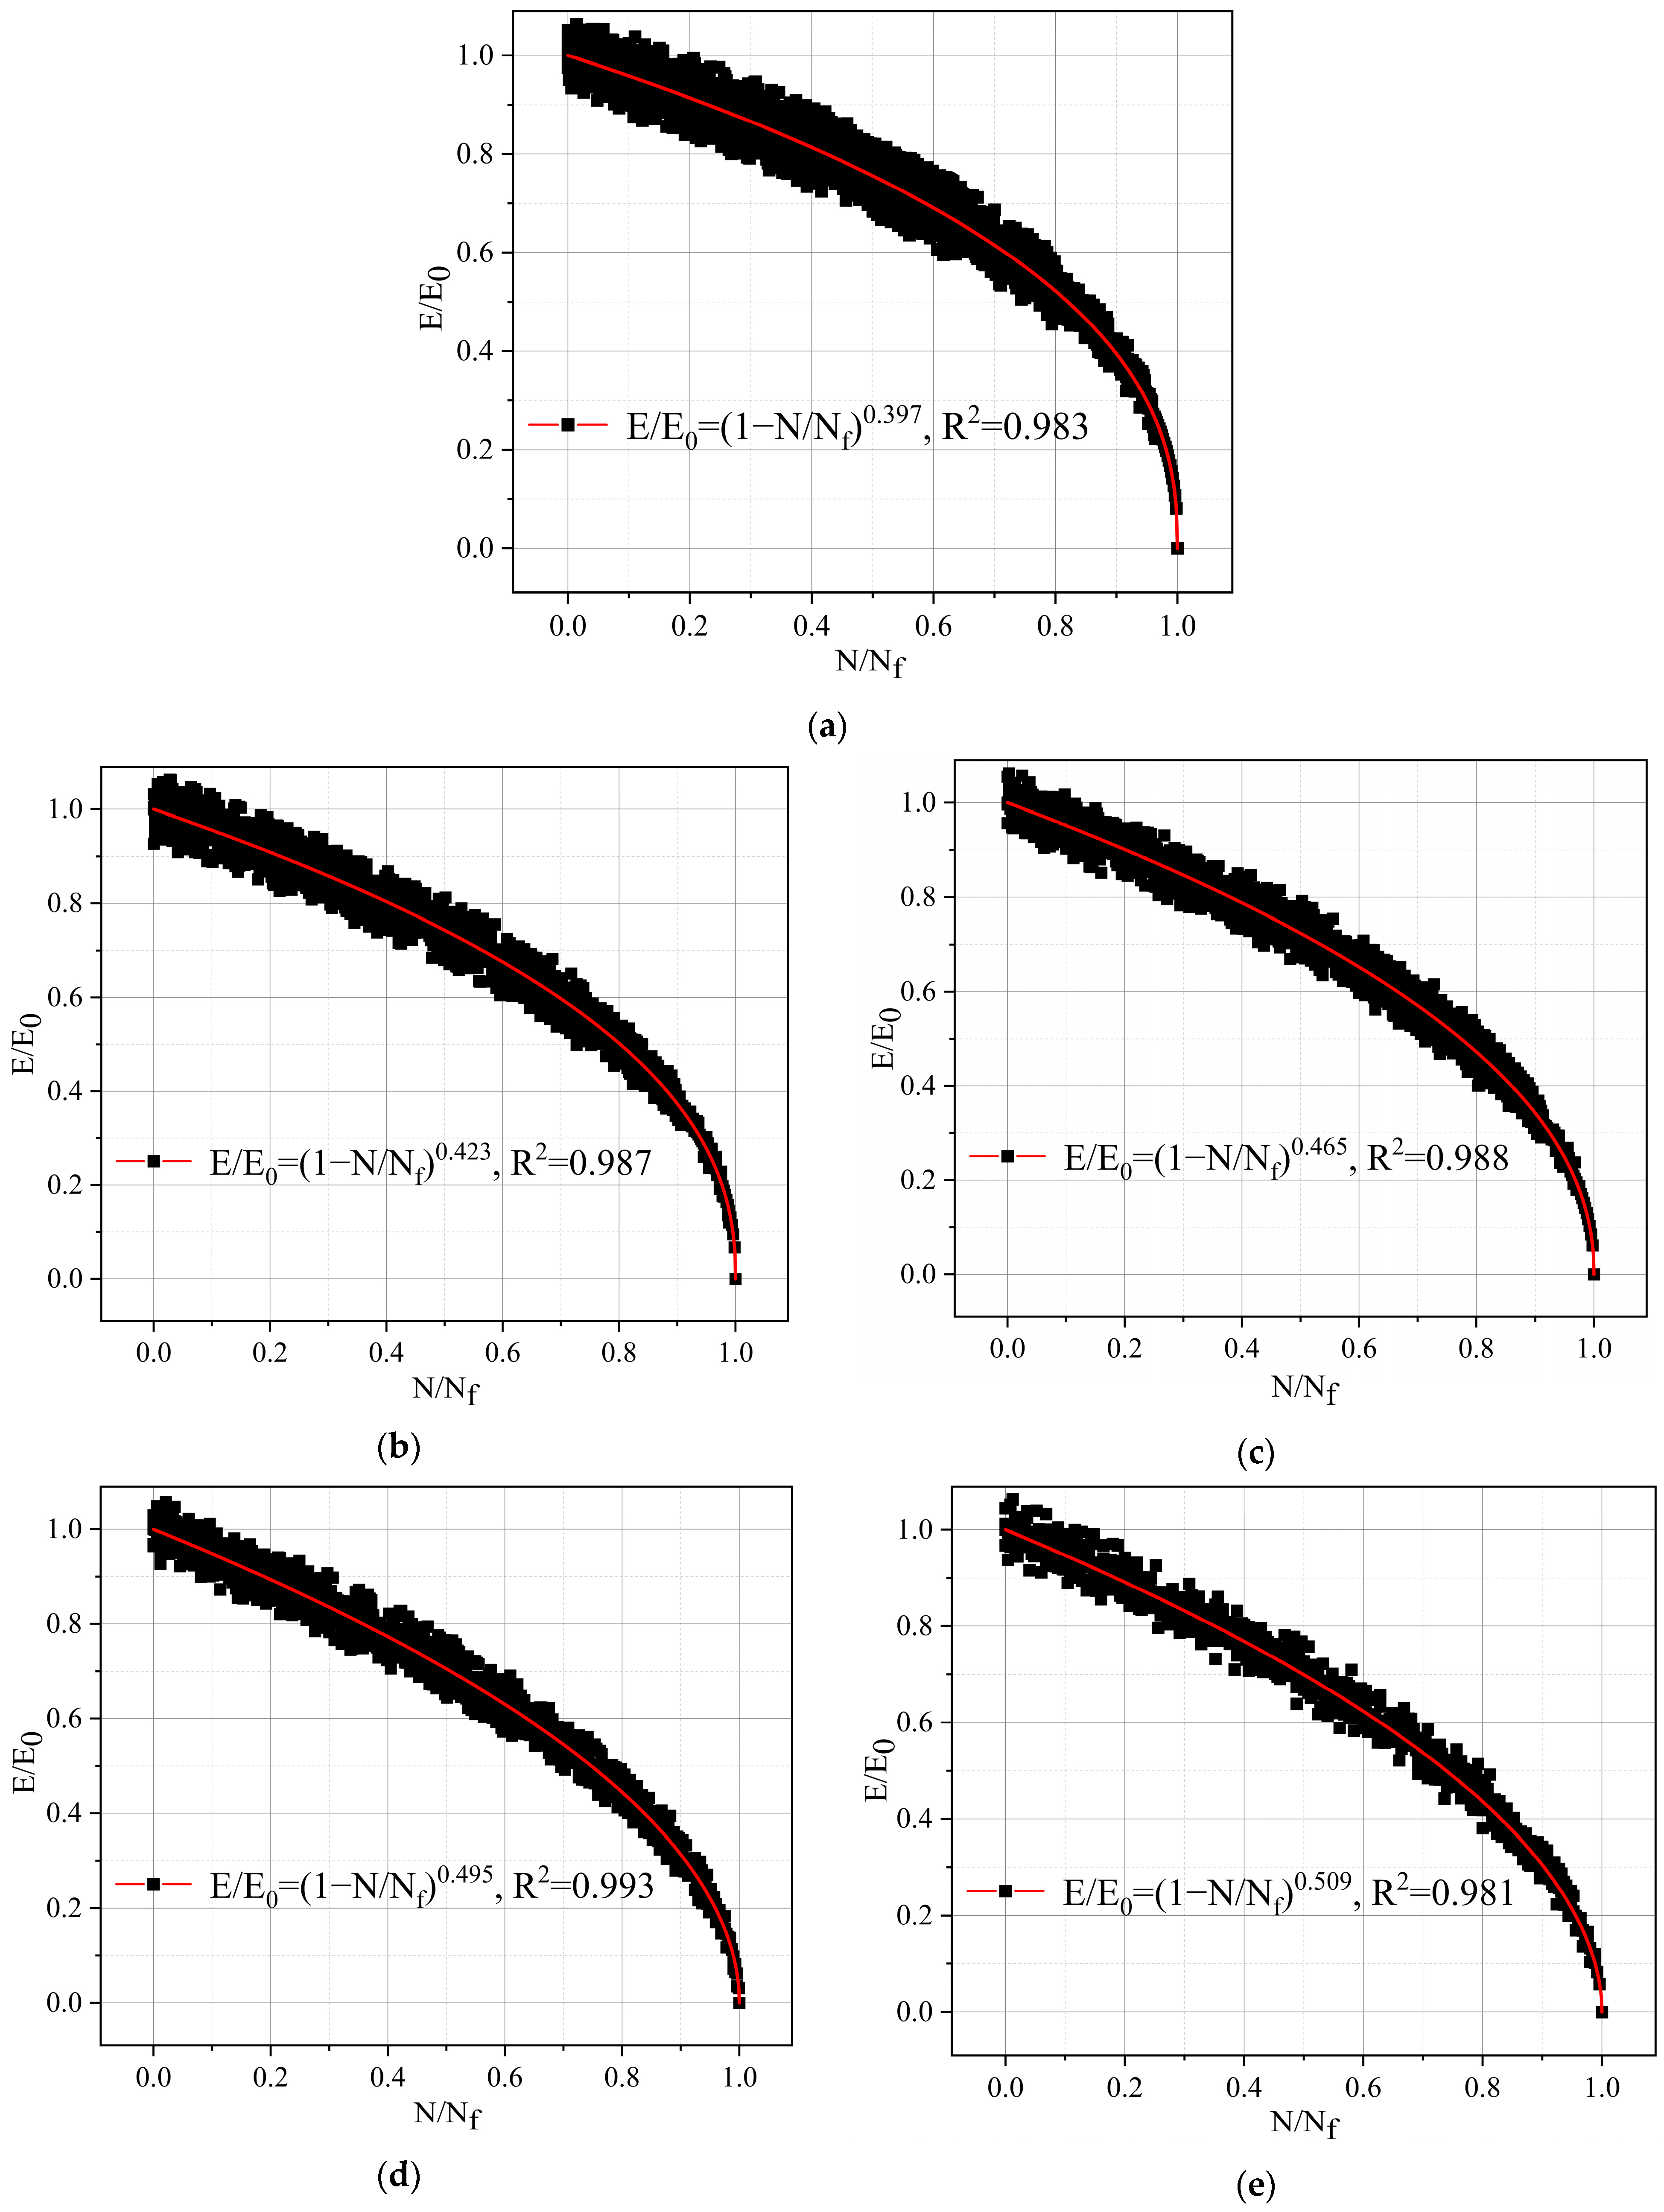
- Through stress-controlled fatigue tests, the modulus decay equations of asphalt mixtures under the DT, IDT, and UC modes were developed and compared.
- (4)
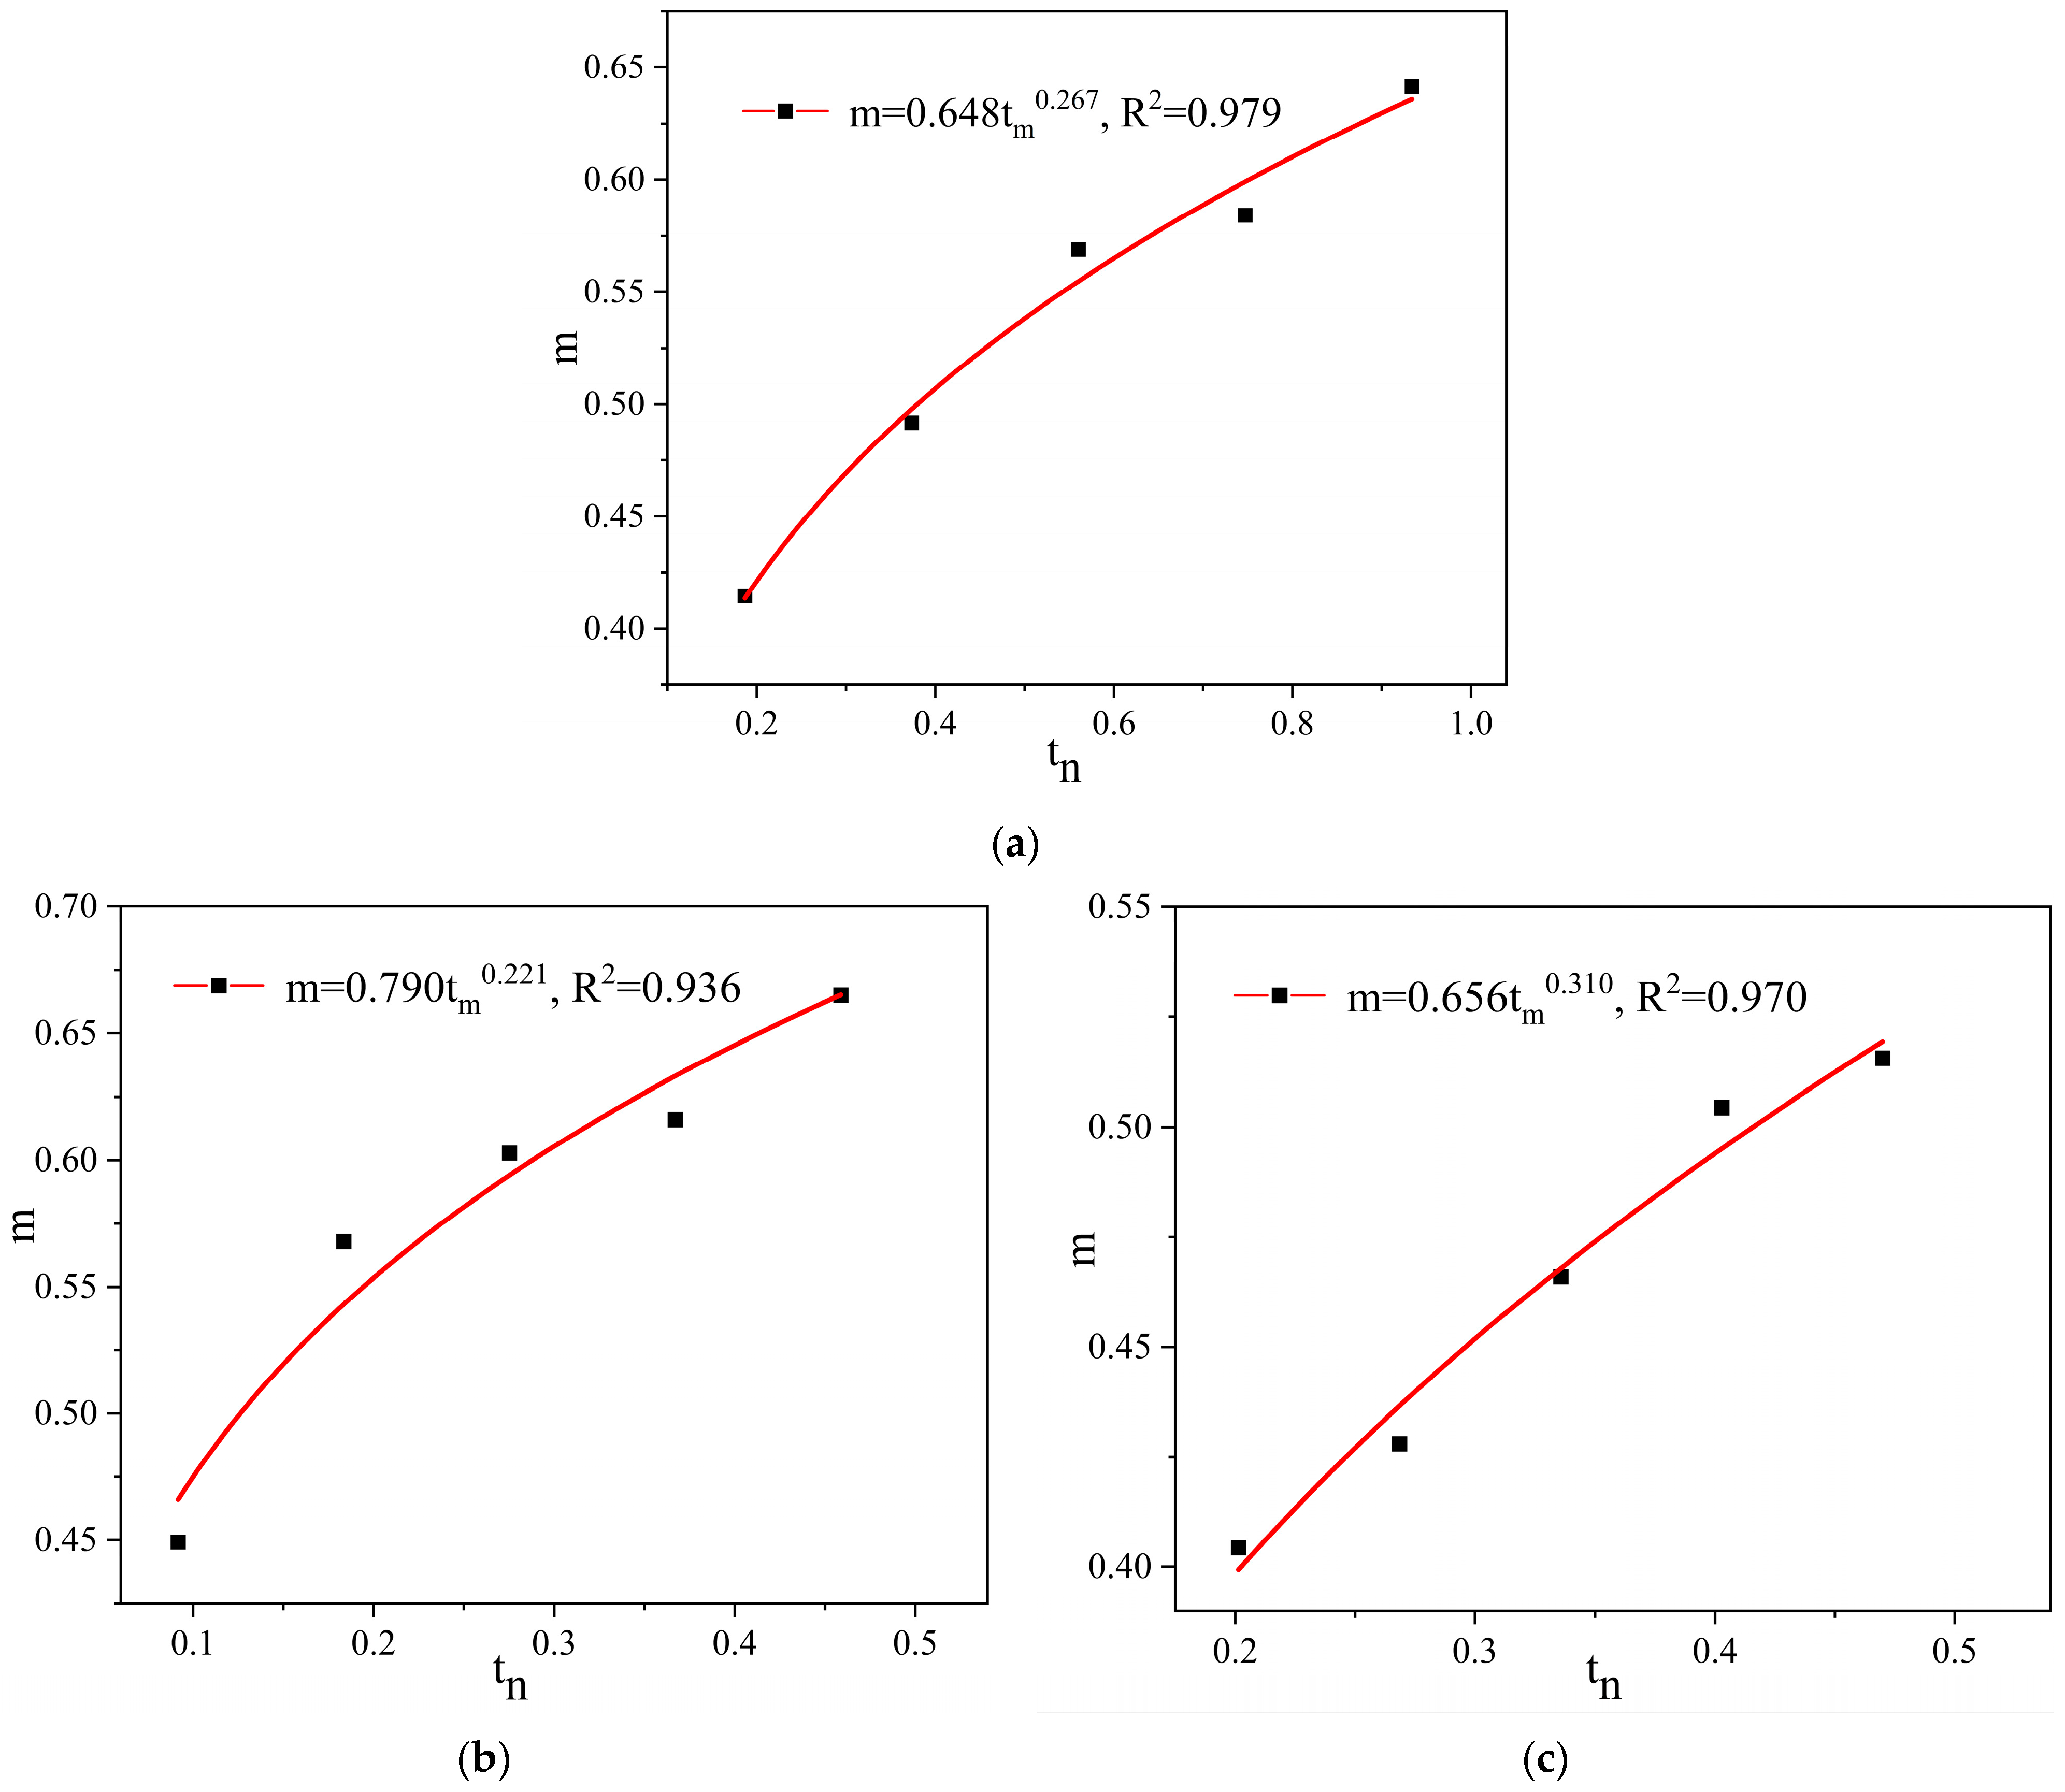
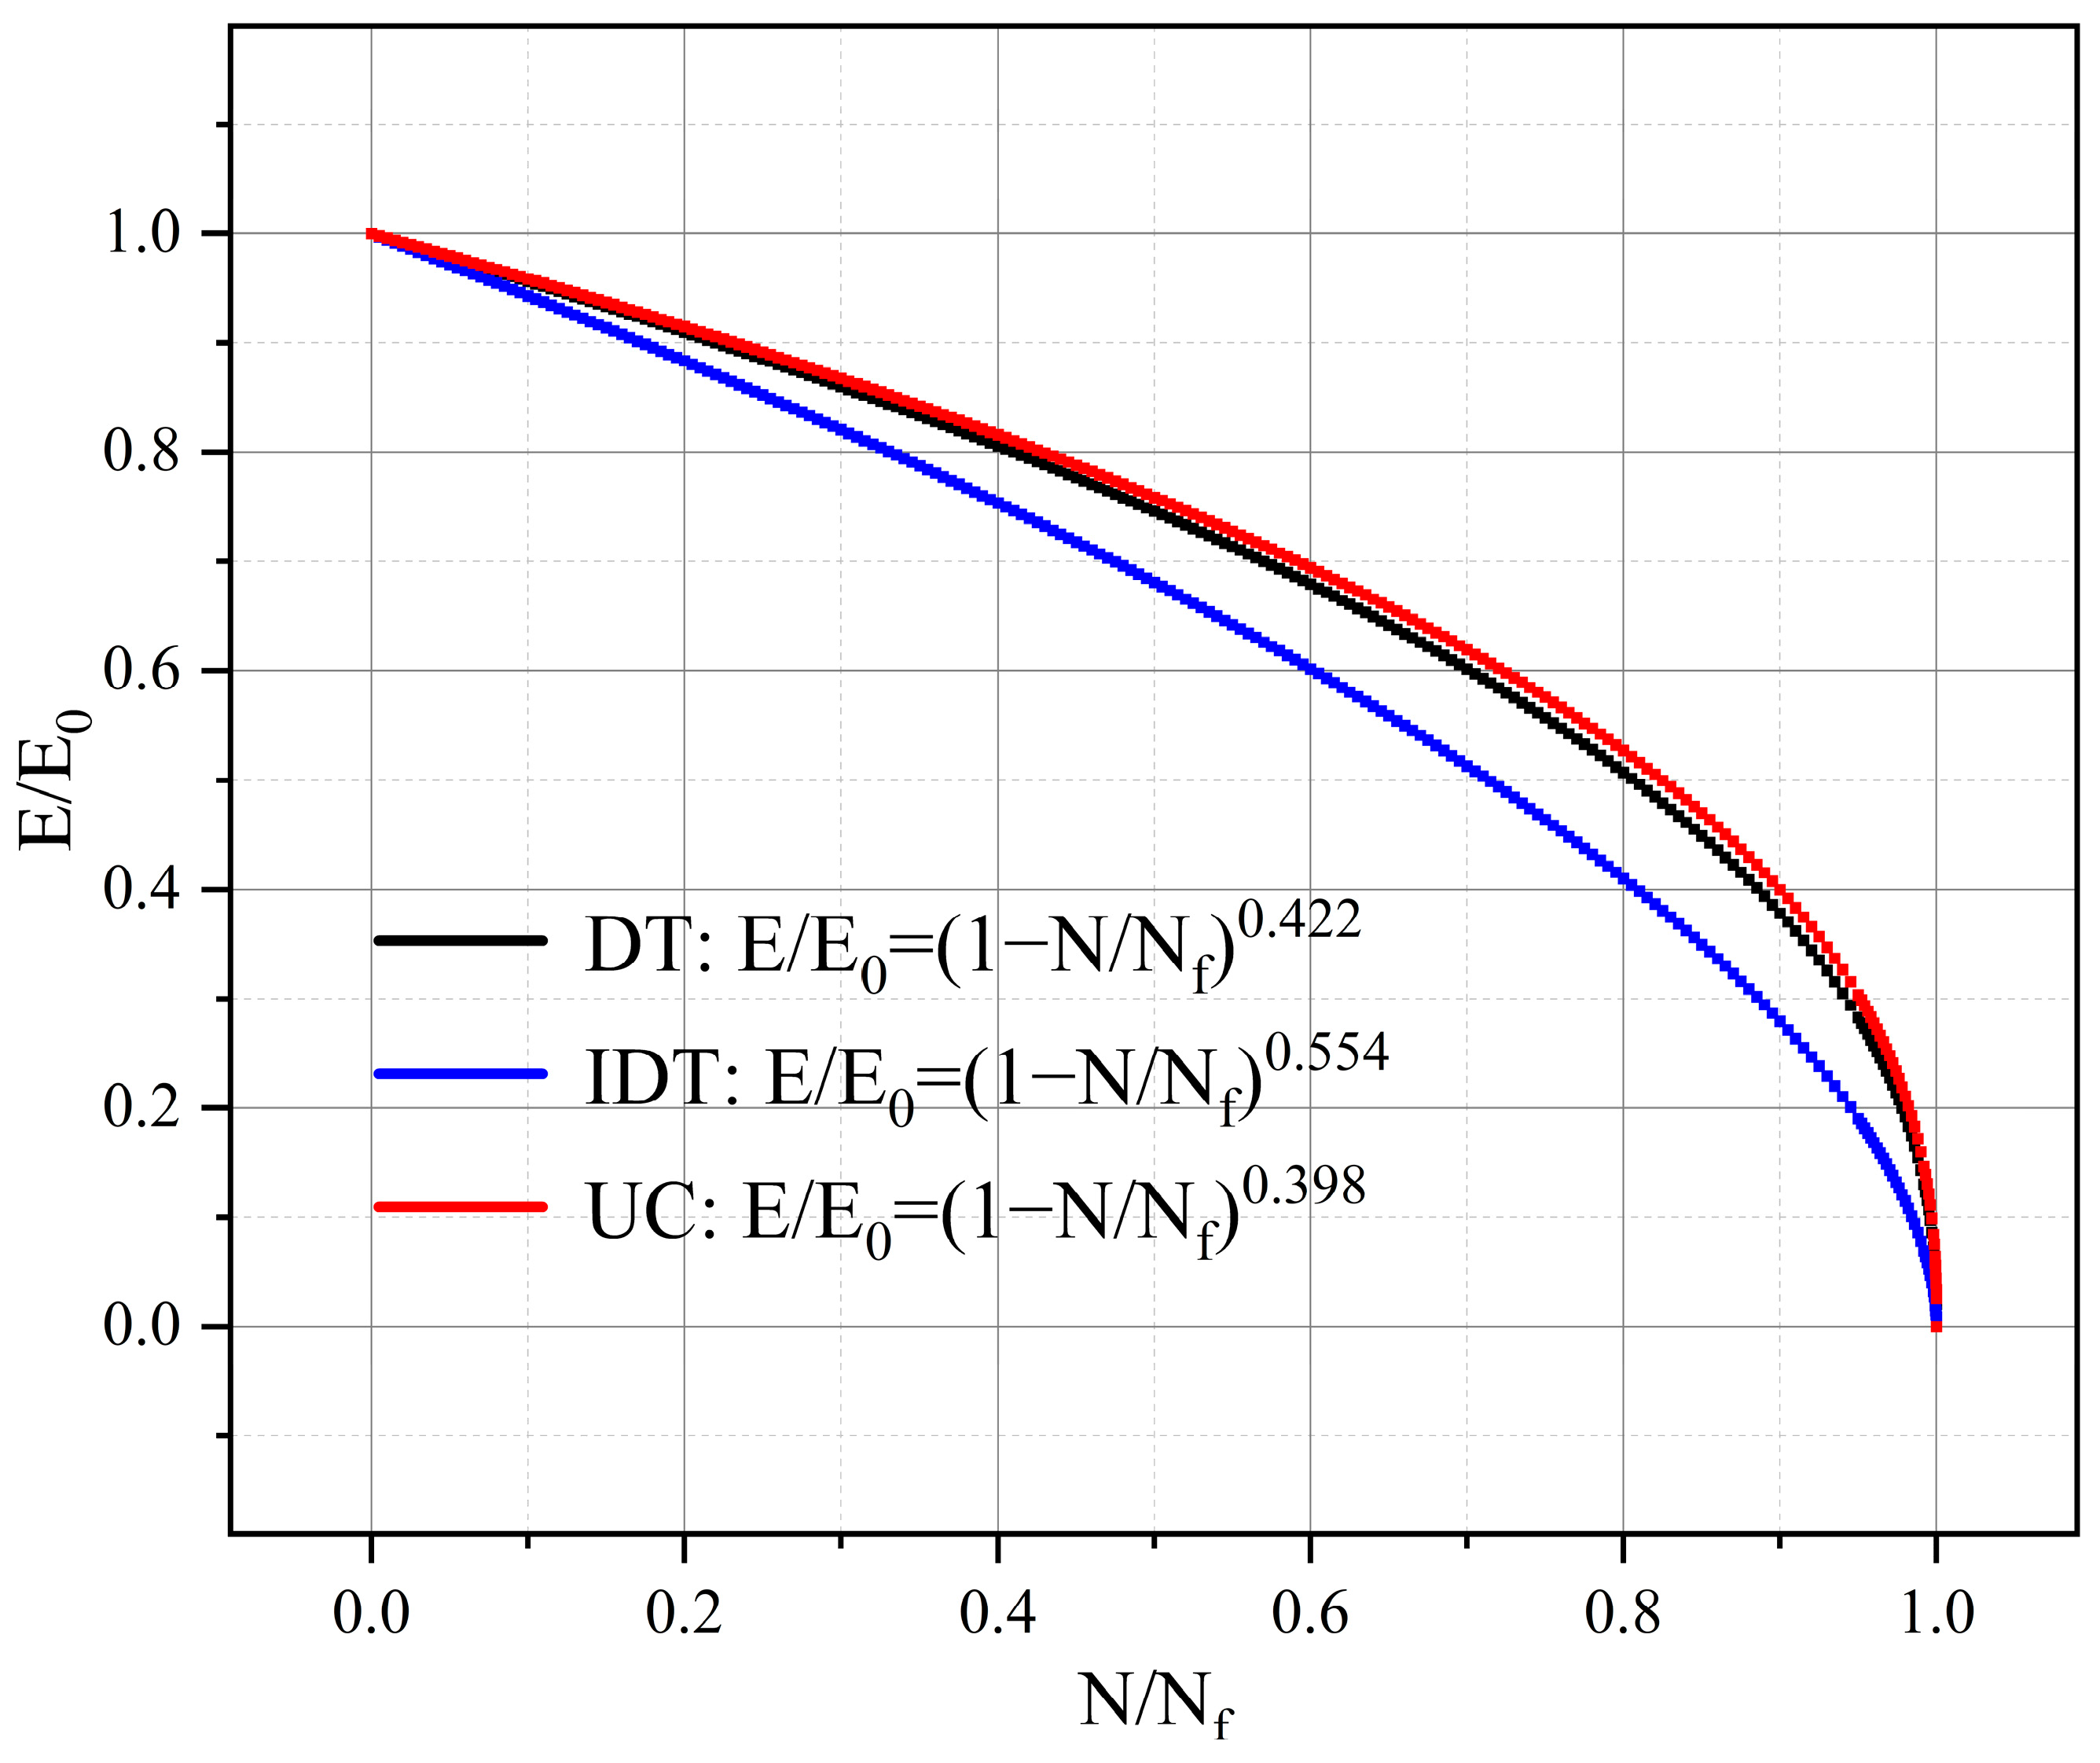
- A unified characterization model for the modulus decay of asphalt mixture under the 3-D stress state was established based on the fatigue stress strength ratio Δ.
2. Materials and Methodology
2.1. Materials
2.1.1. Asphalt
2.1.2. Aggregate and Filler
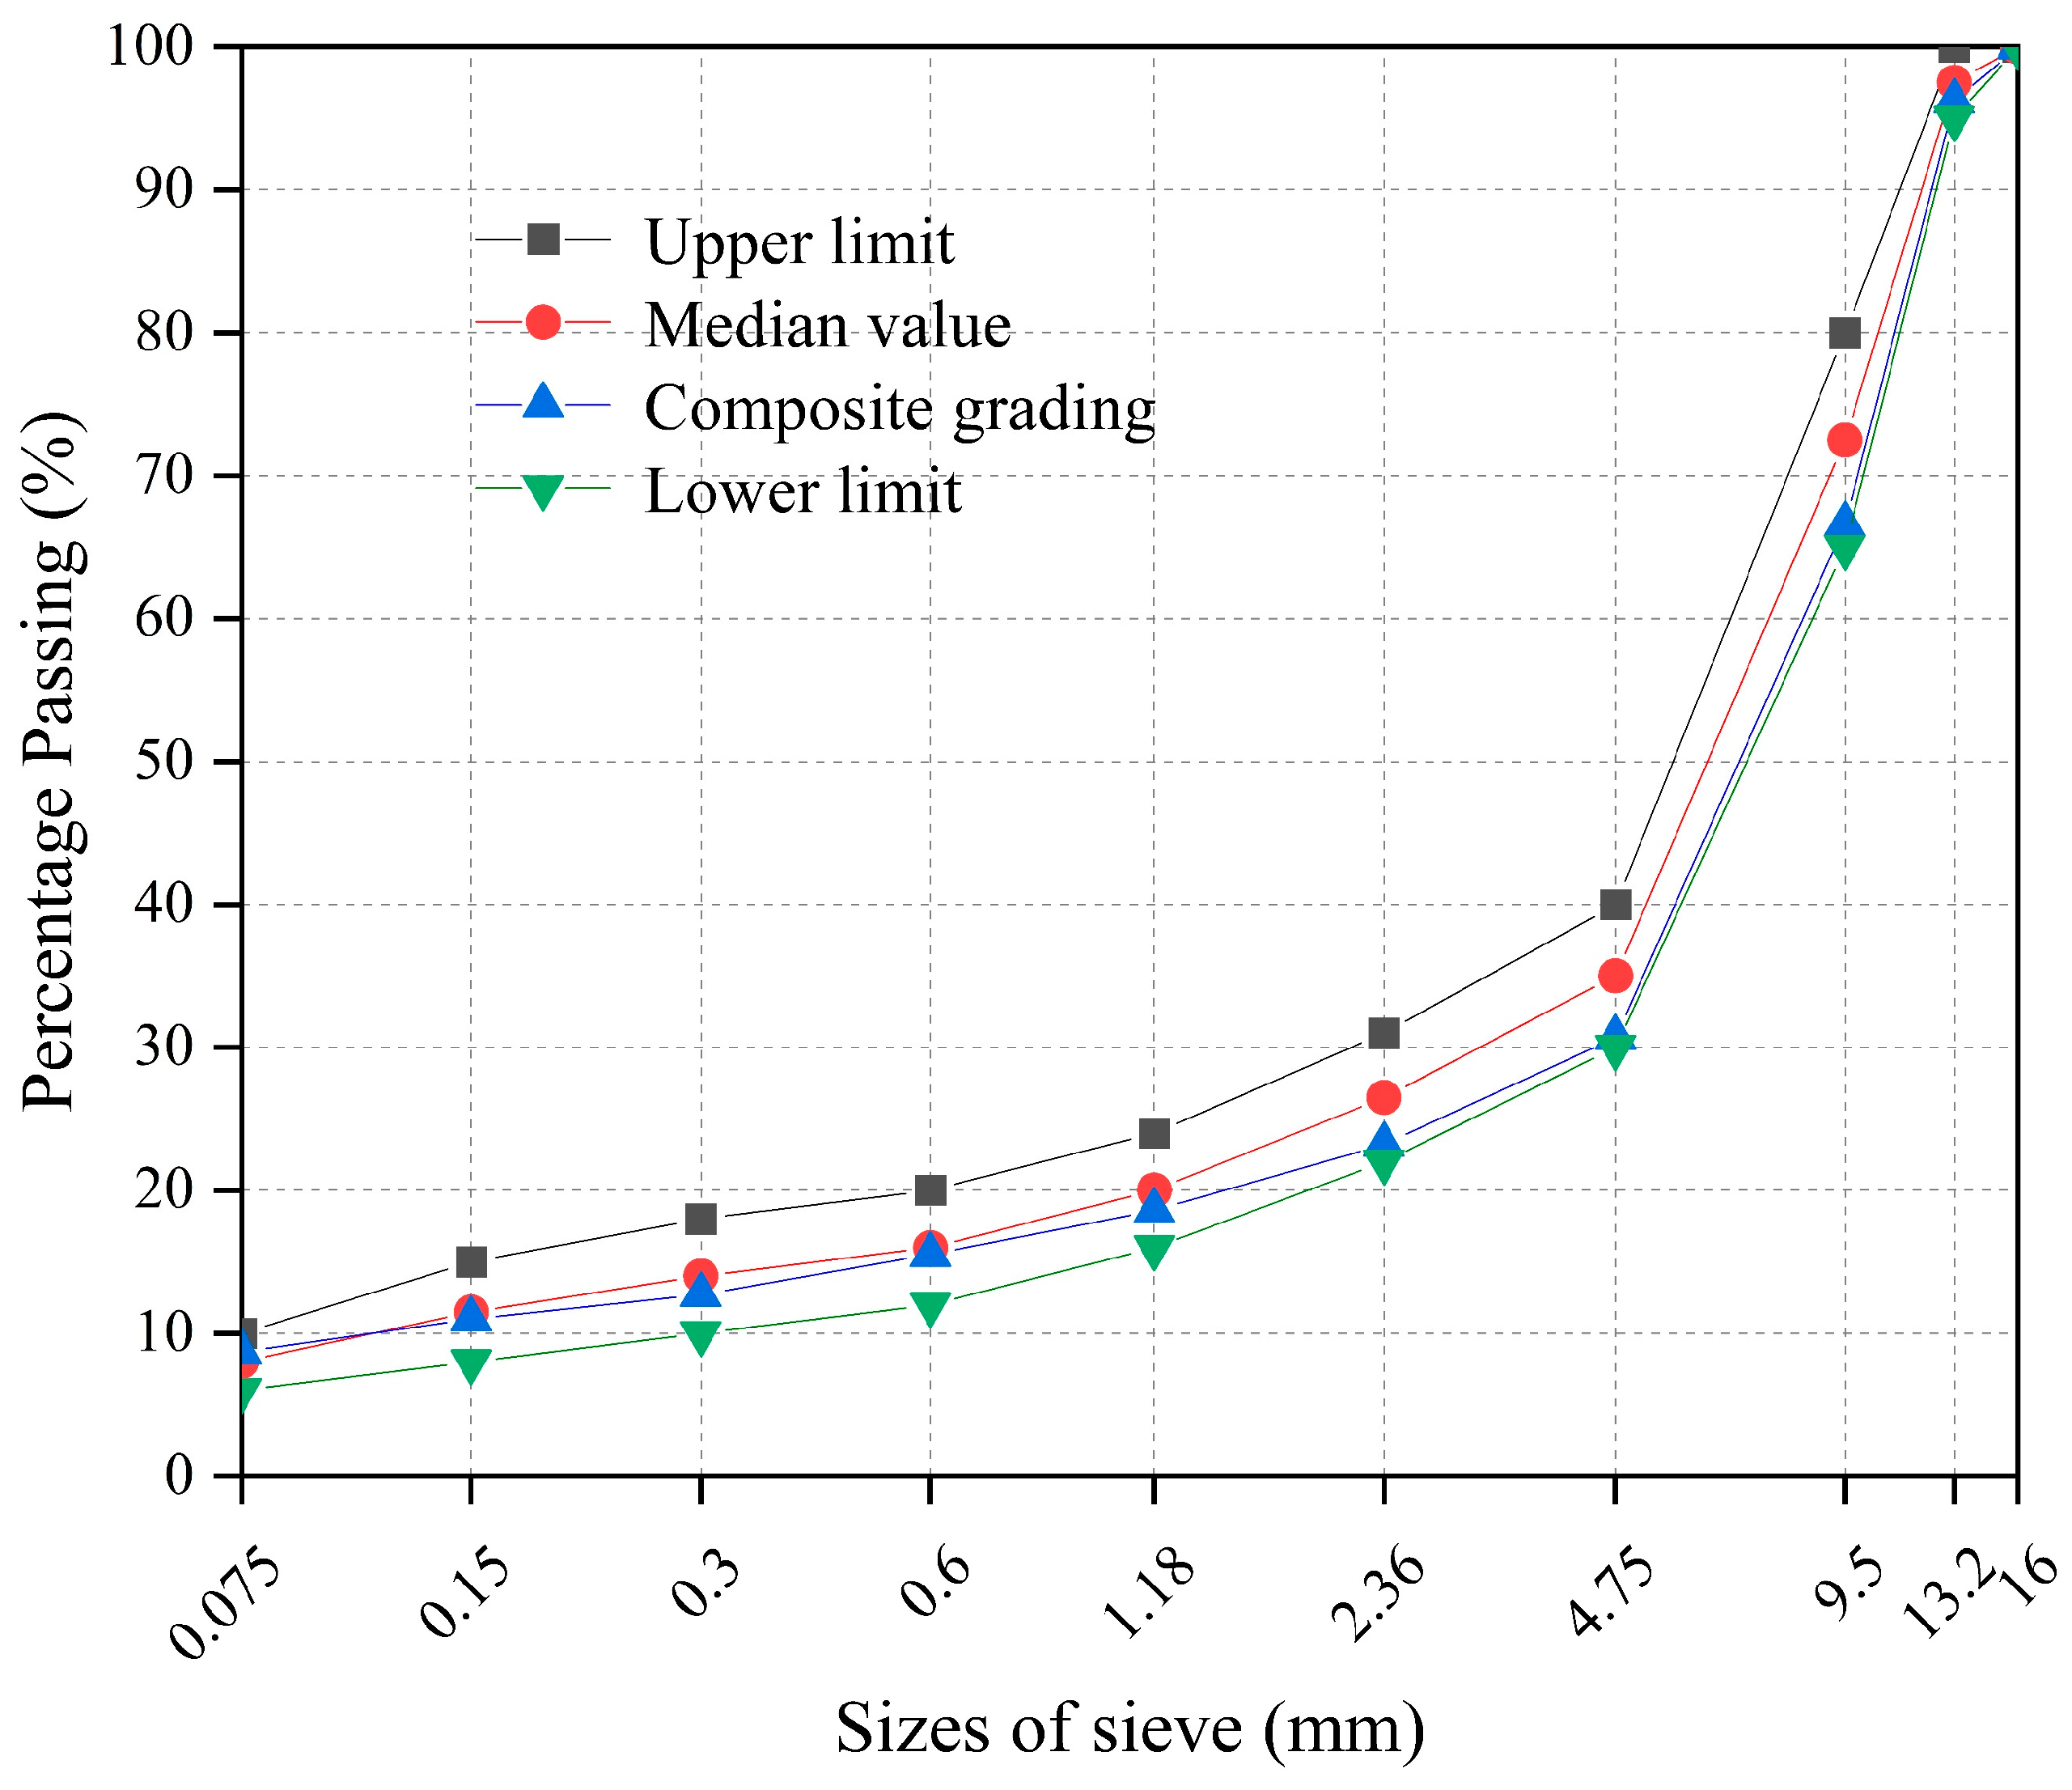
2.1.3. Mix Design
2.2. Experiment Approach
2.2.1. Specimen Preparation
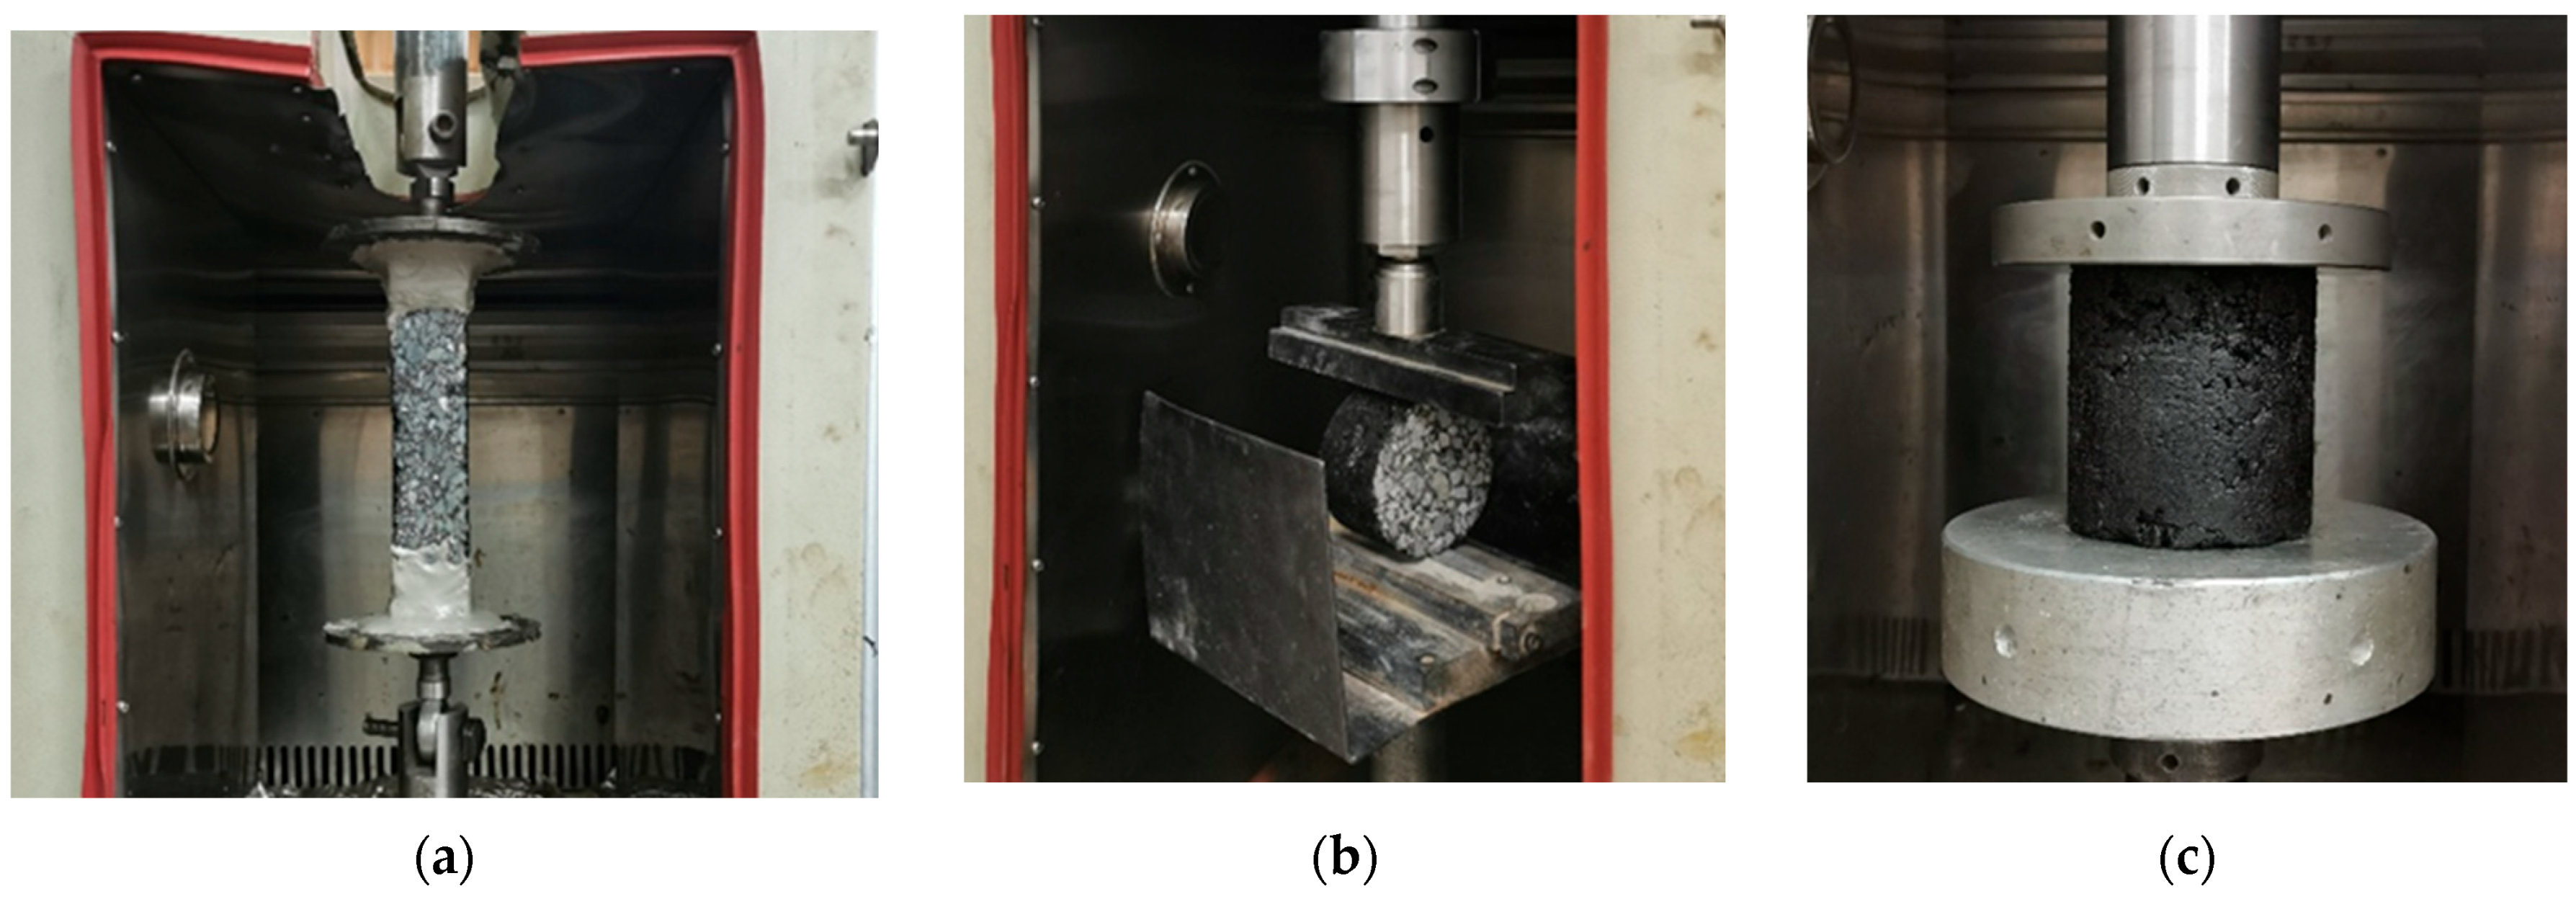
2.2.2. Strength Test Approach
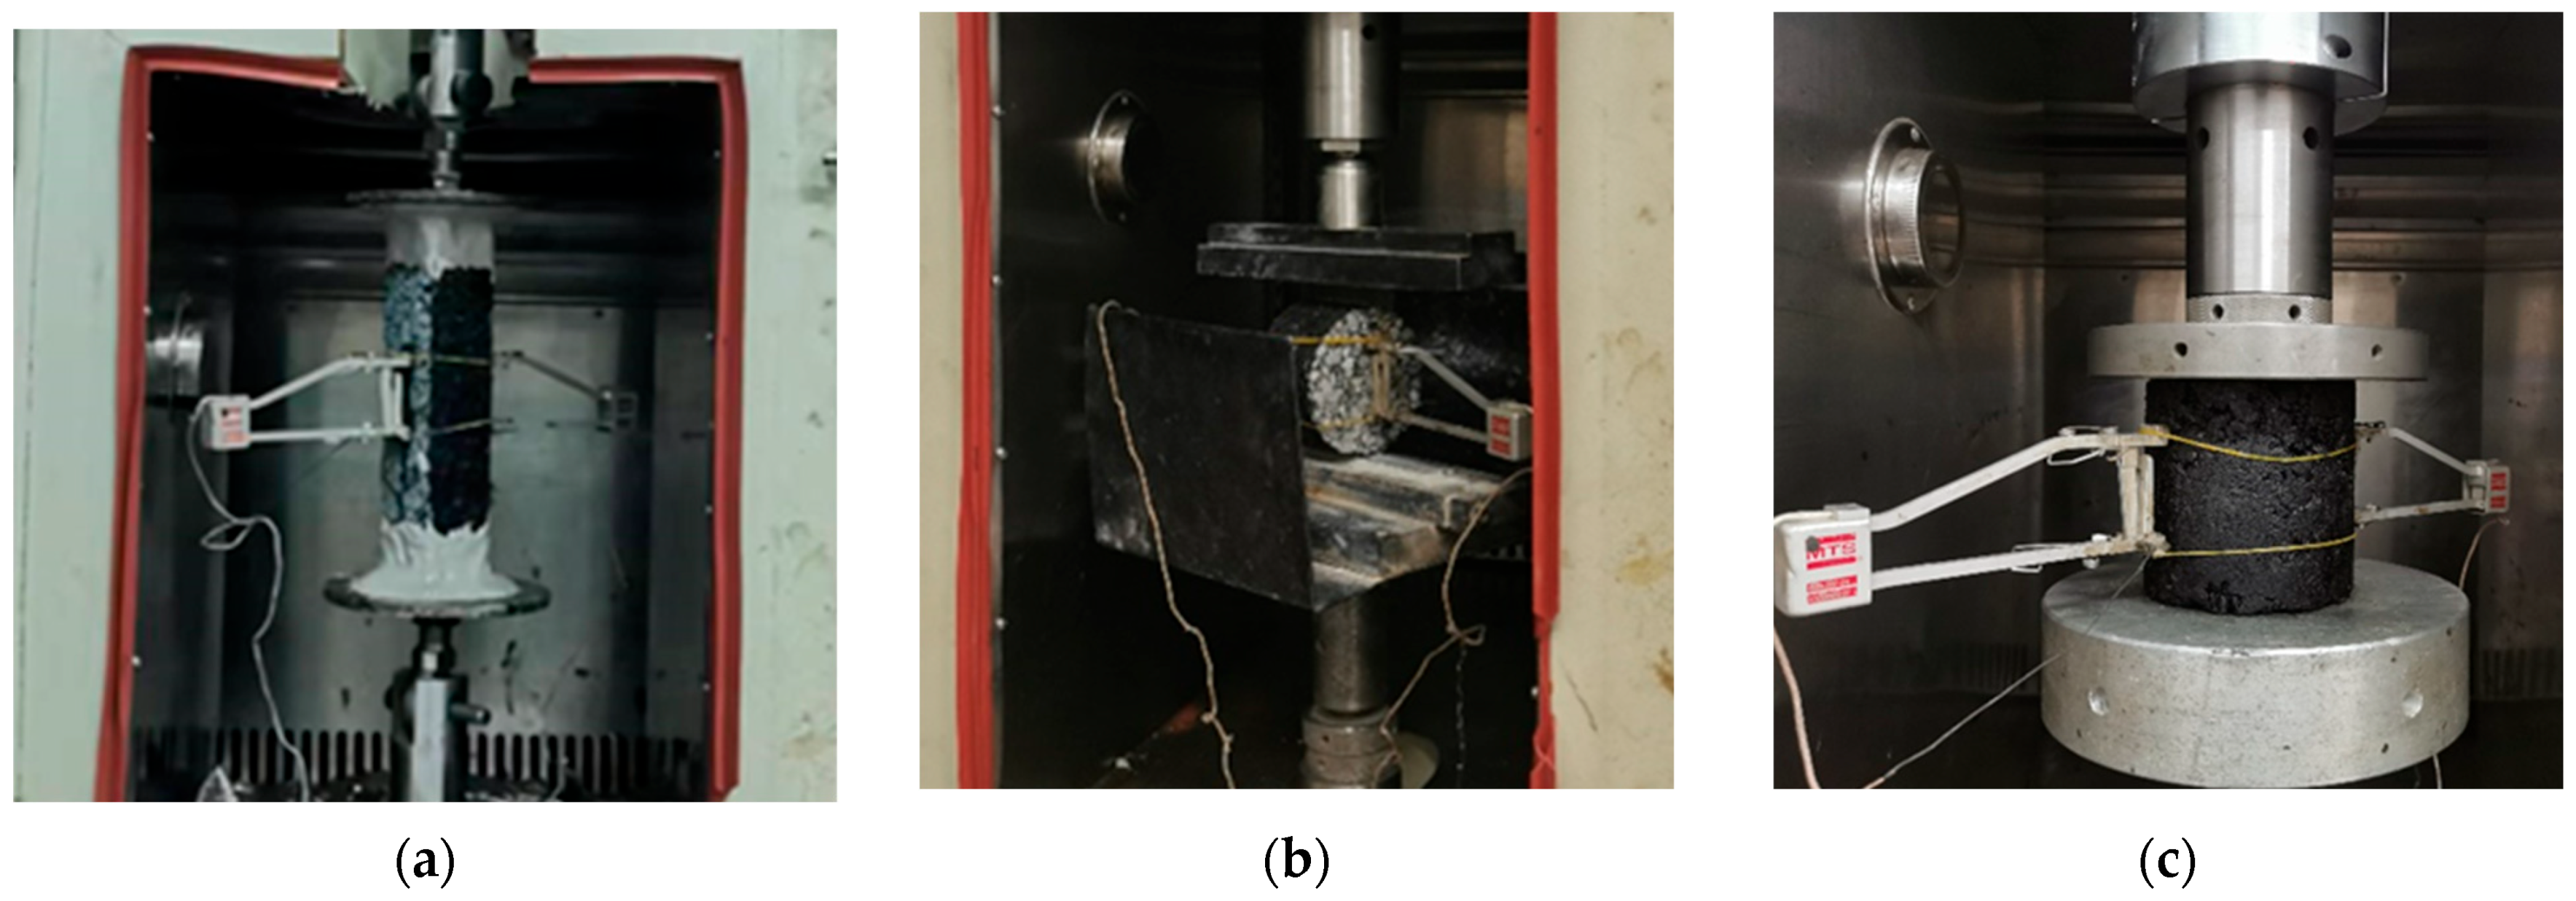
2.2.3. Fatigue Test Approach
2.3. Derivation of Modulus Decay Equation
2.3.1. Damage Variables Based on Modulus
2.3.2. Nonlinear Fatigue Damage Equation for Asphalt Mixes
2.3.3. Modulus Decay Equation
3. Results and Discussion
3.1. Asphalt Mixture Strength and Fatigue Test Results Analysis
3.1.1. Analysis of Strength Test Results
3.1.2. Analysis of Fatigue Test Results
3.2. The Modulus Decay Law of Asphalt Mix with Various Stress States
3.2.1. Fitting Results of Modulus Decay Equation with Various Stress States
3.2.2. Comparative Analysis of Modulus Decay Law under Different Stress States
3.3. Unified Characterization Model for Modulus Decay of Asphalt Mixture under the 3-D Stress State
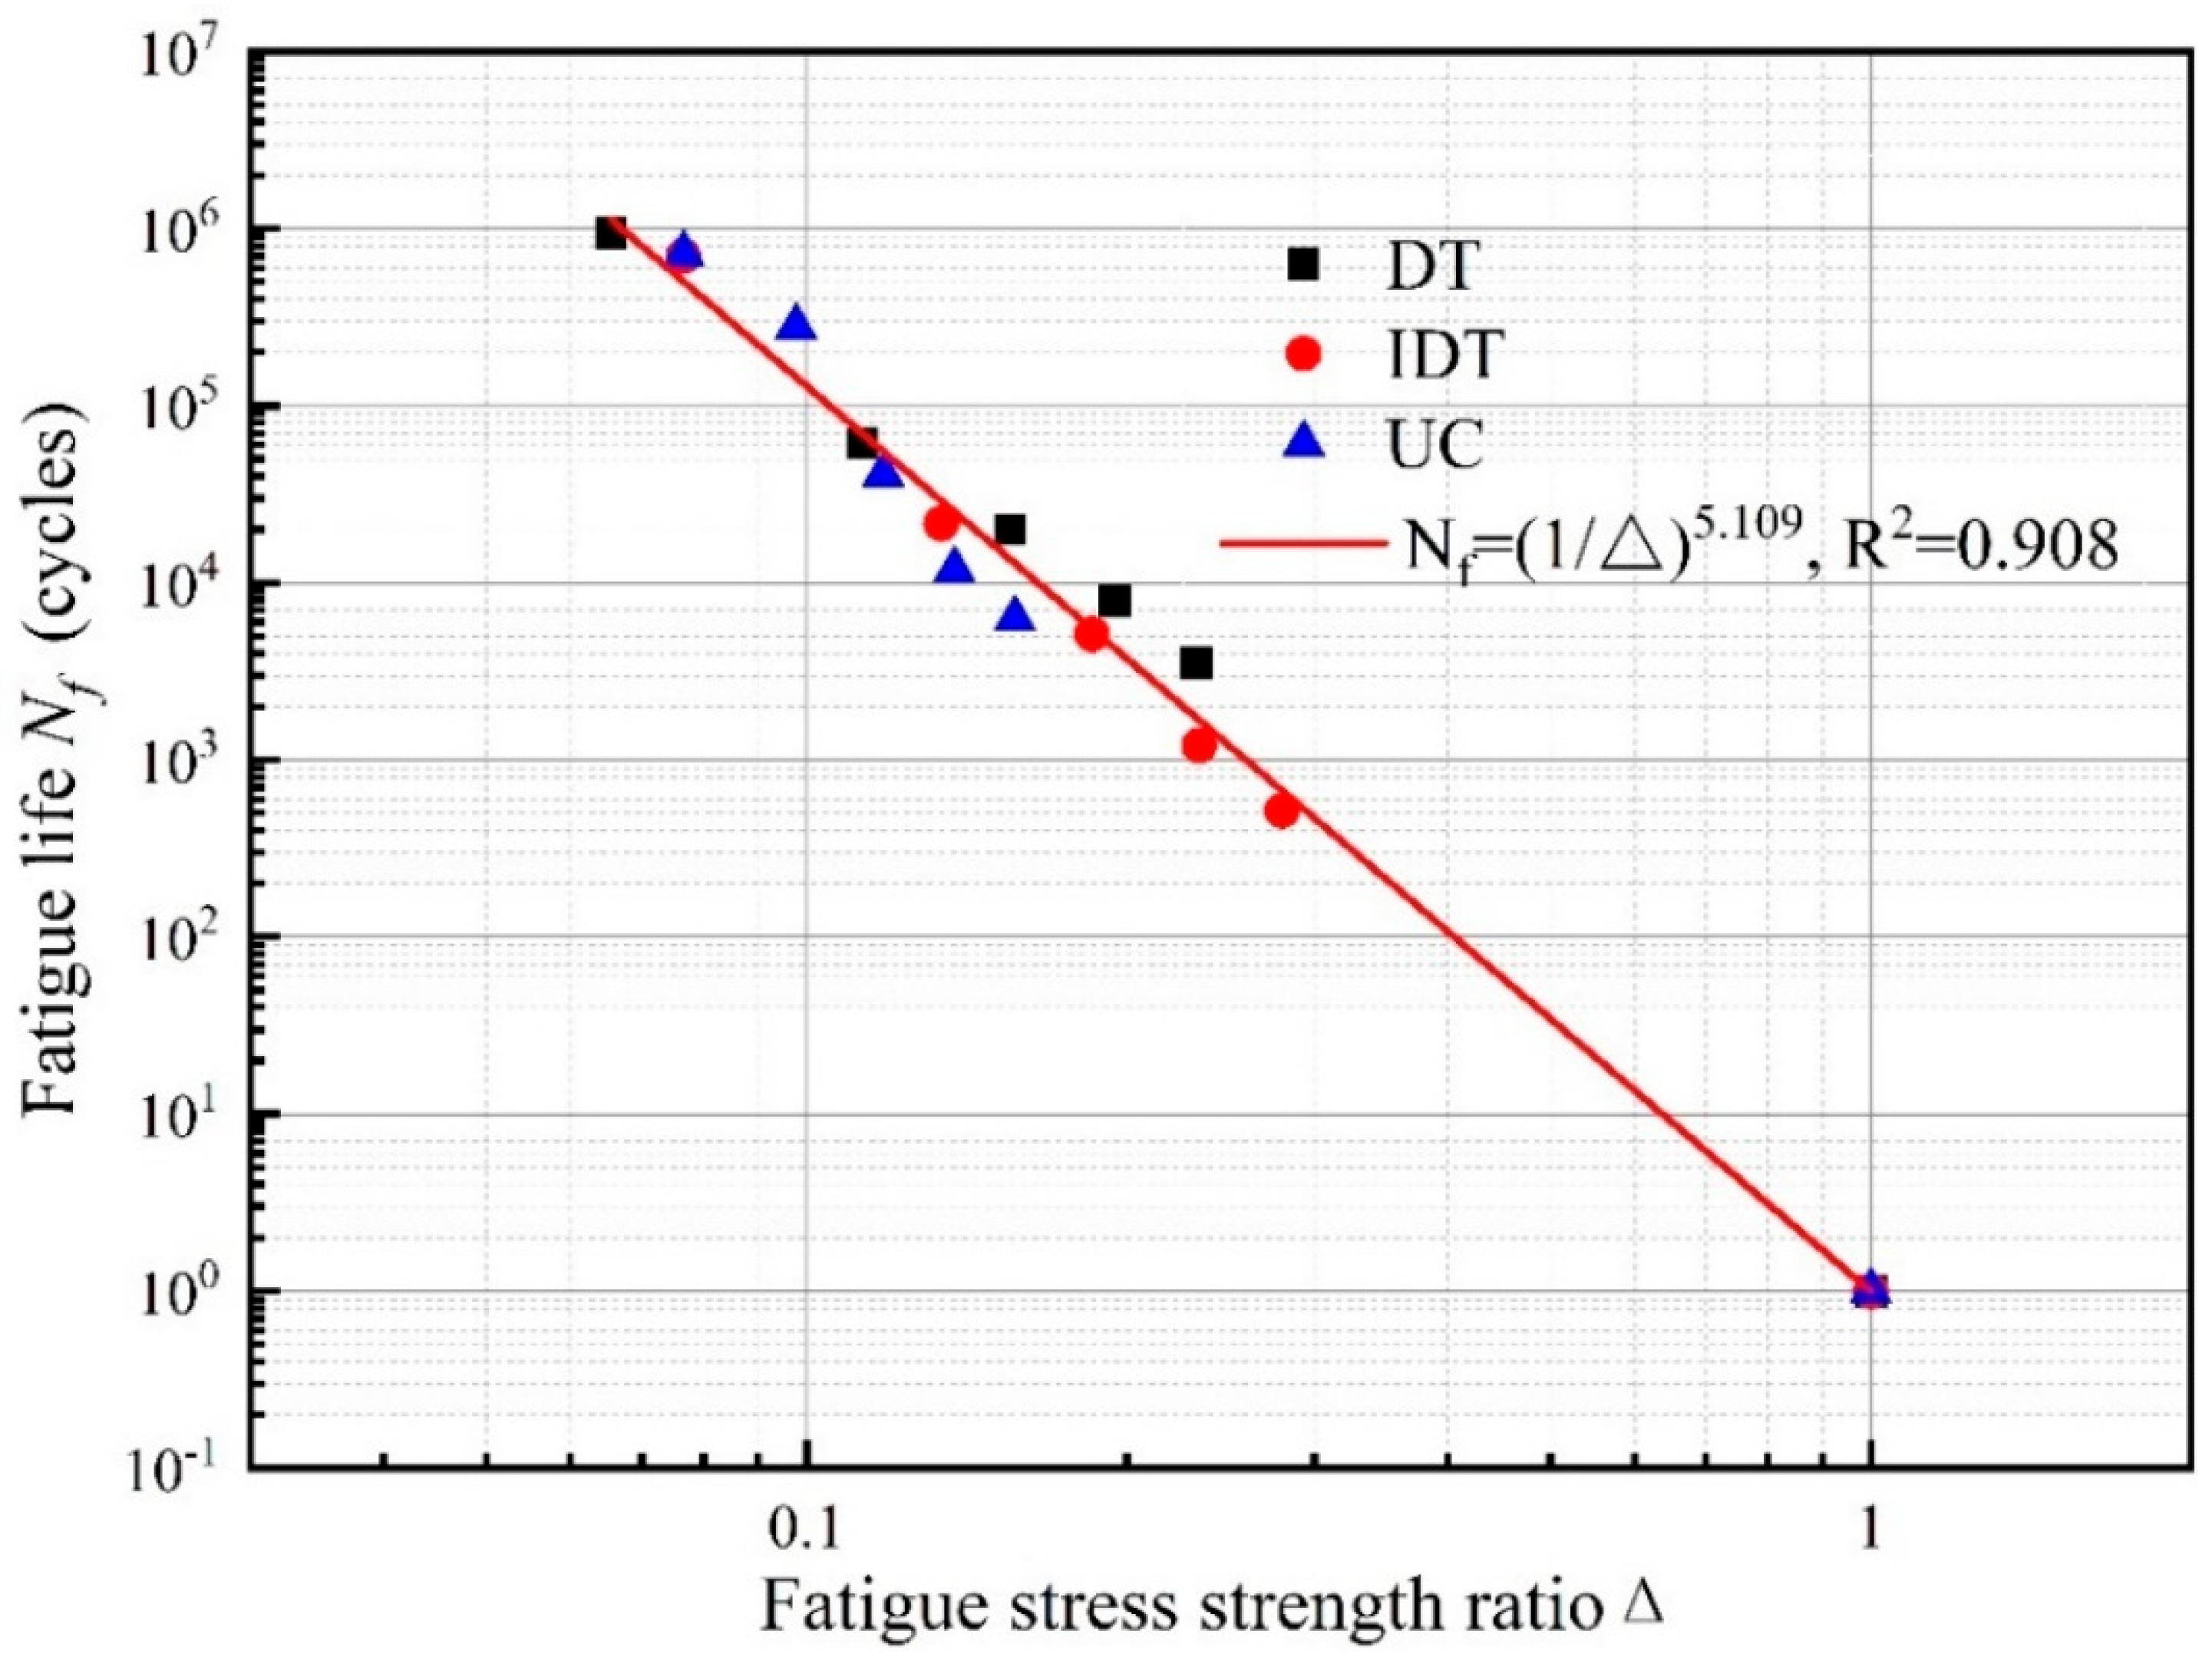
3.3.1. Fatigue Stress Strength Ratio and Normalized Fatigue Equation
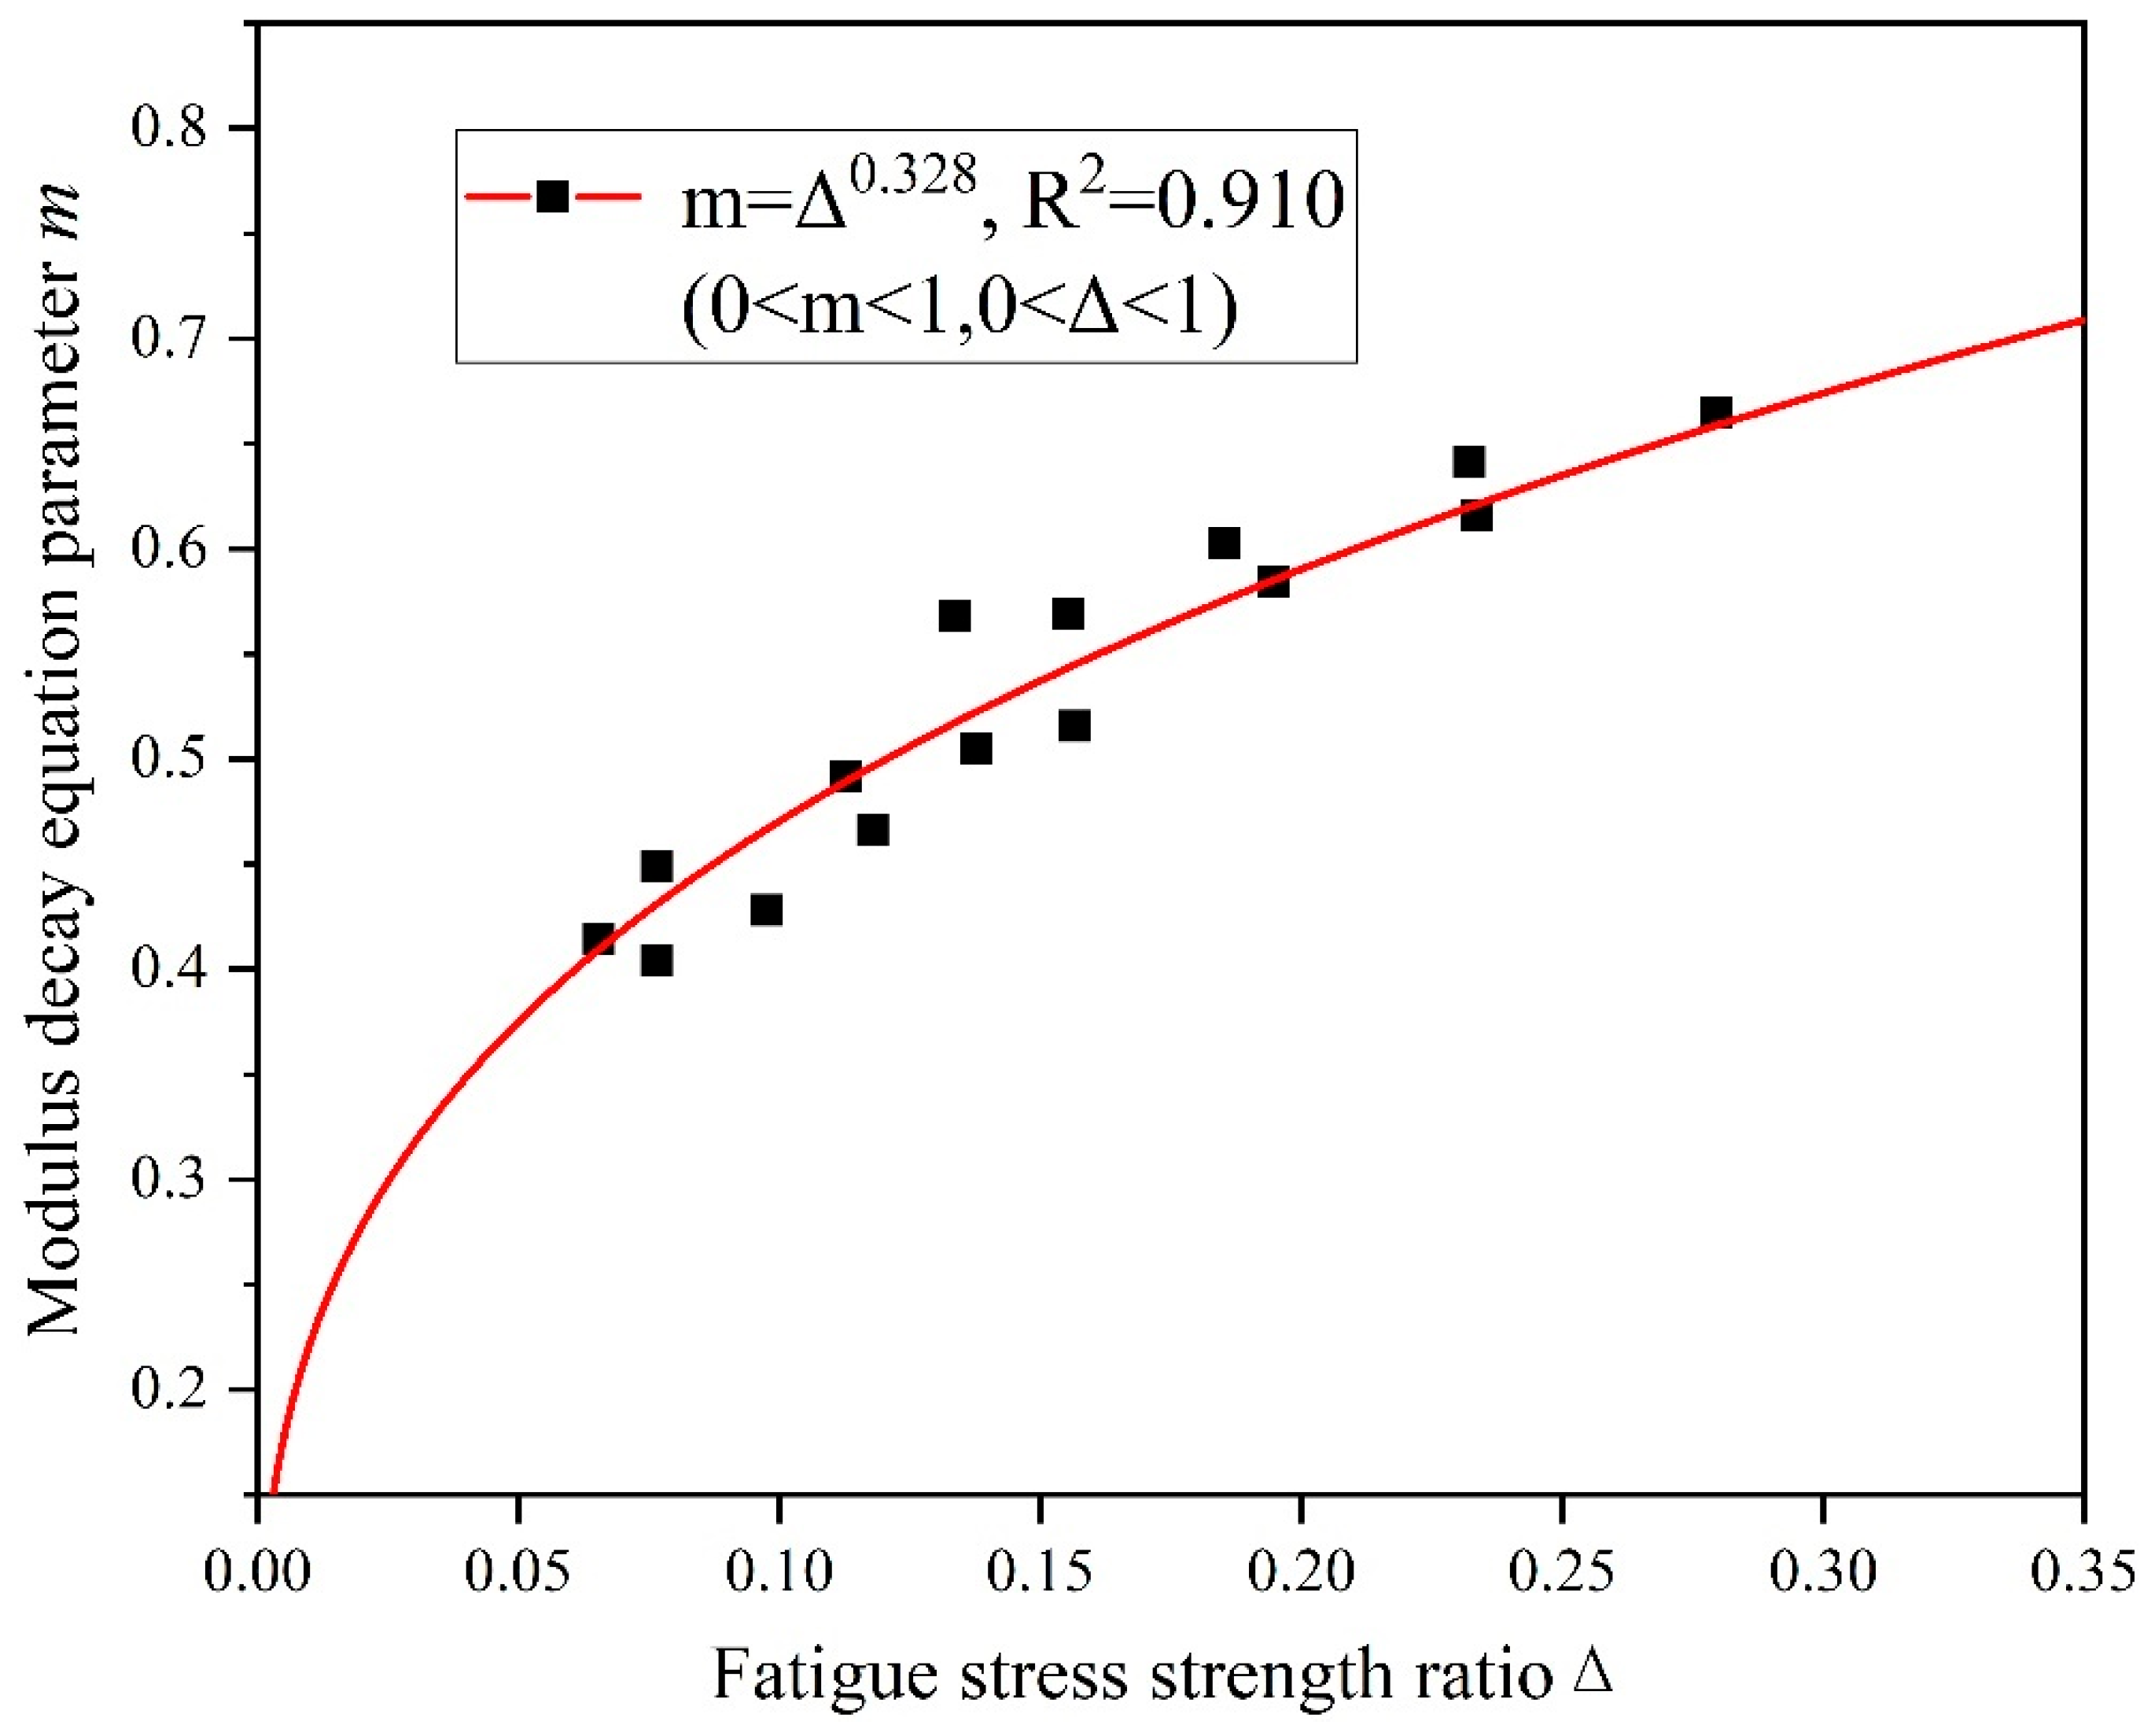
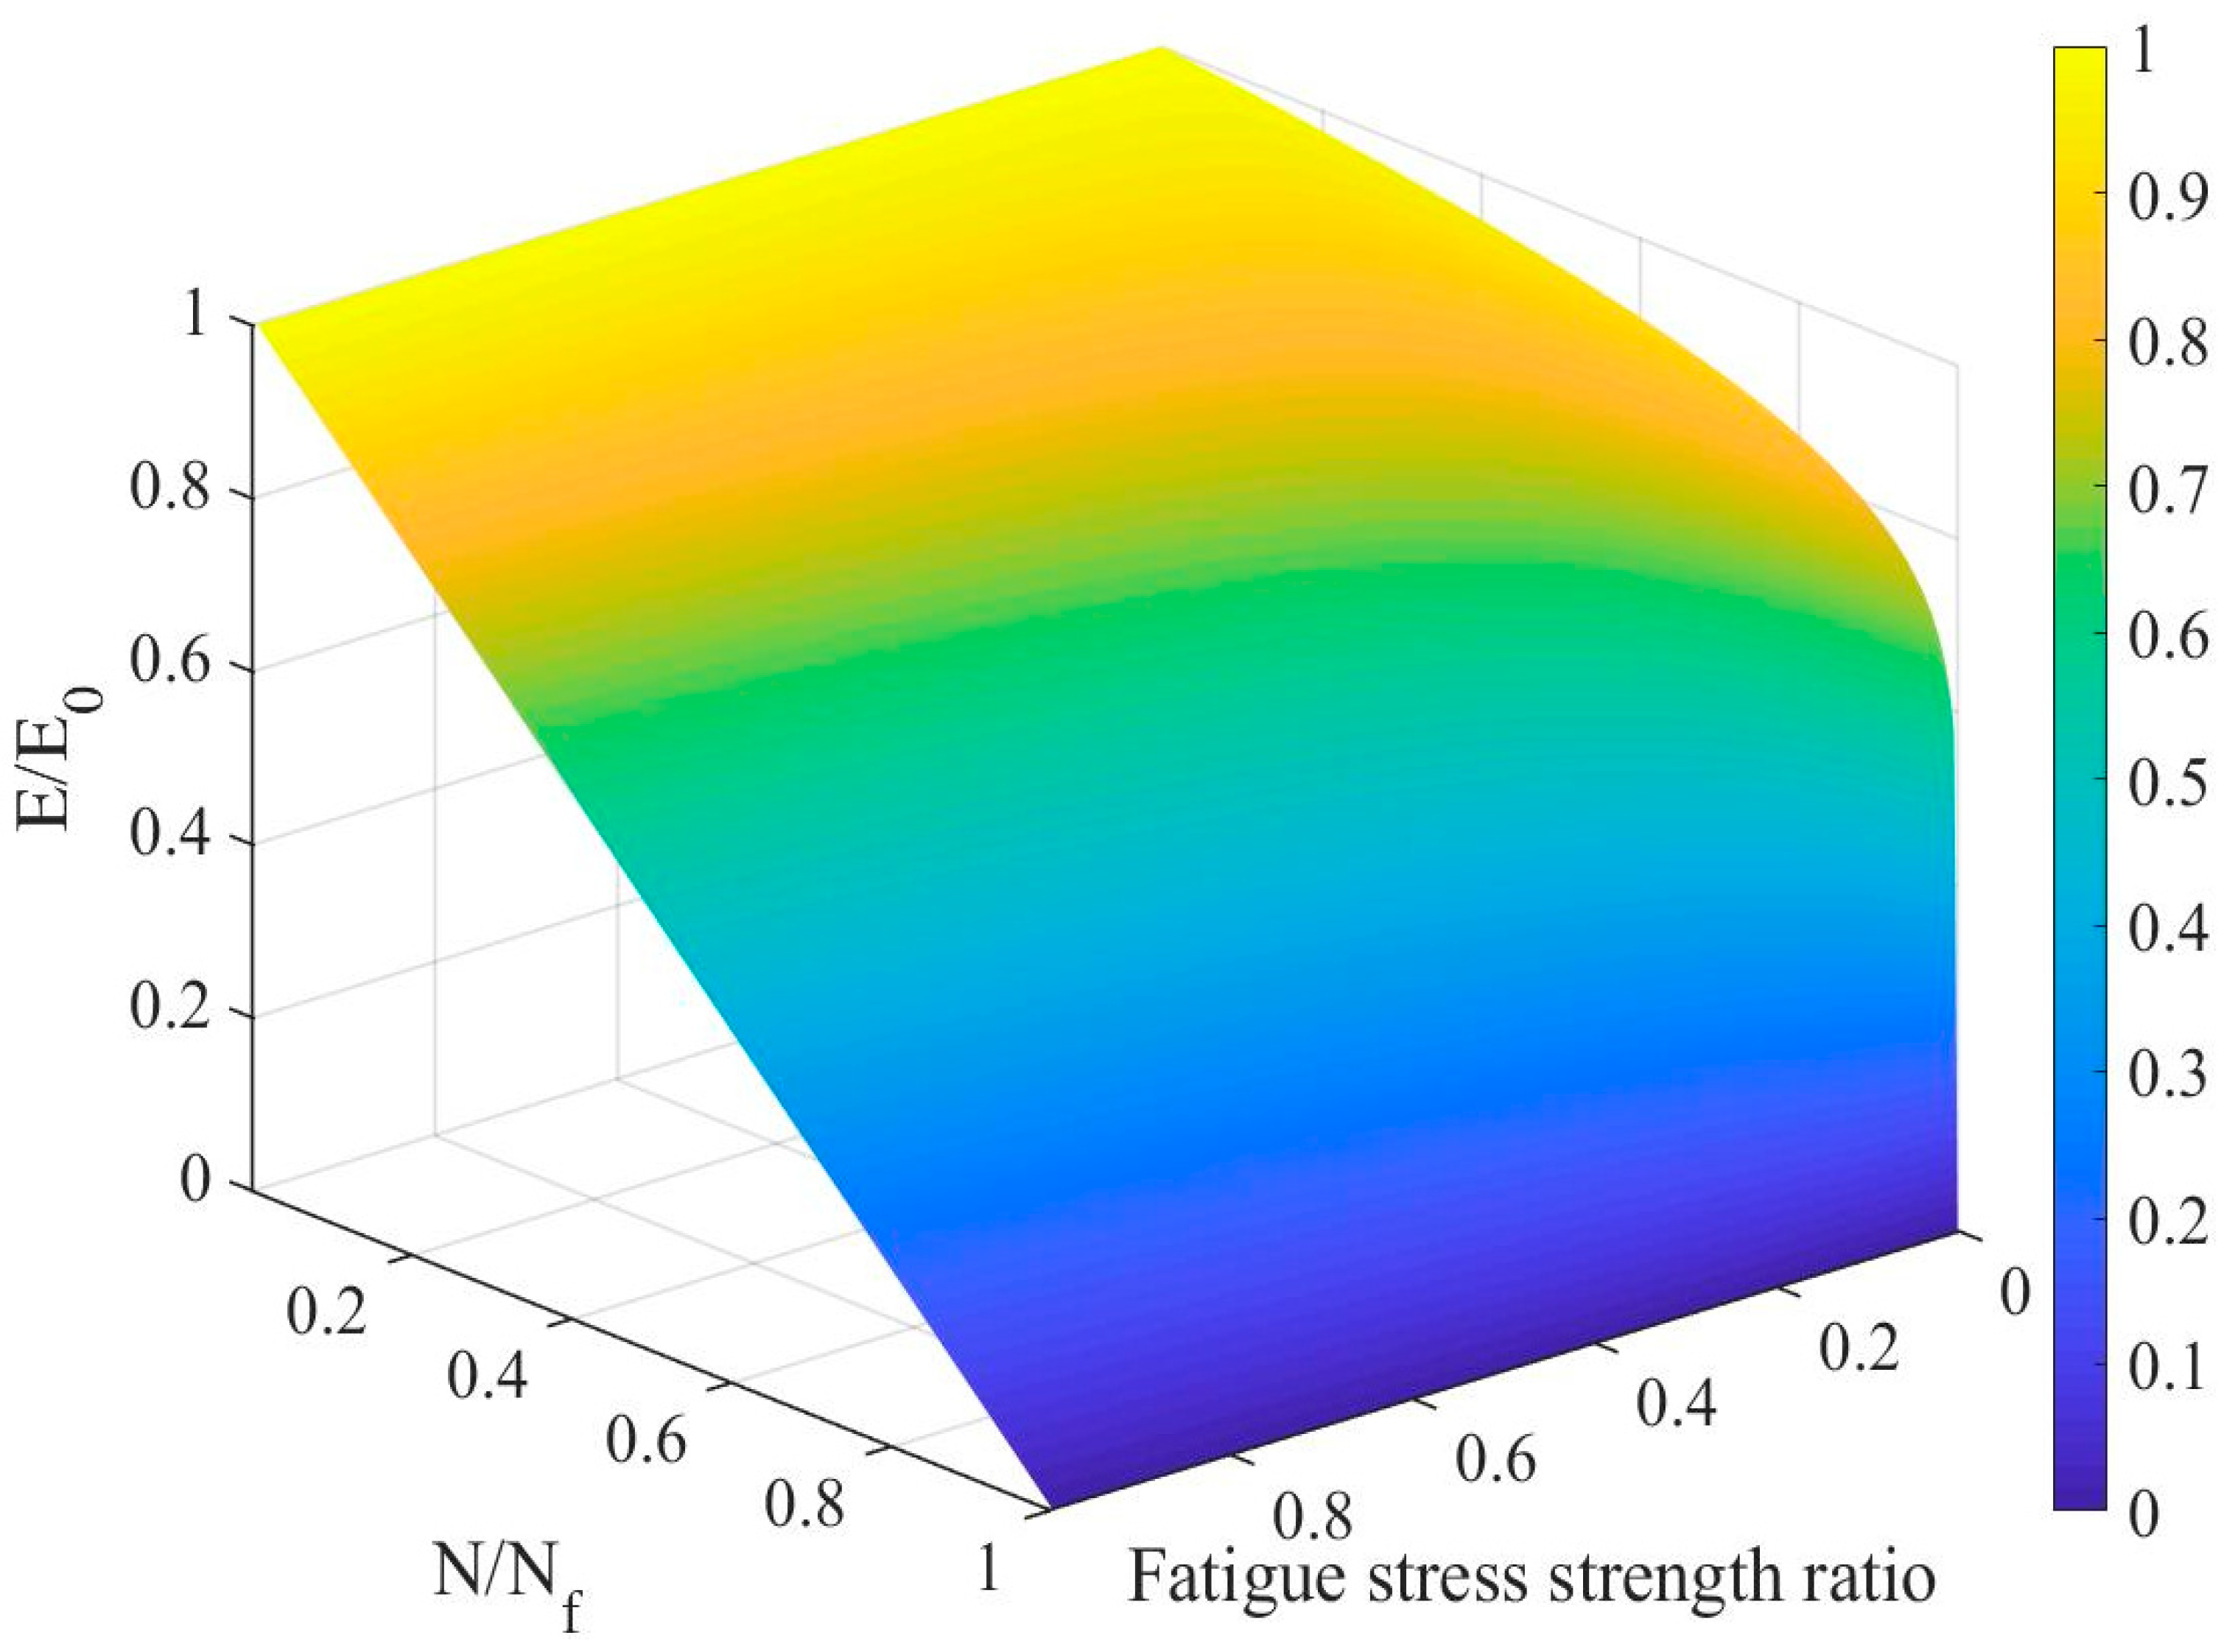
3.3.2. Establishment of the Modulus Decay Model under the 3-D Stress State
4. Conclusions
Author Contributions
Funding
Data Availability Statement
Conflicts of Interest
References
- Ge, Z.-S.; Huang, X.-M. Prediction of asphalt mixtures fatigue properties using damage mechanics. J. Traffic Transp. Eng. 2003, 3, 40–42. [Google Scholar]
- Chow, C.L.; Wei, Y. A model of continuum damage mechanics for fatigue failure. Int. J. Fract. 1991, 50, 301–316. [Google Scholar] [CrossRef]
- Ritchie, R.O.; Gilbert, C.J.; McNaney, J.M. Mechanics and mechanisms of fatigue damage and crack growth in advanced materials. Int. J. Solids Struct. 2000, 37, 311–329. [Google Scholar] [CrossRef]
- Xiao, J.Q.; Ding, D.X.; Jiang, F.L.; Xu, G. Fatigue damage variable and evolution of rock subjected to cyclic loading. Int. J. Rock Mech. Min. Sci. 2010, 47, 461–468. [Google Scholar] [CrossRef]
- Yang, S.; Park, H.; Baek, C.; Li, M.E. Fatigue Cracking Characteristics of Asphalt Pavement Structure under Aging and Moisture Damage. Sustainability 2023, 15, 4815. [Google Scholar] [CrossRef]
- Le, X.Q.; Nguyen, M.L.; Hornych, P.; Nguyen, Q.T. Analysis of LVE behaviour and fatigue damage evolution of asphalt pavements with different interface conditions in an accelerated full-scale experiment. Int. J. Pavement Eng. 2022. [Google Scholar] [CrossRef]
- Moreno-Navarro, F.; Rubio-Gámez, M.C. A review of fatigue damage in bituminous mixtures: Understanding the phenomenon from a new perspective. Constr. Build. Mater. 2016, 113, 927–938. [Google Scholar] [CrossRef]
- Liu, G.; Jia, Y.; Yang, T.; Du, H.; Zhang, J.; Zhao, Y. Fatigue performance evaluation of asphalt mixtures based on energy-controlled loading mode. Constr. Build. Mater. 2017, 157, 348–356. [Google Scholar] [CrossRef]
- Yao, Y.L.; Ren, Y.; Chen, S.F. Preventive maintenance timing of asphalt pavement. J. Chang. Univ. 2006, 26, 3438. [Google Scholar]
- Zheng, J.; Lu, S. Nonlinear Fatigue Damage Model for Asphalt Mixtures. China J. Highw. Transp. 2009, 22, 21–28. [Google Scholar]
- Zhou, Z.G.; Zhang, Q.P.; Yuan, X.X. Fatigue damage analysis of aspahlt mixture specimen during cyclic bending test. J. Cent. South Univ. Sci. Technol. 2011, 42, 1743–1751. [Google Scholar]
- Daniel, J.S.; Kim, Y.R. Laboratory Evaluation of Fatigue Damage and Healing of Asphalt Mixtures. J. Mater. Civ. Eng. 2001, 13, 434–440. [Google Scholar] [CrossRef]
- Shan, L.; Yang, H.; Guo, F.; Li, Z. Fatigue damage evolution in asphalt mixture based on X-ray CT images. Constr. Build. Mater. 2022, 358, 129242. [Google Scholar] [CrossRef]
- Izaks, R.; Rathore, M.; Haritonovs, V.; Zaumanis, M. Performance properties of high modulus asphalt concrete containing high reclaimed asphalt content and polymer modified binder. Int. J. Pavement Eng. 2022, 23, 2255–2264. [Google Scholar] [CrossRef]
- Lv, S.; Hu, L.; Xia, C.; Wang, X.; Borges Cabrera, M.; Guo, S.; Chen, J. Development of fatigue damage model of asphalt mixtures based on small-scale accelerated pavement test. Constr. Build. Mater. 2020, 260, 119930. [Google Scholar] [CrossRef]
- Rezazadeh Eidgahee, D.; Jahangir, H.; Solatifar, N.; Fakharian, P.; Rezaeemanesh, M. Data-driven estimation models of asphalt mixtures dynamic modulus using ANN, GP and combinatorial GMDH approaches. Neural Comput. Appl. 2022, 34, 17289–17314. [Google Scholar] [CrossRef]
- Vestena, P.M.; Schuster, S.L.; de Almeida, P.O., Jr.; Faccin, C.; Specht, L.P.; da Silva Pereira, D. Dynamic modulus master curve construction of asphalt mixtures: Error analysis in different models and field scenarios. Constr. Build. Mater. 2021, 301, 124343. [Google Scholar] [CrossRef]
- Wahengbam, R.D.; Rajbongshi, P. An approach for dynamic stiffness evaluation in asphalt concrete. Constr. Build. Mater. 2015, 96, 541–549. [Google Scholar] [CrossRef]
- Lv, S.; Yuan, J.; Liu, C.; Wang, J.; Li, J.; Zheng, J. Investigation of the fatigue modulus decay in cement stabilized base material by considering the difference between compressive and tensile modulus. Constr. Build. Mater. 2019, 223, 491–502. [Google Scholar] [CrossRef]
- Zhu, H.Z.; Yan, H.; Tang, B.M. Damage Model of Interaction Between Fatigue and Creep for Asphalt Mixture. China J. Highw. Transp. 2011, 24, 15–20. [Google Scholar]
- Lv, S.T.; Fan, X.Y.; Xia, C.D.; Zheng, J.L.; Chen, D.; You, L.Y. Characteristics of Moduli Decay for the Asphalt Mixture under Different Loading Conditions. Appl. Sci. 2018, 8, 840. [Google Scholar] [CrossRef]
- Liu, H.; Yang, X.; Xia, C.; Zheng, J.; Huang, T.; Lv, S. Nonlinear Fatigue Damage Model of Asphalt Mixture Based on Dynamic Modulus and Residual Strength Decay. Materials 2019, 12, 2236. [Google Scholar] [CrossRef]
- Zhu, J.; Ahmed, A.; Said, S.; Dinegdae, Y.; Lu, X. Experimental analysis and predictive modelling of linear viscoelastic response of asphalt mixture under dynamic shear loading. Constr. Build. Mater. 2022, 328, 127095. [Google Scholar] [CrossRef]
- Zhang, J.; Bao, L. Determination of asphalt mixture’s viscoelastic constitutive parameters for pavement response analysis using dynamic modulus transformation. Constr. Build. Mater. 2022, 315, 125729. [Google Scholar] [CrossRef]
- Wang, H.; Al-Qadi, I.L. Near-Surface Pavement Failure Under Multiaxial Stress State in Thick Asphalt Pavement. Transp. Res. Rec. 2010, 2154, 91–99. [Google Scholar] [CrossRef]
- Wang, W.; Zhao, K.; Li, J.; Luo, R.; Wang, L. Characterization of dynamic response of asphalt pavement in dry and saturated conditions using the full-scale accelerated loading test. Constr. Build. Mater. 2021, 312, 125355. [Google Scholar] [CrossRef]
- Liu, Z.; Gu, X. Performance evaluation of full-scale accelerated pavement using NDT and laboratory tests: A case study in Jiangsu, China. Case Stud. Constr. Mater. 2023, 18, e02083. [Google Scholar] [CrossRef]
- Ahmed, A.W.; Erlingsson, S. Numerical validation of viscoelastic responses of a pavement structure in a full-scale accelerated pavement test. Int. J. Pavement Eng. 2017, 18, 47–59. [Google Scholar] [CrossRef]
- Lv, S.; Wang, Z.; Zhu, X.; Yuan, J.; Peng, X. Research on strength and fatigue properties of asphalt mixture with different gradation curves. Constr. Build. Mater. 2023, 364, 129872. [Google Scholar] [CrossRef]
- JTG E20-2011; Standard Test Methods of Asphalt and Asphalts Mixtures for Highway Engineering. Renmin Communication Press: Beijing, China, 2011.
- JTG F40-2004; Technical Spcifications for Construction of Highway Asphalt Pavements. Renmin Communication Press: Beijing, China, 2004.
- Wang, F.; Li, Y.; Ma, G.; Ren, L. Pavement Performance and Application of New SAC13 Asphalt Mixture. Road Mach. Constr. Mech. 2009, 26, 39–42. [Google Scholar]
- Huang, Y.; Wang, X.D.; Liu, Z.H.; Zhou, X.Y.; Zhang, L. Experimental study on dynamic modulus of SAC-13 asphalt mixture with trapezoid beam test. J. Highw. Transp. Res. Dev. 2017, 34, 7–14. [Google Scholar]
- Xue, Z. Pavement Performance Study on Long Life Pavement of SAC-13. Highway 2013, 58, 40–44. [Google Scholar]
- Huang, W.; Huang, M.; Zheng, M.; Li, Y. Air void variation of asphalt rubber mixture grade SAC-13. J. Tongji Univ. 2012, 40, 685–690. [Google Scholar]
- Wang, F.Y.; Sha, Q.L.; Zhang, Y.; Dai, W.T. Application of aggregate gradation test methods of VCA_(DRF) and VCA_(AC) for SAC13. J. Jilin Univ. 2007, 7, 538–543. [Google Scholar]
- Bai, J.W.; Zhao, Y.R.; Shi, J.; He, X.Y. Damage degradation model of aeolian sand concrete under freeze-thaw cycles based on macro-microscopic perspective. Constr. Build. Mater. 2022, 327, 126885. [Google Scholar] [CrossRef]
- Fernández-Canteli, A.; Castillo, E.; Blasón, S. A methodology for phenomenological analysis of cumulative damage processes. Application to fatigue and fracture phenomena. Int. J. Fatigue 2021, 150, 106311. [Google Scholar] [CrossRef]
- Wang, Z.; Lu, W.; Liu, K.; Lv, S.; Peng, X.; Yang, S.; Ding, S. Research on failure strength master curve and fatigue performance of asphalt mixture containing high-proportion reclaimed asphalt pavement. Constr. Build. Mater. 2023, 370, 130537. [Google Scholar] [CrossRef]


| Test Items | Test Results | Indicator Requirements | Specifications | |
|---|---|---|---|---|
| Penetration 25 °C, 100 g, 5 s (0.1 mm) | 62 | 60~80 | T 0604-2011 | |
| Ductility 5 cm/min, 5 °C (cm) | 16 | ≥15 | T 0605-2011 | |
| Softening point (°C) | 72.5 | ≥55 | T 0606-2011 | |
| Dynamic viscosity 180 °C (Pa·s) | 2.8 | 1~4 | T 0625-2011 | |
| Elastic recovery 25 °C (%) | 84 | ≥55 | T 0662-2000 | |
| 48 h softening point difference (°C) | 2.0 | ≤5.5 | T 0661-2011 | |
| Residue after TFOT (163 °C, 85 min) | Mass loss (%) | −0.29 | ≤±0.8 | T 0610-2011 |
| Residual penetration ratio 25 °C (%) | 77 | ≥60 | T 0604-2011 | |
| Residual ductility 5 °C (cm) | 11 | ≥10 | T 0605-2011 | |
| Particle Size (mm) | Apparent Relative Density (g/cm3) | Gross Volume Relative Density (g/cm3) | Water Absorption (%) |
|---|---|---|---|
| 13.2~9.5 | 2.692 | 2.619 | 0.42 |
| 9.5~4.75 | 2.686 | 2.562 | 0.46 |
| 4.75~2.36 | 2.655 | 2.554 | 1.06 |
| 2.36~1.18 | 2.632 | 2.612 | 1.29 |
| 1.18~0.6 | 2.625 | 2.607 | 1.31 |
| 0.6~0.3 | 2.618 | 2.596 | 1.34 |
| 0.3~0.15 | 2.602 | 2.588 | 1.53 |
| 0.15~0.075 | 2.618 | 2.605 | 1.58 |
| Test Items | Crushing Value (%) | Polishing Value (BPN) | Abrasion Value (%) |
|---|---|---|---|
| Results | 15.8 | 57.4 | 19.9 |
| Technical indicators | ≤28 | ≥45 | ≤30 |
| Test Items | Test Results | Technical Indicators | |
|---|---|---|---|
| Apparent relative density (g/cm3) | 2.688 | ≥2.50 | |
| Water content (%) | 0.4 | ≤1 | |
| Apparent property | No agglomeration | — | |
| Hydrophilic coefficient | 0.57 | <1 | |
| Plasticity index (%) | 2.2 | <4 | |
| Particle size (%) | <0.6 mm | 100 | 100 |
| <0.15 mm | 95.2 | 90~100 | |
| <0.075 mm | 84.4 | 75~100 | |
| Asphalt–Aggregate Ratio (%) | Bulk Density (g/cm3) | Volume of Air Voids VV (%) | Voids in Mineral Aggregate VMA (%) | Voids Filled with Asphalt VFA (%) | Marshall Stability MS (kN) | Flow Value FL (mm) | Dynamic Stability DS (time/mm) |
|---|---|---|---|---|---|---|---|
| 5.5 | 2.512 | 3.91 | 13.89 | 71.78 | 12.71 | 3.9 | 9581 |
| Loading Modes | Displacement-Controlled Strength (MPa) | Mean Strength (MPa) | Coefficient of Variation (%) |
|---|---|---|---|
| DT | 1.043/1.138/1.032 | 1.071 | 5.442 |
| IDT | 2.192/2.064/2.284 | 2.180 | 5.068 |
| UC | 7.732/7.029/7.583 | 7.448 | 4.974 |
| Loading Rate (MPa/s) | DT | IDT | UC | |||
|---|---|---|---|---|---|---|
| Mean Strength (MPa) | Coefficient of Variation (%) | Mean Strength (MPa) | Coefficient of Variation (%) | Mean Strength (MPa) | Coefficient of Variation (%) | |
| 0.02 | 0.928 | 6.819 | 0.931 | 4.988 | 6.525 | 9.982 |
| 0.05 | 1.162 | 7.066 | 1.132 | 8.896 | 7.036 | 5.849 |
| 0.1 | 1.537 | 4.988 | 1.185 | 7.494 | 8.315 | 5.430 |
| 0.5 | 1.987 | 5.125 | 1.859 | 9.116 | 10.303 | 4.566 |
| 1.0 | 2.155 | 5.882 | 2.113 | 5.100 | 12.348 | 5.670 |
| 2.0 | 2.439 | 6.534 | 2.214 | 9.853 | 12.712 | 5.225 |
| 4.0 | 3.319 | 7.115 | 2.358 | 7.303 | 14.594 | 8.024 |
| 6.0 | 3.407 | 8.310 | 2.915 | 5.585 | 14.978 | 5.837 |
| DT | IDT | UC | |||||||||
|---|---|---|---|---|---|---|---|---|---|---|---|
| CV | CV | CV | |||||||||
| 0.2 | 0.187 | 934,042 | 10.350 | 0.2 | 0.092 | 699,521 | 9.137 | 1.5 | 0.134 | 722,354 | 12.562 |
| 0.4 | 0.373 | 61,249 | 16.107 | 0.4 | 0.183 | 21,498 | 13.737 | 2.0 | 0.201 | 280,096 | 15.050 |
| 0.6 | 0.560 | 19,905 | 15.983 | 0.6 | 0.275 | 5115 | 8.491 | 2.5 | 0.269 | 41,052 | 8.834 |
| 0.8 | 0.747 | 7889 | 21.118 | 0.8 | 0.367 | 1205 | 14.842 | 3.0 | 0.336 | 11,884 | 11.396 |
| 1.0 | 0.934 | 3503 | 13.354 | 1.0 | 0.459 | 519 | 11.666 | 3.5 | 0.403 | 6268 | 9.785 |
| Stress Levels (MPa) | Nominal Stress Ratio | Value | Mean of Values | Coefficient of Variation (%) |
|---|---|---|---|---|
| 0.2 | 0.187 | 0.418/0.389/0.395/0.456 | 0.415 | 7.345 |
| 0.4 | 0.373 | 0.499/0.443/0.524/0.501 | 0.492 | 6.997 |
| 0.6 | 0.560 | 0.574/0.527/0.541/0.634 | 0.569 | 8.354 |
| 0.8 | 0.747 | 0.598/0.568/0.563/0.607 | 0.584 | 3.752 |
| 1.0 | 0.934 | 0.655/0.617/0.621/0.673 | 0.642 | 4.226 |
| Stress Levels (MPa) | Nominal Stress Ratio | Value | Mean of Values | Coefficient of Variation (%) |
|---|---|---|---|---|
| 0.2 | 0.092 | 0.446/0.432/0.488/0.431 | 0.449 | 5.960 |
| 0.4 | 0.183 | 0.575/0.524/0.548/0.625 | 0.568 | 7.606 |
| 0.6 | 0.275 | 0.602/0.615/0.641/0.553 | 0.603 | 6.097 |
| 0.8 | 0.367 | 0.626/0.593/0.577/0.668 | 0.616 | 6.551 |
| 1.0 | 0.459 | 0.669/0.636/0.659/0.696 | 0.665 | 3.726 |
| Stress Levels (MPa) | Nominal Stress Ratio | Value | Mean of Values | Coefficient of Variation (%) |
|---|---|---|---|---|
| 1.5 | 0.134 | 0.397/0.436/0.395/0.389 | 0.404 | 5.281 |
| 2.0 | 0.201 | 0.423/0.415/0.436/0.438 | 0.428 | 2.547 |
| 2.5 | 0.269 | 0.465/0.431/0.446/0.522 | 0.466 | 8.550 |
| 3.0 | 0.336 | 0.495/0.488/0.521/0.514 | 0.504 | 3.093 |
| 3.5 | 0.403 | 0.509/0.547/0.486/0.520 | 0.516 | 4.916 |
| Loading Modes | Stress Levels (MPa) | ||||
|---|---|---|---|---|---|
| DT | 0 | 0 | |||
| IDT | 0 | ||||
| UC | 0 | 0 |
| Loading Modes | Stress-Controlled | ||||
|---|---|---|---|---|---|
| DT | 0 | 0 | |||
| IDT | 0 | ||||
| UC | 0 | 0 |
| Loading Modes | Stress Level (Mpa) | Loading Rate (MPa/s) | Ultimate Strength (Mpa) | Δ | ||
|---|---|---|---|---|---|---|
| DT | 0.2 | 4 | 3.056 | 0.2 | 3.056 | 0.065 |
| 0.4 | 8 | 3.543 | 0.4 | 3.543 | 0.113 | |
| 0.6 | 12 | 3.862 | 0.6 | 3.862 | 0.155 | |
| 0.8 | 16 | 4.106 | 0.8 | 4.106 | 0.195 | |
| 1 | 20 | 4.306 | 1 | 4.306 | 0.232 | |
| IDT | 0.2 | 4 | 2.613 | 0.721 | 9.421 | 0.077 |
| 0.4 | 8 | 2.991 | 1.442 | 10.784 | 0.134 | |
| 0.6 | 12 | 3.237 | 2.163 | 11.672 | 0.185 | |
| 0.8 | 16 | 3.424 | 2.884 | 12.345 | 0.234 | |
| 1 | 20 | 3.576 | 3.606 | 12.894 | 0.280 | |
| UC | 1.5 | 30 | 19.589 | 1.5 | 19.589 | 0.077 |
| 2 | 40 | 20.476 | 2 | 20.476 | 0.098 | |
| 2.5 | 50 | 21.192 | 2.5 | 21.192 | 0.118 | |
| 3 | 60 | 21.796 | 3 | 21.796 | 0.138 | |
| 3.5 | 70 | 22.319 | 3.5 | 22.319 | 0.157 |
| Loading Modes | Stress Level (Mpa) | Fatigue Stress Strength Ratio Δ | Modulus Decay Equation Parameter |
|---|---|---|---|
| DT | 0.2 | 0.065 | 0.415 |
| 0.4 | 0.113 | 0.492 | |
| 0.6 | 0.155 | 0.569 | |
| 0.8 | 0.195 | 0.584 | |
| 1 | 0.232 | 0.642 | |
| IDT | 0.2 | 0.077 | 0.449 |
| 0.4 | 0.134 | 0.568 | |
| 0.6 | 0.185 | 0.603 | |
| 0.8 | 0.234 | 0.616 | |
| 1 | 0.280 | 0.665 | |
| UC | 1.5 | 0.077 | 0.404 |
| 2 | 0.098 | 0.428 | |
| 2.5 | 0.118 | 0.466 | |
| 3 | 0.138 | 0.504 | |
| 3.5 | 0.157 | 0.516 |
Disclaimer/Publisher’s Note: The statements, opinions and data contained in all publications are solely those of the individual author(s) and contributor(s) and not of MDPI and/or the editor(s). MDPI and/or the editor(s) disclaim responsibility for any injury to people or property resulting from any ideas, methods, instructions or products referred to in the content. |
© 2023 by the authors. Licensee MDPI, Basel, Switzerland. This article is an open access article distributed under the terms and conditions of the Creative Commons Attribution (CC BY) license (https://creativecommons.org/licenses/by/4.0/).
Share and Cite
He, Y.; Lv, S.; Wang, Z.; Ma, H.; Lei, W.; Pu, C.; Meng, H.; Xie, N.; Peng, X. Research on the Modulus Decay Model under a Three-Dimensional Stress State of Asphalt Mixture during Fatigue Damage. Buildings 2023, 13, 2570. https://doi.org/10.3390/buildings13102570
He Y, Lv S, Wang Z, Ma H, Lei W, Pu C, Meng H, Xie N, Peng X. Research on the Modulus Decay Model under a Three-Dimensional Stress State of Asphalt Mixture during Fatigue Damage. Buildings. 2023; 13(10):2570. https://doi.org/10.3390/buildings13102570
Chicago/Turabian StyleHe, Yonghai, Songtao Lv, Ziyang Wang, Huabao Ma, Wei Lei, Changyu Pu, Huilin Meng, Nasi Xie, and Xinghai Peng. 2023. "Research on the Modulus Decay Model under a Three-Dimensional Stress State of Asphalt Mixture during Fatigue Damage" Buildings 13, no. 10: 2570. https://doi.org/10.3390/buildings13102570
APA StyleHe, Y., Lv, S., Wang, Z., Ma, H., Lei, W., Pu, C., Meng, H., Xie, N., & Peng, X. (2023). Research on the Modulus Decay Model under a Three-Dimensional Stress State of Asphalt Mixture during Fatigue Damage. Buildings, 13(10), 2570. https://doi.org/10.3390/buildings13102570