
Prediction Model of Shrinkage Crack Propagation in Cross-Section of Timber Components

Abstract
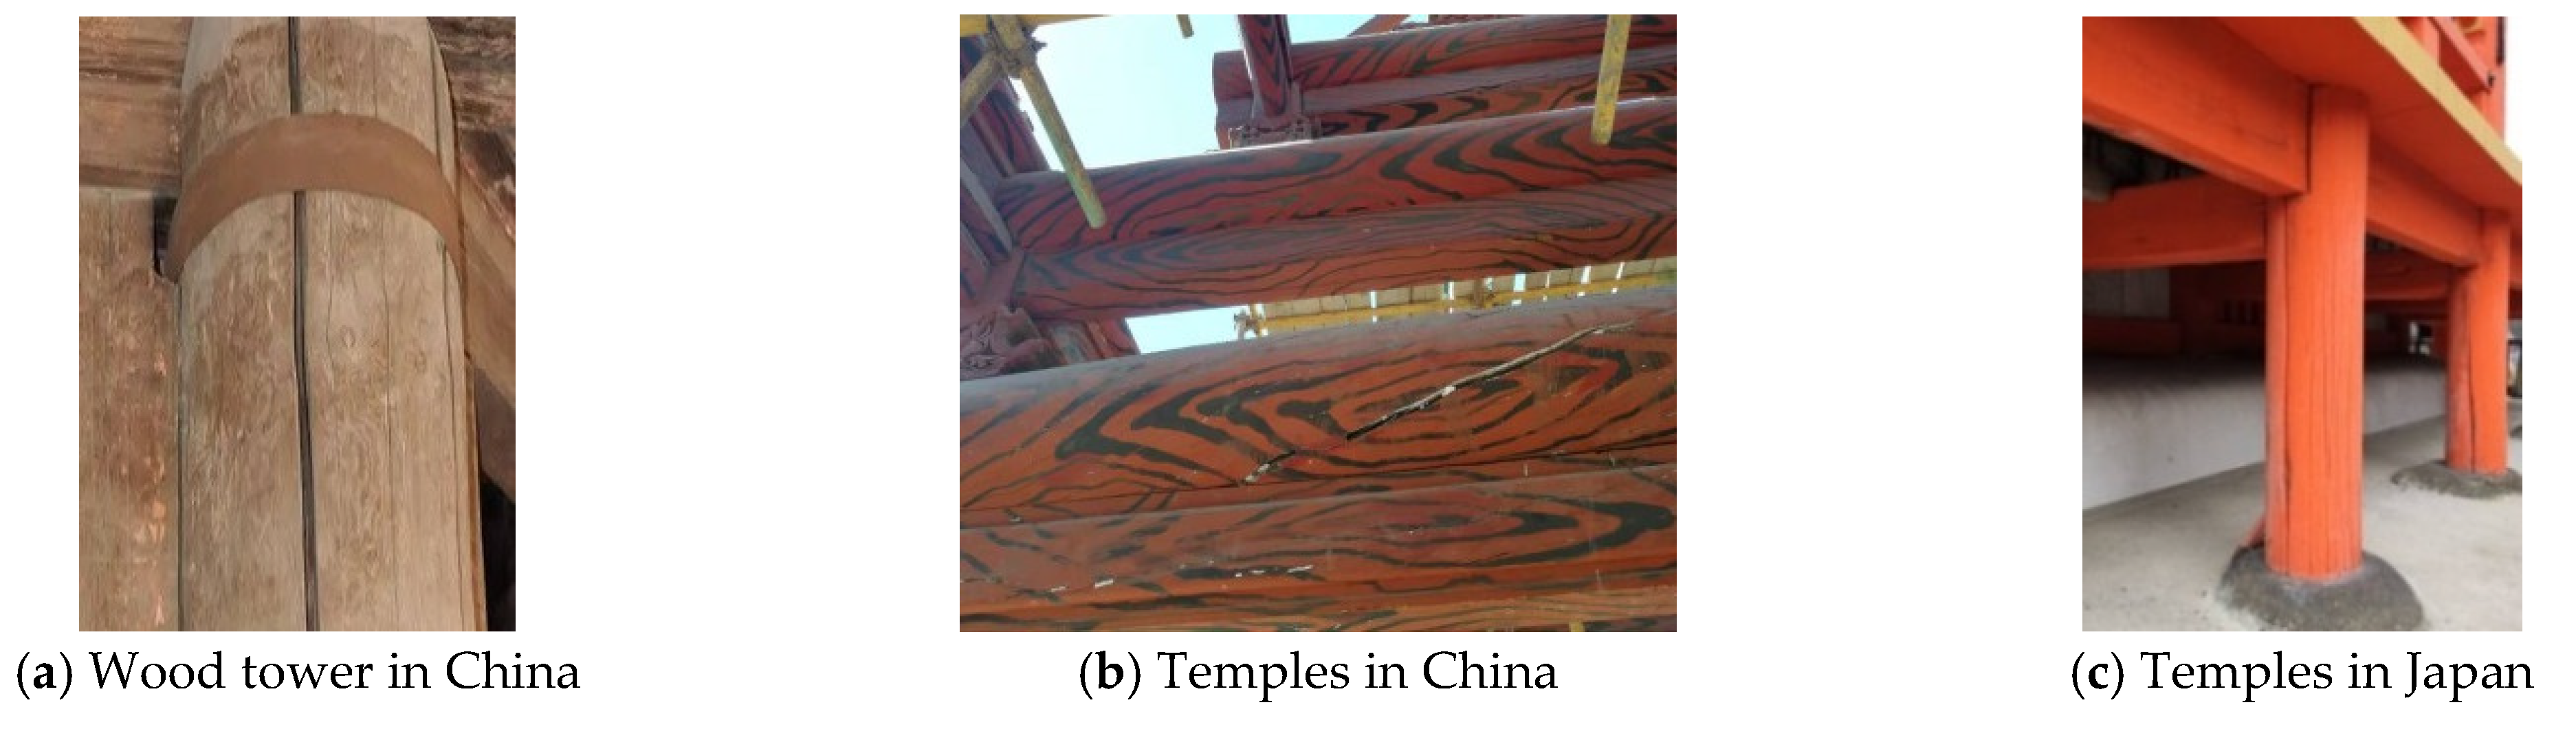
1. Introduction
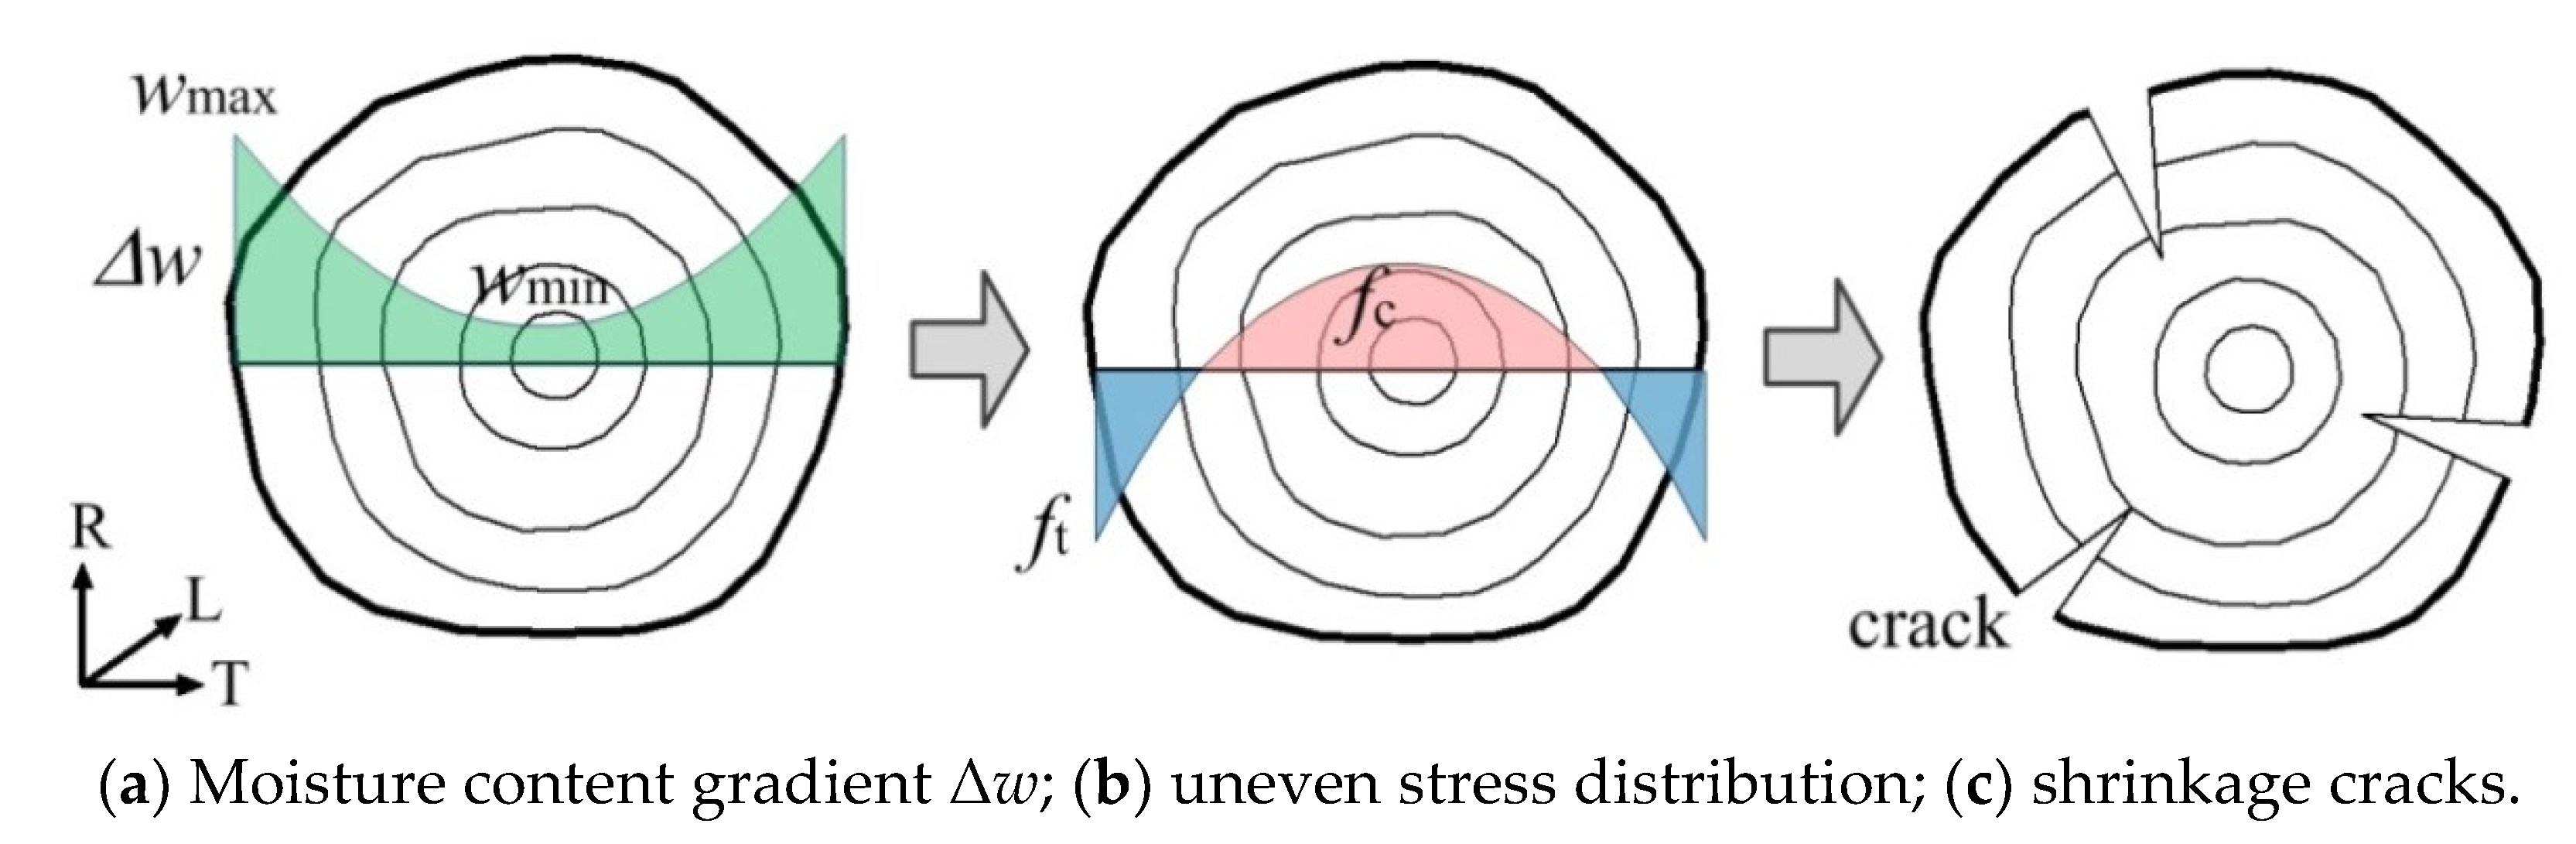
2. Humidity Stress Distribution
2.1. Analytical Solution of Stress Distribution
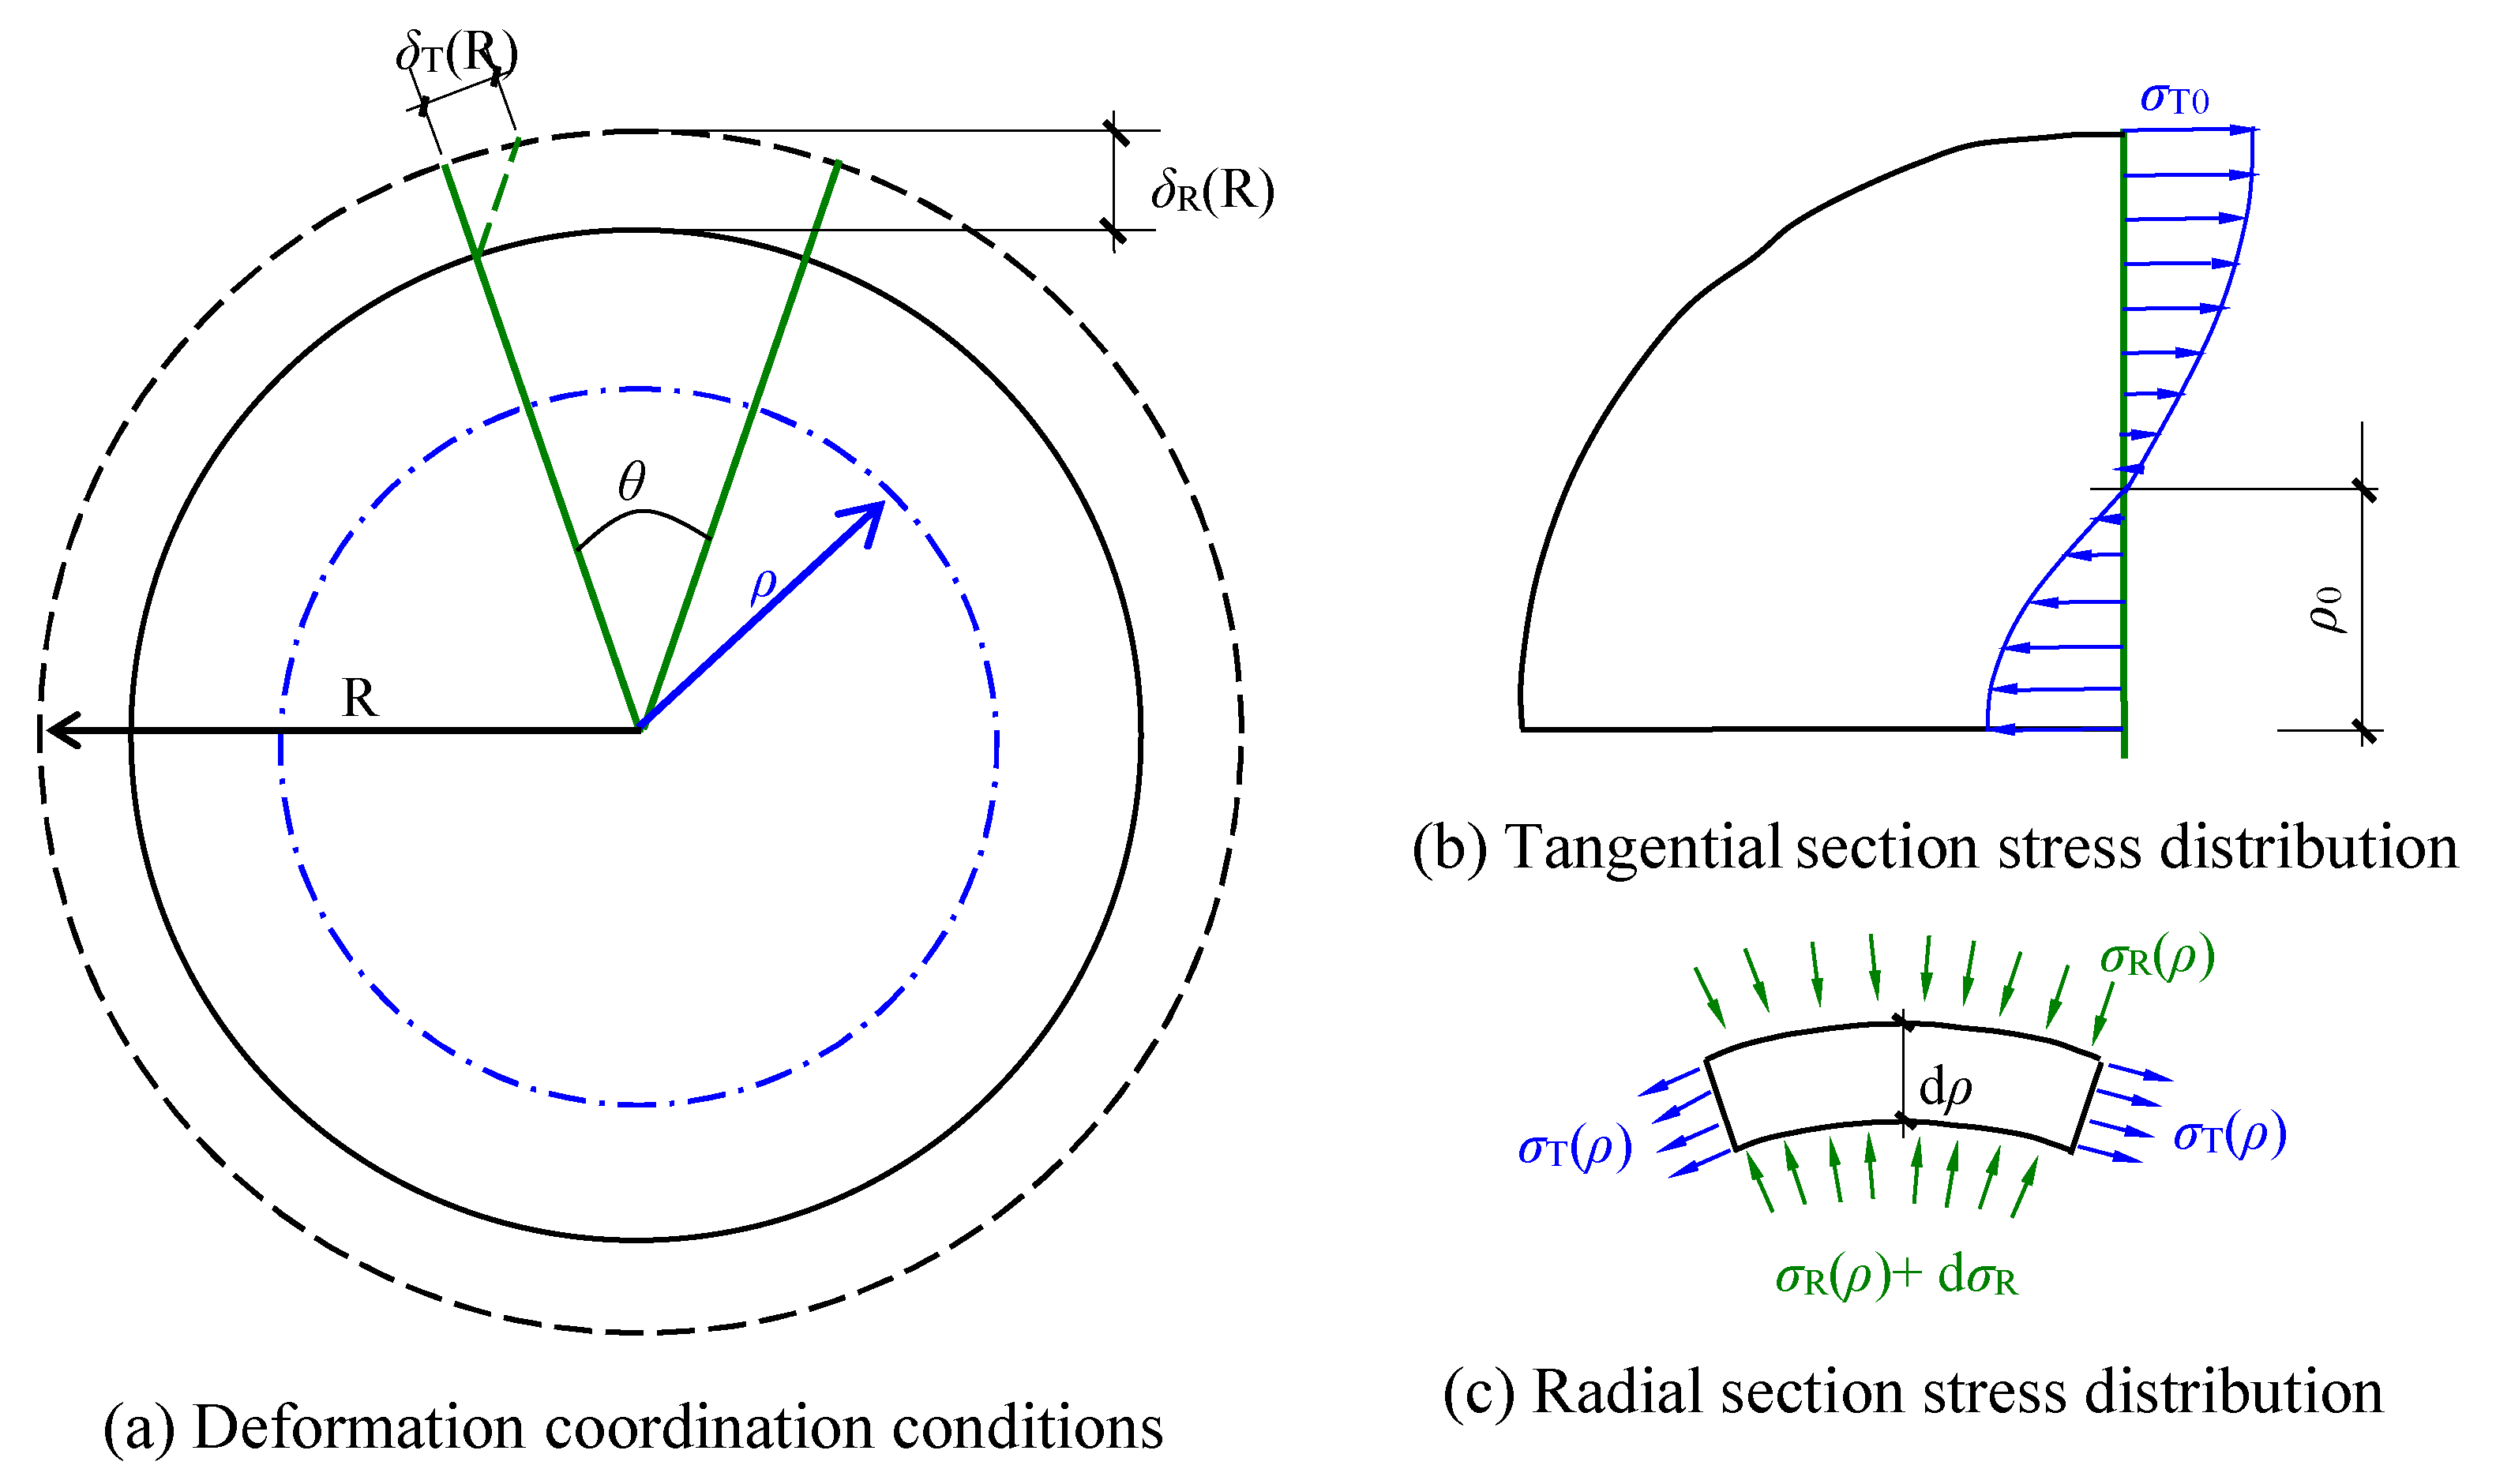
2.1.1. Balance Condition
2.1.2. Constitutional Relationship
2.1.3. Geometric Condition
2.1.4. Fundamental Equation
2.1.5. Boundary Conditions
2.1.6. Solution
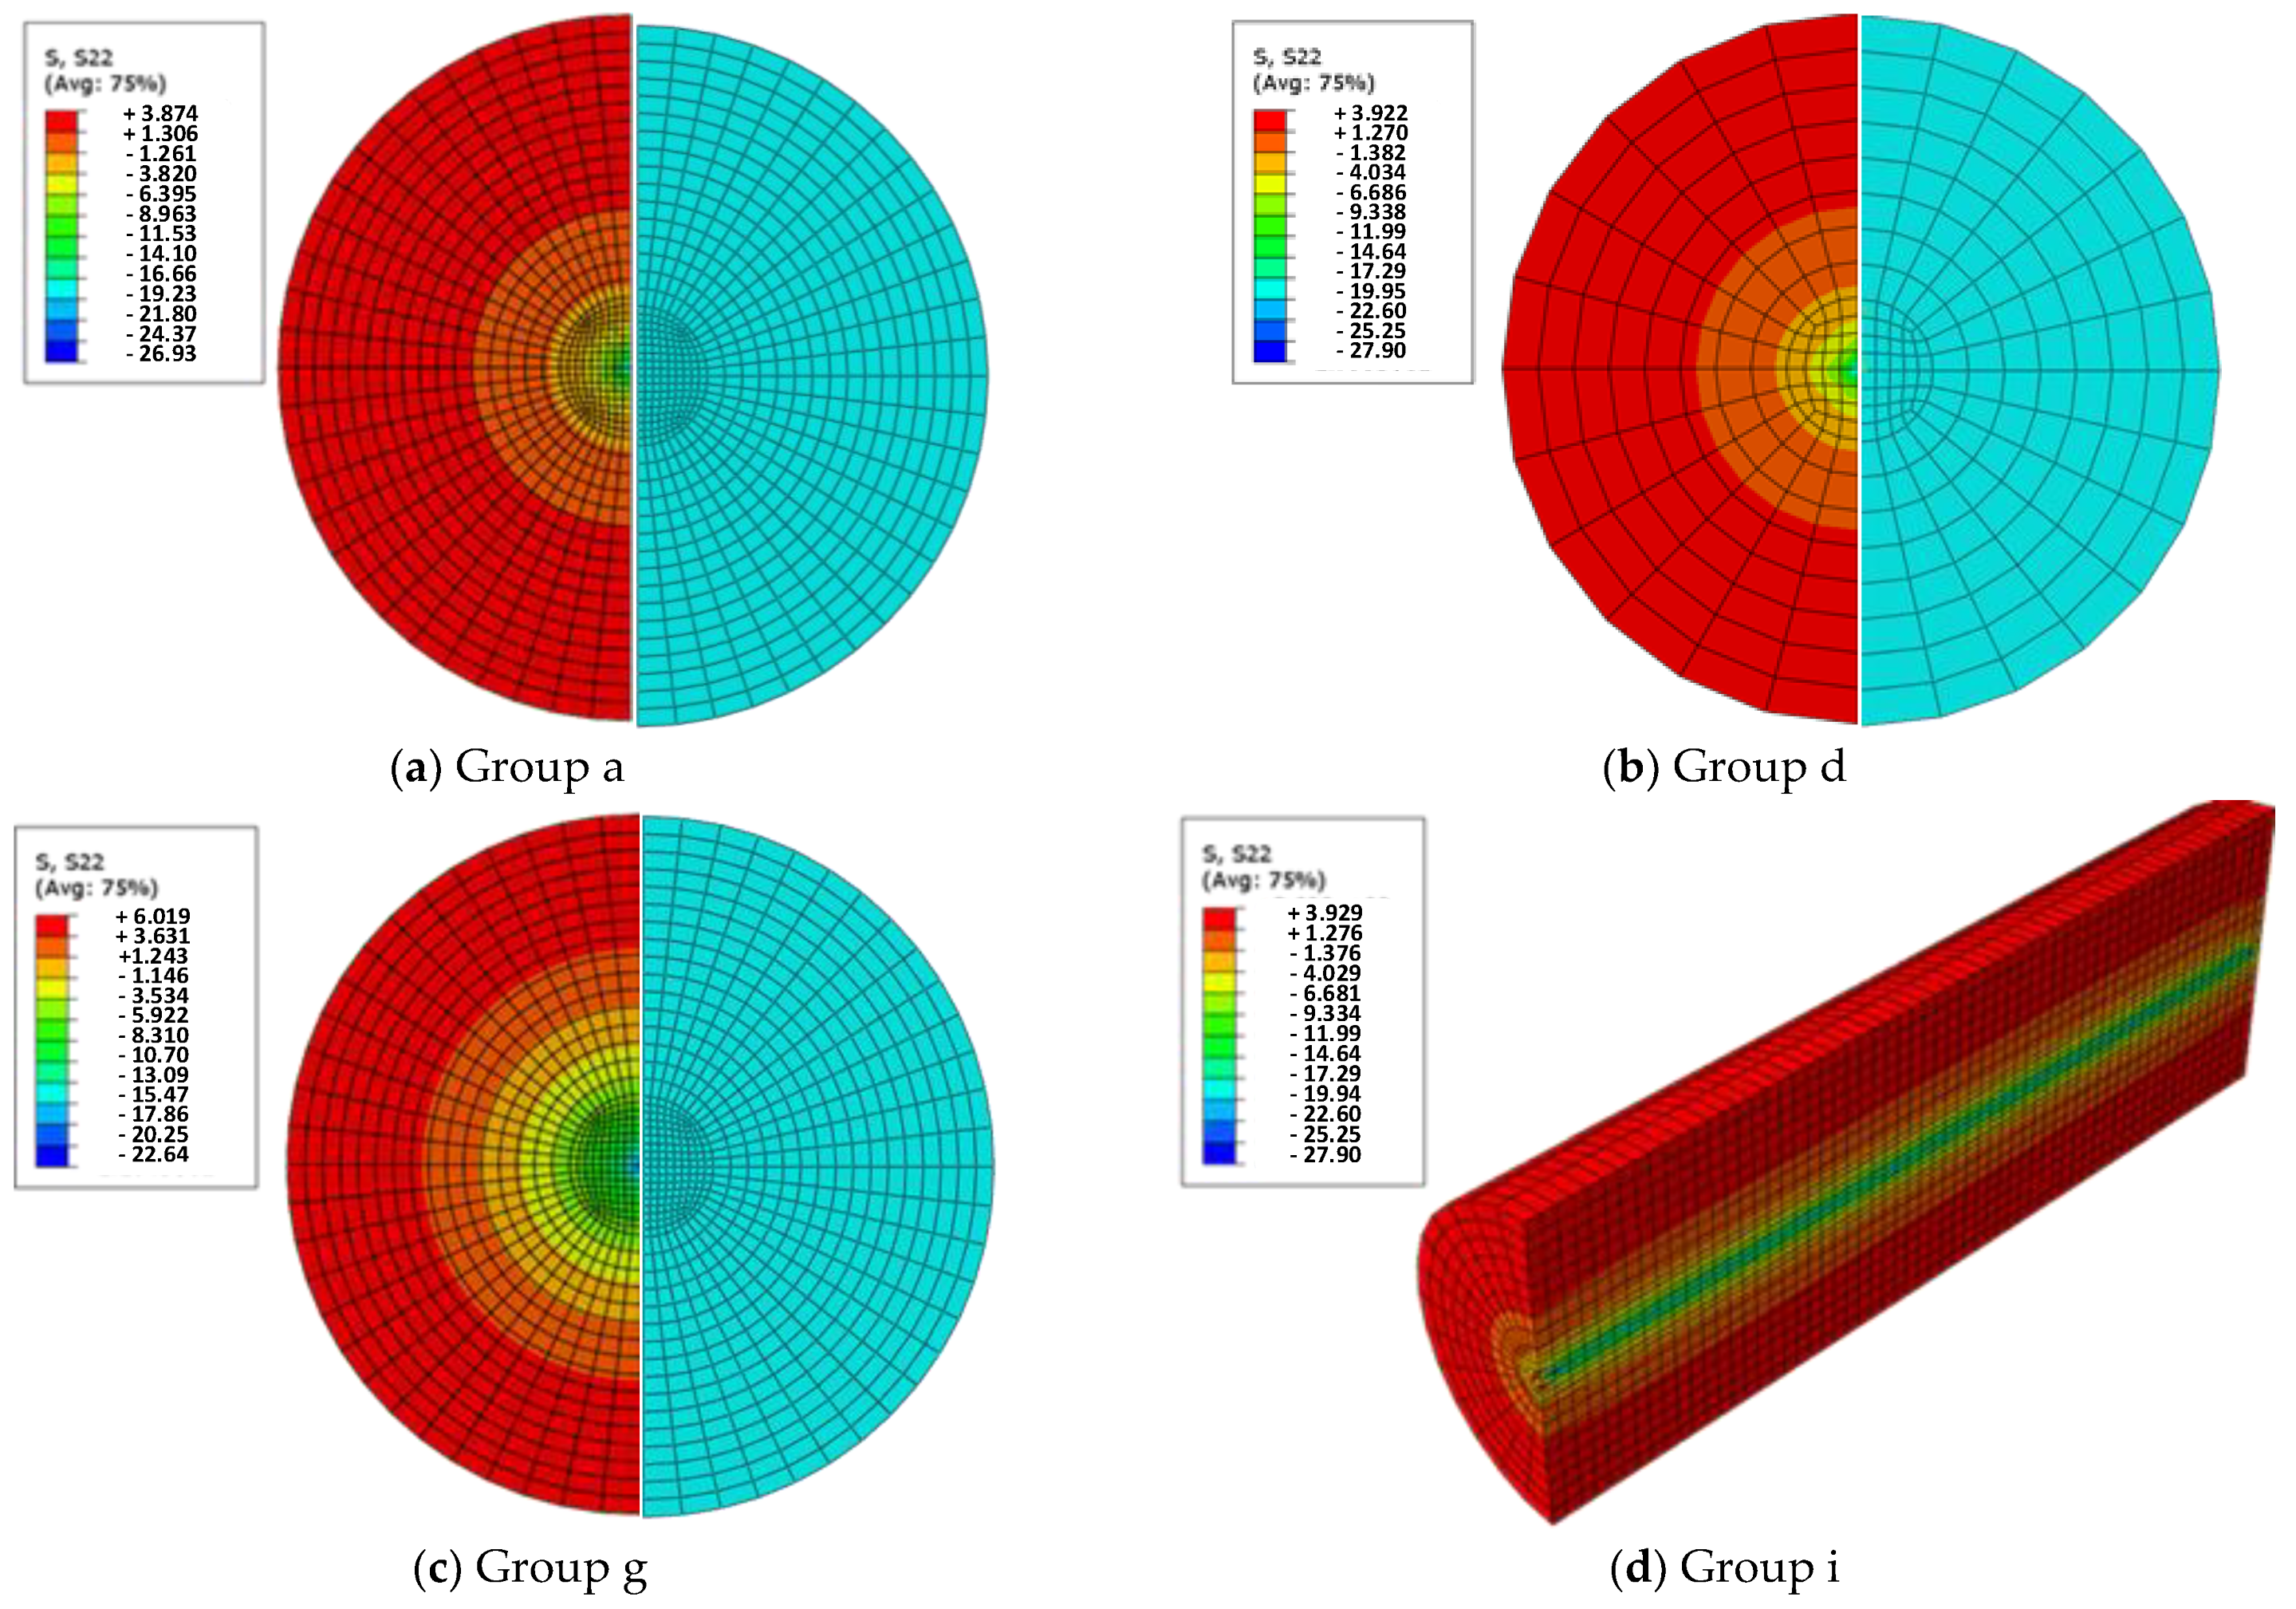
2.2. Numerical Simulation of Stress Distribution
3. Prediction of Dry Shrinkage Crack Depth
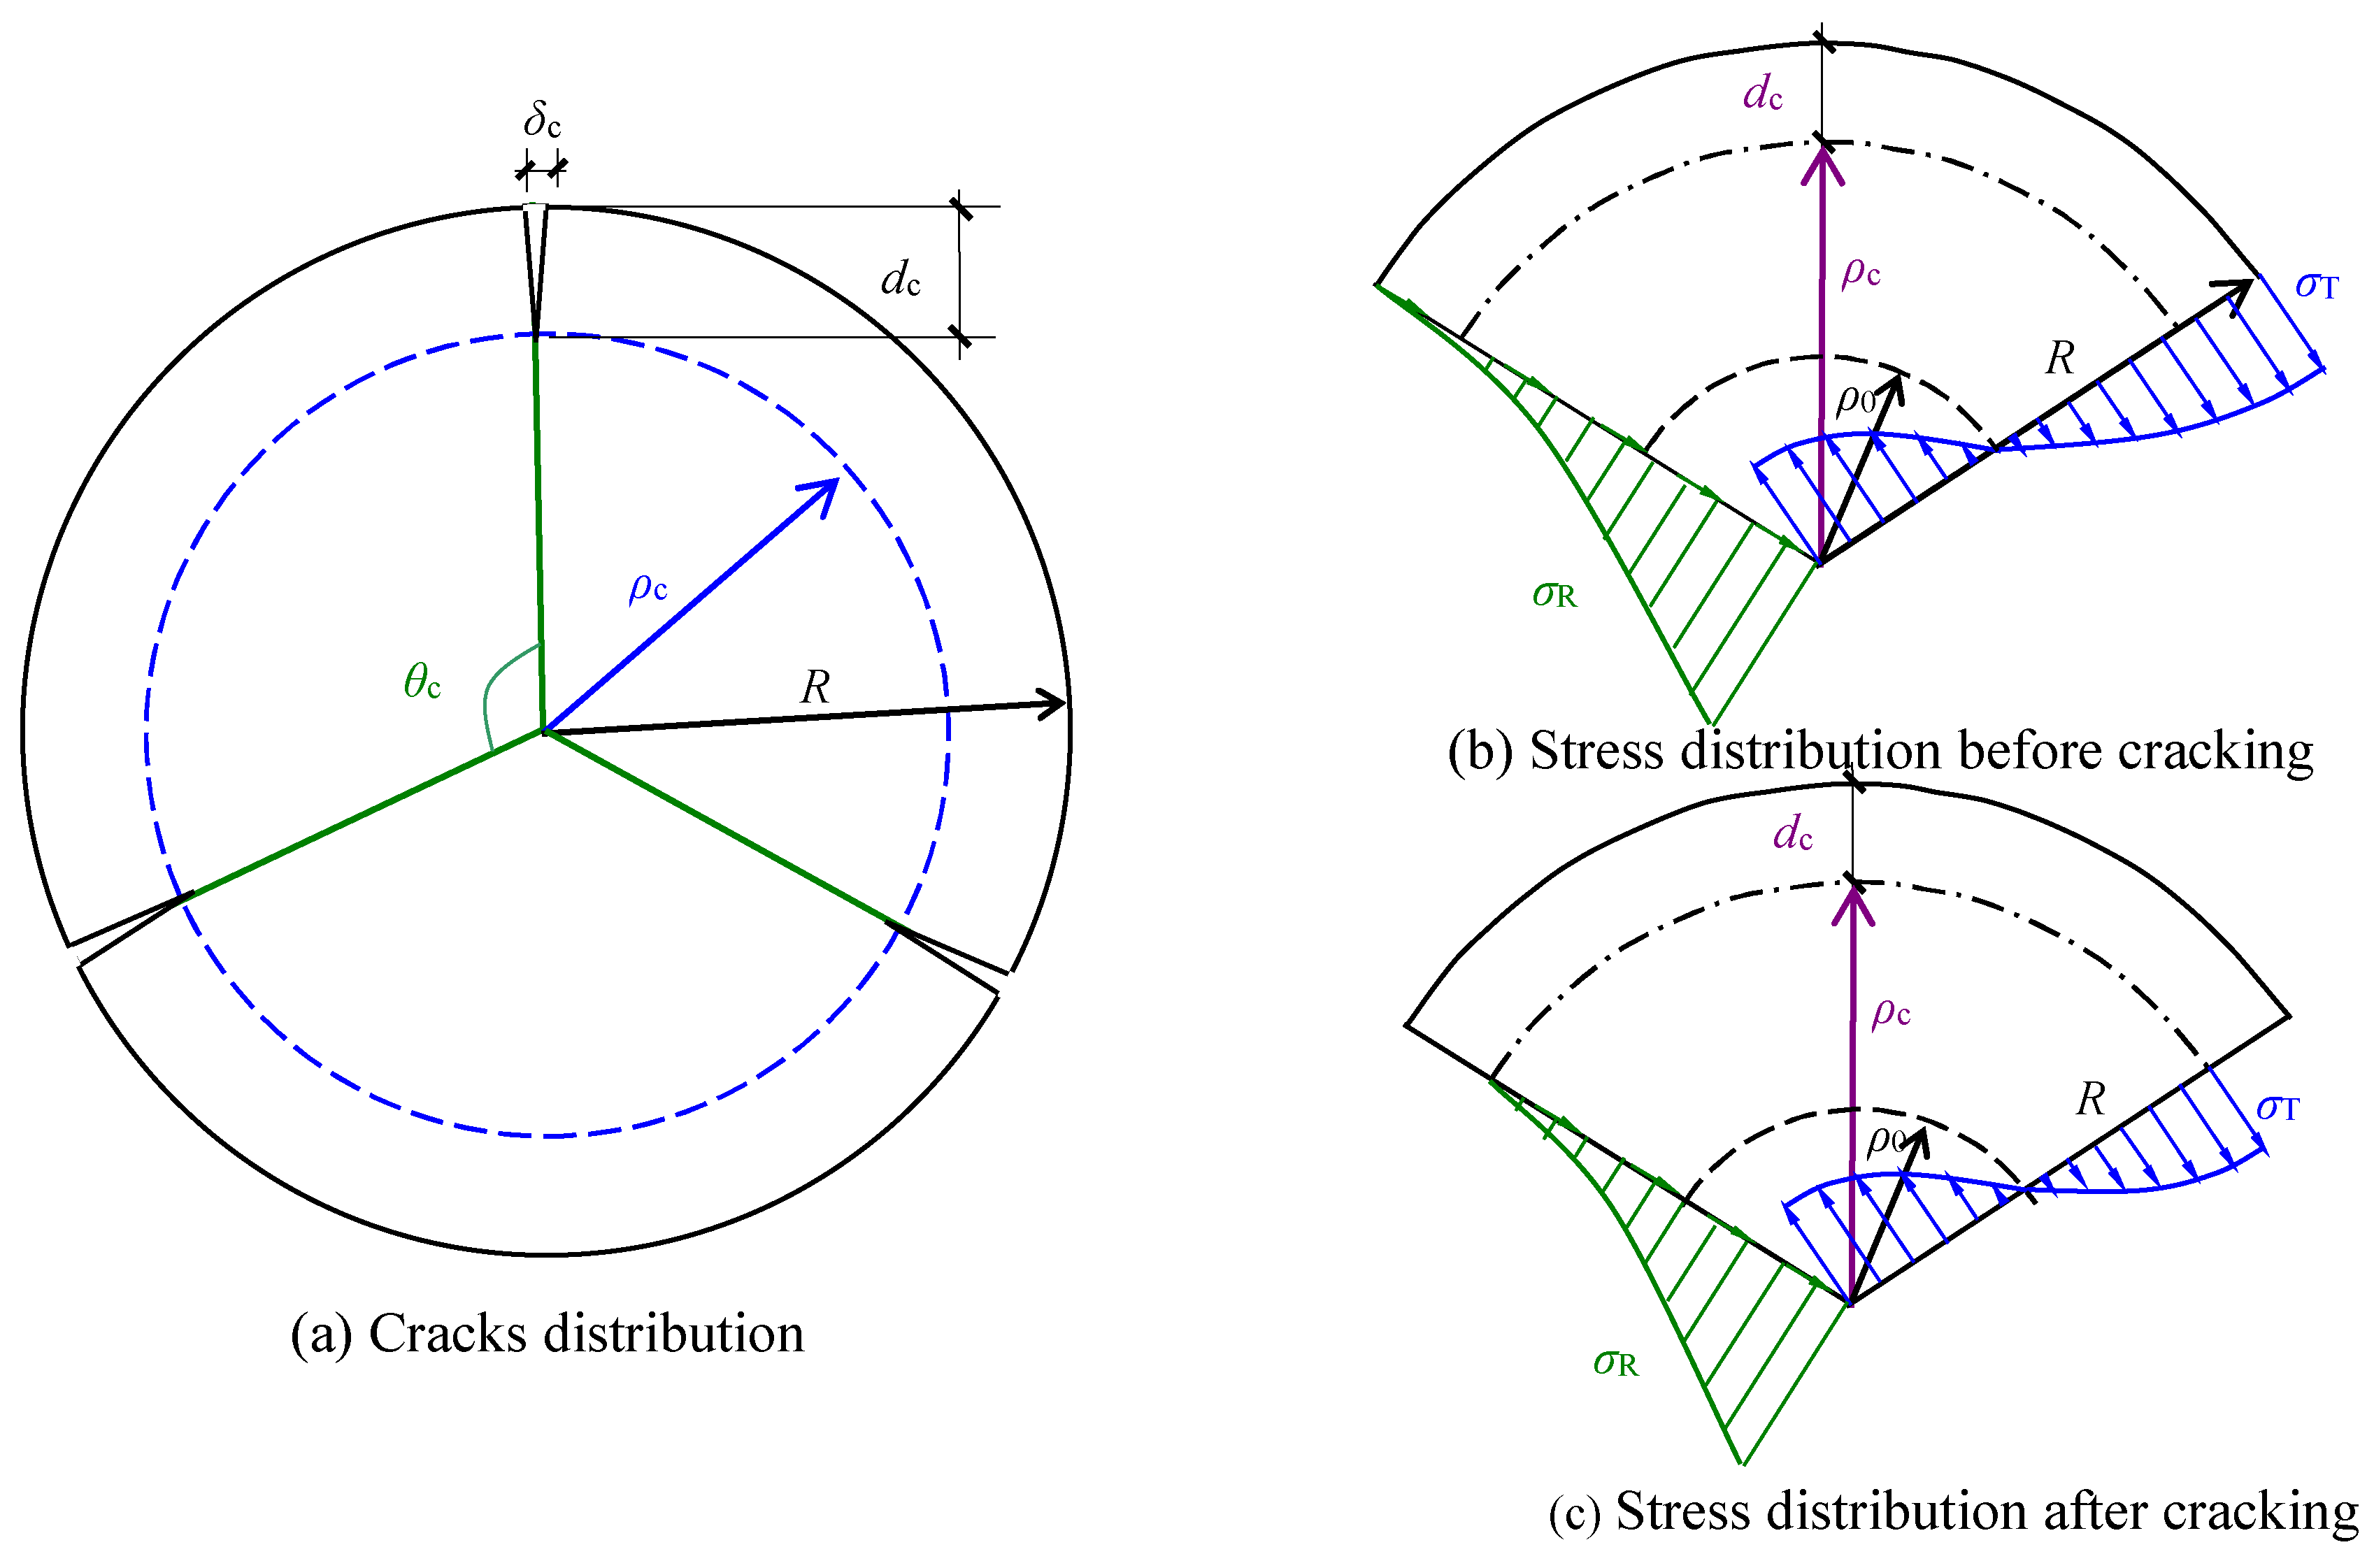
3.1. Basic Assumption
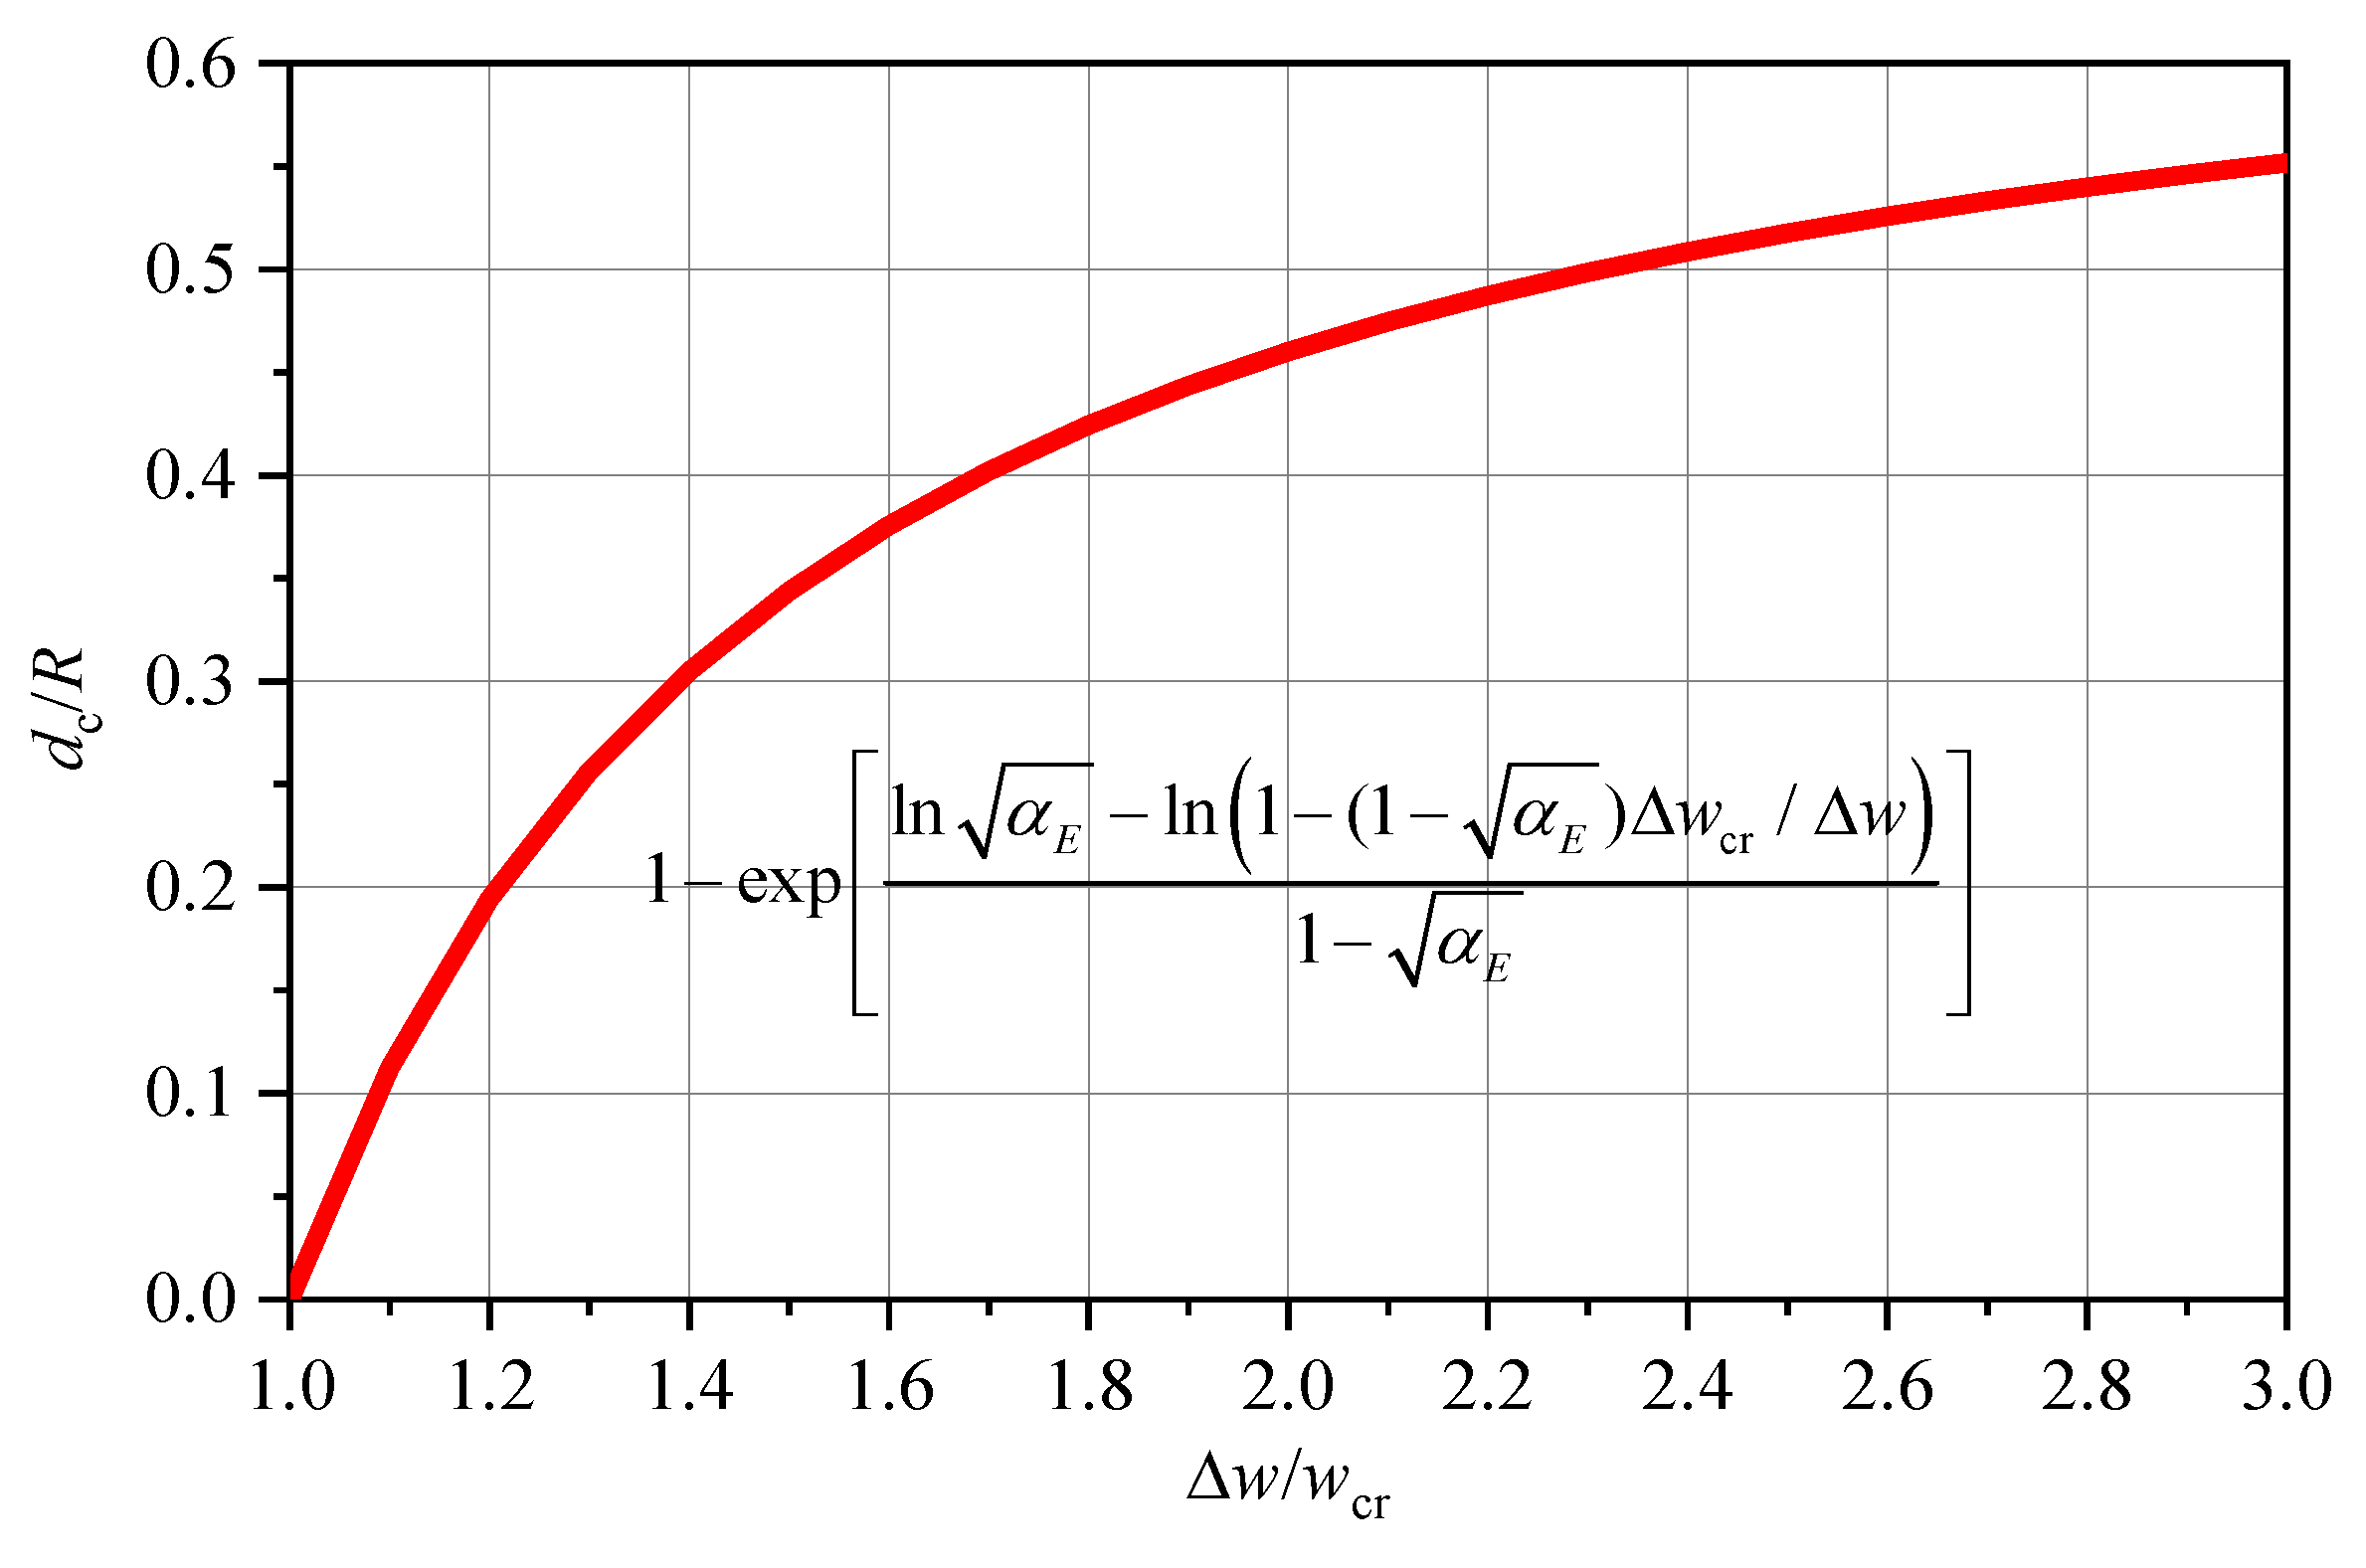
3.2. Critical Moisture Content Gradient Δwcr
3.3. Dry Shrinkage Crack Depth
4. Validation
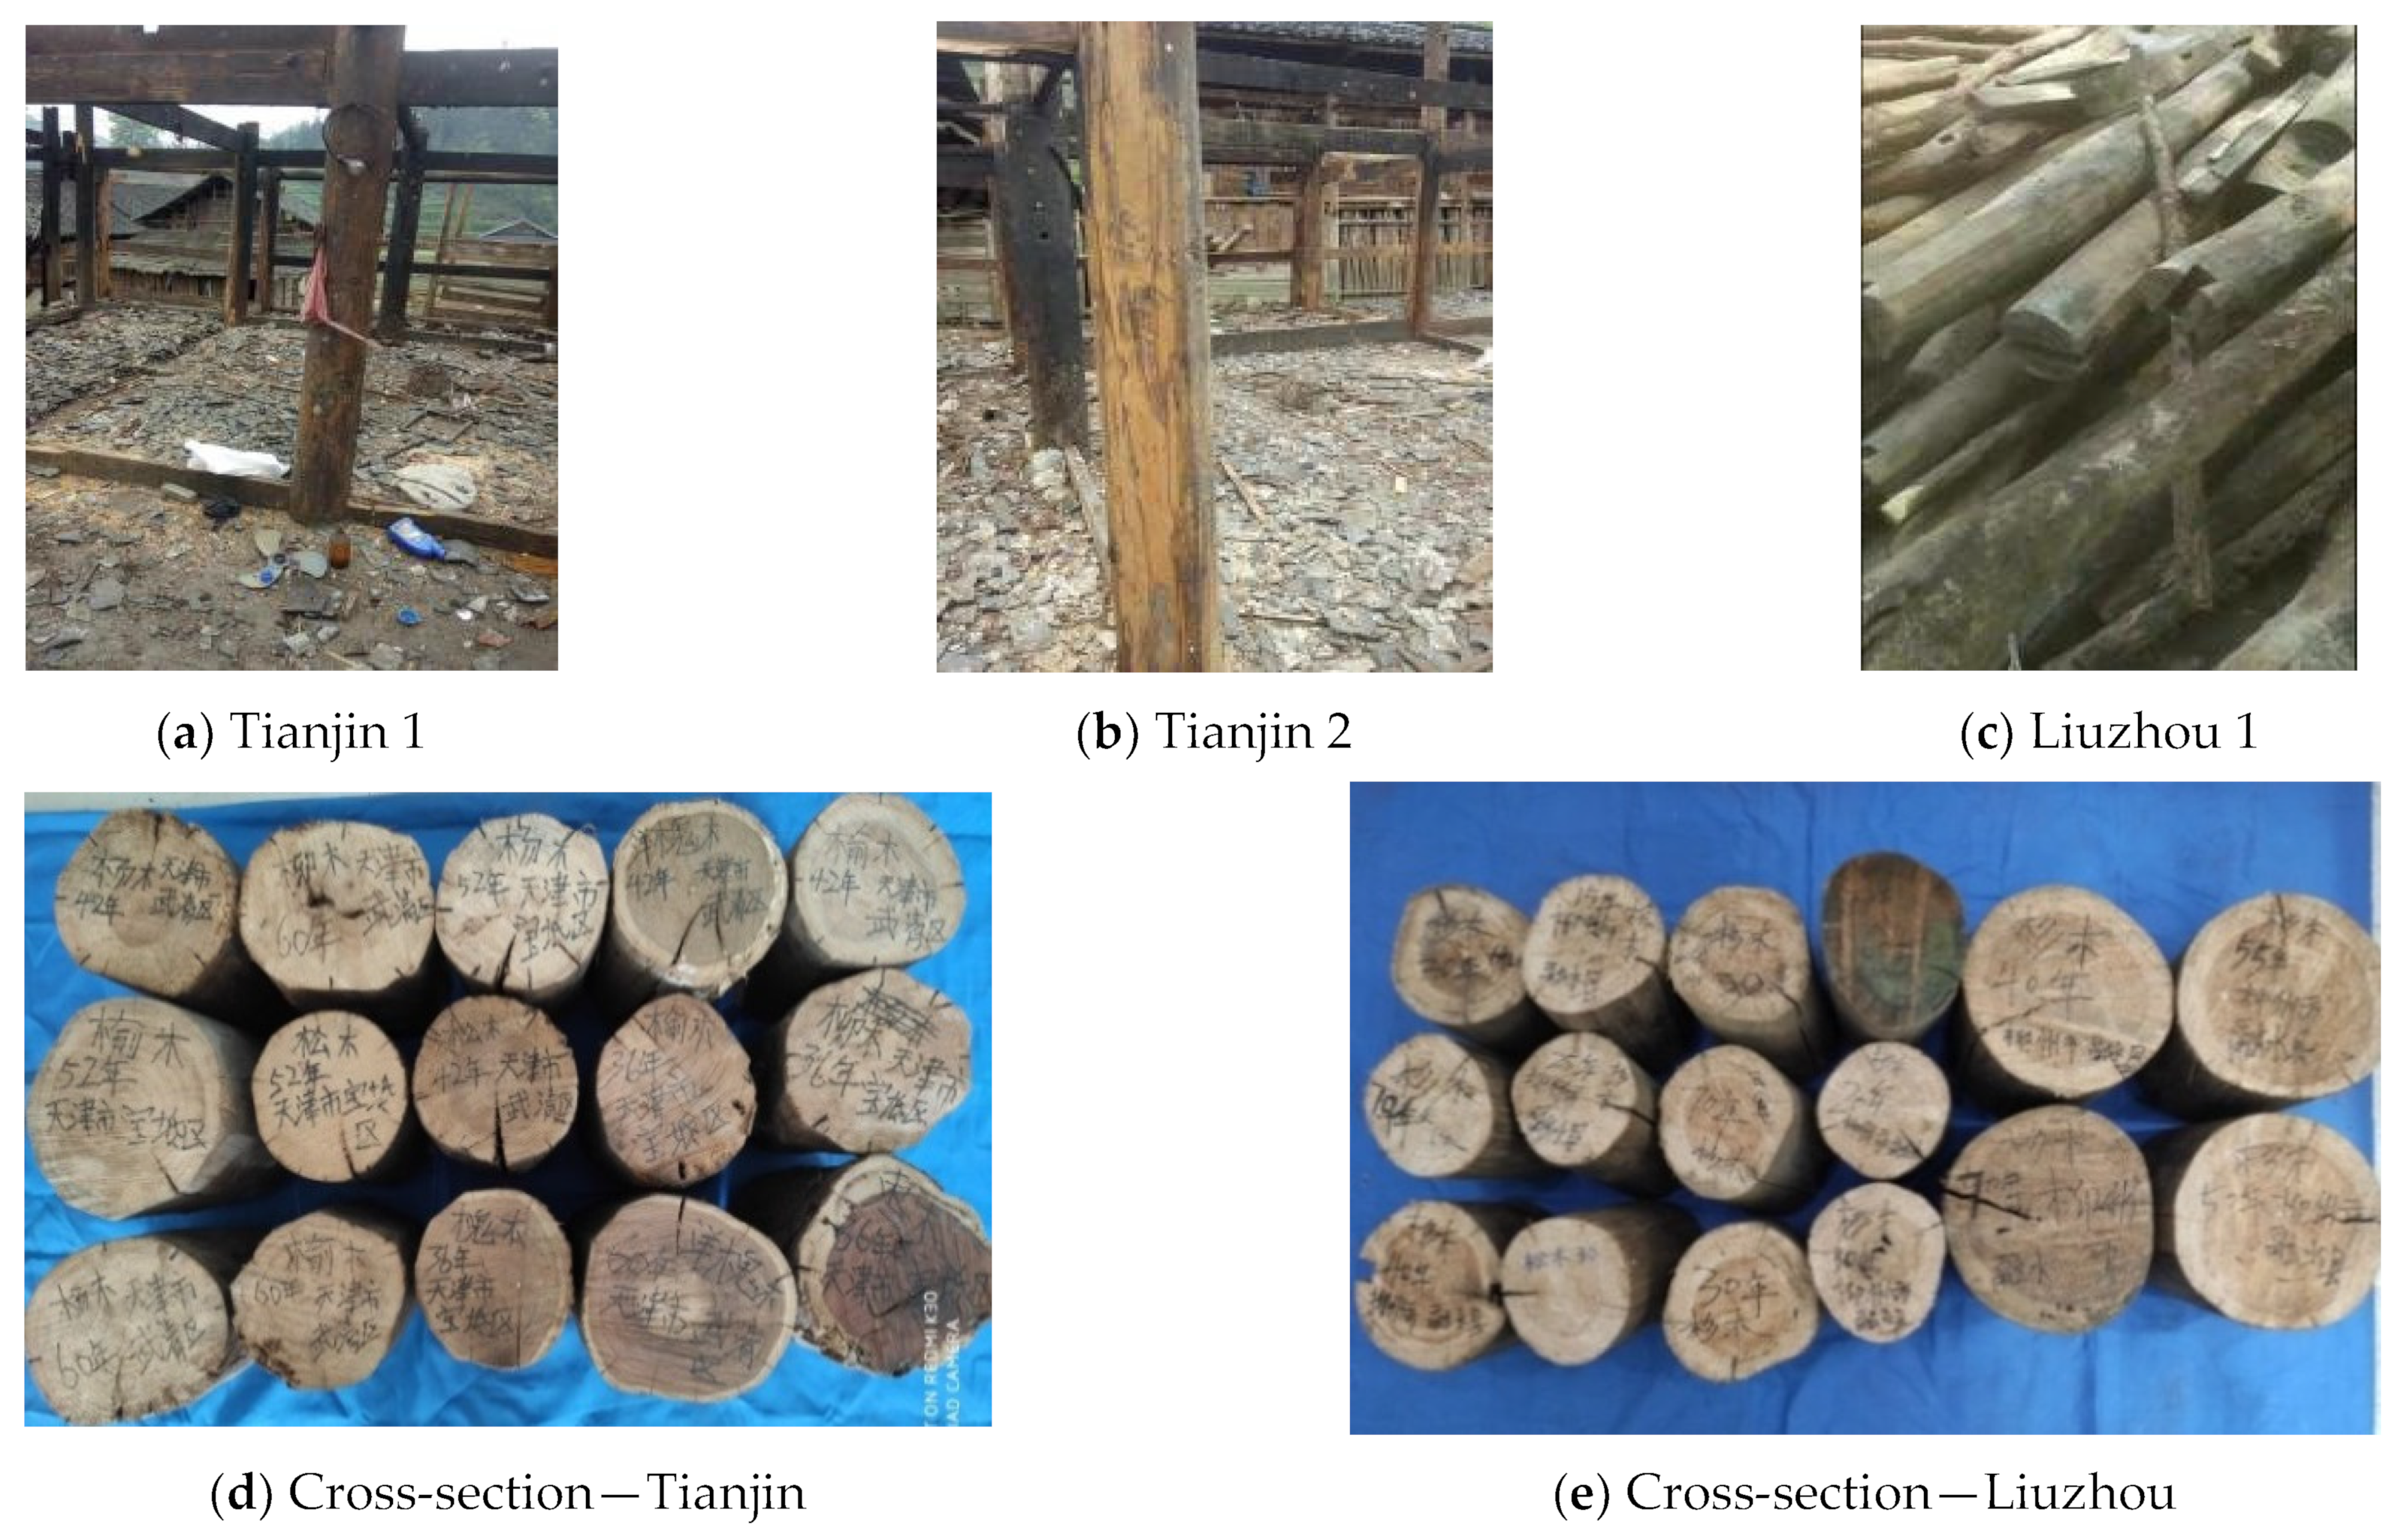
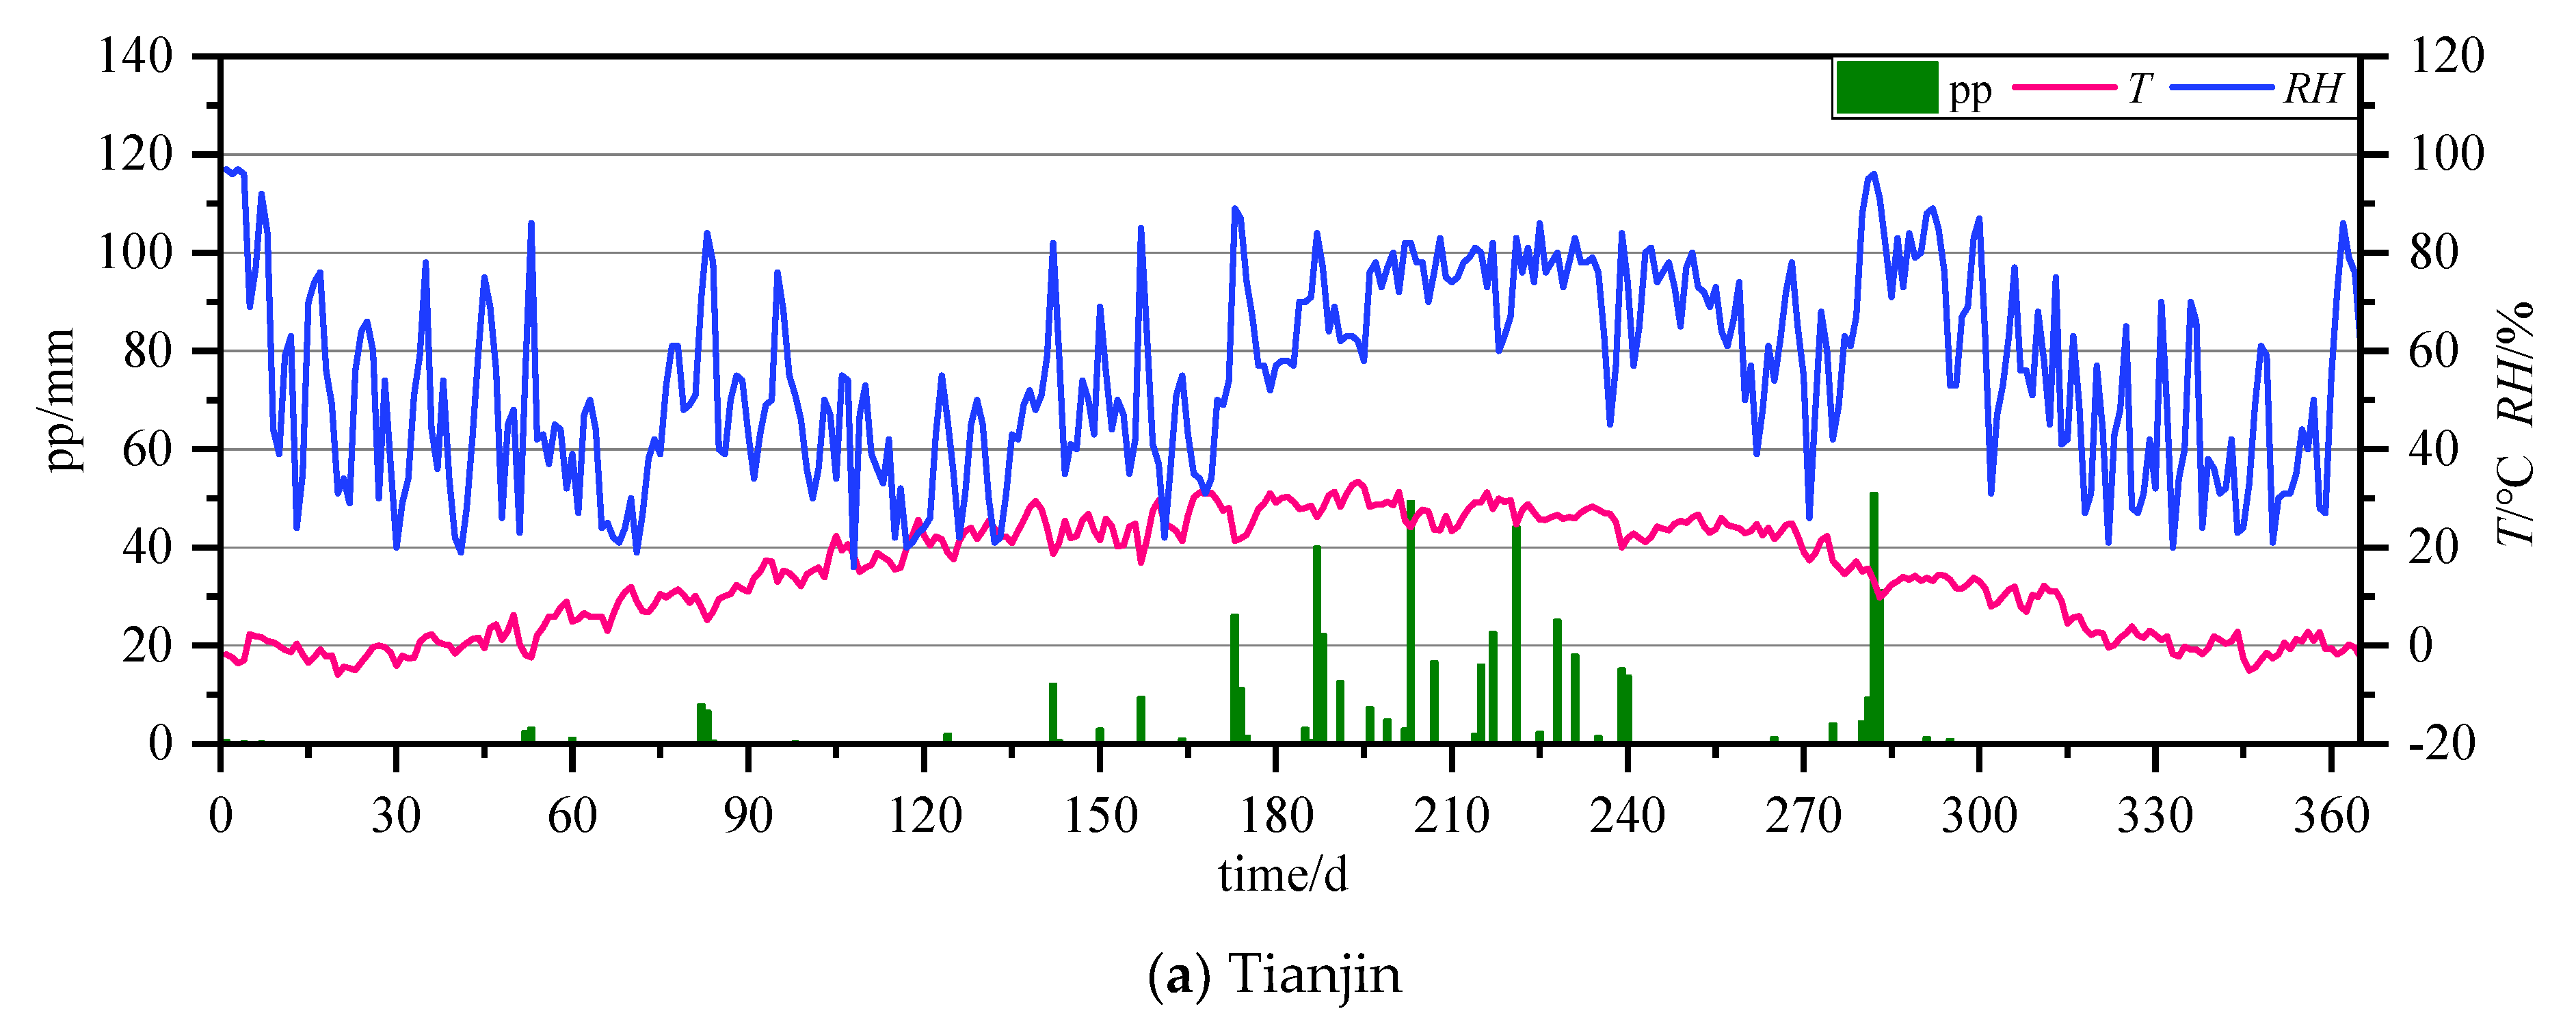
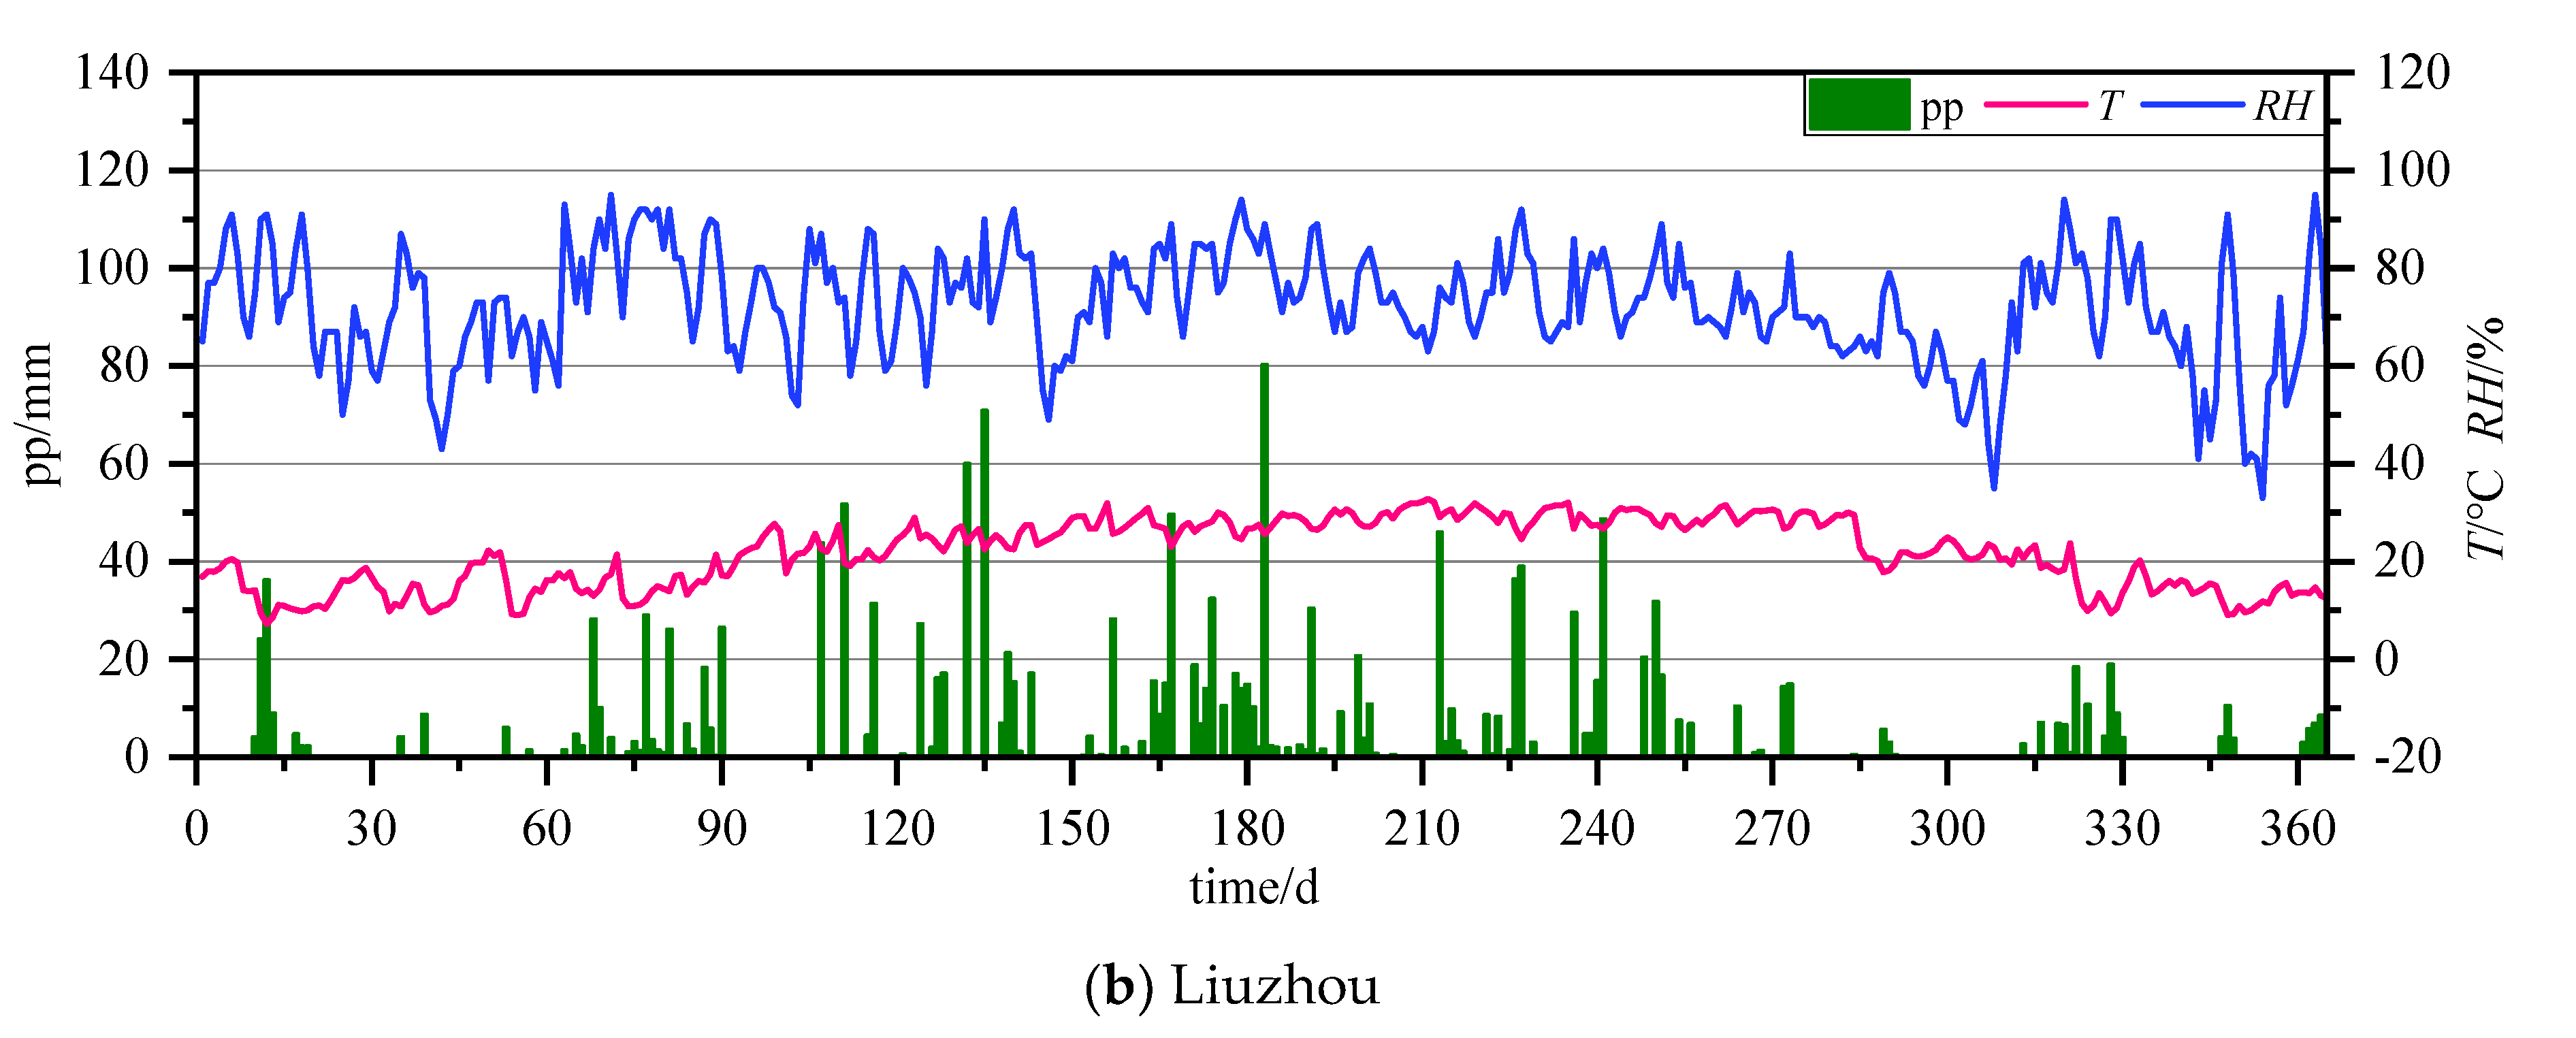
4.1. Detection
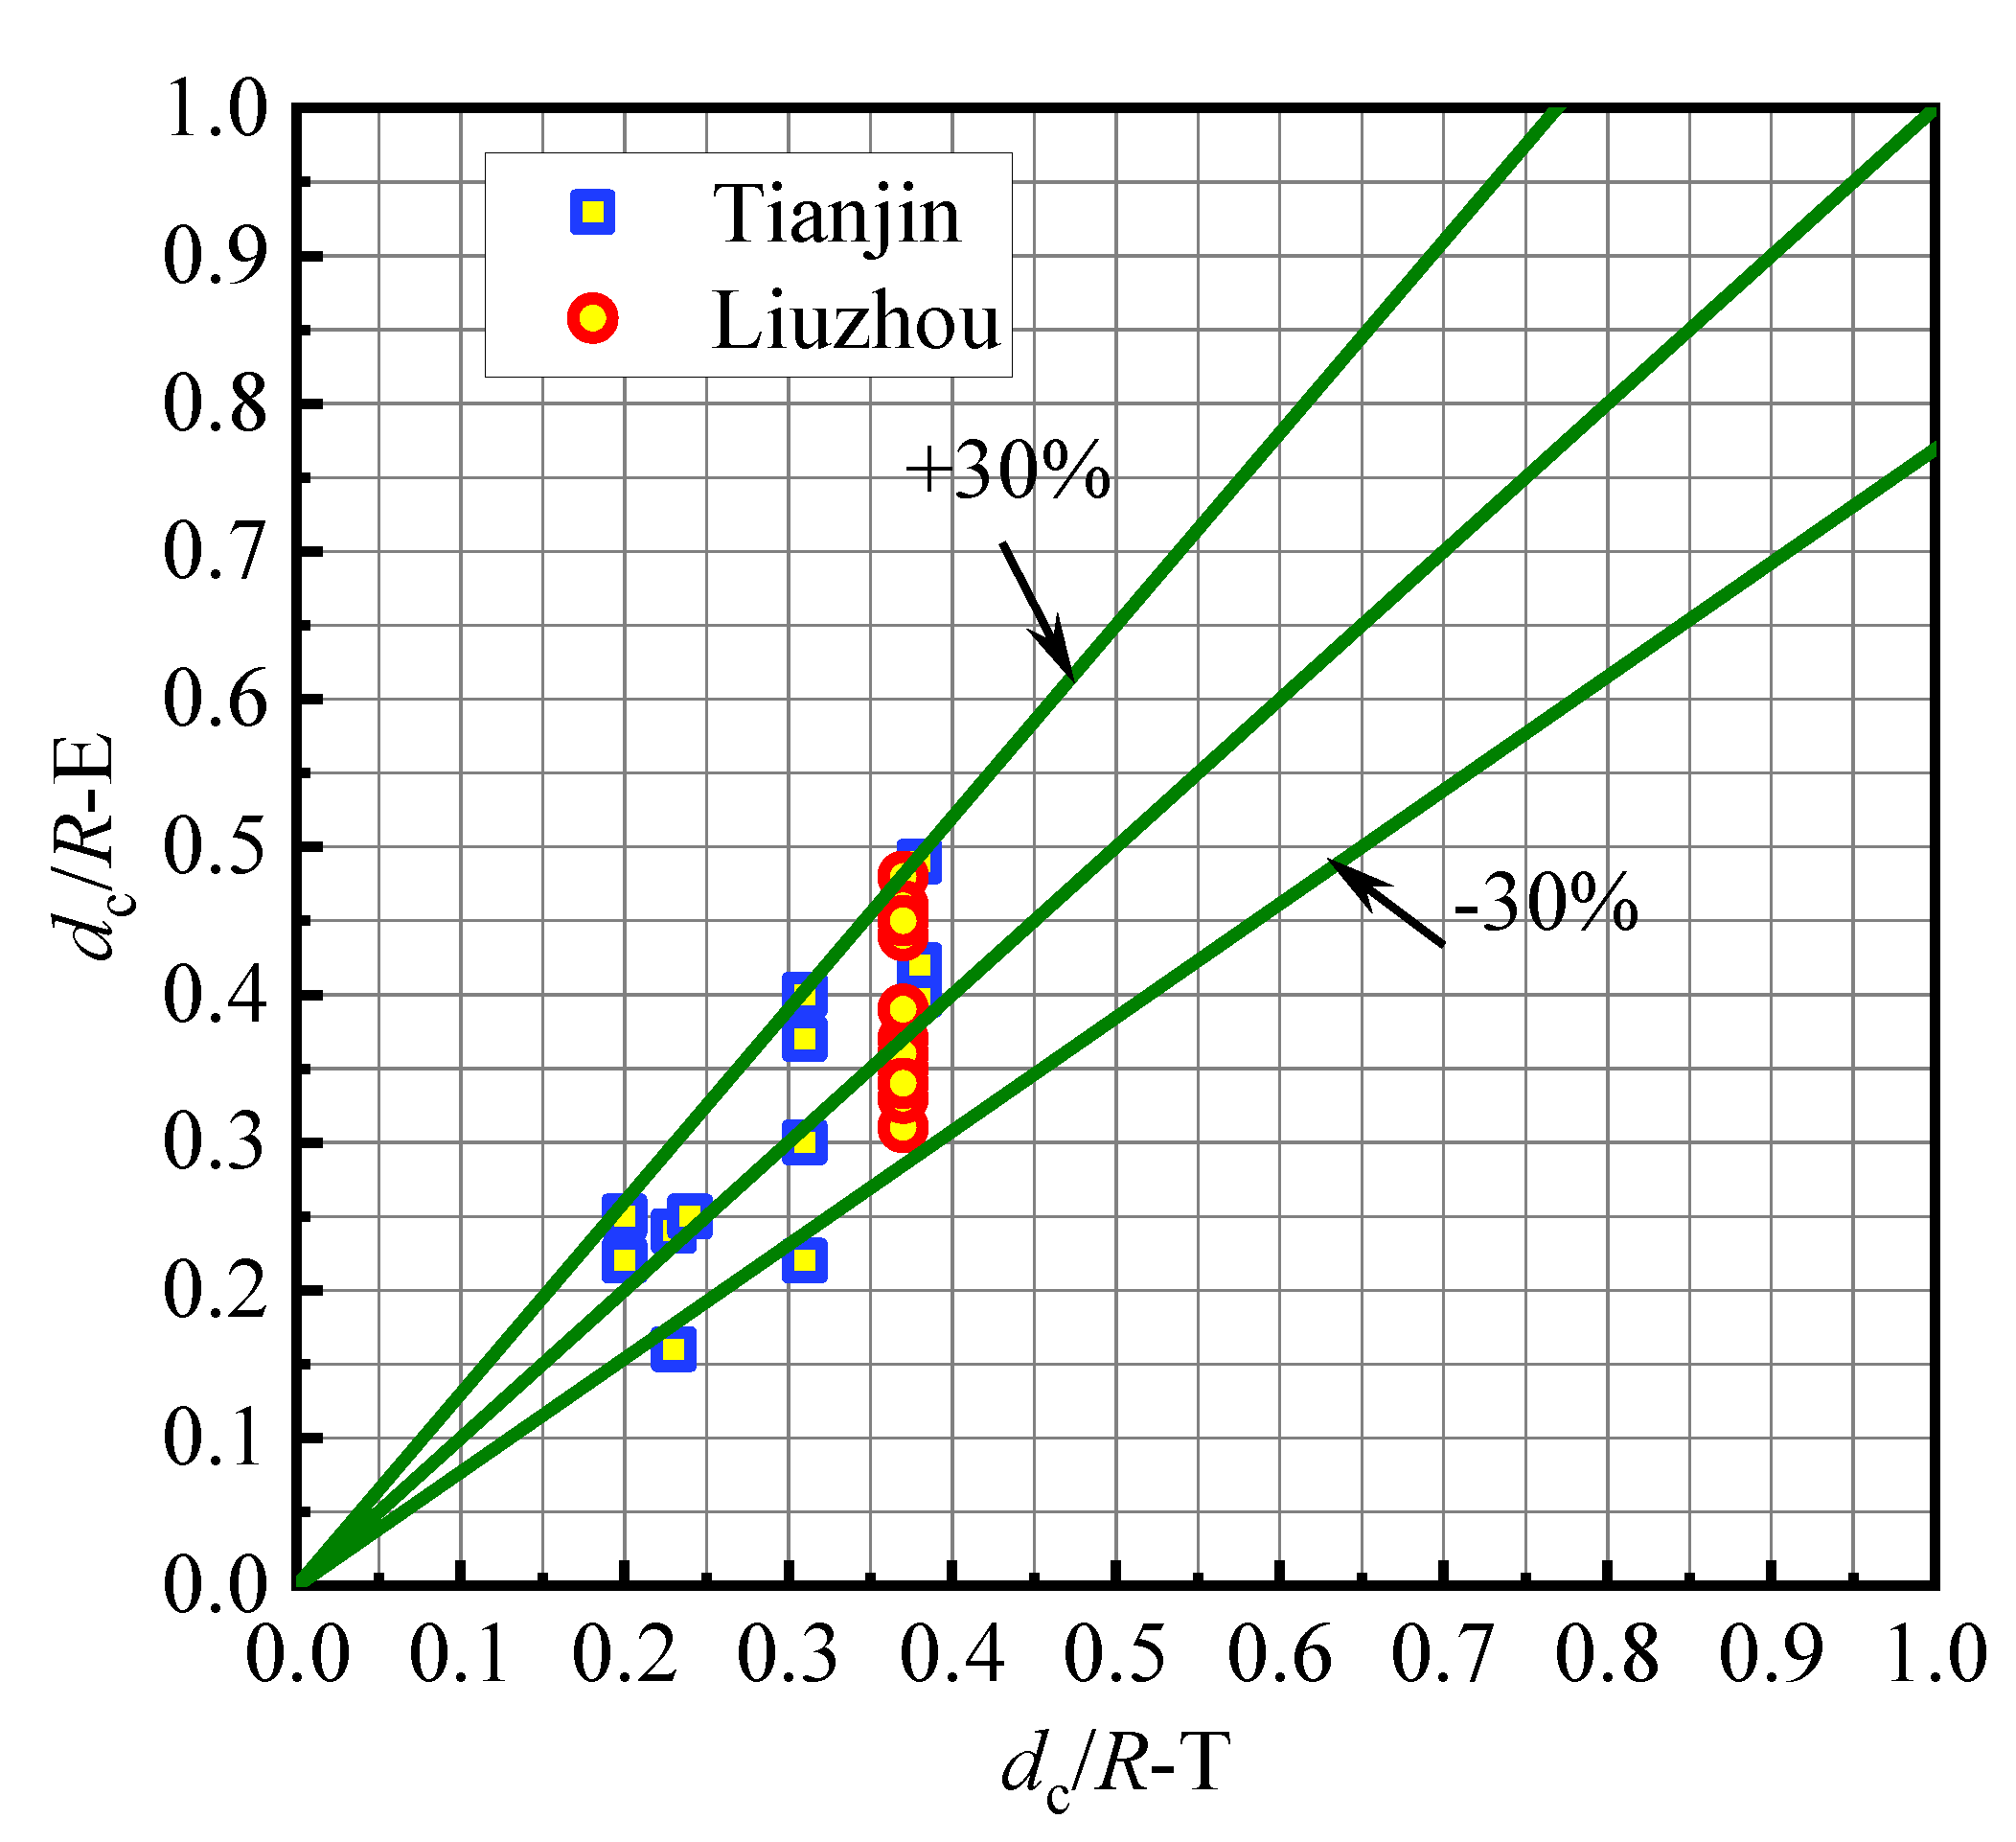
4.2. Comparison
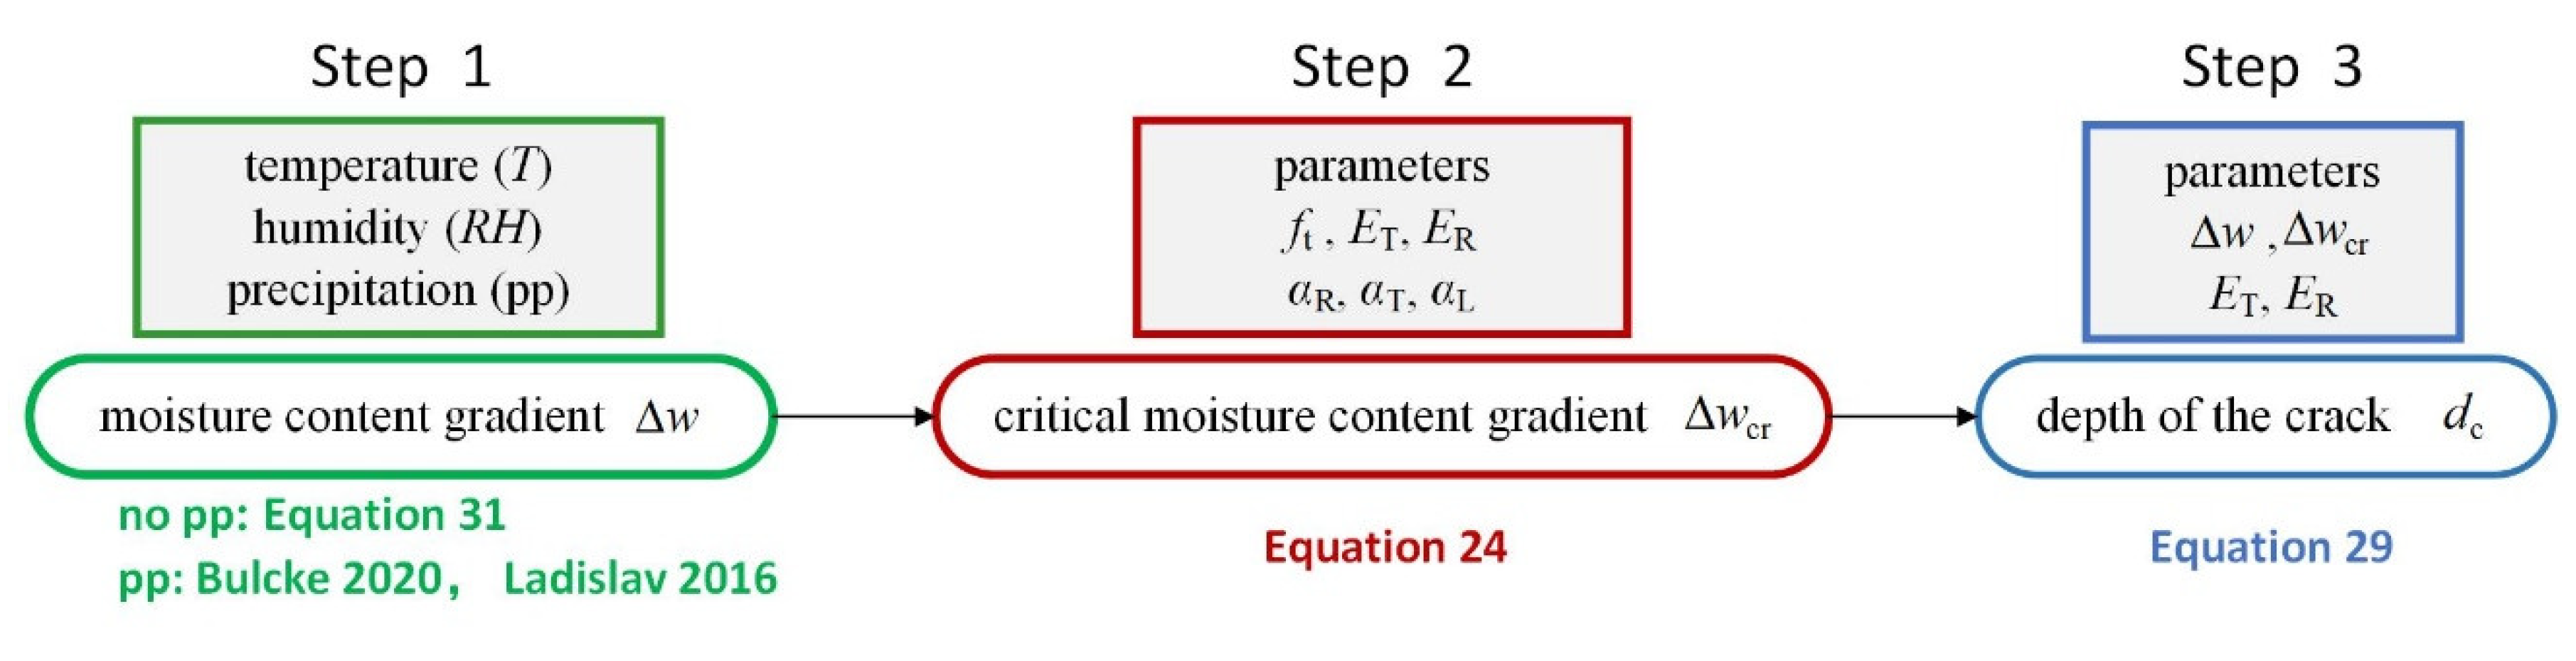
4.3. Application of Prediction Model
5. Conclusions
- (1)
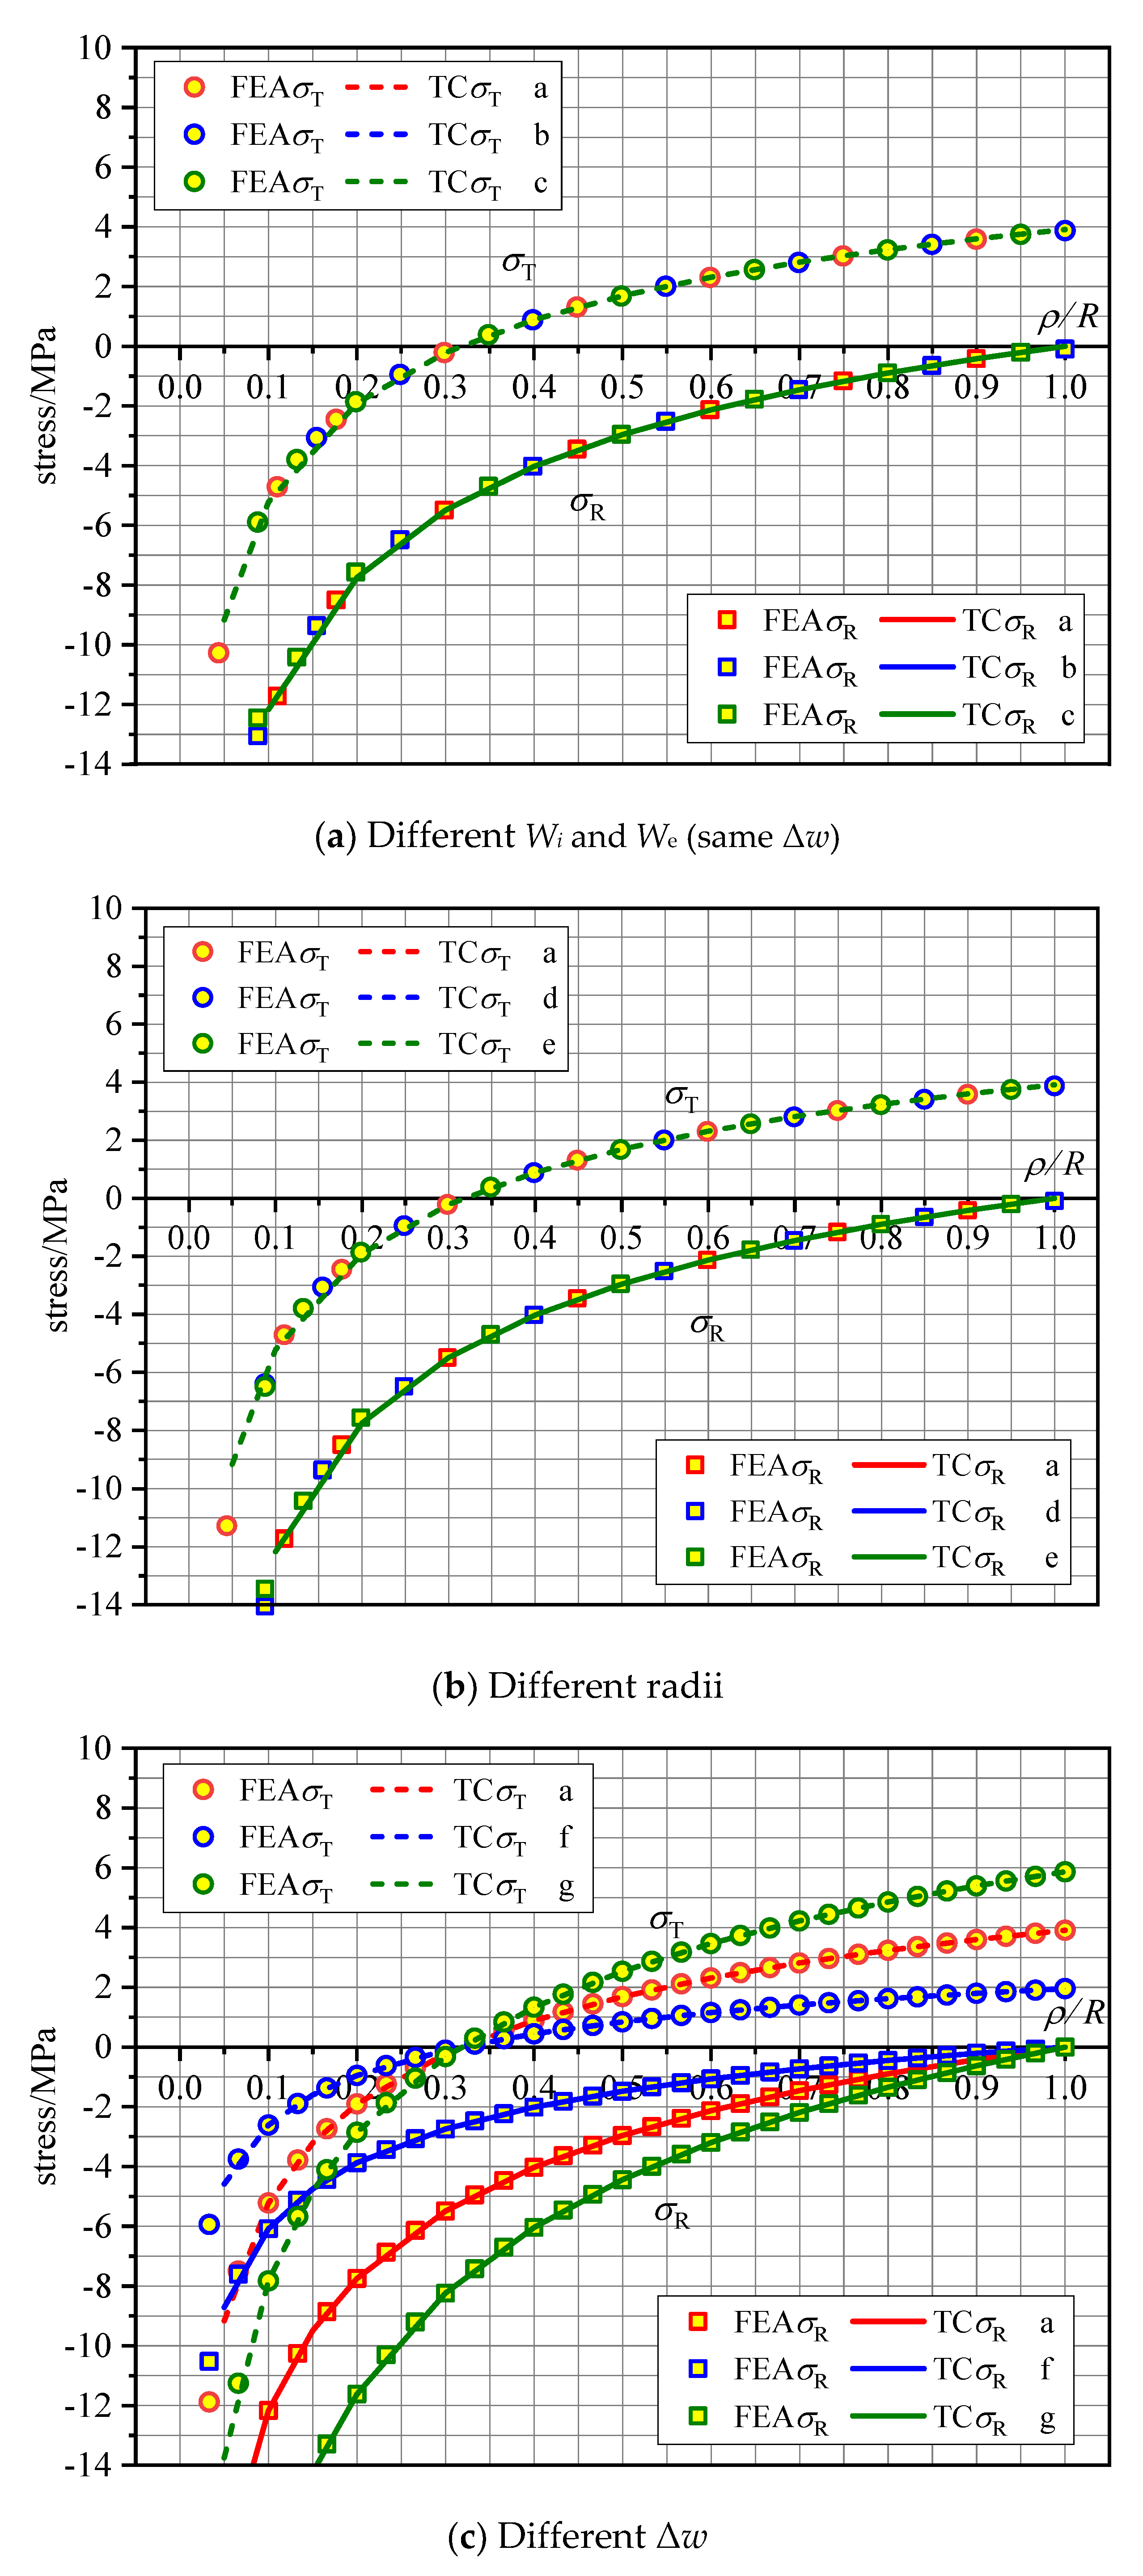
- The theoretical calculation of the humidity stress distribution proposed in this paper is in good agreement with the finite element results. Therefore, the expression of humidity stress is accurate and can provide a reliable basis for subsequent calculations.
- (2)
- The tangential stress of the disc is manifested as compressive stress at the center of the circle while tensile stress at the circumference. There is a continuous change from the center of the circle to the circumference, and a critical tension–compression point r exists. In contrast, the radial stress is always compressive from r = 0 to r = 1.
- (3)
- The moisture stress is not determined by the initial moisture content Wi, equilibrium moisture content We, or member size but by the difference in moisture content Δw.
- (4)
- The distribution of humidity stress in the cross-section of a three-dimensional cylinder is consistent with that of a two-dimensional disk under the same conditions. Furthermore, the three-dimensional cylindrical humidity stress distribution can be simplified as a two-dimensional disk for further calculation.
- (5)
- An approximate shrinkage crack depth prediction model based on reasonable humidity stress expressions was proposed. Although this has scope for engineering application development, several issues that must first be clarified in detail persist, including approximately similar maximum tensile stress and wood tensile strength and the fact that the crack tip stress and residual stress were ignored.
- (6)
- The abovementioned shrinkage crack prediction model was verified via practical engineering testing. The test data are in good agreement with the theoretical calculation data of the model. The above model can be applied to actual engineering prediction to provide a theoretical basis for the reinforcement measures and the safety evaluation of wood structures.
- (7)
- The proposed three-step application process provide a basis on the prediction of shrinkage crack in practical wood engineering for further research.
Author Contributions
Funding
Data Availability Statement
Acknowledgments
Conflicts of Interest
Nomenclature
| Δw | Moisture content gradient |
| wmax | Maximum moisture content |
| wmin | Minimum moisture content |
| R, T, L | Radial direction, tangential direction, longitudinal direction of wood |
| ft | Tensile strength in cross-section |
| ft,R, ft,T, ft,L | Radial/tangential/longitudinal tensile strength in cross-section |
| fc | Compressive strength in cross-section |
| fc,R, fc,T, fc,L | Radial/tangential/longitudinal compressive strength in cross-section |
| αR, αT, αL | Radial/tangential/longitudinal shrinkage and swelling coefficient |
| R, L | Radius/length of the disc |
| δR,δT | Radial/tangential deformation difference |
| δR,sh, δT,sh | Radial/tangential deformation difference caused by shrinkage |
| δR,F, δT,F | Radial/tangential deformation difference caused by force |
| θ | Any angle of the disc |
| σR, σT | Radial/tangential humidity stress |
| ρ/R | Relative distance from the center of the circle |
| ρ0/R | Critical relative distance |
| ER, ET, EL | Radial/tangential/longitudinal elastic modulus |
| εR, εT | Radial/tangential strain |
| vRT, vRL, vTL | Poisson’s ratio of different directions |
| GRT, GRL, GTL | Shear modulus of different directions |
| dc | Depth of the crack |
| ρc/R | Relative distance from the center of the circle after cracking |
| Δwcr | Critical moisture content gradient |
| Yd | The service life of wood components have been used for |
| c | Circumference of wood components |
| n | Number of cracks in wood components |
| dc/R | Relative crack depth of wood components in cross-section |
References
- Kang, W.; Lee, N.-H.; Choi, J.-H. A radial distribution of moistures and tangential strains within a larch log cross section during radio-frequency/vacuum drying. Holz Als Roh-Und Werkst. 2004, 62, 59–63. [Google Scholar] [CrossRef]
- Svensson, S.; Toratti, T. Mechanical response of wood perpendicular to grain when subjected to changes of humidity. Wood Sci. Technol. 2002, 36, 145–156. [Google Scholar] [CrossRef]
- Jönsson, J. Moisture Induced Stresses in Glulam Cross Sections; CIB-W18/34-12-4; Konferenzbeitrag: Venice, Italy, 2001. [Google Scholar]
- Jönsson, J.; Svensson, S. A contact free measurement method to determine internal stress states in glulam. Holzforschung 2004, 58, 148–153. [Google Scholar] [CrossRef]
- Jönsson, J. Internal stresses in the cross-grain direction in glulam induced by climate variations. Holzforschung 2004, 58, 154–159. [Google Scholar] [CrossRef]
- Gereke, T. Moisture-Induced Stresses in Cross-Laminated Wood Panels. Ph.D. Thesis, ETH Zurich, Zurich, Switzerland, 2009. [Google Scholar]
- Fragiacomo, M.; Fortino, S.; Tononi, D.; Usardi, I.; Toratti, T. Moisture-induced stresses perpendicular to grain in cross-sections of timber members exposed to different climates. Eng. Struct. 2011, 33, 3071–3078. [Google Scholar] [CrossRef]
- Morihiko, T. Casehardening and drying set in the kiln-drying of wood III, Changes of set in slices from the outside to the center of wood pieces during conditioning. Mokuaai Gakkaishi 1989, 3, 300–392. [Google Scholar]
- Mohager, S.; Toratti, T. Long term bending creep of wood in cyclic relative humidity. Wood Sci. Technol. 1992, 27, 49–59. [Google Scholar] [CrossRef]
- Cheng, X.; Li, X.; Huang, Q.; Sun, H.; Li, Y.; Xie, J.; Xiong, X. The study of moisture content and inner stress variation of kiln-dried wood during equalization treatment. J. For. Eng. 2016, 1, 38–43. [Google Scholar]
- Gao, X. Fatigue of Wood Subjected to Cyclic Moisture-induced Stress Perpendicular to Grain. Master’s Thesis, Harbin Institute of Technology University, Harbin, China, 2016. [Google Scholar]
- Arends, T.; Pel, L.; Huinink, H.P. Hygromorphic response dynamics of oak: Towards accelerated material characterization. Mater. Struct. 2017, 50, 181. [Google Scholar] [CrossRef]
- Liu, J.; Wang, X. Effect of Drying Temperature and Relative Humidity on Contraction Stress in Wood. BioResources 2016, 11, 6625–6638. [Google Scholar] [CrossRef][Green Version]
- Wang, H.H.; Youngs, R.L. Drying stress and check development in the wood of two oaks. IAWA J. 1996, 17, 15–30. [Google Scholar] [CrossRef]
- Kawa, S. Computation of drying stresses resulting from moisture gradients in wood during. I. Computative method. Mnkuaai Gakkaishi 1979, 2, 103–110. [Google Scholar]
- Chen, X.; Zhu, E. Moisture and Thermal Stress in Glulam Beams. Ind. Constr. 2008, z1, 862–866. [Google Scholar]
- Gereke, T.; Niemz, P. Moisture-induced stresses in spruce cross-laminates. Eng. Struct. 2010, 32, 600–606. [Google Scholar] [CrossRef]
- Angst, V.; Malo, K.A. Moisture-induced stresses in glulam cross sections during wetting exposures. Wood Sci. Technol. 2013, 47, 227–241. [Google Scholar] [CrossRef]
- Arends, T.; Barakat, A.J.; Pel, L. Moisture transport in pine wood during one-sided heating studied by NMR. Exp. Therm. Fluid Sci. 2018, 99, 259–271. [Google Scholar] [CrossRef]
- Zhao, J. Research on Drying Characteristics and Check within White Birch Disks. PhD. Thesis, Northeast Forestry University, Harbin, China, 2013. [Google Scholar]
- Fan, C.; Wang, L.; Pan, J. Measures to control seasoning checks of wood used for the repair of the ancient wooden towers in Yingxian County, Shanxi Province. J. Beijing For. Univ. 2006, 1, 98–102. [Google Scholar]
- Wang, X. Research on Evaluation Method of Reliability-Based Residual Life of Historic Timber Structures. PhD. Thesis, Wuhan University of Technology, Wuhan, China, 2008. [Google Scholar]
- Angellier, N.; Pitti, R.M.; Dubois, F. Crack Analysis of Wood under Climate Variations; Springer: Berlin/Heidelberg, Germany, 2016; pp. 235–242. [Google Scholar]
- Chen, K.; Qiu, H.; Sun, M.; Lam, F. Experimental and numerical study of moisture distribution and shrinkage crack propagation in cross section of timber members. Constr. Build. Mater. 2019, 221, 219–231. [Google Scholar] [CrossRef]
- Brischke, C.; Selter, V. Mapping the Decay Hazard of Wooden Structures in Topographically Divergent Regions. Forests 2020, 11, 510. [Google Scholar] [CrossRef]
- Reinprecht, L. Wood Deterioration, Protection and Maintenance; John Wiley & Sons, Ltd.: London, UK, 2016; pp. 126–142. [Google Scholar]
- Hanhijarvi, A.O. Modelling of Creep Deformation Mechanism in Wood; Espoo 15; Technical Research Cent of Finland: Espoo, Finland, 1995; p. 231. [Google Scholar]
- Xu, B.H.; Bouchaïr, A.; Racher, P. Appropriate Wood Constitutive Law for Simulation of Nonlinear Behavior of Timber Joints. J. Mater. Civ. Eng. 2014, 26, 04014004-1. [Google Scholar] [CrossRef]
- Xu, B.H.; Bouchaïr, A.; Taazount, M.; Vega, E.J. Numerical and experimental analyses of multiple-dowel steel-to-timber joints in tension perpendicular to grain. Eng. Struct. 2009, 31, 235–236. [Google Scholar] [CrossRef]
- Larsen, F.; Ormarsson, S. Numerical and experimental study of moisture-induced stress and strain field developments in timber logs. Wood Sci. Technol. 2013, 47, 837–852. [Google Scholar] [CrossRef]
- Zhou, H. Experimental and Analysis of the Mechanical Behavior of Bolted Joints with Slotted-in Steel Plate in Timber Structures. Master’s Thesis, Harbin Institute of Technology University, Harbin, China, 2017. [Google Scholar]
- He, Z. The Experimental Study on Mechanical Property of Bolted Joint with Glued Timber and Steel Plate. Master’s Thesis, Central South University of Forestry and Technology, Changsha, China, 2017. [Google Scholar]
- Zhao, Y.; He, M.; Ma, R. Bending bearing capacity and parametric analysis of prestressed tube bolted timber connections. J. Build. Struct. 2016, 37, 18–26. [Google Scholar]


| Heat Transfer | Humidity Transfer | ||
|---|---|---|---|
| Temperature | T(K) | Moisture content | W (%) |
| Initial temperature | Ti | Initial moisture content | Wi |
| Ambient temperature | Te | Equilibrium moisture content | We |
| Surface temperature of the object | Ts | Surface moisture content | Ws |
| Thermal conductivity | α (m2/s) | Water diffusion coefficient | D (m2/s) |
| Surface heat exchange coefficient | h (W/m2/K) | Surface humidity divergence coefficient | S (m/s) |
| Coordinates | Heat Transfer | Humidity Transfer |
|---|---|---|
| Cartesian coordinates | ||
| Cylindrical coordinates | ||
| Spherical coordinates |
| Group | Geometric Shape | Radius × Length R × L (mm) | Wi (%) | We (%) | Moisture Content Distribution Form | Restrictions |
|---|---|---|---|---|---|---|
| a | Disc | 100 × 0 | 25 | 15 | Uniform Δw = 10% | Circle center |
| b | Disc | 100 × 0 | 15 | 5 | Uniform Δw = 10% | Circle center |
| c | Disc | 100 × 0 | 35 | 25 | Uniform Δw = 10% | Circle center |
| d | Disc | 50 × 0 | 25 | 15 | Uniform Δw = 10% | Circle center |
| e | Disc | 150 × 0 | 25 | 15 | Uniform Δw = 10% | Circle center |
| f | Disc | 100 × 0 | 20 | 15 | Uniform Δw = 5% | Circle center |
| g | Disc | 100 × 0 | 30 | 15 | Uniform Δw = 15% | Circle center |
| h | Cylinder | 100 × 300 | 25 | 15 | Uniform Δw = 10% | Both ends of circle center |
| i | Cylinder | 100 × 1000 | 25 | 15 | Uniform Δw = 10% | Both ends of circle center |
| Directions | Elastic Modulus (MPa) | Compressive Strength (MPa) | Tensile Strength (MPa) | Shrinkage/Swelling Coefficient (%) |
|---|---|---|---|---|
| R | ER = 1048 (16.1%) | fc,R = 3.07 (12.23%) | ft,R = 3.07 (12.23%) | αR = 0.139 |
| T | ET = 594 (22.7%) | fc,T = 2.67 (13.44%) | ft,T = 2.67 (13.44%) | αT = 0.255 |
| L | EL = 12,888 (6.9%) | fc,L = 36.25 (10.43%) | ft,L = 36.25 (10.43%) | αL = 0.019 |
| Directions | Poisson ratio | Shear modulus (MPa) | ||
| RT | vRT = 0.43 | GRT = 232 | ||
| RL | vRL = 0.03 | GRT = 967 | ||
| TL | vTL = 0.02 | GRT = 773 |
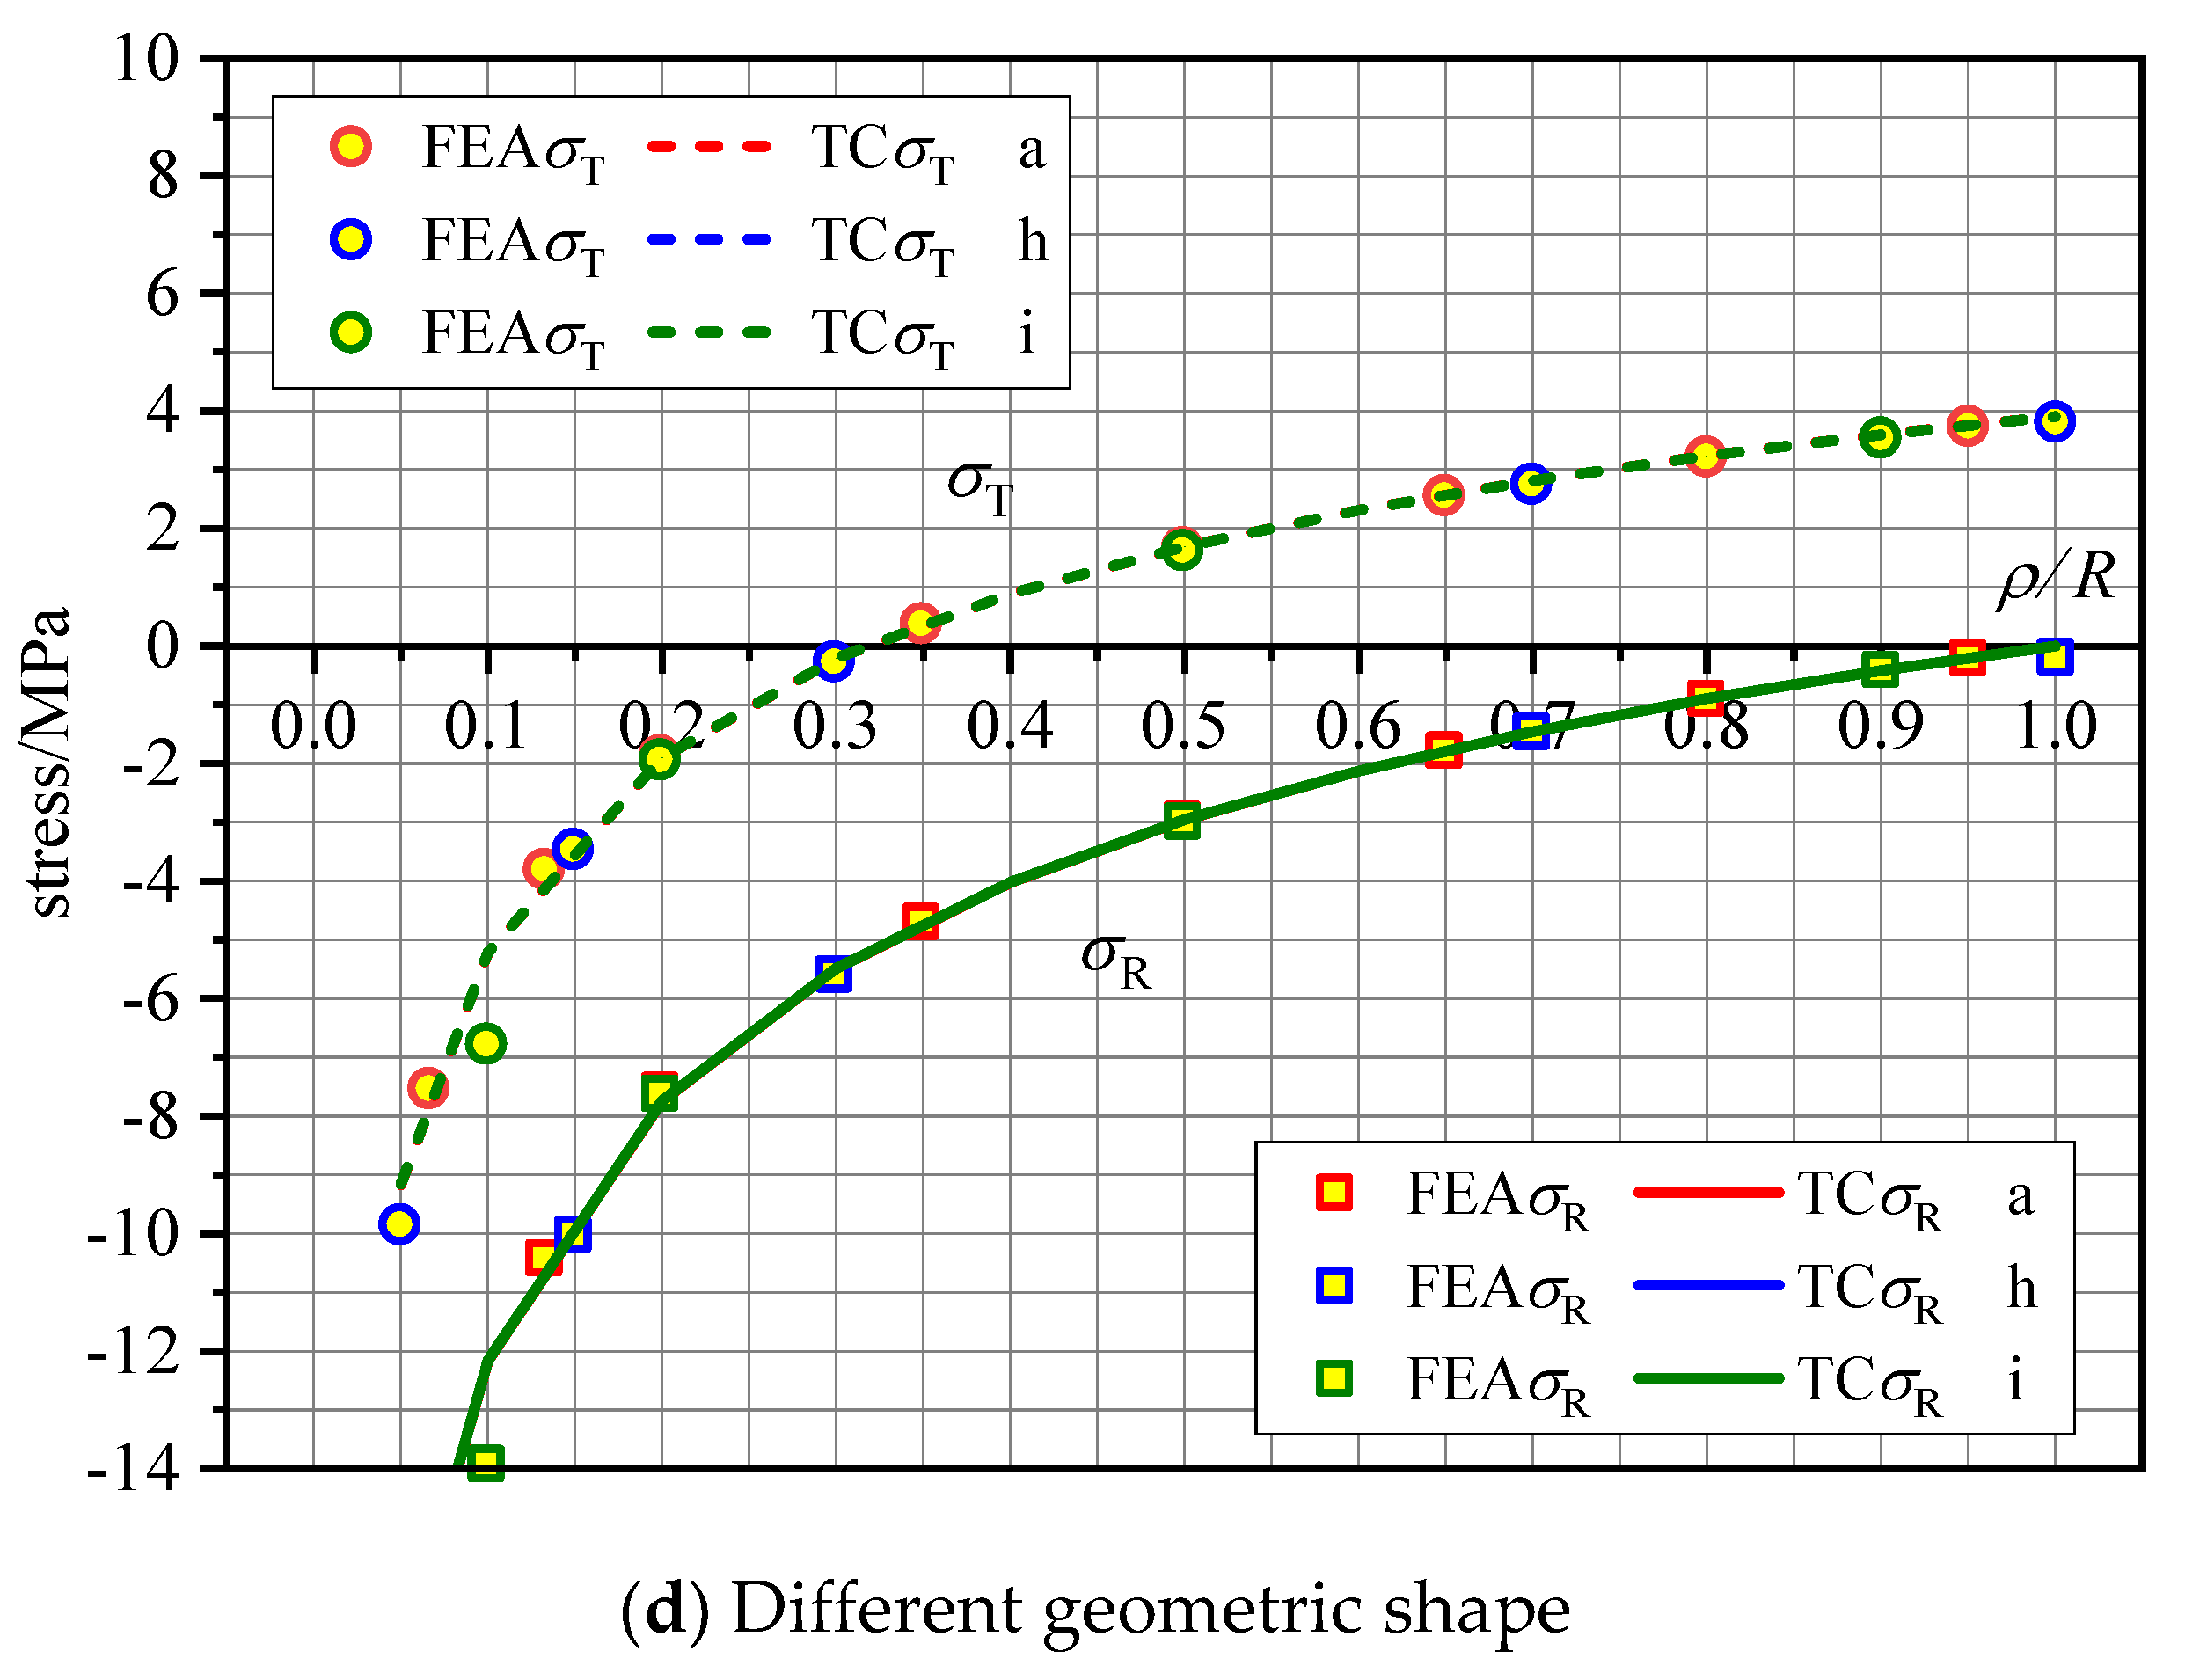
| Model | Geometric | Radius R | n | Crack Distribution | Preset Crack Depth | Δw |
|---|---|---|---|---|---|---|
| M1 | Disc | R = 50 mm | 1 | - | 10% of the radius (5 mm) | 10% |
| M2 | Disc | R = 50 mm | 2 | Equiangular distribution, 180° | 10% of the radius (5 mm) | 10% |
| M3 | Disc | R = 50 mm | 3 | Equiangular distribution, 120° | 10% of the radius (5 mm) | 10% |
| M4 | Disc | R = 50 mm | 4 | Equiangular distribution, 90° | 10% of the radius (5 mm) | 10% |
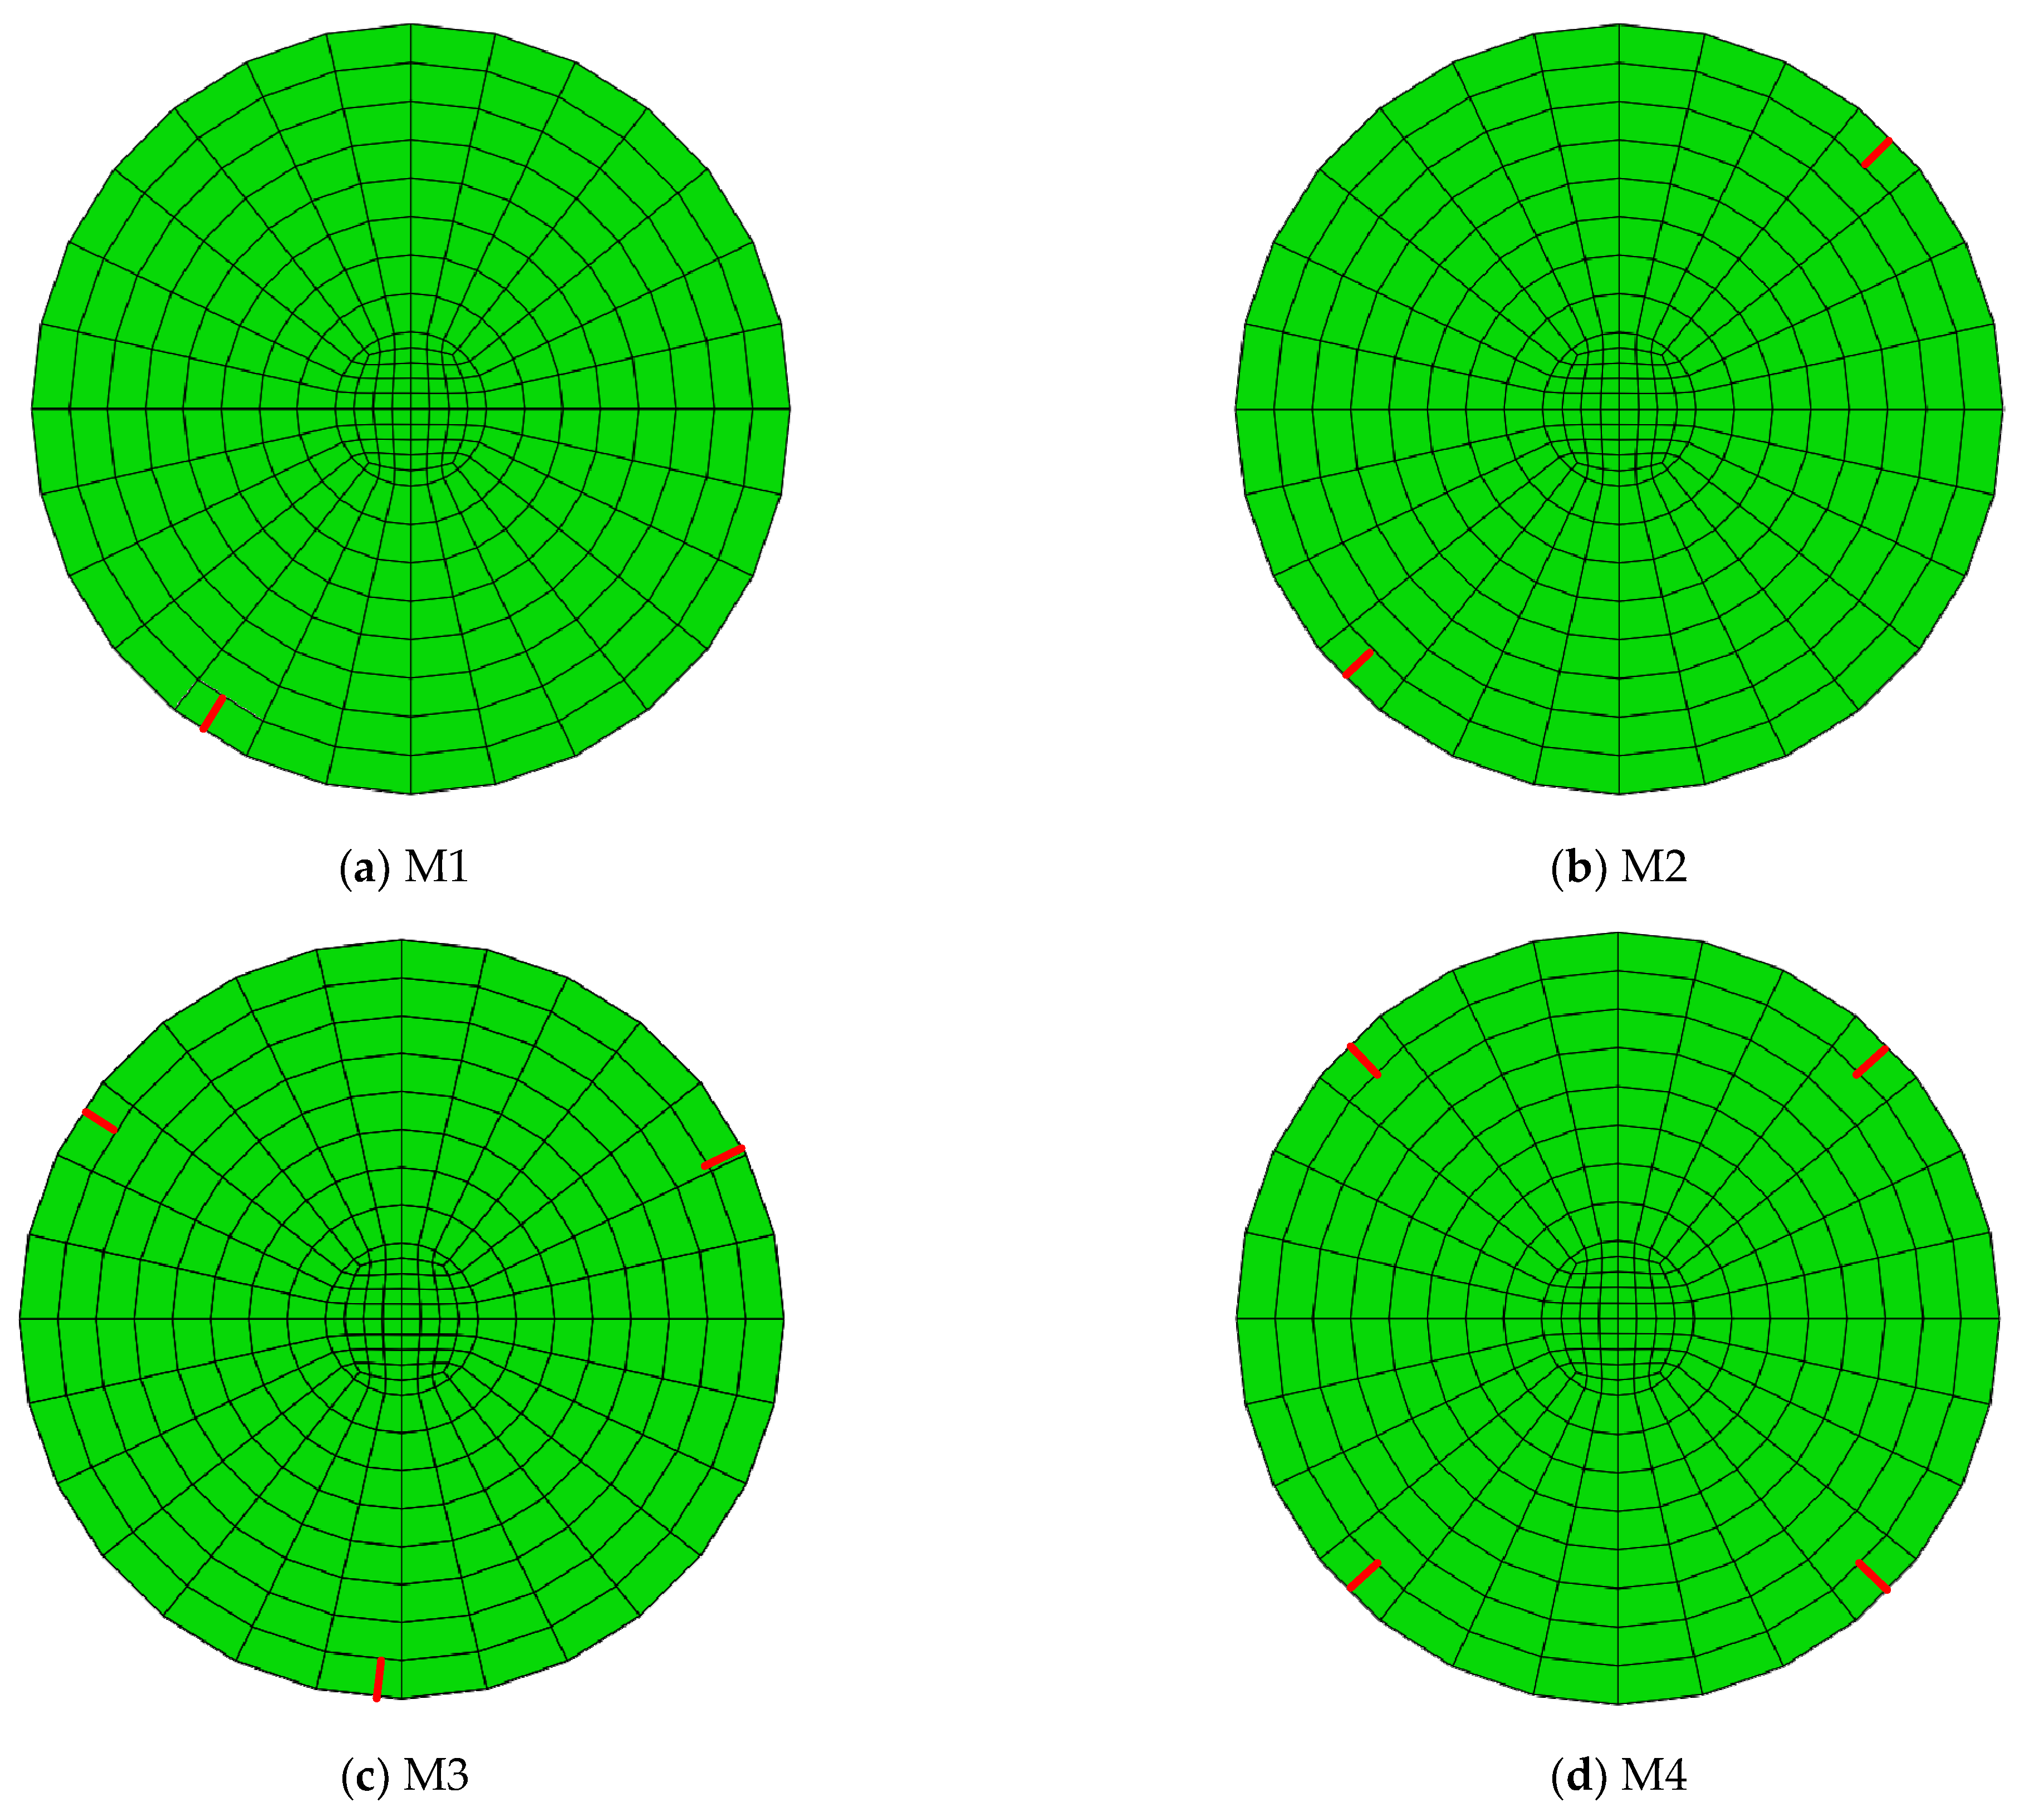
| Model- dc/R | σR,c (MPa) | σR,c0-F (MPa) | σR,c0-T (MPa) | Model- dc/R | σR,c (MPa) | σR,c0-F (MPa) | σR,c0-T (MPa) | ||
|---|---|---|---|---|---|---|---|---|---|
| M2-0.3 | 0.64 | 3.11 | 3.91 | 0.80 | M4-0.3 | 0.27 | 3.26 | 3.91 | 0.83 |
| M2-0.4 | 0.18 | 3.41 | 3.91 | 0.87 | M4-0.4 | 1.01 | 3.23 | 3.91 | 0.83 |
| M2-0.5 | 0.00 | 3.60 | 3.91 | 0.92 | M4-0.5 | 1.05 | 3.06 | 3.91 | 0.78 |
| M2-0.6 | −0.05 | 3.63 | 3.91 | 0.93 | M4-0.6 | −0.03 | 3.01 | 3.91 | 0.77 |
| M2-0.7 | −0.07 | 3.20 | 3.91 | 0.82 | M4-0.7 | −0.05 | 2.99 | 3.91 | 0.76 |
| Average of : 0.83 | |||||||||
| Region | No. | Name | Species | c (mm) | n | Rain Conditions | Yd (Year) | dc/R-E | Δwcr (%) | Δw (%) | dc/R-T | Ratio (E/T) |
|---|---|---|---|---|---|---|---|---|---|---|---|---|
| Tianjin | 1 | TJ-Yu-42 | Elm | 552 | 4 | ✓, light | 42 | 0.37 | 6.36 | 9.56 | 0.31 | 1.19 |
| 2 | TJ-Yu-60 | Elm | 540 | 5 | ✓, light | 60 | 0.30 | 6.36 | 9.56 | 0.31 | 0.97 | |
| 3 | TJ-Yang-60 | Poplar | 622 | 3 | ✓, light | 60 | 0.40 | 5.90 | 9.56 | 0.38 | 1.05 | |
| 4 | TJ-Liu-36 | Willow | 582 | 1 | ✓, light | 36 | 0.24 | 7.30 | 9.56 | 0.23 | 1.06 | |
| 5 | TJ-Song-52 | Pine | 514 | 7 | ✓, light | 52 | 0.25 | 7.18 | 9.56 | 0.24 | 1.03 | |
| 6 | TJ-Yu-52 | Elm | 647 | 4 | ✓, light | 52 | 0.22 | 6.36 | 9.56 | 0.31 | 0.71 | |
| 7 | TJ-Yang-42 | Poplar | 583 | 2 | ✓, light | 42 | 0.49 | 5.90 | 9.56 | 0.38 | 1.29 | |
| 8 | TJ-Yang-52 | Poplar | 563 | 4 | ✓, light | 52 | 0.42 | 5.90 | 9.56 | 0.38 | 1.10 | |
| 9 | TJ-Liu-60 | Willow | 608 | 1 | ✓, light | 60 | 0.16 | 7.30 | 9.56 | 0.23 | 0.70 | |
| 10 | TJ-Huai-36 | Sophora | 498 | 5 | ✓, light | 36 | 0.22 | 7.20 | 9.56 | 0.20 | 1.12 | |
| 11 | TJ-Yu-36 | Elm | 547 | 2 | ✓, light | 36 | 0.40 | 6.36 | 9.56 | 0.31 | 1.29 | |
| 12 | TJ-Huai-60 | Sophora | 616 | 10 | ✓, light | 60 | 0.25 | 7.62 | 9.56 | 0.20 | 1.25 | |
| Liuzhou | 13 | LZ-Sha-70(a) | Spruce | 962 | 4 | x | 70 | 0.44 | 6.10 | 9.13 | 0.37 | 1.19 |
| 14 | LZ-Sha-70(b) | Spruce | 694 | 3 | x | 70 | 0.48 | 6.10 | 9.13 | 0.37 | 1.29 | |
| 15 | LZ-Sha-60 | Spruce | 724 | 9 | x | 60 | 0.36 | 6.10 | 9.13 | 0.37 | 0.97 | |
| 16 | LZ-Sha-55 | Spruce | 953 | 6 | x | 55 | 0.35 | 6.10 | 9.13 | 0.37 | 0.95 | |
| 17 | LZ-Sha-50 | Spruce | 949 | 5 | x | 50 | 0.46 | 6.10 | 9.13 | 0.37 | 1.24 | |
| 18 | LZ-Sha-45 | Spruce | 942 | 7 | x | 45 | 0.34 | 6.10 | 9.13 | 0.37 | 0.92 | |
| 19 | LZ-Sha-40(a) | Spruce | 725 | 6 | x | 40 | 0.37 | 6.10 | 9.13 | 0.37 | 1.00 | |
| 20 | LZ-Sha-40(b) | Spruce | 956 | 7 | x | 40 | 0.31 | 6.10 | 9.13 | 0.37 | 0.84 | |
| 21 | LZ-Sha-30(a) | Spruce | 704 | 5 | x | 30 | 0.39 | 6.10 | 9.13 | 0.37 | 1.05 | |
| 22 | LZ-Sha-30(b) | Spruce | 650 | 5 | x | 30 | 0.39 | 6.10 | 9.13 | 0.37 | 1.05 | |
| 23 | LZ-Sha-30(c) | Spruce | 659 | 5 | x | 30 | 0.33 | 6.10 | 9.13 | 0.37 | 0.89 | |
| 24 | LZ-Sha-30(d) | Spruce | 661 | 4 | x | 30 | 0.36 | 6.10 | 9.13 | 0.37 | 0.97 | |
| 25 | LZ-Sha-30(e) | Spruce | 629 | 5 | x | 30 | 0.44 | 6.10 | 9.13 | 0.37 | 1.19 | |
| 26 | LZ-Sha-25 | Spruce | 602 | 6 | x | 25 | 0.36 | 6.10 | 9.13 | 0.37 | 0.97 | |
| 27 | LZ-Sha-20 | Spruce | 617 | 6 | x | 20 | 0.39 | 6.10 | 9.13 | 0.37 | 1.05 | |
| 28 | LZ-Sha-15 | Spruce | 645 | 7 | x | 15 | 0.34 | 6.10 | 9.13 | 0.37 | 0.92 | |
| 29 | LZ-Sha-10 | Spruce | 617 | 5 | x | 10 | 0.45 | 6.10 | 9.13 | 0.37 | 1.22 | |
| Average ratio (E/T):1.051 Dispersion coefficient of Ratio (E/T): 15.10% | ||||||||||||
Disclaimer/Publisher’s Note: The statements, opinions and data contained in all publications are solely those of the individual author(s) and contributor(s) and not of MDPI and/or the editor(s). MDPI and/or the editor(s) disclaim responsibility for any injury to people or property resulting from any ideas, methods, instructions or products referred to in the content. |
© 2023 by the authors. Licensee MDPI, Basel, Switzerland. This article is an open access article distributed under the terms and conditions of the Creative Commons Attribution (CC BY) license (https://creativecommons.org/licenses/by/4.0/).
Share and Cite
Tian, P.; Qiu, H.; Han, J.; Li, H.; Han, X. Prediction Model of Shrinkage Crack Propagation in Cross-Section of Timber Components. Buildings 2023, 13, 2505. https://doi.org/10.3390/buildings13102505
Tian P, Qiu H, Han J, Li H, Han X. Prediction Model of Shrinkage Crack Propagation in Cross-Section of Timber Components. Buildings. 2023; 13(10):2505. https://doi.org/10.3390/buildings13102505
Chicago/Turabian StyleTian, Panpan, Hongxing Qiu, Jianhong Han, Hongmin Li, and Xia Han. 2023. "Prediction Model of Shrinkage Crack Propagation in Cross-Section of Timber Components" Buildings 13, no. 10: 2505. https://doi.org/10.3390/buildings13102505
APA StyleTian, P., Qiu, H., Han, J., Li, H., & Han, X. (2023). Prediction Model of Shrinkage Crack Propagation in Cross-Section of Timber Components. Buildings, 13(10), 2505. https://doi.org/10.3390/buildings13102505