Article

Multi-Response Optimization on Hydrated Calcium Aluminate Rich Ternary Binders Using Taguchi Design of Experiments and Principal Component Analysis

1
Institute of Ceramics, Refractories and Composite Materials, TU Bergakademie Freiberg, 09599 Freiberg, Germany
2
School of Civil and Environmental Engineering, Georgia Tech, 790 Atlantic Drive, Atlanta, GA 30332, USA
3
Department of Physics, Faculty of Natural Sciences, University of Tetovo, Ilindenska nn, 1200 Tetovo, North Macedonia
4
Faculty of Medicine, University of Prishtina, Boulevard of Martyrs, pn 10000, 38220 Prishtina, Kosovo
*
Author to whom correspondence should be addressed.
Buildings 2023, 13(10), 2494; https://doi.org/10.3390/buildings13102494
Submission received: 21 August 2023 / Revised: 18 September 2023 / Accepted: 28 September 2023 / Published: 30 September 2023
(This article belongs to the Special Issue Advances in Modeling and Characterization of Cementitious Composites)

Abstract

:
This study investigates the influence of various factors on the performance of ternary binders, utilizing statistical approaches. The research focuses on the influence of varying compositions of Portland Cement-Calcium Aluminate Cement-Calcium Sulphate (PC-CAC-CŜ), types and amounts of mineral powders, and chemical admixtures in ternary binders. Using the Taguchi design, the study required a limited number of experimental trials, utilizing a standard orthogonal array of seven factors across three levels. These factors encompassed binder composition (C1-C2-C3), mineral powder types (limestone, quartz, slag), replacement ratio (0%, 25%, 50%), retarder (0%, 0.1%, 0.2%), superplasticizer, viscosity modifying agent (stabilizer) and accelerator (0%, 0.05%, 0.1%). Measurements on hydration kinetics, dimensional stability, compressive strength, and microstructural analyses like X-ray diffraction were conducted. Principal Component Analysis (PCA) was employed to interpret the continuous data derived from heat of hydration curves, length change curves and X-ray diffraction (XRD) patterns. Results indicated that retarder quantity and binder type significantly impacted paste workability. Higher powder content led to reduced strength, whereas increased accelerator improved strength. A strong correlation was observed between accelerator content and the dimensional stability. The primary hydration product’s formation was predominantly influenced by the PC-CAC-CŜ ratio, accelerator, and cement substitutions.

1. Introduction

1.1. Ternary Binder Systems

Ternary binder systems comprise three distinct materials: Portland cement (PC), Calcium Aluminate Cement (CAC), and calcium sulphate (CŜ). Over recent decades, sources of calcium aluminates and calcium sulfate have been integrated into PC-based formulations to enhance rapid setting, early strength, and mitigate plastic shrinkage [1]. Two primary categories of mixtures, PC-dominated and CAC-dominated, emerge depending on the industrial application. PC-dominated systems primarily contain PC, supplemented with moderate CAC or CAC/CŜ, which governs critical properties such as shrinkage, setting and strength. Conversely, CAC-dominated systems, recognized for their expanding and rapid-drying properties, have been developed. Both binary systems of PC-CAC and ternary systems combined with various calcium sulfate sources (such as anhydrite, gypsum, or hemihydrate) have been thoroughly investigated concerning mechanical properties, hydration processes, and microstructural development [2,3,4,5,6,7,8,9,10]. Mixtures based on PC or CAC, with or without CŜ, exhibit distinct hydration kinetics compared to pure PC or CAC [11].
The PC clinker consists of four phases: two calcium silicates (C3S and C2S), one calcium aluminate (C3A), and ferrite (C4AF). C3S and C3A significantly contribute to early hydration, while C2S imparts late properties to the cement. Ettringite (AFt) forms within the first few minutes due to the reaction of C3A with sulphate sources [4]. The primary phases of calcium aluminates cement are monocalcium aluminate (CA) and CA2, with silica also present in the form of C2S and C2AS. AFt is the initial phase formed due to hydration mechanisms in the presence of sulfate. In the presence of C2S, C-S-H and C2ASH8 can also form [12,13]. Rapid formation of ettringite leads to high early strength, fast hardening, and expansion [4]. Organic fillers [14,15,16], and chemical admixtures [17,18], can be added to these complex binders to achieve specific technological properties. Recent research by Wolf et al. [19], demonstrates the effect of lithium carbonate (Li2CO3) addition on the hydration kinetics of ternary blends. They found that the addition of Li2CO3 to ternary binders of CSA-OPC and anhydrite accelerates the dissolution of C3S and ye’elimite and the precipitation of ettringite.
Previous studies on ternary binders suggest that blends of PC and CAC can be utilized to combine their technological benefits and regulate specific properties such as setting time, shrinkage, or expansion. Moreover, these combinations contribute to lower CO2 emissions compared to pure PC [5].
To date, the impact of various parameters on the properties of ternary binders has been explored primarily through classical designs. However, with recent advancements in cement science, the use of the design of experiment (DOE) approach as a statistical tool to simultaneously examine the effect of multiple factors on such complex systems has yet to be reported. Thus, to address this, the current study employed DOE in conjunction with Principal Component Analysis (PCA) to evaluate selected ternary binder compositions. Here, seven factors were varied simultaneously, examining workability, heat evolution, dimensional stability, compressive strength, and phase assemblage. The primary objectives of this study were:
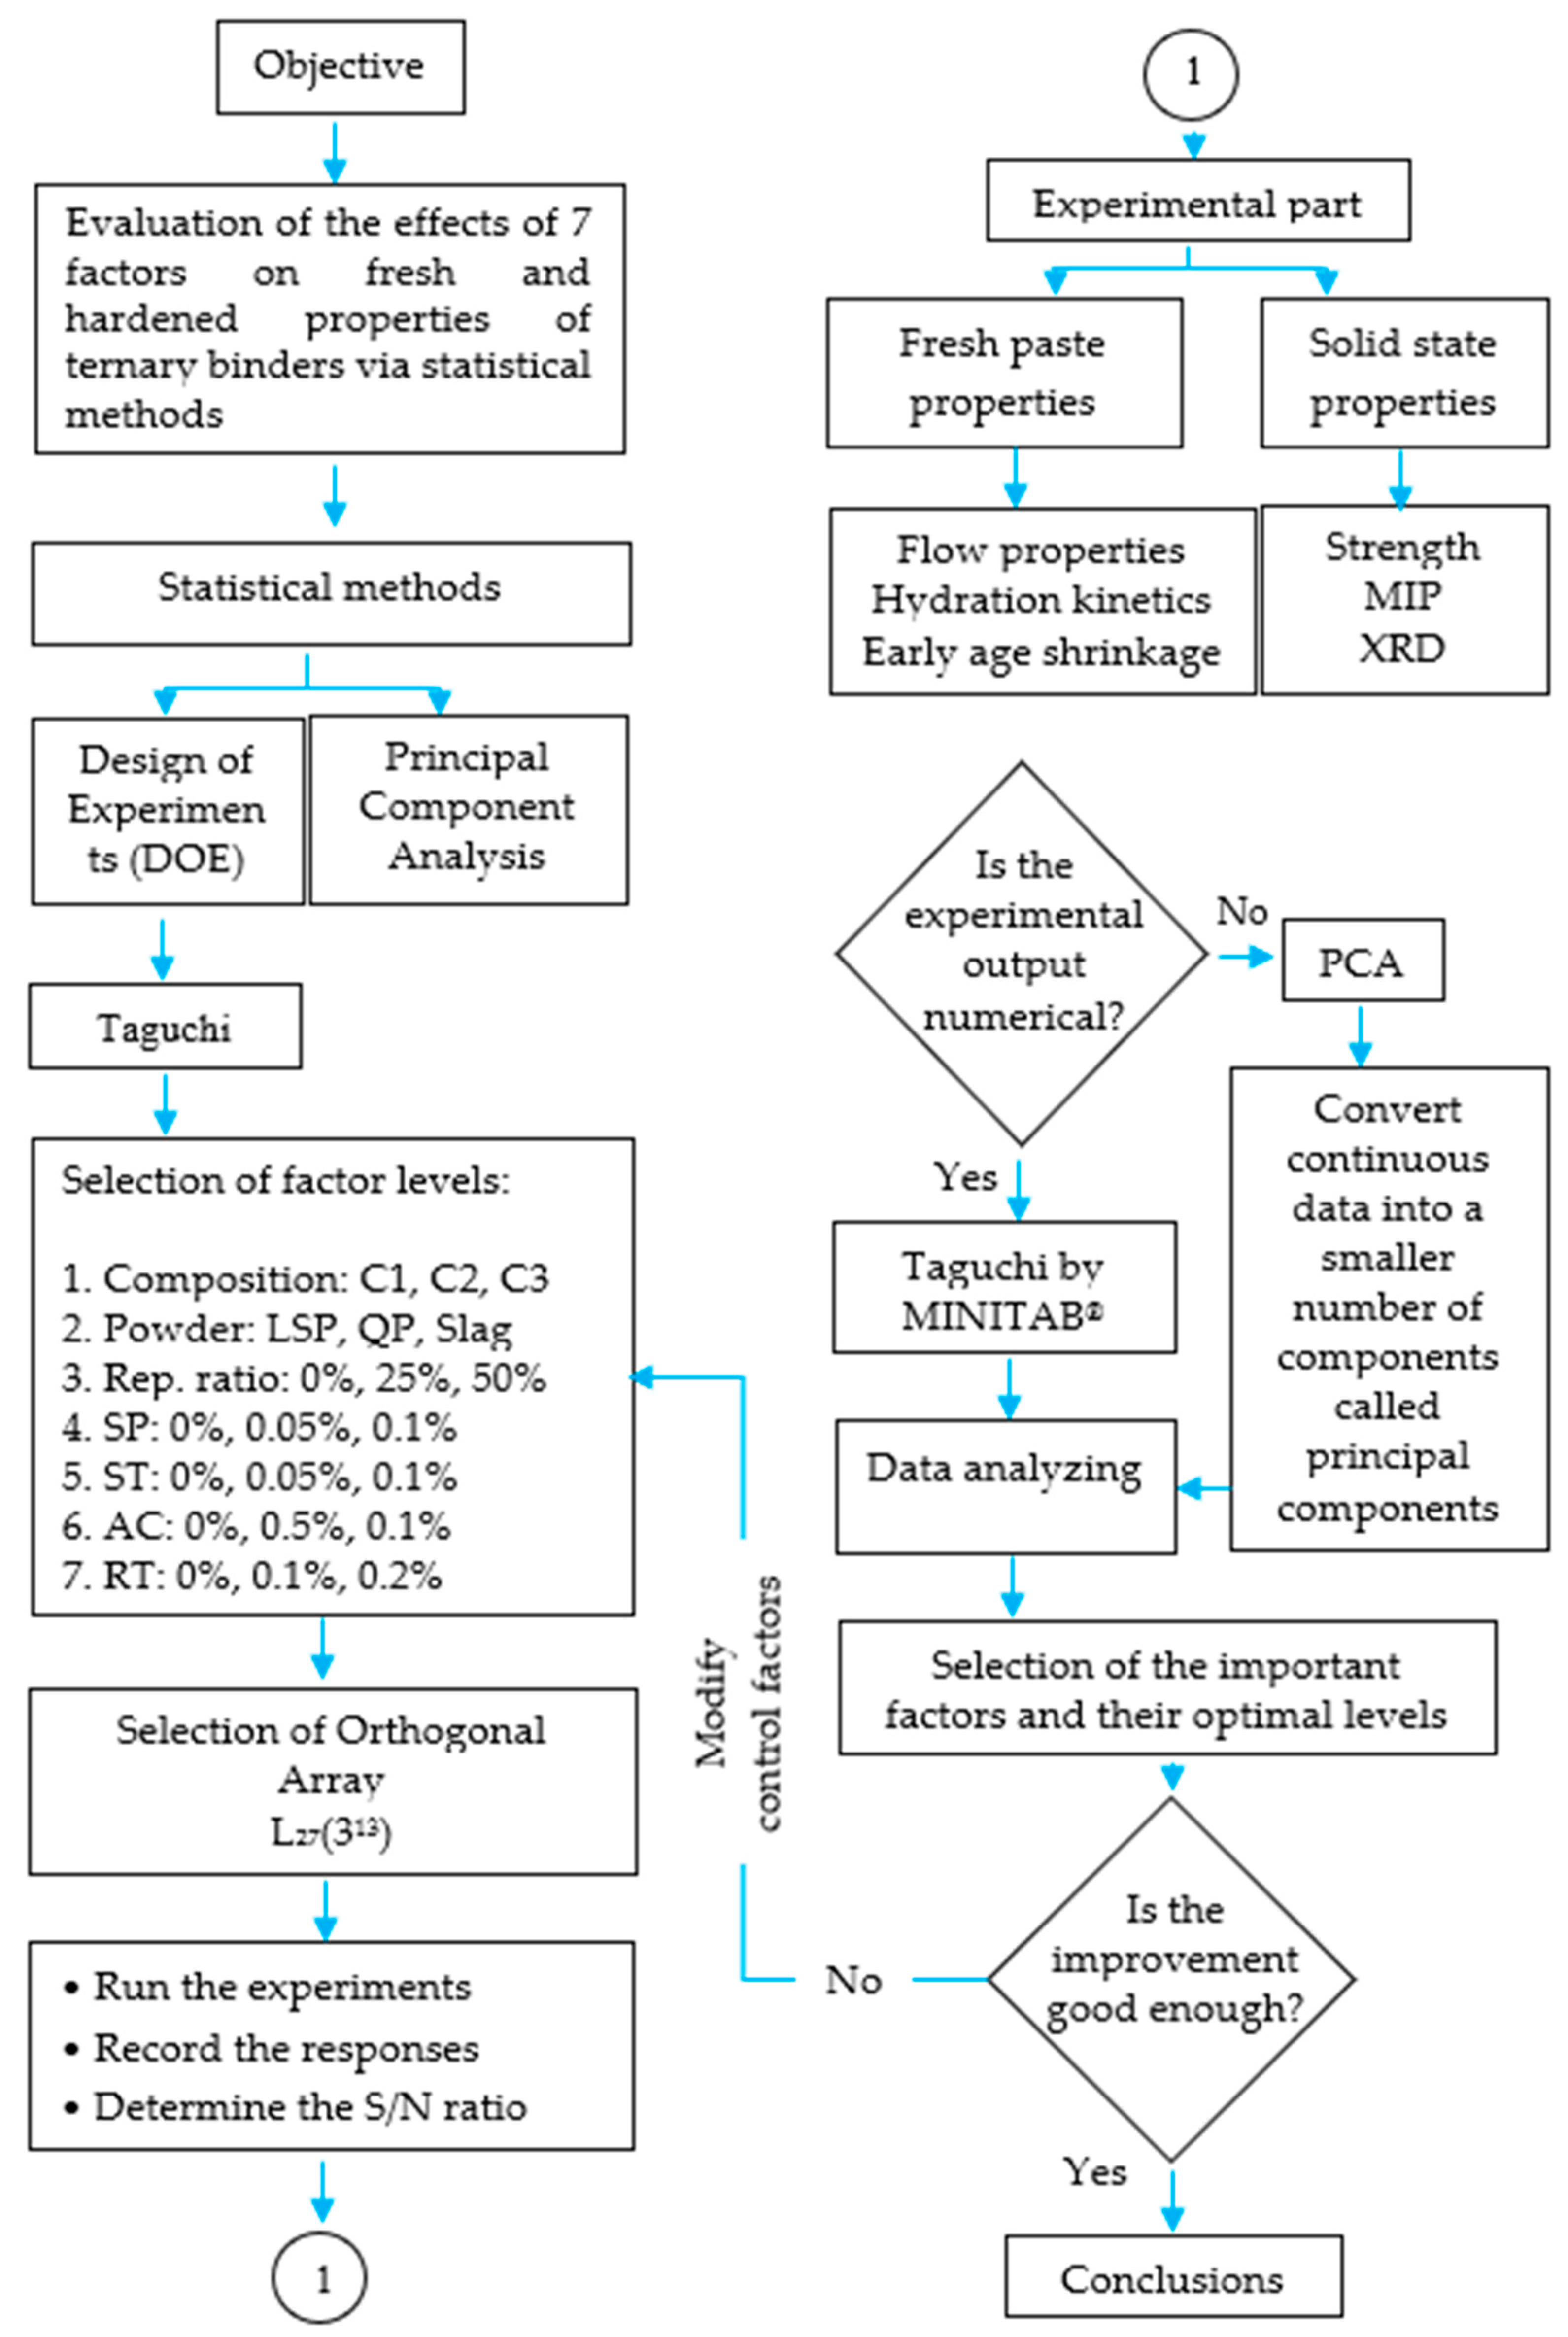
  • To investigate the impact of several controllable factors on the fresh and hardened properties of ternary binders.
  • To assess the influence of each factor on each response output and develop mathematical models.
  • To evaluate continuous data via principal component analysis, grouping variables according to specific characteristics and attempting to relate them to original factors.
  • To propose a more cost-effective method for determining the composition of ternary binders and the required quantities of admixtures for optimal conditions with minimal experimental runs.
To achieve these aims, formulations of compositions C1, C2, and C3, representing typical combinations of PC-CAC-CŜ (Figure 1) as outlined by Bier and Amathieu [20], were utilized. The findings of this study may provide a foundation for future investigations of ternary binders using statistical methods.

1.2. Statistical Models

1.2.1. Design of Experiments (DOE)

The Design of Experiments (DOE) is a statistical method used to identify the input variables that significantly influence the response of a system or process. This involves strategically planning and conducting experiments, then analyzing the data to reach substantial conclusions [21]. Generally, the system or process can be depicted as shown in Figure 2, including various controllable and uncontrollable factors. The controllable factors are like adjustable inputs in the process, while the uncontrollable ones can be environmental factors or certain material properties [22]. A comprehensive and widely used DOE method is factorial design, which tests all possible combinations of all factors across their different levels. It becomes particularly handy when considering multiple factors and their interactions [23]. However, for experiments with many factors, a fractional factorial design can be used to reduce the number of necessary runs, focusing on only a portion of the possible combinations, thereby saving time and resources [24].

1.2.2. Taguchi Method

Fractional factorial designs have found extensive applications in the fields of industrial research and process improvement. A prime example of these applications is Taguchi’s robust design. This was formulated by Genichi Taguchi as a method to enhance quality control, and it stands as a highly efficient variant of fractional factorial designs [25]. Taguchi’s approach is essentially a modified Design of Experiments (DOE) methodology, which is used for planning and conducting experiments. It is an innovative method that was first developed by Dr. Genichi Taguchi [26], following the inception of the original DOE by R. A. Fisher [27]. The primary goal of this method is to minimize the number of experiments that need to be conducted, and this is achieved using special tables known as orthogonal arrays (OA).
One distinctive feature of Taguchi’s method is the importance it places on reducing the variation around the target. Taguchi incorporated a unique approach to treat noise factors, thereby developing an effective way to study their influence. The result of this unique approach is a “robust” design that is only minimally affected by noise, leading to a high signal-to-noise (S/N) ratio [28].
Among the key aspects defined in this method is the “quality loss function”. This function relates to the losses that are incurred when the output deviates from the set specification limits. The loss function indicates that any deviation from the target results in a loss, and a successful outcome is one where the variation from the target is minimal [25,29]. The quality loss function can be categorized into three types: nominal-the-best, smaller-the-better, and larger-the-better (Figure 3). Each of these functions represents a specific goal of the experiment: achieving a specific target, minimizing the result, or maximizing the result, respectively [25]. The Taguchi method has been successfully applied across a wide array of research fields, notably within the “construction chemistry industry”. In the field of construction materials, the optimization of the mechanical properties of concrete represents one of the most dominant applications of the DOE [30]. A multitude of studies have been conducted on the optimization of bleeding on cement-based grouts, the optimization of concrete strengthened with polymer after high temperature, and the optimization of self-compacting concrete or alkali-activated mortar properties using the screening design or the Taguchi approach. These studies stand as testament to the effectiveness of the different DOE methods [31,32,33,34,35].

1.2.3. Principal Component Analysis (PCA)

Principal Component Analysis (PCA), an established mathematical technique and vector space transform, holds the distinction of being one of the oldest and most frequently used methods derived from applied linear algebra for extracting valuable information from extensive data sets [36]. The primary objective of PCA is to extract essential data from a complex table and represent this data as a new set of orthogonal variables. This process involves a mathematical transformation that reduces a large controllable number of variables into a fewer uncontrollable number of elements, known as principal components [37]. PCA also represents the patterns of similarities and differences in observed variables by mapping them as points [38].
From a mathematical perspective, PCA is defined by eigenvectors and eigenvalues. These are numerical values and vectors associated with square matrices.
The first principal component (Z1) is exemplified by the uncorrelated function Equation (1), and is expressed as a linear combination of the response variables X1, X2, …, Xp.
Z 1 = a 11 X 1 + a 12 X 2 + + a 1 p X p
The coefficients of this principal component ( a 11 ,   a 12 , ) are the eigenvectors, and they must satisfy the condition that: a 11 2 + a 12 2 + + a 1 p 2 = 1 [39].
The first principal component is determined such that it accounts the maximum variance in the data, followed by the second, and so on. While there is no fixed rule regarding the number of components to be considered, it is typical to select those components with an eigenvalue of one or more.
In this study, PCA was utilized to analyze continuous data derived from the heat of hydration curves, length change curves and XRD patterns. This was achieved by reducing them to principal components, which explain the maximum amount of variance, and then interpreting these components in terms of the original variables.

2. Materials and Methods

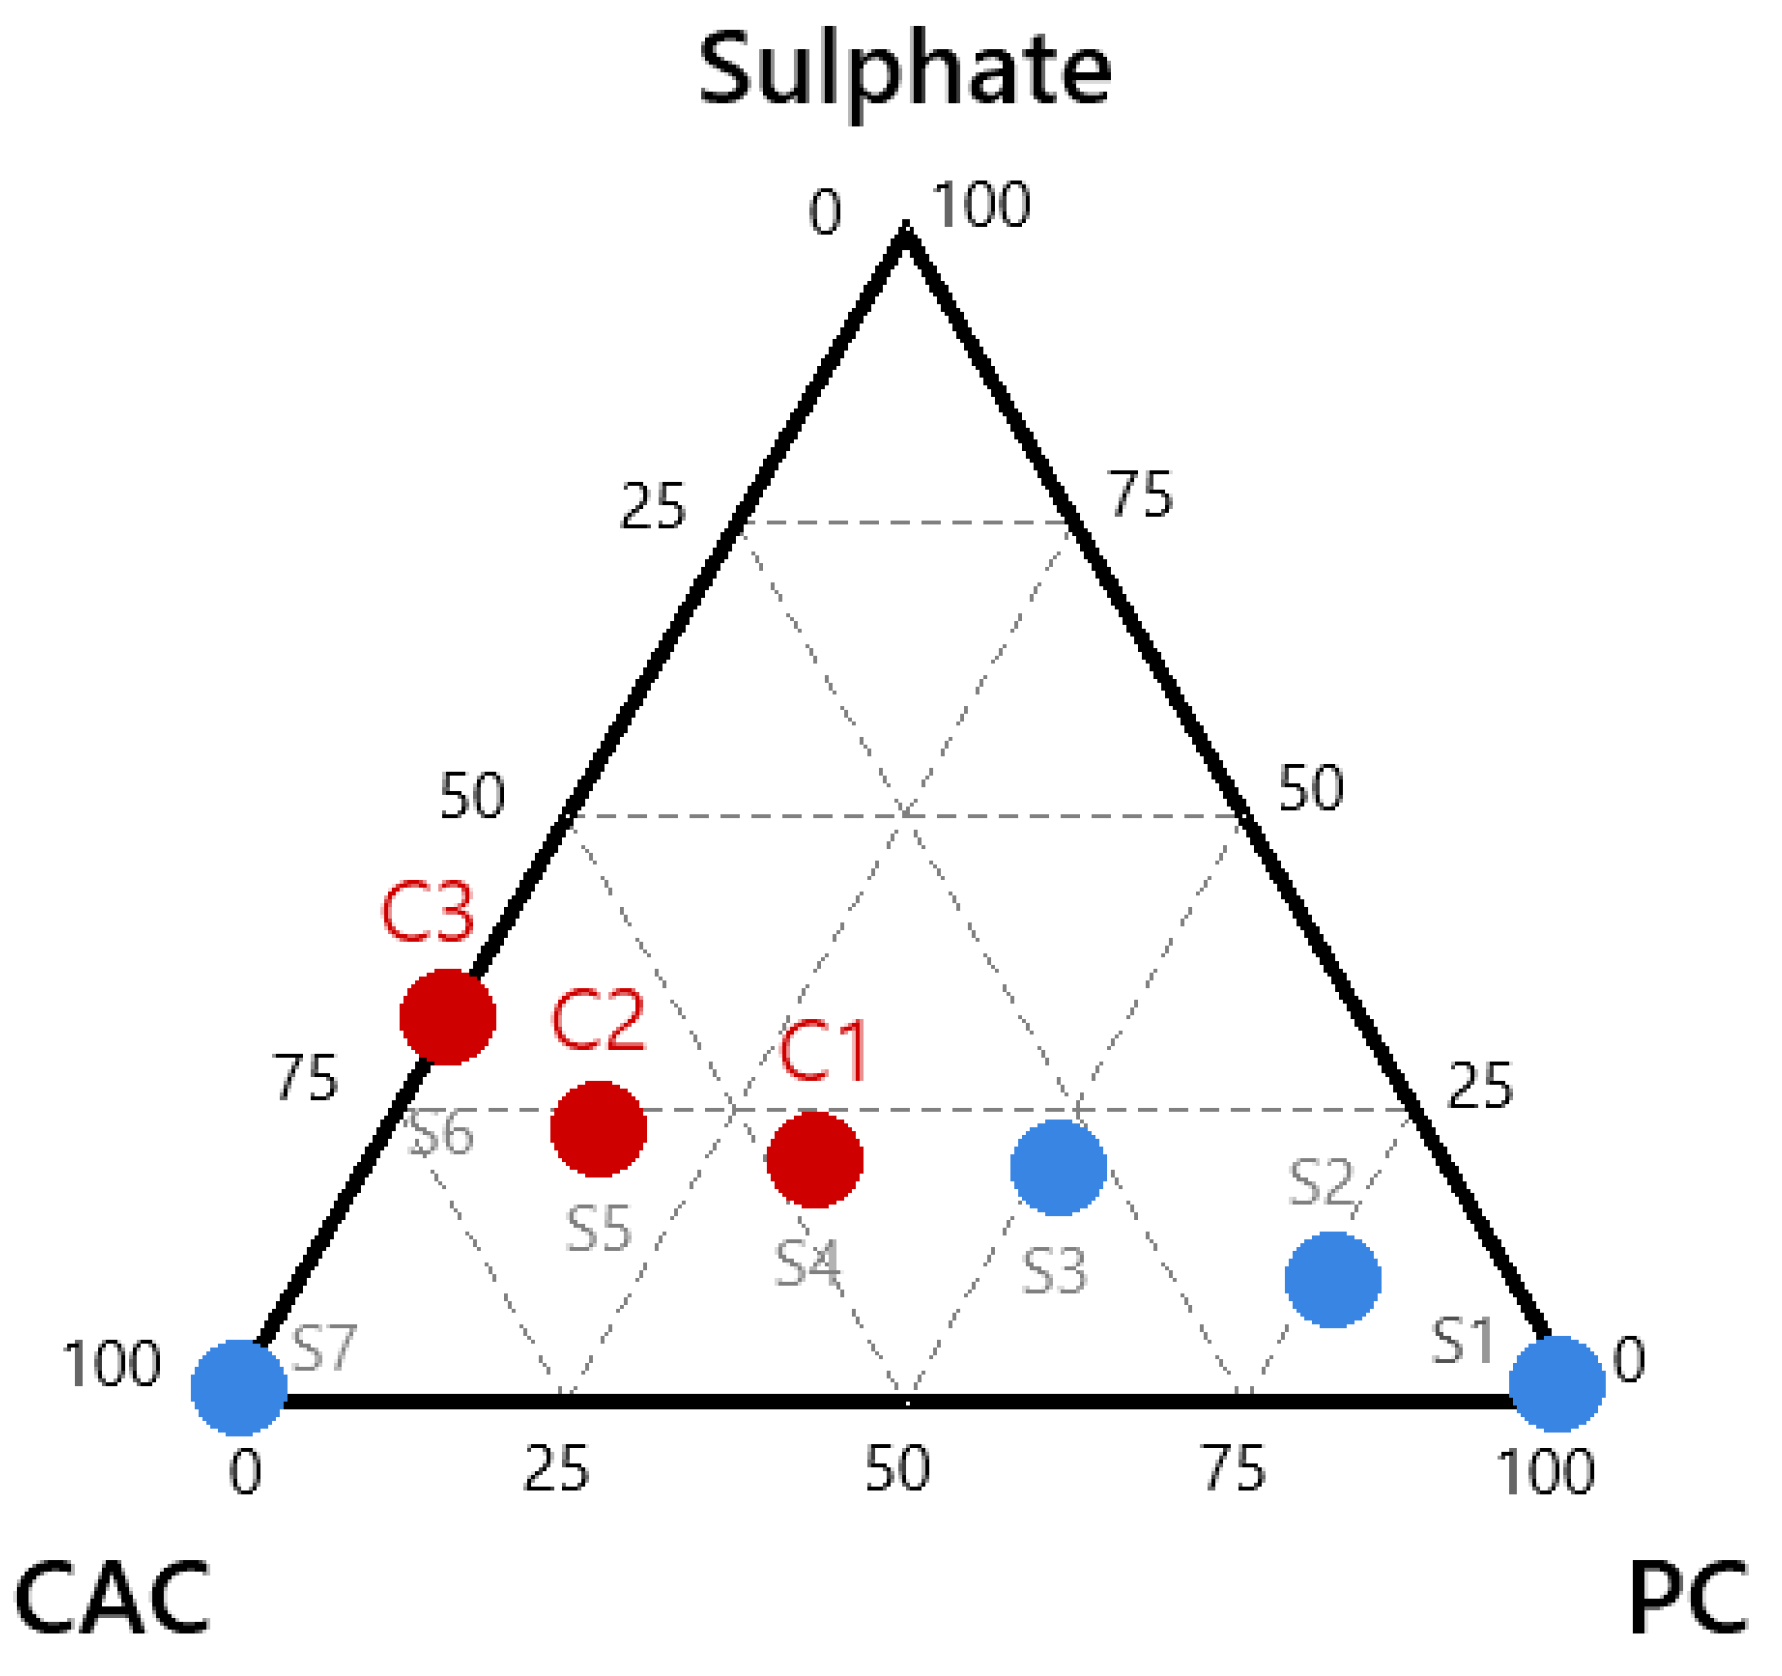
2.1. Materials and Compositions

Investigations were carried out in ternary and quaternary binder paste specimens. The paste series included Portland cement, calcium aluminate cement, calcium sulphate, and additional components such as limestone powder, ground-granulated blast-furnace slag (GGBFS), or quartz powder. CEM I 42.5 R (Opterra) was used as the Portland cement, Fondu (IMERYS) as the calcium aluminate cement and anhydrite (Raddichem) as a sulfate source. X-ray fluorescence (XRF) and X-ray diffraction (XRD) were used to characterize the chemistry and mineralogy of the anhydrous raw materials used, and the results are represented in Table 1 and Table 2. Table 3 summarizes the formulations of each of the investigated compositions. Four chemical admixtures were additionally used. A polycarboxylic ether-based superplasticizer (PCE) of type Melflux® 2561 F, a viscosity modifying agent (stabilizer) of the type Starvis® 3003 F supplied by BASF, lithium carbonate (Li2CO3) as accelerator and citric acid as retarder. All experiments maintained a water-to-solid (binder along with limestone and quartz powder as well as the slag) ratio of 0.4. The mixing procedure involved adding water to the premixed powder and blending the material in a Hobart-type mixer at a low rotation speed of 62 ± 5 rpm for 90 s. Manual mixing followed for 30 s to clean the bowl’s walls, and a final high-speed mix at 125 ± 10 rpm for another 90 s.
This study selected seven controllable factors at three levels (Table 4). An L27(313) orthogonal array, of 7 factors and 27 experimental runs has been chosen as an appropriate layout to determine the optimum combination of the levels of these factors (Table 5). Figure 4 provides a schematic diagram of the key steps in investigating ternary binders via the Taguchi approach. As shown, the factors and their levels were selected, the appropriate orthogonal array was chosen, and experiments were conducted in a random sequence to prevent systematic errors. Experiments on fresh and solid states were conducted, and the output results underwent statistical evaluation. The Taguchi approach was employed to analyze numerical results such as flow, cumulative heat of hydration values, compressive strength and cumulative pore volume. Furthermore, PCA was used to analyze heat of hydration curves, length change curves, MIP pore size distribution curves and XRD patterns, since the Taguchi method cannot evaluate a continuous set of data.

2.2. Analytical Methods

2.2.1. Flow Test

The slump flow test is used to assess the horizontal free flow of pastes using Hägermann’s mini cone (6 × 7 × 10 cm3), according to DIN 1015-3. Upon filling the cone with the paste, it is lifted, allowing the material to spread freely. The mean value of the diameters measured in two perpendicular directions is recorded.

2.2.2. Calorimetry

Isothermal conduction calorimetry was used in this work to determine the heat of hydration of the cement pastes during the initial 24 h. Approximately 6 g of dry material were placed into plastic forms, followed by the injection of water—an approach known as the injection method.

2.2.3. Early Age Stability

Length change tests were performed using a modified German “Schwindrinne” apparatus measuring 4 × 6 × 25 cm3. It includes a movable gate and a linear transducer linked to a data collector converting length into digital signals. The linear transducer was centrally positioned for detecting length changes (positive and negative). Specimens had a standardized initial length of approximately 25 cm.

2.2.4. Strength

Flexural and Compressive tests are performed. Prisms (40 × 40 × 160 mm3) of the prepared samples were put in a climate-controlled chamber with 100% relative humidity for the initial 24 h. Following this, the demolded specimens were water-cured at 20 ± 1 °C until strength testing at seven days.

2.2.5. Mercury Intrusion Porosimetry (MIP)

The MIP method, used to calculate pore size distribution and total porosity of hardened pastes, relies on the principle that a non-wetting liquid (mercury) requires controlled pressure inversely proportional to the pore diameter for penetration. The intrusion volume of mercury and applied pressure offer specific data that, through the Washburn equation (Equation (2)), can be converted into pore diameter.
P H g = 4 γ cos θ d
Here, γ represents the surface tension of mercury and θ denotes the contact angle between the material and mercury [40,41]. For this study, the hydration process of the samples was stopped after 7 days, and then the solvent exchange method was applied.

2.2.6. X-ray Diffraction (XRD)

X-ray powder diffraction analyses were performed by a PANalytical X’pert Pro MPD. The angular 2θ-range goes from 7.5° to 90° with a step width of 0.013°, and a step time of 30 s. This leads to a total scanning time of 13 min. The samples were prepared using the back-loading technique to minimize preferred orientation.

2.2.7. Minitab

In this study, MINITAB® was used as a statistical software program. DOE in MINITAB offers various designs, including Screening, Factorial, Response Surface, Mixture and Taguchi design [42]. For this study purposes, the Taguchi design was found suitable and the Analysis of variance (ANOVA) was further employed as a statistical tool to assess differences in group means [43].

3. Results and Discussions

3.1. Fresh Properties—Workability

The impact of seven factors—composition, type of mineral powder, replacement ratio, superplasticizer (SP), accelerator (AC), retarder (RT) and stabilizer (ST)—on the flow properties of ternary binder pastes are depicted in Figure 5. The main effects plot, expressed as the mean of means, illustrates the influence of each factor on flow results.
Figure 5 reveals that the amount of retarder (RT) used is the most influential factor on workability. As the RT amount increases, chemical reactions decelerate, prolonging the plasticity and workability of the paste. This observation is in line with prior studies that demonstrated that the use of retarder slows the hydration process and lengthens setting time, but simultaneously enhances flow properties, as corroborated by earlier research [17,44]. Besides RT, the selected composition significantly affects the flow properties. Notably, an increase in the content of calcium aluminate cement within the composition improves flow properties. ST, acting as a viscosity-modifying agent, also plays a significant role in flow properties. It was observed that initially increasing its amount from the first level (zero) to the second level (0.05 wt.%) decreases the flow, whereas further increment to the third level (0.1 wt.%) increases it (see Table 4). The main effects plot also indicates that an increase in the replacement ratio, regardless of type, results in decreased flow.
Additionally, in line with previous research, the statistical approach reveals that the addition of SP enhances the workability of the paste. The workability improvement with increased SP might be attributed to the adsorption-dispersion mechanism as the superplasticizer dosage increases [45]. Furthermore, an almost linear relationship between the fluidity of the pastes and the AC dosage was recognized. The reduction in flow values with increased accelerator dosage could be associated with the rapid formation of hydration products during the initial hydration process.
The sum of squares (SS), Mean Squares (MS), the F score (named after R. A. Fisher) and probability (P) values are tabulated in Table A1 (Appendix A). A higher F score and lower p-value indicate a considerable significance of the corresponding factor (at a confidence interval of 95% and a significance level α 5%). According to the ANOVA results for flow values, RT appears to be statistically significant, followed by the composition, with p-values of 0 and 0.061 respectively (Table A1).

3.2. Structure Build-Up

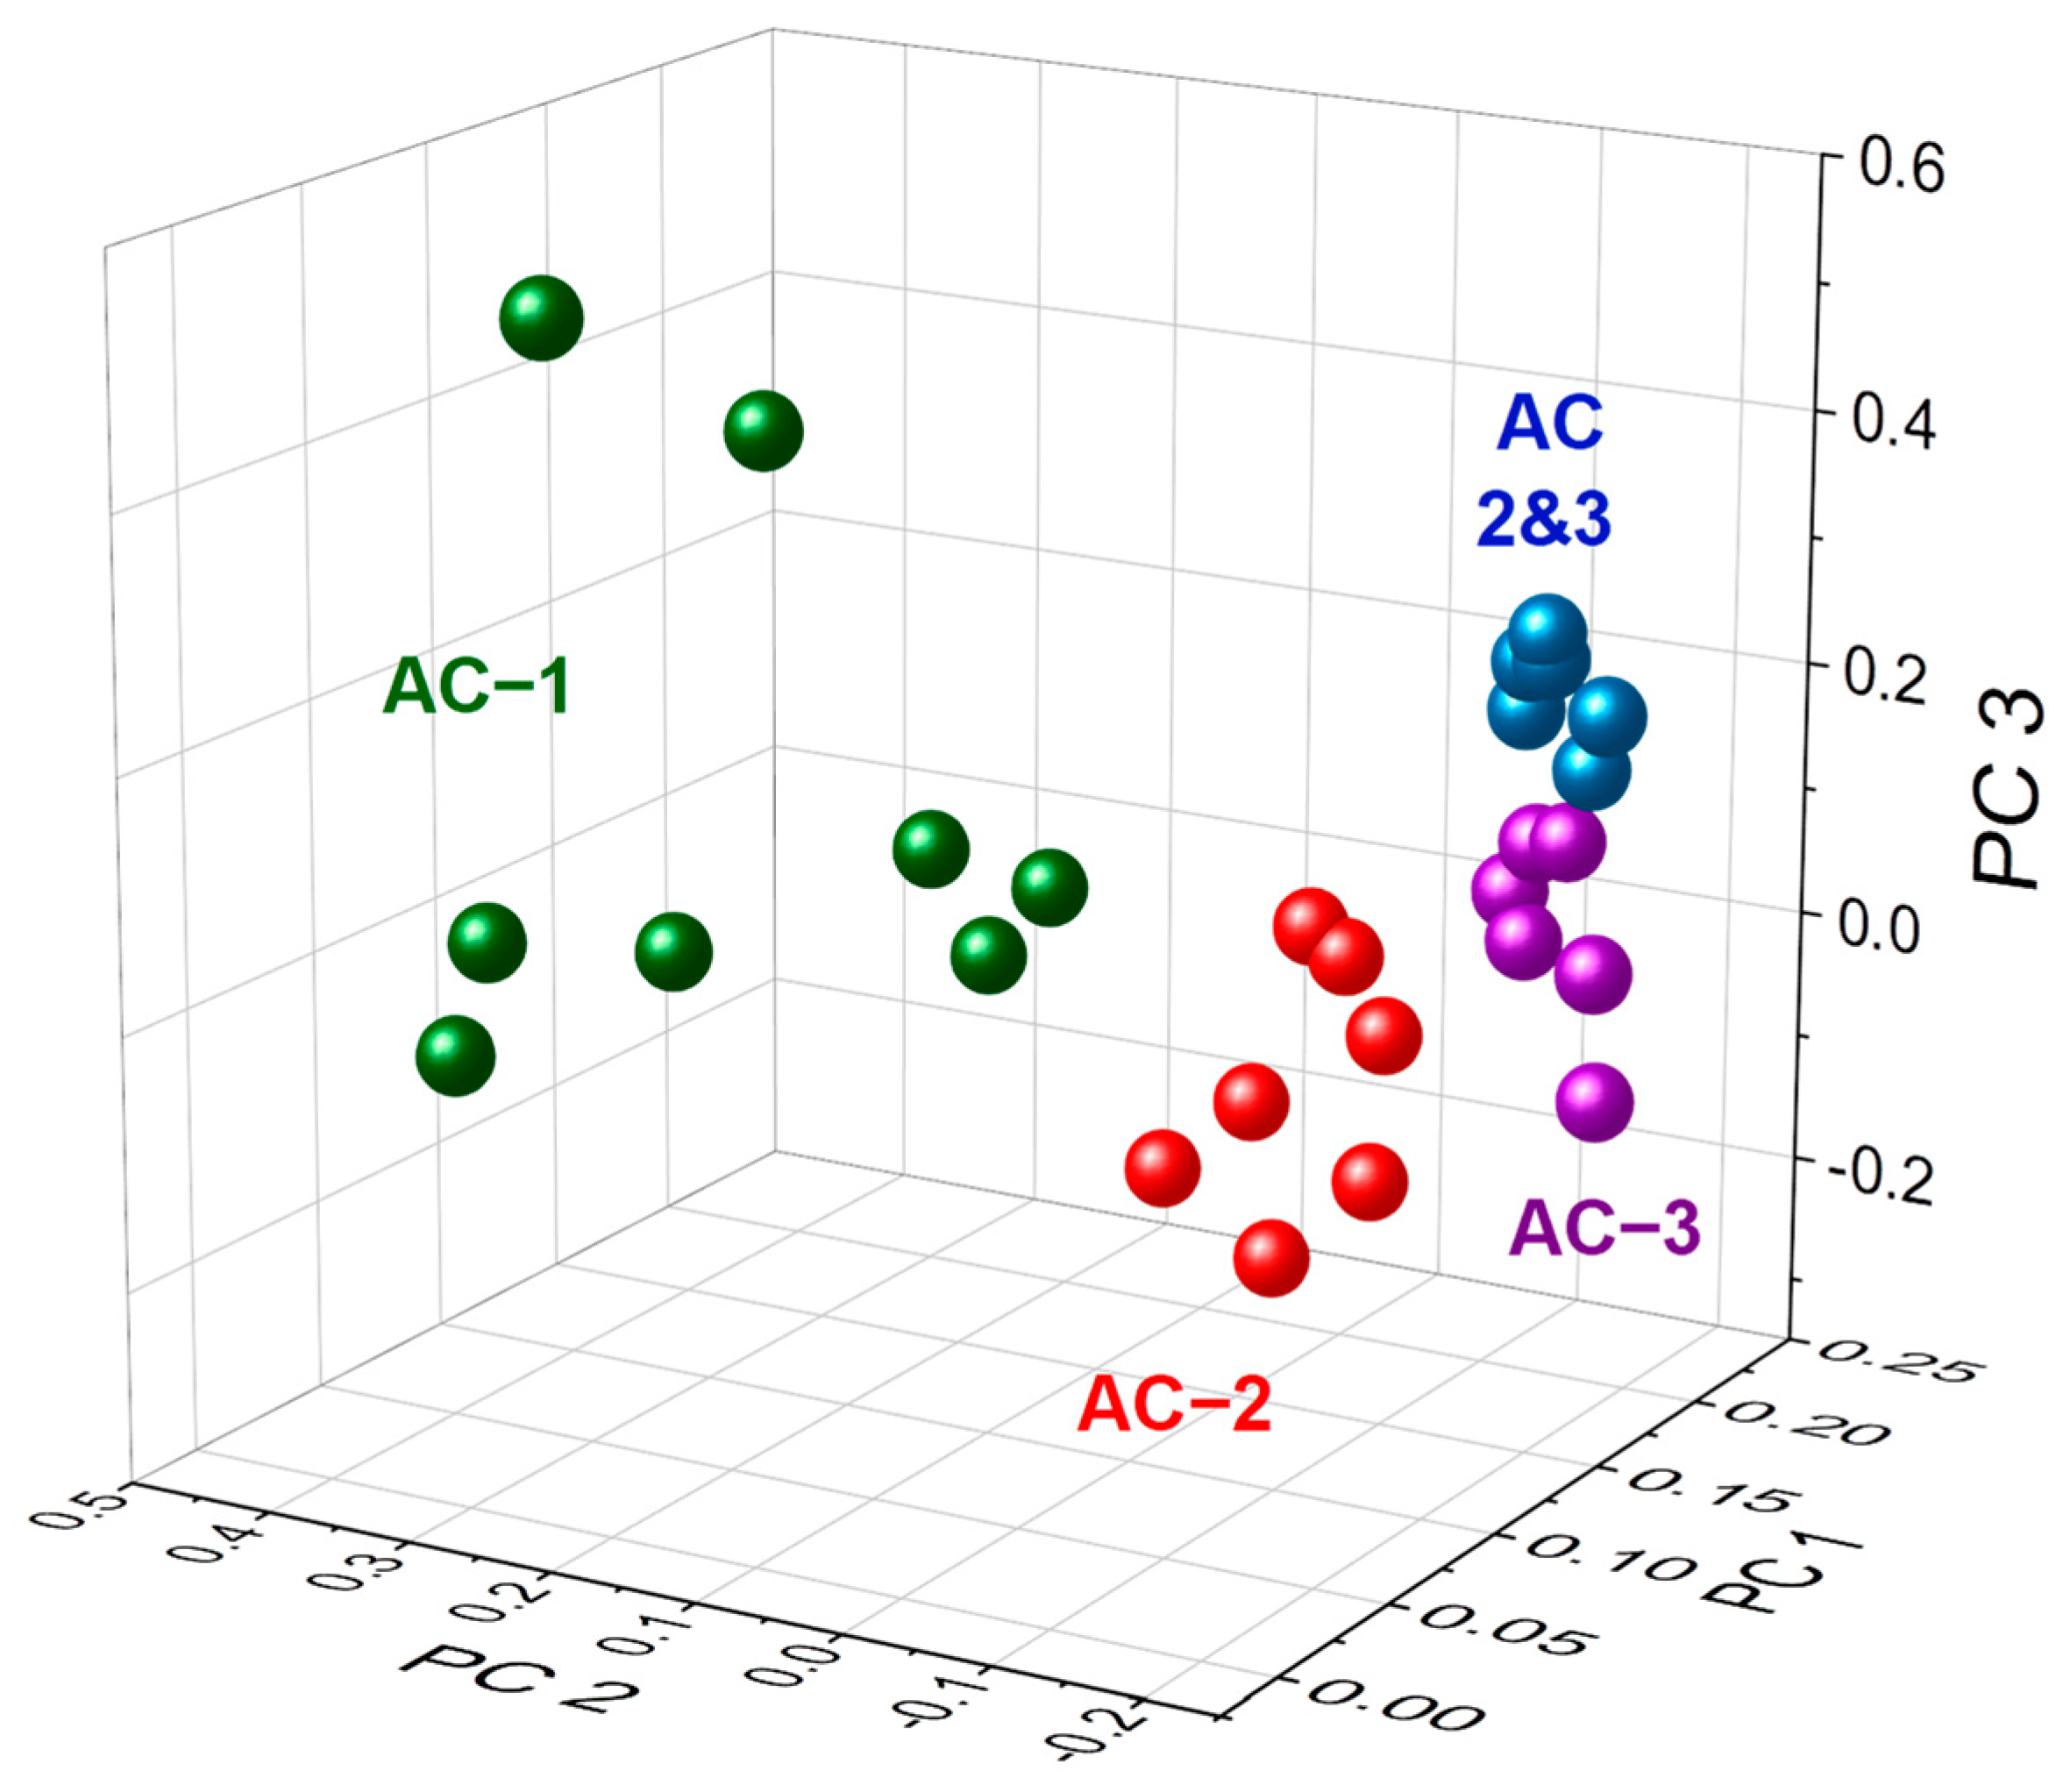
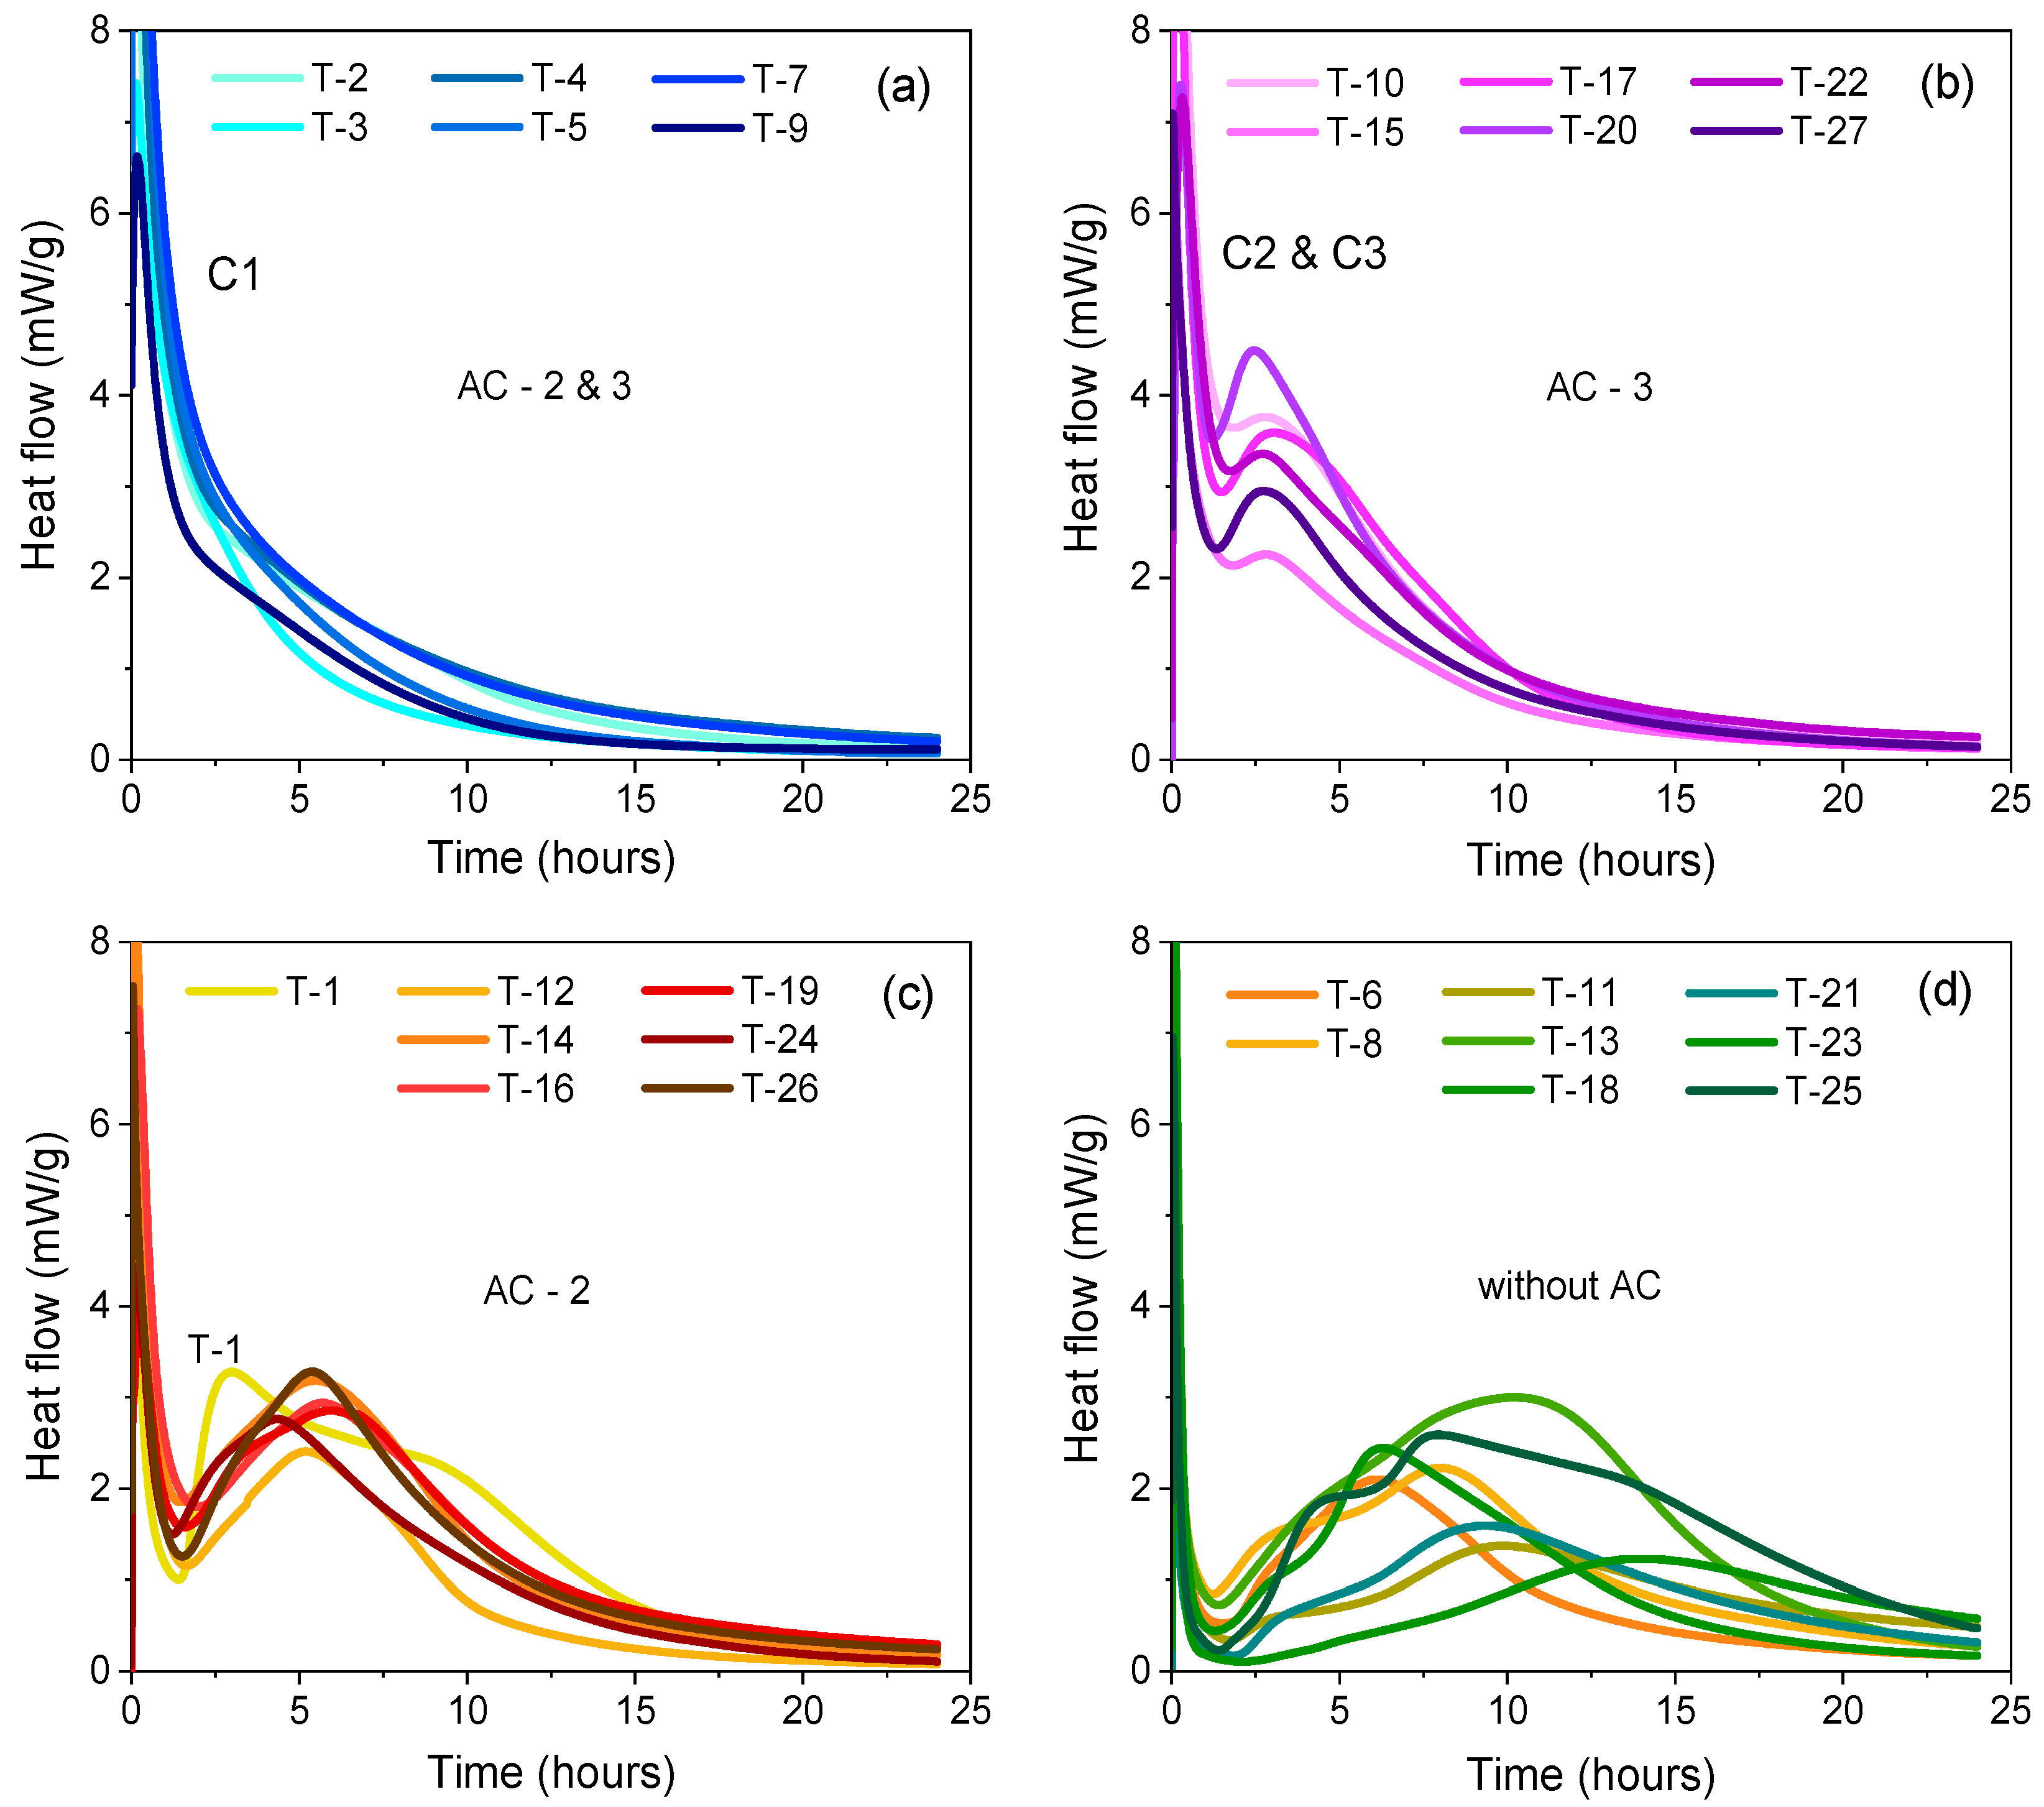
3.2.1. Hydration Kinetics

The cumulative heat of hydration over the initial 24 h for each system under investigation was computed, and the influence of each factor on the final values is demonstrated in Figure 6. The ANOVA results in Table A1 and Figure 6 highlight the significance of each factor on the cumulative heat of hydration, as indicated by a high F score and low p-value. It can be observed that the replacement ratio emerges as the most significant factor on the heat of hydration. An inverse linear relationship shows that an increase in the replacement ratio leads to a decrease in the total cumulative heat flow. The substantial effect of cement replacement by LSP, QP, or slag on the hydration rate aligns with Daman et al.’s study [46], which posits that using supplementary cementitious materials for cement replacement can reduce the rate of hydration heat.
The main effects plot reveals that the cumulative heat of hydration peaked for plain formulations without powders, without RT, but with high amounts of AC and ST, specifically in composition C2. In terms of additives, it becomes evident that citric acid as a retarder and lithium carbonate as an accelerator exert the most significant influence on total heat release. Statistical data show that RT decreases the total heat output, while the accelerator enhances it. This finding aligns perfectly with the work of Rodger and Double [47], demonstrating that the use of RT affects heat release by inhibiting nucleation, while AC promotes it. Furthermore, as Figure 6 illustrates, an increase in dosage results in an increase or decrease in heat release when using AC or RT, respectively. The heat release increase with the rise of AC dosage resonates with previous studies [19,48].
No explicit relationship was found between the heat of hydration and the use of superplasticizer. However, the main effect plot hints at a slight increase in the heat of hydration as the SP content increases from 0.05 to 0.1%. Figure 6 also suggests that the use of stabilizer impacts the heat of hydration, with an increase in cumulative heat observed as the stabilizer content increases.
The continuous data of heat of hydration curves were further examined and analyzed using Principal Component Analysis (PCA), which converted the curves into numerical data related to the principal components, as depicted in Figure 7. Eigenvalues (Table 6) suggest that the first three principal components are significant, as their eigenvalues exceed 1. These principal components account for 69.8%, 19%, and 7.3% of the variability in the data for PC1, PC2, and PC3, respectively. Collectively, these three principal components explain 96.2% of the total variance. The 3D plot (Figure 7) represents four groups of different formulations, each sharing a common characteristic, as explained below.
The heat of hydration curves for all formulations are presented in Figure 8.
Figure 8a corresponds to composition C1, with AC dosage at levels two and three, characterized by a single, intense and sharp peak in the initial minutes of hydration, corresponding to the blue cluster in Figure 7. Formulation C1 typically exhibits fast setting and hardening, hence the fast heat release during the first hydration hour. Figure 8b displays the heat flow curves of compositions C2 and C3 with AC at the third level, exhibiting two main heat release peaks.
The first peak happens in the initial minutes of water addition and is attributed to the rapid dissolution of phases during the wetting process [12]. The second, less intense and broader peak, is attributed to the precipitation of ettringite and AH3 [10], taking place 2.5 h after water contact and signifying the acceleration period. A comparison of Figure 8a,b shows that moving from composition C1 to compositions C2 and C3, accompanied by an increase in CAC content, leads to two different hydration mechanisms, evidenced by an additional peak in the heat of hydration curves. Figure 8c represents formulations C2 and C3 with AC at the second level, except for formulation T1, which refers to pure C1 without any addition of mineral powders or chemical admixtures (see Table 5). Similar to Figure 8b, two peaks can be identified, one at the start of hydration and another 5 h after hydration begins (main heat peak). The second peak occurs approximately 2 times later and is broader, likely due to a decrease in accelerator dosage from level 3 to 2.
Figure 8d showcases the heat flow curves of all formulations without AC (AC at level one, see Table 4). Apart from the initial peak in the first minutes, formulations without AC also feature two smaller precursors to the main peak event. The significant delay in the appearance of the main hydration peak compared to other formulations appears to be linked to the absence of AC.
Consistent with previous work [19], it is evident that increasing the AC dosage accelerates the hydration process. The main heat evolution peak shifts from approximately 10 h (Figure 8d) to 5 h (Figure 8c), and finally to 2.5 h (Figure 8b). When AC is at its highest level, the main heat evolution peak starts earlier and rises and falls more sharply. Earlier studies [19] showed that the accelerator directly influences the rate of ettringite formation, leading to a higher hydration rate during the initial stages of hydration (up to 48 h).
It also becomes apparent that increasing the PC content in the composition (referring to C1) causes the main hydration peak to overlap with the dissolution peak, altering the hydration kinetics. Previous work from Qoku et al. [13] confirms that the ettringite content in the CAC-CŜrich formulations (C1, C2, C3 region of the ternary diagram, (Figure 1) is relatively high. However, Qoku et al. [7] demonstrated that for formulation C1, despite the high content of PC, there is an inhibition of C-S-H and portlandite formation up to 3 months of hydration, making formulation C1 distinct in terms of hydration kinetics compared to C2 and C3. The formation of C-S-H in formulation C2 is not expected to occur and the silicate source has been demonstrated to contribute to straetlingite formation [10]. These differences in phase formation over time lead to differences in hydration kinetics, as reflected in the calorimetry heat flow curves in Figure 8a,b, and further confirmed by the PCA analysis.

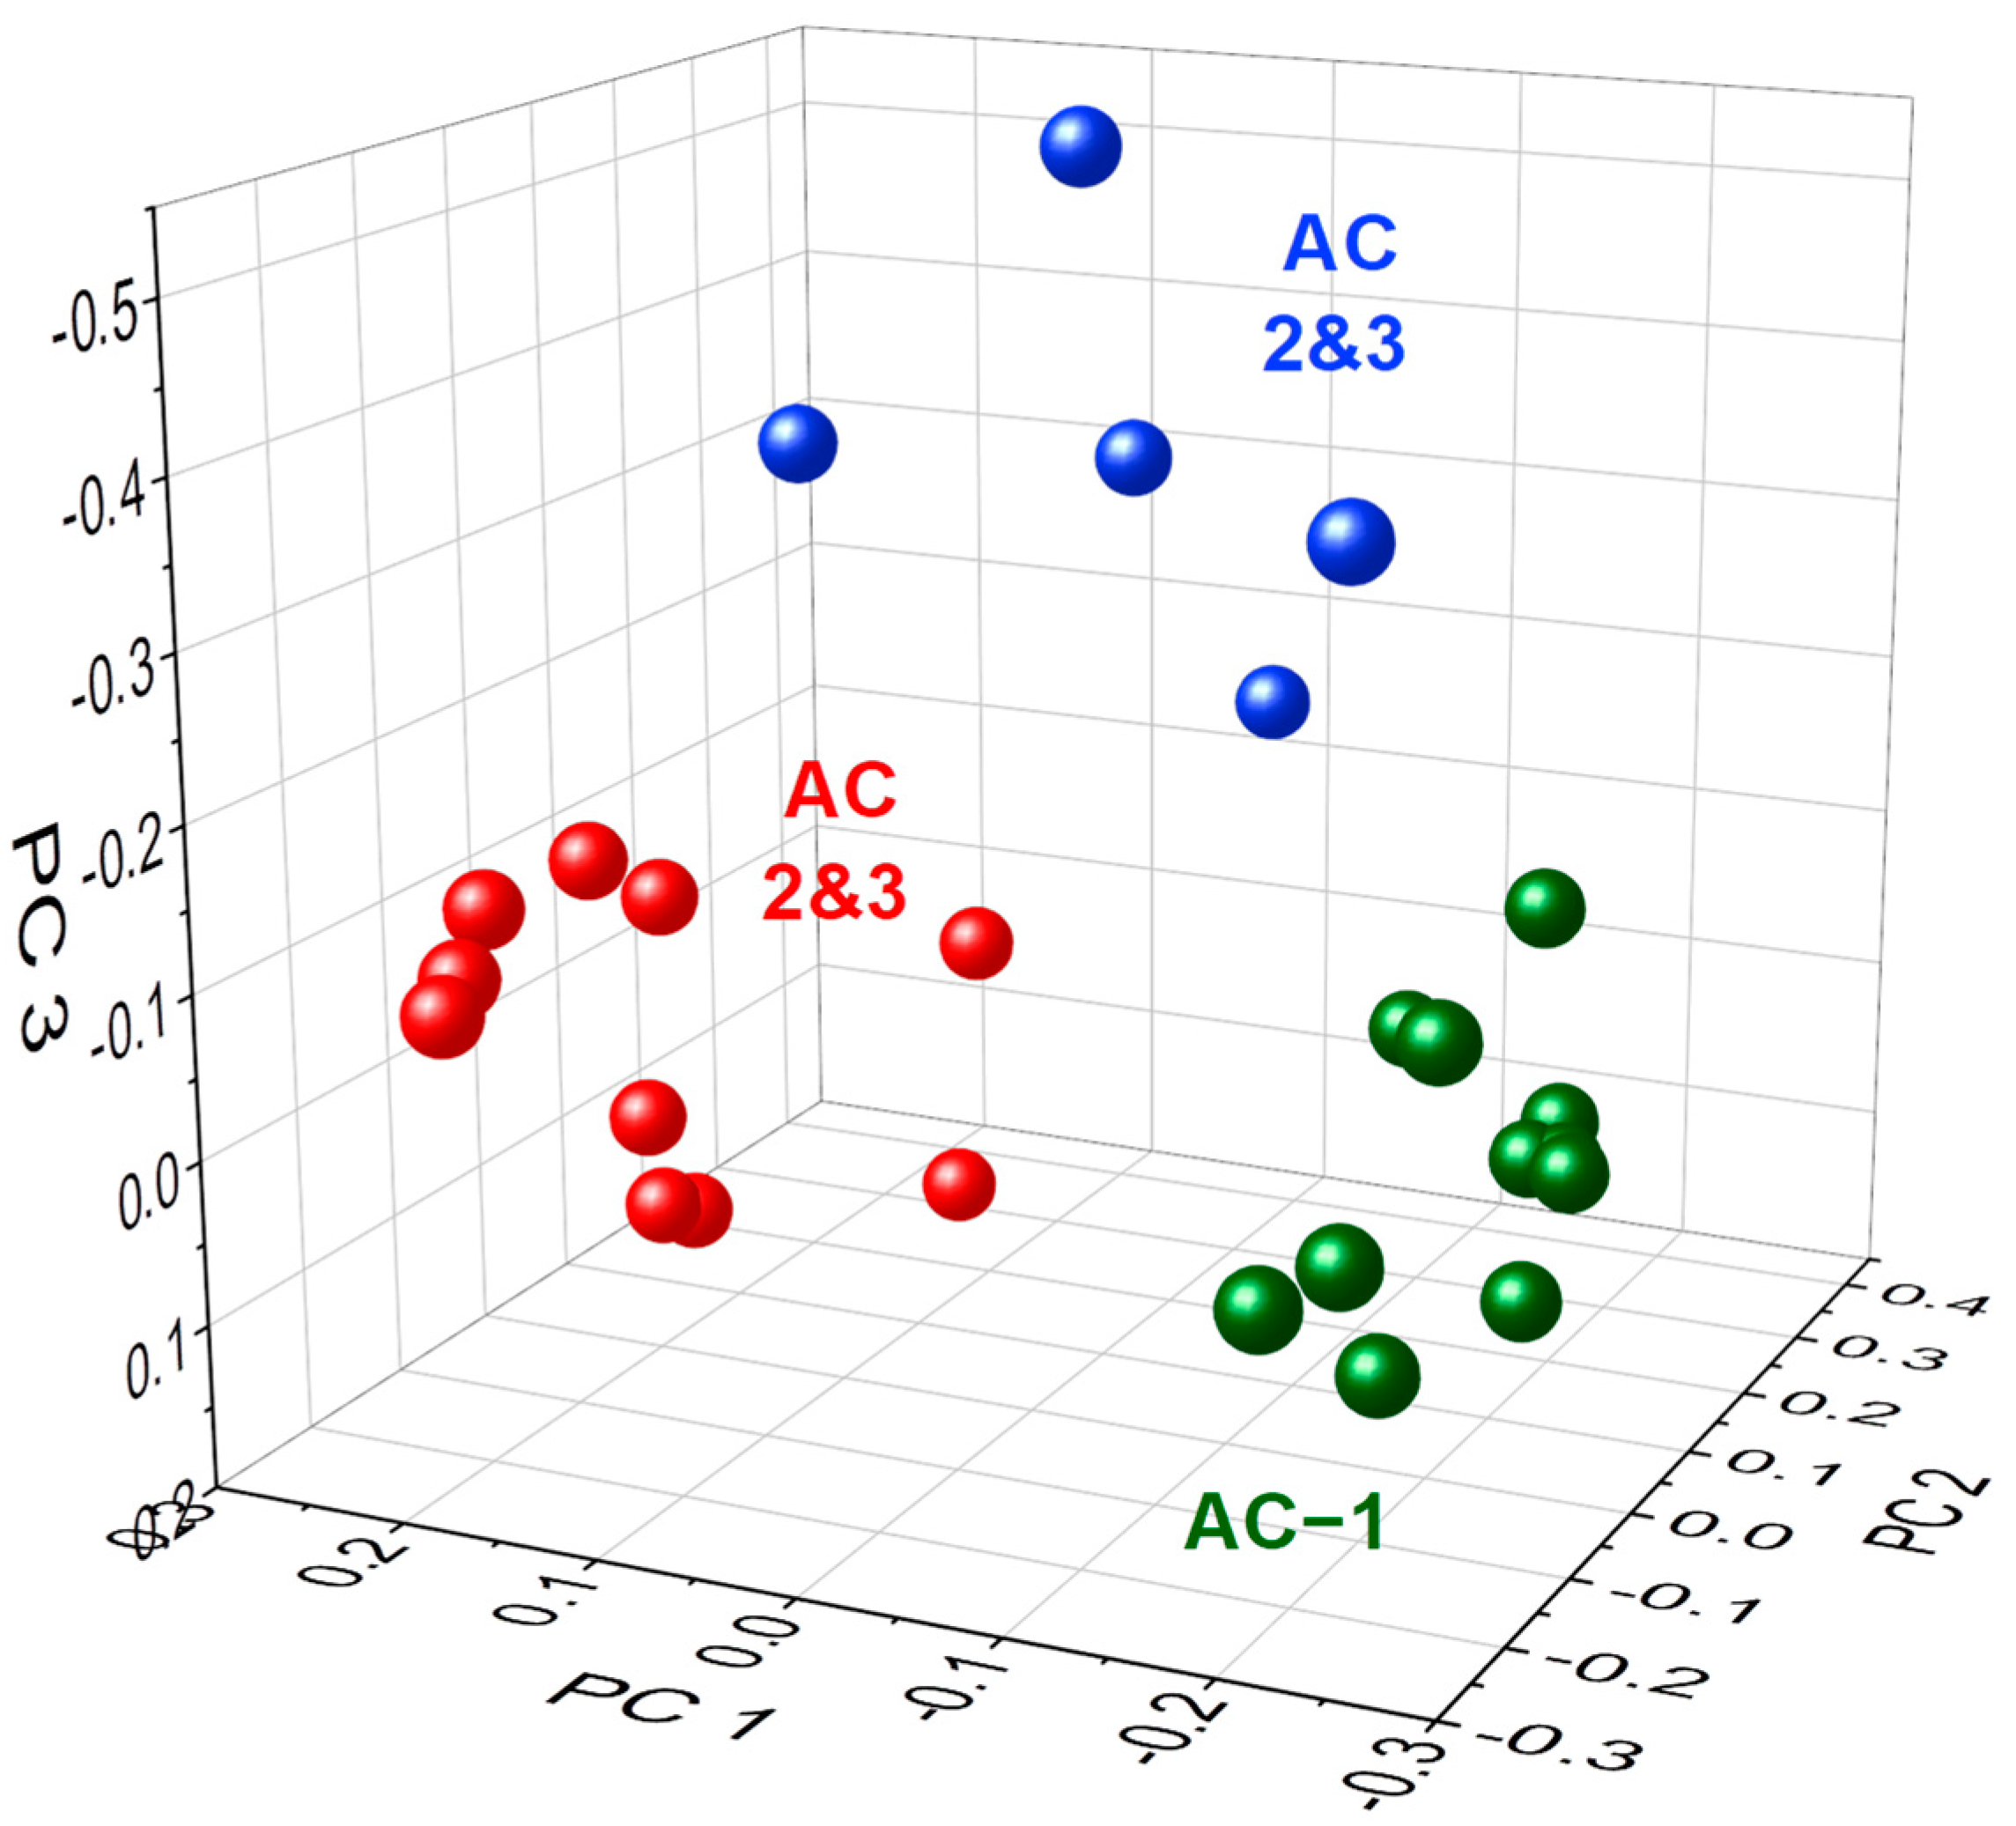
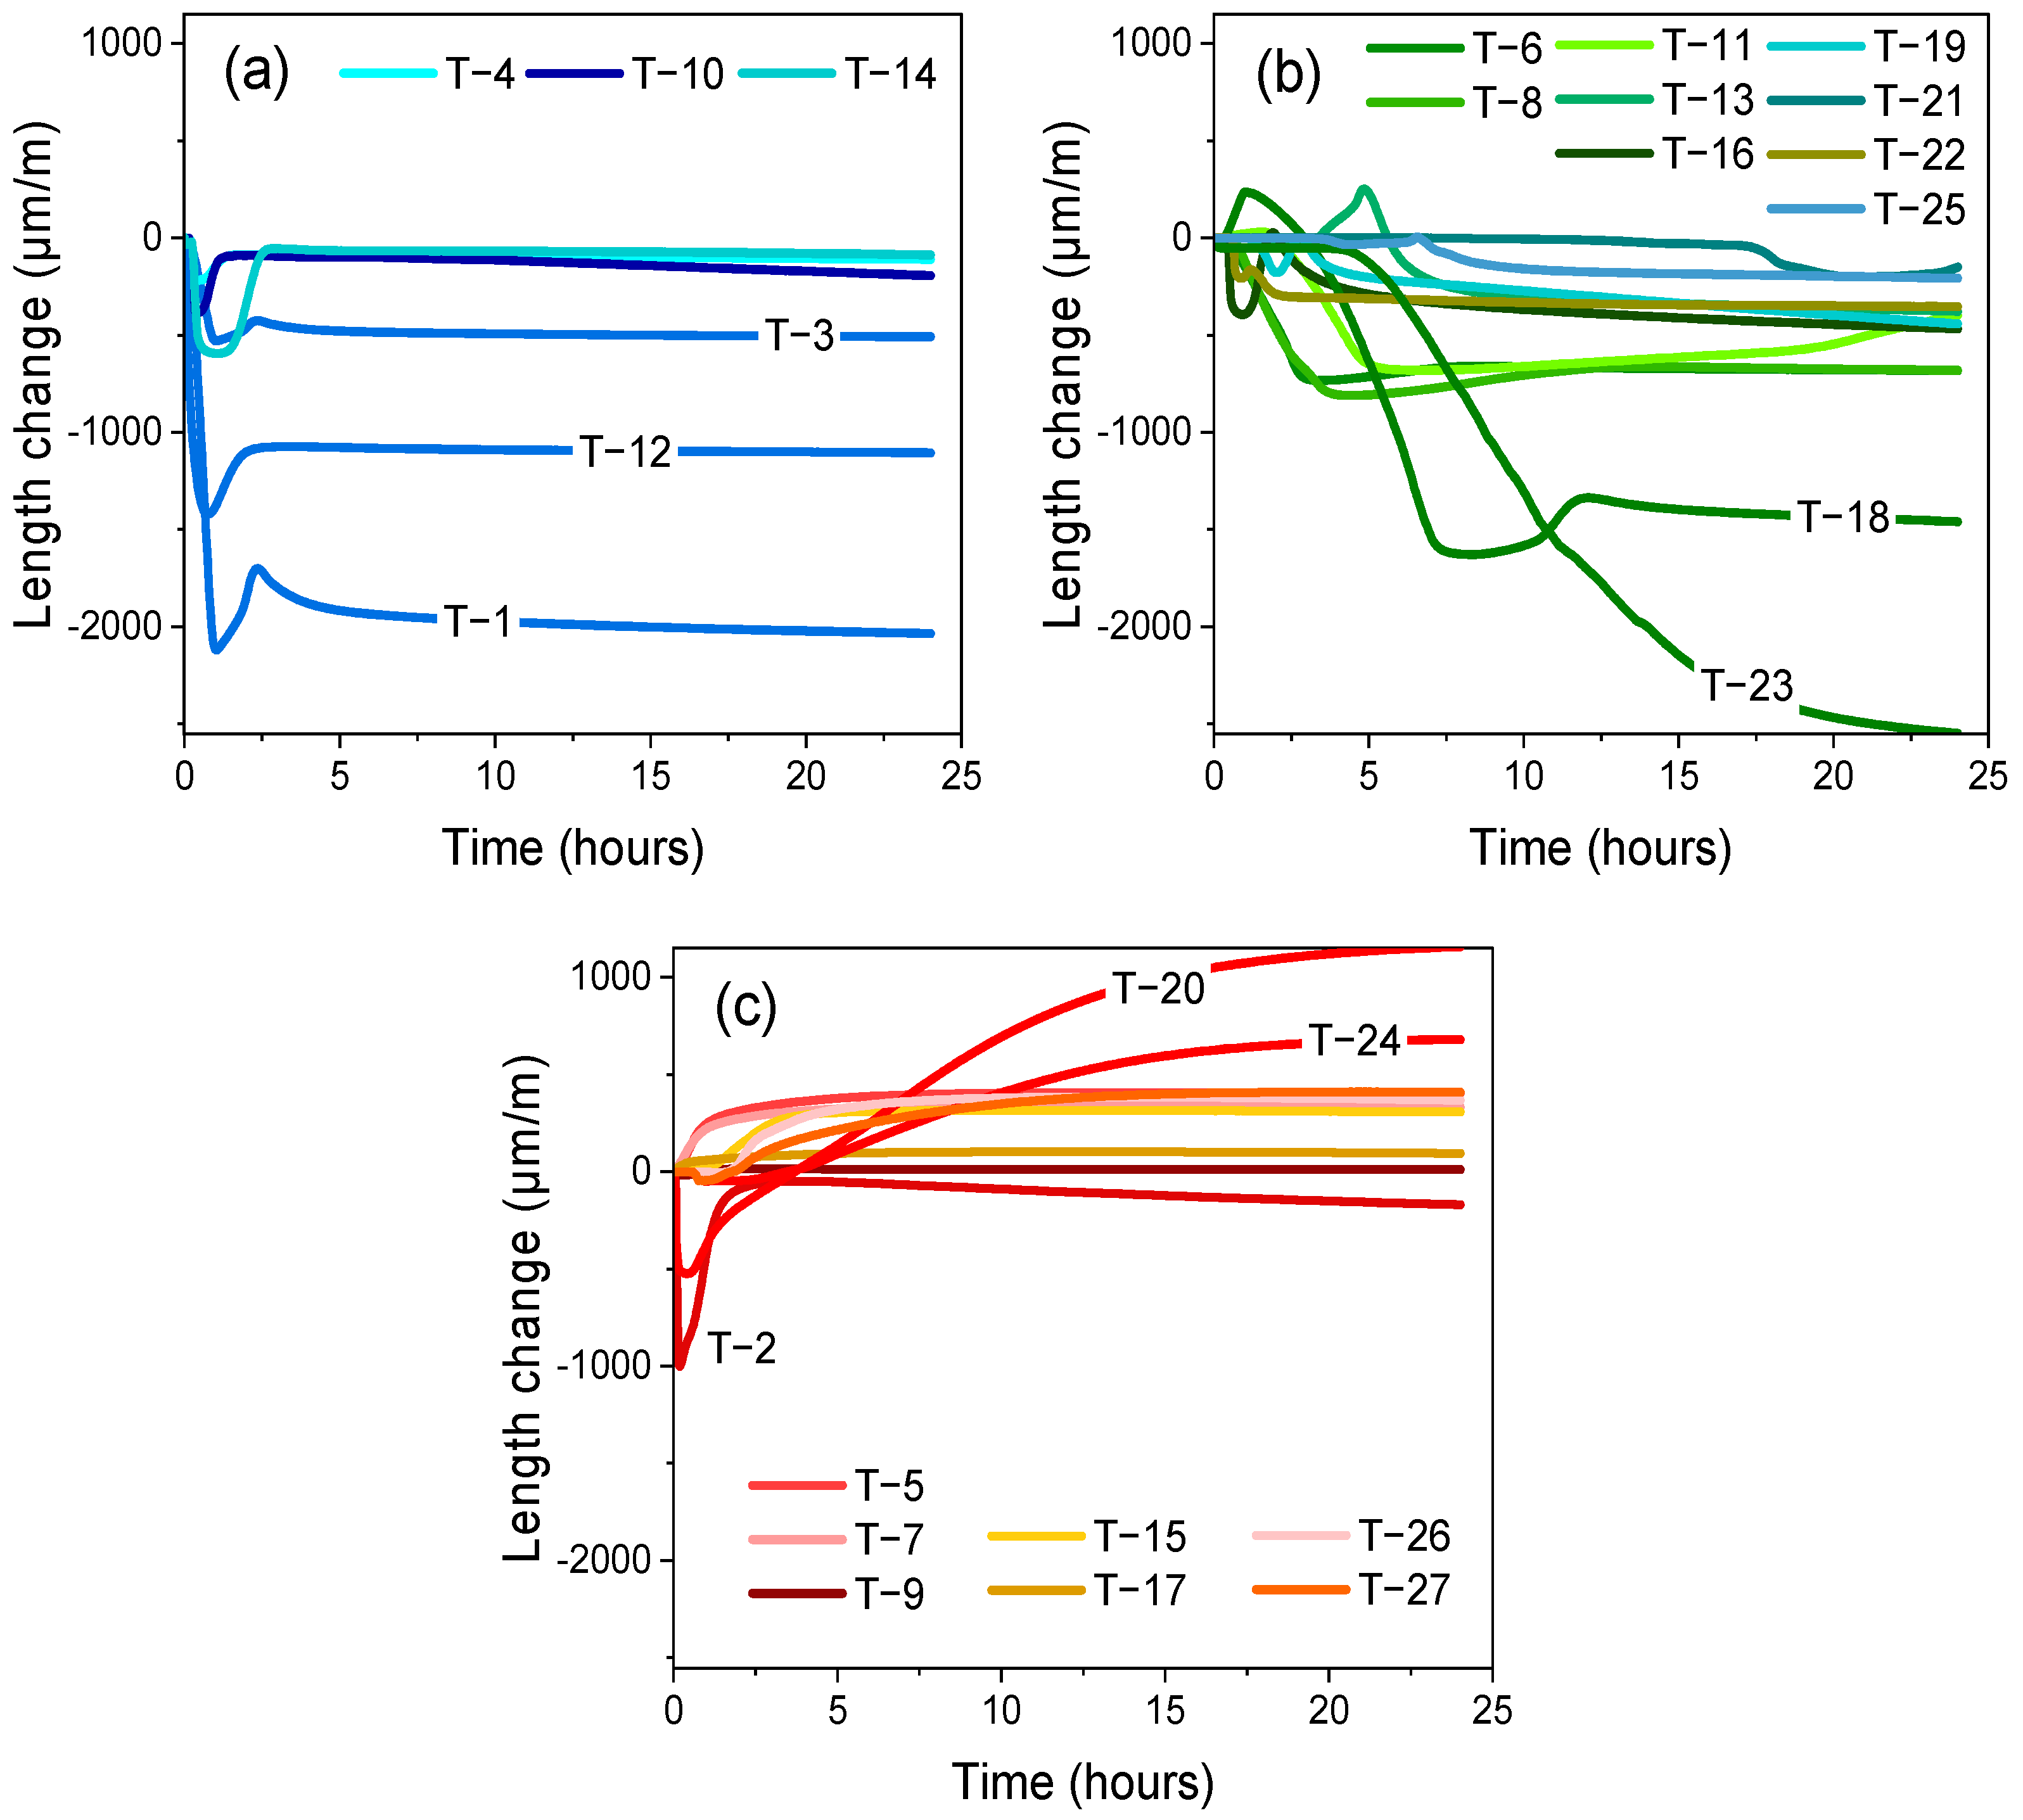
3.2.2. Early Age Shrinkage

The results of the principal component analysis are presented in Table 6. The first three principal components emerge as significantly influential based on their respective eigenvalues. Collectively, these PCs account for 89.6% of the total variance, with the first PC explaining 59.4%, the second 20%, and the third 10.3%. A 3D scatter plot (Figure 9) illustrates the interrelationships between all variables and the first three PCs. The formulations are clustered into three distinct groups, each represented by different graphs displayed in Figure 10a–c.
Figure 10a depicts rapid shrinkage during the initial hydration minutes, followed by minor expansion, corresponding to compositions C1 and C2. The length change pattern is consistent across all formulations, with the exception of T-1. This exception represents a pure C1 formulation devoid of powders or chemical admixtures (refer to Table 5). T-1 exhibits a higher shrinkage rate (up to 2000 μm/m), followed by a minor expansion at the end of the plastic phase. This behavior mirrors Bier and Amathieu’s system 4, to which T-1 corresponds, demonstrating similar length change behavior [18]. All formulations, excluding T-1, include AC at the second and third levels, potentially accounting for the observed expansion due to AC addition and ettringite formation.
Figure 10b shows the length change behavior of formulations with a strong negative correlation to the first PC. These formulations exhibit a notably high shrinkage rate, potentially tied to the absence of AC. Formulations T-18 and T-23, in particular, demonstrate a high shrinkage rate persisting beyond the 24-h mark, possibly due to the incorporation of RT at the highest levels. Fu et al.’s research [49] suggests that the significant shrinkage or reduced expansion after 7 days of hydration in expansive cement systems may be due to retardation of ettringite formation when retarders are added.
Figure 10c presents the length change behavior of formulations with a strong positive correlation to the first PC. These formulations reveal a high expansion rate, likely linked to the addition of AC at the second and third levels. Formulations T-2 and T-20 exhibit considerable initial plastic shrinkage followed by a high rate of expansion. Previous research [50,51] associates this expansive behavior predominantly with ettringite precipitation. Bizzozero et al. [52] related the mechanism of macroscopic expansion in CSA-sulphate systems to ettringite supersaturation and the distribution and confinement of crystals based on sulphate concentration.

3.3. Solid State Properties

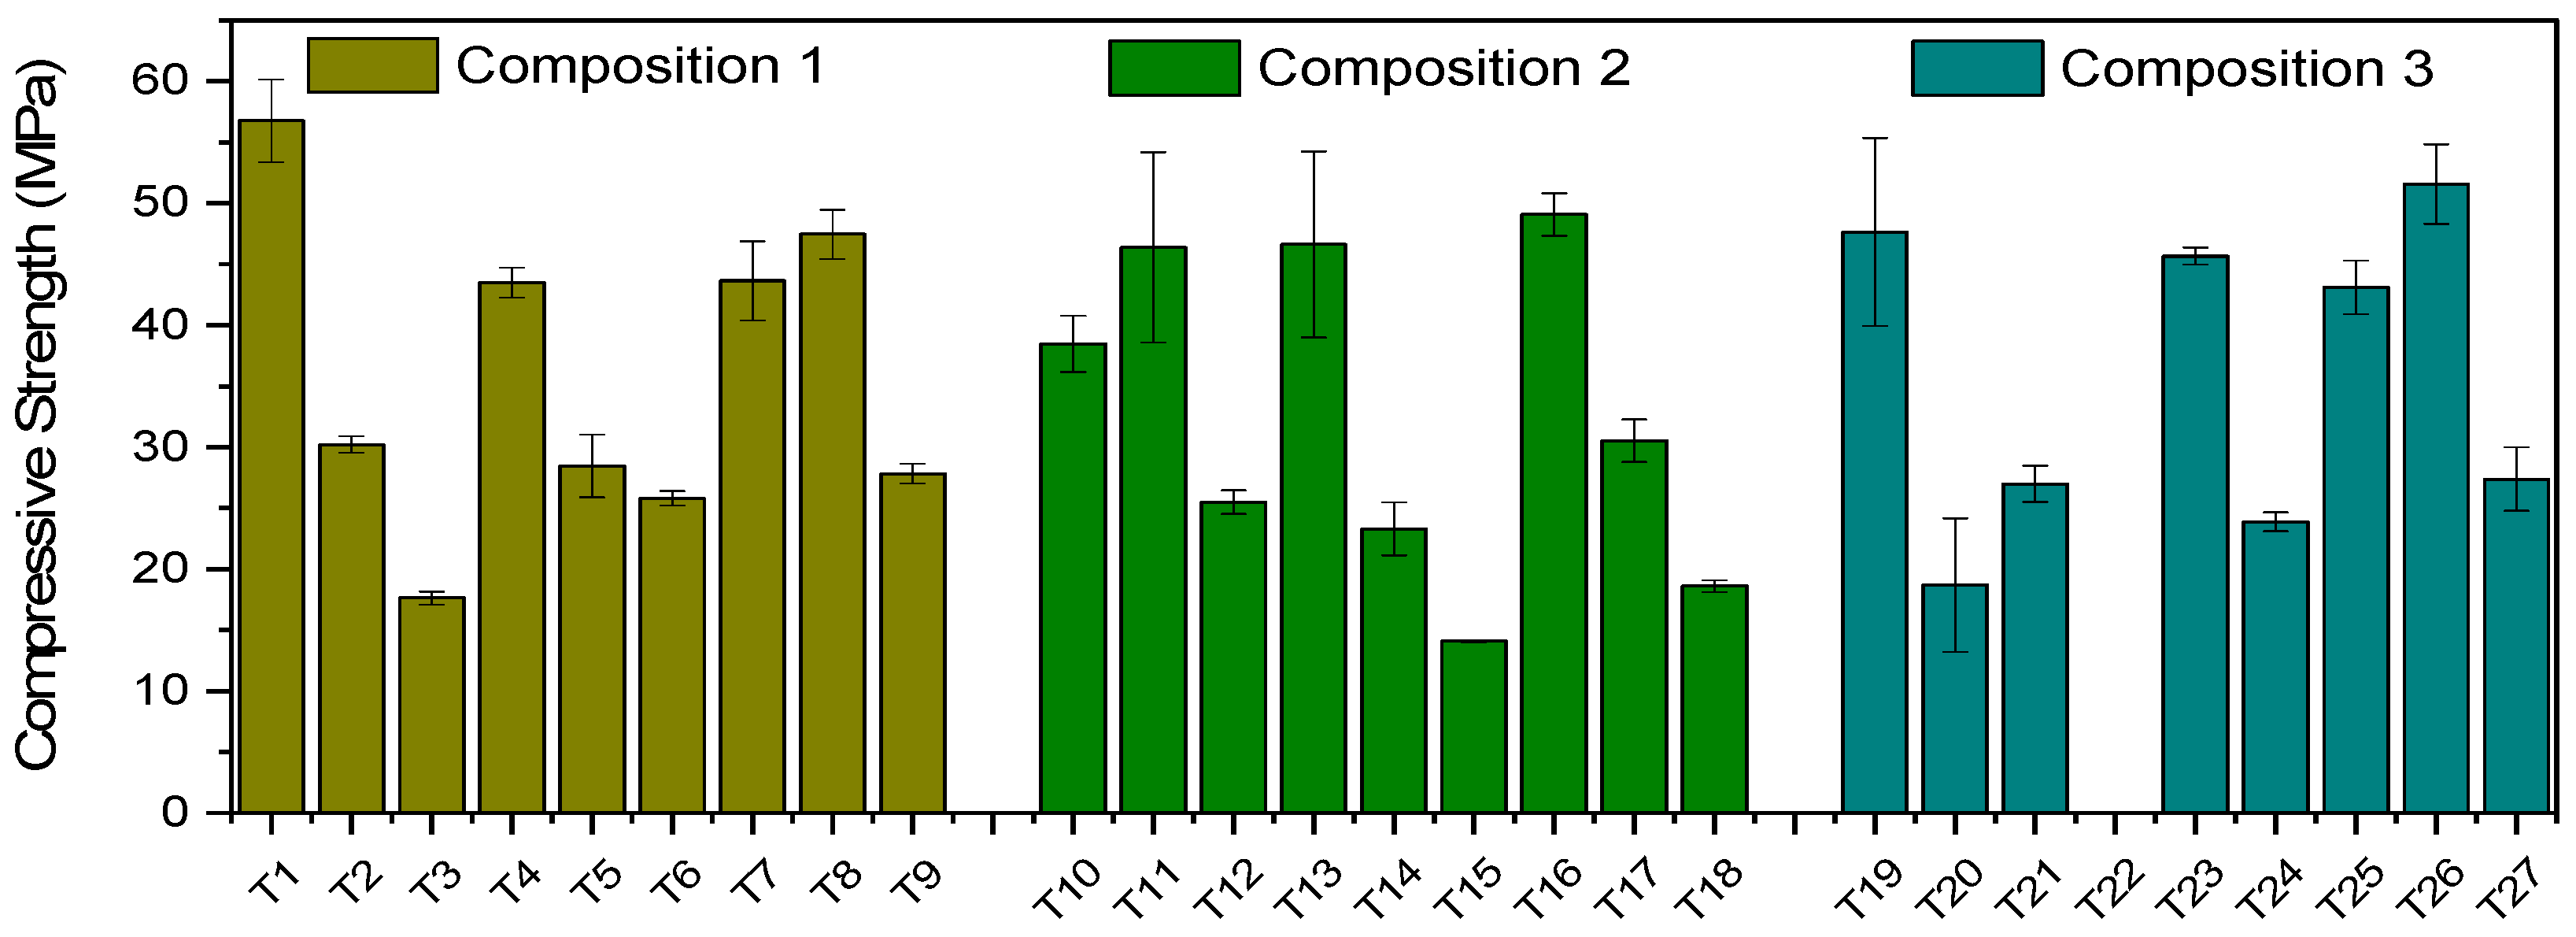
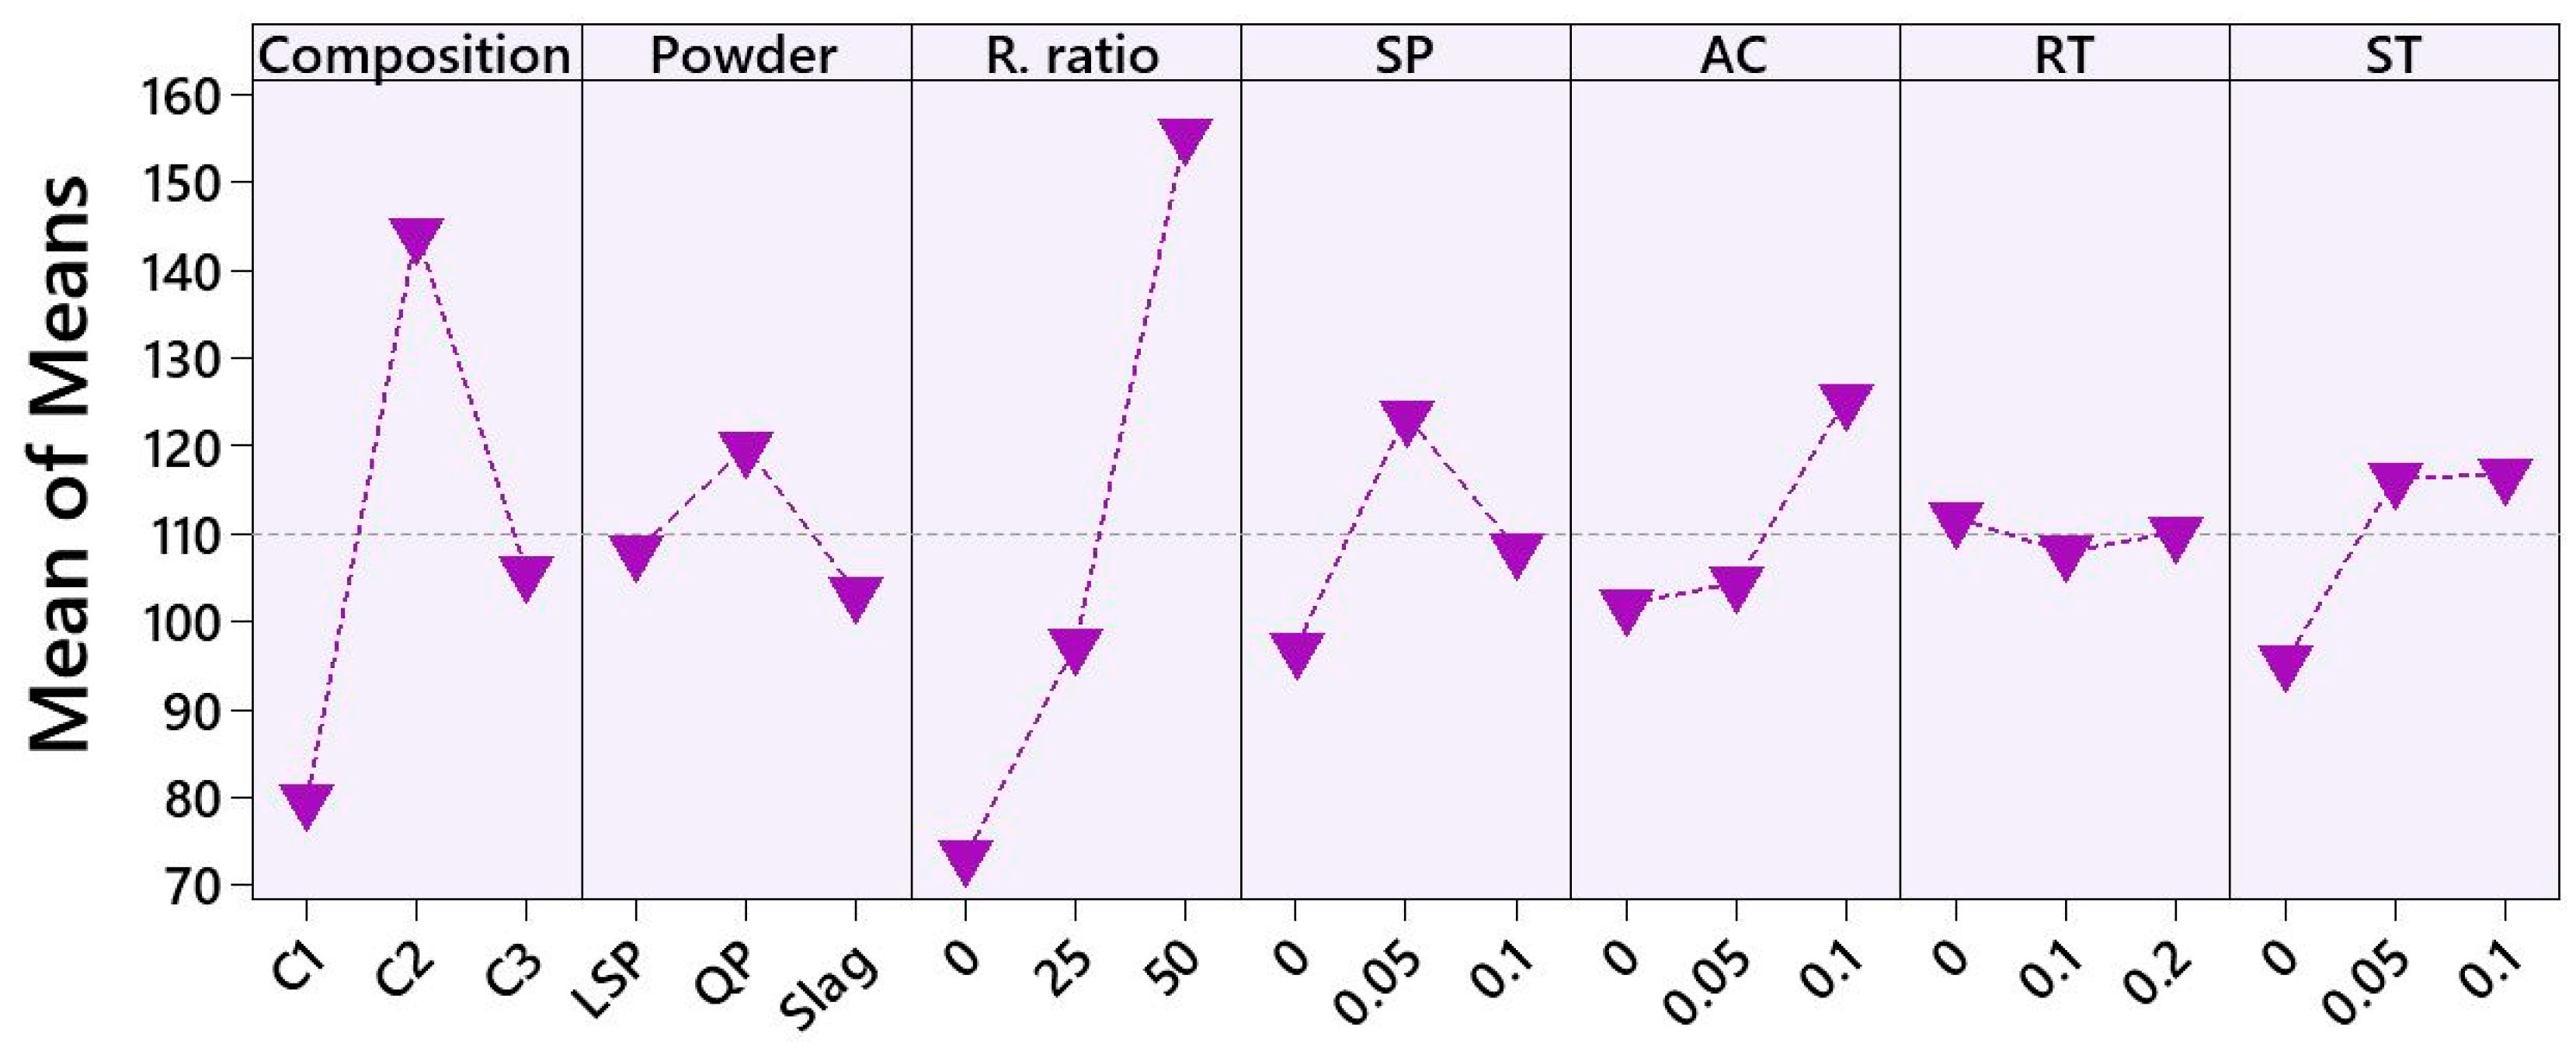
3.3.1. Compressive Strength

Figure 11 presents the main effects plot for the 7-day compressive strength, expressed as the mean of means, while Figure 12 showcases the 7-day compressive results for all formulations. The data reveals that the most impactful factor on compressive strength is the replacement ratio of cement by LSP, QP, or slag.
As the replacement level of the selected powders (LSP, QP, Slag) increases (from 0 to 50%), a corresponding decrease of 49.9% in compressive strength becomes apparent. This effect is particularly noticeable in QP and LSP-based samples compared to those containing slag. Previous studies [53,54] have reported that incorporating more than 10% limestone in cement pastes can lead to a reduction in strength. This effect is more pronounced at the early stages of hydration and can be attributed to the “dilution effect” at higher proportions of LSP addition [55]. The limestone amount used in this study is sufficiently high to produce this dilution effect.
Accelerator emerges as the second most significant factor affecting 7-day compressive strength results, with strength reduction of 31% as AC dosage increases (from 0 to 0.1%), as noted in earlier research [56]. A similar, less pronounced pattern is observed with the addition of stabilizer. Silva et al. [57] reported lower strength performance of mortars with viscosity-modifying agents.
Inclusion of SP and RT at relatively low amounts slightly reduces early age strength, yet strength improves as dosages rise from level 2 to level 3. These findings align well with Zhang et al.’s study [58], which examined the impact of superplasticizers and retarders on the strength of sulfoaluminate cements. It was also observed that compositions C1 and C3 demonstrated higher strength values compared to C2. Given the constraints of drawing conclusions from early age strength assessments alone, it is important for future studies to extend the analysis to long-term performance evaluations beyond the initial 7-day age.
The Analysis of Variance (ANOVA) for 7-day compressive strength, as detailed in Table A1, underscores the statistical significance of the replacement ratio, as indicated by the p-value being less than 0.05 and the high F score value.

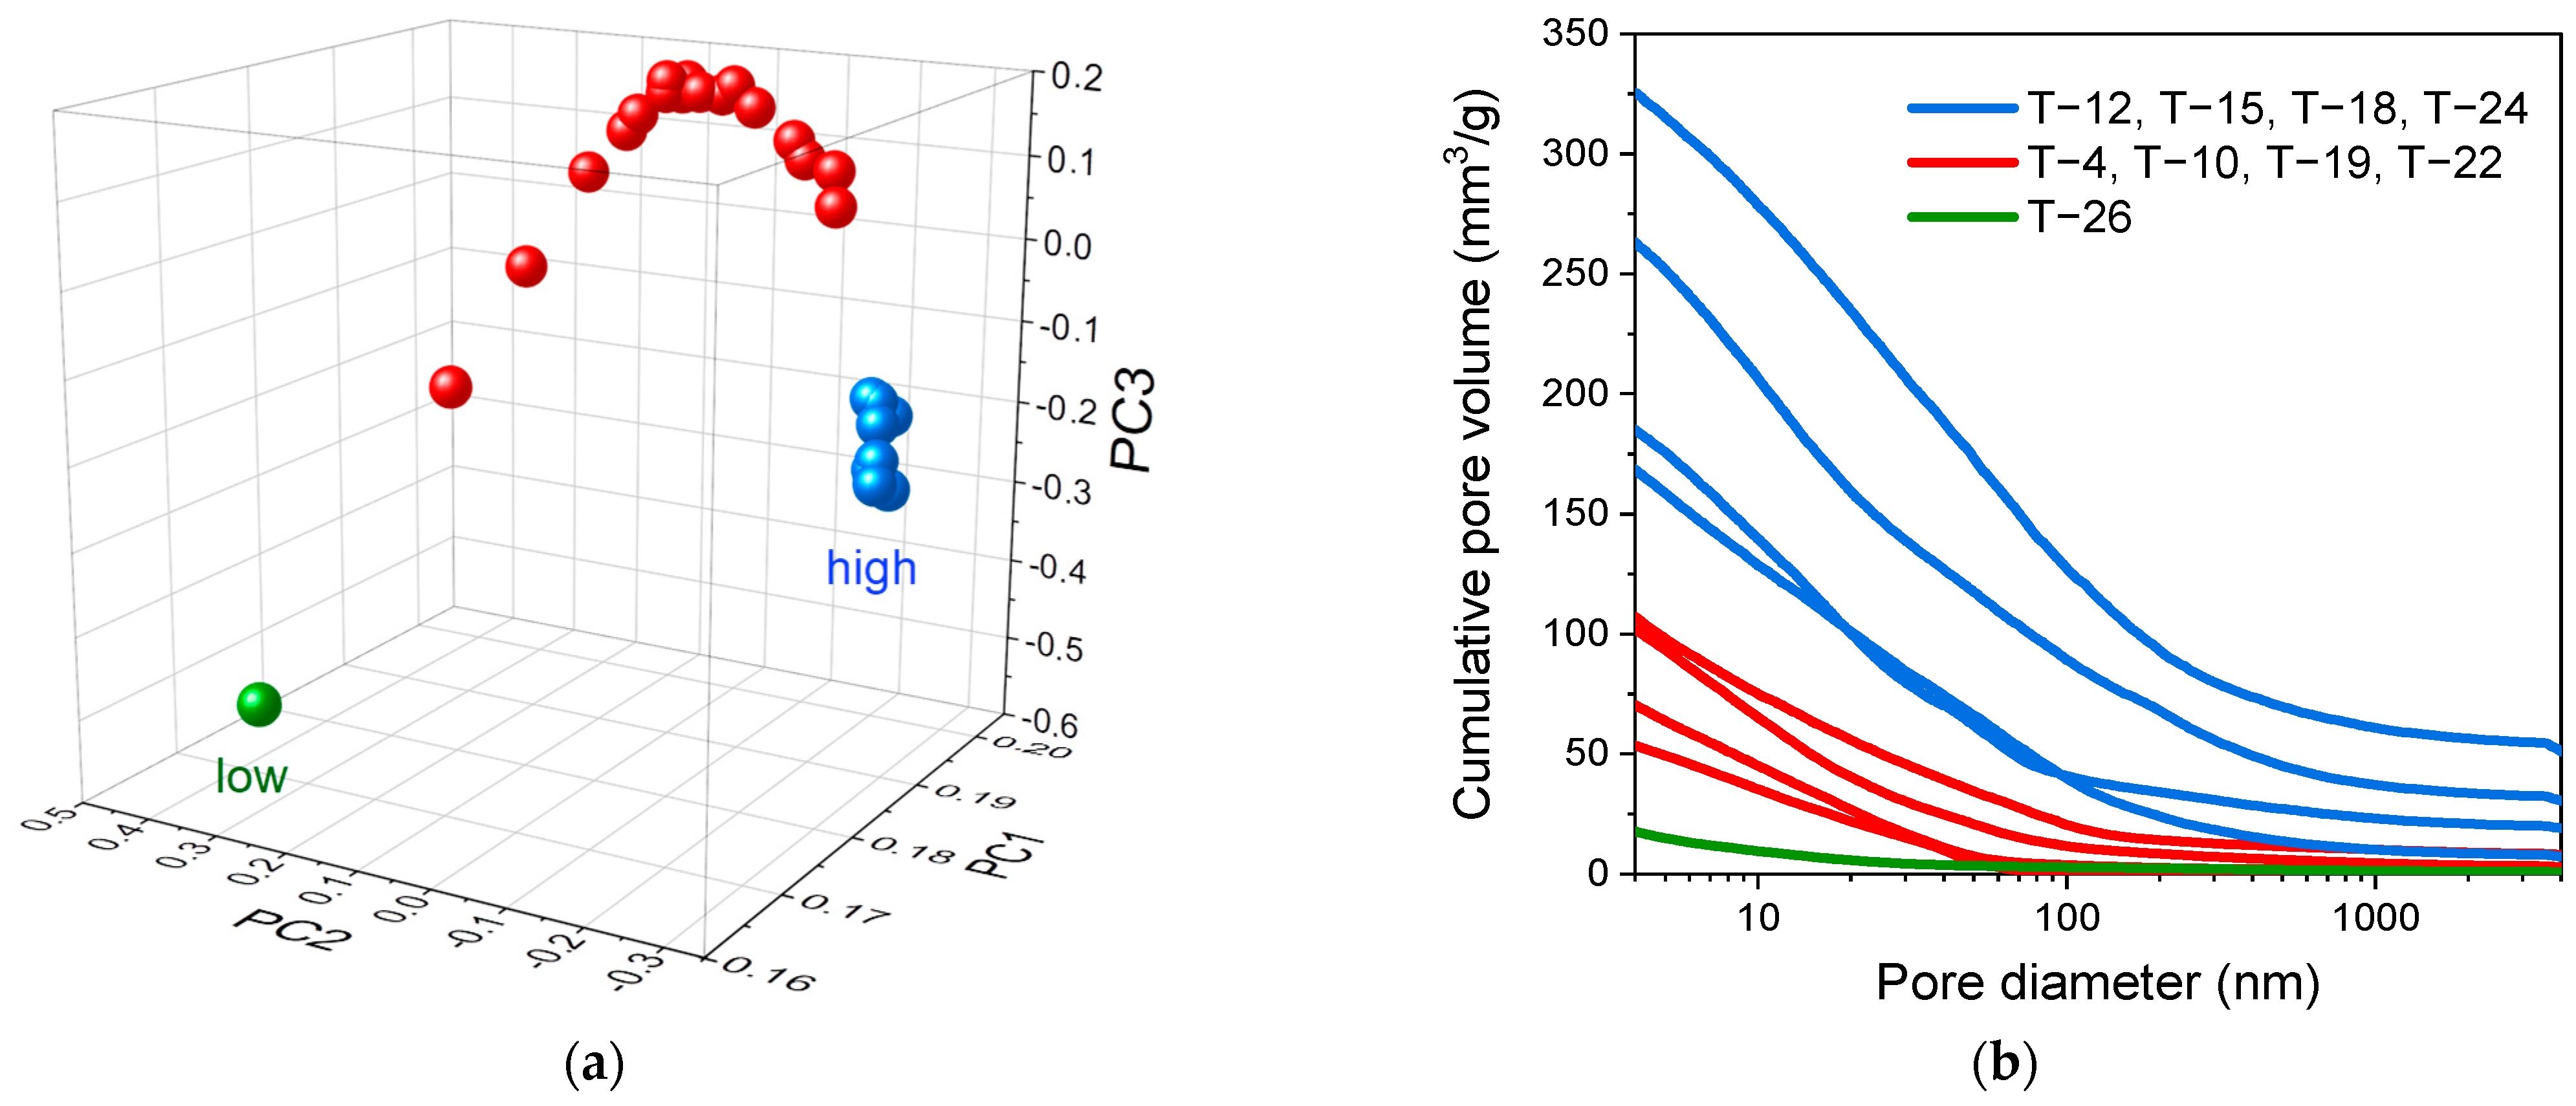
3.3.2. Mercury Intrusion Porosimetry (MIP)

The total cumulative pore volume of 7-day specimens was identified as a suitable quantitative parameter for investigation using statistical methods. The main effects plot for these pore volume values is illustrated in Figure 13. The plot clearly indicates that the replacement ratio and composition type are the primary factors influencing porosity.
When comparing the main effects plot for cumulative pore volume with that for compressive strength (Figure 11), the expected inverse relationship between the factors becomes evident. High porosity is typically associated with lower strength values, as confirmed by this study [59]. The strong correlation between the compressive strength and porosity results underscores the effectiveness of the statistical method applied here.
Formulations of C1 or C3—those lacking LSP/Slag/QP, AC, and ST, and incorporating RT at the second level—exhibited the lowest porosity while simultaneously achieving the highest strength values.
The Analysis of Variance (ANOVA) results for total pore volume (Table A1) further corroborate that the replacement ratio of cement by mineral powders significantly impacts the porosity of the compositions.
Principal Component Analysis (PCA) was employed to analyze the MIP pore size distribution curves. Based on the principal component eigenvalues (Table 6), the first three PCs were deemed highly significant. These three PCs accounted for 93.5%, 5%, and 1.1% of data variability, respectively, cumulatively explaining 99.7% of the total variation. Figure 14a, a 3D scatter plot of cumulative pore volume curves, visually demonstrates how all formulations relate to the first three PCs.
Figure 14b presents representative individual pore size distribution curves of the specimens, with the total pore volume decreasing in order from blue to green lines. The higher total pore volume values (blue series) are associated with compositions C2 and C3 that have high cement replacement levels. The selected red series (T4, T10, T19, T22), with lower total pore volume values, represent formulations without powders. Moreover, a distinct shift of the threshold radius from approximately 30–50 nm to larger pore radii of 200–400 nm is observed.

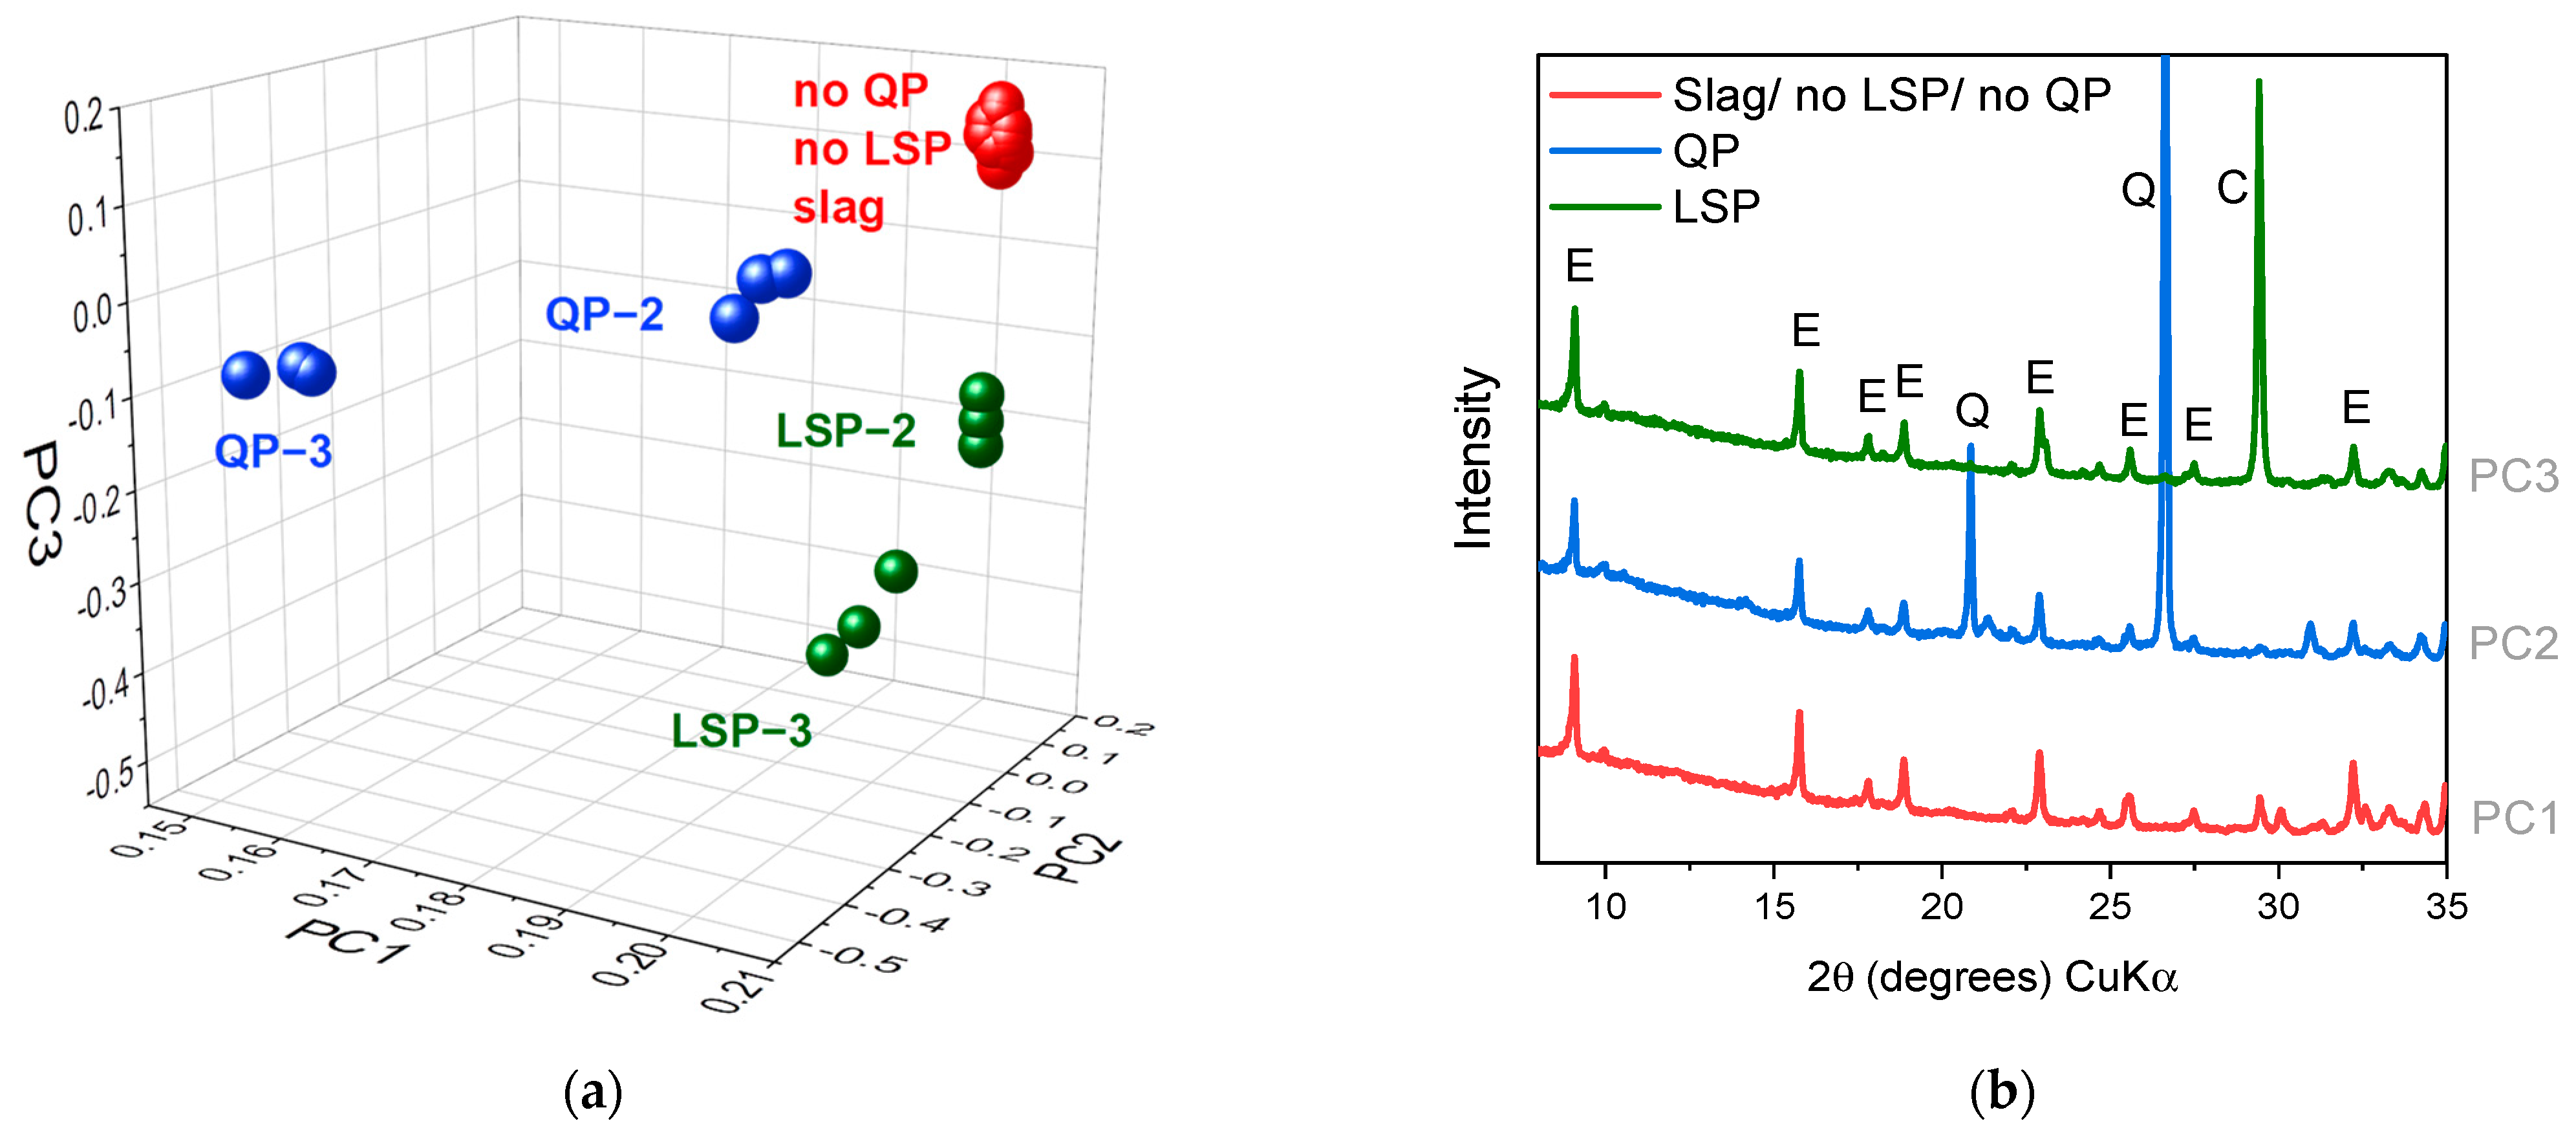
3.3.3. X-ray Diffraction Analysis

X-ray powder diffraction (XRD) was employed to analyze the hydrate phase composition after 7 days of hydration. Ettringite emerged as the primary crystalline hydrate phase across all examined formulations. For formulations incorporating quartz powder or limestone powder, distinct peaks for quartz and calcite were observed. The inclusion of slag led to a notable enhancement in the amorphous hump.
The principal component analysis revealed that the first three principal components account for 99.1% of the data variation, according to the eigenvalues outlined in Table 6. Figure 15a presents a 3D scatter plot of XRD patterns related to the first three principal components. Within the green cluster, two subgroups represent formulations with LSP at replacement ratios of level 2 (T-2, T-11, T-20) and level 3 (T-3, T-12, T-21). Meanwhile, two other subgroups within the blue cluster denote formulations with QP at replacement ratios of level 2 (T-5, T-14, T-23) and level 3 (T-6, T-15, T-24). Formulations lacking quartz or limestone powder, as well as those containing slag at any level, constitute a separate group within the red cluster.
Figure 15b illustrates representative XRD patterns of each group, linked to the first three PCs. The first PC exhibits a strong positive relationship with formulations without powders or those containing only slag. The dominant feature of XRD patterns within this group is the presence of ettringite peaks. The second PC is associated with formulations containing QP at the second and third levels, marked by the presence of quartz peaks–an indication of the high QP content in these formulations. The third PC shows a strong correlation with formulations incorporating LSP, essential for the characteristic peak of calcite. The graphs in Figure 15, indicate that the PCA approach can allow for discrimination of mutual patterns in such complex systems, thus facilitating the XRD qualitative phase analysis into selected samples.

4. Conclusions

The Taguchi approach combined with principal component analysis was employed in this study to investigate the effect of seven factors: composition, type of mineral powder, replacement ratio, superplasticizer (SP), stabilizer (ST), accelerator (AC) and retarder (RT) on the properties of ternary binder systems (PC-CAC-CŜ).
According to the analysis of the results in terms of statistical approaches it can be concluded that:
  • The Taguchi orthogonal array method is promising. It is both efficient and cost-effective method of identifying the significant parameters impacting the properties of ternary binders.
  • Principal Component Analysis is effective in managing large datasets. It reduces them to a few significant variables (typically three, referred to as Principal Components). These components can then be correlated with the parameters under investigation.
More specifically, for the factors and levels chosen in this study, the following observations were made:
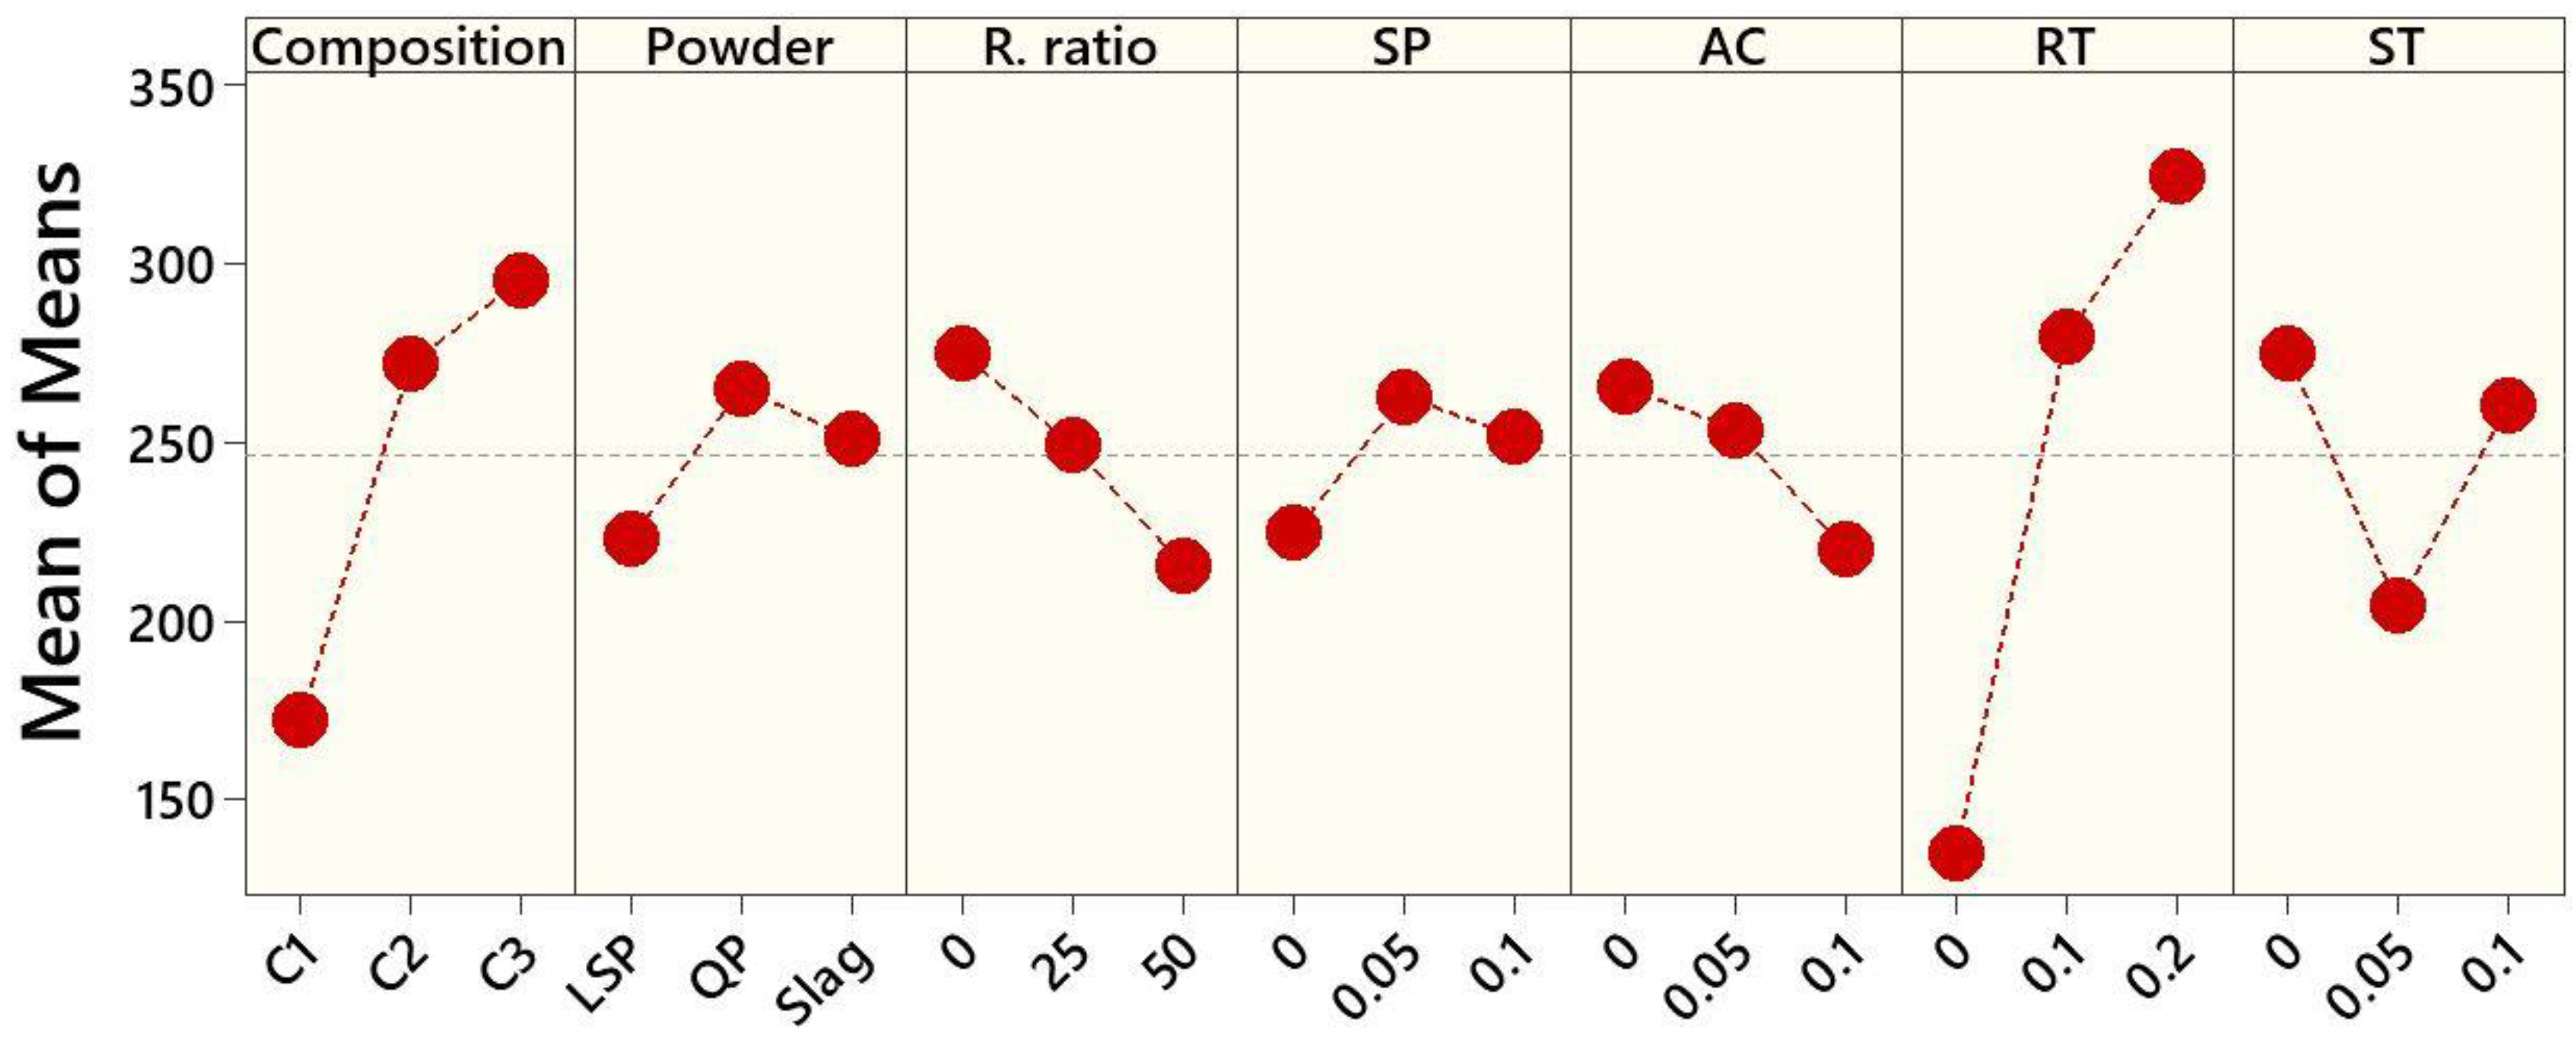
  • Addition of retarders (such as citric acid) in ternary binder systems rich on CAC (like C3) tend to improve flow properties.
  • The cumulative heat flow, indicative of the intensity of hydration, is primarily dependent on the level of cement replacement by limestone powder (LSP), quartz powder (QP), or Slag and the addition and dosage of accelerator.
  • The used statistical approached indicate that the length change behavior is greatly influenced by the accelerator dosage. Formulations with relatively high AC dosages exhibit expansion, while those without AC show shrinkage.
  • The compressive strength and porosity of the binder compositions are negatively affected when the replacement ratio of the cement by LSP, QP, or Slag increases, and/or the accelerator dosage rises.
These observations demonstrate the complex interplay of multiple factors in the performance of ternary binder systems, and the potential for tailored optimization through their controlled examination.

Author Contributions

Conceptualization, A.M., T.A.B. and E.Q.; methodology, A.M.; software, A.M.; validation, A.M., T.A.B. and E.Q.; formal analysis, A.M.; investigation, R.A. and M.Z.; resources, T.A.B.; data curation, A.M.; writing—original draft preparation, A.M.; writing—review and editing, A.M., T.A.B. and E.Q.; visualization, A.M., T.A.B. and E.Q.; supervision, T.A.B.; project administration, T.A.B.; funding acquisition, T.A.B. All authors have read and agreed to the published version of the manuscript.

Funding

This research was funded by the German Academic Exchange Service (DAAD), grant number 57381412. The authors are grateful for the generous support.

Data Availability Statement

The data presented in this study are available on request from the corresponding author.

Acknowledgments

The research presented was conducted at the Technical University of Freiberg. The authors wish to thank Kozo Onoue for the Taguchi design and A. Friedrich for preparing the XRD samples.

Conflicts of Interest

The authors declare no conflict of interest.

Appendix A

Table A1. Analysis of variance (ANOVA).
FactorStatistical ParametersFlowCumulative Heat of HydrationCompressive StrengthCumulative Pore Volume
CompositionDF2222
Adj SS77,04632158.1220,434
Adj MS38,523160.529.0610,217
F3.160.290.182.85
P0.0610.7530.8390.078
PowderDF2222
Adj SS8265270.3168.4448
Adj MS4132135.284.2223.8
F0.270.240.530.05
P0.7630.7880.5960.951
R. RatioDF2222
Adj SS15,9078997226743,722
Adj MS79544498.71133.321,861
F0.5422.8616.718.51
P0.5900.0000.0000.002
SPDF2222
Adj SS6986266.133.35679
Adj MS3493133.116.67339.5
F0.230.240.10.08
P0.7960.7910.9040.927
ACDF2222
Adj SS10,041418.36674858
Adj MS5020209.1333.52429
F0.330.382.430.57
P0.7190.6900.1110.573
RTDF2222
Adj SS176,6241461136486
Adj MS88312730.468.01243.1
F10.961.430.420.05
P0.0000.2590.6600.947
STDF2222
Adj SS25,179643.3238.83005
Adj MS12,588321.7119.41502
F0.880.590.770.35
P0.4290.5620.4770.711
DF—degree of freedom; Adj SS—adjusted sum of squares; Adj MS—adjusted mean squares; F—Fisher value; P—probability.

References

  1. Bier, T.A. Composition and properties of ternary binders. In Cementitious Materials: Composition, Properties, Application; De Gruyter: Berlin/Boston, Germany, 2017; pp. 353–376. [Google Scholar]
  2. Lamberet, S. Durability of Ternary Binders Based on Portland Cement, Calcium Aluminate Cement and Calcium Sulfate. Ph.D. Thesis, EPFL, Lausanne, Switzerland, 2005. [Google Scholar]
  3. Kighelman, J. Hydration and Structure Development of Ternary Binder Systems as Used in Self-Levelling Compounds. Ph.D. Thesis, EPFL, Lausanne, Switzerland, 2007. [Google Scholar]
  4. Pelletier, P.; Winnefeld, F.; Lothenbach, B. The ternary system Portland cement–calcium sulphoaluminate clinker–anhydrite: Hydration mechanism and mortar properties. Cem. Concr. Compos. 2010, 32, 497–507. [Google Scholar]
  5. Pelletier-Chaignat, L.; Winnefeld, F.; Lothenbach, B.; Le Saout, G.; Müller, C.J.; Famy, C. Influence of the calcium sulphate source on the hydration mechanism of Portland cement–calcium sulphoaluminate clinker–calcium sulphate binders. Cem. Concr. Compos. 2011, 33, 551–561. [Google Scholar]
  6. Le Saoût, G.; Lothenbach, B.; Hori, A.; Higuchi, T.; Winnefeld, F. Hydration of Portland cement with additions of calcium sulfoaluminates. Cem. Concr. Res. 2012, 43, 81–94. [Google Scholar]
  7. Qoku, E.; Bier, T.A.; Westphal, T. Phase assemblage in ettringite-forming cement pastes: A X-ray diffraction and thermal analysis characterization. J. Build. Eng. 2017, 12, 37–50. [Google Scholar]
  8. Wolf, J.J.; Jansen, D.; Goetz-Neunhoeffer, F.; Neubauer, J. Relating phase transitions to pore size distributions and mechanical mortar properties in CSA-OPC-C$ based systems–The potential impact of delayed straetlingite formation. Cem. Concr. Res. 2021, 147, 106496. [Google Scholar]
  9. Park, S.; Jeong, Y.; Moon, J.; Lee, N. Hydration characteristics of calcium sulfoaluminate (CSA) cement/ortland cement blended pastes. J. Build. Eng. 2021, 34, 101880. [Google Scholar]
  10. Qoku, E.; Bier, T.A.; Schmidt, G.; Skibsted, J. Impact of sulphate source on the hydration of ternary pastes of Portland cement, calcium aluminate cement and calcium sulphate. Cem. Concr. Com. 2022, 131, 104502. [Google Scholar]
  11. Torréns-Martín, D.; Fernández-Carrasco, L.; Blanco-Varela, M.T. Conduction calorimetric studies of ternary binders based on Portland cement, calcium aluminate cement and calcium sulphate. J. Therm. Anal. Calorim. 2013, 114, 799–807. [Google Scholar]
  12. Taylor, H.F.W. Cement Chemistry; Academic Press: London, UK, 1990. [Google Scholar]
  13. Qoku, E. Characterization and Quantification of Crystalline and Amorphous Phase Assemblage in Ternary Binders during Hydration. Ph.D. Thesis, TU Bergakagemie Freiberg, Freiberg, Germany, 2019. [Google Scholar]
  14. Yuan, Q.; Zhou, D.; Li, B.; Huang, H.; Shi, C. Effect of mineral admixtures on the structural build-up of cement paste. Constr. Build. Mater. 2018, 160, 117–126. [Google Scholar]
  15. Chaunsali, P.; Mondal, P. Physico-chemical interaction between mineral admixtures and OPC–calcium sulfoaluminate (CSA) cements and its influence on early-age expansion. Cem. Concr. Res. 2016, 80, 10–20. [Google Scholar]
  16. Zajac, M.; Rossberg, A.; Le Saout, G.; Lothenbach, B. Influence of limestone and anhydrite on the hydration of Portland cements. Cem. Concr. Com. 2014, 46, 99–108. [Google Scholar] [CrossRef]
  17. Emoto, T.; Bier, T.A. Rheological behavior as influenced by plasticizers and hydration kinetics. Cem. Concr. Res. 2007, 37, 647–654. [Google Scholar] [CrossRef]
  18. Bier, T.A.; Bajrami, A.; Westphal, T.; Qoku, E.; Qorllari, A. Influence of Re-dispersible Powders on Very Early Shrinkage in Functional Mortars. Adv. Mater. Res. 2015, 1129, 77–85. [Google Scholar] [CrossRef]
  19. Wolf, J.J.; Jansen, D.; Goetz-Neunhoeffer, F.; Neubauer, J. Impact of varying Li2CO3 additions on the hydration of ternary CSA-OPC anhydrite mixes. Cem. Concr. Res. 2020, 131, 106015. [Google Scholar] [CrossRef]
  20. Bier, T.A.; Amathieu, L. Calcium Aluminate Cement (CAC) in Building Chemistry Formulations. In Proceedings of the ConChem, International Exhibition & Conference, Dusseldorf, Germany, 2–4 December 1997. [Google Scholar]
  21. Box, G.E.P.; Hunter, J.S.; Hunter, W.G. Statistics for Experimenters, Design, Innovation, and Discovery; Wiley: Hoboken, NJ, USA, 2005. [Google Scholar]
  22. Montgomery, D.C. Design and Analysis of Experiments; Wiley: Hoboken, NJ, USA, 2017. [Google Scholar]
  23. Barrentine, L.B. An Introduction to Design of Experiments. A Simplified Approach; ASQ: Milwaukee, WI, USA, 1999. [Google Scholar]
  24. Mathews, P.G. Design of Experiments with MINITAB; ASQ: Milwaukee, WI, USA, 2005. [Google Scholar]
  25. Roy, R.K. A Primer on the Taguchi Method, 2nd ed.; Society of Manufacturing Engineers: Dearbon, MI, USA, 2010. [Google Scholar]
  26. Taguchi, G.; Chowdhury, S.; Wu, Y. Taguchi’s Quality Engineering Handbook; Wiley: Hoboken, NJ, USA, 2005. [Google Scholar]
  27. Fisher, R.A. The Design of Experiments; Oliver and Boyd: Edinburgh, UK, 1935. [Google Scholar]
  28. Zambanini, R.A. The Application of Taguchi’s Method of Parameter Design to the Design of Mechanical Systems. Doctoral Dissertation, Lehigh University, Bethlehem, PA, USA, 1992. [Google Scholar]
  29. Taguchi, G. The role of DOE for robust engineering: A commentary. Qual. Reliab. Eng. Int. 1996, 12, 73–74. [Google Scholar] [CrossRef]
  30. Chong, B.W.; Othman, R.; Jaya, R.P.; Hasan, M.R.M.; Sandu, A.V.; Nabiałek, M.; Jeż, B.; Pietrusiewicz, P.; Kwiatkowski, D.; Postawa, P.; et al. Design of Experiment on Concrete Mechanical Properties Prediction. A Critical Review. Materials 2021, 14, 1866. [Google Scholar] [CrossRef]
  31. Tan, O.; Hinislioglu, S.; Altun, S. Taguchi approach for optimization of the bleeding on cement–based grouts. Tunn. Undergr. Space Technol. 2005, 20, 167–173. [Google Scholar] [CrossRef]
  32. Tanyildizi, H.; Şahin, M. Application of Taguchi method for optimization of concrete strengthened with polymer after high temperature. Constr. Build. Mater. 2015, 79, 97–103. [Google Scholar] [CrossRef]
  33. Shahen, N.; Khushnood, R.A.; Bier, T.A. Mechanical and energy performance of variably cured effective microorganisms cementitious composite designed via Taguchi. J. Clean. Prod. 2021, 310, 127350. [Google Scholar] [CrossRef]
  34. Qorllari, A.; Bier, T.A. Optimization of Workability and Compressive Strength of Self-Compacting Mortar Using Screening Design. CivilEng 2022, 3, 998–1012. [Google Scholar] [CrossRef]
  35. Onoue, K.; Bier, T.A. Optimization of alkali-activated mortar utilizing ground granulated blast-furnace slag and natural pozzolan from Germany with the dynamic approach of the Taguchi method. Constr. Build. Mater. 2017, 144, 357–372. [Google Scholar] [CrossRef]
  36. Jolliffe, I.T. Principal Component Analysis; Springer: Berlin/Heidelberg, Germany, 2002. [Google Scholar]
  37. Saporta, G.; Niang, N. Principal Component Analysis: Application to Statistical Process Control; John Wiley & Sons: Hoboken, NJ, USA, 2009. [Google Scholar]
  38. Abdi, H.; Williams, L.J. Principal component analysis. WIREs ComStat. 2010, 2, 433–459. [Google Scholar] [CrossRef]
  39. Larose, D.T. Data Mining Methods and Models; John Wiley & Sons, Inc.: Hoboken, NJ, USA, 2006. [Google Scholar]
  40. Zhou, J.; Ye, G.; Breugel, K. Characterization of pore structure in cement-based materials using pressurization–depressurization cycling mercury intrusion porosimetry (PDC-MIP). Cem. Concr. Res. 2010, 40, 1120–1128. [Google Scholar] [CrossRef]
  41. Anwar, M.; Emarah, D.A. Pore structure of concrete containing ternary cementitious blends. Results Mater. 2019, 1, 100019. [Google Scholar] [CrossRef]
  42. Bass, I. Six Sigma Statistics with Excel and Minitab; McGraw-Hill: New York, NY, USA, 2007. [Google Scholar]
  43. Sawyer, S. Analysis of Variance: The Fundamental Concepts. J. Man. Manip. Ther. 2009, 17, 27–37. [Google Scholar] [CrossRef]
  44. Lummer, N.R.; Plank, J. Combination of lignosulfonate and AMPS®-co-NNDMA water retention agent—An example for dual synergistic interaction between admixtures in cement. Cem. Concr. Res. 2012, 42, 728–735. [Google Scholar] [CrossRef]
  45. Gelardi, G.; Flatt, R.J. Working mechanisms of water reducers and superplasticizers. In Science and Technology of Concrete Admixtures; Woodhead Publishing: Cambridge, UK, 2016; pp. 256–278. [Google Scholar]
  46. Panesar, D.K.; Zhang, R. Performance comparison of cement replacing materials in concrete: Limestone fillers and supplementary cementing materials–A review. Constr. Build. Mater. 2020, 251, 118866. [Google Scholar] [CrossRef]
  47. Rodger, S.A.; Double, D.D. The chemistry of hydration of high alumina cement in the presence of accelerating and retarding admixtures. Cem. Concr. Res. 1984, 14, 73–82. [Google Scholar] [CrossRef]
  48. Zhang, Y.; Wang, Y.; Li, T.; Xiong, Z.; Sun, Y. Effects of lithium carbonate on performances of sulphoaluminate cement-based dual liquid high water material and its mechanisms. Constr. Build. Mater. 2018, 161, 374–380. [Google Scholar] [CrossRef]
  49. Fu, Y.; Gu, P.; Xie, P.; Beaudoin, J.J. Effect of chemical admixtures on the expansion of shrinkage-compensating cement containing a pre-hydrated high alumina cement-based expansive additive. Cem. Concr. Res. 1995, 25, 29–38. [Google Scholar] [CrossRef]
  50. Mehta, P.K. Mechanism of expansion associated with ettringite formation. Cem. Concr. Res. 1973, 3, 1–6. [Google Scholar] [CrossRef]
  51. Cohen, M.D. Modeling of expansive cements. Cem. Concr. Res. 1983, 13, 519–528. [Google Scholar] [CrossRef]
  52. Bizzozero, J.; Gosselin, C.; Scrivener, K.L. Expansion mechanisms in calcium aluminate and sulfoaluminate systems with calcium sulfate. Cem. Concr. Res. 2014, 56, 190–202. [Google Scholar] [CrossRef]
  53. Livesey, P. Strength characteristics of Portland-limestone cements. Con. Build. Mater. 1991, 5, 147–150. [Google Scholar] [CrossRef]
  54. Kenai, S.; Soboyejo, W.; Soboyejo, A. Some Engineering Properties of Limestone Concrete. Mater. Manuf. Process. 2004, 19, 949–961. [Google Scholar] [CrossRef]
  55. Ramezanianpour, A.A. Cement Replacement Materials: Properties, Durability, Sustainability; Springer: Berlin/Heidelberg, Germany, 2014. [Google Scholar]
  56. Su, Y.; Luo, B.; Luo, Z.; Huang, H.; Li, J.; Wang, D. Effect of Accelerators on the Workability, Strength, and Microstructure of Ultra-High-Performance Concrete. Materials 2021, 15, 159. [Google Scholar] [CrossRef] [PubMed]
  57. Silva, B.; Pinto, A.P.F.; Gomes, A.; Candeias, A. Impact of a viscosity-modifying admixture on the properties of lime mortars. J. Build. Eng. 2020, 31, 101132. [Google Scholar] [CrossRef]
  58. Zhang, G.; Li, G.; Li, Y. Effects of superplasticizers and retarders on the fluidity and strength of sulphoaluminate cement. Constr. Build. Mater. 2016, 126, 44–54. [Google Scholar] [CrossRef]
  59. Rößler, M.; Odler, I. Investigation on the relationship between porosity, structure and strength of hydrated portland cement pastes: Effect of porosity. Cem. Concr. Res. 1985, 15, 320–330. [Google Scholar]
Figure 1. The compositions of ternary binders utilized in our laboratories. The systems under investigation in this study, denoted as C1, C2, and C3.
Buildings 13 02494 g001
Figure 2. The general design of an experiment’s model of a process [22].
Buildings 13 02494 g002
Figure 3. Taguchi’s loss functions, (a) nominal-the-best loss function; (b) larger-the-better loss function; (c) smaller-the-better loss function [26].
Buildings 13 02494 g003
Figure 4. The schematic diagram outlining the study design, formulated using the Taguchi approach.
Buildings 13 02494 g004
Figure 5. The main effects plot for flow values, denoted in millimeters (mm). The represented values are the mean of means, providing a comprehensive overview of the data.
Buildings 13 02494 g005
Figure 6. The main effects plot for the cumulative heat of hydration, measured in Joules per gram (J/g). The represented values are the mean of means, giving a synthesized view of the data.
Buildings 13 02494 g006
Figure 7. The 3D scatter plot, visually interpreting the three principal components extracted from the heat of hydration curves.
Buildings 13 02494 g007
Figure 8. The heat of hydration curves, highlighting the thermal evolution for all of the tested formulations, (a) formulations C1 with AC at levels 2 and 3; (b) formulations C2 and C3 with AC at level 3; (c) all compositions with AC at level 2; (d) all compositions without AC.
Buildings 13 02494 g008
Figure 9. The 3D scatter plot representing the three principal components derived from the length change curves of the samples.
Buildings 13 02494 g009
Figure 10. The length change curves, representing the dimensional variations in (μm/m) for all tested formulations.
Buildings 13 02494 g010
Figure 11. The main effects plot for the 7-day compressive strength, measured in (MPa). The depicted values represent the mean of means, providing a comprehensive view of the data.
Buildings 13 02494 g011
Figure 12. The compressive strength measurements for all formulations after 7 days.
Buildings 13 02494 g012
Figure 13. The main effects plot for the cumulative pore volume, measured in mL/g. The values represented are the mean of means, providing a comprehensive view of the data.
Buildings 13 02494 g013
Figure 14. The total cumulative pore volume of 7-day samples: (a) The 3D scatter plot visualizing the three principal components derived from the cumulative pore volume curves; (b) Representative MIP pore size distribution curves.
Buildings 13 02494 g014
Figure 15. X-ray diffraction (XRD) analysis of the 7-day samples: (a) The 3D scatter plot, illustrating the three principal components derived from the XRD patterns; (b) The XRD diffractograms corresponding to selected formulations, representing the first three principal components. The phase abbreviations used are ‘E’ for ettringite, ‘Q’ for quartz and ‘C’ for calcite.
Buildings 13 02494 g015
Table 1. Chemical composition of the row materials used (wt.%) obtained by XRF.
PCFonduAnhydriteLSPSlagQP
CaO66.5437.937.680.1944.92
SiO216.464.30.6910.5834.26100
Fe2O33.51170.651.910.58
MgO1.230.620.091.386.11
Al2O34.1838.70.064.429.11
K2O1.650.050.011.130.67
TiO2 1.80.01 0.78
SO36.41 0.383.57
Cr2O3 0.120.01
MnO 0.150.01
P2O3 0.110.04
Table 2. Mineralogical composition of the raw materials used.
PCFonduAnhydriteLSPSlagQP
C3S60
C2S199
C3A4
C4AF88
CA 64
C12A7 5
C2AS 5
C3FT 8
AH3 1
CaCO3 943
SiO2 3 95
Anhydrite9 100
Gypsum
Ankerite 3
Microcline 5
Amorphous 97
Table 3. Formulations of the investigated compositions in this study.
PC (wt.%)Fondu
(wt.%)
Anhydrite
(wt.%)
LSP/QP/Slag
(wt.%)
Composition 1 (C1)3149200
23.2536.751525
15.5024.501050
Composition 2 (C2)1364.5022.500
9.7548.3716.8725
6.5032.2511.2550
Composition 3 (C3)070300
052.522.525
0351550
Table 4. Factor levels applied to this study.
Factors Levels
123
1CompositionC1C2C3
2Type of mineral powderLSPQPSlag
3Replacement ratio (wt.%)02550
4Superplasticizer (SP) (wt.%)00.050.1
5Accelerator (AC) (wt.%)00.050.1
6Retarder (RT) (wt.%)00.10.2
7Stabilizer (ST) (wt.%)00.050.1
Table 5. Experimental layout using L27(313) array.
CompositionPowderR. RatioSPACRTST
11111111
21122222
31133333
41212233
51223311
61231122
71313322
81321133
91332211
102112323
112123131
122131212
132213112
142221223
152232331
162311231
172322312
182333123
193113232
203121313
213132121
223211321
233222132
243233213
253312113
263323221
273331332
Table 6. Eigenvalues and correlation matrix for the heat of hydration curves, length change curves, and XRD patterns.
Principal ComponentsPC1PC2PC3
Heat of hydrationEigenvalue18.855.141.97
Proportion0.700.190.07
Cumulative0.700.890.96
Length changeEigenvalue16.035.392.77
Proportion0.590.200.10
Cumulative0.590.790.90
Cumulative pore volumeEigenvalue24.321.290.30
Proportion0.930.050.01
Cumulative0.930.980.99
XRD patternsEigenvalue23.191.940.63
Proportion0.890.070.02
Cumulative0.890.970.99
Disclaimer/Publisher’s Note: The statements, opinions and data contained in all publications are solely those of the individual author(s) and contributor(s) and not of MDPI and/or the editor(s). MDPI and/or the editor(s) disclaim responsibility for any injury to people or property resulting from any ideas, methods, instructions or products referred to in the content.

