
Research on the Distributive Relationship between Bond Force and Bearing Pressure for Anchorage Force by Headed Bars


Abstract
:1. Introduction
- (1)
- when using a partial anchorage head for the rebar, the bearing area of the headed bars must be at least nine times as large as the sectional area of the reinforcement;
- (2)
- when using the full anchorage head for the rebar, the bearing area of the headed bars must be at least 4.5 times as large as the sectional area of the reinforcement, and the reinforcement’s nominal diameter must not exceed 40 mm;
- (3)
- the thickness of the headed bars should not be less than the nominal reinforcement diameter.
2. Experimental Program
2.1. Design of the Specimens
2.2. Properties of Materials
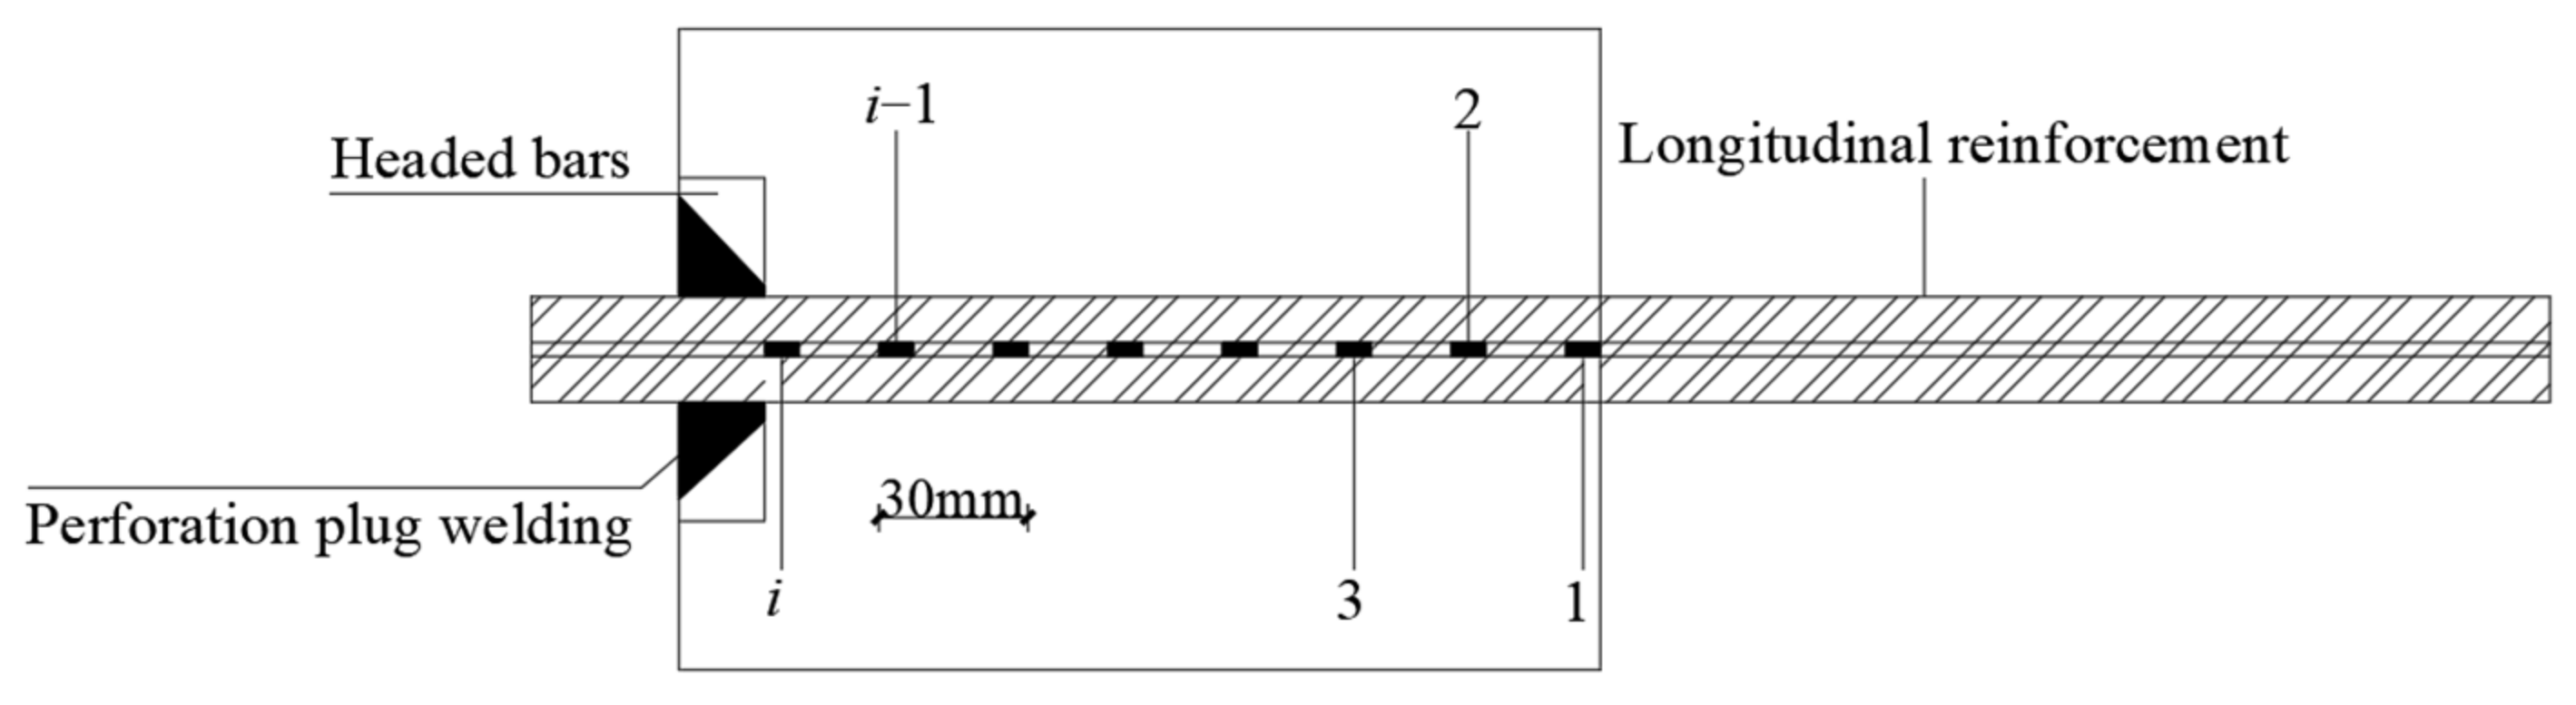
2.3. Loading and Measurement Scheme
3. Experimental Phenomenon
3.1. First Failure Mode of the Specimen
3.2. Second Failure Mode of the Specimen
3.3. Third Failure Mode of the Specimen
4. Results and Analysis
4.1. Results of Pull-Out Tests
4.2. Analysis of the Influencing Parameters on γ
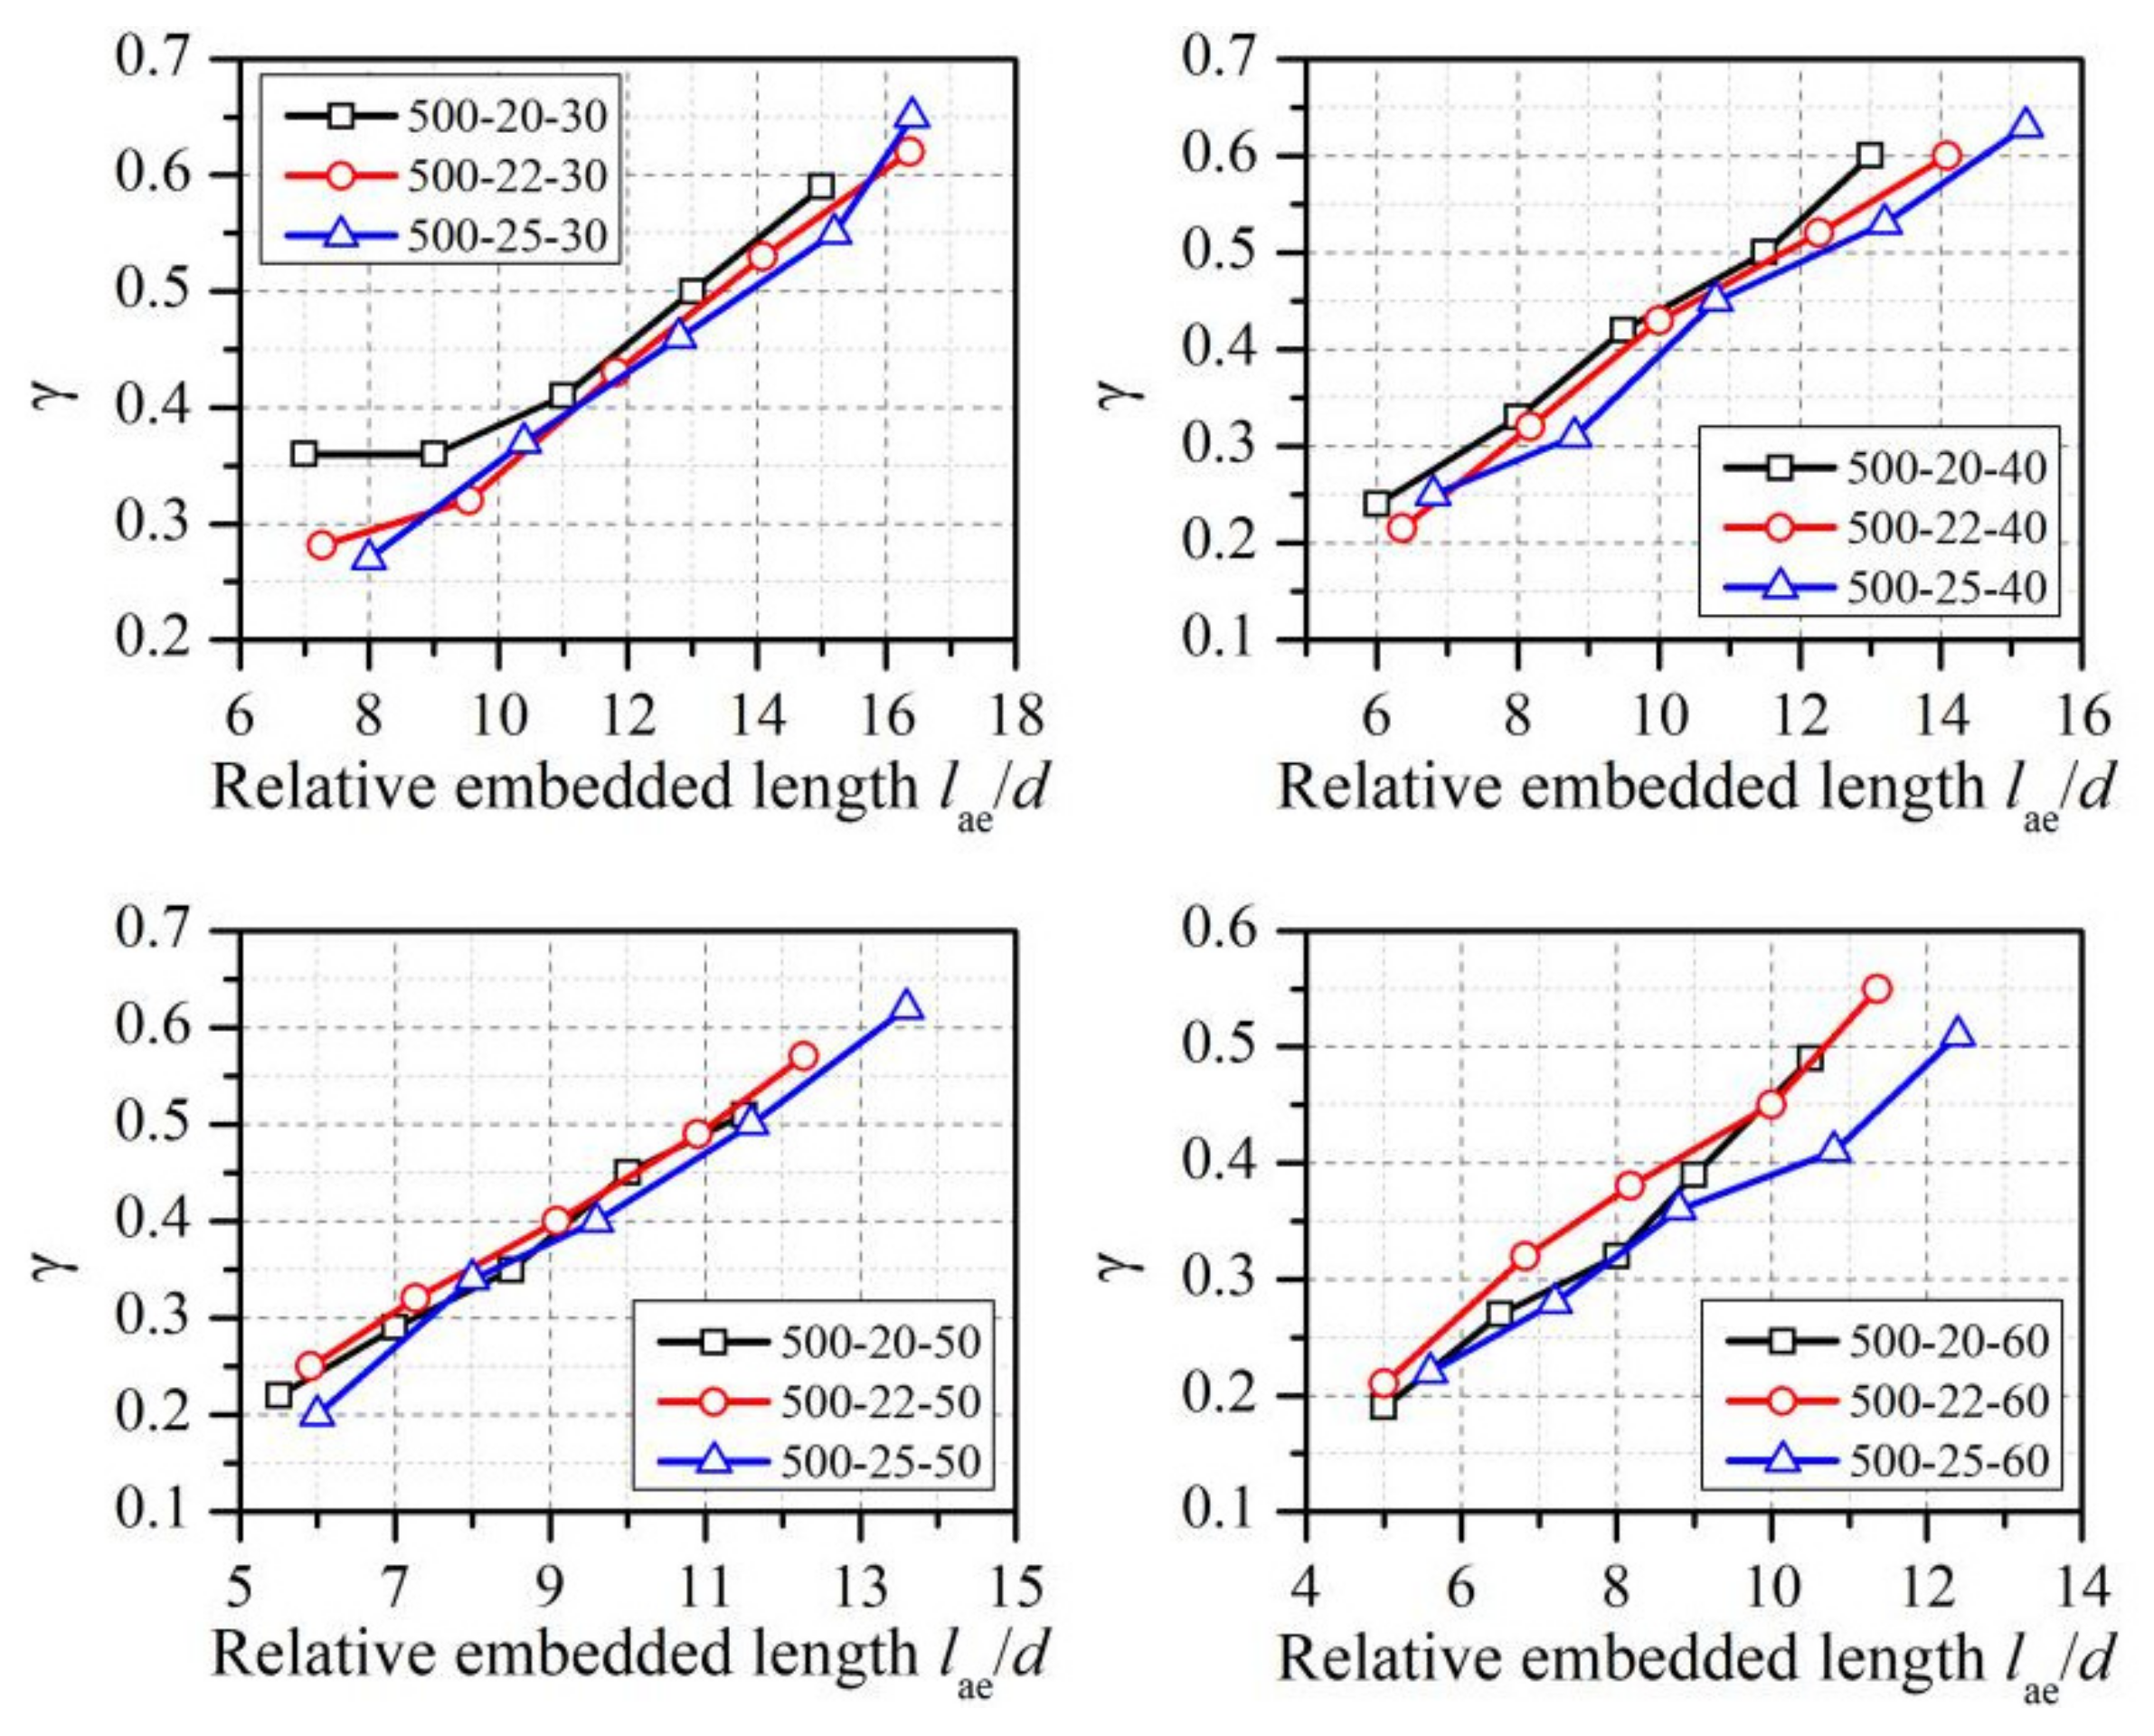
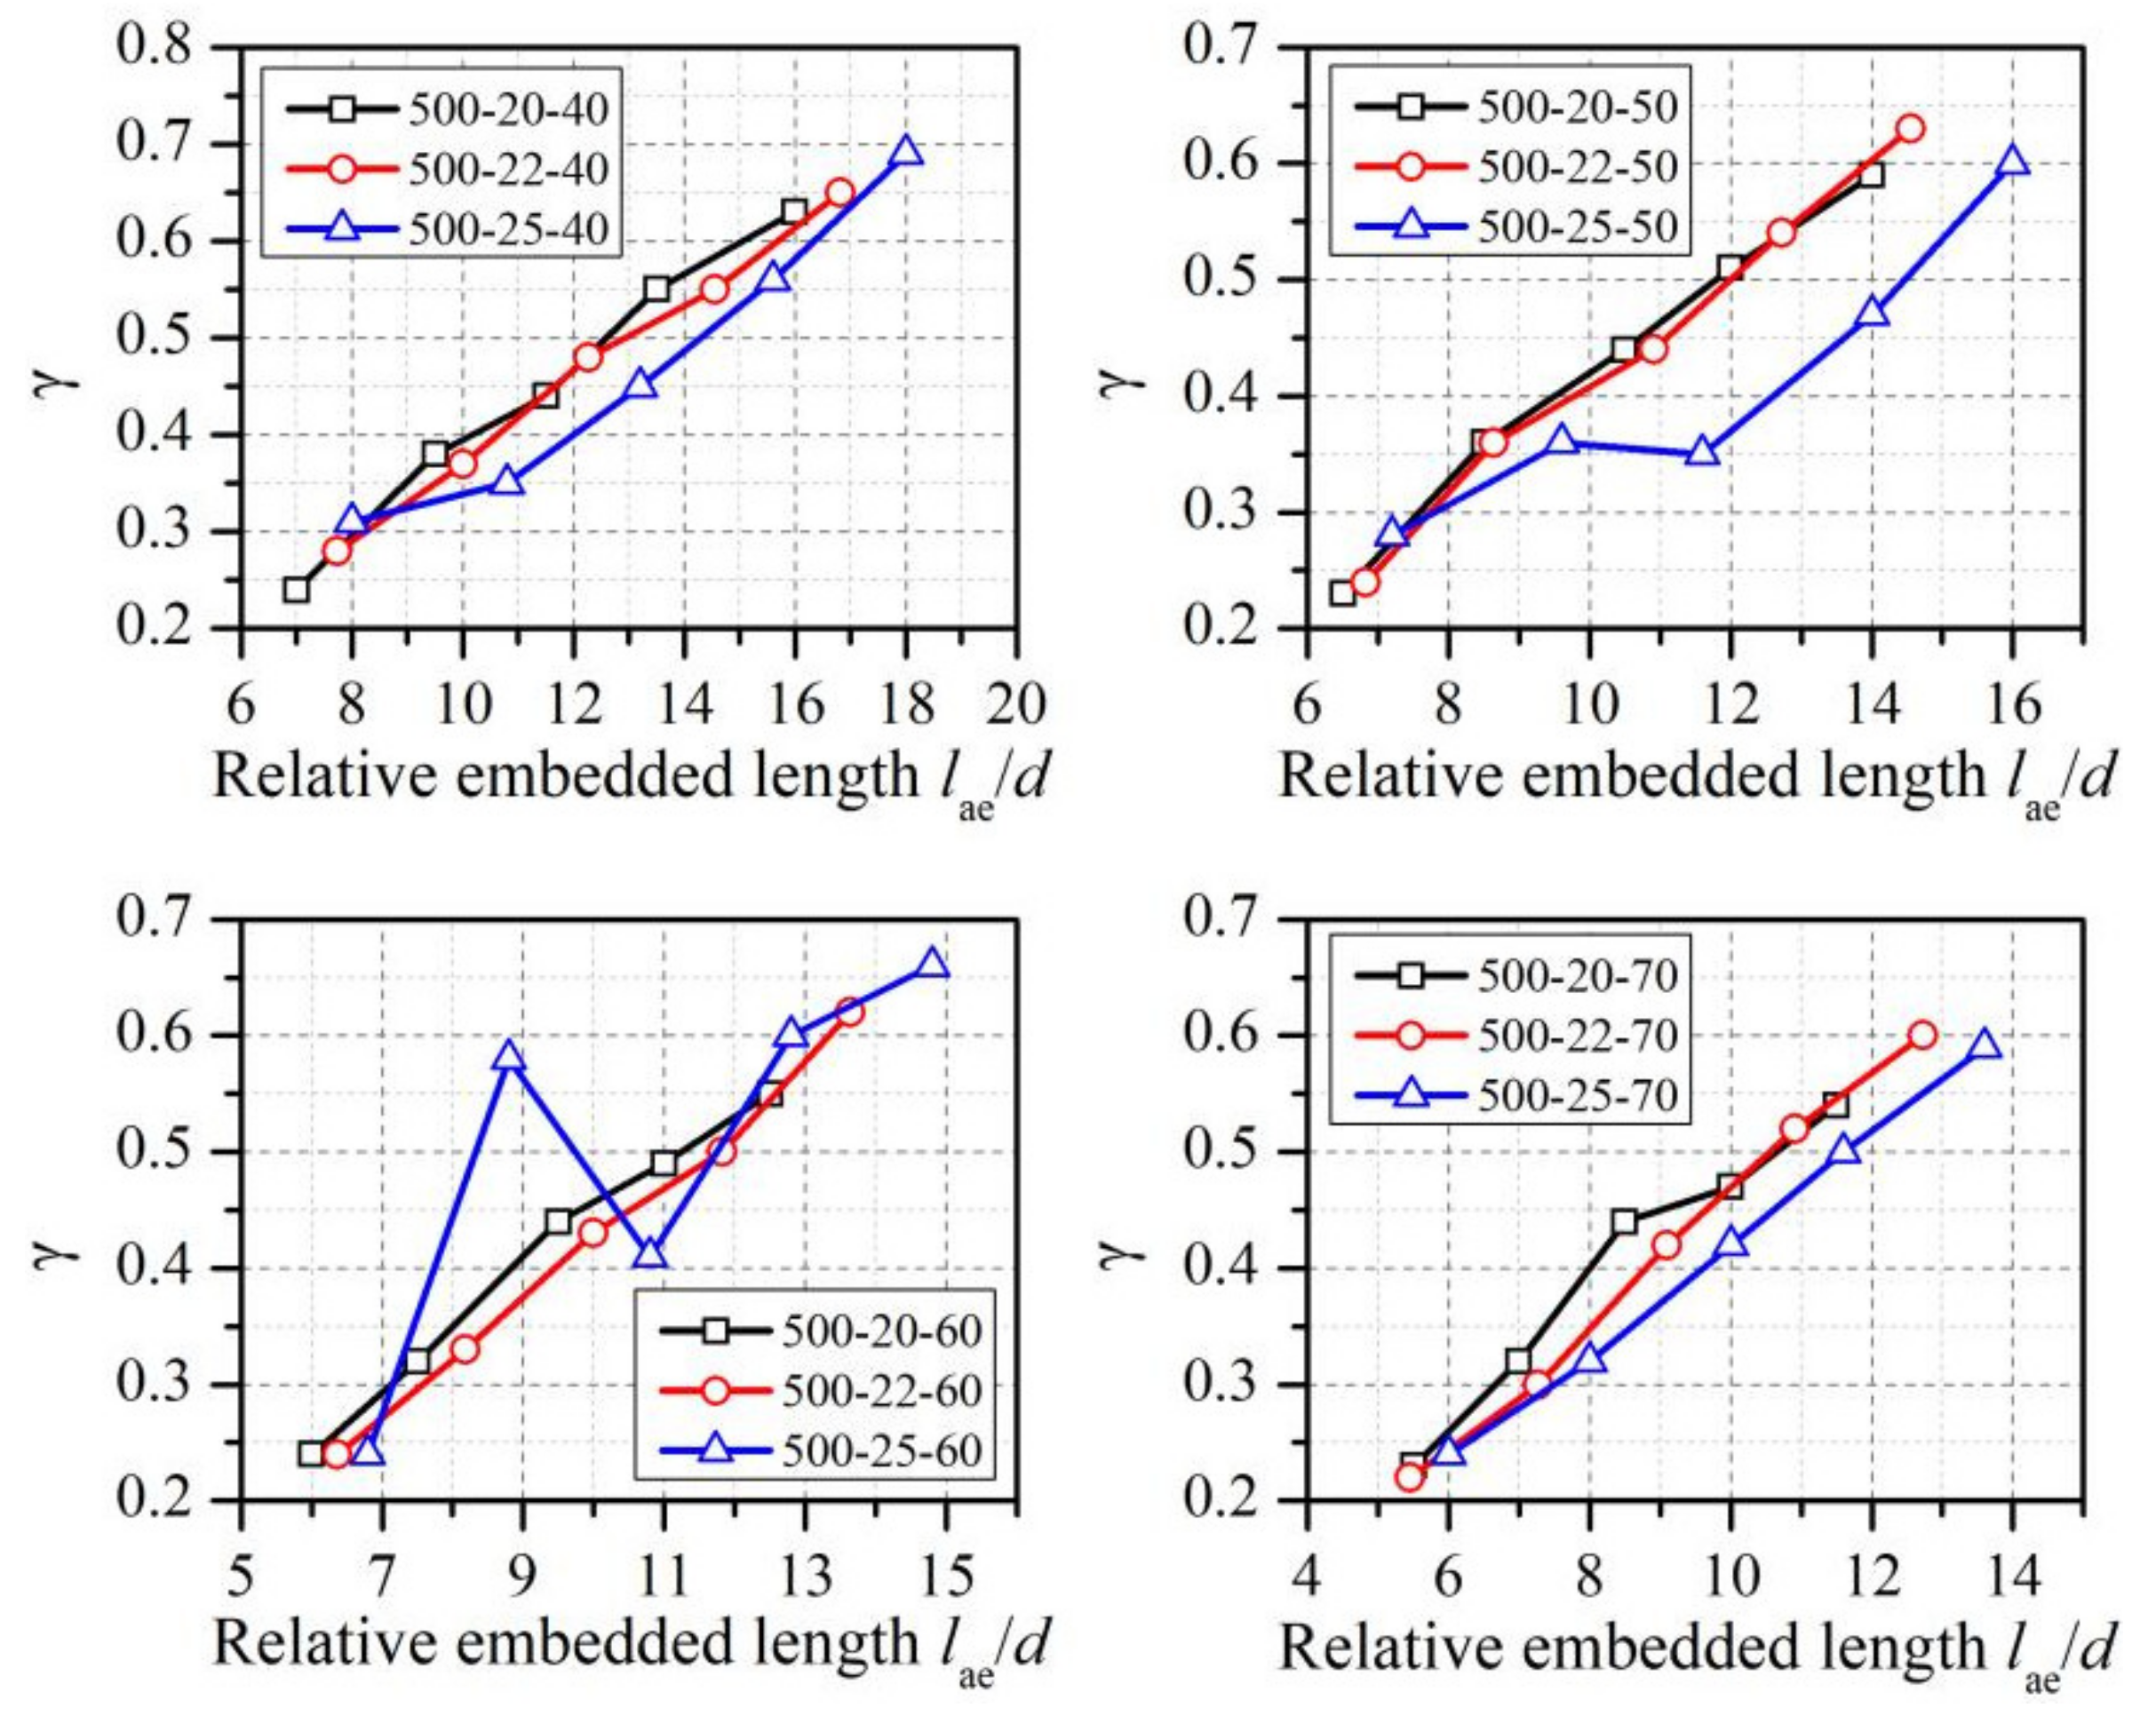
4.2.1. Effect of the Relative Embedded Length lae/d
4.2.2. Effect of fy/ft
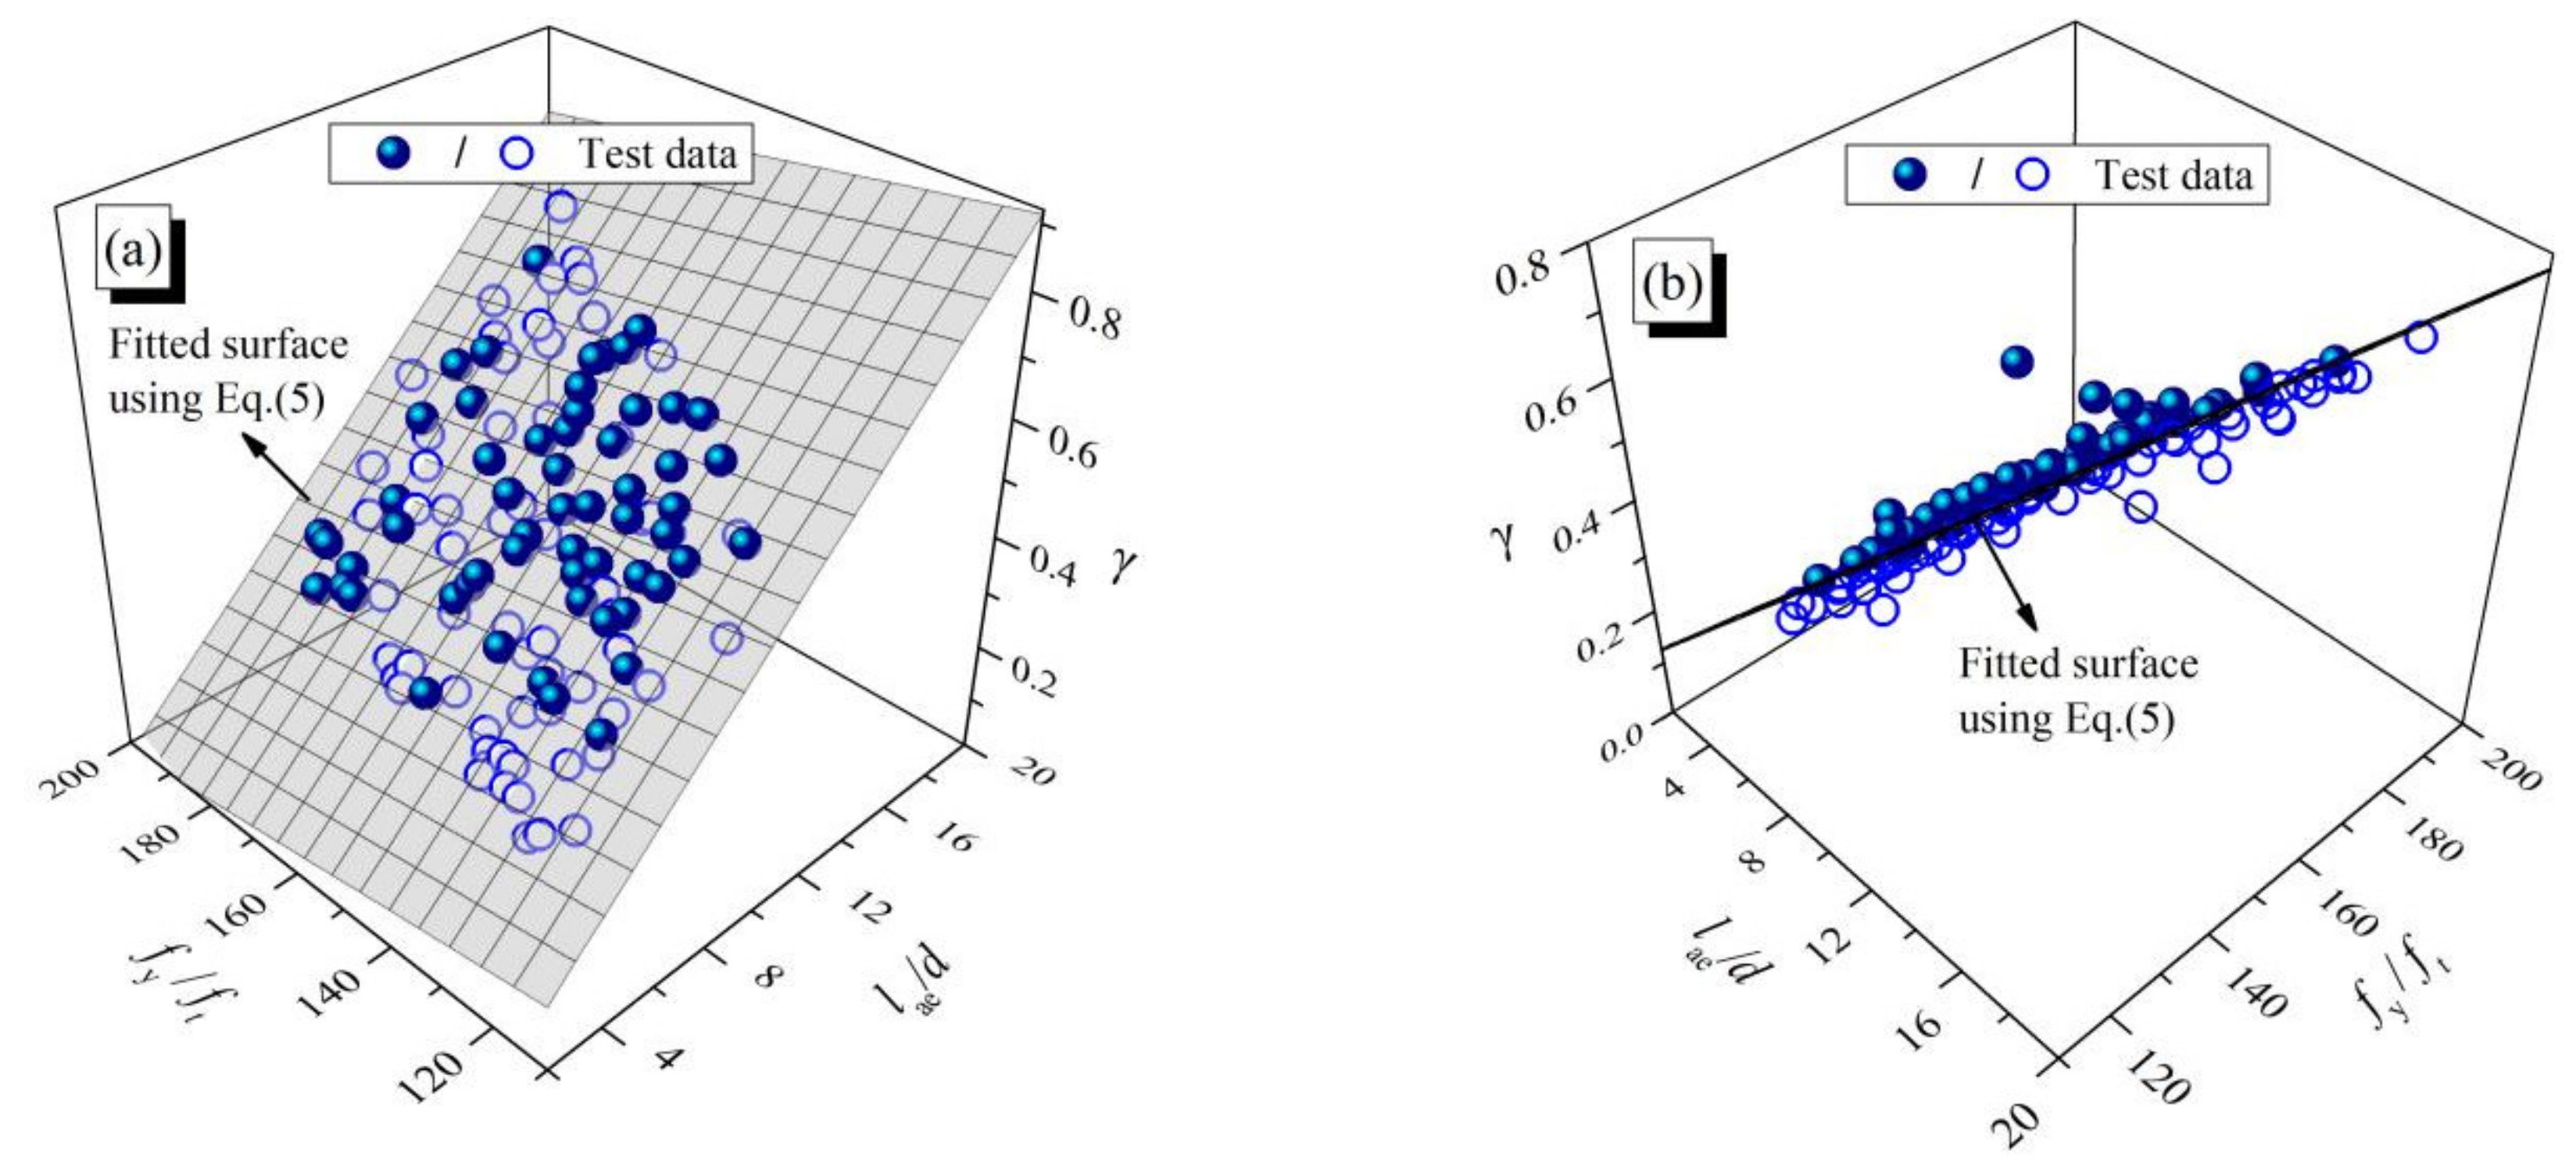
4.3. Determination of the Distributive Relationship
5. Conclusions
- Different embedded lengths lae led to varying damage results. For small values of lae, failure was mainly due to the bearing pressure of the headed bars, resulting in longitudinal cracks throughout the specimen. For large values of lae, failure was primarily due to reinforcement fracture, and longitudinal crack development was not evident. For moderate values of lae, the joint action of the bearing pressure of the headed bars and the bond force between the reinforcement and concrete caused failure, with longitudinal cracks developing along the specimen but not penetrating it entirely.
- The concept of a nominal average bond stress τu was proposed. The correction coefficient γ was introduced to correct the difference between the actual average bond stress τ and the nominal average bond stress τu.
- The correction coefficient γ would increase with an increase in the relative embedded length of the reinforcement lae/d (on average, 146% higher than the initial value) and decrease with an increase in the fy/ft (on average, 33% less than the initial value), with an obvious linear relationship. A formula for γ with lae/d and fy/ft as independent variables was established.
- A calculation method could be derived for the bond force in straight anchor sections at the yield moment for the reinforcement. A distributive relationship for the anchorage force between the bond force and the bearing pressure was obtained. This enabled the direct and effective consideration and selection of influencing factors such as the dimensions of the headed bars, embedded reinforcement length, and concrete strength grade. Consequently, reinforcement design with headed bars can shift from passive checking to active selection.
Author Contributions
Funding
Data Availability Statement
Conflicts of Interest
Nomenclature
| As | Cross-sectional area of the reinforcement, mm2 |
| c | Distance from the longitudinal reinforcement to the outermost edge of the specimen, mm |
| d | Diameter of reinforcement, mm |
| Fb | Bond force between the reinforcement and concrete in the straight anchor section, kN |
| Fb/Fy,8 | Calculated value using Equation (8) |
| Fp | Bearing pressure of the headed bars, kN |
| Fy | Anchorage force of reinforcement, kN |
| fcg | Strength grade of concrete |
| fc,m | Measured axial values concrete compressive strength, MPa |
| ft,m | Measured axial values concrete tensile strength, MPa |
| fu,m | Measured reinforcement ultimate strength, MPa |
| fy | Yield strength of reinforcement, MPa |
| fyAs | Yield force of reinforcement, kN |
| fy/ft | Ratio of the yield strength of reinforcement to the tensile strength of concrete |
| fy,m | Measured reinforcement yield strength, MPa |
| lab | Basic embedded length of reinforcement, mm |
| lae | Embedded length of reinforcement, mm |
| lae/d | Relative embedded length |
| τu | Nominal average bond stress, MPa |
| τ | Actual average bond stress, MPa |
| γ | Correction coefficient |
| β | Ratio of the actual embedded length to the basic embedded length |
| γ5 | Calculated value using Equation (5) |
| μ | Ratio of the test value to the calculated value γ5 |
| λ | Ratio of the test value to the calculated value Fb/Fy,8 |
References
- Brooker, O. Use of headed bars as anchorage to reinforcement. Struct. Eng. 2013, 91, 49–57. [Google Scholar]
- Wright, J.L.; McCabe, S.L. The Development Length and Anchorage Behavior of Headed Reinforcing Bars; SM Report No. 44; University of Kansas Centre for Research: Lawrence, KS, USA, 1997. [Google Scholar]
- Wallace, J.W.; McConnell, S.W.; Gupta, P.; Cote, P.A. Use of headed reinforcement in beam-column joints subjected to earthquake loads. ACI Struct. J. 1998, 95, 590–606. [Google Scholar]
- Miao, T.M.; Zheng, W.Z. Distributive relationship of anchorage force relative to reinforcement and headed bars. Eng. Struct. 2020, 209, 109961. [Google Scholar] [CrossRef]
- Youssf, O.; Hassanli, R.; Mills, J.E.; Elrahman, M.A. An experimental investigation of the mechanical performance and structural application of LECA-Rubcrete. Constr. Build. Mater. 2018, 175, 239–253. [Google Scholar] [CrossRef]
- Yi, O.; Zhuge, Y.; Ma, X.; Gravina, R.J.; Mills, J.E.; Youssf, O. Push-off and pull-out bond behaviour of CRC composite slabs—An experimental investigation. Eng. Struct. 2021, 228, 111480. [Google Scholar] [CrossRef]
- Gravina, R.J.; Xie, T.Y.; Roychand, R.; Zhuge, Y.; Ma, X.; Mills, J.E.; Youssf, O. Bond behaviour between crumb rubberized concrete and deformed steel bars. Structures 2021, 34, 2115–2133. [Google Scholar] [CrossRef]
- Wallace, J.W. Headed reinforcement: A viable option. Concr. Int. 1997, 19, 47–53. [Google Scholar]
- Singhal, S.; Chourasia, A.; Parashar, J. Anchorage behaviour of headed bars as connection system for precast reinforced concrete structural components. Structures 2020, 27, 1408–1418. [Google Scholar] [CrossRef]
- Singhal, S.; Chourasia, A.; Kajale, Y. Cyclic behaviour of precast reinforced concrete beam-columns connected with headed bars. J. Build. Eng. 2021, 42, 103087. [Google Scholar] [CrossRef]
- Yang, Y.Z.; Varma, A.H.; Kreger, M.E.; Wang, Y.; Zhang, K. Shear strength of reinforced concrete beams with T-headed bars for safety-related nuclear structures. Eng. Struct. 2021, 230, 111705. [Google Scholar] [CrossRef]
- Vella, J.P.; Vollum, R.L.; Jackson, A. Investigation of headed bar joints between precast concrete panels. Eng. Struct. 2017, 138, 351–366. [Google Scholar] [CrossRef]
- Vella, J.P.; Vollum, R.L.; Kotecha, R. Headed bar connections between precast concrete elements: Design recommendations and practical applications. Structures 2018, 15, 162–173. [Google Scholar] [CrossRef]
- Sachdeva, P.; Roy, A.B.D.; Kwatra, N. Behaviour of steel fibers reinforced exterior beam-column joint using headed bars under reverse cyclic loading. Structures 2021, 33, 3929–3943. [Google Scholar] [CrossRef]
- Paknejadi, A.H.; Behfarnia, K. Performance of reinforced self-consolidating concrete beam-column joints with headed bars subjected to pseudo-static cyclic loading. Ain Shams Eng. J. 2020, 11, 751–765. [Google Scholar] [CrossRef]
- Chiu, C.K.; Lays, D.P.; Ricky; Krasna, W.A. Anchorage strength development of headed bars in HSRC external beam-column joints considering side-face blowout failure under monotonic loading. Eng. Struct. 2021, 239, 112218. [Google Scholar] [CrossRef]
- Chun, S.C.; Lee, B.S. Components of side-face blowout strengths of headed bars in exterior beam-column joints. ACI Struct. J. 2019, 116, 159–169. [Google Scholar] [CrossRef]
- Chourasia, A.; Gupta, S. Influential parameters for headed bars in RC beam-column joint. Curr. Sci. 2019, 116, 1666–1673. [Google Scholar] [CrossRef]
- Sachdeva, P.; Roy, A.B.D.; Kwatra, N. Anchorage capacity of headed bars in steel fiber reinforced concrete. Can. J. Civ. Eng. 2021, 49, 134–147. [Google Scholar] [CrossRef]
- Sachdeva, P.; Roy, A.B.D.; Kwatra, N. Performance evaluation of different shapes of headed bars in steel fiber reinforced concrete. Adv. Concr. Constr. 2021, 11, 387–396. [Google Scholar]
- Zhao, D.B.; Zhou, Y.W.; Xing, F.; Sui, L.L.; Ye, Z.H.; Fu, H.K. Bond behavior and failure mechanism of fiber-reinforced polymer bar-engineered cementitious composite interface. Eng. Struct. 2021, 243, 112520. [Google Scholar] [CrossRef]
- Eligehausen, R.; Popov, E.P.; Bertero, V. Local Bond Stress-Slip Relationships of Deformed Bars under Generalized Excitations; College of Engineering, University of California: Berkeley, CA, USA, 1983. [Google Scholar]
- CEP-FIP Model Code 2010; The International Federation for Structural Concrete: Lausanne, Switzerland, 2010.
- Xu, Y.L.; Shao, Z.M.; Shen, W.D. Bond strength between reinforcement bars and concrete. J. Build. Sci. 1988, 4, 8–14. [Google Scholar]
- Xu, Y.L. Experimental Study on Bond Anchorage Performance of Deformed Reinforcement Concrete. Ph.D. Thesis, Tsinghua University, Beijing, China, 1990. [Google Scholar]
- Xu, Y.L.; Shen, W.D.; Wang, H. Experimental study on bond anchorage performance of reinforced concrete. J. Build. Struct. 1994, 15, 26–37. [Google Scholar]
- GB50010-2010; Code for Design of Concrete Structures. China Architecture & Building Press: Beijing, China, 2015.
- JGJ 256-2011; Technical Specification for Application of Headed Bars. China Architecture & Building Press: Beijing, China, 2011.


| Group | No. | β | Group | No. | β | Group | No. | β |
|---|---|---|---|---|---|---|---|---|
| 500-20-30 | 500-20-30-140 | 0.28 | 500-20-40 | 500-20-40-120 | 0.28 | 500-20-50 | 500-20-50-110 | 0.28 |
| 500-20-30-180 | 0.36 | 500-20-40-160 | 0.36 | 500-20-50-140 | 0.36 | |||
| 500-20-30-220 | 0.43 | 500-20-40-190 | 0.44 | 500-20-50-170 | 0.42 | |||
| 500-20-30-260 | 0.50 | 500-20-40-230 | 0.53 | 500-20-50-200 | 0.51 | |||
| 500-20-30-300 | 0.61 | 500-20-40-260 | 0.63 | 500-20-50-230 | 0.58 | |||
| 500-20-60 | 500-20-60-100 | 0.28 | 500-22-30 | 500-22-30-160 | 0.29 | 500-22-40 | 500-22-40-140 | 0.28 |
| 500-20-60-130 | 0.36 | 500-22-30-210 | 0.37 | 500-22-40-180 | 0.37 | |||
| 500-20-60-160 | 0.45 | 500-22-30-260 | 0.46 | 500-22-40-220 | 0.46 | |||
| 500-20-60-180 | 0.49 | 500-22-30-310 | 0.56 | 500-22-40-270 | 0.56 | |||
| 500-20-60-210 | 0.59 | 500-22-30-360 | 0.65 | 500-22-40-310 | 0.63 | |||
| 500-22-50 | 500-22-50-130 | 0.31 | 500-22-60 | 500-22-60-110 | 0.28 | 500-25-30 | 500-25-30-200 | 0.33 |
| 500-22-50-160 | 0.38 | 500-22-60-150 | 0.39 | 500-25-30-260 | 0.43 | |||
| 500-22-50-200 | 0.47 | 500-22-60-180 | 0.46 | 500-25-30-320 | 0.52 | |||
| 500-22-50-240 | 0.56 | 500-22-60-220 | 0.55 | 500-25-30-380 | 0.62 | |||
| 500-22-50-270 | 0.64 | 500-22-60-250 | 0.67 | 500-25-30-410 | 0.67 | |||
| 500-25-40 | 500-25-40-170 | 0.32 | 500-25-50 | 500-25-50-150 | 0.30 | 500-25-60 | 500-25-60-140 | 0.33 |
| 500-25-40-220 | 0.41 | 500-25-50-200 | 0.43 | 500-25-60-180 | 0.41 | |||
| 500-25-40-270 | 0.51 | 500-25-50-240 | 0.51 | 500-25-60-220 | 0.50 | |||
| 500-25-40-330 | 0.62 | 500-25-50-290 | 0.61 | 500-25-60-270 | 0.64 | |||
| 500-25-40-380 | 0.71 | 500-25-50-340 | 0.70 | 500-25-60-310 | 0.70 | |||
| 600-20-40 | 600-20-40-140 | 0.27 | 600-20-50 | 600-20-50-130 | 0.28 | 600-20-60 | 600-20-60-120 | 0.30 |
| 600-20-40-190 | 0.38 | 600-20-50-170 | 0.38 | 600-20-60-150 | 0.36 | |||
| 600-20-40-230 | 0.45 | 600-20-50-210 | 0.47 | 600-20-60-190 | 0.48 | |||
| 600-20-40-270 | 0.53 | 600-20-50-240 | 0.53 | 600-20-60-220 | 0.53 | |||
| 600-20-40-320 | 0.63 | 600-20-50-280 | 0.62 | 600-20-60-250 | 0.60 | |||
| 600-20-70 | 600-20-70-110 | 0.29 | 600-22-40 | 600-22-40-170 | 0.31 | 600-22-50 | 600-22-50-150 | 0.30 |
| 600-20-70-140 | 0.37 | 600-22-40-220 | 0.40 | 600-22-50-190 | 0.39 | |||
| 600-20-70-170 | 0.46 | 600-22-40-270 | 0.49 | 600-22-50-240 | 0.49 | |||
| 600-20-70-200 | 0.54 | 600-22-40-320 | 0.56 | 600-22-50-280 | 0.58 | |||
| 600-20-70-230 | 0.61 | 600-22-40-370 | 0.67 | 600-22-50-320 | 0.66 | |||
| 600-22-60 | 600-22-60-140 | 0.32 | 600-22-70 | 600-22-70-120 | 0.29 | 600-25-40 | 600-25-40-200 | 0.30 |
| 600-22-60-180 | 0.40 | 600-22-70-160 | 0.38 | 600-25-40-270 | 0.40 | |||
| 600-22-60-220 | 0.49 | 600-22-70-200 | 0.49 | 600-25-40-330 | 0.48 | |||
| 600-22-60-260 | 0.61 | 600-22-70-240 | 0.59 | 600-25-40-390 | 0.59 | |||
| 600-22-60-300 | 0.70 | 600-22-70-280 | 0.69 | 600-25-40-450 | 0.69 | |||
| 600-25-50 | 600-25-50-180 | 0.29 | 600-25-60 | 600-25-60-170 | 0.29 | 600-25-70 | 600-25-70-150 | 0.31 |
| 600-25-50-240 | 0.41 | 600-25-60-220 | 0.40 | 600-25-70-200 | 0.41 | |||
| 600-25-50-290 | 0.49 | 600-25-60-270 | 0.50 | 600-25-70-250 | 0.51 | |||
| 600-25-50-350 | 0.59 | 600-25-60-320 | 0.58 | 600-25-70-290 | 0.59 | |||
| 600-25-50-400 | 0.67 | 600-25-60-370 | 0.68 | 600-25-70-340 | 0.68 |
| fcg/MPa | Type of Cement | Water-Binder Ratio | Slump of Concrete | Material Consumption | |||||
|---|---|---|---|---|---|---|---|---|---|
| Cement | Silica Fume | Slag Powder | Water | Sand | Stone | ||||
| C30 | P·O 42.5 | 0.52 | 70 mm | 413 | - | - | 215 | 602 | 1169 |
| C40 | P·O 42.5 | 0.44 | 70 mm | 430 | - | - | 190 | 610 | 1180 |
| C50 | P·O 42.5 | 0.35 | 70 mm | 542 | - | - | 190 | 566 | 1100 |
| C60 | P·O 42.5 | 0.26 | 75 mm | 654 | - | - | 173 | 551 | 1025 |
| C70 | P·O 52.5 | 0.20 | 75 mm | 588 | 50 | 112 | 150 | 513 | 986 |
| fcg/MPa | fc,m/MPa | ft,m/MPa |
|---|---|---|
| C30 | 29.62 | 2.96 |
| C40 | 37.88 | 3.39 |
| C50 | 46.40 | 3.79 |
| C60 | 56.01 | 4.14 |
| C70 | 67.02 | 4.51 |
| Steel Grade | d/mm | fy,m/MPa | fu,m/MPa |
|---|---|---|---|
| HRB300 | 8 | 340 | 400 |
| HRB500 | 20 | 555 | 725 |
| 22 | 555 | 716 | |
| 25 | 560 | 713 | |
| HRB600 | 20 | 633 | 825 |
| 22 | 612 | 796 | |
| 25 | 684 | 901 |
| No. | Fp/kN | Fb/kN | Fy/kN | No. | Fp/kN | Fb/kN | Fy/kN |
|---|---|---|---|---|---|---|---|
| 500-20-30-140 | 107.36 | 60.39 | 167.75 | 500-20-40-120 | 124.76 | 39.40 | 164.16 |
| 500-20-30-180 | 104.85 | 58.98 | 163.83 | 500-20-40-160 | 113.05 | 55.68 | 168.73 |
| 500-20-30-220 | 99.29 | 69.00 | 168.29 | 500-20-40-190 | 94.87 | 68.70 | 163.57 |
| 500-20-30-260 | 85.84 | 85.84 | 171.68 | 500-20-40-230 | 82.83 | 82.83 | 165.66 |
| 500-20-30-300 | 67.52 | 97.16 | 164.68 | 500-20-40-260 | 63.04 | 94.56 | 157.60 |
| 500-20-50-110 | 130.51 | 36.81 | 167.32 | 500-20-60-100 | 135.52 | 31.79 | 167.31 |
| 500-20-50-140 | 118.25 | 48.30 | 166.55 | 500-20-60-130 | 122.28 | 45.23 | 167.51 |
| 500-20-50-170 | 111.11 | 59.83 | 170.94 | 500-20-60-160 | 112.99 | 53.17 | 166.16 |
| 500-20-50-200 | 92.16 | 75.40 | 167.56 | 500-20-60-180 | 104.36 | 66.72 | 171.08 |
| 500-20-50-230 | 82.79 | 86.17 | 168.96 | 500-20-60-210 | 84.46 | 81.15 | 165.61 |
| 500-22-30-160 | 144.66 | 56.42 | 201.08 | 500-22-40-140 | 163.29 | 44.71 | 208.00 |
| 500-22-30-210 | 142.35 | 66.99 | 209.34 | 500-22-40-180 | 140.14 | 65.95 | 206.09 |
| 500-22-30-260 | 118.59 | 89.46 | 208.05 | 500-22-40-220 | 113.38 | 85.53 | 198.91 |
| 500-22-30-310 | 95.17 | 107.32 | 202.49 | 500-22-40-270 | 97.42 | 105.54 | 202.96 |
| 500-22-30-360 | 77.40 | 126.28 | 203.68 | 500-22-40-310 | 82.04 | 123.06 | 205.10 |
| 500-22-50-130 | 147.14 | 49.05 | 196.19 | 500-22-60-110 | 157.13 | 41.77 | 198.90 |
| 500-22-50-160 | 134.39 | 63.24 | 197.63 | 500-22-60-150 | 133.05 | 62.61 | 195.66 |
| 500-22-50-200 | 120.20 | 80.13 | 200.33 | 500-22-60-180 | 123.34 | 75.60 | 198.94 |
| 500-22-50-240 | 102.45 | 98.43 | 200.88 | 500-22-60-220 | 111.99 | 91.63 | 203.62 |
| 500-22-50-270 | 85.43 | 113.24 | 198.67 | 500-22-60-250 | 85.58 | 104.60 | 190.18 |
| 500-25-30-200 | 184.82 | 68.36 | 253.18 | 500-25-40-170 | 190.01 | 63.34 | 253.35 |
| 500-25-30-260 | 158.66 | 93.18 | 251.84 | 500-25-40-220 | 174.62 | 78.45 | 253.07 |
| 500-25-30-320 | 136.64 | 116.40 | 253.04 | 500-25-40-270 | 138.26 | 113.12 | 251.38 |
| 500-25-30-380 | 115.06 | 140.63 | 255.69 | 500-25-40-330 | 119.02 | 134.21 | 253.23 |
| 500-25-30-410 | 89.06 | 165.40 | 254.46 | 500-25-40-380 | 94.53 | 160.96 | 255.49 |
| 500-25-50-150 | 211.28 | 52.82 | 264.10 | 500-25-60-140 | 194.89 | 54.97 | 249.86 |
| 500-25-50-200 | 164.51 | 84.75 | 249.26 | 500-25-60-180 | 185.12 | 71.99 | 257.11 |
| 500-25-50-240 | 151.47 | 100.98 | 252.45 | 500-25-60-220 | 162.88 | 91.62 | 254.50 |
| 500-25-50-290 | 125.47 | 125.47 | 250.94 | 500-25-60-270 | 144.61 | 100.49 | 245.10 |
| 500-25-50-340 | 98.34 | 160.45 | 258.79 | 500-25-60-310 | 125.63 | 130.76 | 256.39 |
| 600-20-40-140 | 148.47 | 46.89 | 195.36 | 600-20-50-130 | 149.48 | 44.65 | 194.13 |
| 600-20-40-190 | 118.46 | 72.60 | 191.06 | 600-20-50-170 | 120.54 | 67.80 | 188.34 |
| 600-20-40-230 | 109.90 | 86.35 | 196.25 | 600-20-50-210 | 106.97 | 84.05 | 191.02 |
| 600-20-40-270 | 86.59 | 105.83 | 192.42 | 600-20-50-240 | 94.36 | 98.21 | 192.57 |
| 600-20-40-320 | 71.81 | 122.27 | 194.08 | 600-20-50-280 | 78.45 | 112.89 | 191.34 |
| 600-20-60-120 | 139.94 | 44.19 | 184.13 | 600-20-70-110 | 147.81 | 44.15 | 191.96 |
| 600-20-60-150 | 129.99 | 61.17 | 191.16 | 600-20-70-140 | 128.99 | 60.70 | 189.69 |
| 600-20-60-190 | 103.44 | 81.27 | 184.71 | 600-20-70-170 | 104.53 | 82.13 | 186.66 |
| 600-20-60-220 | 97.58 | 93.75 | 191.33 | 600-20-70-200 | 99.66 | 88.38 | 188.04 |
| 600-20-60-250 | 87.71 | 107.20 | 194.91 | 600-20-70-230 | 87.13 | 102.28 | 189.41 |
| 600-22-40-170 | 166.66 | 64.81 | 231.47 | 600-22-50-150 | 177.32 | 56.00 | 233.32 |
| 600-22-40-220 | 144.32 | 84.76 | 229.08 | 600-22-50-190 | 144.99 | 81.56 | 226.55 |
| 600-22-40-270 | 118.88 | 109.74 | 228.62 | 600-22-50-240 | 129.24 | 101.55 | 230.79 |
| 600-22-40-320 | 106.91 | 130.67 | 237.58 | 600-22-50-280 | 104.53 | 122.71 | 227.24 |
| 600-22-40-370 | 80.28 | 149.09 | 229.37 | 600-22-50-320 | 83.89 | 142.84 | 226.73 |
| 600-22-60-140 | 172.15 | 54.36 | 226.51 | 600-22-70-120 | 177.70 | 50.12 | 227.82 |
| 600-22-60-180 | 152.99 | 75.35 | 228.34 | 600-22-70-160 | 163.30 | 69.99 | 233.29 |
| 600-22-60-220 | 130.20 | 98.22 | 228.42 | 600-22-70-200 | 130.46 | 94.47 | 224.93 |
| 600-22-60-260 | 109.61 | 109.61 | 219.22 | 600-22-70-240 | 108.91 | 117.99 | 226.90 |
| 600-22-60-300 | 82.91 | 135.27 | 218.18 | 600-22-70-280 | 90.05 | 135.08 | 225.13 |
| 600-25-40-200 | 216.18 | 97.12 | 313.30 | 600-25-50-180 | 236.42 | 91.94 | 328.36 |
| 600-25-40-270 | 207.96 | 111.98 | 319.94 | 600-25-50-240 | 199.79 | 112.38 | 312.17 |
| 600-25-40-330 | 179.50 | 146.86 | 326.36 | 600-25-50-290 | 202.47 | 109.02 | 311.49 |
| 600-25-40-390 | 139.15 | 177.10 | 316.25 | 600-25-50-350 | 167.41 | 148.46 | 315.87 |
| 600-25-40-450 | 96.62 | 215.06 | 311.68 | 600-25-50-400 | 126.83 | 190.25 | 317.08 |
| 600-25-60-170 | 256.77 | 81.09 | 337.86 | 600-25-70-150 | 233.14 | 73.62 | 306.76 |
| 600-25-60-220 | 132.60 | 183.11 | 315.71 | 600-25-70-200 | 210.69 | 99.15 | 309.84 |
| 600-25-60-270 | 185.40 | 128.84 | 314.24 | 600-25-70-250 | 178.90 | 129.55 | 308.45 |
| 600-25-60-320 | 128.16 | 192.24 | 320.40 | 600-25-70-290 | 154.78 | 154.78 | 309.56 |
| 600-25-60-370 | 107.70 | 209.06 | 316.76 | 600-25-70-340 | 130.32 | 187.53 | 317.85 |
| No. | γ (Test Value) | μ | No. | γ (Test Value) | μ | No. | γ (Test Value) | μ | No. | γ (Test Value) | μ |
|---|---|---|---|---|---|---|---|---|---|---|---|
| 500-20-30-140 | 0.360 | 1.509 | 500-20-30-180 | 0.360 | 1.083 | 500-20-30-220 | 0.410 | 0.993 | 500-20-30-260 | 0.500 | 1.011 |
| 500-20-30-300 | 0.590 | 0.994 | 500-20-60-100 | 0.190 | 0.830 | 500-20-60-130 | 0.270 | 0.917 | 500-20-60-160 | 0.320 | 0.885 |
| 500-20-60-180 | 0.390 | 0.976 | 500-20-60-210 | 0.490 | 1.039 | 500-22-50-130 | 0.250 | 0.972 | 500-22-50-160 | 0.320 | 1.014 |
| 500-22-50-200 | 0.400 | 1.020 | 500-22-50-240 | 0.490 | 1.040 | 500-22-50-270 | 0.570 | 1.069 | 500-25-40-170 | 0.250 | 0.919 |
| 500-25-40-220 | 0.310 | 0.861 | 500-25-40-270 | 0.450 | 1.002 | 500-25-40-330 | 0.530 | 0.959 | 500-25-40-380 | 0.630 | 0.988 |
| 600-20-40-140 | 0.240 | 1.026 | 600-20-40-190 | 0.380 | 1.087 | 600-20-40-230 | 0.440 | 1.024 | 600-20-40-270 | 0.550 | 1.052 |
| 600-20-40-320 | 0.630 | 1.001 | 600-20-70-110 | 0.230 | 0.956 | 600-20-70-140 | 0.320 | 1.037 | 600-20-70-170 | 0.440 | 1.166 |
| 600-20-70-200 | 0.470 | 1.064 | 600-20-70-230 | 0.540 | 1.068 | 600-22-60-140 | 0.240 | 0.904 | 600-22-60-180 | 0.330 | 0.961 |
| 600-22-60-220 | 0.430 | 1.017 | 600-22-60-260 | 0.500 | 0.978 | 600-22-60-300 | 0.620 | 1.048 | 600-25-50-180 | 0.280 | 1.106 |
| 600-25-50-240 | 0.360 | 0.970 | 600-25-50-290 | 0.350 | 0.762 | 600-25-50-350 | 0.470 | 0.838 | 600-25-50-400 | 0.600 | 0.927 |
| 500-20-40-120 | 0.240 | 1.024 | 500-20-40-160 | 0.330 | 1.046 | 500-20-40-190 | 0.420 | 1.082 | 500-20-40-230 | 0.500 | 1.057 |
| 500-20-40-260 | 0.600 | 1.091 | 500-22-30-160 | 0.281 | 1.109 | 500-22-30-210 | 0.320 | 0.937 | 500-22-30-260 | 0.430 | 0.971 |
| 500-22-30-310 | 0.530 | 0.964 | 500-22-30-360 | 0.620 | 0.958 | 500-22-60-110 | 0.210 | 0.904 | 500-22-60-150 | 0.320 | 1.016 |
| 500-22-60-180 | 0.380 | 1.023 | 500-22-60-220 | 0.450 | 1.008 | 500-22-60-250 | 0.550 | 1.059 | 500-25-50-150 | 0.200 | 0.792 |
| 500-25-50-200 | 0.340 | 0.965 | 500-25-50-240 | 0.400 | 0.953 | 500-25-50-290 | 0.500 | 0.984 | 500-25-50-340 | 0.620 | 1.052 |
| 600-20-50-130 | 0.230 | 0.947 | 600-20-50-170 | 0.360 | 1.066 | 600-20-50-210 | 0.440 | 1.043 | 600-20-50-240 | 0.510 | 1.051 |
| 600-20-50-280 | 0.590 | 1.027 | 600-22-40-170 | 0.280 | 1.031 | 600-22-40-220 | 0.370 | 0.990 | 600-22-40-270 | 0.480 | 1.013 |
| 600-22-40-320 | 0.550 | 0.977 | 600-22-40-370 | 0.650 | 0.967 | 600-22-70-120 | 0.220 | 0.908 | 600-22-70-160 | 0.300 | 0.946 |
| 600-22-70-200 | 0.420 | 1.039 | 600-22-70-240 | 0.520 | 1.079 | 600-22-70-280 | 0.600 | 1.066 | 600-25-60-170 | 0.240 | 0.956 |
| 600-25-60-220 | 0.580 | 1.634 | 600-25-60-270 | 0.410 | 0.924 | 600-25-60-320 | 0.600 | 1.139 | 600-25-60-370 | 0.660 | 1.070 |
| 500-20-50-110 | 0.220 | 0.945 | 500-20-50-140 | 0.290 | 0.968 | 500-20-50-170 | 0.350 | 0.973 | 500-20-50-200 | 0.450 | 1.048 |
| 500-20-50-230 | 0.510 | 1.034 | 500-22-40-140 | 0.215 | 0.898 | 500-22-40-180 | 0.320 | 0.997 | 500-22-40-220 | 0.430 | 1.051 |
| 500-22-40-270 | 0.520 | 1.032 | 500-22-40-310 | 0.600 | 1.033 | 500-25-30-200 | 0.270 | 0.926 | 500-25-30-260 | 0.370 | 0.930 |
| 500-25-30-320 | 0.460 | 0.917 | 500-25-30-380 | 0.550 | 0.910 | 500-25-30-410 | 0.650 | 0.988 | 500-25-60-140 | 0.220 | 0.834 |
| 500-25-60-180 | 0.280 | 0.853 | 500-25-60-220 | 0.360 | 0.899 | 500-25-60-270 | 0.410 | 0.829 | 500-25-60-310 | 0.510 | 0.916 |
| 600-20-60-120 | 0.240 | 0.948 | 600-20-60-150 | 0.320 | 1.030 | 600-20-60-190 | 0.440 | 1.084 | 600-20-60-220 | 0.490 | 1.057 |
| 600-20-60-250 | 0.550 | 1.047 | 600-22-50-150 | 0.240 | 0.929 | 600-22-50-190 | 0.360 | 1.044 | 600-22-50-240 | 0.440 | 1.000 |
| 600-22-50-280 | 0.540 | 1.032 | 600-22-50-320 | 0.630 | 1.044 | 600-25-40-200 | 0.310 | 1.146 | 600-25-40-270 | 0.350 | 0.904 |
| 600-25-40-330 | 0.450 | 0.925 | 600-25-40-390 | 0.560 | 0.933 | 600-25-40-450 | 0.690 | 0.972 | 600-25-70-150 | 0.240 | 0.931 |
| 600-25-70-200 | 0.320 | 0.932 | 600-25-70-250 | 0.420 | 0.973 | 600-25-70-290 | 0.500 | 0.998 | 600-25-70-340 | 0.590 | 1.012 |
| No. | Fb/Fy (Test Value) | λ | No. | Fb/Fy (Test Value) | λ | No. | Fb/Fy (Test Value) | λ | No. | Fb/Fy (Test Value) | λ |
|---|---|---|---|---|---|---|---|---|---|---|---|
| 500-20-30-140 | 0.360 | 1.508 | 500-20-30-180 | 0.360 | 1.082 | 500-20-30-220 | 0.410 | 0.993 | 500-20-30-260 | 0.500 | 1.010 |
| 500-20-30-300 | 0.589 | 0.993 | 500-20-60-100 | 1.004 | 1.000 | 500-20-60-130 | 0.270 | 1.109 | 500-20-60-160 | 0.319 | 1.070 |
| 500-20-60-180 | 0.389 | 1.180 | 500-20-60-210 | 0.490 | 1.256 | 500-22-50-130 | 0.250 | 0.971 | 500-22-50-160 | 0.320 | 1.013 |
| 500-22-50-200 | 0.400 | 1.019 | 500-22-50-240 | 0.490 | 1.039 | 500-22-50-270 | 0.570 | 1.068 | 500-25-40-170 | 0.250 | 0.918 |
| 500-25-40-220 | 0.310 | 0.861 | 500-25-40-270 | 0.450 | 1.002 | 500-25-40-330 | 0.530 | 0.959 | 500-25-40-380 | 0.630 | 0.987 |
| 600-20-40-140 | 0.240 | 1.025 | 600-20-40-190 | 0.380 | 1.086 | 600-20-40-230 | 0.440 | 1.024 | 600-20-40-270 | 0.550 | 1.052 |
| 600-20-40-320 | 0.630 | 1.000 | 600-20-70-110 | 0.230 | 1.157 | 600-20-70-140 | 0.320 | 1.254 | 600-20-70-170 | 0.440 | 1.409 |
| 600-20-70-200 | 0.470 | 1.287 | 600-20-70-230 | 0.540 | 1.291 | 600-22-60-140 | 0.240 | 0.903 | 600-22-60-180 | 0.330 | 0.960 |
| 600-22-60-220 | 0.430 | 1.016 | 600-22-60-260 | 0.500 | 0.977 | 600-22-60-300 | 0.620 | 1.047 | 600-25-50-180 | 0.280 | 1.105 |
| 600-25-50-240 | 0.360 | 0.969 | 600-25-50-290 | 0.350 | 0.761 | 600-25-50-350 | 0.470 | 0.838 | 600-25-50-400 | 0.600 | 0.926 |
| 500-20-40-120 | 0.240 | 1.024 | 500-20-40-160 | 0.330 | 1.046 | 500-20-40-190 | 0.420 | 1.081 | 500-20-40-230 | 0.500 | 1.057 |
| 500-20-40-260 | 0.600 | 1.090 | 500-22-30-160 | 0.281 | 1.108 | 500-22-30-210 | 0.320 | 0.937 | 500-22-30-260 | 0.430 | 0.971 |
| 500-22-30-310 | 0.530 | 0.964 | 500-22-30-360 | 0.620 | 0.957 | 500-22-60-110 | 0.210 | 0.904 | 500-22-60-150 | 0.320 | 1.015 |
| 500-22-60-180 | 0.380 | 1.022 | 500-22-60-220 | 0.450 | 1.007 | 500-22-60-250 | 0.550 | 1.059 | 500-25-50-150 | 0.200 | 0.791 |
| 500-25-50-200 | 0.340 | 0.965 | 500-25-50-240 | 0.400 | 0.953 | 500-25-50-290 | 0.500 | 0.983 | 500-25-50-340 | 0.620 | 1.051 |
| 600-20-50-130 | 0.230 | 0.947 | 600-20-50-170 | 0.360 | 1.066 | 600-20-50-210 | 0.440 | 1.043 | 600-20-50-240 | 0.510 | 1.050 |
| 600-20-50-280 | 0.590 | 1.026 | 600-22-40-170 | 0.280 | 1.031 | 600-22-40-220 | 0.370 | 0.989 | 600-22-40-270 | 0.480 | 1.013 |
| 600-22-40-320 | 0.550 | 0.977 | 600-22-40-370 | 0.650 | 0.967 | 600-22-70-120 | 0.220 | 0.907 | 600-22-70-160 | 0.300 | 0.945 |
| 600-22-70-200 | 0.420 | 1.039 | 600-22-70-240 | 0.520 | 1.078 | 600-22-70-280 | 0.600 | 1.065 | 600-25-60-170 | 0.240 | 0.955 |
| 600-25-60-220 | 0.580 | 1.633 | 600-25-60-270 | 0.410 | 0.924 | 600-25-60-320 | 0.600 | 1.139 | 600-25-60-370 | 0.660 | 1.069 |
| 500-20-50-110 | 0.220 | 0.944 | 500-20-50-140 | 0.290 | 0.968 | 500-20-50-170 | 0.350 | 0.973 | 500-20-50-200 | 0.450 | 1.047 |
| 500-20-50-230 | 0.510 | 1.033 | 500-22-40-140 | 0.215 | 0.898 | 500-22-40-180 | 0.320 | 0.996 | 500-22-40-220 | 0.430 | 1.051 |
| 500-22-40-270 | 0.520 | 1.032 | 500-22-40-310 | 0.600 | 1.032 | 500-25-30-200 | 0.270 | 0.926 | 500-25-30-260 | 0.370 | 0.929 |
| 500-25-30-320 | 0.460 | 0.916 | 500-25-30-380 | 0.550 | 0.910 | 500-25-30-410 | 0.650 | 0.988 | 500-25-60-140 | 0.220 | 0.834 |
| 500-25-60-180 | 0.280 | 0.852 | 500-25-60-220 | 0.360 | 0.899 | 500-25-60-270 | 0.410 | 0.828 | 500-25-60-310 | 0.510 | 0.916 |
| 600-20-60-120 | 0.240 | 0.947 | 600-20-60-150 | 0.320 | 1.029 | 600-20-60-190 | 0.440 | 1.084 | 600-20-60-220 | 0.490 | 1.056 |
| 600-20-60-250 | 0.550 | 1.047 | 600-22-50-150 | 0.240 | 0.929 | 600-22-50-190 | 0.360 | 1.043 | 600-22-50-240 | 0.440 | 0.999 |
| 600-22-50-280 | 0.540 | 1.031 | 600-22-50-320 | 0.630 | 1.043 | 600-25-40-200 | 0.310 | 1.146 | 600-25-40-270 | 0.350 | 0.904 |
| 600-25-40-330 | 0.450 | 0.925 | 600-25-40-390 | 0.560 | 0.932 | 600-25-40-450 | 0.690 | 0.972 | 600-25-70-150 | 0.258 | 0.931 |
| 600-25-70-200 | 0.320 | 0.932 | 600-25-70-250 | 0.420 | 0.973 | 600-25-70-290 | 0.500 | 0.998 | 600-25-70-340 | 0.590 | 1.012 |
Disclaimer/Publisher’s Note: The statements, opinions and data contained in all publications are solely those of the individual author(s) and contributor(s) and not of MDPI and/or the editor(s). MDPI and/or the editor(s) disclaim responsibility for any injury to people or property resulting from any ideas, methods, instructions or products referred to in the content. |
© 2023 by the authors. Licensee MDPI, Basel, Switzerland. This article is an open access article distributed under the terms and conditions of the Creative Commons Attribution (CC BY) license (https://creativecommons.org/licenses/by/4.0/).
Share and Cite
Miao, T.; Yang, J.; Zhou, Y.; Zhan, M.; Sha, L.; Zheng, W. Research on the Distributive Relationship between Bond Force and Bearing Pressure for Anchorage Force by Headed Bars. Buildings 2023, 13, 2463. https://doi.org/10.3390/buildings13102463
Miao T, Yang J, Zhou Y, Zhan M, Sha L, Zheng W. Research on the Distributive Relationship between Bond Force and Bearing Pressure for Anchorage Force by Headed Bars. Buildings. 2023; 13(10):2463. https://doi.org/10.3390/buildings13102463
Chicago/Turabian StyleMiao, Tianming, Jian Yang, Ying Zhou, Meiqiu Zhan, Lirong Sha, and Wenzhong Zheng. 2023. "Research on the Distributive Relationship between Bond Force and Bearing Pressure for Anchorage Force by Headed Bars" Buildings 13, no. 10: 2463. https://doi.org/10.3390/buildings13102463
APA StyleMiao, T., Yang, J., Zhou, Y., Zhan, M., Sha, L., & Zheng, W. (2023). Research on the Distributive Relationship between Bond Force and Bearing Pressure for Anchorage Force by Headed Bars. Buildings, 13(10), 2463. https://doi.org/10.3390/buildings13102463