Abstract
To effectively utilize the effectively the solid waste-soda residue (SR) and fly ash (FA), a mixture of 70% SR, 20% FA, and 10% clay was formed to produce soda residue soil (SRS). By adding cement and/or lime, four different SRS proportions were prepared. The compaction properties, mechanical properties, and dry–wet stability. Furthermore, the mechanical mechanisms of SRS were explored, and the improvement effect and efficiency of cement and/or lime on the mechanical performance of SRS were analyzed. The results show that the SRS is lightweight and easy to compact and shape, which is conducive to construction. Compared to cement, lime has a greater impat on the compaction properties of SRS. The mechanical properties of SRS are enhanced after adding cement and/or lime; the unconfined compressive strength (UCS), California Bearing Ratio (CBR), and resilient modulus all increase significantly. The UCS, CBR, and resilient modulus of SRS with different proportions all increase with the increase of compaction degree; the CBR and resilient modulus can meet the requirements of the subgrade, and the UCS can meet the requirements of the base and sub-base. The contribution rate of cement per unit amount is better than that of lime to the mechanical performance of SRS. As dry–wet cycles increase, the dry–wet stability of SRS with different proportions first increases and then decreases, which is affected by hydration and dry–wet deterioration together, with a critical cycle number for the strength transition. The excellent mechanical performance of SRS benefits from the gradation and chemical action. The particles of SR, FA, and clay can complement each other and perform an interlocking action. Therefore, SRS has a good gradation and forms a dense and stable structure. Also, the chemical reactions between materials are very important. The cement and/or lime have a hydration and gelling effect, FA and clay participate in pozzolanic reactions, and SR and FA have certain alkali-activated effects.
Keywords:
SR soil; compaction properties; UCS; CBR; resilient modulus; dry–wet cycles; mechanical mechanism 1. Introduction
Soda residue (SR) belongs to a kind of non-hazardous solid waste. It is a by-product in the production process of Na2CO3, using the ammonia-soda process. The annual output of SR is extremely high [1,2], but its utilization rate is very low [3,4,5]. Hence, SR occupies a significant amount of land and has a negative impact on the surrounding environment [6,7,8], which determines the utilization urgency of the SR. Meanwhile, subgrade engineering has a high demand for fillers with the vigorous development of road construction [9]. Moreover, to achieve the purpose of being green and low-carbon [10,11], China has introduced many favorable policies to encourage and support the comprehensive use of bulk solid waste [12,13].
For SR, it is a great opportunity for high-content and large-scale utilization. Indeed, SR has its own properties worth utilizing, including lightness, gelling, and alkali-activated effects. Many scholars and engineers have sought various ways to expand the engineering applications of SR [14,15,16,17,18,19]. Due to the inherent properties of SR, it is suitable for mixing with fly ash (FA), clay and other soils, and solid wastes. To prepare SRS as the filler, its mechanical properties can be further stabilized and improved by adding cementitious materials, such as cement and/or lime.
Xu [20] studied the SRS formed by mixing different contents of SR, clay, lime, cement, FA, and soil stabilizer. The study showed that the addition of cement and lime was beneficial in improving the compressive strength. The optimal proportion, comprising 30% SR + 65% clay + 2% cement + 3% lime, exhibited the highest CBR and resilient modulus. Zheng [21] conducted a systematic study on the strength and durability of stabilized stone chips using mineral slag-cement-SR. The results showed that the slag-cement-SR stabilized stone chips and had high strength, good impermeability, and frost resistance, which could be used as the material of the roadbase. Zhang [22] used 80% SR and 20% FA to generate SRS as embankment material. The addition of NaSO4·10H2O could activate the activity of FA, enhance the bonding ability of SRS, and effectively improve its UCS, shear strength, and CBR value, and when the amount of NaSO4·10H2O was 5%, the SRS could meet the requirements of highway embankments. Zhao [1,23] further showed that NaSO4·10H2O could react with SR to produce NaOH, stimulating FA to generate N-A-S-H, and SR took place the pozzolanic reaction with FA to produce gels to fill the pores of solid particles, to improve the mechanical properties of SRS. Li [24] used SR and FA mixed to prepare SRS, providing alkali-activated action by water glass. Specifically, the proportion of 80% SR, 20% FA, and 2% water glass had good mechanical properties, water stability, and frost resistance stability, which could meet the requirements of roadbase materials. Xu [25] used SR and cement to reinforce soft soil, and after 20 dry–wet cycles, it still met the lowest standard requirements for a highway sub-base. In summary, many research results show that SRS formed by mixing SR and FA or clay has good mechanical properties that can be further enhanced by cement and/or lime.
When producing soda ash through the ammonia-soda process, in addition to generating SR, the Na2CO3 enterprises also produce another solid waste-FA during coal-fired power generation and limestone calcination. In this study, based on the principles of local utilization, treatment of waste with another waste, and comprehensive utilization, making full use of the characteristics of SR and FA using a high-content of SR and FA mixed clay to form SRS, is stabilized by adding external cement and/or lime, producing a low-carbon and environmentally friendly subgrade construction material, which can promote the resource utilization of SR. This article investigates the mechanical properties and dry–wet stability of SRS for roads, compares the stabilization efficiency of cement and lime, clarifies the application range of different proportions, and analyzes its mechanical mechanism from the perspectives of gradation and microstructure to efficiently utilize SR and FA and provide the theoretical basis and technical parameters for the engineering practice.
2. Materials and Methods
2.1. Test Materials
The SR and FA were sampled from Lianyungang Soda Ash Co., Ltd. (Lianyungang, China). The main mineral components of the SR are calcite, gypsum hemihydrate, and calcium sulfate. The main mineral components of the FA are quartz and mullite, respectively, as shown in Figure 1a,b. The chemical compositions of the SR are mainly composed of CaCO3, CaSO4, and Ca(OH)2 [7,26,27]. The agglomerates formed by the combination of CaCO3 and other components can provide a skeleton effect. The chemical composition of the FA was mainly composed of oxides, such as Al2O3, SiO2, and Fe2O3, with a certain activity [28]. The clay used was Lianyungang coastal clay. The basic physical properties of SR, FA, and clay are shown in Table 1. The cement used was ordinary Portland cement with a strength grade of 42.5, and the lime was third-grade ash.
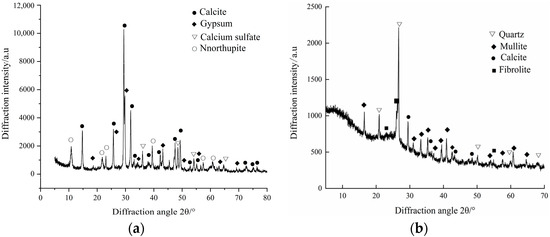
Figure 1.
XRD diffraction pattern of SR and FA: (a) XRD diffraction pattern of SR; (b) XRD diffraction pattern of FA.

Table 1.
Basic physical properties of materials.
2.2. Test Methods
2.2.1. Compaction Test
According to JTG 3430-2020 [29] (Test Methods of Soils for Highway Engineering), the heavy compaction test was used with a hammer weight of 4.5 kg and a drop height of 45 cm. The volume of each specimen was 997 cm3, and each specimen was compacted in 5 layers with 27 blows per layer. Five specimens were prepared for each proportion, with the water content increasing in increments of 2%. The maximum dry density (MDD) and optimum water content (OWC) of each proportion were determined.
2.2.2. 7d UCS Test
According to JTG 3430-2020 and JTG E51-2009 [30] (Test Methods of Materials Stabilized with Inorganic Binders for Highway Engineering), the UCS tests were conducted using specimens with Φ50 mm and H50 mm (shown in Figure 2). Based on the MDD and OWC, the specimens were formed using a single static pressure and were cured for 6 days in a standard curing room, soaking in water on the last day. The UCS was measured using a strength meter at a speed of 1 mm/min.
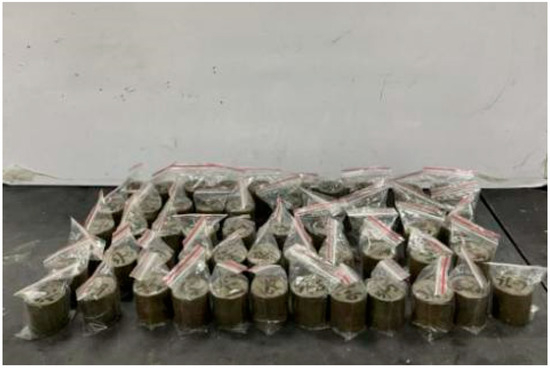
Figure 2.
UCS specimen preparation.
2.2.3. CBR Test
According to JTG 3430-2020, the CBR test was conducted using specimens of Φ152 mm and H170 mm. The production of the specimen is similar to that of UCS. According to the OWC and the MDD and the different compaction degrees, the test materials were weighed and loaded into the test mold, and the specimens were formed by the single static pressure method [31]. After soaking in water for 4 days (shown in Figure 3), the CBR value of the specimens was measured at the speed of 1 mm/min.
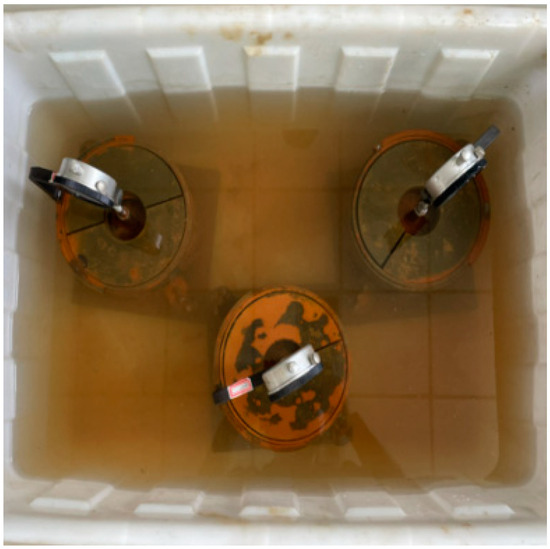
Figure 3.
CBR specimens.
2.2.4. Resilient Modulus Test
According to JTG 3430-2020, the resilient modulus specimens were molded using the same method as the CBR test. After molding, the specimens were sealed with the molds and subjected to standard curing for 7 days. Finally, the resilient modulus was measured using a strength meter at a speed of 1 mm/min.
2.2.5. Dry and Wet Cycle Test
The UCS was used as the measure for the dry–wet cycle test [3]. The specimen preparation method was the same as that for UCS. The specimens were air-dried for 1 day and then soaked in water for 1 day to complete a dry–wet cycle (shown in Figure 4). After each cycle, the UCS was measured using a pavement strength tester at a speed of 1 mm/min.
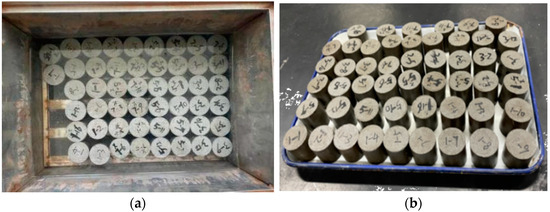
Figure 4.
Water stability test: (a) Specimens soaked; (b) Specimens air-dried.
2.3. Test Schemes
Based on preliminary tests [32], because of the good mechanical properties, the mix proportion (70% SR + 20% FA + 10% clay) was chosen to perform further studies, into which externally binding materials (cement and/or lime) were added. The mix proportions of SRS are shown in Table 2, where cement and lime were used as external additives. Group G1, without external additives, was used as the control group. Group G2 (single-addition with cement), G3 (single-addition with lime), and G4 (composite-addition with cement and lime) are compared with G1 to analyze the effect and efficiency of external additives on the engineering properties of SRS.
Table 2.
Test schemes.
3. Test Results and Analysis of Mechanical Properties
3.1. Compaction Properties
SR is easy to compact; their compaction curves are shown in Figure 5a. Taking the G1 without any external additives as the control group, the effects of cement and lime on the MDD and OWC of SRS are analyzed. The percentage increase of the MDD and OWC of the external additive groups (G2, G3, G4) compared with the G1 is defined as the contribution rate of the external additives. Here, the percentage increase of the MDD and OWC when the external additive is 1% as the unit contribution rate, as shown in Figure 5b.
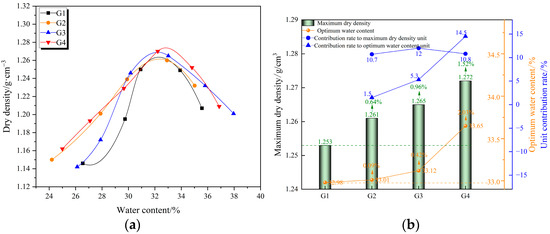
Figure 5.
Compaction results: (a) Compaction results of SRS; (b) Analysis of MDD and OWC and unit contribution.
The results indicate that the MDD and OWC follow the order of G1 < G2 < G3 < G4. Compared with G1, the MDD improves in all the G2, G3, and G4, and the sum of the improvements in G2 and G3 is slightly more than that in G4, indicating that the effect of composite-addition is slightly less than that of single-addition superposition. The OWC increase in all the G2, G3, and G4, and the sum of the increases in the G2 and G3 is significantly less than that in the G4, indicating that the composite-addition requires more water than the single-addition superposition.
It is demonstrated that adding cement and/or lime can improve the MDD of SRS. Since the hydration of cement and lime requires water, it leads to an increase in the OWC. Nevertheless, the effects of cement and lime on the MDD and OWC of SRS are not synchronized. The contribution rate of unit lime to the MDD and OWC is higher than that of unit cement, and the influence of lime is greater.
The MDD of SRS in each proportion is smaller than that of ordinary filling soil (1.6–1.7 g/cm3), which can effectively reduce the uneven settlement caused by self-weight. The OWC of each proportion of SRS is around 33%. After press filtration, the SR (with a water content of about 50%) can reach the OWC state through simple stirring and air-drying or sun-drying, which is convenient for the construction and compaction of SRS and can improve construction efficiency.
3.2. Mechanical Properties for Road Use
In the road structure design [33,34], the UCS and CBR are the criteria for selecting roadbase materials and subgrade materials, respectively, and the compaction degree is the criterion for construction control. The required strength and resilient modulus of subgrade and roadbase can only be achieved through the rational selection of fillers and effective control of the compaction degree. By analyzing the mechanical properties and mechanical performance of SRS with different mix proportions under different compaction degrees, their applicable range can be determined.
3.2.1. UCS Property
After 6 days of curing, the G1 specimens (unconfined) suffered a loose failure during soaking on the 7th day, making it impossible to perform the UCS test. This indicates that although the SR, FA, and clay have a certain cohesiveness and activity, the produced cementitious material is insufficient after curing for 6 days due to the slow hydration reaction, resulting in the loose failure after the 7th day of soaking of the G1 specimens.
The UCS values of the G2, G3, and G4 are shown in Figure 6. The G2, G3, and G4 have different 7d UCS values in different compaction degrees. According to JTG/T F20-2015 [35] (Technical Guidelines for Construction of Highway Roadbases) and the strength requirements of different structural layers under different traffic levels of the highway, suitable mix proportions can be selected. The UCS of the G2, G3, and G4 increases continuously with the increase of compaction degree. With the compaction degree increasing from 90% to 100%, the UCS of G2, G3, and G4 increases by 102%, 97%, and 88%, respectively. The UCS of the G4 is the highest, significantly higher than that of the G2 and G3 by 80–140%. The UCS of the G2 and G3 are basically the same at different compaction degrees, indicating that adding 6% cement and 8% lime to the SRS has similar effects on the UCS.
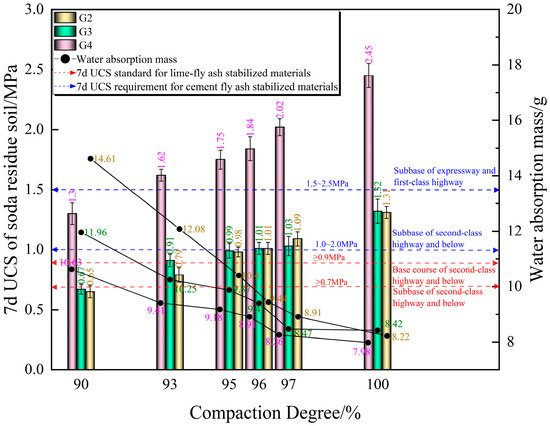
Figure 6.
7d UCS and water absorption mass of SRS.
The water absorption mass during soaking on the 7th day is defined as the difference between the mass of the specimen after wiping off the surface water and the mass before soaking (shown in Figure 6). The water absorption mass of the G2, G3, and G4 gradually decreased with the increase in compaction degree and showed a convergent trend. The water absorption mass of G4 is the smallest, while that of G2 is the largest, and that of G3 is in the middle. When the strength is similar, the water absorption mass of the G3 is smaller than that of the G2, indicating that the G3 specimens form a denser structure than the G2 specimens. The development trend and value relationship of the water absorption mass of three proportions are basically opposite to those of the UCS. The smaller water absorption mass indicates that the specimen has a denser structure, which leads to higher strength.
The difference between G4 and G2 is taken as the contribution of lime to the improvement of UCS, and the difference between G4 and G3 is taken as the contribution of cement to the improvement of UCS. The contribution rate per unit of external addition of 1% cement or lime is calculated as the unit contribution rate of cement and lime to UCS, respectively (shown in Figure 7). It is found that the unit contribution rate of cement is significantly higher than that of lime. Compared to lime, the gelling property of cement is stronger, and the hydration between cement and water is more intense, resulting in the generation of more hydration to fill and wrap the SRS.
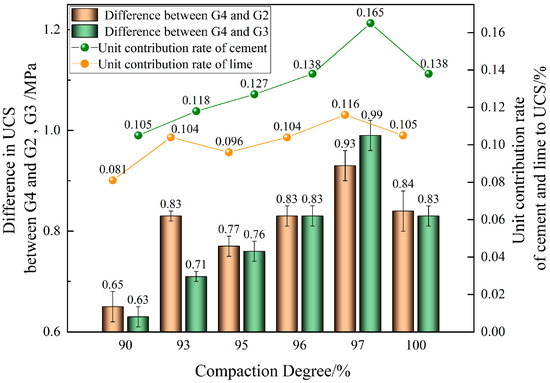
Figure 7.
Strength difference and contribution per unit of external additives.
3.2.2. CBR Property
G1 specimens were soaked loosely before the UCS test; hence, the UCS value of G1 specimens could not be measured. In the CBR test, although specimens were also soaked in water, G1 specimens were soaked with molds, which could provide lateral restraint and support. Therefore, G1 has the CBR value.
The CBR values of each proportion are shown in Figure 8a. All four proportions’ CBR values meet the minimum CBR value requirement (8%) for subgrade on expressways and first-class highways in JTG D50-2017 [36] (Specifications for Design of Highway Asphalt Pavement). The minimum value of G1 is 39.92% at 96% compaction degree, which is nearly five times higher than the requirement specified in the regulation. Among the different compaction degrees, the CBR value of G4 is greater than that of G2, G3, and G1. The CBR values of each proportion increase with the increase in compaction degree, and there is a significant linear relationship between them, shown in Equation (1).
where CDi is the different compaction degrees, and a and b are regression coefficients.
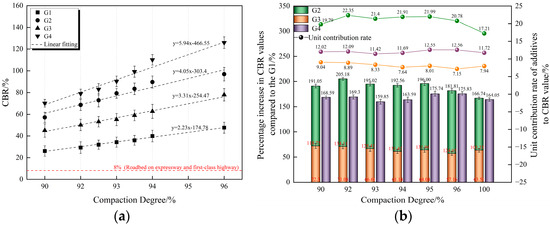
Figure 8.
CBR test results: (a) CBR value of SRS; (b) percentage increase values and unit contribution rate.
The greater the influence of the compaction degree, the larger the regression coefficient a, and the larger the CBR value. Among them, G4 has the largest regression coefficient, followed by G2 and G3, and G1 has the smallest.
The sum of CBR improvements in G2 and G3 is significantly greater than that in G4 (as shown in Figure 8b), indicating that the effect of composite addition is significantly lower than that of single-addition superposition. However, with the increase in compaction degree, the effect of composite addition tends to approach that of single-addition superposition.
The percentage increase of CBR in G2, G3, and G4 compared to that in G1 is the contribution rate of the external additives. It is then normalized to obtain the unit contribution rate, which represents the percentage increase of CBR when the external additive is 1%. At different compaction degrees, the unit contribution rate of cement to CBR is significantly higher than that of lime and composite addition. This indicates that the addition of cement and/or lime can enhance the CBR strength of SRS, and the enhancement efficiency of cement is superior.
3.2.3. Resilient Modulus Property
The resilient modulus values of the G1, G2, G3, and G4 are shown in Figure 9a. At different compaction degrees, the resilient modulus values of each proportion follow the trend of G4 > G2 > G3 > G1. According to JTG D50-2017, the resilient modulus values of each proportion can meet the requirements of the specification of the roadbed surface. The resilient modulus values of each proportion increase significantly with the increase in compaction degrees, showing a linear relationship as shown in Equation (2).
where RM is the resilient modulus, CDi is the different compaction degrees, and c and d are regression coefficients.

Figure 9.
Resilient modulus test results: (a) resilient modulus of SRS; (b) percentage increase in resilient modulus compared to group G1 and unit contribution.
The greater the influence of the compaction degree, the larger the regression coefficient c, and the larger the resilient modulus value.
After adding the additive, the regression coefficients increase. The regression coefficient c of G4 is the largest, indicating that the resilient modulus of G4 increases the fastest with the increase of the compaction degree. From 90–100% of the compaction degree, the resilient modulus of G4 increases by 167 MPa, while the increase of G1 is significantly smaller, at only 60.36 MPa. The resilient modulus of G2 is 20–55 MPa higher than that of G3 at different compaction degrees. At different compaction degrees, compared with G1, the resilient modulus of G2 increases by 118–139%, that of G3 increases by 82–107%, and that of G4 increases by 146–164%. The sum of the resilient modulus increases of G2 and G3 is significantly higher than that of G4, indicating that the effect of composite addition is significantly lower than that of single-addition superposition.
The improvement rate of G2, G3, and G4 to the resilient modulus compared with G1 is defined as the contribution rate of external additives, which is unitized (the percentage of resilient modulus increases when external additives account for 1%). As shown in Figure 9b, the contribution rate of unit cement to the resilient modulus is the largest, followed by unit lime, which is slightly larger than that of unit composite addition, indicating that the cement content has a more significant effect on the resilient modulus increase.
3.3. Comprehensive Evaluation by Fuzzy Evaluation Approach
The fuzzy evaluation method [37] is used to evaluate the effectiveness of externally blended cement and lime for stabilizing SRS. When using SRS as the subgrade filler, its mechanical properties (CBR, resilient modulus) and economic cost should be considered. The cost of adding 1% cement and 1% lime to the SRS is 4.95 yuan/m3 and 4.71 yuan/m3, respectively, based on the unit of external blending material.
Stabilized SRS with external additives, its cost needs to be strictly controlled, with a weight value of 0.4 [38]. The weights for CBR and resilient modulus in the subgrade soil are equivalent, with both weight values of 0.3 [38]. The compaction degree of the expressway and first-grade highway embankment is ≥93%. Therefore, at a 93% compaction degree to the CBR and resilient modulus, the contribution rate of the unit external additives is used to assign scores (as shown in Table 3), and the results for each indicator score are taken as a row in the matrix R.
Table 3.
Results of assigning scores to each indicator.
Based on the principles of fuzzy mathematics analysis, the higher the total score, the better the overall evaluation effect. After considering the economic and mechanical properties (CBR, resilient modulus), it is found that the most efficient stabilization results from adding 6% cement as an external additive.
3.4. Dry–Wet Stability
The subgrade is an important supporting structure of the road, which is easily subjected to dry–wet cycles due to climate and environmental factors. During the drying process, the subgrade soil shrinks because of water loss, leading to the development of cracks [39]. During the wetting process, the subgrade soil expands and erodes. The repeated dry–wet cycles cause degradation in the engineering properties of the subgrade soil and harm to the safety and stability of the road. Therefore, it is necessary to study the dry–wet stability of SRS.
3.4.1. Strength Development
As shown in Figure 10a, the UCS of all three proportions (G2, G3, G4) presents a trend of first rising and then falling, and there is a critical number (the number of inflection points of UCS rising and falling). The strength loss percentage (SLP) is used to express the strength loss of each proportion after the wet–dry cycles, followed in Equation (4).
where SLP is the percentage loss of UCS, and to characterize dry and wet stability, the lower the SLP, the better the dry–wet stability; UCS0 is the UCS before any wet-dry cycles; UCSn is the UCS after n wet–dry cycles. At the same dry–wet cycles, the lower the SLP, the better the wet and dry stability.
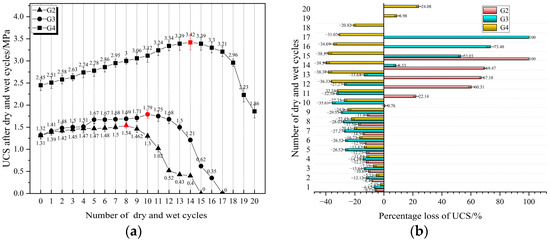
Figure 10.
Dry–wet cycles test results: (a) UCS after dry–wet cycles; (b) strength loss percentage.
As shown in Figure 10b, the SLP can be negative, indicating that the specimen’s strength remains higher than its initial strength during the wet–dry cycles. G2 reaches the critical number after eight cycles. It is not until the 10th cycle that the strength loss begins, with a small SLP of only 0.76%, followed by a steep increase in strength loss, with the SLP increasing to 69.47% after 14 cycles, resulting in eventual failure. G3 reaches the critical number after 10 cycles, and the strength begins to decline after 13 cycles. The strength loss shows a steep increase after 14 and 15 cycles, with an increase of 44.7% and 20.45%, respectively, reaching the SLP of 73.48% before complete failure occurs. G4 reaches the critical number after 14 cycles, and the strength loss does not appear until after 19 wet–dry cycles, with an SLP of 24.08% after 20 cycles.
In summary, with the dry–wet cycles increasing, SRS shows an initial increase in strength until reaching the critical number, followed by a decline in strength. There is still a buffer period where the strength remains higher than the initial strength, which is longer for proportions with a higher initial strength. Then, a steep decline occurs, and when the SLP reaches about 70%, the specimens will fail completely when subjected to one wet–dry cycle again, losing their integrity.
The reason for this phenomenon is that as the wet–dry cycles increase and time passes, the hydration continues [40]. In the early stages, the strength increase caused by hydration covers the strength deterioration caused by wet–dry cycles, so the strength shows an upward trend. As the wet–dry cycles continue to increase, the hydration reaction gradually stabilizes, and after reaching a critical number, the strength deterioration caused by wet–dry cycles dominate, and the overall strength shows a gradually decreasing trend until failure. The effects of single-addition and composite addition, cement, and lime on the critical number are inconsistent. The critical number of G4 with composite addition is the highest, and it can withstand the most cycles. G3, with a single addition of lime, has a higher critical number of cycles than G2 with a single addition of cement, and it can withstand more cycles than G2. However, the effect of composite addition is still lower than that of single-addition superposition.
3.4.2. Appearance Deterioration Development
The appearance failure development of each proportion with increasing numbers of dry–wet cycles is shown in Figure 11.
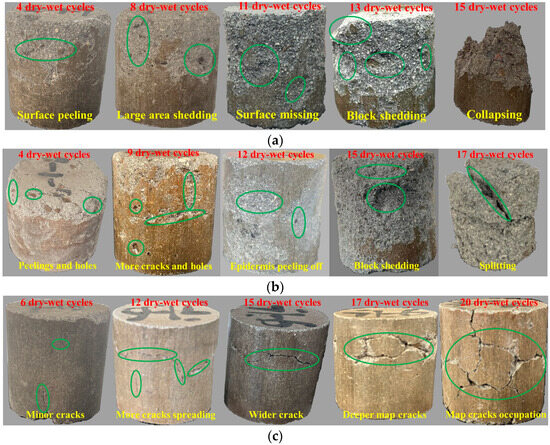
Figure 11.
Apparent deterioration development after different dry–wet cycles: (a) Specimens of G2 for 4, 8, 11, 13, and 15 dry–wet cycles; (b) Specimens of G3 for 4, 9, 12, 15, and 17 dry–wet cycles; (c) Specimens of G4 for 6, 12, 15, 17, and 20 dry–wet cycles.
For G2, the surface begins to peel off after four cycles. After eight cycles, most of the epidermis is shed off. After 11 cycles, the specimen shows significantly deeper peeling and a loose surface with the deterioration eroding inward, and after 13 cycles, there are more massive sheds from the specimen. The top collapses during the 15th cycle when the specimen is soaked in water. For G3, cracks appear on the top surface, and some peeling occurs after four cycles. After nine cycles, many larger cracks and holes appear on the side of the specimen. By the 12th cycle, the epidermis of the specimen has almost peeled off. By the 15th cycle, the entire surface has peeled off, and deep cracks and holes appear on the upper part, with big block shedding. After 17 cycles, a big and wide crack penetrates the whole specimen, and the specimen completely splits, resulting in the failure of the specimen. For G4, only minor cracks appear at the bottom after six cycles. After 12 cycles, a horizontal crack appears on the side. After 15 cycles, the horizontal crack gets longer and wider. After 17 cycles, the horizontal crack develops into a large area of network cracks and penetrates inward, accompanied by shedding, and after 20 cycles, the area of the network cracks continues to extend, to expand, to derive more new cracks, and the invasion goes deeper. However, the specimen still does not lose its integrity and exhibits relatively high strength.
3.5. Mechanical Mechanism Analysis
The influence of various materials on the structure of SRS can be analyzed from both perspectives of gradation and microscopic, allowing for a better exploration of its mechanical properties and strength formation mechanism.
3.5.1. Gradation Mechanism
Test materials and particle size analysis are presented in Table 4, and particle size distribution is shown in Figure 12. The predominant fraction in the SR is powder particles (67%), while the clay contains mainly powder particles (53%) and clay particles (34%). The FA consists mostly of sand particles (40.3%) and powder particles (59%).
Table 4.
Particle size analysis.
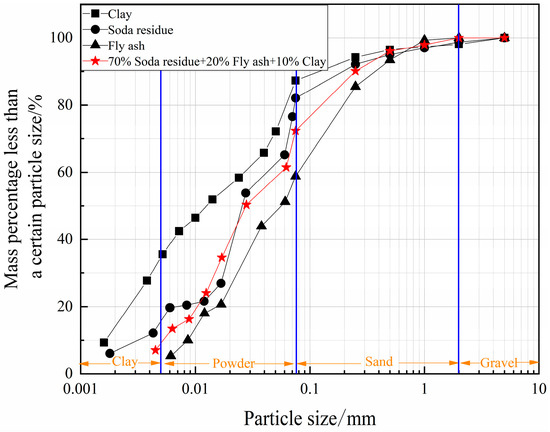
Figure 12.
Particle size.
The coefficients of uniformity (Cu) and curvature (Cc) for SR and clay are greater than 5 and less than 1, respectively. The Cc is greater than 3 or less than 1, indicating the absence of grain group in the gradation, which shows that the three materials are not well graded. However, each material has a specific characteristic of coarse or fine particles: the clay has the finest particles, the FA has the coarsest particles, and the SR provides a good link between clay and FA [41]. By taking advantage of the complementary and linking properties of FA, SR, and clay, an SRS is formed by mixing 70% SR, 20% FA, and 10% clay. Coarse particles in the SRS form a coarse skeleton, while fine particles fill the pores of the skeleton, resulting in a compacted state. The coefficients of uniformity and curvature for the SRS are 11.42 and 1.05, respectively, meeting the requirements of Cu (≥5) and Cc (1–3), indicating that the SRS has a well-graded grain size distribution.
3.5.2. Microstructure Mechanism
The micromorphology of test materials and various proportions is shown in Figure 13. The SR has a honeycomb-like structure, which is flocculent and relatively loose; the pores of different sizes are distributed between the flocculence (Figure 13a). The FA possesses a sponge-like surface on which glass microspheres are not uniformly distributed (Figure 13b). The clay appears as flake-shaped particles, which are assembled in a face-to-face overlapping manner (Figure 13c).
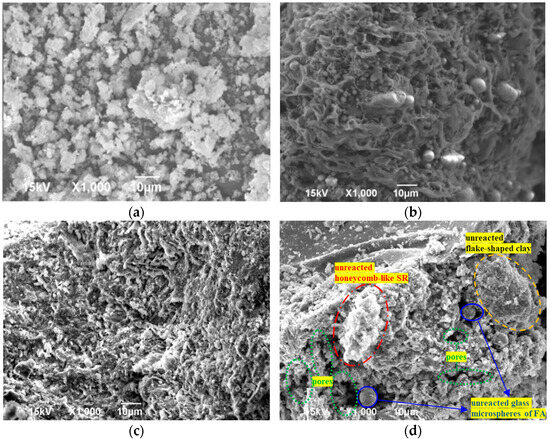
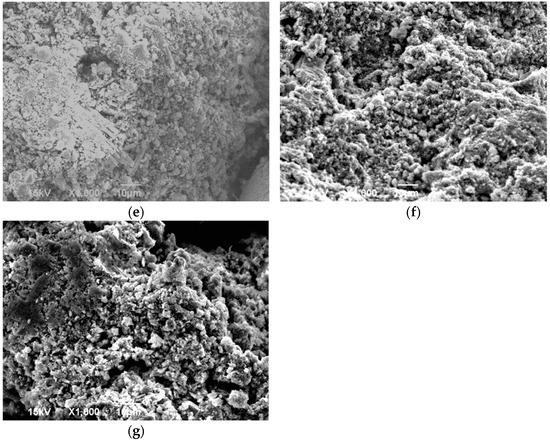
Figure 13.
Microstructure: (a) SR microstructure; (b) FA microstructure; (c) clay microstructure; (d) G1 microstructure; (e) G2 microstructure; (f) G3 microstructure; (g) G4 microstructure.
The microstructure of G1 is relatively integrated and compact (Figure 13d). SR and FA form a skeleton structure, and clay fills the pores of the skeleton to increase compactness and integrity [42,43,44]. Although the overall structure of G1 without external additives is significant, the particles are not tightly connected to each other, and there are still large and more clearly visible pores. SR and FA have certain gelling properties and alkali-activated effects, but the gelling property is weak, and the reaction is slow. In the microstructure of G1, the unreacted honeycomb-like SR structure, unreacted glass microspheres of FA, and unreacted flake-shaped clay structure can be markedly seen. The strength of the cement-based composite is related to its age [45,46]; the curing and reaction time of 7d is not enough to generate a large enough amount of hydration [47] to fill the soil structure of G1, resulting in the loose destruction of G1 specimens after being soaked in water for 1 day.
In the microstructures of G2, G3, and G4, the honeycomb-like SR structure, glass microspheres of FA, and flake-shaped clay structure all disappear. It shows that under the drastic hydration and excitation of cement and lime, SR, FA, and clay are deeply involved in the chemical reactions; the hydrations further glue, fill, and compact soil structure, leading to the soil structure pores becoming smaller and denser.
In the microstructures of G2 (Figure 13e) with the external additive of cement, more cement-hydrate, C-S-H, is produced, including needle-shaped Aft [48], distributing and interlacing in the particles, binding, connecting, and filling them more tightly; therefore, the pores significantly reduced, resulting in a denser structure. In the microstructures of G3 (Figure 13f) with the external additive of lime, the gelling substances cluster into small aggregates on the structure surface, and the clusters of aggregates are connected to form a mesh-like distribution, resulting in a dense structure. Lime can dissolve the amorphous glass phase in FA and has a certain alkali-activated effect on the activity of FA [49]. Meanwhile, FA with lime can generate pozzolanic reactions [50,51]. The hydration of lime generates Ca(OH)2, which reacts with SiO2 and Al2O3 in clay and FA to form water-hardened gelling substances, C-S-H and C-A-H, thus improving the mechanical properties and road performance of SRS [52]. In the microstructures of G4 (Figure 13g) with external additives of cement and lime, both cement and lime produce hydrates; together, the hydrates bond the particles, obviously clustering into larger aggregates on the structure surface, resulting in a denser structure.
4. Conclusions
The SRS formed by mixing 70% SR, 20% FA, and 10% clay has excellent grading, a low weight, and is easy to compact. Adding cement and/or lime can effectively enhance its mechanical properties, its CBR and resilient modulus can meet the requirements of relevant subgrade filler, and its UCS can meet the requirements of different base layers.
- Cement and lime have an increasing effect on the MDD and OWC of SRS. For the MDD, the effect of composite addition is slightly smaller, while for the OWC, the effect of composite addition is significantly higher. The contribution rate of lime per unit to the MDD and OWC is higher than that of cement;
- Cement and lime have a significant enhancing effect on the UCS, CBR, and resilient modulus; the effect of single-addition superimposition is significantly higher than that of composite addition. The contribution rate of cement per unit to UCS, CBR, and resilient modulus is higher than that of lime;
- Cement and lime have a significant enhancing effect on the dry–wet stability of SRS. The higher the strength, the larger the critical number of cycles. The degree of appearance damage increases with the increase in dry–wet cycles;
- The mechanical properties of SRS mainly come from good gradation and the hydration-enhanced cementation effect of external additives. The particles of SR, FA, and clay complement each other, forming a dense structure. The hydration products generated by lime and/or cement further strengthen the dense structure;
- The experimental phenomena and corresponding conclusions in this article can provide technical parameters for the promotion and engineering design of SRS. The influence of different curing ages on the dry–wet stability of SRS has not been considered in this study. On the basis of the existing research results, in the future, the dry–wet stability of SRS under different curing ages will be further studied. Additionally, various micro and macro testing methods will be combined to further explore the mechanical mechanism of SRS.
Author Contributions
Data analysis, Conceptualization, Writing—Review and Editing and Funding acquisition, X.Z.; Validation, Formal analysis, Visualization, Picture processing, T.Y.; Resources, Test data acquisition, Investigation, Writing—Original Draft Preparation, Formal analysis, Visualization, Picture processing, T.L.; Conceptualization, Writing—review and editing and Funding acquisition, Z.Z.; Project administration, Test data collation, and Writing—Review and Editing, and Supervision, J.L. All authors have read and agreed to the published version of the manuscript.
Funding
This study received financial support from the National Natural Science Foundation of China (Grant No. 51809101), the Primary Research & Development Plan of Jiangsu Province (Grant No. BE2021681), the Lianyungang City Key Technology Project (Grant No. SF2230), the Qinglan Project of Jiangsu Higher Education Institutions, the Natural Science Foundation of the Jiangsu Higher Education Institutions of China (Grant No. 23KJA580003), Postgraduate Research & Practice Innovation Program of Jiangsu Province (Grant No. SJCX23-1815), and Natural Science Foundation of Industry-University-Research Project of LianSu Expressway (Grant No. JOUH22089).
Data Availability Statement
If readers require the data from this article, please contact the corresponding author.
Conflicts of Interest
The authors declare no conflict of interest.
References
- Zhao, X.; Liu, C.; Zuo, L.; Wang, L.; Zhu, Q.; Liu, Y.; Zhou, B. Synthesis and Characterization of Fly Ash Geopolymer Paste for Goaf Backfill: Reuse of Soda Residue. J. Clean. Prod. 2020, 260, 121045. [Google Scholar] [CrossRef]
- Ji, G.D.; Yang, C.H.; Liu, W.; Zuo, J.J.; Lei, G.W. An experimental study on the engineering properties of backfilled alkali wastes reinforced by fly ash. Rock Soil Mech. 2015, 36, 2169–2176. [Google Scholar] [CrossRef]
- He, J.; Shi, X.; Li, Z.; Zhang, L.; Feng, X.; Zhou, L. Strength Properties of Dredged Soil at High Water Content Treated with Soda Residue, Carbide Slag, and Ground Granulated Blast Furnace Slag. Constr. Build. Mater. 2020, 242, 118126. [Google Scholar] [CrossRef]
- Wang, X.; Yan, X.; Li, X. Environmental Risk for Application of Ammonia-Soda White Mud in Soils in China. J. Integr. Agric. 2020, 19, 601–611. [Google Scholar] [CrossRef]
- Yan, Y.; Qi, F.; Seshadri, B.; Xu, Y.; Hou, J.; Ok, Y.S.; Dong, X.; Li, Q.; Sun, X.; Wang, L.; et al. Utilization of Phosphorus Loaded Alkaline Residue to Immobilize Lead in a Shooting Range Soil. Chemosphere 2016, 162, 315–323. [Google Scholar] [CrossRef]
- Gomes, H.I.; Mayes, W.M.; Rogerson, M.; Stewart, D.I.; Burke, I.T. Alkaline Residues and the Environment: A Review of Impacts, Management Practices and Opportunities. J. Clean. Prod. 2016, 112, 3571–3582. [Google Scholar] [CrossRef]
- Li, C.; Liang, Y.; Jiang, L.; Zhang, C.; Wang, Q. Characteristics of Ammonia-Soda Residue and Its Reuse in Magnesium Oxychloride Cement Pastes. Constr. Build. Mater. 2021, 300, 123981. [Google Scholar] [CrossRef]
- Hulisz, P.; Pindral, S.; Kobierski, M.; Charzyński, P. Technogenic Layers in Organic Soils as a Result of the Impact of the Soda Industry. Eurasian Soil Sci. 2018, 51, 1133–1141. [Google Scholar] [CrossRef]
- Chen, Y.-C. Evaluating Greenhouse Gas Emissions and Energy Recovery from Municipal and Industrial Solid Waste Using Waste-to-Energy Technology. J. Clean. Prod. 2018, 192, 262–269. [Google Scholar] [CrossRef]
- Kwon, S.-J.; Wang, X.-Y. CO2 Uptake Model of Limestone-Powder-Blended Concrete Due to Carbonation. J. Build. Eng. 2021, 38, 102176. [Google Scholar] [CrossRef]
- Mi, R.; Pan, G. Slowing down CO2 Effective Diffusion Speeds in Recycled Aggregate Concrete by Using Carbon Capture Technology and High-Quality Recycled Aggregate. J. Build. Eng. 2022, 45, 103628. [Google Scholar] [CrossRef]
- Cui, K.; Lu, D.; Jiang, T.; Zhang, J.; Jiang, Z.; Zhang, G.; Chang, J.; Lau, D. Understanding the Role of Carbon Nanotubes in Low Carbon Sulfoaluminate Cement-Based Composite. J. Clean. Prod. 2023, 416, 137843. [Google Scholar] [CrossRef]
- Cui, K.; Liang, K.; Jiang, T.; Zhang, J.; Lau, D.; Chang, J. Understanding the Role of Carbon Nanotubes in Low-Carbon Concrete: From Experiment to Molecular Dynamics. Cem. Concr. Compos. 2023, 142, 105189. [Google Scholar] [CrossRef]
- Liu, C.; Liu, B.; Chen, X.; Zhang, J.; Duan, W.; Guo, J.; Han, J.; Zhang, Y.; Yu, S.; Hu, K. Preparation and Modification of Alkaline Bricks by Using Industrial Residues and Calcium Stearate. Environ. Prog. Sustain. Energy 2017, 36, 21–26. [Google Scholar] [CrossRef]
- Wang, Q.; Li, J.; Zhang, J.; Wu, P.; Lyu, X.; Hu, S.; Qiu, J.; Liu, X.; Yu, H. Reuse of the Soda Sludge Dealt with Water Washing as a Supplementary Material for the Synthesis of Clinker Binders. J. Clean. Prod. 2021, 295, 126433. [Google Scholar] [CrossRef]
- Wang, Q.; Li, J.; Yao, G.; Zhu, X.; Hu, S.; Qiu, J.; Chen, P.; Lyu, X. Characterization of the Mechanical Properties and Microcosmic Mechanism of Portland Cement Prepared with Soda Residue. Constr. Build. Mater. 2020, 241, 117994. [Google Scholar] [CrossRef]
- He, J.; Li, Z.; Wang, X.; Shi, X. Durability of Soft Soil Treated with Soda Residue and Ground Granulated Blast Furnace Slag in a Soaking Environment. J. Mater. Civ. Eng. 2020, 32, 06019018. [Google Scholar] [CrossRef]
- Şener, S. Use of Solid Wastes of the Soda Ash Plant as an Adsorbent for the Removal of Anionic Dyes: Equilibrium and Kinetic Studies. Chem. Eng. J. 2008, 138, 207–214. [Google Scholar] [CrossRef]
- Xu, D.; Ni, W.; Wang, Q.; Xu, C.; Li, K. Ammonia-Soda Residue and Metallurgical Slags from Iron and Steel Industries as Cementitious Materials for Clinker-Free Concretes. J. Clean. Prod. 2021, 307, 127262. [Google Scholar] [CrossRef]
- Xu, J.K. Research of Treatment on Soda Residue Subgrade. Master’s Thesis, Tianjin University, Tianjin, China, 2007. (In Chinese). [Google Scholar]
- Zheng, M.R. Experimental Research of Soda Residue in Inorganic Binder Stabilize Materials and Cement-Stabilized Soil. Master’s Thesis, South China University of Technology, Guangzhou, China, 2011. (In Chinese). [Google Scholar]
- Zhang, X.X. Research of Soda Residue Performance in Highway and Microstructure Characteristics. Master’s Thesis, Hebei University of Technology, Tianjin, China, 2015. (In Chinese). [Google Scholar]
- Liu, C.Y.; Zhao, X.H.; Zhu, N.; Liu, Y.F.; Pang, Y.Z. Mechanical Properties of Fly Ash-based Geopolymers and Modification Mechanism of Soda Residue. Bull. Chin. Ceram. Soc. 2017, 36, 679–685+691. (In Chinese) [Google Scholar]
- Li, Y.P. Study on Water Stability and Mechanical Properties of Soda Residue Geopolymer for Subgrade Soil. Master’s Thesis, Hebei University of Technology, Tianjin, China, 2018. (In Chinese). [Google Scholar]
- Xu, S.Z. Investigation on Soft Soil Solidified by Cement-Soda Residue. Master’s Thesis, Hefei University of Technology, Hefei, China, 2019. (In Chinese). [Google Scholar]
- Song, R.; Zhao, Q.; Zhang, J.; Liu, J. Microstructure and Composition of Hardened Paste of Soda Residue-Slag-Cement Binding Material System. Front. Mater. 2019, 6, 211. [Google Scholar] [CrossRef]
- Jadeja, R.N.; Tewari, A. Effect of Soda Ash Industry Effluent on Agarophytes, Alginophytes and Carrageenophyte of West Coast of India. J. Hazard. Mater. 2009, 162, 498–502. [Google Scholar] [CrossRef] [PubMed]
- Wang, C.; Zeng, Z.; Wang, A.; Gao, S.; Huang, J.; Liu, K. Basic Properties, Characteristic Heavy Metals Leaching and Migration of Coal Incineration Fly Ash-Based Mortar. Structures 2023, 54, 1179–1195. [Google Scholar] [CrossRef]
- JTG 3430-2020[S]; Test Methods of Soils for Highway Engineering. Standards Press of China: Beijing, China, 2008.
- JTG E51-2009[S]; Test Methods of Materials Stabilized with Inorganic Binders for Highway Engineering. China Communications Press: Beijing, China, 2009.
- Dong, D.D. Research on Specimen Preparation and Test Method of Bearing Ratio Test. Master’s Thesis, China University of Mining and Technology, Xuzhou, China, 2021. (In Chinese). [Google Scholar]
- Liang, T. Study on Road Performance of Soda Residue Soil Based on Orthogonal Test. Master’s Thesis, Jiangsu Ocean University, Lianyungang, China, 2023. (In Chinese). [Google Scholar]
- George, V.; Kumar, A. Studies on Modulus of Resilience Using Cyclic Tri-Axial Test and Correlations to PFWD, DCP, and CBR. Int. J. Pavement Eng. 2018, 19, 976–985. [Google Scholar] [CrossRef]
- Simonsen, E.; Janoo, V.C.; Isacsson, U. Resilient Properties of Unbound Road Materials during Seasonal Frost Conditions. J. Cold Reg. Eng. 2002, 16, 28–50. [Google Scholar] [CrossRef]
- JTG/T F20-2015[S]; Technical Guidelines for Construction of Highway Roadbases. China Communications Press: Beijing, China, 2015.
- JTG D50-2017[S]; Specifications for Design of Highway Asphalt Pavement. China Communications Press: Beijing, China, 2017.
- He, Z.X. Application of Fuzzy Mathematics; Tianjin Science and Technology Press: Tianjin, China, 2013; pp. 188–193. [Google Scholar]
- Chen, Y.H.; Chen, Y.M.; Zhang, W.L.; Zhang, Y.T. Engineering Properties of Solidified Soda Residue with GGBS and Cement. J. Build. Mater. 2017, 20, 582–585+597. (In Chinese) [Google Scholar]
- Li, J.; Chen, H.; Gao, X.; Ding, Q.; Shan, W.; Guo, H.; Zhuo, J. Cracks Evolution and Micro Mechanism of Compacted Clay under Wet-Dry Cycles and Wet-Dry-Freeze-Thaw Cycles. Cold Reg. Sci. Technol. 2023, 214, 103944. [Google Scholar] [CrossRef]
- He, J.; Zhang, L.; Zhang, C. Durability Analysis of Sludge Solidified with Soda Residue Subjected to Dry-Wet and Freeze-Thaw Cycles. Adv. Civ. Eng. 2021, 2021, e9960416. [Google Scholar] [CrossRef]
- Kampala, A.; Horpibulsuk, S.; Prongmanee, N.; Chinkulkijniwat, A. Influence of Wet-Dry Cycles on Compressive Strength of Calcium Carbide Residue–Fly Ash Stabilized Clay. J. Mater. Civ. Eng. 2014, 26, 633–643. [Google Scholar] [CrossRef]
- Wang, H.; Zhao, X.; Gao, H.; Yuan, T.; Zhang, X. The Effects of Salt-Loss Soda Residue and Oxalate Acid on Property and Structure of Fly Ash-Based Geopolymer. Constr. Build. Mater. 2023, 366, 130214. [Google Scholar] [CrossRef]
- Guo, W.; Zhang, Z.; Xu, Z.; Zhang, J.; Bai, Y.; Zhao, Q.; Qiu, Y. Mechanical Properties and Compressive Constitutive Relation of Solid Waste-Based Concrete Activated by Soda Residue-Carbide Slag. Constr. Build. Mater. 2022, 333, 127352. [Google Scholar] [CrossRef]
- Soundarya, N. Effect of Fly Ash and GGBS on Lime Stabilized Mud Block. Mater. Today Proc. 2021, 47, 4636–4640. [Google Scholar] [CrossRef]
- Kanty, P.; Rybak, J.; Stefaniuk, D. Some Remarks on Practical Aspects of Laboratory Testing of Deep Soil Mixing Composites Achieved in Organic Soils. IOP Conf. Ser. Mater. Sci. Eng. 2017, 245, 022018. [Google Scholar] [CrossRef]
- Ermolovich, E.A.; Ivannikov, A.L.; Khayrutdinov, M.M.; Kongar-Syuryun, C.B.; Tyulyaeva, Y.S. Creation of a Nanomodified Backfill Based on the Waste from Enrichment of Water-Soluble Ores. Materials 2022, 15, 3689. [Google Scholar] [CrossRef] [PubMed]
- Phummiphan, I.; Horpibulsuk, S.; Rachan, R.; Arulrajah, A.; Shen, S.-L.; Chindaprasirt, P. High Calcium Fly Ash Geopolymer Stabilized Lateritic Soil and Granulated Blast Furnace Slag Blends as a Pavement Base Material. J. Hazard. Mater. 2018, 341, 257–267. [Google Scholar] [CrossRef] [PubMed]
- Xiao, Q.Y.; Su, G.; Wang, Z.H.; Feng, S.J.; Zhang, H. The influence of alkali slag on the mechanical and water stability of cement stabilized semi-rigid recycled base and its micro analysis. Eng. J. Wuhan Univ. 2022, 55, 675–681. (In Chinese) [Google Scholar]
- Li, B.J.; Li, G.Z. Study on Mechanical Properties of Soda Residue/Fly Ash Composite Cementitious Material. Adv. Mater. Res. 2011, 194–196, 1026–1029. [Google Scholar] [CrossRef]
- Jha, A.K.; Sivapullaiah, P.V. Mechanism of Improvement in the Strength and Volume Change Behavior of Lime Stabilized Soil. Eng. Geol. 2015, 198, 53–64. [Google Scholar] [CrossRef]
- Sun, Y.; Li, L. Strength Assessment and Mechanism Analysis of Cement Stabilized Reclaimed Lime-Fly Ash Macadam. Constr. Build. Mater. 2018, 166, 118–129. [Google Scholar] [CrossRef]
- Zhu, S.; Tang, Y.; Xu, Q.; Zhang, K.; Li, H.; Zhu, Z.; Yin, W. Mechanical Properties Test and Enhancement Mechanism of Lime Soil Modified by High Content Soda Residue for Road Use. Coatings 2022, 12, 1539. [Google Scholar] [CrossRef]
Disclaimer/Publisher’s Note: The statements, opinions and data contained in all publications are solely those of the individual author(s) and contributor(s) and not of MDPI and/or the editor(s). MDPI and/or the editor(s) disclaim responsibility for any injury to people or property resulting from any ideas, methods, instructions or products referred to in the content. |
© 2023 by the authors. Licensee MDPI, Basel, Switzerland. This article is an open access article distributed under the terms and conditions of the Creative Commons Attribution (CC BY) license (https://creativecommons.org/licenses/by/4.0/).