1. Introduction
The safety and comfort of pedestrians around urban buildings largely depend on the wind environment at the height of the pedestrian floor [
1,
2,
3,
4]. In order to solve this problem, people have done a lot of research on pedestrian wind environments [
5,
6,
7,
8,
9]. To clarify what urban layout, building shape, vegetation, building density, and other factors can make the wind environment of the pedestrian floor safe and comfortable [
10,
11,
12]. Therefore, it is of great significance for architectural designers and decision makers to improve pedestrian level wind environment and create good pedestrian wind comfort.
In recent years, in order to improve the wind environment at urban pedestrian levels and enhance the comfort of the wind environment, people have adopted some strategies [
13,
14,
15,
16].
Cui [
17] quantitatively evaluated the pedestrian wind environment of a U-shaped canyon by conducting particle image test experiments in wind tunnels. The results show that the wind speed of a U-shaped canyon at pedestrian height is generally lower than that of a parallel canyon, especially in a parallel wind direction. Weerasuriya [
18] tested the influence of twisted wind characteristics on pedestrian altitude wind speed in a boundary layer wind tunnel. Taking Tsuen Wan, Hong Kong, as the research object, we found that the wind speed of the twisted wind largely depends on the size and direction of the yaw angle; especially in nearby areas with low densities of buildings, the local wind circulation is significantly affected by the twisted wind. Through a wind tunnel experiement, He [
19] studied the influence of irregularity (fragmentation, angularity, and curvature) and permeability on the wind environment of the pedestrian floor. The results show that the wind environment at pedestrian level is negatively correlated with urban irregularity. There is a positive correlation between the wind performance of the pedestrian layer and urban permeability. Ikegaya [
20] used the computational fluid dynamics (CFD) method to study the wind field of the pedestrian floor around the building with an aspect ratio of 1:1:2. It is proposed that the evaluation method of peak factor can better evaluate the wind environment on a pedestrian floor.
Piloti design plays a huge role in improving the microclimate around buildings [
21]. In hot summers, a piloti design can not only provide shade for people but also improve the ventilation effect around the building [
22]. Du [
23] studied the shapes of “I”, “L”, “U”, and “☐“ of four common building structures through CFD, used the average wind speed ratio and the average wind speed change rate to identify wind comfort, and quantitatively evaluated the improvement brought by the “lift-up” design. The results show that the piloti design can improve the wind comfort of the built environment, and its influence degree is closely related to the incident wind direction. Among them, the wind comfort under the oblique wind direction is better than the other two wind directions. Huang [
24] compared the differences in meteorological parameters and response heat perception between the piloti part of the piloti building and the area directly exposed to outdoor sunlight based on field measurement and subject questionnaire. The results show that most people report feeling more comfortable in the shade of a piloti building. Meanwhile, through data analysis, it is concluded that solar radiation and wind speed are the two main factors affecting outdoor thermal comfort. Sha [
25] used CFD to study the influence of piloti design with different wind directions on pedestrian wind comfort. The results show that when the wind direction is between 30° and 45°, the open-air setting is more effective reducing the concentration of pollutants than at 0° and 15°. The piloti design can enhance the dilution of pollutant concentrations in all winds. Tse [
26] studied the influence of piloti design and size on the surrounding wind environment through a wind tunnel experiment. The results show that the piloti height is the parameter that has the greatest influence on the surrounding wind environment. Chen [
27] used the CFD method to explore the impact of building height and upstream buildings on piloti buildings. The results show that the piloti building is taller or shorter than the upstream building, which can make the surrounding wind environment better. However, increasing building height and removing upstream buildings are not necessarily beneficial to the surrounding wind environment of the piloti buildings.
Computational wind engineering simulation research originated around 1963, when Smagorinsky [
28] developed one of the first successful LES methods. With the improvement of computing power, large eddy simulation is becoming more and more popular in wind engineering. Muralam [
29] and Yu Da-Hai [
30] applied the LES model to study the flow around the blunt body. The results show that although the LES model can accurately reflect the complex characteristics of flow around a blunt body, it is difficult to apply in engineering due to the large amount of calculation. Shah KB [
31] found that LES could well predict the phenomenon of flow around blunt bodies and provide important information for wind engineering researchers. Selvan [
32] used the LES model to study the full-scale wind tunnel experiment, and the results showed that the prediction of the mean value was in good agreement with the measured results. Kravchenko AG [
33] studied the large-eddy numerical simulation of subcritical flow around a cylinder and proposed some key problems to appropriately simulate the numerical simulation of flow around a blunt body. Tutar [
34] used large eddy simulation to conduct a numerical study on two parallel buildings and presented the distribution characteristics of the flow field of the parallel buildings. Lim HC [
35] used LES to study a rectangular building located in a turbulent boundary layer, and the results showed that a reasonable incoming flow and computational domain boundary can greatly improve the coincidence between LES and test results. In general, LES performs better than other turbulence modeling methods but requires much more computing resources.
Existing wind environment studies are mainly focused on the layout of buildings without piloti or with the piloti wind environment of a single building or a row of buildings. It is generally ignored that the diverse and complex forms of urban blocks will increase the uncertainty of the effect of piloti design on improving the wind environment. In addition, there is a lack of research on the wind comfort of pedestrian floors based on the building overhead rate in urban blocks. This study considers the complexity of the form of urban blocks, and the target area of the study is set in the middle of the architectural complex. At the same time, this study is not conducted on a single building or a single row of buildings but on a small group of buildings so as to ensure the credibility of the research results. In this study, six different overhead rates were set up to study the influence of different piloti rates on the surrounding wind environment, and it was found that the piloti rate was the best for pedestrian wind comfort. At the same time, three commonly used building layouts are selected, and the comparison between these three building layouts is also made, and it is obtained that the building layout has the best piloti rate and pedestrian wind comfort. This study provides some suggestions for urban planners to mitigate the increasingly serious urban heat island effect.
3. Building Configuration Description
3.1. Building Configuration
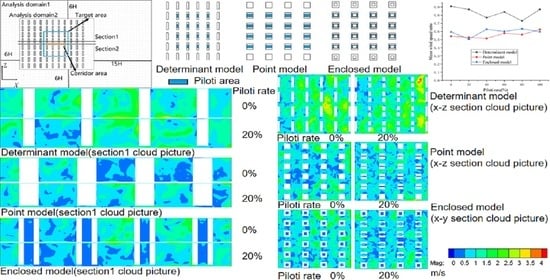
The analytical model in this study is determined by referring to three common residential layouts, i.e., determinant cluster, point cluster, and enclosing cluster, in Wuhan, China.
As shown in
Figure 3, the architectural complex designed by this research institute consists of 88 single buildings in 8 rows and 11 columns. The size of the computational domain is 1882 × 1204 × 462 m, and the design size of the entire architectural complex is 1000 × 700 m. The distance between the front, left, and right of the entire building complex and the edge of the computing domain is 252 m (6H, H = 42 m), and the distance between the rear and the edge of the computing domain is 630 m (15H), which is in line with the recommended setting in the AIJ guide. The maximum blocking rate of the model in this study is 3.6%, which is slightly higher than the 3% blocking rate recommended by the guideline, but as long as the blocking rate is less than 10% [
38], the result can also be considered reliable.
The dimensions of a single building are shown in
Figure 3. The distance between the front and back of the building is 60 m, and the distance between the left and right sides of the building is 25 m. The building size of the determinant group was 60 m (x) × 15 m (z) × 42 m (y); the point group building size was 30 m (x) × 30 m (z) × 42 m (y). The dimensions of the surrounding building are 34 m (x) × 34 m (z) × 42 m (y), and the dimensions of the inner building are 16 m (x) × 16 m (z) × 42 m (y). Although each model is different in size, its footprint is the same.
In order to eliminate the uncertainty of wind environment effect of piloti design in complex urban blocks, 16 single buildings in the center of an architectural complex were selected as the target area. The target areas of determinant, point, and enclosed types are 300 × 340 m, 220 × 300 m, and 376 × 236 m, respectively. Although the target area is different in size, its position in the whole building group is the same. There are four rows of buildings in the front row, three rows of buildings in the back row, and two rows of buildings on the left and right. At the same time, the pedestrian height of the middle passage and piloti area in the target area are studied separately. In order to study the direction of the wind in the target area, the vector diagrams of the middle section of the target area and the middle section of the building in the target area are studied. As shown in
Figure 3, the middle section of the target area is
Section 1. The middle section of the building in the target area is
Section 2. For the determinant model, point model, and enclosed model,
Section 1 is the Z = 602 m section, and
Section 2 are Z = 644.5 m, Z = 629.5 m, and Z = 631.5 m, respectively.
Table 2 shows the introduction to each case. The piloti rate of each model is 0%, 20%, 40%, 60%, 80%, and 100%. The area of different groups in this study is the same. The piloti form studied is that the piloti part begins in the middle and gradually spreads to both sides. As shown in
Table 1, the so-called piloti ratio is the ratio of the horizontal area of 3 m of the building to the floor area of the building. As shown in
Figure 4, the so-called piloti area refers to the part of the building raised from the ground to allow the air to flow through.
3.2. Boundary Condition
The software used in this study is Openfoam-v8.
The boundary condition type of inlet velocity is codeFixedValue, and the power law air inlet velocity is adopted. The formula is
, where US is the summer wind speed in Wuhan, China [
39],
= 2.7 m/s, Zs = 10 m, and the ground roughness α is set to 0.3. The exit boundary condition is pressureInletOutletValue. The wall boundary condition is set to noSlip. The inlet flow set is a laminar flow inlet.
The pressure boundary condition type for the entrance and wall is set to zeroGradient. The outlet boundary condition type is set to totalPressure, which corresponds to the velocity in the inlet boundary condition.
The viscosity boundary conditions of the inlet, outlet, and wall are type calculated.
The total calculation time step is 1200 s. 1200 s is calculated from the inlet wind speed blowing across the entire computing domain to allow adequate fluid development. At the same time, the number of co was set, the maximum set is not more than 1.
The time term of the NS equation is approximated using the Euler difference scheme, while the convection, gradient, and LaPlace terms are approximated using Gauss linear approximations. The precision of the solution of the NS equation is 10−6.
The turbulence condition used in this paper is , where = 0.3, = 462 m, and Z is the height.
3.3. Grid Introduction
Figure 5 and
Figure 6 show the grid picture of the x-y and x-z sections when the piloti ratio of the determinant model is 0%. The author densified the target area studied and adopted a relatively sparse grid layout far away from the building model. The boundary layer grid of the first floor of the buildings in the target area is 1.6 × 10
−3 (y+ < 8). The grid number of all models is shown in
Table 3.
4. Results and Discussion
4.1. The Effects of Piloti Design in the Determinant Group
4.1.1. The Effects of Piloti Design on Pedestrian Layer Wind Speed in the Target Area
As shown in
Figure 7, the overall average wind speed ratio of target areas with different piloti rates presents a downward trend as a whole, with slight, but small, fluctuations in the middle. When the piloti ratio is 100%, the reason why the average wind speed ratio suddenly rises is that there are no obstacles at the bottom, which leads to the increase of the average wind speed ratio. Therefore, for the determinant model, the increase in piloti rate has a negative effect on the average wind speed of pedestrian height in the target area.
Combined with
Figure 8 and
Figure 9, it can be known that the mainstream wind speed in the target area is countercurrent wind. The regional average wind speed ratio does not increase with the increase of the building piloti rate because the target area is located in the middle part of the building complex and there are obstacles in front of it. Therefore, when the wind blows into the target area, the wind speed in the target area has been attenuated, so the wind speed in the target area is small. However, there are no obstacles around the whole building complex, so the wind speed is relatively high. In the target area of the building complex, the wind speed outside the building complex is large while the wind speed in the target area is small, so the wind outside the building complex will flow to the inside of the building complex, and the inside of the target area is affected by the side wind. Furthermore, as shown in
Figure 8, when the side wind enters, the wind direction from the side changes from the downwind direction to the opposite wind direction due to the obstruction of buildings. In the target area, the wind speed of the countercurrent wind is higher than that of the downcurrent wind, so most of the wind direction in the target area changes.
4.1.2. The Effects of Piloti Design on the Wind Speed at the Pedestrian Level of the Aisle in the Target Area
As shown in
Figure 7, the average pedestrian wind speed ratio in the middle aisle of the target area generally presents a downward trend. Combined with
Figure 10, it can be seen that the dominant wind in the middle corridor of the target area is countercurrent wind, while some wind direction blows upward, resulting in the decline of wind speed on the pedestrian floor. When the piloti ratio is 100%, the increase in the average wind speed ratio is due to the fact that there is no obstacle to block it, which leads to the increase in the average wind speed.
4.1.3. The Effects of Piloti Design on Wind Speed of the Pedestrian Layer in the Piloti Area
As shown in
Figure 7, with the increase in piloti rate, the average wind speed ratio of the pedestrian floor height in piloti areas also gradually increases. It is highest when the piloti rate is 100% because it is fully piloti and there is no obstruction because the average wind speed is at a maximum. Therefore, for the determinant model, the increase in the piloti rate can increase the average wind speed of pedestrian height in the piloti space.
4.1.4. The Effects of Piloti Design on Pedestrian Layer Wind Comfort in the Target Area
The hottest month in Wuhan is July, with an average temperature of 28.4 °C [
39]. Therefore, its comfortable wind range is 0.7–1.7 m/s.
The target area of the study was sampled every 0.5 m, and 355,705, 368,105, 380,009, 391,913, 403,817, and 415,721 points were selected for the piloti rate ranging from 0% to 100%.
The bar chart of the ratio and number of comfortable wind points on pedestrian floors with different piloti rates in the target area is shown below. It has been discovered that, in the target area, the proportion of comfortable wind increases as the piloti rate increases. However, when the piloti rate is 100%, the proportion of large wind speeds increases, leading to a decline in the comfortable wind ratio.
At the same time, it can be seen from
Figure 11 that when the piloti rate increases from 0% to 20%, the comfortable wind ratio increases by 1.66%, with a small increase in the ratio range. However, from 20 to 40 percent, the comfortable wind ratio increased significantly, by 4.96 percent. From 40% to 60% and from 60% to 80%, the comfortable wind ratio increased by 1.76% and 1.04%, respectively.
Therefore, it can be concluded that in the summer, for the determinant group, the comfortable wind ratio increases with an increase in the piloti rate, but if the piloti rate exceeds 80%, because of the increase in the large wind speed, the comfortable wind ratio decreases. At the same time, it can be concluded that when the piloti rate is between 20% to 40%, the comfortable wind ratio increases the most.
4.2. The Effects of Piloti Design in the Point Group
4.2.1. The Effects of Piloti Design on Pedestrian Layer Wind Speed in the Target Area
It can be seen from
Figure 12 that the overall wind speed ratio of target areas under different piloti rates fluctuates, but the fluctuation is small. The maximum difference between two piloti rates does not exceed 0.07 except when the piloti rate is 100%. The maximum wind speed ratio occurs on layouts with a 100% piloti ratio, but this is because there are no obstacles under the target area and wind flow is not blocked, resulting in a higher average wind speed.
Combined with
Figure 13 and
Figure 14, it can be seen that the mainstream wind direction in the target area is countercurrent wind. The average wind speed ratio of the target area does not increase with the increase in the piloti rate of the building, and even slightly decreases when the piloti rate is 20% and 40%. This is because there is an opening at the bottom, resulting in the increased wind speed of the downstream wind is greater than that of the upstream wind. When the piloti rate is 60%, the increase is due to the further increase of the bottom opening, which leads to a larger increase in the upstream wind speed than the downstream wind speed.
4.2.2. The Effects of Piloti Design on the Wind Speed at the Pedestrian Level of the Aisle in the Target Area
It can be seen from
Figure 12 that the average wind speed ratio of the corridor in the target area is the minimum under the condition of no piloti, reaches the maximum when the piloti rate is 20%, and then begins to fluctuate gently, but the fluctuation is small. Combined with
Figure 15, the main wind direction of the target area is still countercurrent. This shows that, for point layout, building piloti on the first floor can greatly improve the wind speed of the middle corridor.
4.2.3. The Effects of Piloti Design on Wind Speed of the Pedestrian Layer in the Piloti Area
As shown in
Figure 12, the average wind speed ratio at a height of 1.5 m inside the piloti space presents a trend of gradual increase. It can be concluded that for the point model, with the increase in piloti rate, the average wind speed of pedestrian floors in the piloti area also increases gradually. When the piloti ratio was 60% to 80%, the average wind speed ratio decreased slightly, which may be because at a 60% piloti ratio, the average wind speed of downstream wind and countercurrent wind increased by the same amplitude, so the average wind speed did not change much. When the piloti ratio is 100%, the sudden rise in the average wind speed ratio is because there is no blockage at the bottom, so the average wind speed ratio increases.
4.2.4. The Effects of Piloti Design on Pedestrian Layer Wind Comfort in Target Area
The target area of the study was sampled every 0.5 m, and 263,906, 276,593, 288,305, 300,017, 311,729, and 323,441 points were selected for the piloti rate ranging from 0% to 100%.
It can be seen from
Figure 16 that in the target area, the comfortable wind ratio presents an overall upward trend with the increase in piloti rate. When the piloti rate is 100%, the comfortable wind ratio reaches its maximum.
However, when the piloti ratio was 40%, the comfortable wind ratio showed a decreasing trend compared with 20%. Combined with
Figure 12, it can be seen that for the layout with a 40% piloti ratio, its average wind speed ratio in the target area is the smallest among all point models. This is due to the increase in the speed of the countercurrent wind, which leads to a decrease in the overall wind speed. Therefore, when the piloti ratio is 40%, the comfortable wind ratio decreases.
For the point model, the proportion of comfortable wind is highest when the piloti ratio is 100%. However, when the piloti rate is 100%, it is impossible to achieve, and when the piloti rate is 80%, the comfortable wind ratio is only 1.23% smaller than when the piloti rate is 100%. Therefore, it is also appropriate to choose a slightly smaller piloti rate.
4.3. The Effects of Piloti Design in the Enclosed Group
4.3.1. The Effects of Piloti Design on Pedestrian Layer Wind Speed in the Target Area
Figure 17 shows that the average wind speed of pedestrian floors in the target area decreases first and then gradually flattens. This is due to the change in the building piloti rate. However, it fluctuates slightly when it is flat, and the difference in average wind speed ratio between different piloti rates is less than 0.035. This indicates that for the enclosed model, the building piloti rate has little influence on the average wind speed of pedestrian floors in the target area. Even when the piloti rate is 20%, this arrangement is not conducive to the average wind speed of the pedestrian layer in the target area.
According to
Figure 18 and
Figure 19, the mainstream wind speed in the target area is countercurrent wind. When the piloti rate is 20%, the decrease of the average wind speed is because the wind direction is partly upward, which leads to the decrease of the average wind speed in the target area. When the piloti ratio is 100%, it is lower than when it is 40%, 60%, and 80%, which is also because part of the wind direction is upward.
4.3.2. The Effects of Piloti Design on the Wind Speed at the Pedestrian Level of the Aisle in the Target Area
As shown in
Figure 17, the average wind speed ratio of the pedestrian floor in the middle aisle of the target area shows a trend of fluctuation, and the fluctuation range is large. The maximum average wind speed ratio of the middle passage at a height of 1.5 m in the target area is 100%, which is 0.607.
When the piloti ratio is 20%, the average wind speed ratio is the lowest. At the same time, according to
Figure 20, the wind flows upward and the wind speed ratio decreases because of the low piloti rate. The average wind speed ratio of the target area is the lowest when the piloti ratio is 20%.
4.3.3. The Effects of Piloti Design on Wind Speed of the Pedestrian Layer in the Piloti Area
It can be seen from
Figure 17 that, with the continuous increase of piloti rate, the average wind speed ratio at the height of 1.5 m in the piloti space presents an overall trend of increase. When the piloti ratio is 100%, the average wind speed ratio reaches its maximum, which is 0.652. Compared with the piloti rate of 20%, there is a great improvement.
4.3.4. The Effects of Piloti Design on Pedestrian Layer Wind Comfort in the Target Area
The target area of the study was sampled every 0.5 m, and 285,985, 298,753, 312,259, 325,921, 336,961, and 348,001 points were selected for the piloti rate ranging from 0% to 100%.
It can be seen from
Figure 21 that for the enclosed model, the increase in piloti rate has a certain effect on improving wind comfort in the target area of the enclosed layout, but the effect is small. Even if the piloti rate is not set correctly, it may reduce outdoor comfort.
When the piloti ratio is 20%, the comfortable wind ratio is the lowest. In combination with the vector diagram, this is due to the double effect of the side-current wind and a large part of the wind flowing upwards. Because of these two factors, when the piloti rate is 20%, the overall average wind speed ratio is smaller, which leads to a smaller comfortable wind ratio in the target area.
When the piloti ratio is 60%, the comfortable wind ratio is 65.3%. Compared with no piloti, the improvement range is 2.41%. This is a significant improvement over the 20% reduction in piloti rates and the less than 1% improvement in piloti rates of 40%, 80%, and 100%.
Therefore, it can be concluded that for the enclosed model, outdoor pedestrian wind comfort reaches its maximum when the piloti rate is 60%.
4.4. Comparisons between Different Building Configurations
The piloti setting has little influence on the overall wind speed in the target area, and even an inappropriate piloti rate setting may reduce the overall average wind speed in the target area. For the determinant layout, with the increase in piloti rate, the average wind speed of pedestrian height in the target area is adversely affected. For point and enclosed layouts, setting the correct piloti rate can improve the overall mean wind speed of the area, requiring the piloti rate to be greater than 40%.
For point layouts, the piloti setting can greatly improve the average wind speed of the center aisle. This is not the case with determinant and enclosing layouts. For the determinant layout, the piloti setting reduces the average wind speed of the center aisle. The enclosed layout is the same, but when the piloti ratio is 60%, the average wind speed in the corridor is slightly increased.
At the same time, with the increase in piloti rate, the average piloti space wind speed of the three building layouts increases accordingly. This indicates that the greater the piloti ratio, the greater the wind speed inside the piloti space.
When there is no piloti condition, the determinant comfortable wind ratio is 59.14%. The point comfortable wind ratio is 51.84%; the enclosed comfortable wind ratio is 62.89%. The enclosed building layout is better than the other two kinds of building layout when there is no piloti. The point layout had the worst wind comfort ratio and was much lower than the other two layouts. For the determinant model, the point model, and the enclosed model, the maximum comfortable wind ratios in the target area are 68.44%, 66.99%, and 65.3% when the piloti ratio is 80%, 100%, and 60%, respectively. The wind comfort ratio is highest when the row layout and piloti ratio are both at 80%. Compared with the no piloti condition, the piloti rate of determinant, point, and enclosure models are improved by 9.3%, 15.15%, and 2.41%, respectively. The comfortable wind ratio is most obvious in the ground-floor piloti point-to-point layout. For the enclosed model, the improvement effect of the bottom frame is poor.
5. Conclusions
This paper mainly studies the influence of different piloti ratios on outdoor wind comfort for three typical building layouts. A total of six different piloti rates were set: 0%, 20%, 40%, 60%, 80%, and 100%. Three common residential building layouts in Wuhan, China were selected as the research objects, which are determinant type, point type, and enclosed type. There were 18 sets of models. The average wind speed was compared among the target area, the middle corridor of the building, and the pedestrian layer of the building’s piloti space. The outdoor wind comfort was analyzed by the comfortable wind ratio.
The results show that: (1) The piloti setting has little influence on the overall wind speed in the target area, and even an inappropriate piloti rate setting may reduce the overall mean wind speed in the target area. (2) For point layout, the piloti setting can improve the average wind speed in the middle passage. However, for the determinant and enclosure layout, the average wind speed in the corridor area will be reduced. (3) With the increase in piloti rate, the average wind speed of the piloti area can be improved. (4) A comprehensive comparison of the three building layouts shows that the comfortable wind ratio of the determinant layout is the highest when the piloti ratio is 80%.
The results of this study can provide architects and urban planners with reference for piloti and urban layout design. The reasonable piloti rate setting can significantly improve outdoor wind comfort as well as outdoor pedestrian wind comfort in densely built cities.


 ,
, 


