Article

Flexural Behavior of GBFS-Based Geopolymer-Reinforced Concrete Beams

Department of Civil Engineering, Faculty of Civil Engineering, Yıldız Technical University, Istanbul 34230, Türkiye
*
Author to whom correspondence should be addressed.
Buildings 2023, 13(1), 141; https://doi.org/10.3390/buildings13010141
Submission received: 12 December 2022 / Revised: 29 December 2022 / Accepted: 3 January 2023 / Published: 5 January 2023
(This article belongs to the Section Building Materials, and Repair & Renovation)

Abstract

:
Geopolymer concrete (GC) is an emerging alternative construction material due to it being eco-friendly in production with considerably low carbon emissions. Despite being an alternative material, the structural behavior of GC is a rarely studied subject in the literature. The studies concerning the mechanical behavior of structural members made from GC have established the foundations of its practical usability. The current structural codes are exclusively for ordinary Portland cement concrete (OPCC), and the utilization of these for GC constitutes an open question. In this study, 12 GC beams with different shear span-to-effective depth ratios of 2.5, 3.5 and 4.5 were manufactured and tested in a three-point bending test setup. The effect of the shear reinforcement ratio was also taken into account (0, 0.34, 0.45 and 0.67%). The results were compared with the predictive capabilities of four structural codes and two equations in the literature (all for OPCC). In addition, comparisons were made with a very limited number of studies, which included predictive tools for the strength of GC. All specimens’ cracking moments were calculated with flexural tensile strength predictions and compared with experimental cracking moments. Moreover, particularly for the beams that failed in flexure, the ultimate bending moments were compared with the predictions of two structural codes for OPCC. It was observed that the best predictions of the cracking moment could be made by the equation of Diaz-Loya et al. (2011), which resulted in the lowest coefficient of variation (COV) and consistently predicted on the safe side, whereas, even with a lower COV, EC2 consistently overestimated the cracking moment. For the ultimate moment capacity, it was observed that both ACI318 (2019) and TS500 (2000) delivered relatively good predictions and could be employed confidently.

1. Introduction

Considering the fact that the average concrete consumption in the world is more than 1 m3 per person, the construction sector has a significant impact on the deterioration of the biosphere due to its increasing carbon emissions. One of the main ingredients of concrete, Portland cement, releases significant amounts of CO2 gases during manufacturing as a result of calcination and combustion [1,2,3]. Manufacturing 1 ton of Portland cement releases 0.8 to 1 ton of CO2 [4]. This accounts for 5–7% of all global greenhouse emissions. Geopolymer concrete (GC) is one of the materials promising low carbon emissions and it can also help with waste recycling since one of its main components is slag or fly-ash, by-products of blast-furnace-related processes in the industry. Research related to GC is on the rise due to these considerations [5,6,7,8,9]. The material understanding of GC was started by Davidovits in 1979 when he found out that it could be used as an alternative binder instead of Portland cement [10,11,12,13]. The durability and high strength obtained with this strong binder paved the way for the use of geopolymer mortars in concrete as an alternative to Portland cement. As is well-known, high-performance concrete has superior mechanical properties such as improved toughness and excellent durability with respect to normal strength [14,15,16,17,18,19].
This study focused on understanding and characterizing the composite behavior of GC with reinforcements as structural members. Experimental studies, which are on a consistent rise, have devised similar testing procedures used for structural members made with ordinary Portland cement concrete (OPCC). Feng et al. [20] indicated that GC specimens (cylinders with 45 and 12.5 mm diameters) had Young’s moduli values similar to that of OPCC. Lee et al. [21] investigated the shear and bending effects on nine reinforced alkali-activated slag concrete beams with an average compressive strength of 50 MPa, varying the shear span-to-effective depth ratios (a/d) and stirrup ratios. While the mode of failure was shear for the beams without stirrups, those with stirrups failed in terms of flexure. Kumaravel et al. [22] investigated the flexural behavior of GC beams. Fly ash was activated with NaOH and Na2SiO3 solution and a total of four beams, two GC and two OPCC beams, were produced. No noticeable difference was found in terms of the flexural behavior between the GC and OPCC beams. Chang [23] investigated the shear behavior of fly-ash-based GC beams with different tensile reinforcement ratios and an a/d ratio of 2.5. Yacob et al. [24] produced fly-ash-based GC and OPCC beams with varying a/d and stirrup ratios. The failure modes, deformation characteristics and strengths of the beams were compared. Sanni [25] investigated the flexural behavior of GC beams with an a/d ratio of 6, varying tensile reinforcement ratios and compressive strengths of the concrete. Chang [23], Yacob et al. [24] and Sanni [25] emphasized that the crack types in GC beams had similar characteristics to those of OPCC beams. Wu et al. [26] stated that the shear capacities of GC beams are on par with or even superior to OPCC beams based on testing eighteen GC beams and three OPCC control beams with different tensile reinforcement ratios and cross-sectional dimensions. Madheswaran et al. [27] produced T-beams based on fly ash with variable a/d and stirrup spacing ratios. It was shown that the experimental results were consistent with the shear strength relations for conventional concrete given by ACI318 [28], and thus it was concluded that these relations can be used for GC beams.
In this study, a thorough understanding of the shear–flexural behavior of GC beams was sought. A systematic approach that began with identifying the proportions of the ingredients of granulated blast furnace slag (GBFS), the bulk material of GC beams, was followed. Twelve beams with a/d ratios of 2.5, 3.5 and 4.5, and percent stirrup ratios of 0, 0.34, 0.45 and 0.67 were casted. The selected a/d range specifically aimed to capture the transition of shear failure to bending failure. The initial flexural crack moments (Mcr), nominal moment capacities (Mn), load-displacement curves, strains at selected reinforcements, failure modes and associated crack pattern developments were gathered. The compatibility of the current structural codes [26,27,28,29,30,31,32,33] and the literature established for OPPC [34,35] were evaluated in terms of the predictions of Mcr. Moreover, although limited in number, four recent studies specifically dedicated to GC from the literature [36,37,38,39] were included in the prediction comparisons. Finally, the Mn values were predicted according to two codes [30,32] and compared with the test results.

2. Material and Methodology

The experimental program included twelve beams in three groups with respect to the a/d values of 2.5, 3.5 and 4.5. Each group had four specimens with volumetric transverse ratios of 0, 0.34, 0.45 and 0.67%. Starting with the production of GC, the details of the mixture design and the obtained mechanical properties are given below. In this section the three-point bending setup and various geometrical parameters of the tests are addressed as well.

2.1. Materials

Choosing aluminosilicate-based wastes as an alternative binder instead of cement will produce and ensure that these pozzolanic wastes are disposed of without harming the environment. However, it has not yet been determined which pozzolan material and which activator are the most ideal for concrete in the production of GC. The Si/Al ratio plays an active role in geopolymer formation. For this reason, the most used pozzolans in the literature are metakaolin, fly ash and GBFS. The most used alkali activators are sodium silicate (Na2SiO3) and sodium hydroxide (NaOH). [40,41,42]. The specific amounts of the materials in the GC used in the manufacturing of the beams are given in Table 1.
GBFS was obtained from a ready-mix concrete supplier (Figure 1). The values related to usability were checked and were found suitable for GC production. The maximum aggregate diameter was 13 mm. The chemical composition of the GBFS and the aggregate gradation curves used in all mixtures were given in the study of Ozturk and Arslan [43]. The alkaline liquid used was composed of 8 mol sodium hydroxide solution and 32% sodium silicate solution. Superplasticizer (pH: 4.00, chloride content < 0.1%) was used to increase workability.
The beams were reinforced with double ϕ12/ϕ16 bars (12/16 mm in diameter) in the compression zone and tension zone, respectively. The transverse reinforcement consisted of ϕ8 (8 mm in diameter) closed-web reinforcements. The mean yield strength and ultimate strength of reinforcing steels were fy = 610/506/596 MPa and fu = 788/662/740 MPa for the ϕ8/ϕ12/ϕ16 bars, respectively.

2.2. Test Beams Fabrication and Curing

The fabrication of GC beams faces difficulties in terms of the workability and consistency. Even in a test setting, relatively small amounts of GC for specimen production requires constant monitoring and careful adjustment of mixing ratios (especially the alkaline solution and superplasticizer content). A sudden loss of consistency is due to the rapid reaction of alkaline solution with pozzolan. Controlling this process with superplasticizer is another aspect of the process. In order to maintain the workability, consistency and thus the homogeneity, an iterative process was first carried out in order to find the optimal values. These iterations were carried out with different mixing ratios and the values given in Table 1 were found to be the optimum. It is advised to prepare the dry mix in the required quantities (≈2 m3) in an industrial concrete plant and then to transfer the dry mixture to the lab facility. In order to ensure homogeneity, a minimum of 5 min is advised in the mixers. Alkali activator solutions can then be added to the dry mix on site in a controlled manner. This method would prevent the sudden freezing of the GC in the trans-mixer on road. After mixing for at least 5 more mins after adding the alkaline solutions, the GC can then be placed in the formwork, as shown in Figure 2.
Flow and slump tests were carried out to measure the consistency of the samples taken from the concrete mixer. The initial flow test resulted in a spread of 62 cm. The slump test after one hour gave a value of 20 cm. The overall results indicated that the workability at the beginning, for the fresh concrete, was in class F5 and dropped into class S4 after one hour. The curing application is one of the important factors affecting the concrete quality, especially in the early strengthening of RC beams. Ambient curing was applied, as in the case of using GC in a structural system in a building (Figure 2).

2.3. Test Set-Up

The shear and flexural behaviors of the geopolymer-reinforced concrete (RC) beams were investigated through a three-point bending test setup as seen in Figure 3. Load was applied with a constant displacement-controlled rate of 30 μ/s until the specimens failed. A 50 mm thick steel plate was used to ensure the uniform distribution of the load under the actuator. The geometrical properties of the beams are shown in Figure 3. Linear variable differential transformers (LVDTs) were used for monitoring mid-span deflections and deflections of points at 20 cm left/right of the center line.

2.4. Cross-Section of Beams

Figure 3 shows the arrangement of the reinforcement, strain gages and cross-sectional dimensions of the GC beams. All beams were 150 mm wide (bw) and were 210 mm in effective depth (d). The a/d, which plays an important role in the formation of fracture patterns and the failure mode in reinforced GC beams, was set as 2.5, 3.5 and 4.5 in the G25, G35 and G45 series, respectively. Accordingly, with d = 210 mm, shear span lengths of 525 mm, 735 mm and 945 mm were obtained for the G25, G35 and G45 series, respectively. Four transverse reinforcement space configurations were used, where the transverse reinforcement ratios (ρw) ranged from 0% to 0.67%. The beam labelling included a combination of the following letters and numbers: G was used to indicate the GC series; 2.5/3.5/4.5 were used to indicate the a/d of 2.5, 3.5 and 4.5, respectively; R was used is for the reference beams without transverse reinforcement (ρw = 0); and S was used for the transverse reinforcement spacing with the following values in cm: 10, 15 and 20 cm. For example, a beam of series G having a transverse reinforcement spacing of 10 cm was designated as G25S10. The properties of the beams, including their compressive strengths, are shown in Table 2.

3. Experimental Results

The crack formation and failure modes of the beams are shown in Figure 4. Three different regimes were identified in the failure modes and their associated crack patterns, namely shear only, shear–flexural and flexural only failure modes. In each case, at the early stages of loading, early small cracks of flexural characteristics (vertical) were observed. These developed into inclined characteristic diagonal cracks, starting from around the support locations and reaching the loading point for the beams failing in terms of shear as the tests progressed. For the beams failing in terms of flexure, these initial cracks enlarged and were vertically propagated through the depth of the beam towards the top around the mid-span. Depending on the a/d and transverse reinforcement ratio, a mixed pattern was observed for shear–flexural failure [43]. In this case, in addition to diagonal shear cracks, prominent flexural cracks were also detected in the beams with frequent transverse reinforcement spacing. In all cases, cracks expanded past the beam at mid-height and propagated towards the load application point. Flexural failure (Figure 4), as with OPCC, occurred due to the yielding of the steel reinforcement followed by the crushing of concrete at the compression side of the specimens (G35S10, G35S15, G35S20, G45S10, G45S15 and G45S20).
Table 3 shows the variation in the loads, Pfl, Pcr, Pmax and Pu, which corresponded to the load at the growth of the first moment of cracking, the load at the onset of diagonal cracking, the peak load and the ultimate load, respectively. A diagonal crack was defined as a major inclined crack, extending from the level of the flexural reinforcement towards the application point of the load, and the load at the growth of this first inclined crack was termed as the diagonal-tension-cracking load (Pcr). While Pu was defined as approximately 80% of Pmax, the ratio of the deflection at Pmax (Pmax) to the deflection at Pu (u) varied between 0.9 and 2.3.
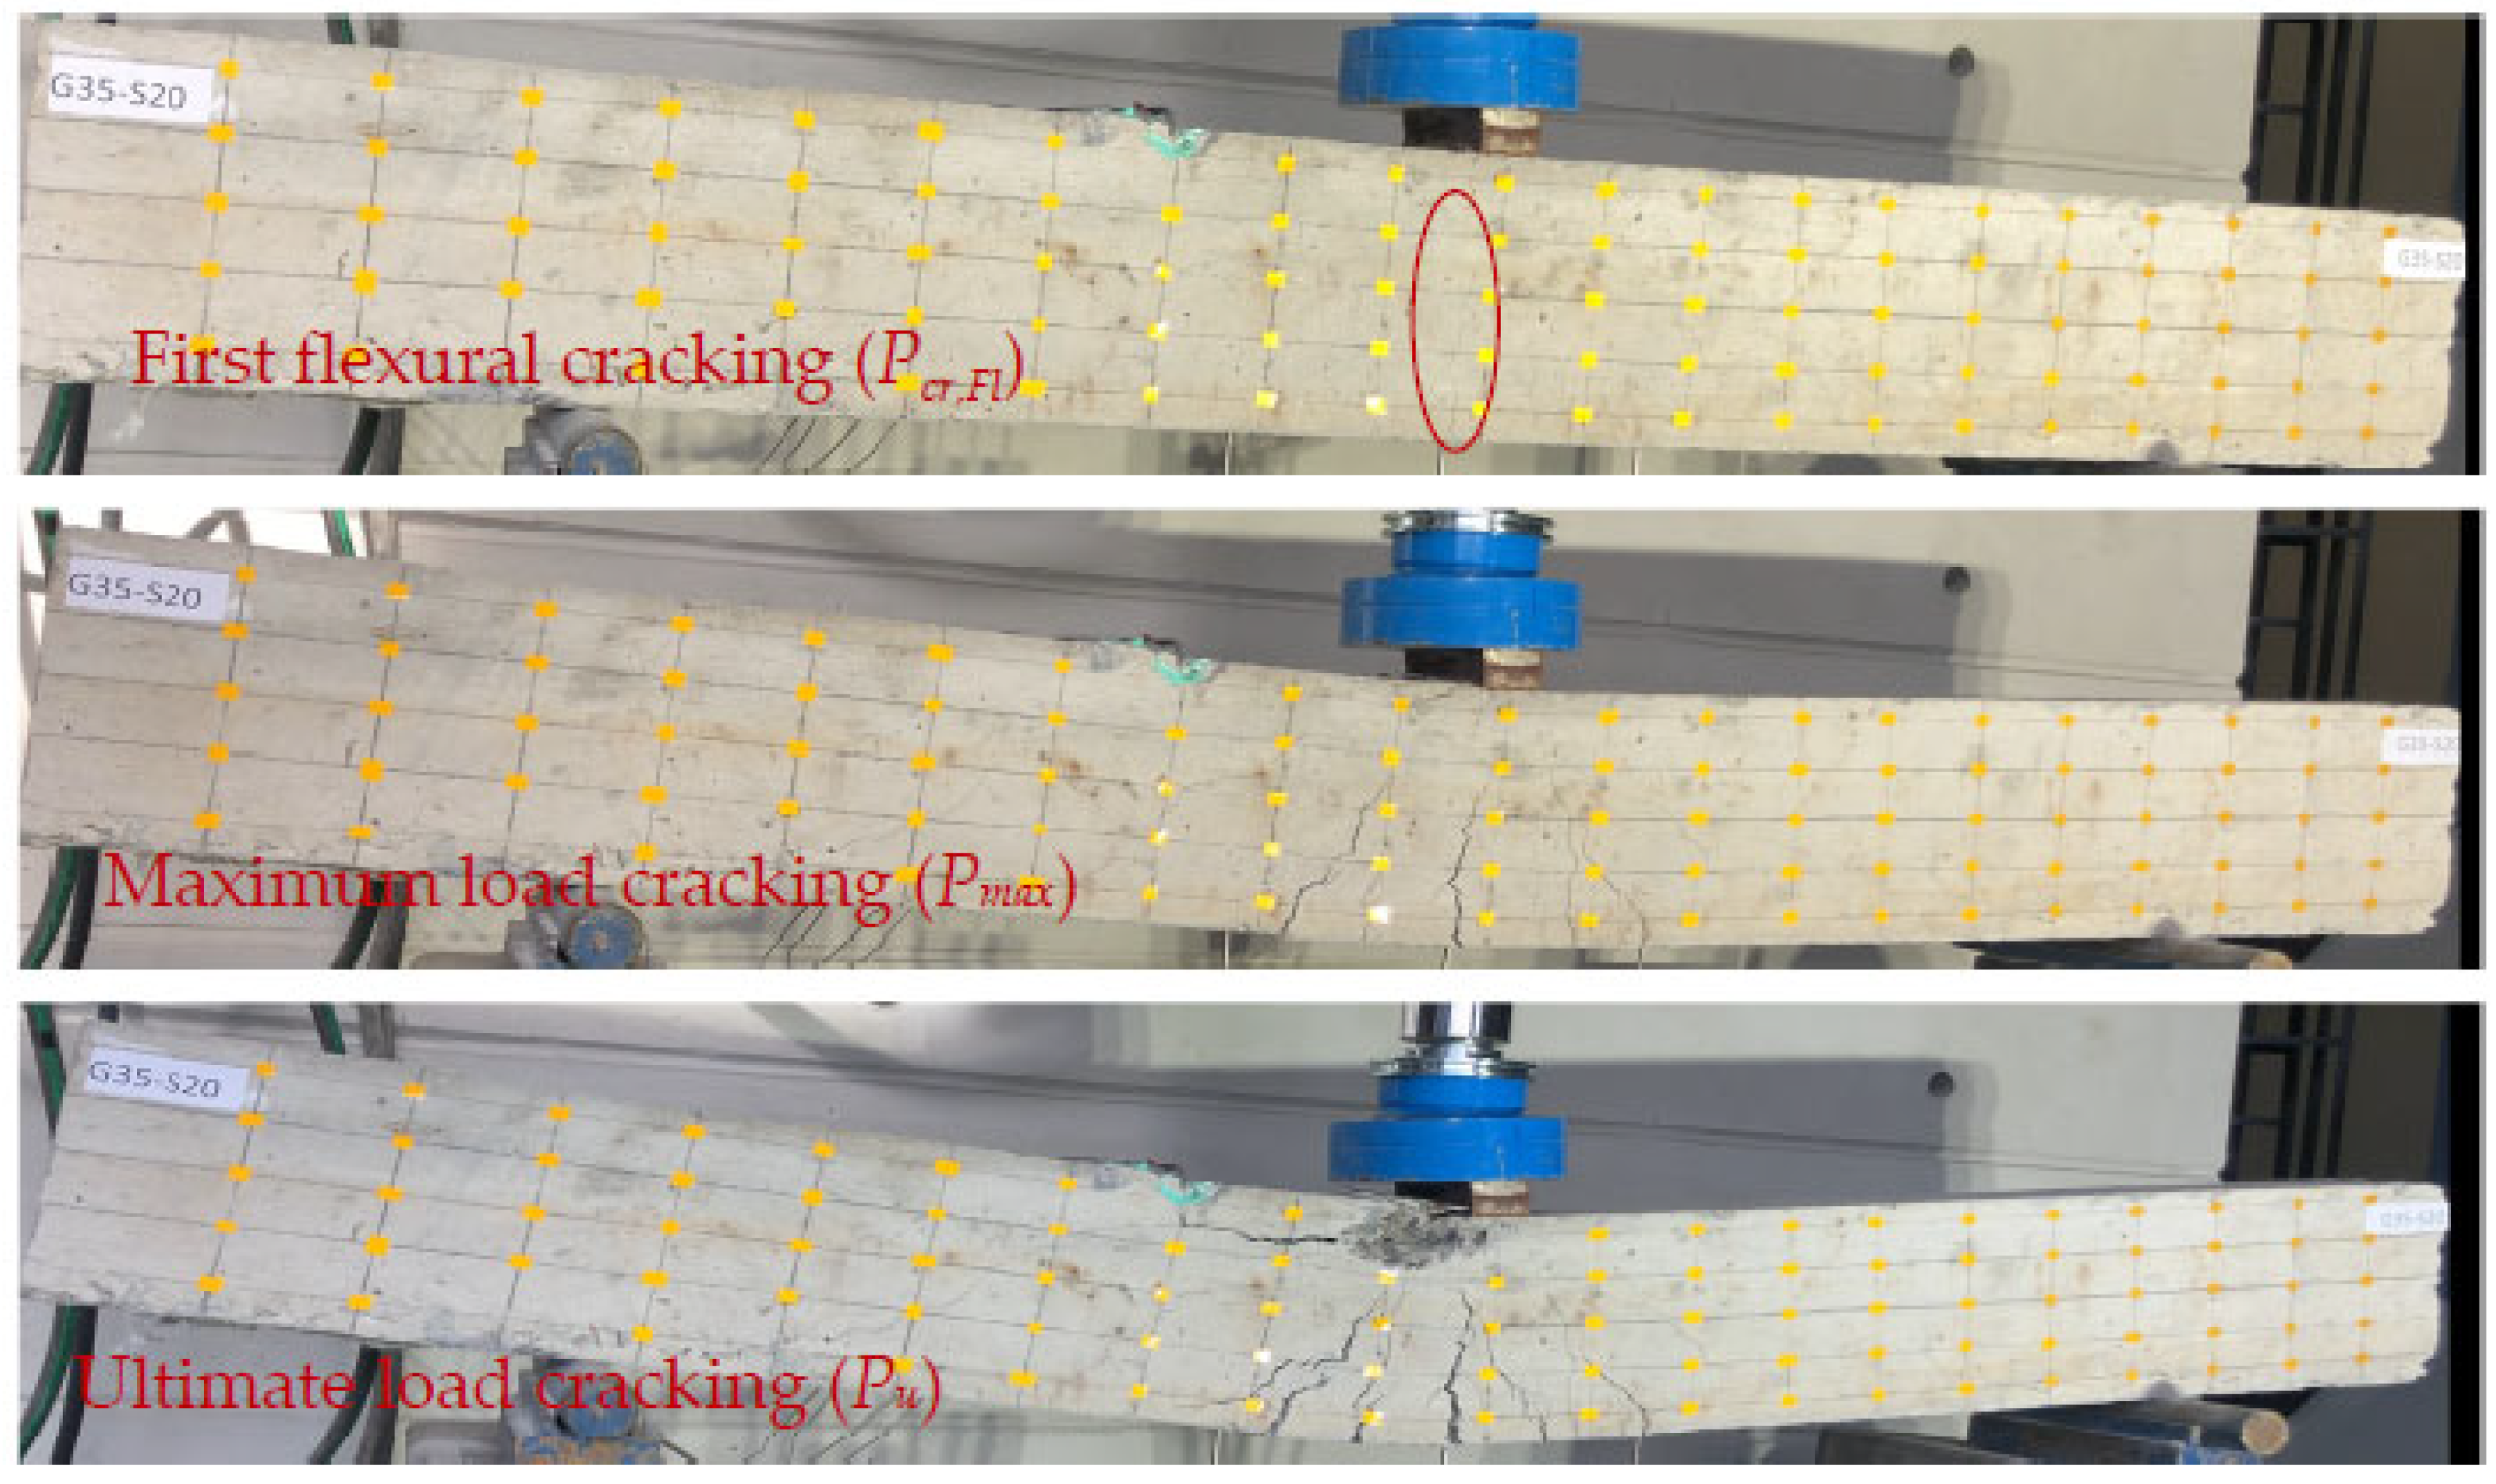
In Figure 5, various load levels with their corresponding crack formations are shown for the G35S20 specimen. First, hairline cracks due to the initial flexural action were observed. Then, more prominent shear-type inclined cracks appeared. As the load approached the maximum load level, cracks were dispersed along the mid span directed toward the load application point. Finally, degradation of the concrete along considerably enlarged cracks was observed for the ultimate load level.
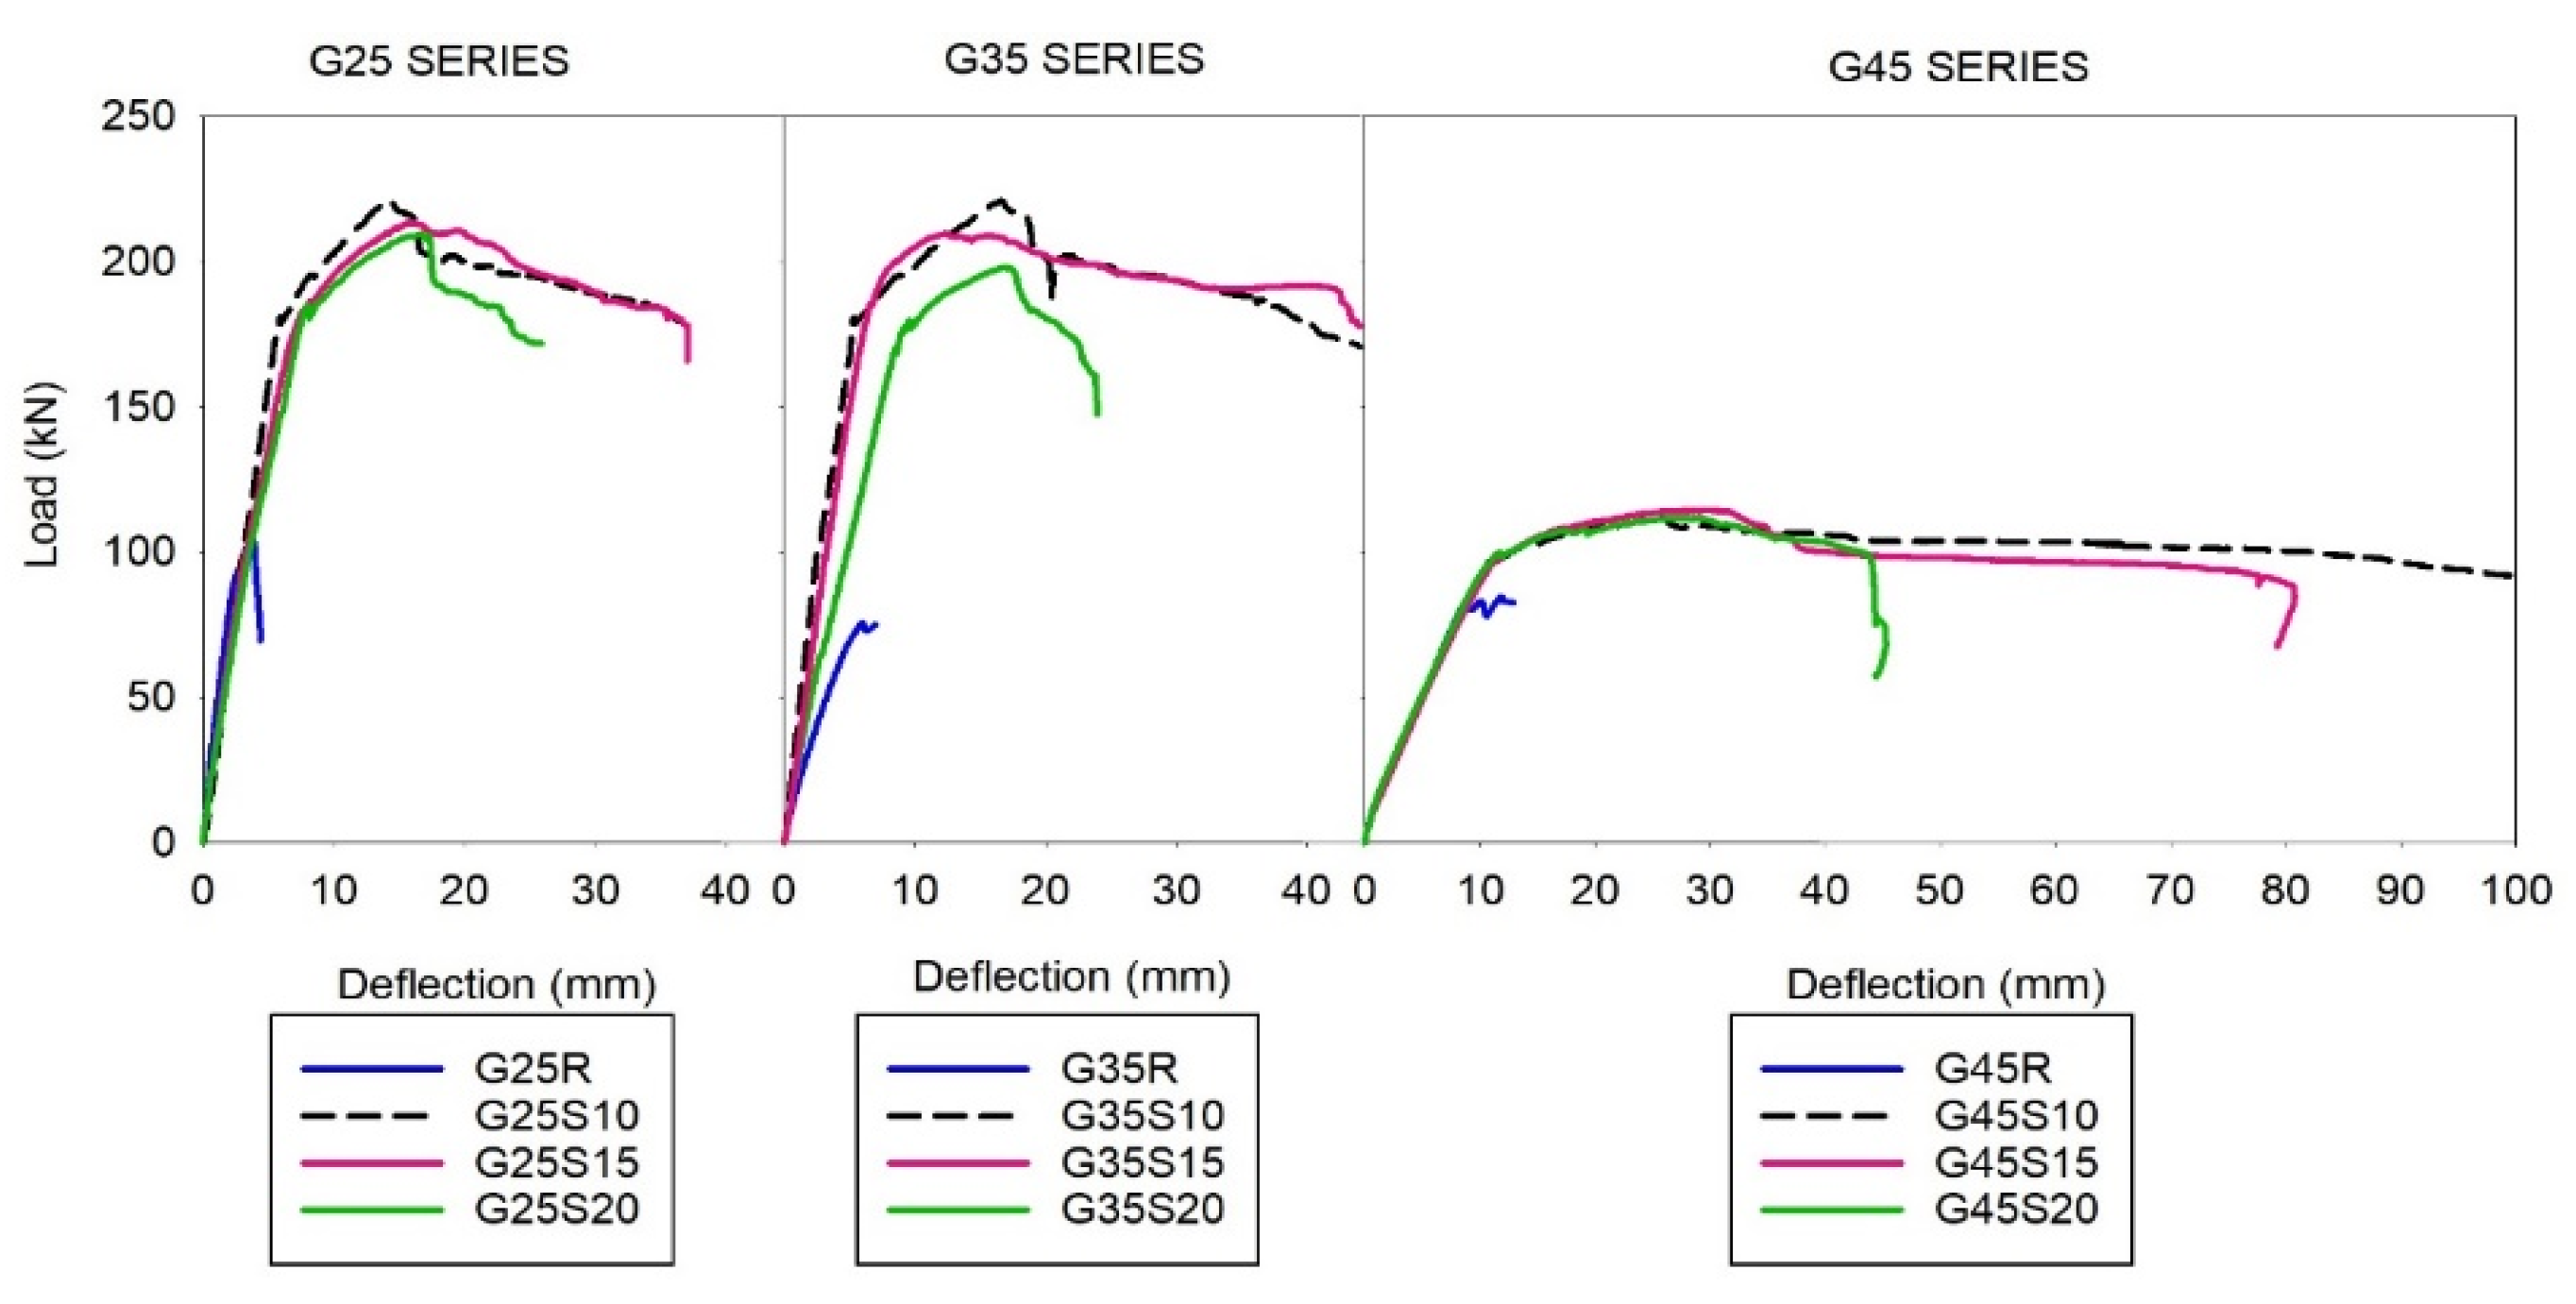
The load–deflection curves of the tested beams are plotted in Figure 6. It can be observed that the load-carrying capacity increased by decreasing a/d. The use of transverse reinforcement significantly improved not only the shear strength but also the ductility of GC beams, as with OPCC.
The combined load–deflection and strain–deflection curves of the tested beams are plotted in Figure 7. It was observed that the tensile reinforcement did not yield in the reference beams (G25R, G35R and G45R), which reached strength loss by pure shear failure. In the G25S20 specimen, it was observed that the transverse reinforcement (S1), which was closest to the load application point, did not yield, while the transverse reinforcement right next to (S1), i.e., (S2), appeared to yield. This was solely because the diagonal crack was arrested by S2 while it barely passed through S1. The longitudinal reinforcement started to yield when the load value reached approximately 120 kN. In the G25S15 specimen, it was observed that all the transverse reinforcements with strain gage (Figure 3—S1, S2 and S3) yielded when the mid-span deflection reached around 20 mm, and the tensile reinforcement started yielding when the load reached 125 kN. In the G25S10 specimen, when the applied load reached 130 kN, yielding was observed in the tensile reinforcement and strain gage (S3). In general, it was observed that when Pmax was reached, almost all crack-arresting transverse reinforcements had already yielded.

4. Evaluation of the Moment Capacities of the Tested Beams

The Mcr value is an indirect measure of the tensile strength of concrete ( f t ) . In practice, the tensile strength has often been predicted based on the compressive strength of OPCC. It is a measure of the maximum stress on the tension face of an unreinforced concrete specimen at the onset of failure in flexure.

4.1. Modulus of Rupture of Concrete

Most commonly, in the standards and in the related literature, the modulus of rupture of concrete ( f r ) is calculated from empirical equations (AS 3600 [29]; ACI 318 [30]; Eurocode 2 [33]; Ahmad and Shah [34]; Swamy [35]). Most of these equations are based on the fc value via statistical methods. Direct tension experiments are relatively scarce. Instead, tension experiments in the form of testing flexural tensile strength have been conducted as well. These tests are well established and are carried out in accordance with standard test methods such as ASTM C78 [44], ASTM C293 [45], ASTM C1018 [46] AS1012 [47] and TS-EN-12390 [48]. Empirical relations based on compressive strength are the most practical, as the compressive strength is almost always readily available or easy to measure. Here, some of the most common of these empirical relations between the flexural tensile and compressive strength of OPCC are given, as they are used later in this paper for cracking moment predictions.
AS 3600 [29] states that the characteristic f r can be calculated from Equation (1):
f r = 0.60 f c
In ACI318 [30], the f r for normal-weight concrete can be found from:
f r = 0.70 f c
ACI 363 [31] states that the characteristic f r can be calculated from Equation (3):
f r = 0.97 f c
In Eurocode 2 [33], the tensile strength is defined as the maximum stress that concrete can withstand when subjected to uniaxial tension and is given as f t = 0.3 f c 2 / 3   . When the value of f r is determined from f t , f r is taken as two times that of f t and can be calculated from Equation (4):
f r = 0.6 f c 2 / 3
Some of the literature suggested alternative forms. Ahmad and Shah [34] expressed an empirical Equation (5) to predict the average value of f r for values of f c of up to 84 MPa based on the available experimental results.
f r = 0.438 f c 2 / 3
For concrete with granite aggregate, a regression analysis by Swamy [35] gave the value of f r based on cube compressive strength ( f c u ) as
f r = 0.92 f c u
Besides OPPC, some relatively recent studies have started to address the same problem for GC. Diaz-Loya et al. [36] studied the mechanical properties of fly-ash-based GC experimentally. The measured values of the static elastic modulus, Poisson’s ratio, compressive strength and flexural strength of GC specimens made from 25 fly ash stockpiles from different sources were recorded and analyzed. It was found that the flexural strength of GC is similar to that of OPCC, and the value of f r expressed for heat-cured fly-ash-based GC can be given as:
f r = 0.69 f c
Some other studies have suggested the usage of a composite composition, including both PC and fly ash, in geopolymer mortar together. Shehab et al. [37] showed that the replacement of cement with fly-ash-based geopolymer improved the mechanical properties of samples. Based on their test results, f r can be calculated for fly-ash-based GC with full and partial cement replacement as:
f r = 1.098 f c
Phoo-ngernkham et al. [38] suggested a composite concrete with adding PC into high-calcium fly-ash-based geopolymer mortar. Enhancements in the compressive strength, modulus of rupture and fracture characteristics were observed. Considering their tests on ambient-cured specimens, they proposed the following equation for f r :
f r = 2.78 f c 13.95
In another study, Nath and Sarker [39] worked on the test data of ambient-cured, blended, low-calcium fly-ash-based GC. They proposed an expression by regression analysis using the least square fit method as:
f r = 0.93 f c

4.2. Flexural Moment

The load at the growth of the first flexural crack is termed as the flexural cracking load. The flexural cracking moment, Mcr, is usually estimated using the modulus of rupture as follows:
  M c r = f r I g y t
Here, I g is the moment of inertia of the gross concrete section and y t is the distance of the extreme tension fiber from the neutral axis. In addition, the nominal flexural strength of the beams (Mn) can be calculated via the standard expressions given in ACI318 [30] and TS500 [32]. Finally, the load value corresponding to this flexural strength value can be defined as the nominal maximum load (Pmax).

4.3. Evaluation of Test Results

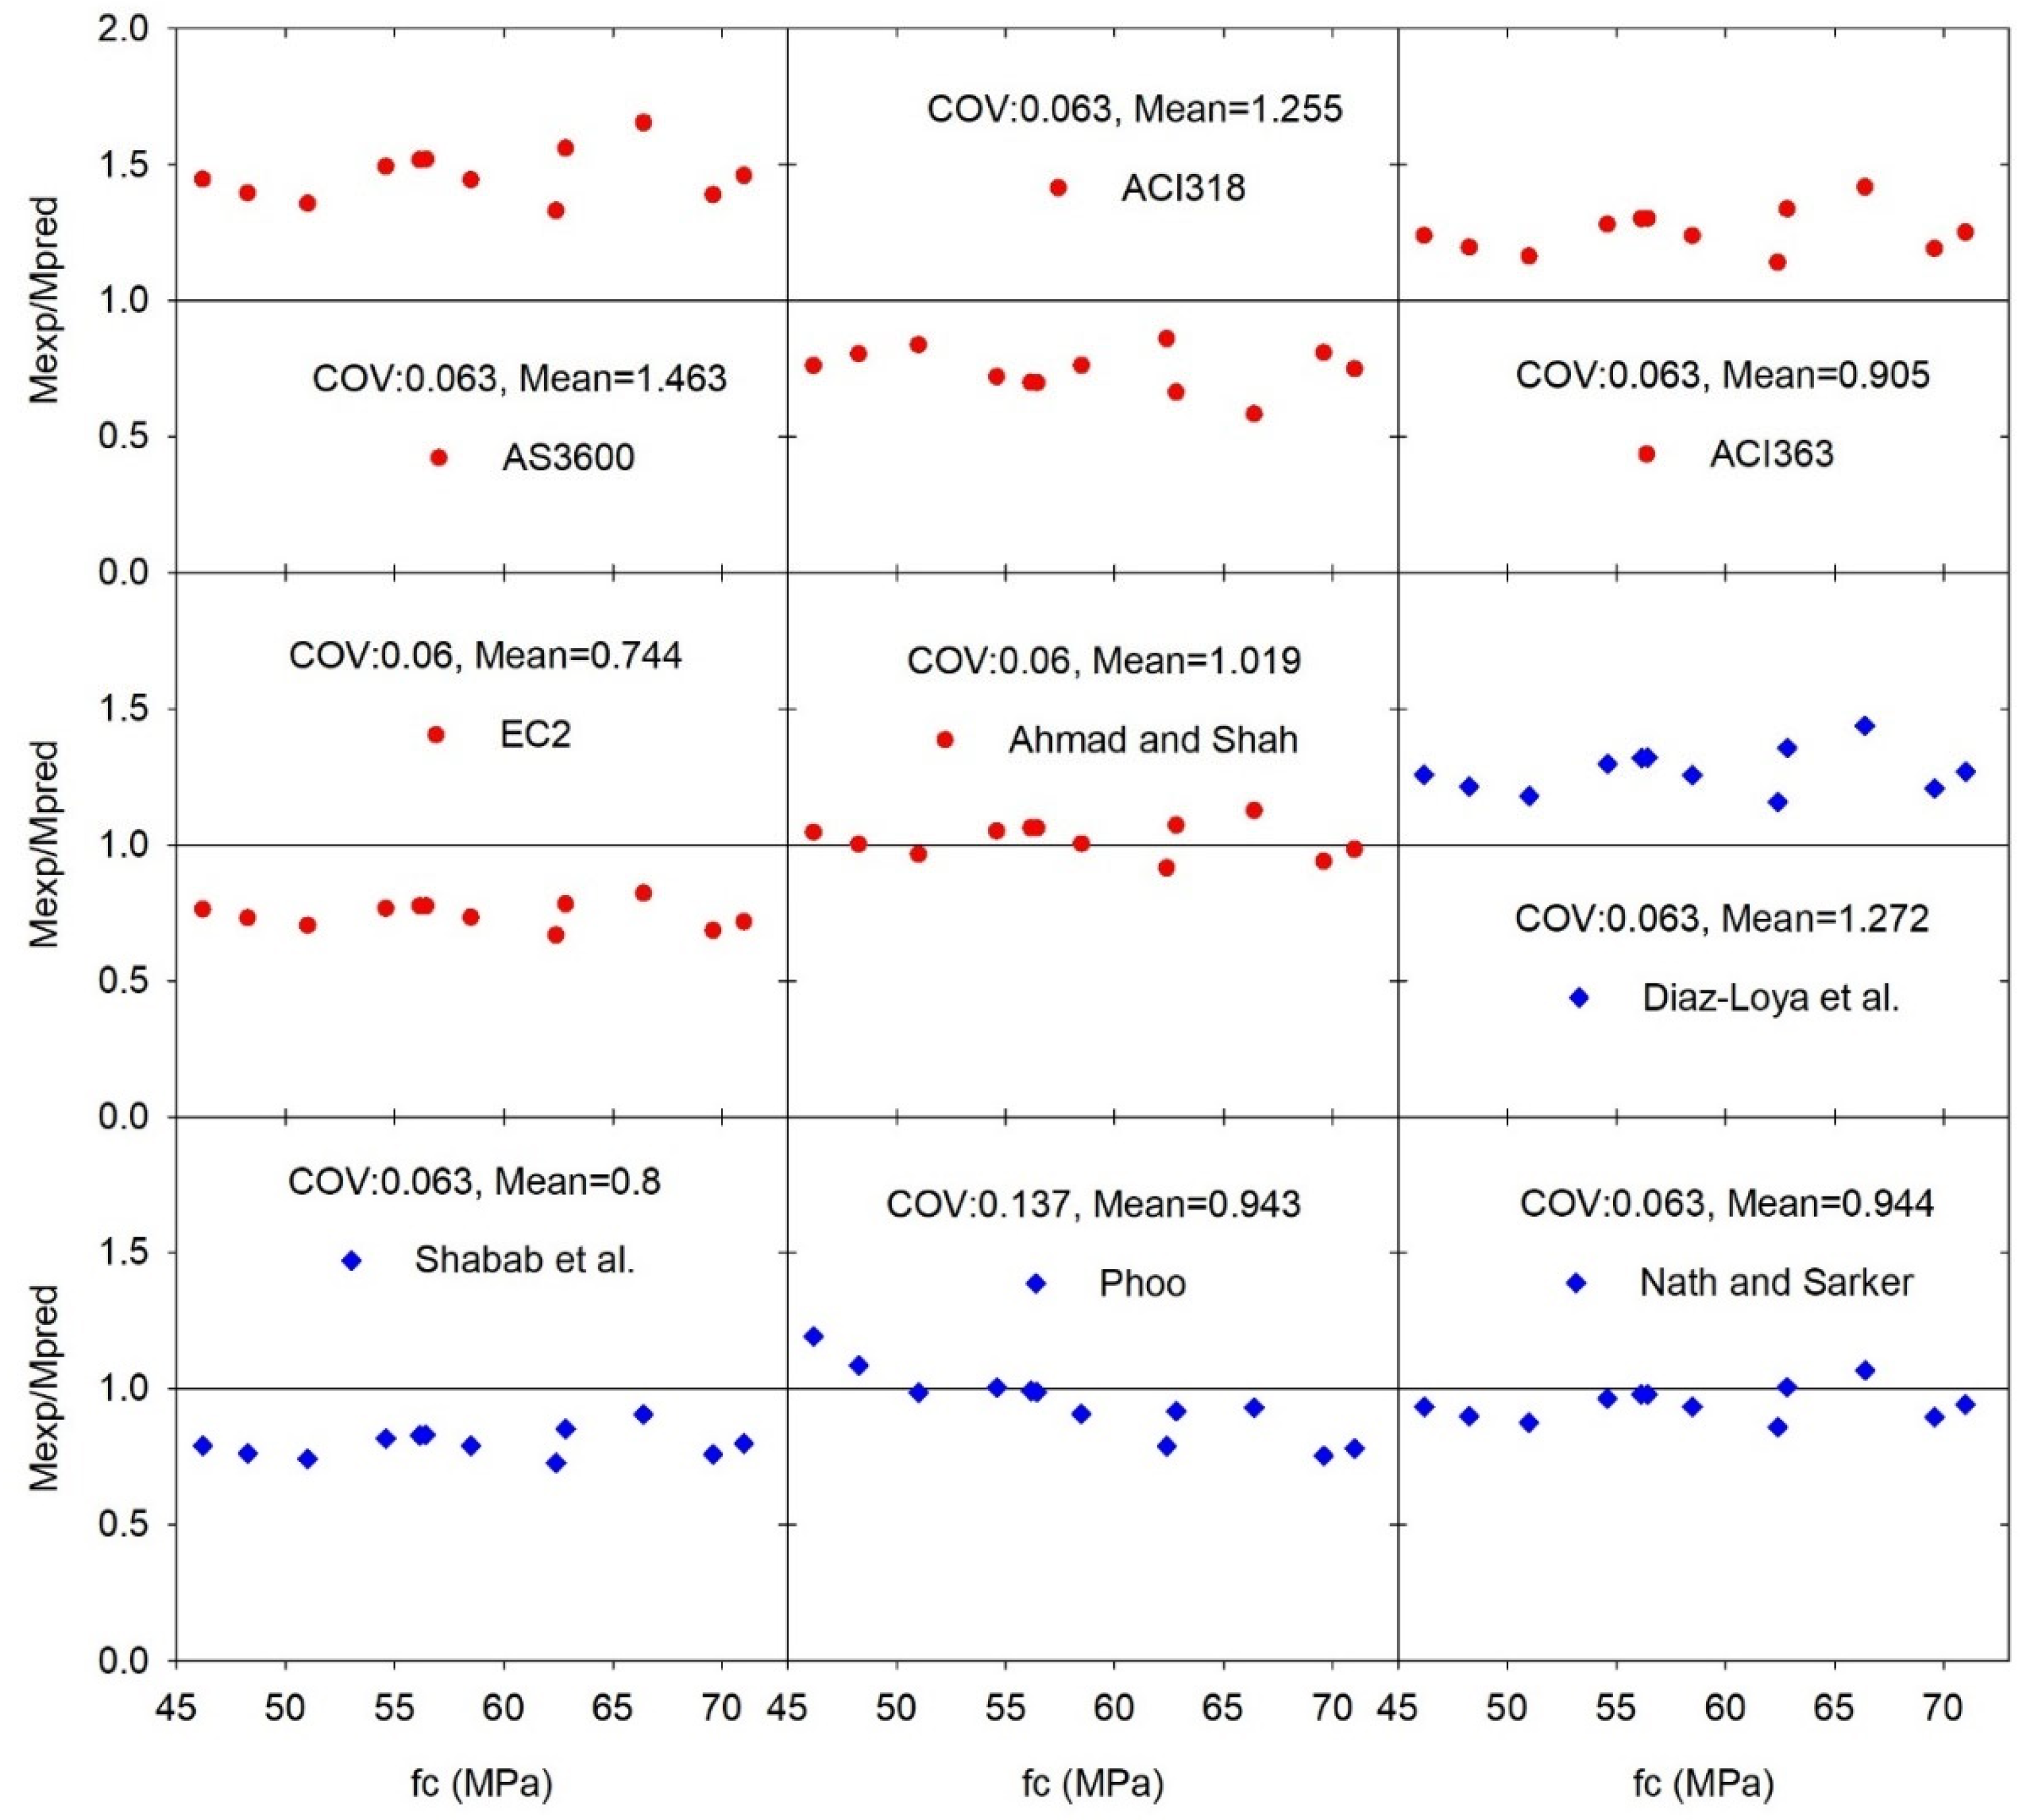
The Mcr was calculated for the tested beams by using the f r values, which in turn were calculated from the given literature in Section 4.1. Table 4 includes the ratios of the experimental cracking moments (Mcr,exp) to the corresponding cracking moments (Mcr,pred) predicted by using different values of f r . Using the equations recommended for OPCC and GC, ACI363 [31] and AS3600 [29], Ahmad and Shah [34] and Diaz-Loya et al. [36] underestimated, on average, the cracking moment by 10%, 46%, 1% and 27%, respectively. However, ACI318 [30], EC2 [33], Shehab et al. [37], Phoo-ngernkham et al. [38] and Nath and Sarker [39] overestimated the cracking moments for the tested beams by around 26%, 26%, 20%, 6% and 6%, respectively. When compared with the experimental results, the equations proposed by EC2 [33] and Ahmad and Shah [34] both had the same lowest COV value of 0.06, as both of them retained the factor f c 2 / 3 in their respective expressions. Only the constant in front of f c 2 / 3 differed from one to other. This was expected, as the COV values were obtained by normalizing the standard variations with the averages. Swamy [35] produced almost the same (up to four digits) COV value with respect to those of EC2 and Ahmad and Shah [34]. Similarly, ACI363 [31], ACI318 [30], AS3600 [29], Diaz-Loya et al. [36], Shebab et al. [37] and Nath and Sarker [39], all of whom had a factor of f c in their expressions, had the exact same COV value of 0.063. Only Phoo-ngernkham et al. [38] produced a noticeably higher COV value of 0.136. It can be seen from Figure 8 that, from a statistical performance perspective, Ahmad and Shah [34] had the best predictions, as their expression produced the lowest COV and an average value (Mcr,exp/Mcr,pred) of 1.019. This was slightly higher than 1. Since some of their predictions overestimated the corresponding test value, from a design perspective, Diaz-Loya et al. [36], with their COV value of 0.063 and an average ratio of 1.298, would be safer. Since Diaz-Loya et al. [36] consistently underestimated (Figure 8) with a similar COV value, it can be concluded that their expression can used with confidence.
Mn was calculated in this experiment based on the ACI318 [30] and TS500 [32] predictions for beams in flexural failure (Table 5). The nominal failure moment values proposed by ACI318 [30] and TS500 [32] for OPCC consistently underestimated the experimental values on average by 25% and 30%, respectively. Both codes had a similar predictive performance, as indicated by their similar COV and mean values (Table 5). It was seen that as the a/d and transverse reinforcement ratios increased, the predictions given in Table 5 came closer to the experimental values. This was mainly because the failure mode shifted to the pure bending region where the codes were intended for. Nevertheless, it is obvious that more experimental work is required for better results on the nominal moment capacity prediction of GC beams in flexural failure.

5. Conclusions

The behavior of beams made of GBSF-based GC with an optimum alkali activator ratio was evaluated experimentally in terms of consistency and strength. The Mcr, Exp values of beams were compared with the corresponding moments calculated by using different approaches. The following conclusions were drawn from this work:
The tests indicated similar, classical behaviors for the GC beams as those seen in beams made from OPCC. For the beams with transverse reinforcement (S series), as the value of a/d increased and/or the transverse reinforcement ratio decreased, the peak load decreased. For a/d = 4.5 and a/d = 3.5 (G45S and G35S series), no matter the transverse reinforcement ratio, the failure modes were exclusively flexural. As the value of a/d increased, the failure mode shifted from shear to flexural, and the ductility increased. Apart from discrepancies stemming from the slightly different compressive strengths, all the observations were as expected, revealing similar characteristics to the behavior of OPCC beams.
The experimental cracking moments, Mcr, Exp, were compared with the corresponding moments calculated by using different approaches for the modulus of rupture. Using the f r equations recommended for OPCC, ACI363 [31] and AS3600 [29] underestimated and EC2 [33] and ACI318 [30] overestimated the cracking moments for the tested beams. Using the equations recommended for GC, Diaz-Loya et al. [36] underestimated the cracking moment for the tested beams while Shehab et al. [37], Phoo-ngernkham et al. [38] and Nath and Sarker [39] overestimated the cracking moment.
For OPCC, cracking moment comparisons with the experimental results indicated similar values for COV (≈0.06) obtained by the equations from ACI318 [30], ACI363 [31], AS3600 [29], EC2 [33], Swamy [35] and Ahmad and Shah [34]. Moreover, some of the COV values were exactly the same, as the proposed equations for f r were similar in form. This was expected, since the evaluation of COV (ratio of standard variance to the average) includes a normalization. The equation from Phoo-ngernkham et al. [38] performed relatively poorly, giving a COV value of 0.137, which was noticeably higher.
From a statistical viewpoint, Ahmad and Shah [34], with a COV value of 0.06 and a mean value of 1.019 for Mcr,exp./Mcr,pred, seemed favorable. However, scattering (Figure 8) indicated that Diaz-Loya et al. [36], with a mean value of 1.273 for Mcr,exp./Mcr,pred and a comparable COV value, fared better from a design viewpoint since it was consistently on the safe side.
Comparing the experimental nominal moment values with predictions from ACI 318 [30] and TS500 [32] for OPCC, it was seen that both predictions underestimated the experimental values. However, it was also observed that as the value of a/d increased (failure in flexural mode), the predictions became better. This can be easily attributed to the fact that nominal moment capacity calculations in the codes were intended for bending in the first place.
Finally, it can be stated that GC specimens performed similarly in terms of characteristics to OPCC in beam form; nevertheless, more experimental work is required for establishing quantitative evaluations for GC specimens, such as those that exist for beams made of OPCC and their dedicated predictions. As the formation of codes for OPCC material and the behavior of structural members made of this material required a considerable amount of research spanning many years, as a new material, GC, would also require a similar developmental process. This study intended to be a contribution to this cause. In this way, OPCC would face a strong candidate with equal establishment and confidence in terms of structural performance. Nevertheless, limitations stemming from a manufacturing viewpoint should also be addressed as well. Because of the lack of any consensus on the manufacturing methodology, the resulting material could suffer in terms of consistency and workability. These issues should also be clearly addressed and standardized for the prevalence of GC in the construction industry as a strong alternative with a much lower threat to the environment.

Author Contributions

Conceptualization, M.O. and G.A.; methodology, M.O.; validation, M.O. and G.A.; investigation, M.O.; data curation, G.A.; writing—original draft preparation, M.O. and G.A.; writing—review and editing, G.A.; supervision, G.A. All authors have read and agreed to the published version of the manuscript.

Funding

This work was supported by the Research Fund of the Yıldız Technical University, grant number FDK-2020-3820.

Data Availability Statement

The data presented in this study are available on request from the corresponding author. The data are not publicly available, as the data also forms part of an ongoing study.

Conflicts of Interest

The authors declare no conflict of interest.

References

  1. Maholtra, V. Introduction: Sustainable development and concrete technology. ACI Concr. Int. 2002, 24, 22. [Google Scholar]
  2. Huntzinger, D.N.; Eatmon, T.D. A life-cycle assessment of Portland cement manufacturing: Comparing the traditional process with alternative technologies. J. Clean. Prod. 2009, 17, 668–675. [Google Scholar] [CrossRef]
  3. Meyer, C. The greening of the concrete industry. Cem. Concr. Compos. 2009, 31, 601–605. [Google Scholar] [CrossRef]
  4. Davidovits, J. False Values on CO2 Emission for Geopolymer Cement/Concrete; Technical Paper No. 24; Scientific Papers; Geopolymer Institute Library: Saint-Quentin, France, 2015; pp. 1–9. [Google Scholar]
  5. Flower, D.J.M.; Sanjayan, J.G. Greenhouse gas emissions due to concrete manufacture. Int. J. Life Cycle Assess. 2007, 12, 282–288. [Google Scholar] [CrossRef]
  6. Ulugöl, H.; Kul, A.; Yıldırım, G.; Şahmaran, M.; Aldemir, A.; Figueira, D.; Ashour, A. Mechanical and microstructural characterization of geopolymers from assorted construction and demolition waste-based masonry and glass. J. Clean. Prod. 2021, 280, 124358. [Google Scholar] [CrossRef]
  7. Zhuang, X.Y.; Chen, L.; Komarneni, S.; Zhou, C.H.; Tong, D.S.; Yang, H.M.; Yu, W.H.; Wang, H. Fly ash-based geopolymer: Clean production, properties and applications. J. Clean. Prod. 2016, 125, 253–267. [Google Scholar] [CrossRef]
  8. Wu, Y.; Zhou, Y. Hybrid machine learning model and Shapley additive explanations for compressive strength of sustainable concrete. Constr. Build. Mater. 2022, 330, 127298. [Google Scholar] [CrossRef]
  9. Antiohos, S.K.; Tapali, J.G.; Zervaki, M.; Sousa-Coutinho, J.; Tsimas, S.; Papadakis, V.G. Low embodied energy cement containing untreated RHA: A strength development and durability study. Constr. Build. Mater. 2013, 49, 455–463. [Google Scholar] [CrossRef]
  10. Oakes, L.; Magee, B.; McIlhagger, A.; McCartney, M. Strength prediction and mix design procedures for geopolymer and alkali-activated cement mortars comprising a wide range of environmentally responsible binder systems. J. Struct. Integr. Maint. 2019, 4, 135–143. [Google Scholar] [CrossRef]
  11. Juenger, M.C.G.; Winnefeld, F.; Provis, J.L.; Ideker, J.H. Advances in alternative cementitious binders. Cem. Concr. Res. 2011, 41, 1232–1243. [Google Scholar] [CrossRef]
  12. Tian Sing, N.G.; Voo, Y.L.; Foster, S.J. Sustainability with Ultra-High Performance and Geopolymer Concrete Construction. In Innovative Materials and Techniques in Concrete Construction; Springer: Dordrecht, The Netherlands, 2012; pp. 81–100. [Google Scholar] [CrossRef]
  13. Hassan, A.; Arif, M.; Shariq, M. Use of geopolymer concrete for a cleaner and sustainable environment–A review of mechanical properties and microstructure. J. Clean. Prod. 2019, 223, 704–728. [Google Scholar] [CrossRef]
  14. Davidovits, J. Geopolymers: Inorganic polymeric new materials. J. Therm. Anal. Calorim. 1991, 37, 1633–1656. [Google Scholar] [CrossRef]
  15. Aydın, S.; Baradan, B. Mechanical and microstructural properties of heat cured alkali-activated slag mortars. Mater. Des. 2012, 35, 374–383. [Google Scholar] [CrossRef]
  16. Wu, Y.; Zhou, Y. Splitting tensile strength prediction of sustainable high-performance concrete using machine learning techniques. Environ. Sci. Pollut. Res. 2022, 29, 89198–89209. [Google Scholar] [CrossRef]
  17. Van Jaarsveld, J.G.S.; van Deventer, J.S.J.; Lorenzen, L. The potential use of geopolymeric materials to immobilise toxic metals: Part I. Theory and applications. Miner. Eng. 1997, 10, 659–669. [Google Scholar] [CrossRef]
  18. Komnitsas, K.; Zaharaki, D. Geopolymerisation: A review and prospects for the minerals industry. Miner. Eng. 2007, 20, 1261–1277. [Google Scholar] [CrossRef]
  19. Fernández-Jiménez, A.; Garcia-Lodeiro, I.; Palomo, A. Durability of alkali-activated fly ash cementitious materials. J. Mater. Sci. 2007, 42, 3055–3065. [Google Scholar] [CrossRef]
  20. Feng, K.N.; Ruan, D.; Pan, Z.; Collins, F.; Bai, Y.; Wang, C.M.; Duan, W.H. Effect of strain rate on splitting tensile strength of geopolymer concrete. Mag. Concr. Res. 2014, 66, 825–835. [Google Scholar] [CrossRef]
  21. Lee, K.M.; Choi, S.; Choo, J.F.; Choi, Y.C.; Yoo, S.W. Flexural and Shear Behaviors of Reinforced Alkali-Activated Slag Concrete Beams. Adv. Mater. Sci. Eng. 2017, 2017, 5294290. [Google Scholar] [CrossRef] [Green Version]
  22. Kumaravel, S.; Thirugnanasambandam, S. Flexural behaviour of geopolymer concrete beams. Int. J. Adv. Eng. Res. Stud. 2013, 4, 06. [Google Scholar]
  23. Chang, E.H. Shear and Bond Behavior of Reinforced Fly Ash-Based Geopolymer Concrete Beams. Ph.D. Thesis, Department of Civil Engineering, Curtin University of Technology, Bentley, Australia, 2009. Available online: http://hdl.handle.net/20.500.11937/468 (accessed on 30 January 2009).
  24. Yacob, N.S.; ElGawady, M.A.; Sneed, L.H.; Said, A. Shear strength of fly ash-based geopolymer reinforced concrete beams. Eng. Struct. 2019, 196, 109298. [Google Scholar] [CrossRef]
  25. Sanni, S.H. Analytical Modelling and Experimental Validation of Balanced Reinforced Geopolymer Concrete Beams. I-Manag. J. Struct. Eng. 2021, 10, 31–39. [Google Scholar] [CrossRef]
  26. Wu, C.; Hwang, H.J.; Shi, C.; Li, N.; Du, Y. Shear tests on reinforced slag-based geopolymer concrete beams with transverse reinforcement. Eng. Struct. 2020, 219, 110966. [Google Scholar] [CrossRef]
  27. Madheswaran, C.K.; Ambily, P.S.; Lakshmanan, N.; Dattatreya, J.K.; Sathik, S.A. Shear Behavior of Reinforced Geopolymer Concrete Thin-Webbed T-Beams. ACI Mater. J. 2014, 111, 89. [Google Scholar]
  28. ACI 318; Building Code Requirements for Structural Concrete (ACI 318-08) and Commentary. ACI: Farmington Hills, MI, USA, 2008; p. 473.
  29. AS-3600; Concrete Structures. Standards Australia International: Sydney, Australia, 2009.
  30. ACI 318-19; Building Code Requirements for Structural Concrete and Commentary. ACI: Farmington Hills, MI, USA, 2019.
  31. ACI 363; State of the Art Report on High Strength Concrete. ACI363-R. ACI: Farmington Hills, MI, USA, 1992.
  32. TS500; Requirements for Design and Construction of Reinforced Concrete Structures. Turkish Standards Institute: Ankara, Turkey, 2000; p. 67. (In Turkish)
  33. Eurocode 2 ENV 1992-1-1; Design of Concrete Structures, Part 1: General Rules and Rules for Buildings. British Standards Institution: London, UK, 1992.
  34. Ahmad, S.H.; Shah, S.P. Structural properties of high strength concrete and its implications for precast prestressed concrete. PCI J. 1985, 30, 92–119. [Google Scholar]
  35. Swamy, R.N. Properties of high-strength concrete. Cem. Concr. Aggreg. CCAGDP 1986, 8, 33–41. [Google Scholar]
  36. Diaz-Loya, E.I.; Allouche, E.N.; Vaidya, S. Mechanical properties of fly-ash-based geopolymer concrete. ACI Mater. J. 2011, 108, 300–306. [Google Scholar]
  37. Shehab, H.K.; Eisa, A.S.; Wahba, A.M. Mechanical properties of fly ash based geopolymer concrete with full and partial cement replacement. Constr. Build. Mater. 2016, 126, 560–565. [Google Scholar] [CrossRef]
  38. Phoo-ngernkham, T.; Sata, V.; Hanjitsuwan, S.; Ridtirud, C.; Hatanaka, S.; Chindaprasirt, P. Compressive strength, bending and fracture characteristics of high calcium fly ash geopolymer mortar containing portland cement cured at ambient temperature. Arab. J. Sci. Eng. 2016, 41, 1263–1271. [Google Scholar] [CrossRef]
  39. Nath, P.; Sarker, P.K. Flexural strength and elastic modulus of ambient-cured blended low-calcium fly ash geopolymer concrete. Constr. Build. Mater. 2017, 130, 22–31. [Google Scholar] [CrossRef] [Green Version]
  40. Xu, H.; Van Deventer, J.S.J. The geopolymerisation of alumino-silicate minerals. Int. J. Miner. Process. 2000, 59, 247–266. [Google Scholar] [CrossRef] [Green Version]
  41. Skorina, T. Ion exchange in amorphous alkali-activated aluminosilicates: Potassium based geopolymers. Appl. Clay Sci. 2014, 87, 205–211. [Google Scholar] [CrossRef]
  42. Shehata, N.; Sayed, E.T.; Abdelkareem, M.A. Recent progress in environmentally friendly geopolymers: A review. Sci. Total Environ. 2021, 762, 143166. [Google Scholar] [CrossRef]
  43. Ozturk, M.; Arslan, G. Shear Behavior of Granulated Blast Furnace Slag-Based Geopolymer-Reinforced Concrete Beams. Buildings 2022, 12, 2053. [Google Scholar] [CrossRef]
  44. ASTM C78; Test Method for Flexural Strength of Concrete Using Simple Beam with Third-Point Loading. In Annual Book of ASTM Standards . ASTM: West Conshohocken, PA, USA, 1988.
  45. ASTM C293; Standard Test Method for Flexural Strength of Concrete (Using Simple Beam with Center-Point Loading). In Annual Book of ASTM Standards. ASTM: West Conshohocken, PA, USA, 2004.
  46. ASTM C1018; Standard Test Method for Flexural Toughness and Firstcrack Strength of Fiber-Reinforced Concrete (Using Beam with Third-Point Loading). ASTM International: West Conshohocken, PA, USA, 1997.
  47. AS 1012, 10-2000; Australian: Methods of Testing Concrete-Method for the Determination of Indirect Tensile Strength of Concrete Cylinders (Brasil or Splitting Test). Standards Australia: Sydney, Australia, 2000.
  48. TS EN 12390-3; Testing Hardened Concrete-Part 3: Compressive Strength of Test Specimen. Turkish Standards Institute: Ankara, Turkey, 2019. (In Turkish)
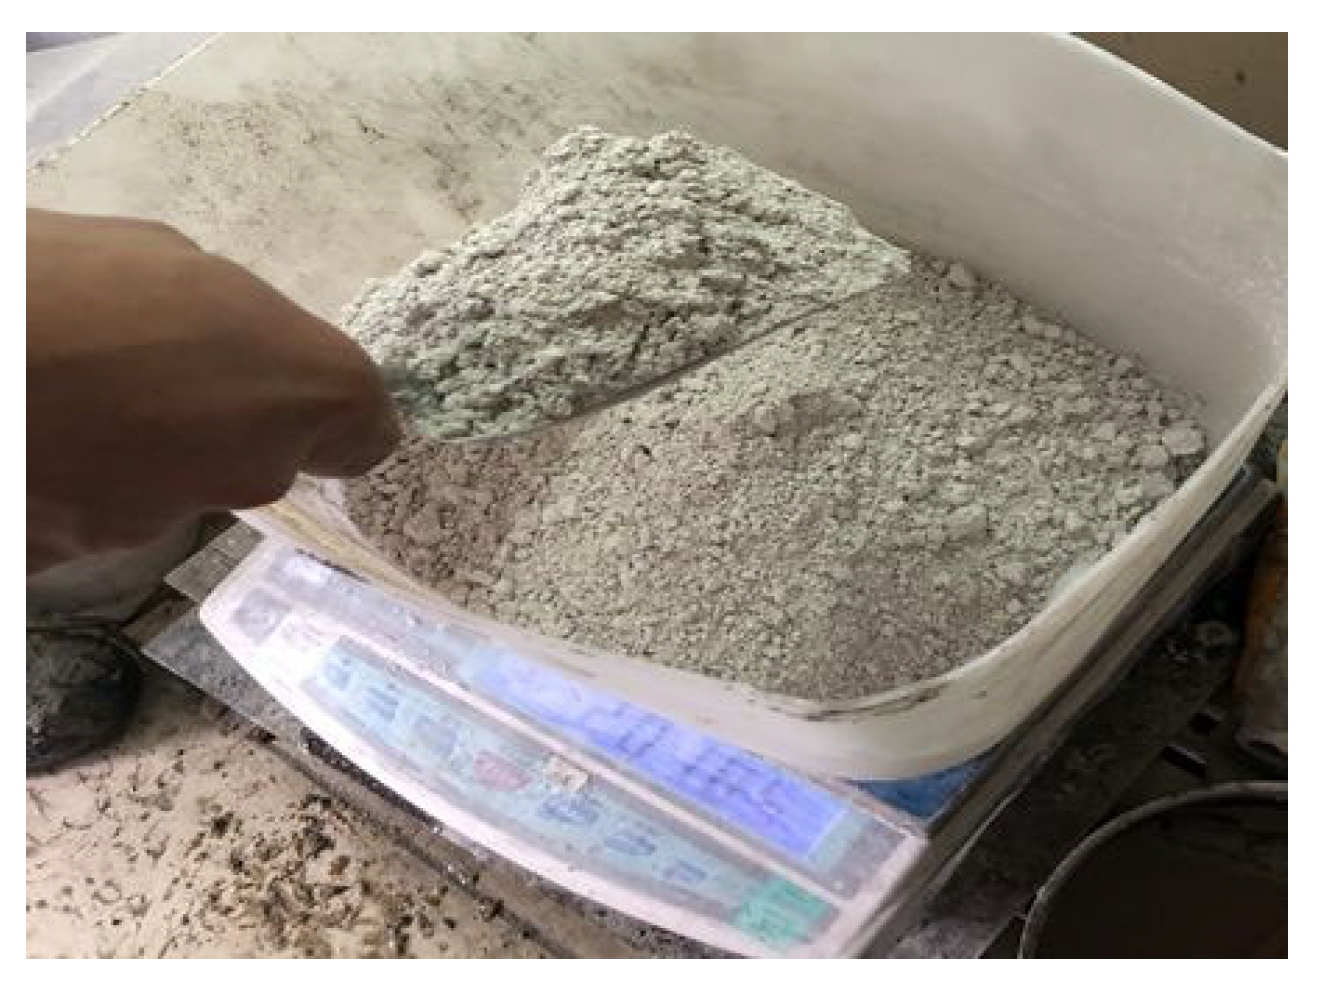
Figure 1. Granulated blast furnace slag.
Buildings 13 00141 g001
Figure 2. Fabricating of GC beams.
Buildings 13 00141 g002
Figure 3. Test set-up and reinforcement configuration.
Buildings 13 00141 g003
Figure 4. Crack pattern and failure modes. (a) G35S10, (b) G35S15, (c) G35S20, (d) G45S10, (e) G45S15 and (f) G45S20.
Buildings 13 00141 g004
Figure 5. Pcr, Pmax and Pu stages for G35S20.
Buildings 13 00141 g005
Figure 6. Load–deflection curves.
Buildings 13 00141 g006
Figure 7. Load–deflection and strain–deflection curves.
Buildings 13 00141 g007
Figure 8. Scattering of Mcr,Exp./Mcr,pred values.
Buildings 13 00141 g008
Table 1. The specific amount of the materials.
MaterialAmount (kg/m3)
GBFS450
NaOH solution102
Na2SiO3 solution234
Superplasticizer4.5
Naturel sand (0–2 mm)322
Crushed sand (0–4 mm)458
Crushed stone (5–13 mm)804
Table 2. Properties of beams.
BeamsBeamfc
(MPa)
s
(mm)
ρw
(%)
L
(mm)
a
(mm)
a/d
G25R #
G25S10 #
G25S15 #
G25S20 #
G25R #56.43--14005252.5
G25S10 #69.581000.67
G25S15 #58.491500.45
G25S20 #62.832000.34
G35R #
G35S10
G35S15
G35S20
G35R #48.26--22007353.5
G35S1046.181000.67
G35S1551.011500.45
G35S2054.582000.34
G45R #
G45S10
G45S15
G45S20
G45R #62.39--22009454.5
G45S1071.001000.67
G45S1566.401500.45
G45S2056.142000.34
# Ozturk and Arslan [43].
Table 3. Critical loads and deflections of beams.
BeamsPcr,Fl
(kN)
Pcr
(kN)
Pmax
(kN)
Pmax
(mm)
Pu
(kN)
u
(mm)
Failure Mode
G25R #37.5570.20103.903.8269.584.36S *
G25S10 #38.1569.20221.0616.66178.9039.62S-F **
G25S15 #36.3665.52213.4316.04165.9937.00S *
G25S20 #40.6972.68209.0115.78171.8625.84S *
G35R #22.7950.1675.745.9874.926.98S *
G35S1023.1047.70221.0516.58170.5244.34F &
G35S1522.7856.71209.6612.36147.4823.96F &
G35S2025.9359.58197.0617.5165.2946.62F &
G45R #19.2163.4782.5612.0282.5612.02S *
G45S1022.4968.59111.5425.5788.29103.24F &
G45S1524.6466.74114.3828.2468.6979.30F &
G45S2020.7962.03111.7128.9458.0144.40F &
* S: shear; & F: flexural; ** S-F: shear–flexural; # Ozturk and Arslan [43].
Table 4. Comparison of experimental-to-predicted cracking moment ratios (Mcr,exp/Mcr,pred).
BeamAS3600 [29]ACI318 [30]ACI363 [31]EC2
[33]
Ahmad and Shah [34]Swamy [35]Diaz-Loya et al. [36]Shehab et al. [37]Phoo-ngernkham et al. [38]Nath and Sarker [39]
G25R1.5191.3020.9390.7751.0621.0691.3210.8300.9870.980
G25S101.3891.1910.8590.6850.9390.9631.2080.7590.7530.896
G25S151.4441.2380.8930.7331.0041.0141.2560.7890.9070.932
G25S201.5601.3370.9650.7821.0721.0891.3560.8520.9171.006
G35R1.3951.1960.8630.7311.0020.9961.2130.7631.0850.900
G35S101.4461.2390.8940.7631.0461.0371.2570.7901.1930.933
G35S151.3571.1630.8390.7040.9650.9641.1800.7410.9850.875
G35S201.4931.2800.9230.7661.0501.0541.2980.8161.0040.963
G45R1.3301.1400.8230.6680.9150.9291.1570.7270.7870.858
G45S101.4601.2510.9030.7170.9831.0111.2690.7980.7790.942
G45S151.6541.4171.0230.8221.1261.1501.4380.9040.9291.067
G45S201.5171.3010.9390.7751.0621.0691.3190.8290.9920.979
MV1.4641.2550.9050.7441.0191.0291.2730.8010.9430.944
SD0.0920.0790.0570.0450.0620.0620.0800.0500.1290.059
COV0.0630.0630.0630.0600.0600.0600.0630.0630.1360.063
Table 5. Comparison of nominal moment predictions.
BeamsMExp. (kNm)Mn,ACI (kNm)Mn, TS (kNm)MExp./Mn,ACIMExp./Mn,TS500
G35S1081.2443.5040.901.8681.986
G35S1577.0545.0042.101.7121.830
G35S2072.4245.9042.801.5781.692
G45S1052.7049.8047.401.0581.112
G45S1554.0448.7045.801.1101.180
G45S2052.7846.3043.101.1401.225
MV0.7460.701
SD0.1810.173
COV0.2430.247
Disclaimer/Publisher’s Note: The statements, opinions and data contained in all publications are solely those of the individual author(s) and contributor(s) and not of MDPI and/or the editor(s). MDPI and/or the editor(s) disclaim responsibility for any injury to people or property resulting from any ideas, methods, instructions or products referred to in the content.