Abstract
Severe damage or collapse of reinforced concrete dapped-end beams (RC-DEBs) may occur during the service life. The collapse of the Concorde overpass structure in Laval, Quebec, Canada, in 2006 revealed the causes of collapse, i.e., insufficient shear strength (no stirrups), misplacement of hanger reinforcement, etc. In addition, the inspection report of RC half-joint bridges in England until 2018 expressed that damages or failures of half-joint structures can be attributed to the poor condition of structures or non-compliant reinforcement detailing. These conditions exhibited how important it is to understand the proper detailing of dapped-end reinforcement. To date, some studies have performed investigations on the effect of inadequate dapped-end reinforcement on the structural behavior of DEBs. However, the results of the research to date were not yet complete enough to disclose the role of each group of dapped-end reinforcement in resisting the working load. Therefore, this study was carried out to investigate the main role of each group of dapped-end reinforcement separately on the structural performance of RC-DEBs. Eight large-scaled RC-DEBs (with sizes of 1800 mm length, 120 mm width and 250 mm height) were prepared, cast and cured. All DEB specimens were tested under the three-point loading up to failure. To localize the effect of shear failure, the shear span-depth ratio of 1.43 was set. Test results exhibited that arrangement of a specific group of dapped-end reinforcement separately affects the structural performance of DEBs significantly. The diagonal reinforcement (DR) group was found to be more effective than the vertical hanger reinforcement (HR) group. The failure load capacity of the DR group (DEB-18) achieved 0.29 times that of the control beam (DEB-3). Meantime, the nib flexure reinforcement (NFR) group demonstrated the most important role in the structural performance of DEBs compared to other dapped-end reinforcement groups. The failure load capacity of the NFR group (DEB-39) reached 0.62 times that of the control beam, while rupture deflection of the NFR group also exhibited the highest value than other groups, i.e., 0.62 times that of the control beam. In addition, analysis results of rosette strain gages (RSGs) data indicated that regions near to re-entrant corner and its vicinity experienced the highest stress concentration factor (SCF) compared to other places of the beams. These regions were more susceptible to experiencing the first crack, progressive crack, damage or failure first than other regions of DEBs. The greater the value of SCF, the greater the probability of collapse occurring in the related structural elements, which is also followed by a lower failure load capacity. DEB-1 (without dapped-end reinforcement) has the highest SCF (205.68), and the lowest failure load capacity (12.58 kN), whilst DEB-3 (with the complete dapped-end reinforcement) has the lowest SCF (79.62), but the highest failure load capacity (105.26 kN). Obviously, DEB-3 can withstand the working load properly. Its adequate dapped-end reinforcement is able to accommodate and distribute the high stress flows in the dapped-end region properly, which causes the SCF value to decrease.
1. Introduction
Reinforced concrete dapped-end beams (RC-DEBs) are generally made in the form of precast concrete, in which precast RC-DEBs have been widely implemented in real-world construction as car park structures, RC buildings, long-span bridges, short-span bridges, pedestrian bridges, and other reinforced concrete bridge girders [1,2,3,4]. The structural performance of the RC-DEB has been extensively investigated to date. Many efforts have been made to increase their structural capacity, but it is often found that RC-DEBs are still experiencing shear failure, or severe damage occurs around the dapped-end region. Actually, the damage or collapse of the RC-DEBs or half-joint structures may occur during the service life. Aksoylu et al. [5] revealed that the snow loads could lead to damage or collapse on the prefabricated concrete dapped-end purlins in industrial buildings. Further, a collapse occurred at the south half of the Concorde overpass structure in Laval, Quebec, Canada, in 2006, as reported by Mitchell et al. [6]. Observation and investigation exhibited that the original design had a deficiency in terms of insufficient shear strength (no stirrups), inadequate detailing for the hanger steel reinforcement anchoring in the dapped-end region, and improper anchorage of the top reinforcement. The misplacement of hanger reinforcement of the half-joint structure also resulted in the large crack of concrete in this crucial region. In addition, based on inspection of RC half-joint bridges in England, Desnerck et al. [7] proved that damages or failures of half-joint structures could be attributed to the poor condition of structures (or the structural deficiency occurred during the lifetime), structural deterioration (or non-compliant reinforcement detailing), and also the constructional defects (or improper construction methods). In order to overcome this issue, aside from the use of fiber-reinforced concrete (FRC), engineered cementitious composites (ECC) [8], or the fiber reinforced polymer (FRP), etc. on DEBs, one of the imperative things that must be met is to complete the proper dapped-end reinforcement details, in order to improve their structural performance.
It is known that RC-DEBs have different specific groups of the dapped-end reinforcement that cover, among others, a group of hanger reinforcement (HR); diagonal reinforcement (DR); nib vertical reinforcement (NVR); nib horizontal reinforcement (NHR) and nib flexure reinforcement (NFR). Based on the PCI code [9], the dapped-end reinforcement was not designed separately, but in fact, each group of reinforcement has a role in resisting shear cracks or diagonal tension or failure modes that could potentially occur in the dapped-end area. It is important to know and understand the role of each group of dapped-end reinforcement separately, as well as their load-carrying capacity due to the working load. Up to the present, there are some studies by Rajapakse et al. [10], Desnerck et al. [11], and Desnerck et al. [12] that conducted investigations on the effect of the inadequate dapped-end reinforcement on the structural behavior of DEBs. However, the results of the research were not yet complete enough to disclose the role of each group of dapped-end reinforcement in resisting the working load. In addition, Mattock and Chan [13] stated that the closed stirrups (HR) are quite important to withstand the diagonal crack emanating from the re-entrant corner. We need to examine this statement further to consider the actual role of the HR group in the dapped-end region.
Based on the descriptions above, in reality, no one research has studied the important role of each group of the dapped-end reinforcement separately and in detail. Therefore, it is necessary and important to investigate the main role of each group of dapped-end reinforcement individually or separately on the structural performance of RC-DEBs. It is more straightforward to distinguish and understand the respective roles of each reinforcement group. After all, this study aims to investigate the role of each group of dapped-end reinforcement to withstand the working load and reveals that an essential role of the reinforcement group is related to the structural performance of DEBs. In addition, it can also be compared to the structural capacity of the related RC-DEB, where the dapped-end reinforcement group is incomplete or inadequate. Possible failure modes due to the stress concentration at the dapped-end region were also discussed in this study.
Early Studies
Taher [1] revealed that the shear strength of RC-DEBs can be increased by reinforcing the dapped-end area. Compared to conventional reinforcement, Herzinger [2] concluded that using single and double-head stud reinforcement in the dapped-end area of RC-DEBs improves the structural behavior of these beams and reduces the reinforcement congestion. This fact is also reported by Mohamed and Elliott [14], who used steel fiber self-compacting concrete to construct RC-DEBs. The studies revealed that the steel reinforcement amount in the dapped-end region could be reduced due to the shear strength enhancement of the reinforced steel fiber self-compacting concrete DEBs. In addition, Özkılıç et al. [15] also proved that use of the steel fiber concrete on DEBs could increase the shear strength capacity. According to the investigations of Huang and Nanni [16], Nagy-György et al. [17], Shakir et al. [18], Gemi et al. [19], Aksoylu et al. [20], and Özkılıç, et al. [21] CFRP strengthening at the dapped-end area can lead to the increased shear strength capacity of RC-DEBs. Aswin et al. [22] assessed the experimental results of 111 RC-DEBs from the existing studies and found that shear failure is the most common failure mode on these beams. Furthermore, modeling of DEBs using the Finite Element Modeling (FEM) package has been conducted to capture the realistic behavior of related beams [23,24,25,26,27,28]. The simulation results present adequate prediction and demonstrate the effectiveness of the proposed FEM tools. The crack pattern, failure modes, load-displacement relationship, shear strength capacity, etc., were reasonably captured by the simulations.
Meanwhile, because of the geometric discontinuity that occurs at the end of beams, called the D-region, DEBs are frequently exposed to severe stress flows [2,14,16,29,30]. The D-regions have a nonlinear strain distribution [31]. Based on the previous investigations [13,30,32,33], the re-entrant corner of the RC-DEBs typically originates the initial cracking. Therefore, some researchers [13,16] have suggested using a group of closed stirrups near the end face of the un-dapped portion of beams to resist the vertical component of the inclination compressive load originating from the nib area or support. In general, vertical stirrups as the hanger reinforcement (HR) have been utilized and recommended to overcome the diagonal cracks that emanate from the re-entrant corner. Rajapakse et al. [10] also reported that increasing the number or section area of hanger reinforcement in the dapped-end area yields an increase in shear capacity. However, Wang et al. [32] concluded that inclined HR and longitudinally bent reinforcement had a greater impact on shear strength capacity than the vertical one. In comparison to the vertical HR, Forsyth [3] also revealed that the inclined HR greatly lowers crack width and crack growth rates. When compared to identical specimens with vertical HRs, inclined HRs can delay the beginning of cracking and enhance the strength capacity of DEBs by about 30%. Further, Desnerck et al. [11] found that beams with fewer nib reinforcement had lower load-carrying capacity than beams with full nib reinforcement, in which the insufficient diagonal reinforcement (DRs) resulted in a 40% reduction in load-carrying capacity. Desnerck et al. [12] also reported that a decrement of 50% of the cross-sectional area of the diagonal, vertical, and U steel bars in dapped-end region generated in a 35% reduction of failure load compared to the control specimen. In addition, insufficient anchorage of the diagonal steel bars resulted in strength losses of approximately 10%. In the meantime, Aksoylu et al. [5] proposed the dapped-end reinforcement types in order to address damages on prefabricated concrete dapped-end purlins due to snow loads. The experimental results exhibited that the specimen with the “Z” reinforcement type generates approximately 30% higher load capacity than other specimens. Moreover, Botros et al. [4] and Klein et al. [34] have investigated various dapped-end reinforcement schemes believed to predispose the structural behavior of dapped ends of prestressed concrete thin-stemmed members. The “CZ” reinforcement scheme showed good structural performance compared to others. This type provides imperative merit owing to the ease of its construction and better anchorage of the hanger steel bars in the compression zone of the beam. In addition, this scheme generates lower crack width when the beam fails. However, Mohammed et al. [35,36] revealed that the varied configuration of HRs or DRs combined by using engineered cementitious composites (ECC) placed in the dapped-end region could significantly affect the failure load capacity, crack patterns, and modes of failure of the DEBs. The use of DRs is more effective than HRs. The combination of DRs (or HRs) with ECC obviously can lead to DEBs fail in the flexural failure mode with high failure load capacity.
We know that recessing of DEBs can result in a discontinuity matter, and when significant stresses are retained at the discontinuity zone, the stress concentration will develop. The causes of discontinuity can be induced by a sudden change in the geometry of the members or by the presence of a concentrated load or a support reaction force, etc. The structural elements’ holes, notches, grooves, and other features typically exhibit such a dramatic change. The major cause of material failure or fracturing in most situations is the stress concentration [37,38,39,40]. The stress flows that can describe the occurrence of stress concentrations in RC beams due to the working loads, openings and other discontinuities can also be examined and studied using FEM [41]. Furthermore, an investigation on the stress concentration of masonry concrete walls with an opening under the axial and flexural loads using FEM revealed that highly localized stresses were found at or near the discontinuity area. A significant stress concentration was found around the upper corners of the concrete wall’s opening [42]. On the other hand, experimental work on RC walls with openings was carried out, where the strain gauges were used and placed at the corners of the wall opening to measure the stress concentrations. Test results showed that as the opening sizes of the RC wall increased, the principal stresses increased and were more concentrated on the top corners of the openings. In order to overcome the stress concentration at the top corners of the openings, the CFRP strengthening was applied around the openings of the RC wall at an angle of 45º to each corner. It turned out to be a significant enhancement in the reduction of the principal stresses for this condition [43].
2. Experimental Program
2.1. Materials and Mix Proportion
RC-DEBs were cast using normal strength concrete (NSC), with a compressive strength of 28 MPa at the age of 28 days. The concrete specimen is a cylinder with a size of 100 mm diameter and 200 mm height. All concrete specimens were cured by water immersion. The mix proportion used for the test specimens is shown in Table 1. Coarse aggregates have a maximum size of 20 mm, as well maximum grain diameter of sand is 1.2 mm. Meanwhile, cement Type-1 was utilized.

Table 1.
Mix proportion of NSC (kg/m3).
2.2. DEB Specimens and Testing Procedure
Eight large-scaled beams with 1800 mm length, 120 mm width and 250 mm height were prepared, cast, and cured, whilst a dapped-end (nib) portion had a size of 110 mm length and 140 mm height. The sizes of all DEB specimens refer to research done by Aswin et al. [30] and Mohammed et al. [35,36]. The effect of scaled DEB specimen size was not reviewed and considered in this research. A vibrator was used to compact the fresh concrete. After 1 day of casting, all DEB specimens were cured using wet burlaps, which were placed on the beam surface. The curing was carried out until 21 days, then allowed to dry in the lab at room temperature. All DEB specimens were tested at the age of 28 days under a three-point bending static load up to failure. The working load was placed close to the re-entrant corner, with the shear span () of 160 mm. This is to localize the shear effect in the dapped-end region.
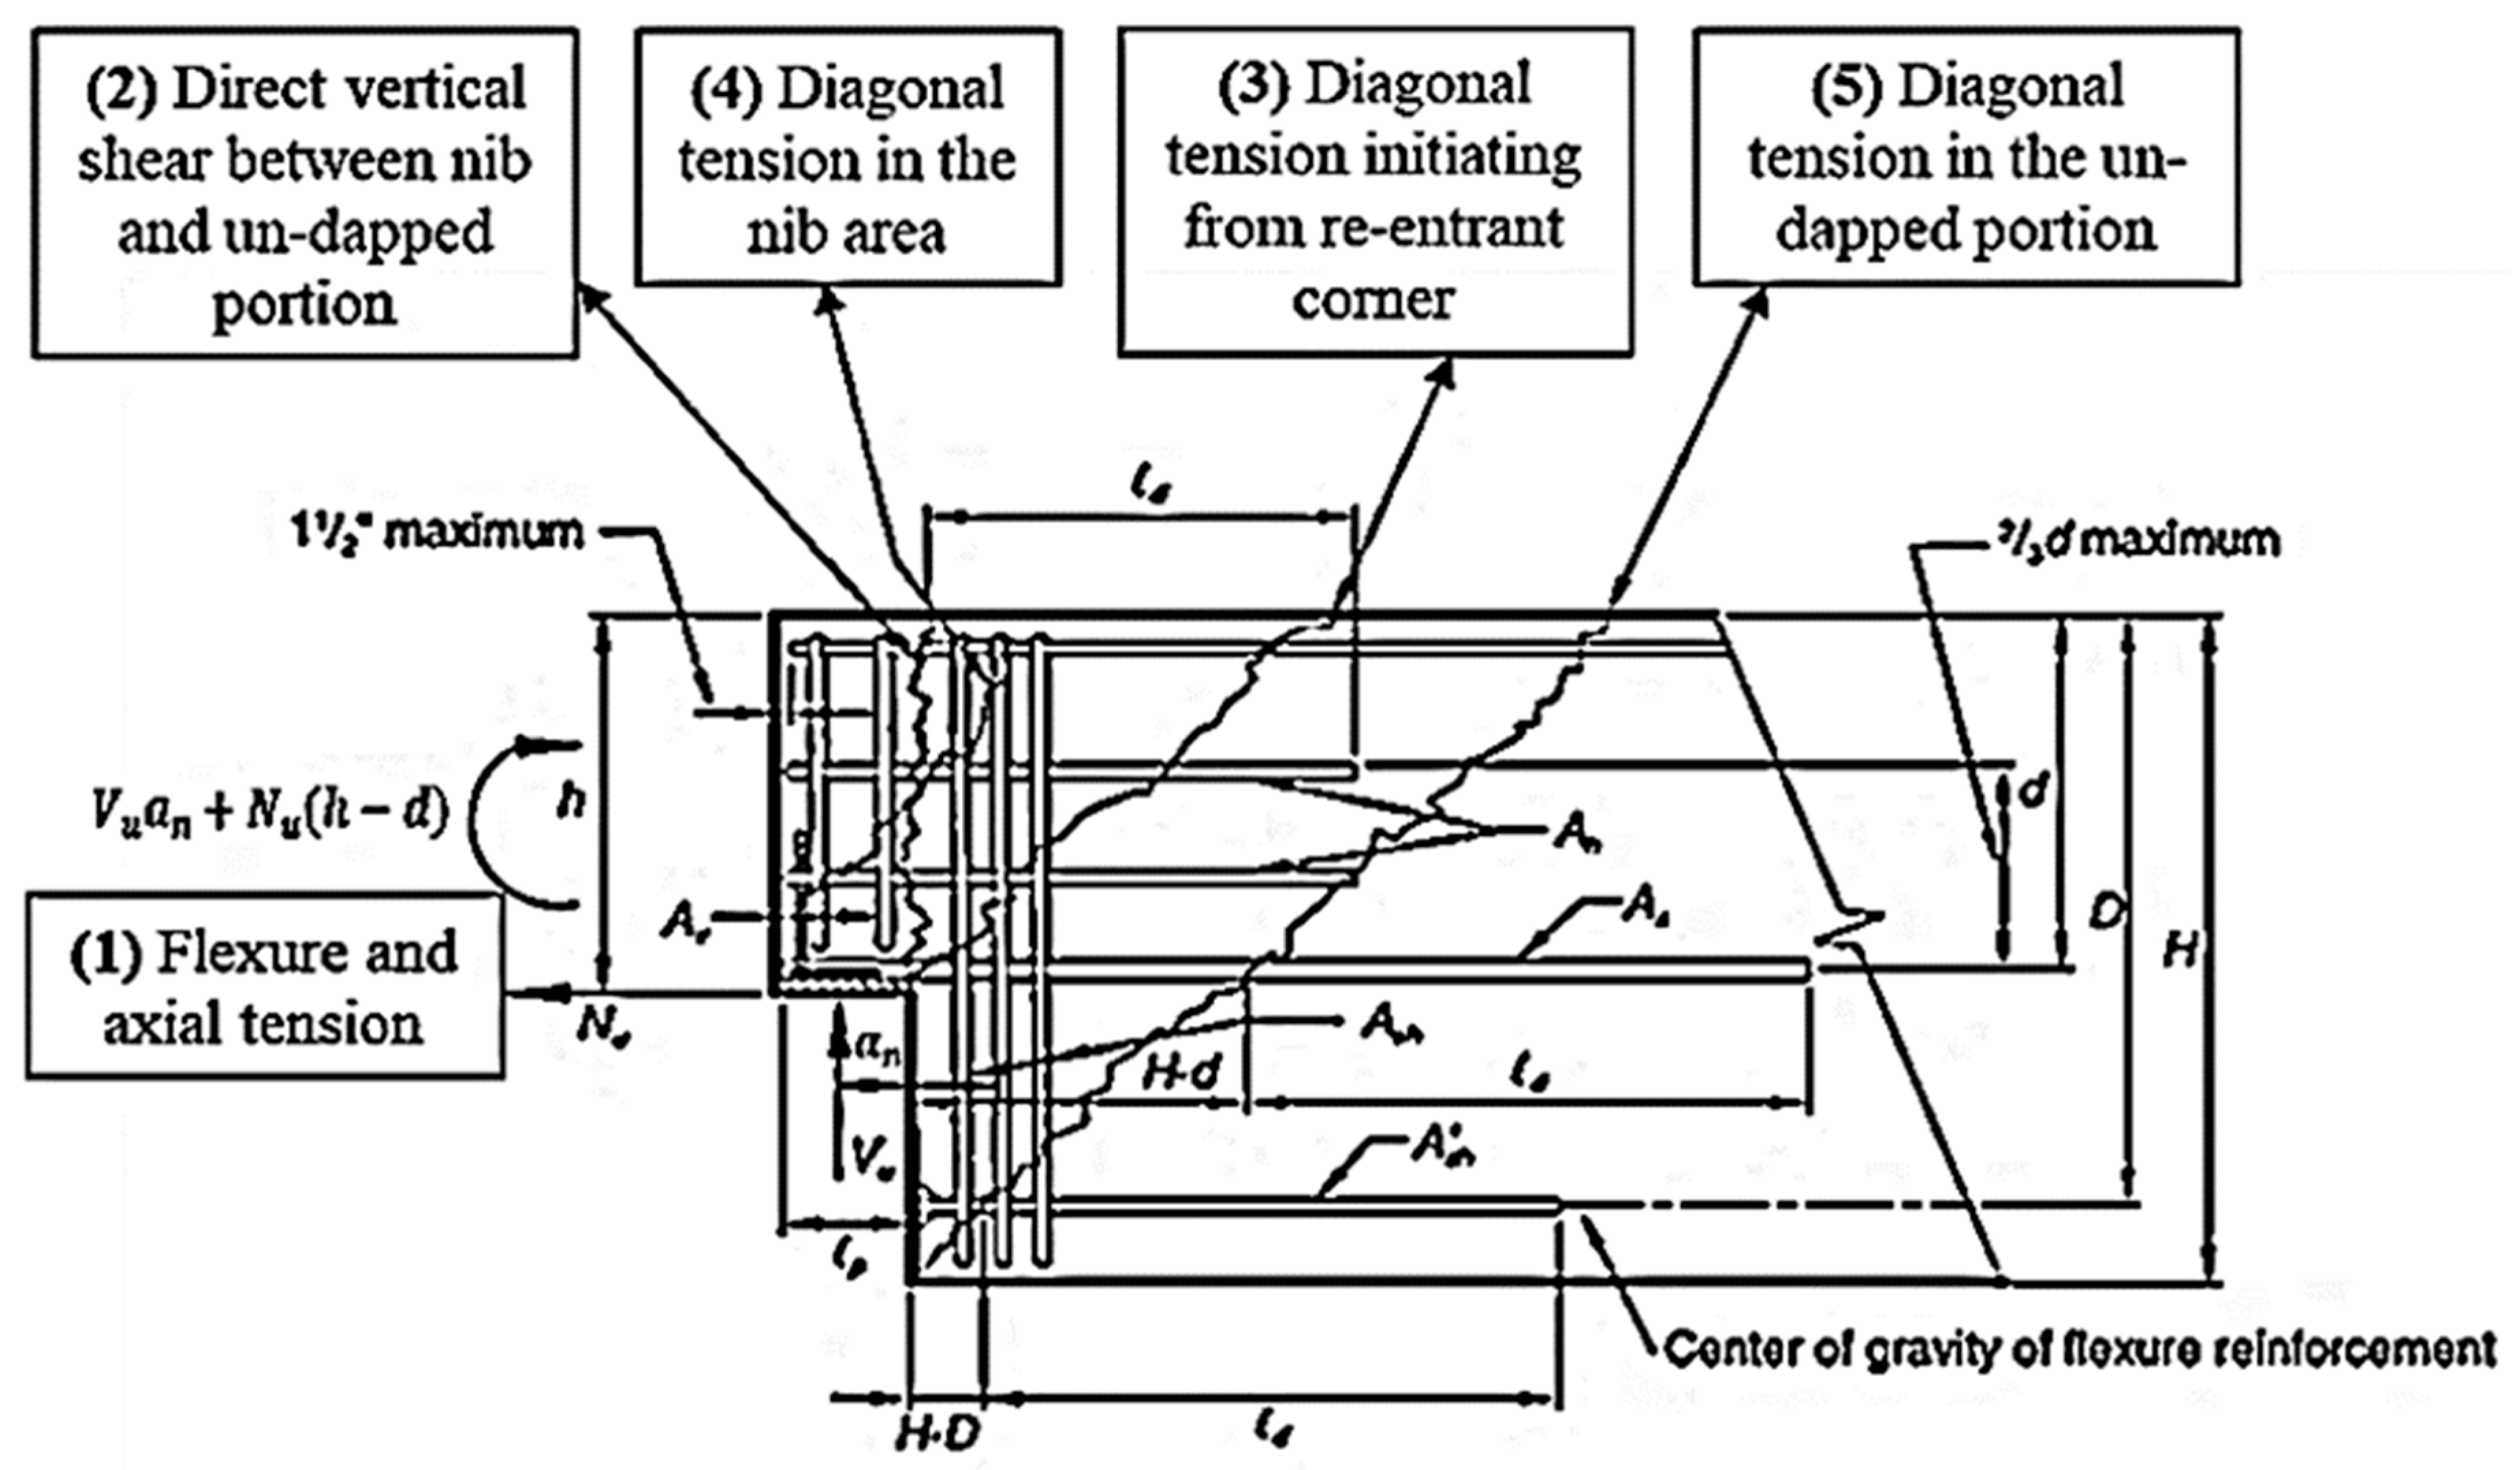
In this study, the control beam (DEB-3) was reinforced with the complete steel reinforcement in the dapped-end region and was designed based on the provision of PCI code [9]. PCI code has stipulated design equations that reflect the relationship between the required steel reinforcement at the dapped-end region and the five possible failure modes, as illustrated in Figure 1. The locations of the five potential modes of failure are as follows: (1) at the extended end, called “flexural and axial tension failure”; (2) interface between the nib and the un-dapped portion, called “direct vertical shear”; (3) originating from the re-entrant corner called “diagonal tension”; (4) emanating from the nib area called “diagonal tension”; and then (5) at the un-dapped portion of the beam called as “diagonal tension”.
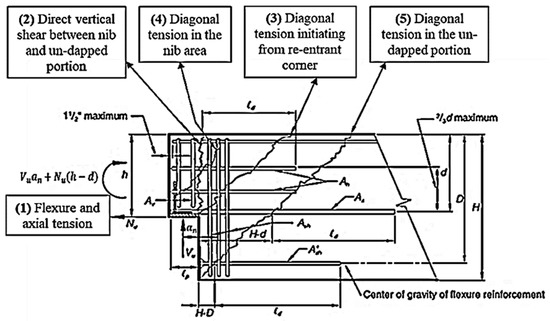
Figure 1.
Modes of failure of DEBs as prescribed in PCI code (PCI code, 2010).
The tested beams were labeled as DEB-1, DEB-3, DEB-8, DEB-18, DEB-25, DEB-32, DEB-36, and DEB-39. DEB-1 has been assigned no dapped-end reinforcement, which is considered to be the reference specimen, while DEB-3 has been reinforced with four different dapped-end reinforcements, including NHRs, NVRs, HRs, and NFRs, which are considered to be the control specimen. The dapped-end reinforcement of DEB-3 has been designed using PCI code. The other beams were assigned a dapped-end reinforcement based on the variations of the dapped-end reinforcement scheme of DEB-3. The beam specimens labeled with DEB-8, DEB-18, DEB-25, and DEB-32 have been embedded with one type of dapped-end reinforcement, which are HRs, DRs, NHRs, and NVRs, respectively. DEB-36 had three different types of dapped-end reinforcement without NFRs. Lastly, DEB-39 had just NFRs in the dapped-end region.
Dapped-end reinforcement for HRs and DRs has been assembled with three-closed stirrups of 8 mm diameter. Meanwhile, the NVRs group has been assembled with two-closed stirrups with a diameter of 8 mm in order to contribute appropriately to the confinement strength of concrete. On the other hand, the NHRs group has been assigned a stirrup having two U-steel bars with 8 mm, while the group of NFRs has been assigned three-single steel bars of 10 mm. Stirrups spacing is 100 mm center to center for all RC beams. Three main flexural reinforcement of beams have been assigned with a diameter of 10 mm, and two steel bars of 8 mm diameter have been assigned as top rebars for all RC beams. The details of the dapped-end reinforcement of the studied beams are shown in Table 2.

Table 2.
Details of the dapped-end steel reinforcement of the tested beams.
The nominal shear span-to-depth ratio (), for all beams, has been designed to be 0.96, which is within the PCI code requirements (where . The shear span to depth ratio () has been set at 1.43 (where in order to localize the effect of shear failure. The nominal shear span () is measured from support to center of hanger reinforcement, as can be seen in Figure 1, whilst the shear span () is the distance between support and applied load (), as shown in Figure 2. The Linear Variable Differential Transducer (LVDT) was used to measure the vertical deflection of beams. The applied load is derived from the actuator machine with a capacity of 500 kN. The concentrated load () was applied at 215 mm from the left edge of the nib (where the shear span is 160 mm) with a loading rate of 0.15 kN/s till failure. The loading will stop when the DEB specimens have collapsed/ruptured. All equipment used is connected to a data logger. Laboratory and schematic setup of RC-DEB specimens, including the load position, beam and nib sizes, and instrumentations, are shown in Figure 2. In this study, the crack width of all DEB specimens was not examined and investigated.

Figure 2.
Experimental setup of RC-DEBs under three-point bending static test.
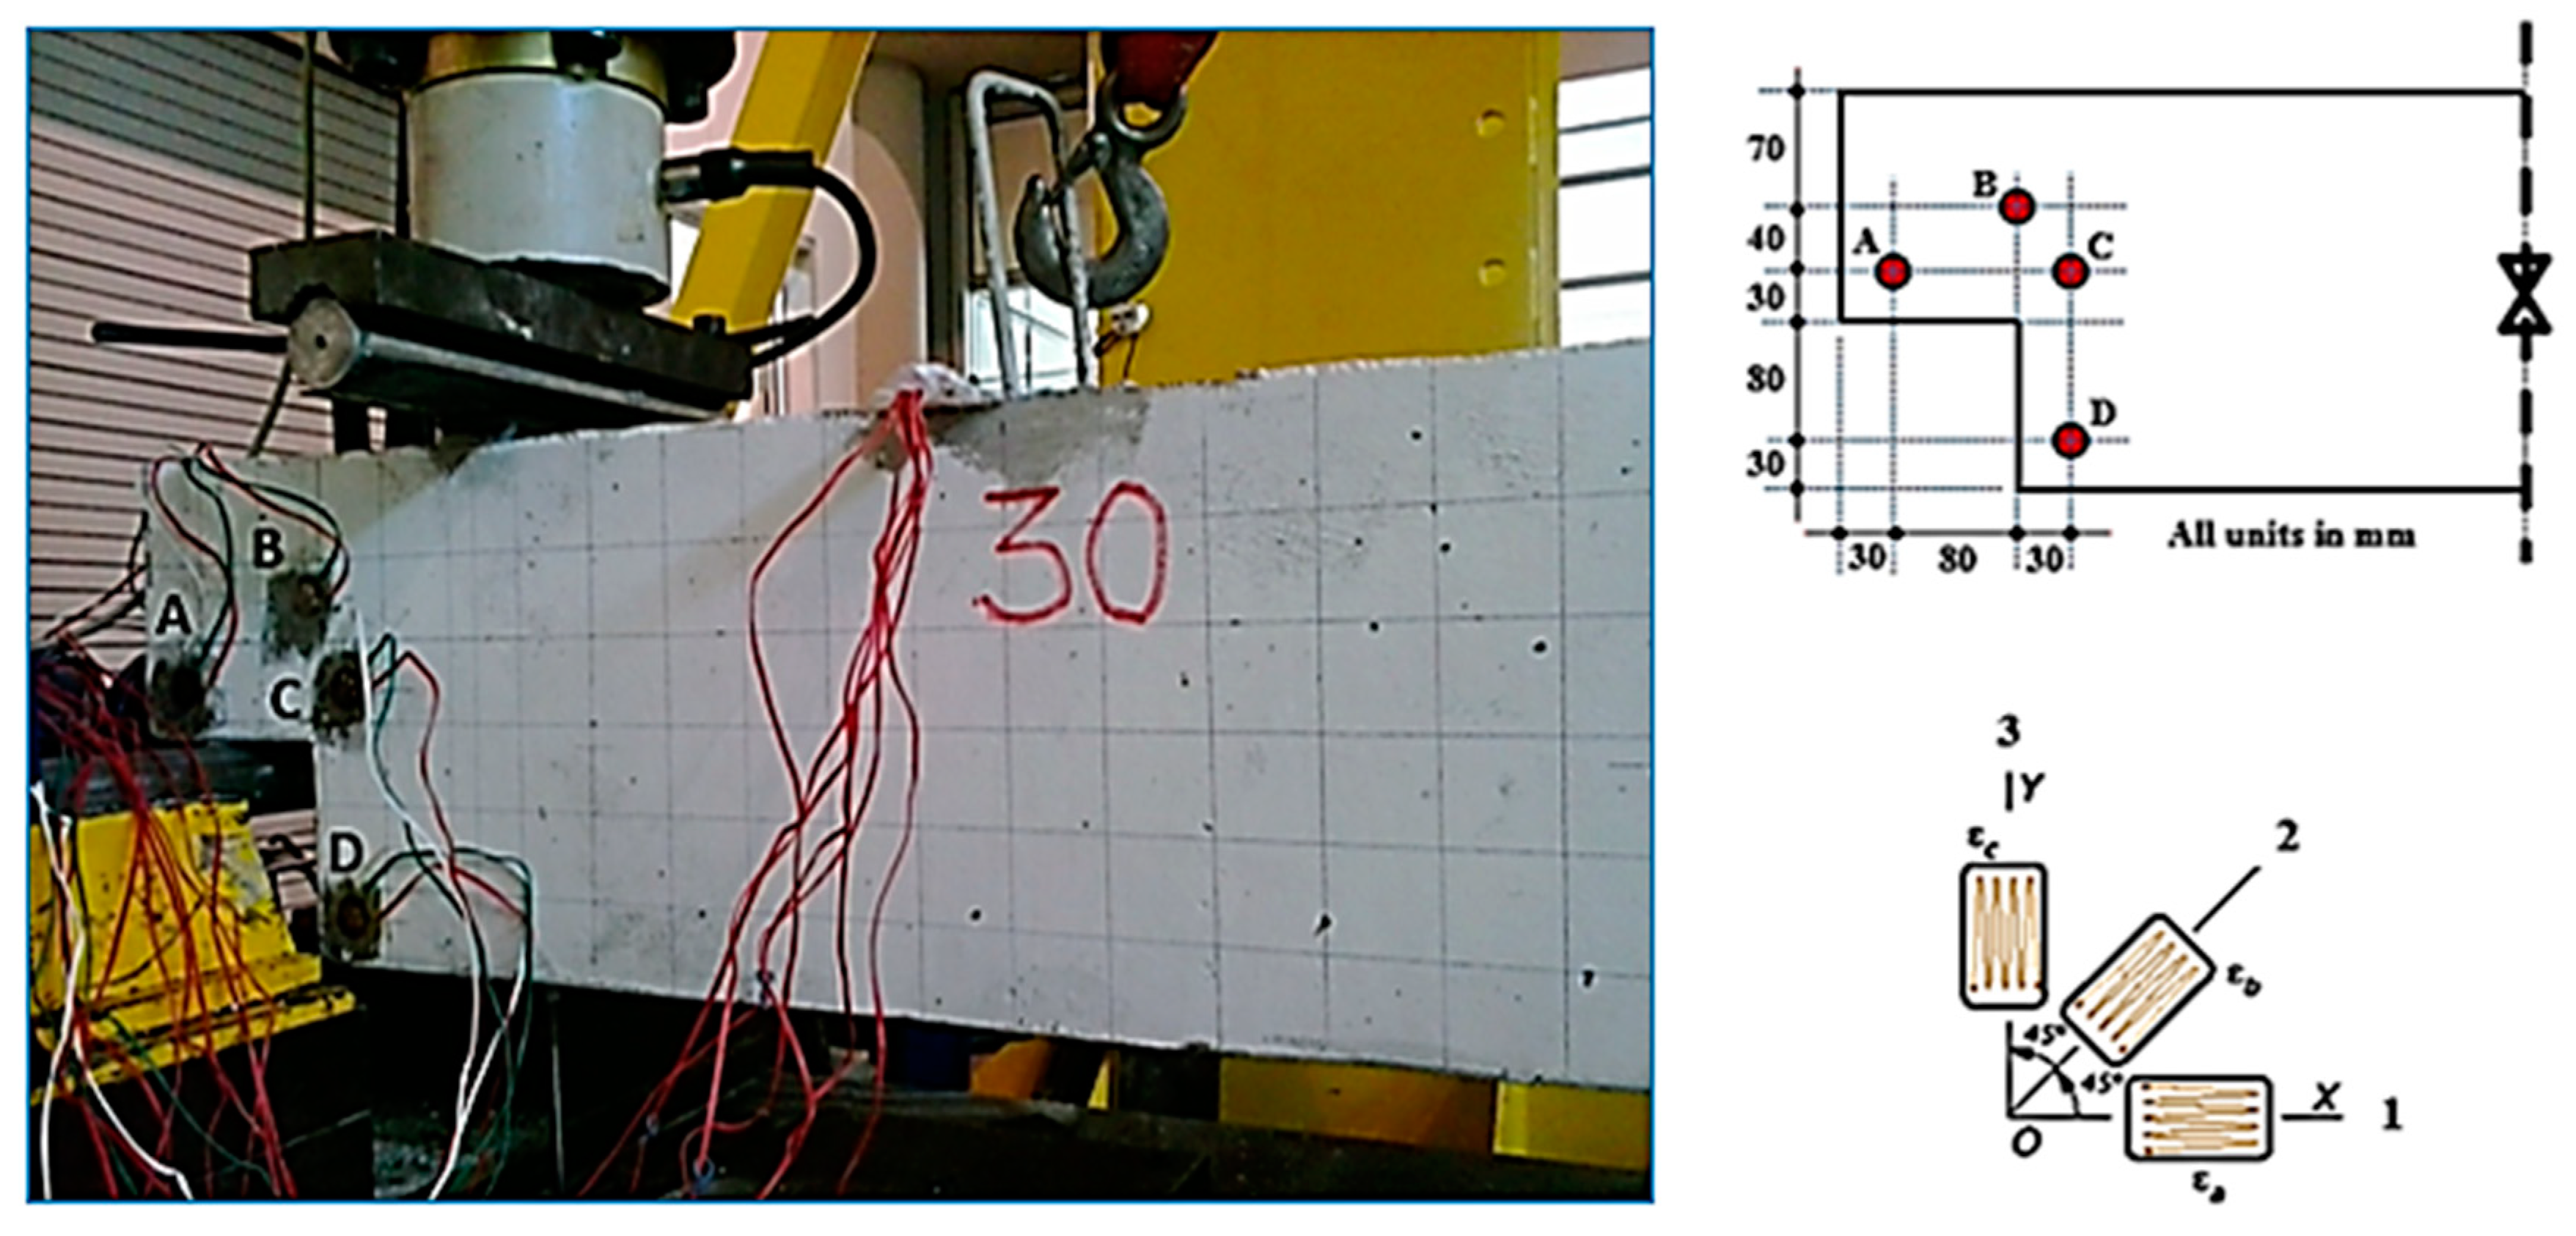
Four rosette strain gages (RSGs) with three directions (a, b, and c) were attached at different locations at the dapped-end region in order to measure the strain at various locations, as shown in Figure 3. All RSGs were also connected to the data logger. The rosette strain reading was taken up to 80% of the maximum applied load in order to avoid missing any data due to the damage of RSG [43]. Besides, the stress concentration factor (SCF) was evaluated based on the relevant stresses obtained from the measured strains. The provisions of several kinds of literature [44,45,46,47] were used in this investigation to satisfy the need to transform the measured rosette strains and determine the corresponding stresses for each RSG. The measured rosette strains were used to gain the corresponding transforming strains based on Equations (1)–(3). The transformation strains are then used to evaluate the related stresses according to Equations (4)–(7), and the principal stresses were obtained based on Equations (8) and (9). Lastly, the stress concentration factor () for each rosette strain was calculated using Equation (10) which is available in the literature [37,38,40,43].
where , and are the measured rosette strains, is the transverse transformation strain, is the lateral transformation strain and is the shear transformation strain at x − y plane.
where is Poisson’s ratio, is the modulus of elasticity and is shear modulus.
where is the nominal stress at 80% of , is the vertical shear plane area of dapped-end region, are the nib width and height, respectively.
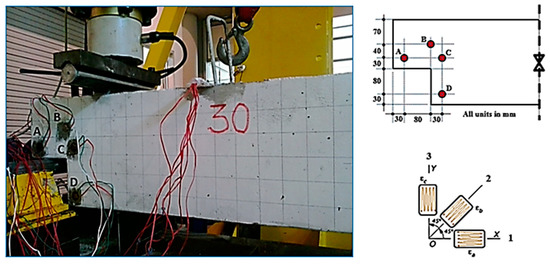
Figure 3.
Placement scheme of Rosette Strain Gages (RSGs, (A, B, C, and D)) at dapped-end region.
3. Results and Discussion
3.1. Grade of NSC and the Properties of Steel Bars
The mechanical properties of NSC and steel bars are needed for the design requirement of the dapped-end reinforcement. Therefore, the compressive test using cylindrical samples (with 200 mm height and 100 mm diameter) was conducted, and the average concrete grade of NSC () was obtained to be 28 MPa. Meantime, a direct tensile test was carried out for 8 and 10 steel bars, and their properties are shown in Table 3. Steel reinforcement of 8 mm diameter is plain rebar that is used for NVRs, HRs, DRs and shear links. The plain rebars have been used owing to form the closed stirrups for easy bending during the fabrication. Meanwhile, steel reinforcement of 10 mm is deformed rebar, and it is only used for NFRs. The deformed 10 steel bar has higher strength but lower ductility compared to the plain steel bar of 8 mm diameter.

Table 3.
Tensile properties of steel bars.
3.2. The Role of Dapped-End Reinforcement on the Structural Behavior of RC-DEBs
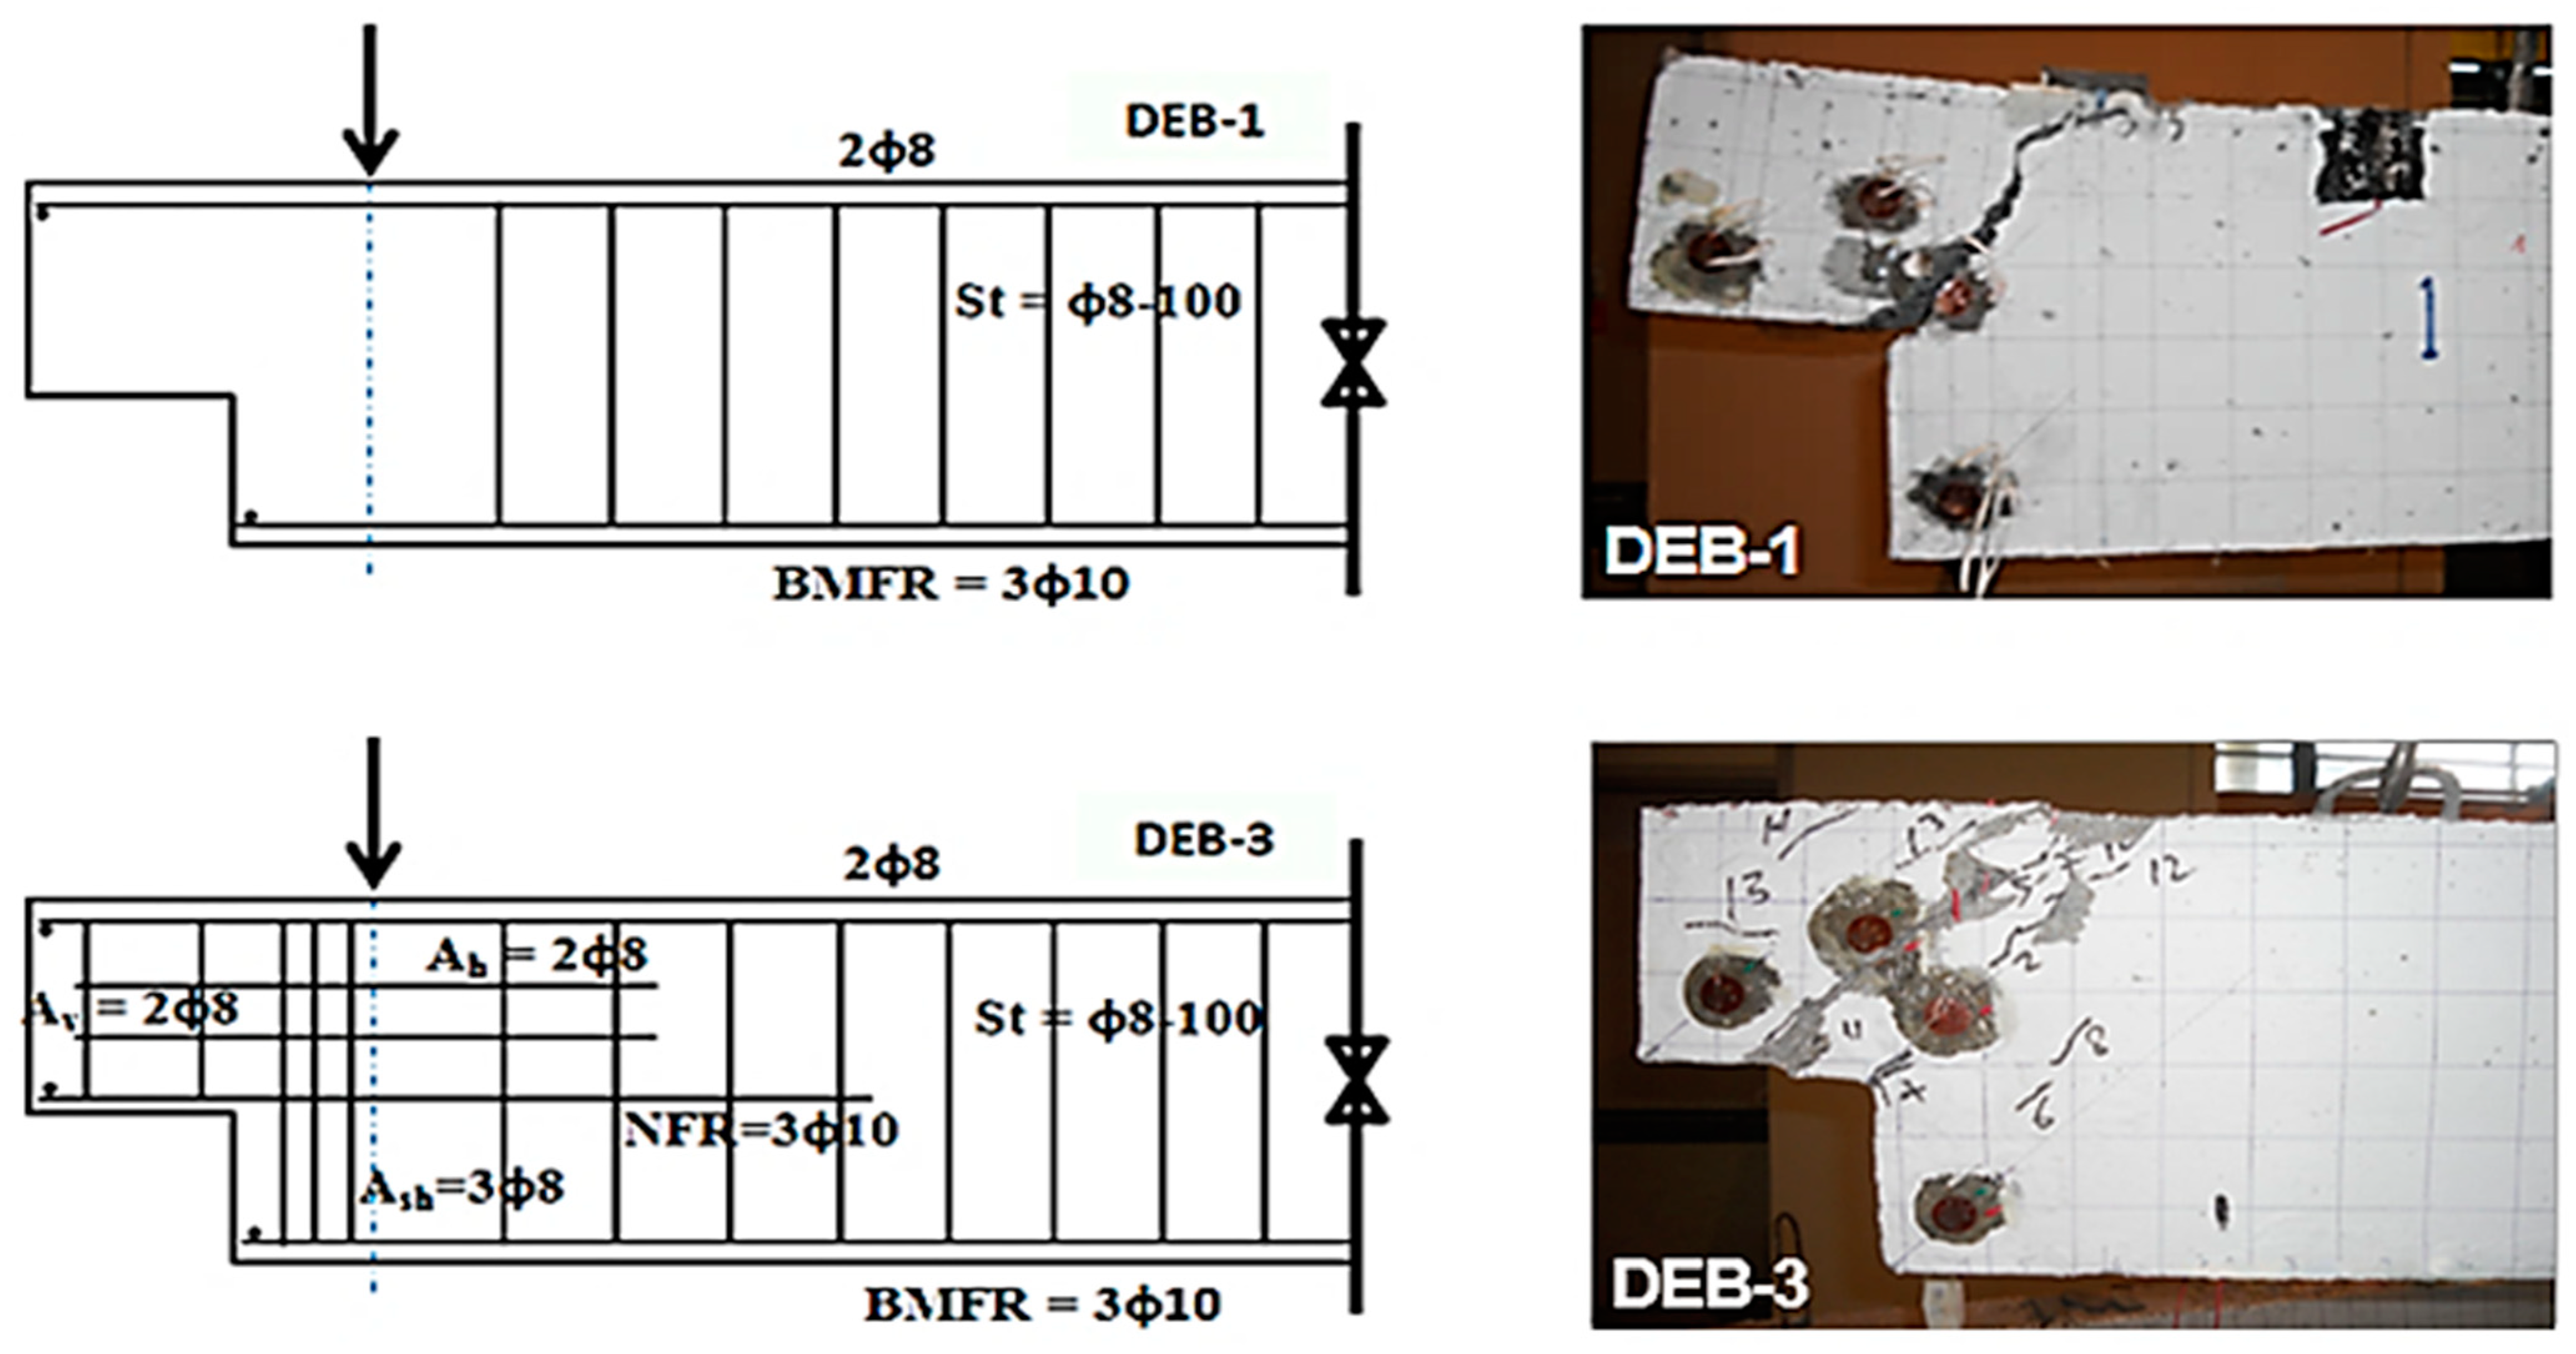
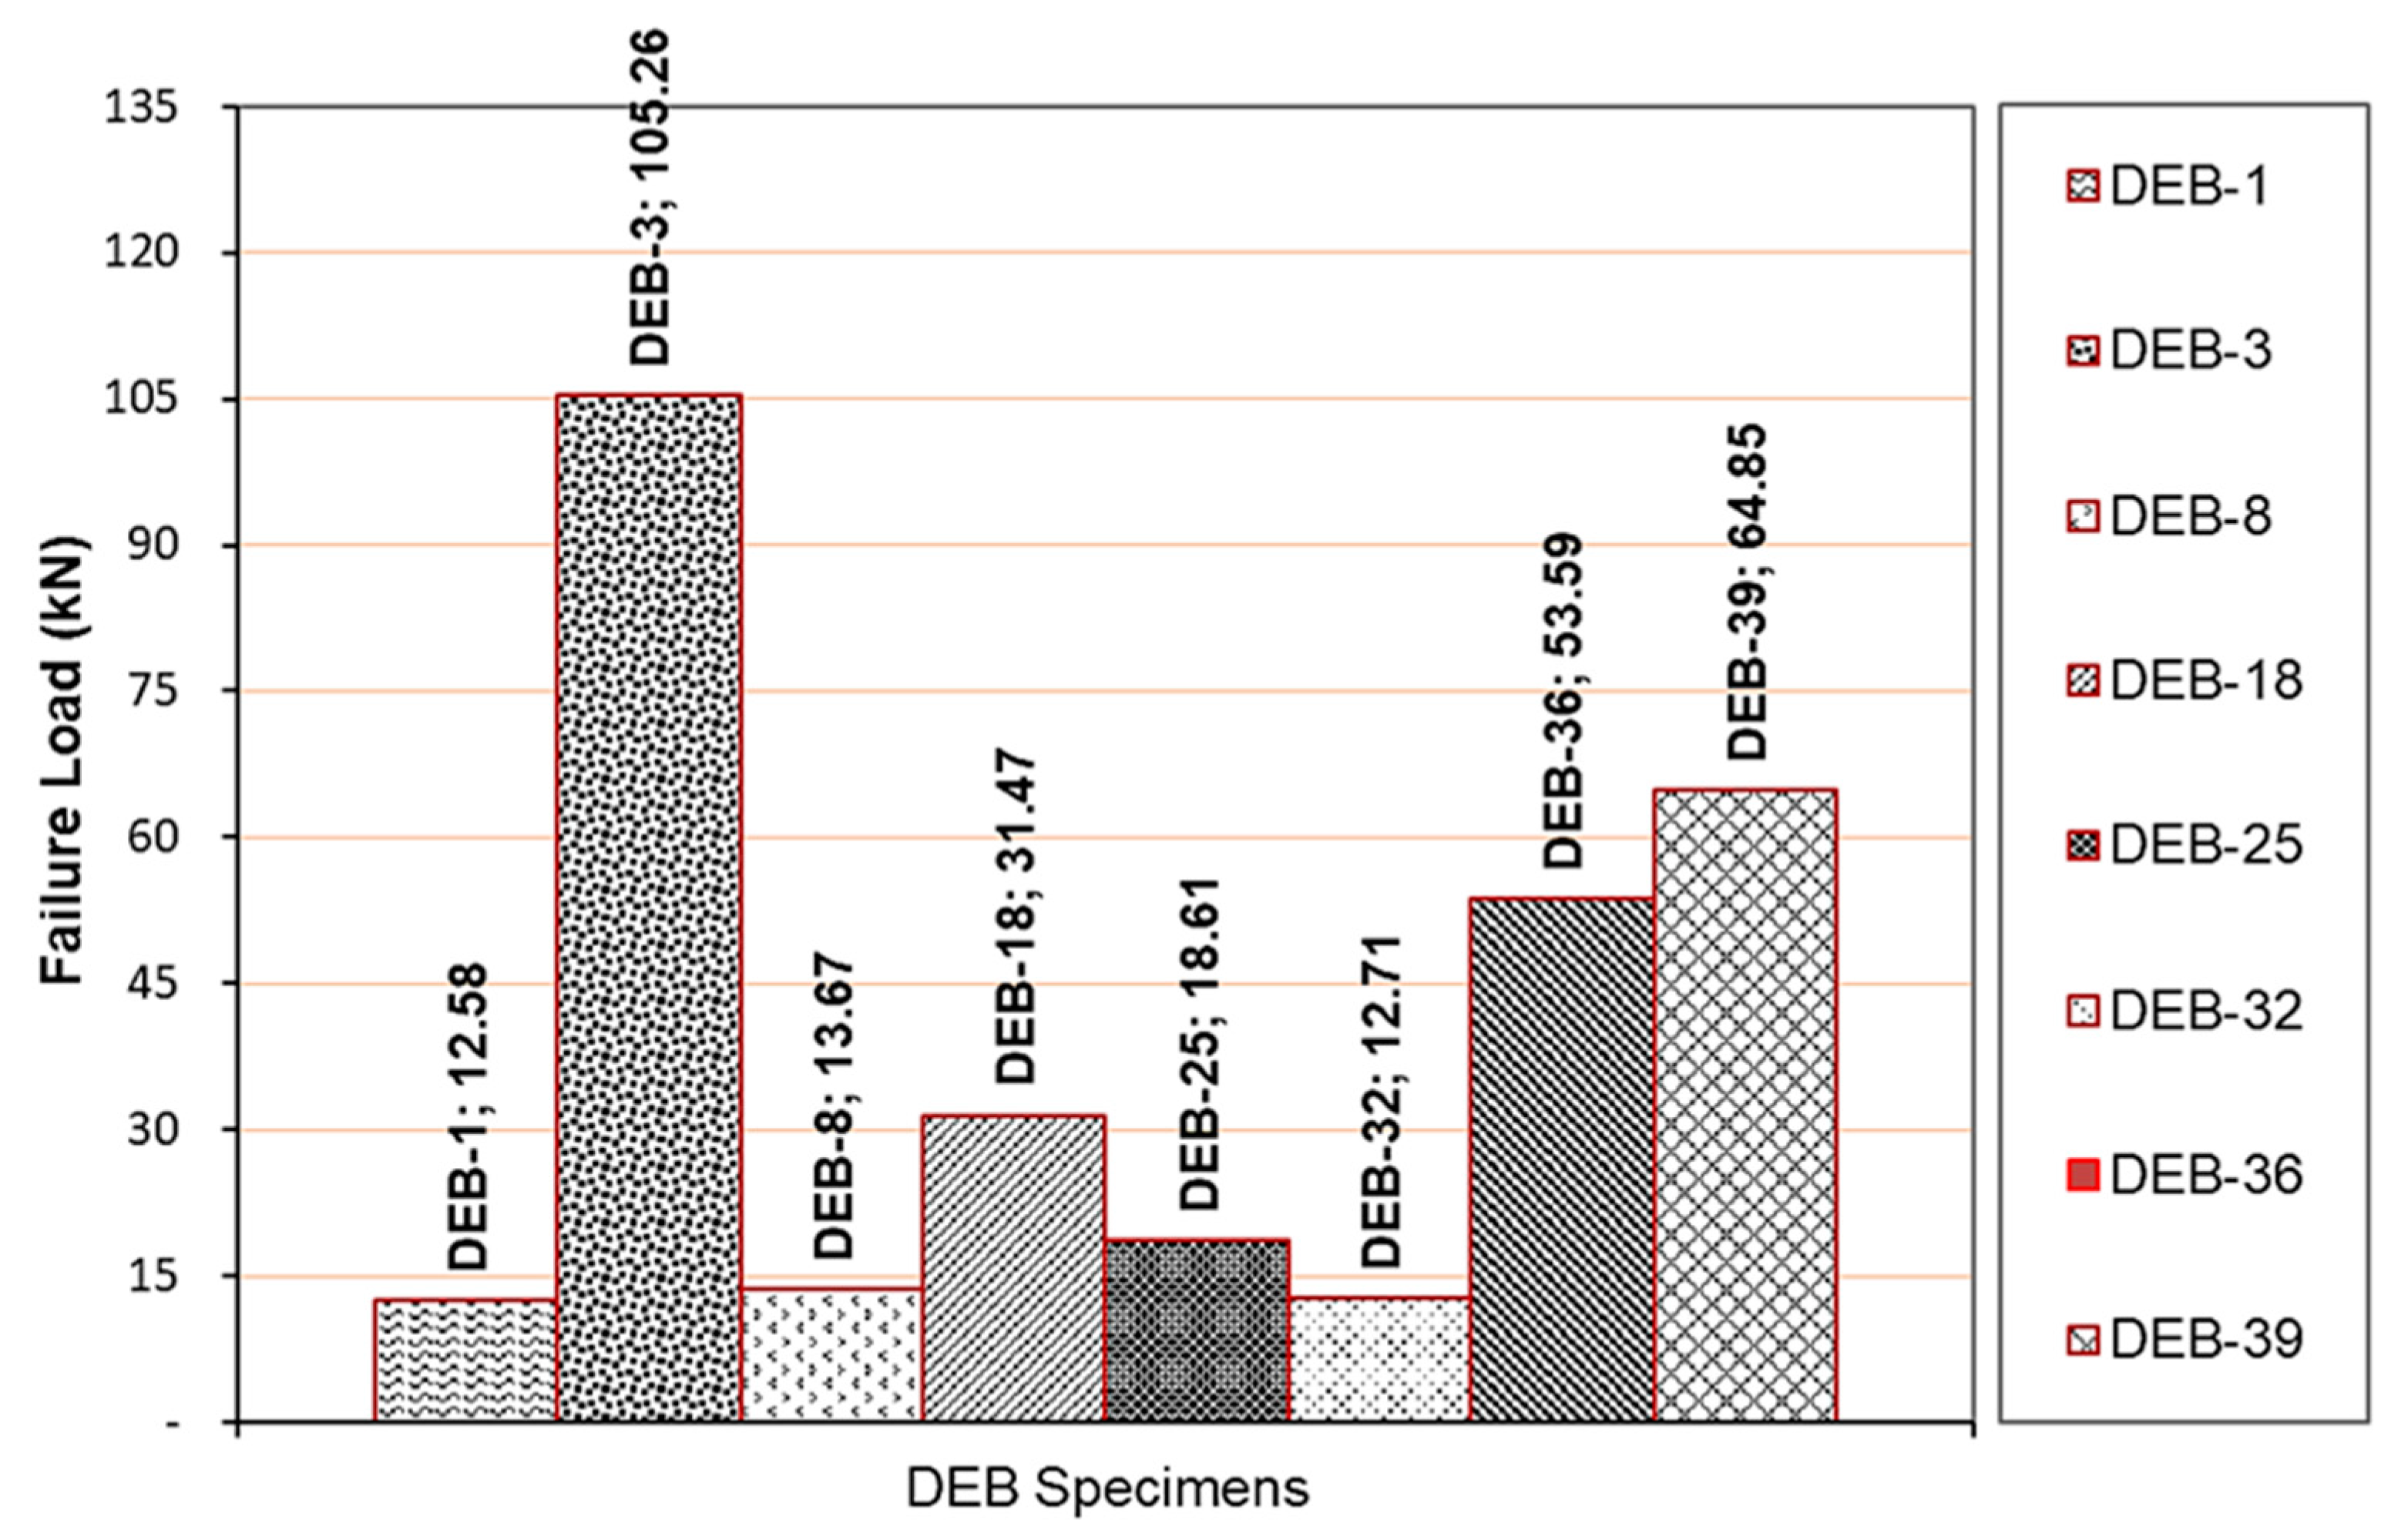
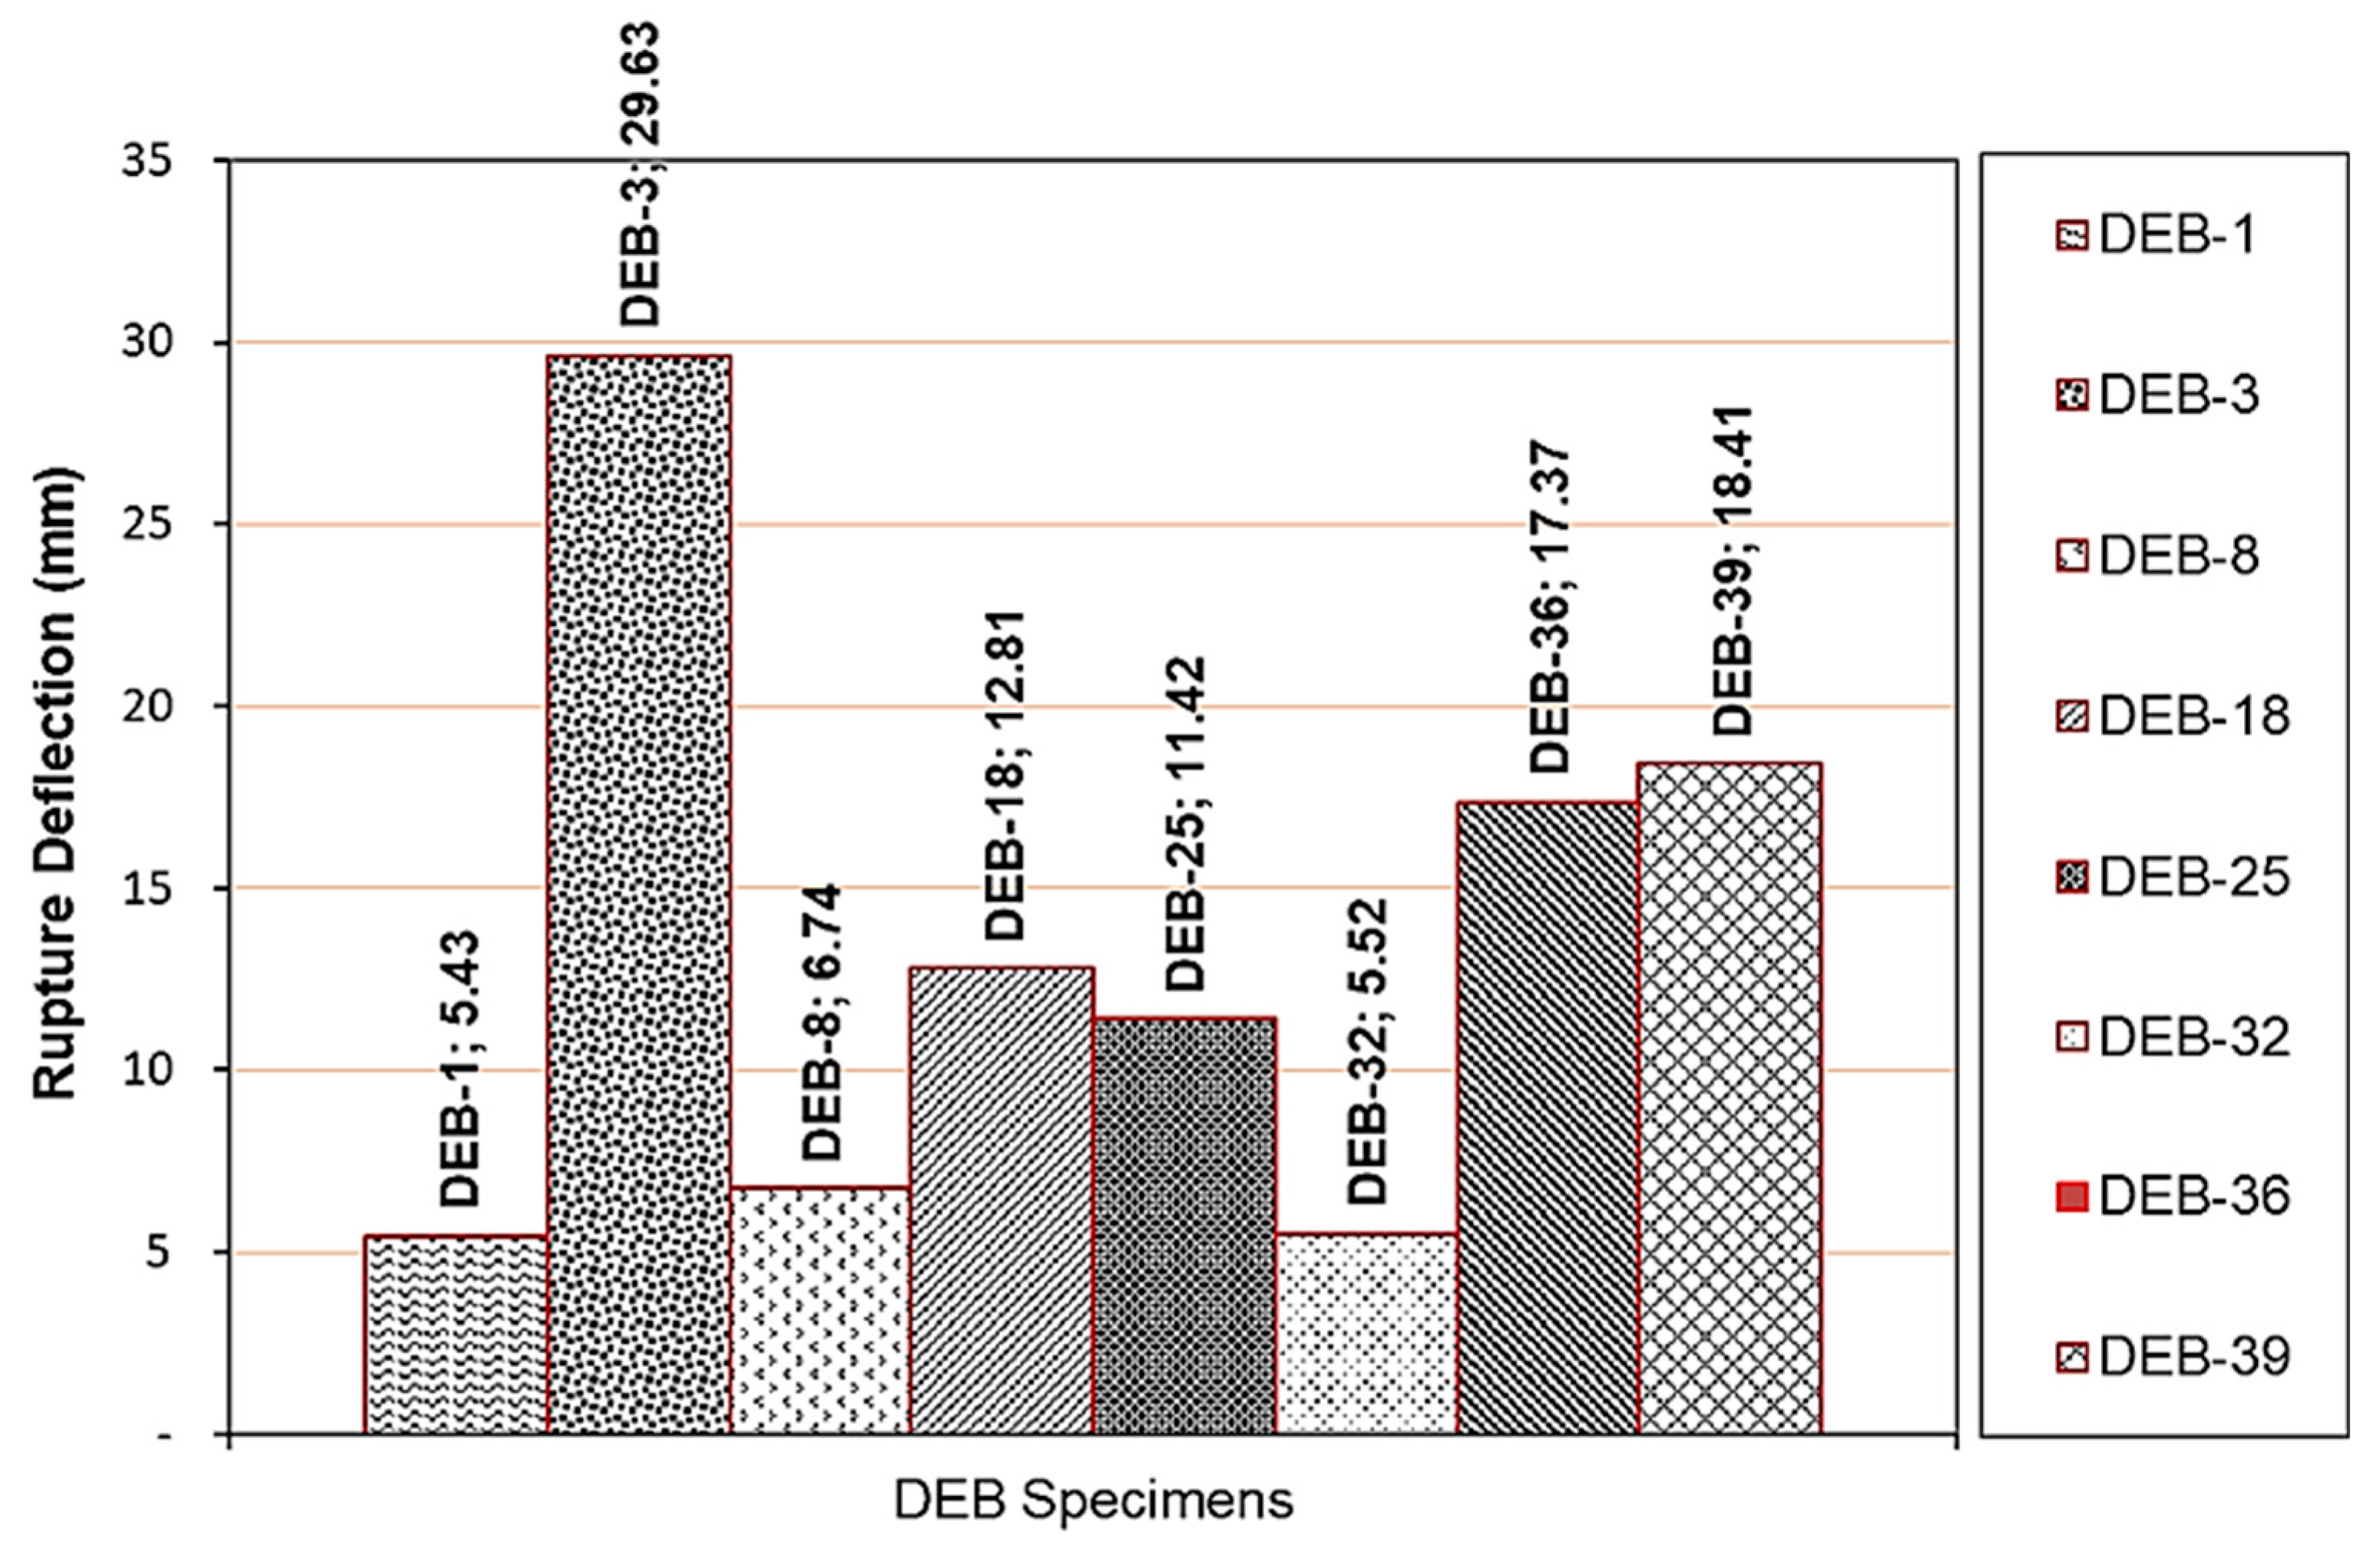
DEB-3 is a control beam with the four groups of dapped-end reinforcement (i.e., NHRs, NVRs, HRs, and NFRS), whereas DEB-1 is a reference beam with no dapped-end reinforcement. The failure of DEB-3 was indicated by the occurrence of a few diagonal cracks at the dapped-end zone, whereas the failure of DEB-1 was defined by the occurrence of the major diagonal crack issuing from the re-entrant corner, as shown in Figure 4, Figure 5 and Figure 6. This single crack propagates diagonally as the load increases without being prevented in its progression. The reference beam (DEB-1) has the lowest capacity when compared to other beams, with a failure load of 12.58 kN and a corresponding rupture deflection of 5.43 mm. Meanwhile, DEB-3 has the highest capacity among all DEBs, with a 736.72% increase in failure load and a 445.67% increase in the rupture deflection when compared to DEB-1. Failure load is meant as the maximum load. While rupture deflection is defined as the final deflection that occurs, which was recorded in the data logger, where the DEB specimen at that time has collapsed, the loading of the actuator machine has also stopped. The rupture deflection is intended to see how much ability of DEB specimens can withstand the working load when the DEB has actually reached its collapse.
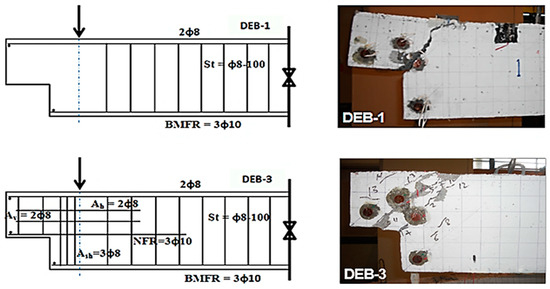
Figure 4.
Reinforcement detail and modes of failure of DEB-1 and DEB-3.
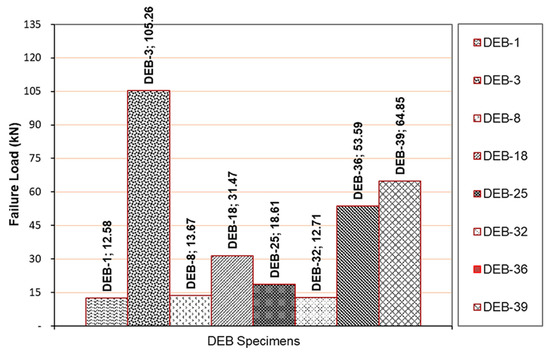
Figure 5.
Failure load capacity of DEB specimens.
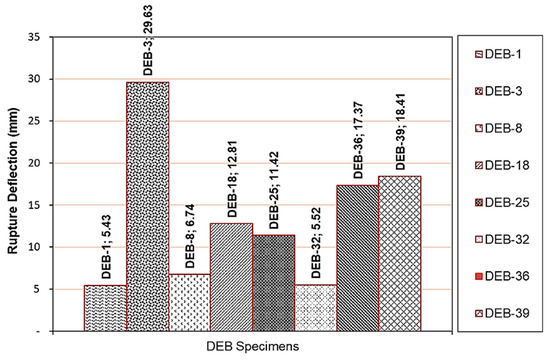
Figure 6.
Deflection of DEBs at rupture condition.
Each group of steel reinforcements in the dapped-end area works to support each other to withstand the working load. Reduction of nib reinforcement in the dapped-end region can certainly cause a decrease in capacity. Desnerck et al. [12] also provided a congruent statement that reduces the amount of steel reinforcement in the diagonal reinforcement. The nib vertical and nib horizontal reinforcement can lead to a reduction in the failure load capacity of 35% of the control specimen.
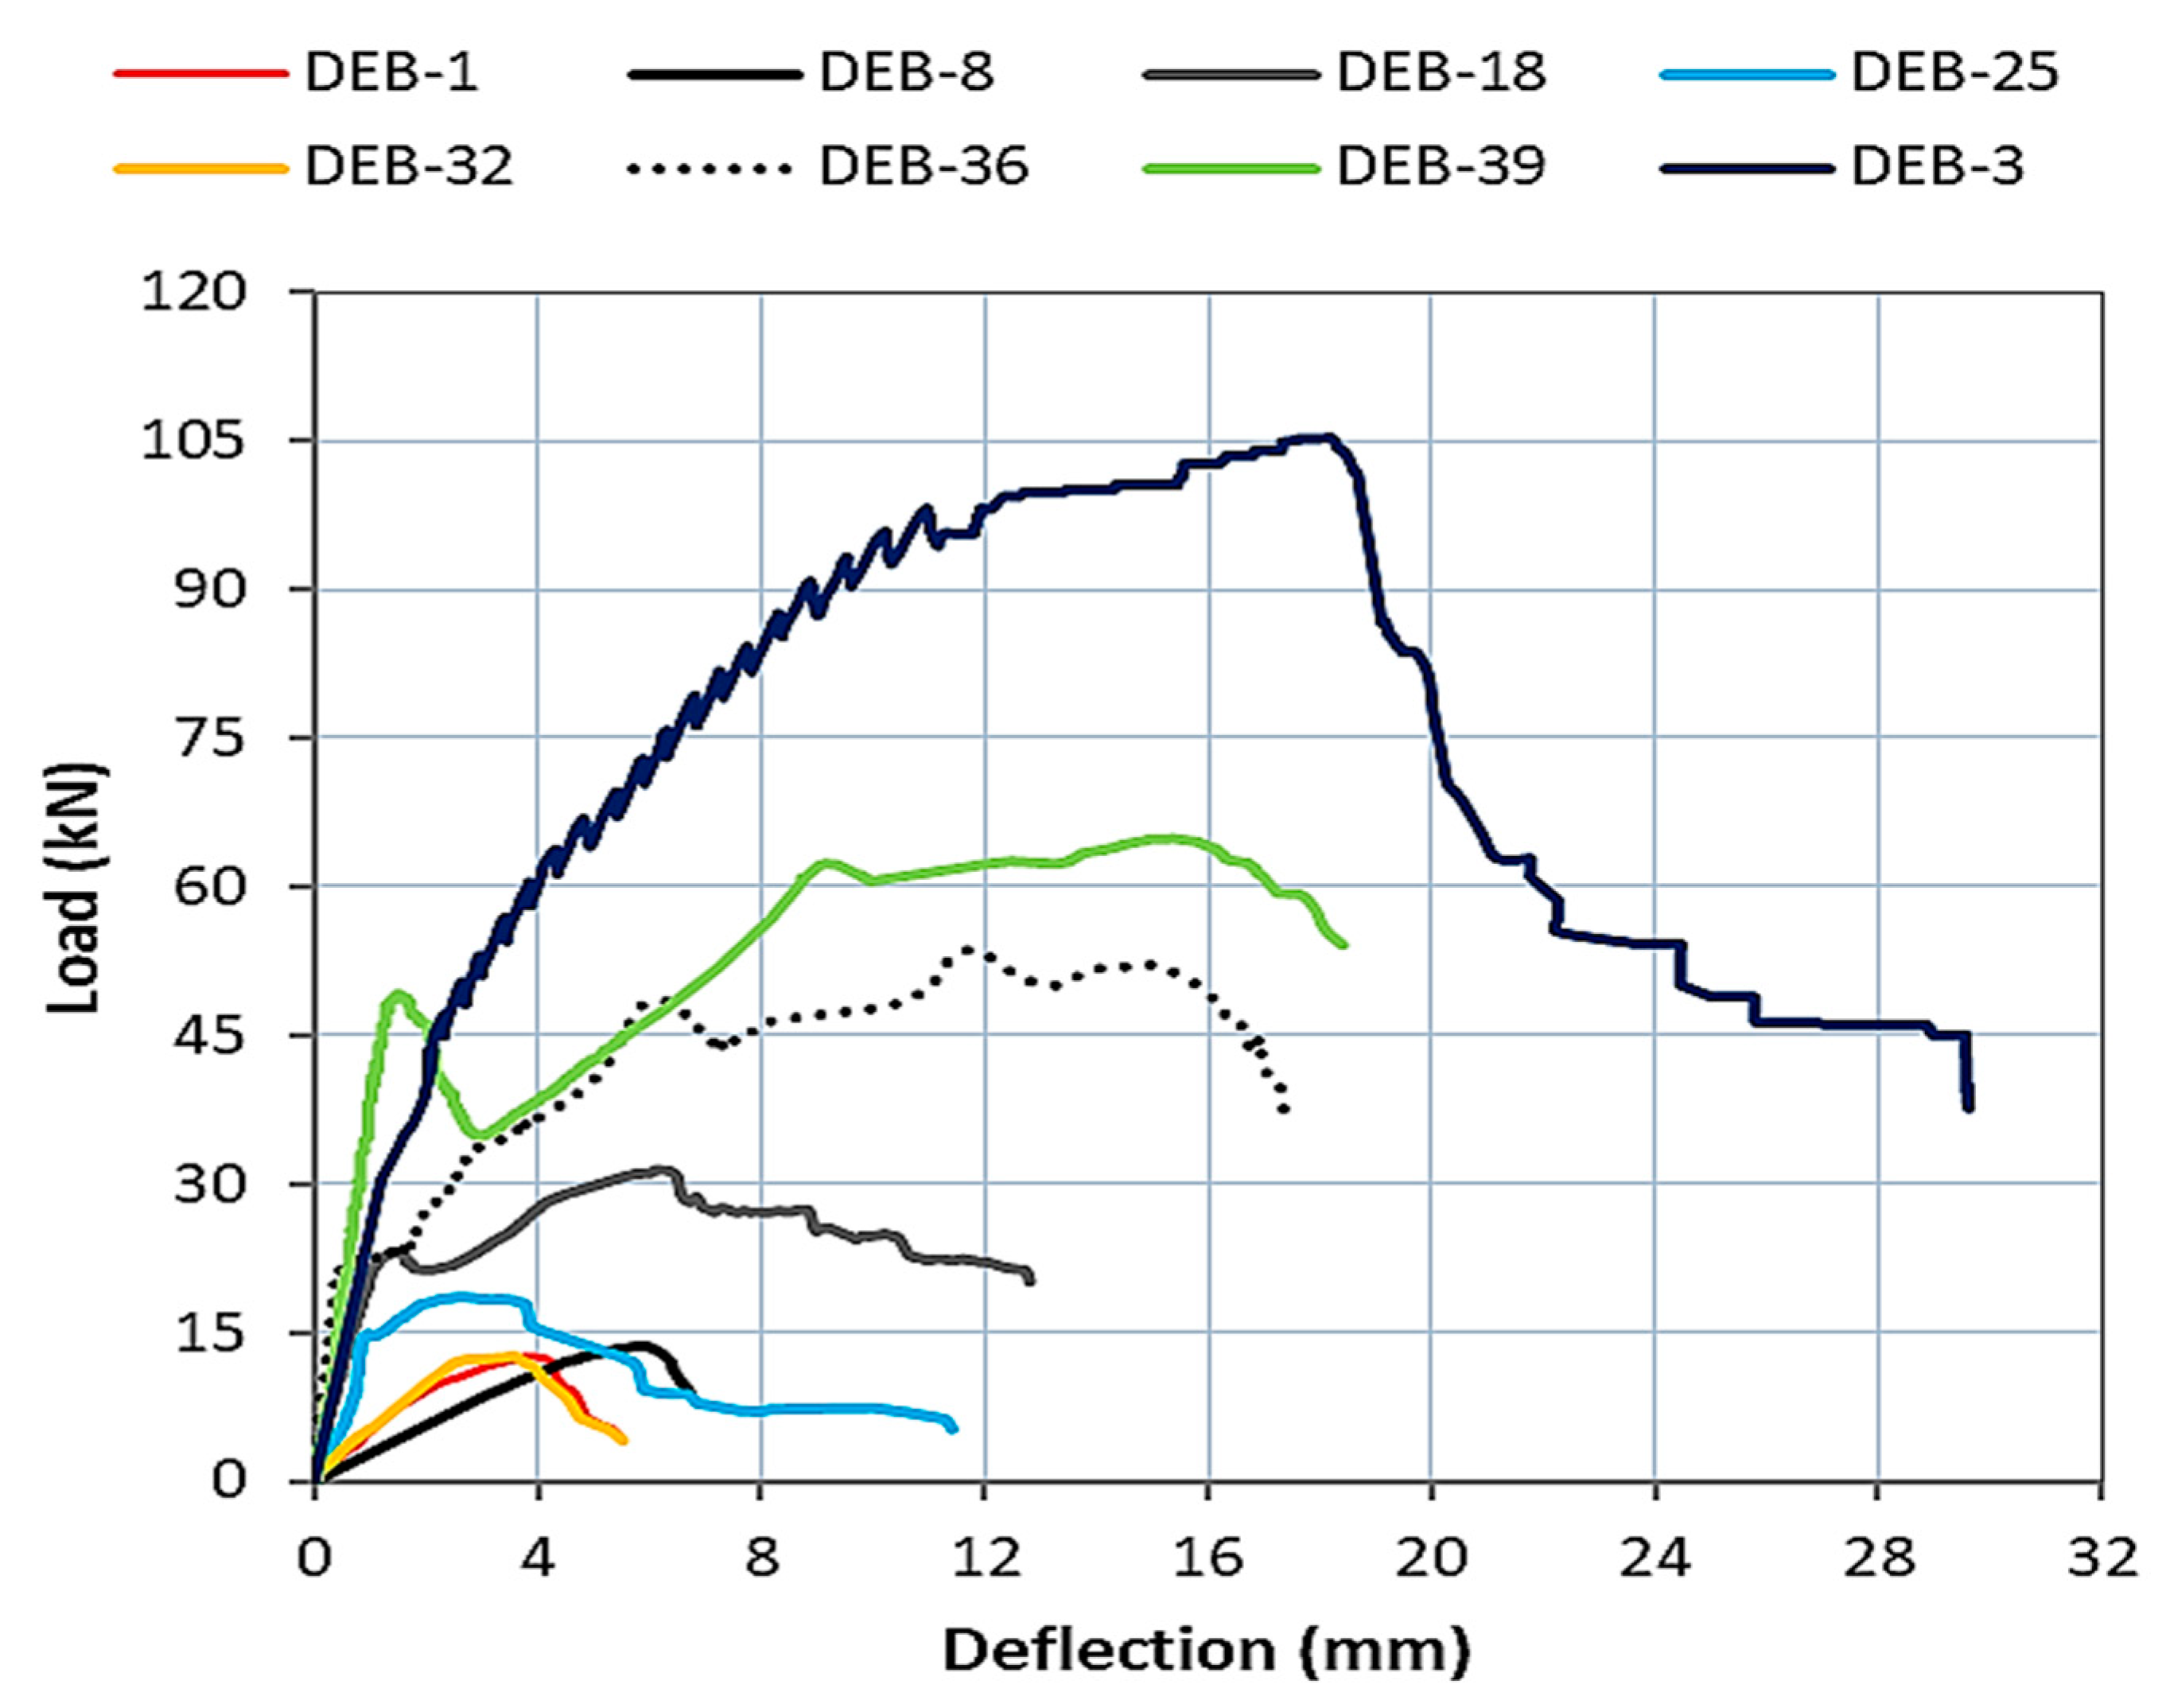
According to the load-deflection curves of all DEBs (as shown in Figure 7), it can be seen that the specimen having the four groups of dapped-end reinforcement (i.e., DEB-3) exhibited the highest structural capacity with a failure load of 105.26 kN and a rupture deflection of 29.63 mm compared to other specimens. It can be seen that all groups reinforced with dapped-end reinforcement showed post-deflection after the ultimate failure load, which confirmed that the presence of steel reinforcement at the dapped-end region of the beams plays an important role in improving the structural performance of DEBs. Meanwhile, DEB-1 failed prematurely due to the absence of dapped-end reinforcement that would have prevented the cracks from propagating.
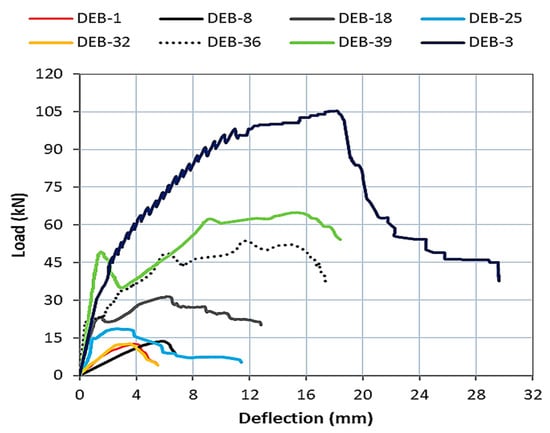
Figure 7.
Load-deflection relationship of DEBs.
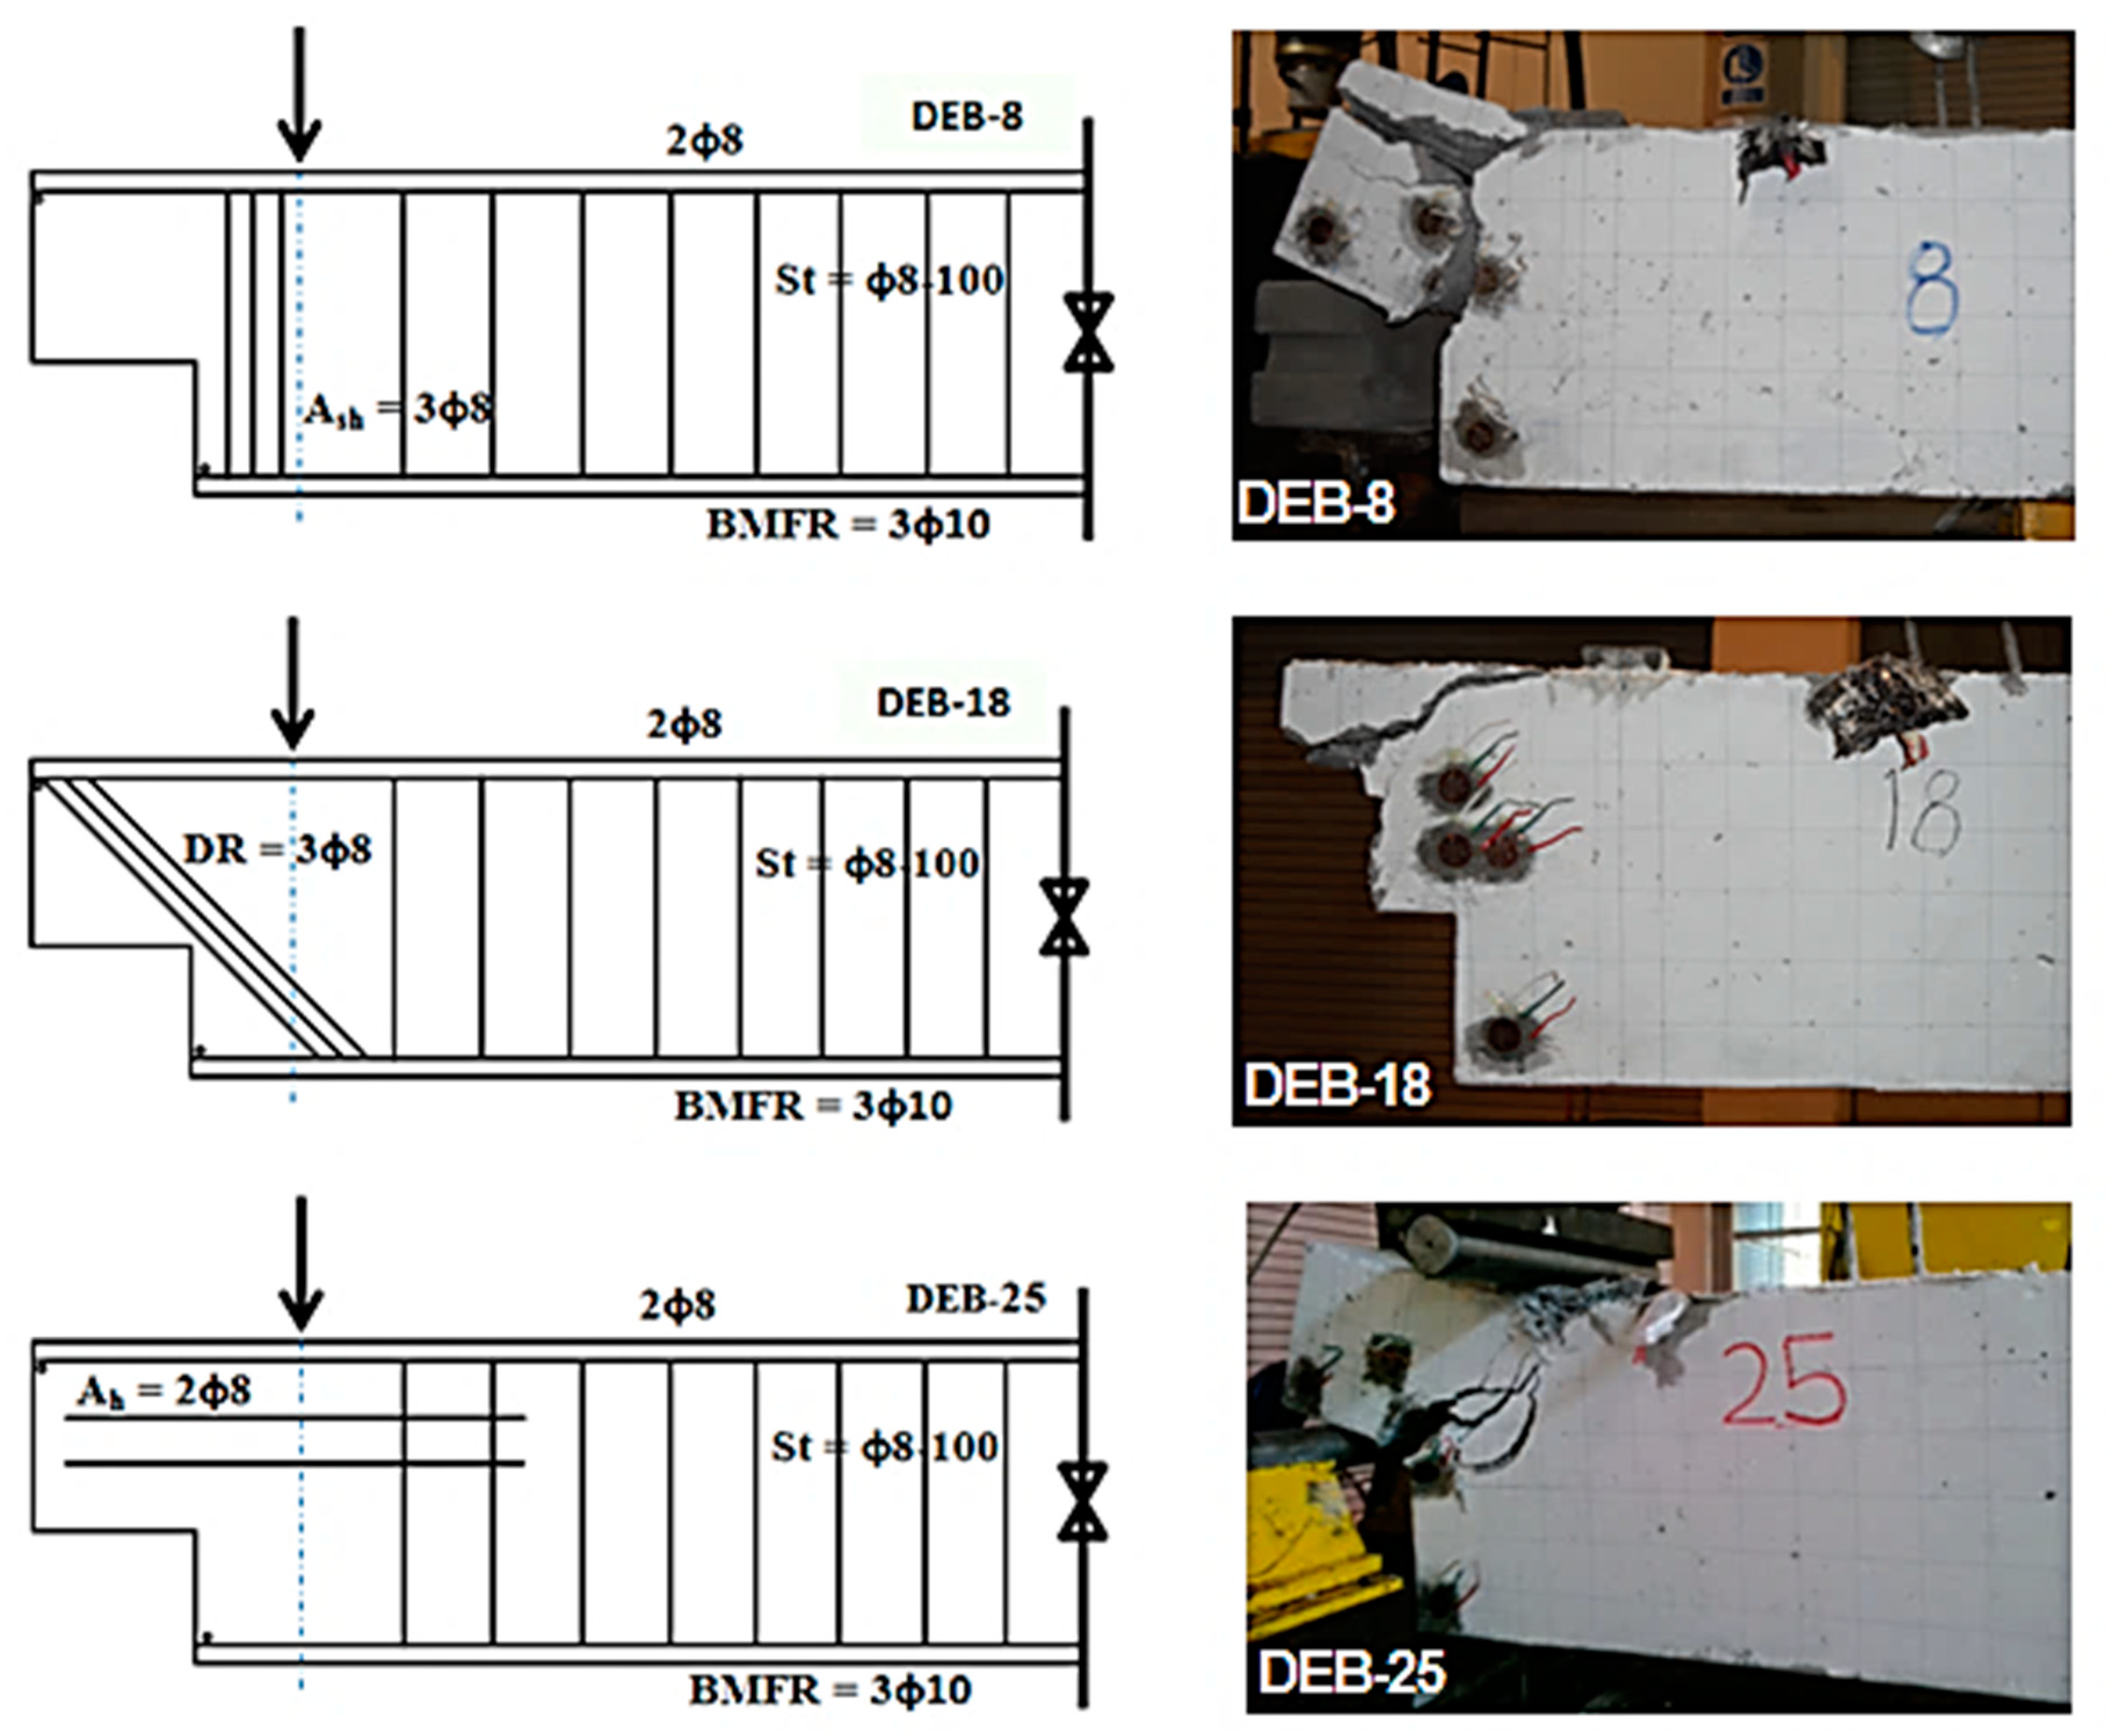
In DEB-8, the presence of HRs was quite effective in resisting the diagonal cracks coming from the re-entrant corner, but thereafter the cracks deviated and propagated vertically parallel to the direct shear plane until failure, as seen in Figure 8. As there was no other steel reinforcement to resist these cracks, DEB-8 failed rapidly. However, as shown in Figure 5, Figure 6 and Figure 7, the inclusion of only HRs in DEB-8 does not result in a considerable increase in load and deflection capacity, where the failure load and rupture deflection capacity are just marginally higher than that of DEB-1. In addition, HRs can also function to provide confinement strength in the un-dapped region, so that diagonal cracks emanating from the un-dapped part can be inhibited. This condition is in line with what has been revealed by Mattock and Chan [13], who stated that in the case of dapped-end beams, the inclined compression force in the nib region has to be resisted by a tension force of a group of hanger reinforcement placed close to the full-depth end face of the beam. However, it should also be noted that the studies in this paper have proven that a group of hanger reinforcements cannot work alone. It will function effectively if it is supported by other nib reinforcements, such as NFRs, DRs, NHRs, etc. Meanwhile, according to Rajapakse et al. [10], the addition of the amount of steel reinforcement in the hanger reinforcement group did not make a significant contribution, which only resulted in a 15% increase in strength.
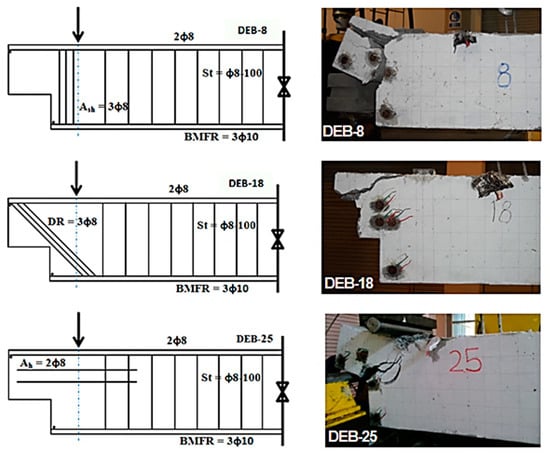
Figure 8.
Reinforcement detail and modes of failure of DEB-8, DEB-18, and DEB-25.
DEB-18 was created by replacing the HRs group with the DRs group in DEB-8. Because of its location, a group of DRs is better equipped to resist diagonal cracks from the re-entrant corner than a group of HRs. Aside from that, a group of DRs can sustain the direct shear in the shear plane region and the flexural moments from the support reaction, where the support reaction dominates over the direct shear. As a result of this circumstance, a diagonal crack appears at the support and develops vertically until failure, as shown in Figure 8. In comparison to DEB-8, DEB-18 has a 130.21% increase in failure load and a 90.06% increase in rupture deflection capacity, as shown in Figure 5 and Figure 6. According to the load-deflection curves shown in Figure 7, it can be seen that DEB-18 has better behavior than DEB-8, which has a higher deformative deflection till rupture. It is concluded that the DRs group performed better than the HRs group.
This has been proven by Desnerck et al. [11]: that the diagonal reinforcement plays a significant role in resisting the shear forces originating from the support. It was reported that dapped-end beams which having an inadequate diagonal reinforcement generated a 40% reduction in failure load capacity. Meanwhile, Aksoylu et al. [5] reported that the use of diagonal reinforcement equipped with the proper anchorage model (called Type Z) in the dapped-end purlins resulted in approximately 30% higher load capacity than other specimens.
In the case of DEB-25, basically, the NHRs group was used as reinforcement with a secondary role. The first secondary role is to aid NVRs in resisting diagonal cracks from the nib section’s corner, and the second secondary role is to aid NFRs in resisting diagonal cracks from the support. Meanwhile, the third secondary function is to aid NFRs in resisting direct shear. As a result, if the confinement strength from NVRs and the existence of NFRs as the first layer are present, all tasks of the NHRs group may be efficiently performed. The failure mode of DEB-25 was characterized by a major diagonal crack originating from the re-entrant corner, as shown in Figure 8. When the crack propagation reaches NHRs, however, the diagonal crack deviates slightly to the right. According to Figure 5, Figure 6 and Figure 7, the behavior of DEB-25 is better than DEB-8, with a 36.14% increase in failure load and a 69.44% increase in rupture deflection capacity.
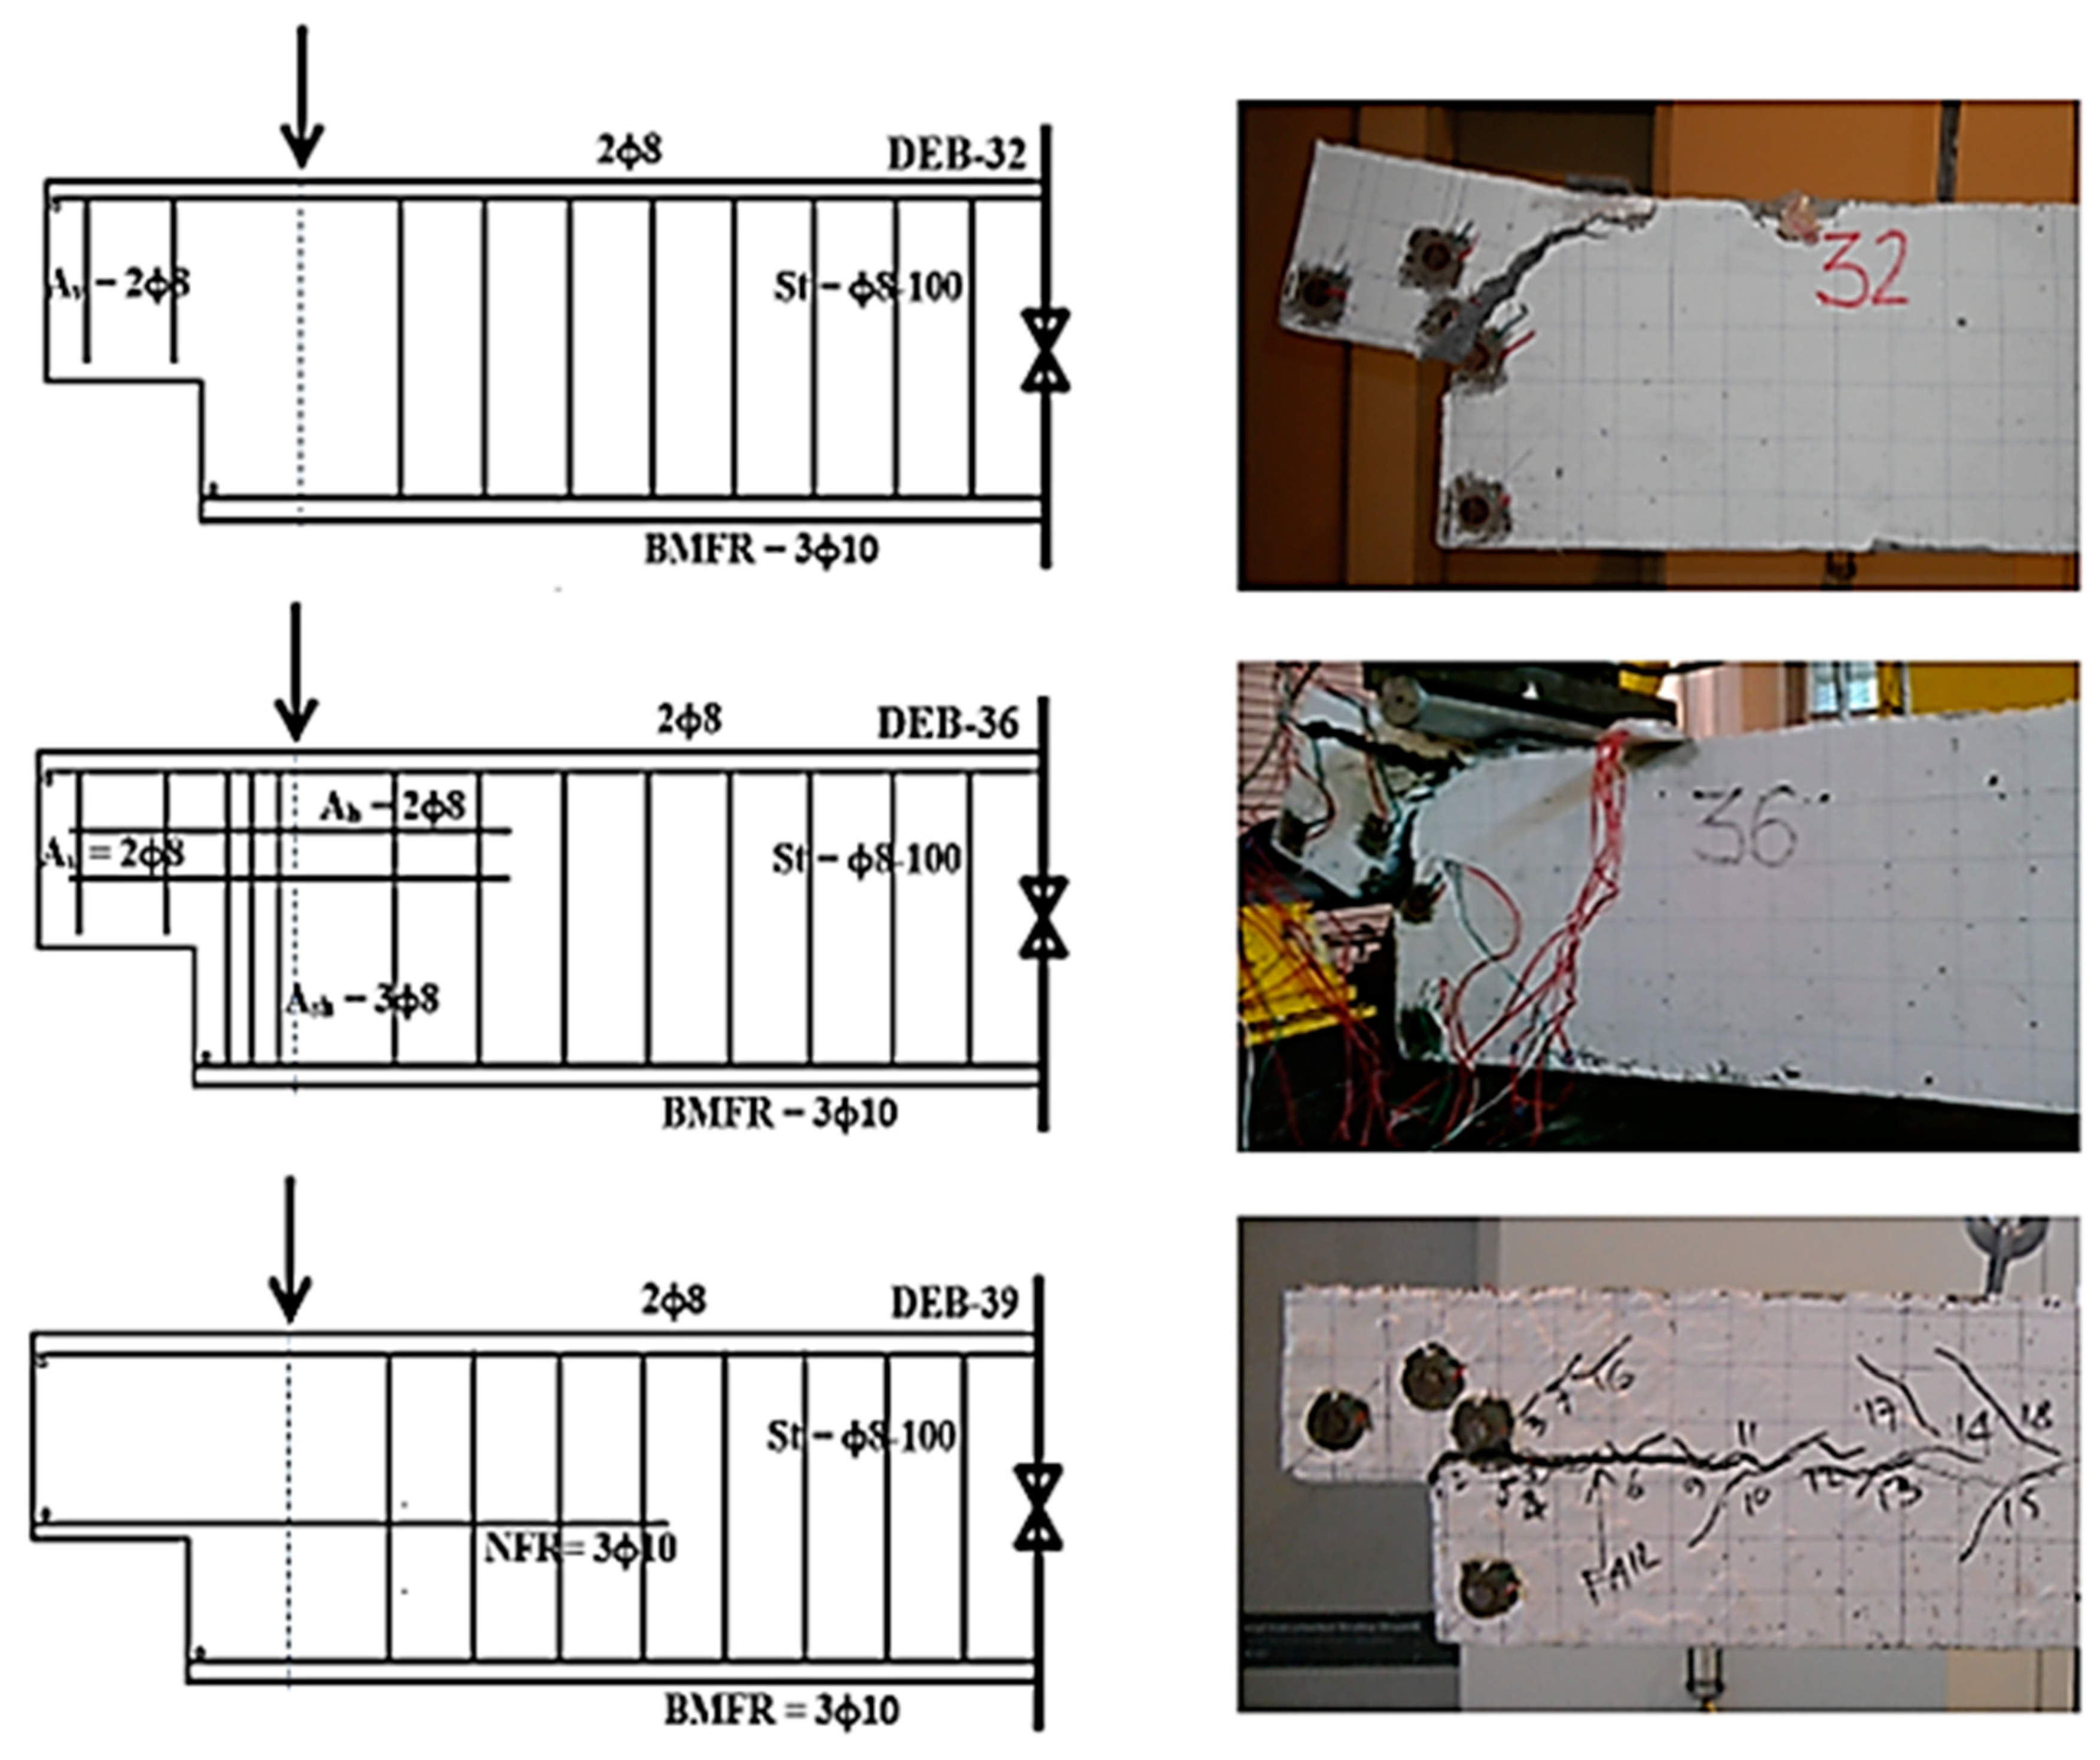
Furthermore, the use of the NVRs group for DEB-32 was intended to withstand a diagonal crack from the corner of the nib. However, the existence of the NVRs group does not operate properly due to the absence of NFRs as the anchorage holder for the NVRs’ legs. As a result, the load and deflection capacity, behavior, and failure modes of DEB-32 were identical to those of DEB-1, as seen in Figure 5, Figure 6, Figure 7 and Figure 9.
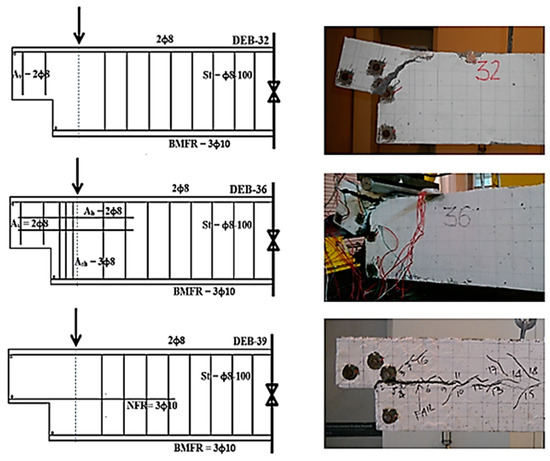
Figure 9.
Reinforcement detail and modes of failure for DEB-32, DEB-36, and DEB-39.
DEB-36 is a derivative of DEB-3 but without NFRs. It can be seen in Figure 5, Figure 6, Figure 7 and Figure 9 that the initial crack started at the re-entrant corner and moved diagonally. Because HRs exist, cracks propagation can be slowed, causing the cracks to propagate vertically until failure. On the other hand, because the NHRs group is less resistant to crack propagation than the HRs group, the crack pattern and failure modes are comparable to DEB-8. It turns out the DEB-36 has a higher failure load and rupture deflection capacity than the DEB-1, DEB-8, DEB-18, DEB-25, and DEB-32. This is due to the DEB-36’s incorporation of HRs, NVRs, and NHRs as part of its combined dapped-end reinforcement.
The NFRs group’s first and most important function is to resist the lateral stress and/or the diagonal stress from the support. The second function is to withstand the flexural moment induced by shear force at the support acting in accordance with the HRs group’s center point. In addition, another key function is to withstand direct shear at the dapped-end region’s interface or shear plane. NFRs also provide a supplementary role in preventing diagonal cracks in the dapped-end region. In terms of the primary and secondary roles of the NFRs group, the presence of NFRs has a significant impact on the structural performance of DEBs.
As illustrated in Figure 9, the cracks from the re-entrant corner develop in the diagonal direction at first for DEB-39. However, because the NFRs group may prevent and resist these diagonal cracks, the cracks deviate horizontally and propagate to failure. As for the failure mode, it can be seen that de-bonding between NFRs and concrete along NFRs revealed the modes of failure. Moreover, DEB-39 has the maximum capacity (as shown in Figure 5, Figure 6 and Figure 7) when compared to the other beams, which are DEB-1, DEB-8, DEB-18, DEB-25, DEB-32, and DEB-36. The failure load of DEB-39 was 64.85 kN, and the rupture deflection capacity was 18.41 mm. In addition, DEB-39 also has better behavior than other beams, where it showed a 106.07% increase in failure load and a 43.72% increase in rupture deflection when compared to DEB-18. Quadri and Fujiyama [48] also proved the importance of bonding strength between the nib flexure reinforcement (NFR) and the concrete in the dapped-end area. As a result of static or dynamic loading, the bond deterioration that occurs at NFR will cause a decrease in the failure load capacity of 16.92–50% compared to the control RC-DEB.
This case demonstrated that the presence of the NFRs group has a significant influence on the structure performance of RC-DEBs. Furthermore, when compared to other groups of dapped-end reinforcement, such as HRs, DRs, NVHs, or NHRs, it performs the most vital role in impeding and resisting potential cracks that may develop within the dapped-end region. Finally, according to observations made during beam testing, the initial crack for all dapped-end beams was always begun from the re-entrant corner, and the shear failure is also classified as a failure mode for all DEBs. Actually, there have been quite a number of studies related to the dapped-end beams, which reported that due to dapped-end beams being subjected to the loads, initial cracks always appear from the re-entrant corner, as has been reported by many researchers, such as Mattock and Chan [13], Desnerck et al. [7], Rajapakse et al. [10], Özkılıç et al. [15], Berger [49], and Shakir [50].
3.3. The SCF Values of RC-DEBs
Based on the SCF analysis that refers to the RSGs data, it was found that the values of the normal and principal stresses were considerably different. As demonstrated in Table 4, Table 5, Table 6 and Table 7, the stresses have various values depending on the RSG position in the dapped-end region. It can be seen that the stress levels in the dapped-end region are not equally distributed, where some localized high stresses or stress concentrations occurred in this part.

Table 4.
The stresses and SCF of RC-DEBs based on RSG-A data.

Table 5.
The stresses and SCF of RC-DEBs based on RSG-B data.

Table 6.
The stresses and SCF of RC-DEBs based on RSG-C data.

Table 7.
The stresses and SCF of RC-DEBs based on RSG-D data.
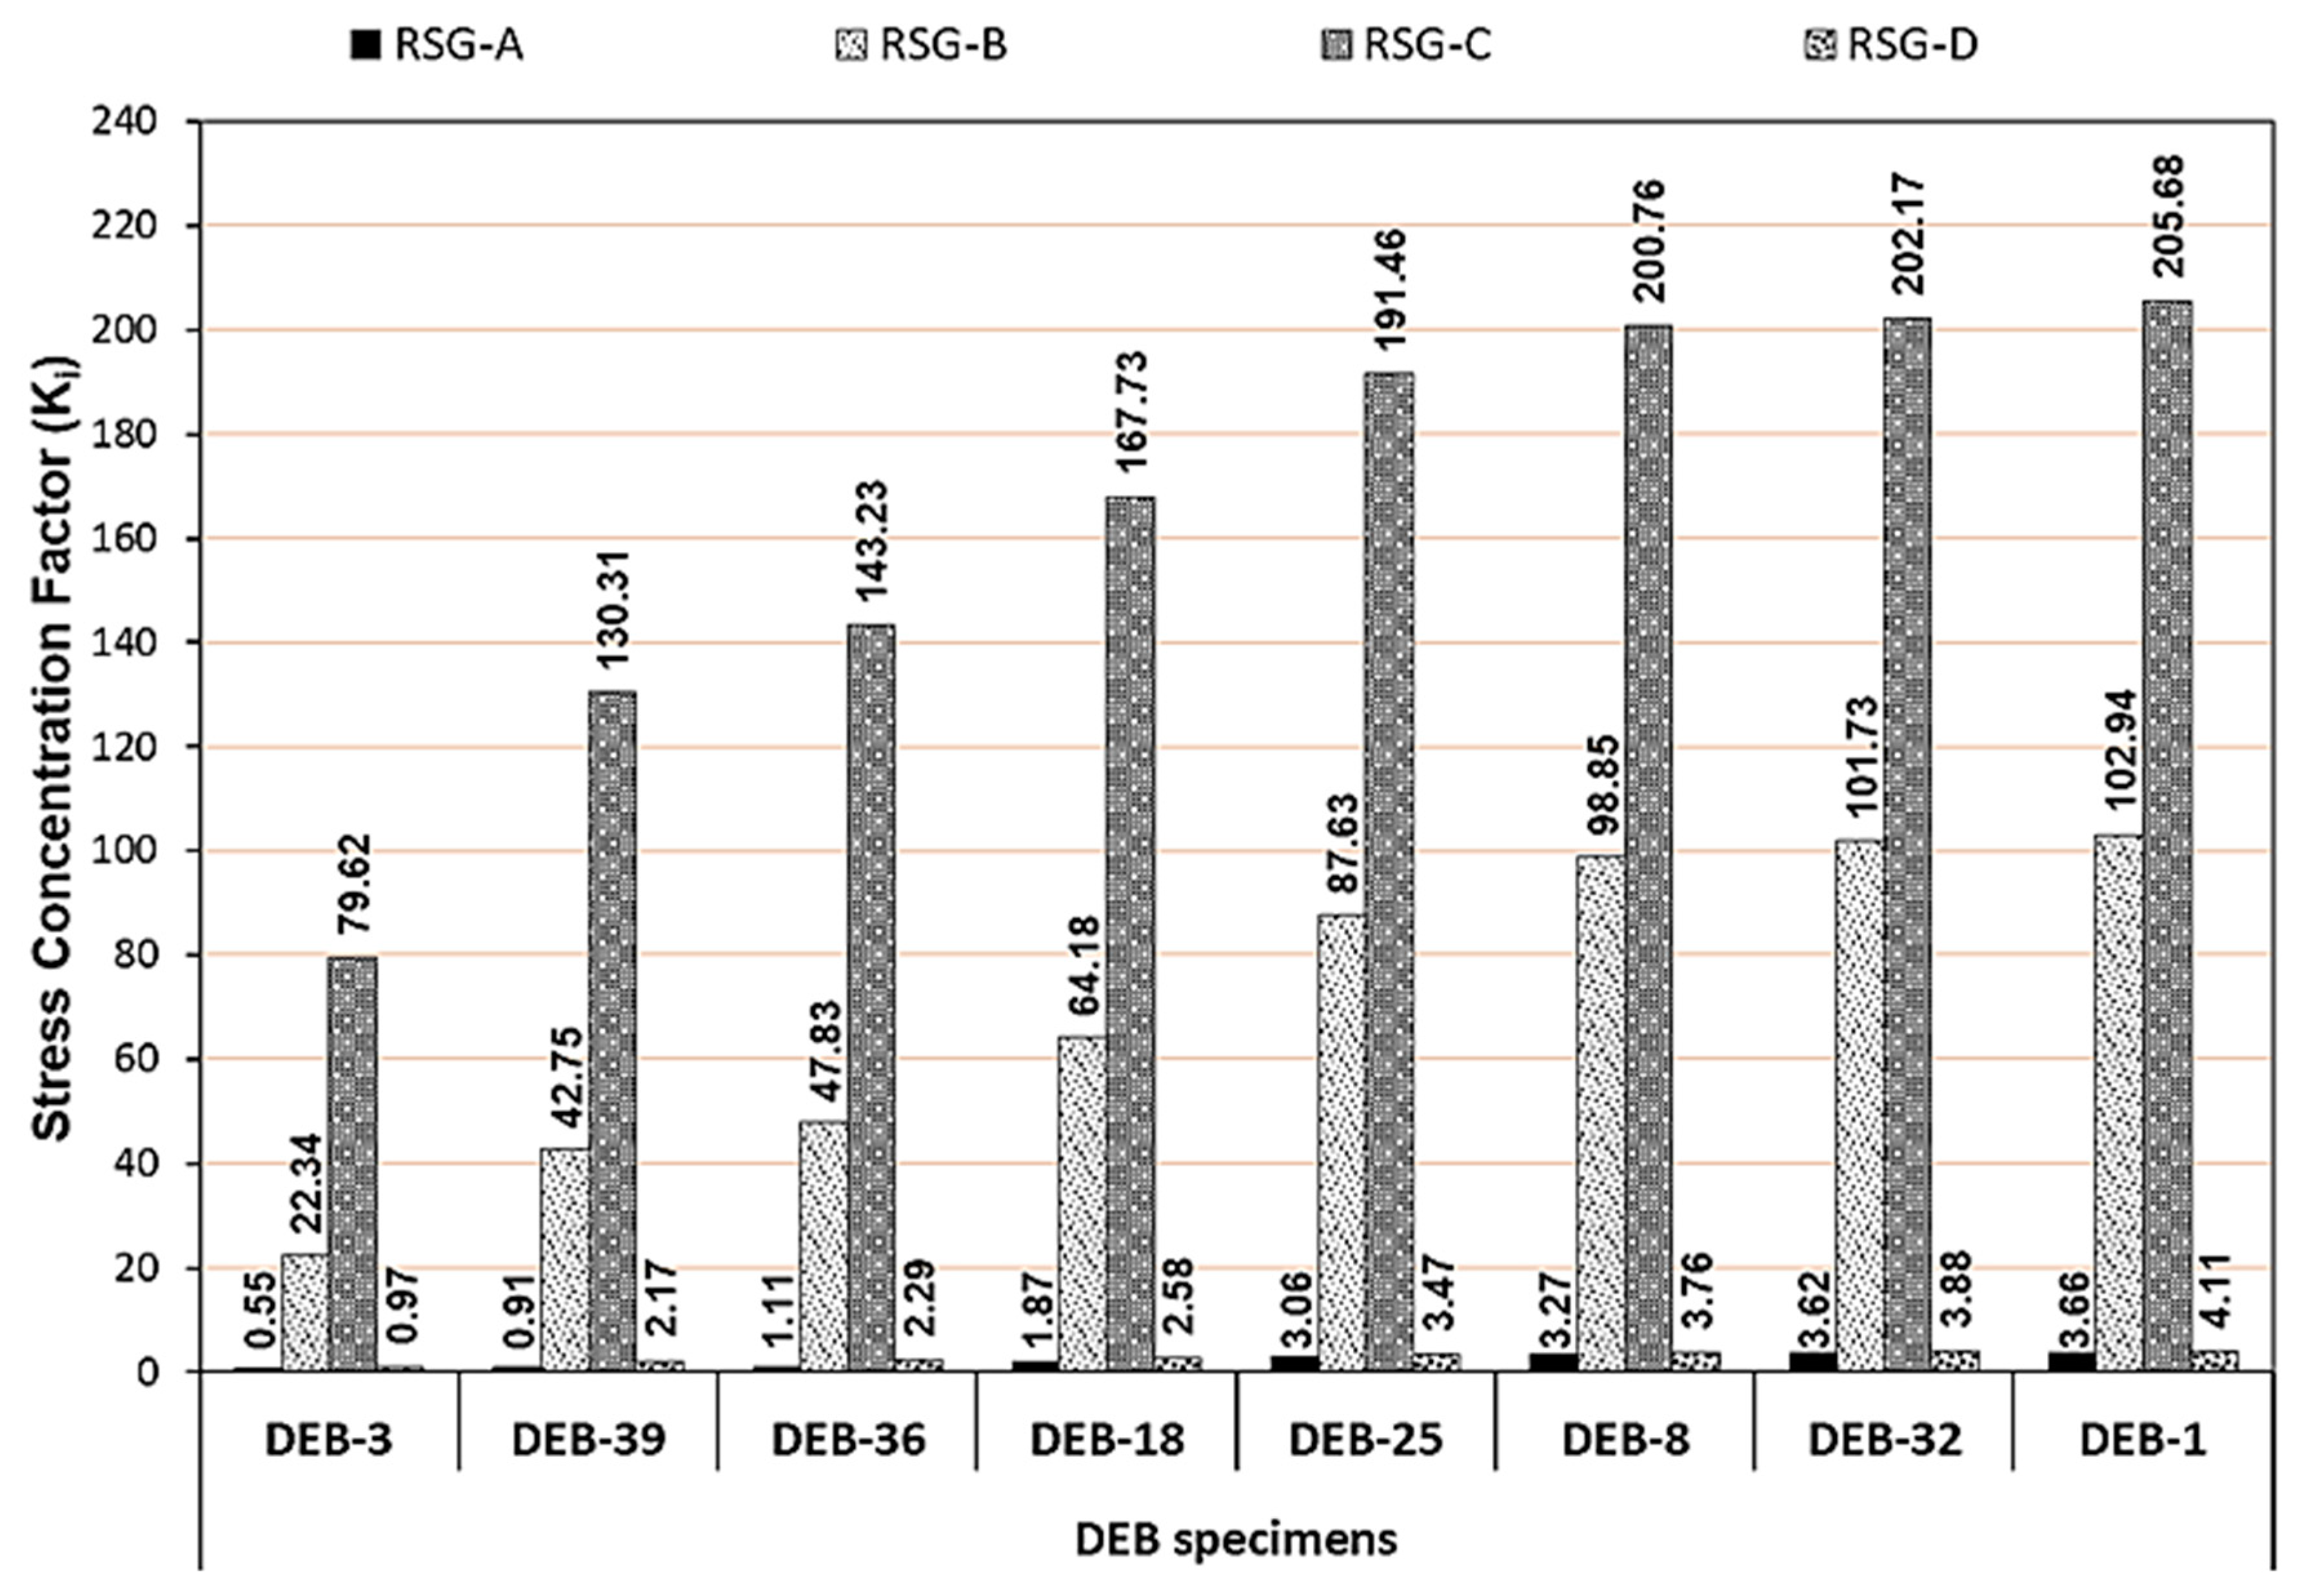
As presented in Table 4, Table 5, Table 6 and Table 7 and shown in Figure 10, the RSG-C data had the highest SCF values for each DEB specimen tested, then followed by RSG-B, RSG-D, and RSG-A. This means that the stress flows are more localized at the region which are close to the re-entrant corner and its vicinity. The stress values that occur at this region are very high, corresponding to stress concentration in the designated location. The SCF values decreased as the region moved away from the re-entrant corner, which is consistent with Saint Venant’s concept. Furthermore, the SCF values of the RSG-D were higher than those of the RSG-A. This demonstrates that the stress flows are more concentrated in the un-dapped region (where the RSG-D is located) than in the region adjacent to the nib corner (position of the RSG-A).
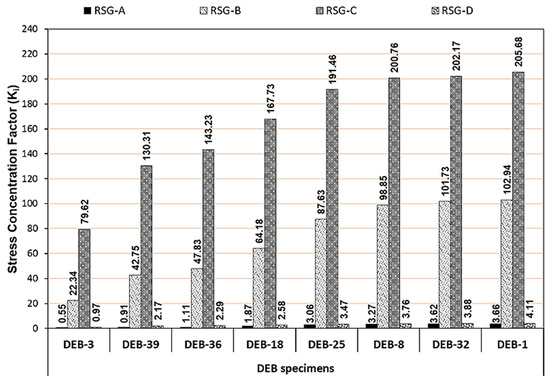
Figure 10.
The SCF values of each DEB specimen are based on the RSG data.
The fine cracks typically appeared in the un-dapped zone during the DEBs test. However, it did not occur in the region close to the nib corner. Furthermore, during the test, it was observed that the first crack always started at the re-entrant corner. Therefore, it can be seen that the re-entrant corner and its surroundings are constantly plagued with dominant cracks (including at the support). Thus, RC-DEBs’ damage and failure always begin here. The stress concentration that arises in the dapped-end area was due to the discontinuity of DEBs. FEM may be used to describe stress flows that arise in disturbed regions related to working loads, support reactions, openings, or other discontinuities, as reported by Aswin et al. [41]. Meantime, Don et al. [28] revealed that the predicted failure modes and the crack patterns of DEBs are consistently in accordance with those achieved experimentally, showing the localized ruptures at the re-entrant corner of the dapped-end region. In addition, Aksoylu et al. [5] proved that according to the test results of all specimens, dominant shear failure and damage occurred at the thinned end part of dapped-end purlins. The existence of discontinuity in the dapped end region caused the stress path flows, resulting in the stress concentration at the re-entrant corners and its surrounding area, including the support region. Damage and failure always occur in the dapped-end region.
Further analysis revealed that there is a significant and interrelated relationship between the SCF value, the failure load capacity, and the scheme of the dapped-end reinforcement group based on the RSG-A, RSG-B, RSG-C, and RSG-D data of each RC-DEB. Each DEB with less dapped-end reinforcement and an insufficient main role of the dapped-end reinforcement group had a low failure load capacity and a high SCF value. Nevertheless, DEB with more and or full dapped-end reinforcement, as well as a sufficient main role of the dapped-end reinforcement group, always generates a high failure load capacity and a low SCF value. DEB-1 had the smallest failure load capacity (12.58 kN) yet the highest SCF value (205.68). Discontinuity and stress flow in DEB-1’s dapped-end region create localized extremely high stress. Because of this situation, as well as the lack of dapped-end reinforcement, diagonal cracks develop and move fast up to failure, resulting in the least failure load capacity. In contrast, DEB-1, DEB-18, DEB-25, DEB-36, DEB-39, and DEB-3 had a more complete dapped-end reinforcement and a sufficient group of dapped-end reinforcement. DEB-3, on the other hand, has the largest failure load capacity (105.26 kN) and the lowest SCF value (79.62). The stress flows that occur in the dapped-end region can be inhibited and resisted by employing the dapped-end reinforcement groups, which are then uniformly distributed in the surrounding areas. Finally, the localized high stress can be minimized, yielding the lowest SCF value. Mohammed, Ean and Malek [43] revealed that due to the applied load, the upper corners of the opening of RC walls experienced high principal stresses along with a lower failure load capacity. Nevertheless, once the openings strengthened using CFRP, it turns out the load-carrying capacity improved. Meanwhile, the stress concentration factor decreases. It is worth noting that the CFRP pattern with 45⁰ to the corners provides better results. The CFRP strengthening is able to resist the working load and disseminate the high-stress flows sufficiently, resulting in lower SCF values.
In comparison to DEB-1, DEB-8, DEB-18, DEB-25, DEB-32, and DEB-36, the DEB-39 (which only uses the NFRs group) provided the highest structural performance and played the most important role in resisting the potential and progressive cracks that occur within the dapped-end region. This can be led to the conclusion that the use of the NFRs group is superior compared to other groups of the dapped-end reinforcement, such as HRs, DRs, NVRs, or NHRs.
4. Conclusions
Based on the results from the large-scale DEBs testing, the following conclusions can be drawn:
- The DRs group is more appropriate to be used in the DEB region than the group of HRs, NVRs and NHRs in resisting the diagonal cracks, owing to the DRs group being placed perpendicular to the crack direction. In comparison to DEB-8 (using only HRs), DEB-18 (beam with DRs only) has a 130.21% increase in failure load and a 90.06% increase in rupture deflection capacity.
- The existence of the NFRs group provides the highest structural performance and plays the most important role in resisting the potential cracks that occurred within the dapped-end region compared to the dapped-end reinforcement group of NHRs, NVRs, HRs and DRs. DEB-39 (beam having NFRs only) also has better behavior than other beams, where it showed a 106.07% increase in failure load and a 43.72% increase in rupture deflection when compared to DEB-18 (only using DRs).
- The discontinuity of DEB can cause localized high stress or stress concentration in the DEB region or at the regions that are close to the re-entrant corner. The initial crack always occurs at the re-entrant corner and develops from there. The damages or failures are frequently found at the re-entrant corner, support, and vicinity.
- The better the steel reinforcement scheme in the dapped-end region, the more DEB has the ability to reduce the localized stress flows or the stress concentration. Such DEBs are usually identified as having a larger failure load capacity with a low-stress concentration factor.
- DEB-3 (with complete dapped-end reinforcement) exhibited the highest structural capacity with a failure load of 105.26 kN and a rupture deflection of 29.63 mm compared to other specimens. Meantime, this beam has the lowest stress concentration factor (i.e., 79.62 based on the RSG-C data) compared to others. DEB-3 can withstand the applied load properly. Its adequate dapped-end reinforcement is able to accommodate and distribute the high-stress flows in the dapped-end region properly, which causes the SCF value to decrease.
- However, DEB-1 (without dapped-end reinforcement) has the smallest structural capacity with a failure load of 12.58 kN and a rupture deflection of 5.43 mm, whereas its stress concentration factor is the largest (i.e., 205.68 based on the RSG-C data) compared to others.
5. Recommendations for Designers
This study has provided useful information for the designers, among them:
- -
- HRs are not important to withstand the diagonal crack emanating from the re-entrant corner. The failure load capacity is quite low if the DEB only uses HRs, where diagonal cracks emanating from the re-entrant corner will continue to move up vertically in the direction of the shear plane until it fails. However, the DEB uses only NFRs, the diagonal crack is completely inhibited so that the crack direction moves horizontally to the right along the NFRs up to fail.
- -
- NFRs are better able to withstand diagonal cracks or shear forces that occur in the dapped-end region compared to HRs and DRs.
- -
- PCI code did not determine the use of DRs clearly in the dapped-end region. However, this paper has revealed the use of DRs only in the dapped-end region and its effect on structural behavior to help designers understand the role of the DRs group in withstanding the working load.
- -
- The designers can understand clearly the role of each dapped-end reinforcement group in withstanding the shear force or potential cracks/failures that occur in the dapped-end region, such as the group of HRs, NVRs, NHRs, DRs and NFRs.
- -
- The use of RSGs is intended to collect data on strains that occur on the concrete surface due to the phenomenon of cracks that arise due to shear forces. After that, the stress concentration factor will be obtained at each position of RSG. Based on this data, the designer can forecast which points in the dapped-end region experience the greatest stress concentration so that the failure potential can be predicted.
6. Suggestion
This research has provided the understanding that a complete dapped-end reinforcement that has been designed according to the standard code will provide reasonable structural capacity. However, dapped-end reinforcement has its own group (such as the group of HR, DR, NFR, NVR and NHR). Each reinforcement group has a certain role in the structural performance of RC-DEB due to the working load, but of course, each reinforcement group provides a different behavior and lower structural capacity. Further, in practice in the field, one can find half-join structures which have inadequate dapped-end reinforcement, which has the potential to cause damage or collapse of structures. Therefore, we need to know and understand the actual conditions related to the structural role of each reinforcement group. Aside from that, this research also revealed the relationship between the stress concentration factor and with structural capacity of RC-DEBs. All of these descriptions have been explained clearly and in detail in this paper. All this information is very useful for users or designers. However, to add to the perfection of what has not been done in this research, the authors suggest that crack width measurements, finite element modeling, parametric studies, use of full-scaled specimens, etc., can be carried out in the future.
Author Contributions
Conceptualization, M.A.; methodology, M.A. and A.A.-F.; formal analysis, M.A. and A.A.-F.; investigation, M.A.; resources, M.S.L.; data curation, M.A.; writing—original draft preparation, M.A., A.A.-F. and Z.I.S.; writing—review and editing, M.A., A.A.-F. and Z.I.S.; visualization, M.A. and A.A.-F.; supervision, M.S.L.; project administration, M.S.L.; funding acquisition, M.S.L. All authors have read and agreed to the published version of the manuscript.
Funding
This research received no external funding.
Data Availability Statement
Not applicable.
Acknowledgments
The authors would like to thank the Ministry of Education (MOE) of Malaysia and Universiti Teknologi PETRONAS for granting the project under code FRGS 2014-1.
Conflicts of Interest
The authors declare no conflict of interest.
References
- Taher, S.-D. Strengthening of critically designed girders with dapped ends. Proc. Inst. Civ. Eng.-Struct. Build. 2005, 158, 141–152. [Google Scholar] [CrossRef]
- Herzinger, R. Stud Reinforcement in Dapped Ends of Concrete Beams; University of Calgary: Calgary, AB, Canada, 2008. [Google Scholar]
- Forsyth, M.B. Behavior of Prestressed, Precast Concrete Thin-Stemmed Members with Dapped Ends; North Carolina State University: Raleigh, NC, USA, 2013. [Google Scholar]
- Botros, A.W.; Klein, G.J.; Lucier, G.W.; Rizkalla, S.H.; Zia, P. Dapped ends of prestressed concrete thin-stemmed members: Part 1, experimental testing and behavior. PCI J. 2017, 62, 61–82. [Google Scholar] [CrossRef]
- Aksoylu, C.; Özkılıç, Y.O.; Arslan, M.H. Damages on prefabricated concrete dapped-end purlins due to snow loads and a novel reinforcement detail. Eng. Struct. 2020, 225, 111225. [Google Scholar] [CrossRef]
- Mitchell, D.; Marchand, J.; Croteau, P.; Cook, W.D. Concorde overpass collapse: Structural aspects. J. Perform. Constr. Facil. 2011, 25, 545–553. [Google Scholar] [CrossRef]
- Desnerck, P.; Lees, J.M.; Valerio, P.; Loudon, N.; Morley, C.T. Inspection of RC half-joint bridges in England: Analysis of current practice. Proc. Inst. Civ. Eng.-Bridge Eng. 2018, 171, 290–302. [Google Scholar] [CrossRef]
- Al-Fakih, A.; Mohammed, B.S.; Liew, M.S. On rubberized engineered cementitious composites (R-ECC): A review of the constituent material. Case Stud. Constr. Mater. 2021, 14, e00536. [Google Scholar] [CrossRef]
- Wilden, H. PCI Design Handbook: Precast and Prestressed Concrete; Precast/Prestressed Concrete Institute: Chicago, IL, USA, 2010. [Google Scholar]
- Rajapakse, C.; Degée, H.; Mihaylov, B. Investigation of shear and flexural failures of dapped-end connections with orthogonal reinforcement. Eng. Struct. 2022, 260, 114233. [Google Scholar] [CrossRef]
- Desnerck, P.; Lees, J.M.; Morley, C.T. Impact of the reinforcement layout on the load capacity of reinforced concrete half-joints. Eng. Struct. 2016, 127, 227–239. [Google Scholar] [CrossRef]
- Desnerck, P.; Lees, J.M.; Morley, C.T. The effect of local reinforcing bar reductions and anchorage zone cracking on the load capacity of RC half-joints. Eng. Struct. 2017, 152, 865–877. [Google Scholar] [CrossRef]
- Mattock, A.H.; Chan, T.C. Design and behavior of dapped-end beams. PCI J. 1979, 24, 28–45. [Google Scholar] [CrossRef]
- Mohamed, R.; Elliott, K. Shear strength of short recess precast dapped end beams made of steel fibre self-compacting concrete. In Proceedings of the 33rd Conference on Our World in Concrete & Structures, Singapore, 25–27 August 2008; Singapore Concrete Institute: Singapore, 2008. [Google Scholar]
- Özkılıç, Y.O.; Aksoylu, C.; Arslan, M.H. Experimental and numerical investigations of steel fiber reinforced concrete dapped-end purlins. J. Build. Eng. 2021, 36, 102119. [Google Scholar] [CrossRef]
- Huang, P.-C.; Nanni, A. Dapped-end strengthening of full-scale prestressed double tee beams with FRP composites. Adv. Struct. Eng. 2006, 9, 293–308. [Google Scholar] [CrossRef]
- Nagy-György, T.; Sas, G.; Dăescu, A.; Barros, J.A.; Stoian, V. Experimental and numerical assessment of the effectiveness of FRP-based strengthening configurations for dapped-end RC beams. Eng. Struct. 2012, 44, 291–303. [Google Scholar] [CrossRef]
- Shakir, Q.M.; Abd, B.B.; Jasim, A.T. Experimental and numerical investigation of self compacting reinforced concrete dapped end beams strengthened with CFRP sheets. J. Univ. Babylon Eng. Sci. 2018, 26, 16–35. [Google Scholar] [CrossRef]
- Gemi, L.; Aksoylu, C.; Yazman, Ş.; Özkılıç, Y.O.; Arslan, M.H. Experimental investigation of shear capacity and damage analysis of thinned end prefabricated concrete purlins strengthened by CFRP composite. Compos. Struct. 2019, 229, 111399. [Google Scholar] [CrossRef]
- Aksoylu, C.; Ozkilic, Y.O.; Yazman, S.; Gemi, L.; Arslan, M.H. Experimental and numerical investigation of load bearing capacity of thinned end precast purlin beams and solution proposals. Tek. Dergi/Tech. J. Turk. Chamb. Civ. Eng. 2021, 32, 10823–10858. [Google Scholar] [CrossRef]
- Özkılıç, Y.O.; Yazman, Ş.; Aksoylu, C.; Arslan, M.H.; Gemi, L. Numerical investigation of the parameters influencing the behavior of dapped end prefabricated concrete purlins with and without CFRP strengthening. Constr. Build. Mater. 2021, 275, 122173. [Google Scholar] [CrossRef]
- Aswin, M.; Mohammed, B.S.; Liew, M.; Syed, Z. Root cause of reinforced concrete dapped-end beams failure. Int. J. Appl. Eng. Res. 2015, 10, 42927–42933. [Google Scholar]
- Abeysinghe, S.; Yapa, H. Numerical simulation of damaged reinforced concrete half-joint beams: Towards appraisal and retrofitting. Proc. Inst. Civ. Eng.-Struct. Build. 2022; Ahead of Print. [Google Scholar]
- Abdel-Moniem, A.E.N.; Madkour, H.; Abdullah, A.; Farah, K. Numerical investigation of reinforced-concrete beams with half-joints. Proc. Inst. Civ. Eng.-Struct. Build. 2020, 173, 715–729. [Google Scholar] [CrossRef]
- Abdul-Jawad, H.M. Modelling of dapped-end beams using Abaqus software. Int. J. Civ. Eng. Technol. 2018, 9, 1–10. [Google Scholar]
- Syed, Z.I.; Hejah, E.S.; Mohamed, O.A. Modelling of Dapped-End Beams under Dynamic Loading. Int. J. Mech. Eng. Robot. Res. 2017, 6 6, 242–247. [Google Scholar] [CrossRef]
- Syed, Z.I.; Kewalramani, M.; Hejah, E.S. Structural reliability of dapped end beams with different reinforcement layouts under dynamic loading. In Proceedings of the IOP Conference Series: Materials Science and Engineering, Wuhan, China, 10–12 October 2019; p. 012003. [Google Scholar]
- Don, W.; Suryanto, B.; Tambusay, A.; Suprobo, P. Forensic assessments of the influence of reinforcement detailing in reinforced concrete half-joints: A nonlinear finite element study. Structures 2022, 38, 689–703. [Google Scholar] [CrossRef]
- Ahmad, S.; Elahi, A.; Hafeez, J.; Fawad, M.; Ahsan, Z. Evaluation of the shear strength of dapped ended beam. Life Sci. J. 2013, 10, 1038–1044. [Google Scholar]
- Aswin, M.; Mohammed, B.S.; Liew, M.; Syed, Z.I. Shear failure of RC dapped-end beams. Adv. Mater. Sci. Eng. 2015, 2015, 309135. [Google Scholar] [CrossRef]
- Schlaich, J.; Schafer, K. Design and detailing of structural concrete using strut-and-tie models. Struct. Eng. 1991, 69, 113–125. [Google Scholar]
- Wang, Q.; Guo, Z.; Hoogenboom, P.C. Experimental investigation on the shear capacity of RC dapped end beams and design recommendations. Struct. Eng. Mech. 2005, 21, 221. [Google Scholar] [CrossRef]
- Moreno-Martínez, J.Y.; Meli, R. Experimental study on the structural behavior of concrete dapped-end beams. Eng. Struct. 2014, 75, 152–163. [Google Scholar] [CrossRef]
- Klein, G.; Botros, A.; Andrews, B.; Holloway, K. Dapped ends of prestressed concrete thin-stemmed members: Part 2, design. PCI J. 2017, 62, 83–100. [Google Scholar] [CrossRef]
- Mohammed, B.S.; Aswin, M.; Liew, M.; Zawawi, N.A.W.A. Structural performance of RC and R-ECC dapped-end beams based on the role of hanger or diagonal reinforcements combined by ECC. Int. J. Concr. Struct. Mater. 2019, 13, 1–19. [Google Scholar] [CrossRef]
- Mohammed, B.S.; Aswin, M.; Liew, M. Prediction of failure load of RC and R-ECC dapped-end beams. Case Stud. Constr. Mater. 2020, 13, e00433. [Google Scholar] [CrossRef]
- Ugural, A.C.; Fenster, S.K. Advanced Mechanics of Materials and Applied Elasticity; Pearson Education: London, UK, 2011. [Google Scholar]
- Pilkey, W.D.; Pilkey, D.F.; Bi, Z. Peterson’s Stress Concentration Factors; John Wiley & Sons: Hoboken, NJ, USA, 2020. [Google Scholar]
- Shigley, J.E. Shigley’s Mechanical Engineering Design; Tata McGraw-Hill Education: New York, NY, USA, 2011. [Google Scholar]
- Armenàkas, A.E. Advanced Mechanics of Materials and Applied Elasticity; CRC Press: Boca Raton, FL, USA, 2016. [Google Scholar]
- Aswin, M.; Mohammed, B.S.; Liew, M.; Syed, Z. Prediction of RC Beams Failure Load using Non-linear Finite Element Analysis. Int. J. Appl. Eng. Res. 2015, 10, 42974–42980. [Google Scholar]
- SH, F.; Soran, T. Finite Element Investigation of Stress Concentration Factor in the Concrete Wall with Openings. Asian Trans. Eng. 2012, 2, 7–17. [Google Scholar]
- Mohammed, B.S.; Ean, L.; Malek, M. One way RC wall panels with openings strengthened with CFRP. Constr. Build. Mater. 2013, 40, 575–583. [Google Scholar] [CrossRef]
- Beer, F.P.; Johnston, E.; DeWolf, J.; Mazurek, D. Mechanics of Materials; McGraw Hill: New York, NY, USA, 1992. [Google Scholar]
- Gere, J.; Goodno, B. Mechanics of Materials; CENGAGE Learning: Boston, MA, USA, 2009. [Google Scholar]
- MEMS1049. Mechatronics. Available online: https://www.pitt.edu›MEMS1082›Chapter9-3 (accessed on 21 October 2021).
- Note, M.G.T. Strain Gage Rosettes. Available online: https://manualzz.com/doc/11823544/strain-gauge-rosettes--tn-515- (accessed on 21 October 2021).
- Quadri, A.I.; Fujiyama, C. Response of Reinforced Concrete Dapped-End Beams Exhibiting Bond Deterioration Subjected to Static and Cyclic Loading. J. Adv. Concr. Technol. 2021, 19, 536–554. [Google Scholar] [CrossRef]
- Berger, P.-H. Modelling the Behavior of Dapped-End Connections with Fiber-Reinforced Concrete; Universitè de Liège: Liège, Belgium, 2021. [Google Scholar]
- Shakir, Q.M. Reinforced concrete dapped end beams–State of the Art. Int. J. Appl. Sci. 2018, 1, 44. [Google Scholar] [CrossRef]
Disclaimer/Publisher’s Note: The statements, opinions and data contained in all publications are solely those of the individual author(s) and contributor(s) and not of MDPI and/or the editor(s). MDPI and/or the editor(s) disclaim responsibility for any injury to people or property resulting from any ideas, methods, instructions or products referred to in the content. |
© 2023 by the authors. Licensee MDPI, Basel, Switzerland. This article is an open access article distributed under the terms and conditions of the Creative Commons Attribution (CC BY) license (https://creativecommons.org/licenses/by/4.0/).

