1. Introduction
Civil structures during their lifetime may be exposed to various environmental factors, such as corrosion [
1,
2], vibration and fatigue [
3,
4], impact [
5,
6,
7,
8], seismic excitations [
9,
10,
11], and strong wind or storm [
12]. These environmental factors may lead to damage to structural components. Damages in structures should be identified and repaired to prevent accidents [
13]. Among the different types of building materials, concrete is the most widely used in constructing various structures. Compared to other building materials, concrete is significantly durable and chemically resistant. Additionally, using concrete makes it possible to make various building components without limitations in size and shape. However, concrete is a brittle material [
14]. Nowadays, strengthening and repairing concrete columns has attracted much attention from researchers. When external loads on concrete columns increase strongly during an earthquake, the column can easily fail and endanger the safety of the entire structure. Therefore, finding effective methods to improve the bearing capacity and ductility of concrete columns is essential [
15]. According to previous studies, concrete columns can achieve greater compression-bearing capacity by applying confinement pressure [
16,
17,
18]. You can apply confinement pressure to concrete columns with a concrete jacket, steel jacket, or fiber-reinforced polymer (FRP) wrap. Recently, smart materials called shape memory alloys (SMA) have been used to improve the performance of reinforced concrete columns [
19]. Applying these materials to confine the reinforced concrete columns significantly increases the bearing capacity and ductility of concrete columns [
20,
21,
22,
23,
24]. Many studies have been conducted in the past decades to understand the behavior of confined concrete columns.
The first research on concrete confinement was conducted by Richard et al. [
25]. They investigated the behavior of concrete under the effect of multiaxial stresses, and the results showed the effectiveness of lateral confinement on concrete behavior. The results of this research led many researchers to investigate the behavior of concrete under the effect of lateral confinement and different methods of applying lateral confinement pressure. Generally, there are two confinement techniques: active confinement and passive confinement. Passive confinement, a common technique, is applied to concrete structures by internal steel transverse bars (e.g., spirals and closed hoops), external steel jackets, or external FRP wraps. Active confinement prestresses the reinforced concrete member before loading in transverse directions and is more effective in increasing the ultimate strength and ductility of concrete elements [
26]. Recently, several researchers have started using smart materials such as SMAs for developing active confinement in concrete members [
15,
16,
19,
20,
21,
26,
27,
28,
29,
30,
31,
32,
33,
34,
35,
36,
37,
38,
39,
40,
41,
42,
43,
44,
45,
46,
47,
48,
49,
50,
51,
52,
53,
54,
55]. Amidst this research, only a few investigations have focused on finding analytical methods to predict the behavior of concrete confined with SMA spirals, such as Chen et al. [
21,
33,
56,
57,
58].
SMAs are a group of metal alloys capable of withstanding large deformations, while being able to return to their original shape (undeformed state) by applying heat (Shape Memory Effect) or unloading (Super-Elastic) [
59,
60]. The change in crystal microstructures of SMA is mainly responsible for SME and SE [
61]. In concrete confinement, SMA wires can be used in austenite or martensite phases. If the wires used for confinement have SE properties, the confinement is passive, but if the wires used to apply confinement have SME properties with the application of initial strain, the applied confinement with SMA wires is active [
16].
The review of previous research shows that a comprehensive study has not been conducted to provide efficient formulations to predict the peak and ultimate stresses and corresponding strains of concrete cylinders confined with SMA spirals using available experimental data. In this research, the gathered database includes the results of experimental studies conducted on plain concrete cylindrical specimens confined with SMA spirals subjected to uniaxial compressive loading (monotonic and cyclic), and have been collected from the published reported between 2008 and 2022. By using this database and using Matlab and SigmaPlot software, and by performing regression analysis, equations for predicting peak stress and corresponding strain in addition to ultimate stress and corresponding strain for plain concrete cylindrical specimens confined with SMA spirals were determined. Finally, the obtained relations have been compared with the existing relationships for active confinement, which have been proposed by other researchers.
2. The Behavior of Active Confined Concrete with SMA Spirals
To apply active confinement pressure to a concrete structure using SMA spirals, the SME of SMA wires must be used with the initial strain. They are also restrained on both ends and heated using a temperature above
Af. When the martensitic SMA wire is restrained, due to the constraint provided by concrete, the spiral cannot restore its original length; rather large recovery stress is induced in the spiral, causing the confining pressure to be exerted on the concrete.
Figure 1 shows a schematic of a concrete column confined with SMA spirals [
16,
26,
47]. Mender et al. [
62] proposed a model to obtain the active confinement pressure that SMA spirals exert on concrete specimens with a circular cross-section (Equation (1)):
In this equation f
l is active confinement pressure,
ASMA is the cross-sectional area of SMA wire (mm
2),
fSMA equals the SMA wire recovery stress,
S is the pitch of the SMA spiral and
dc is the diameter of the concrete cylinders.
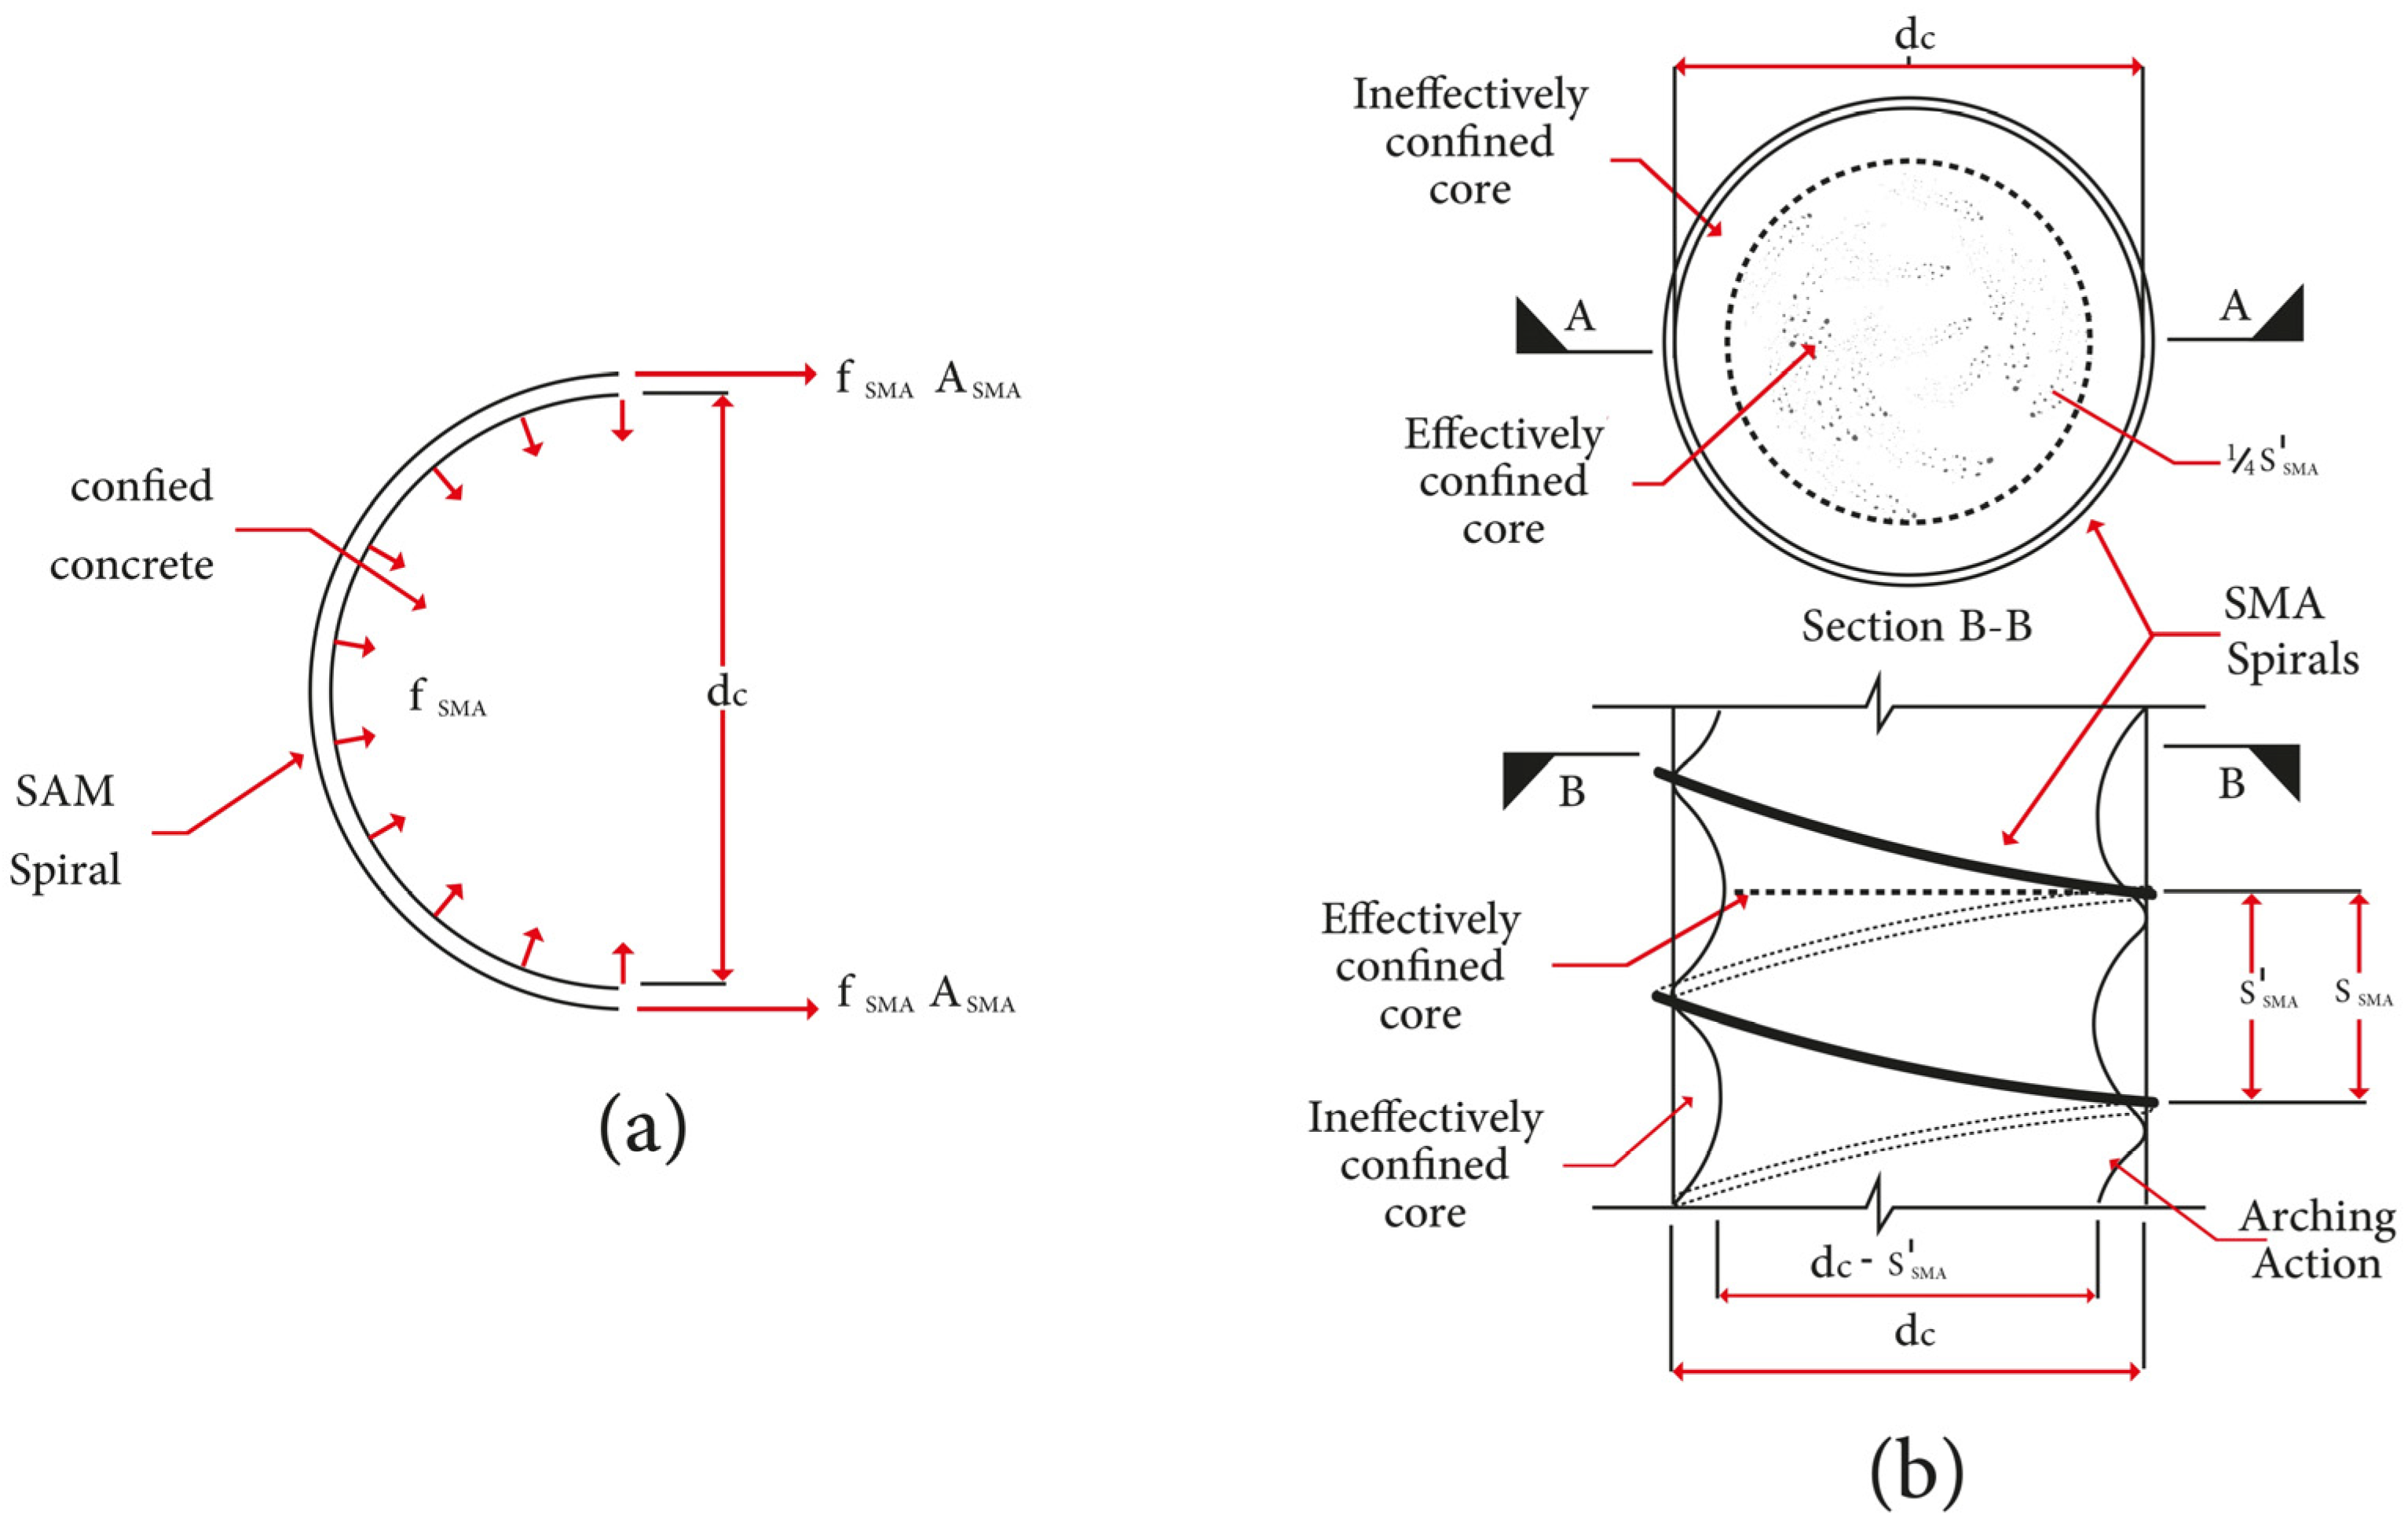
Figure 2 depicts the confinement forces and effective confinement of SMA-confined reinforced concrete columns [
19,
62].
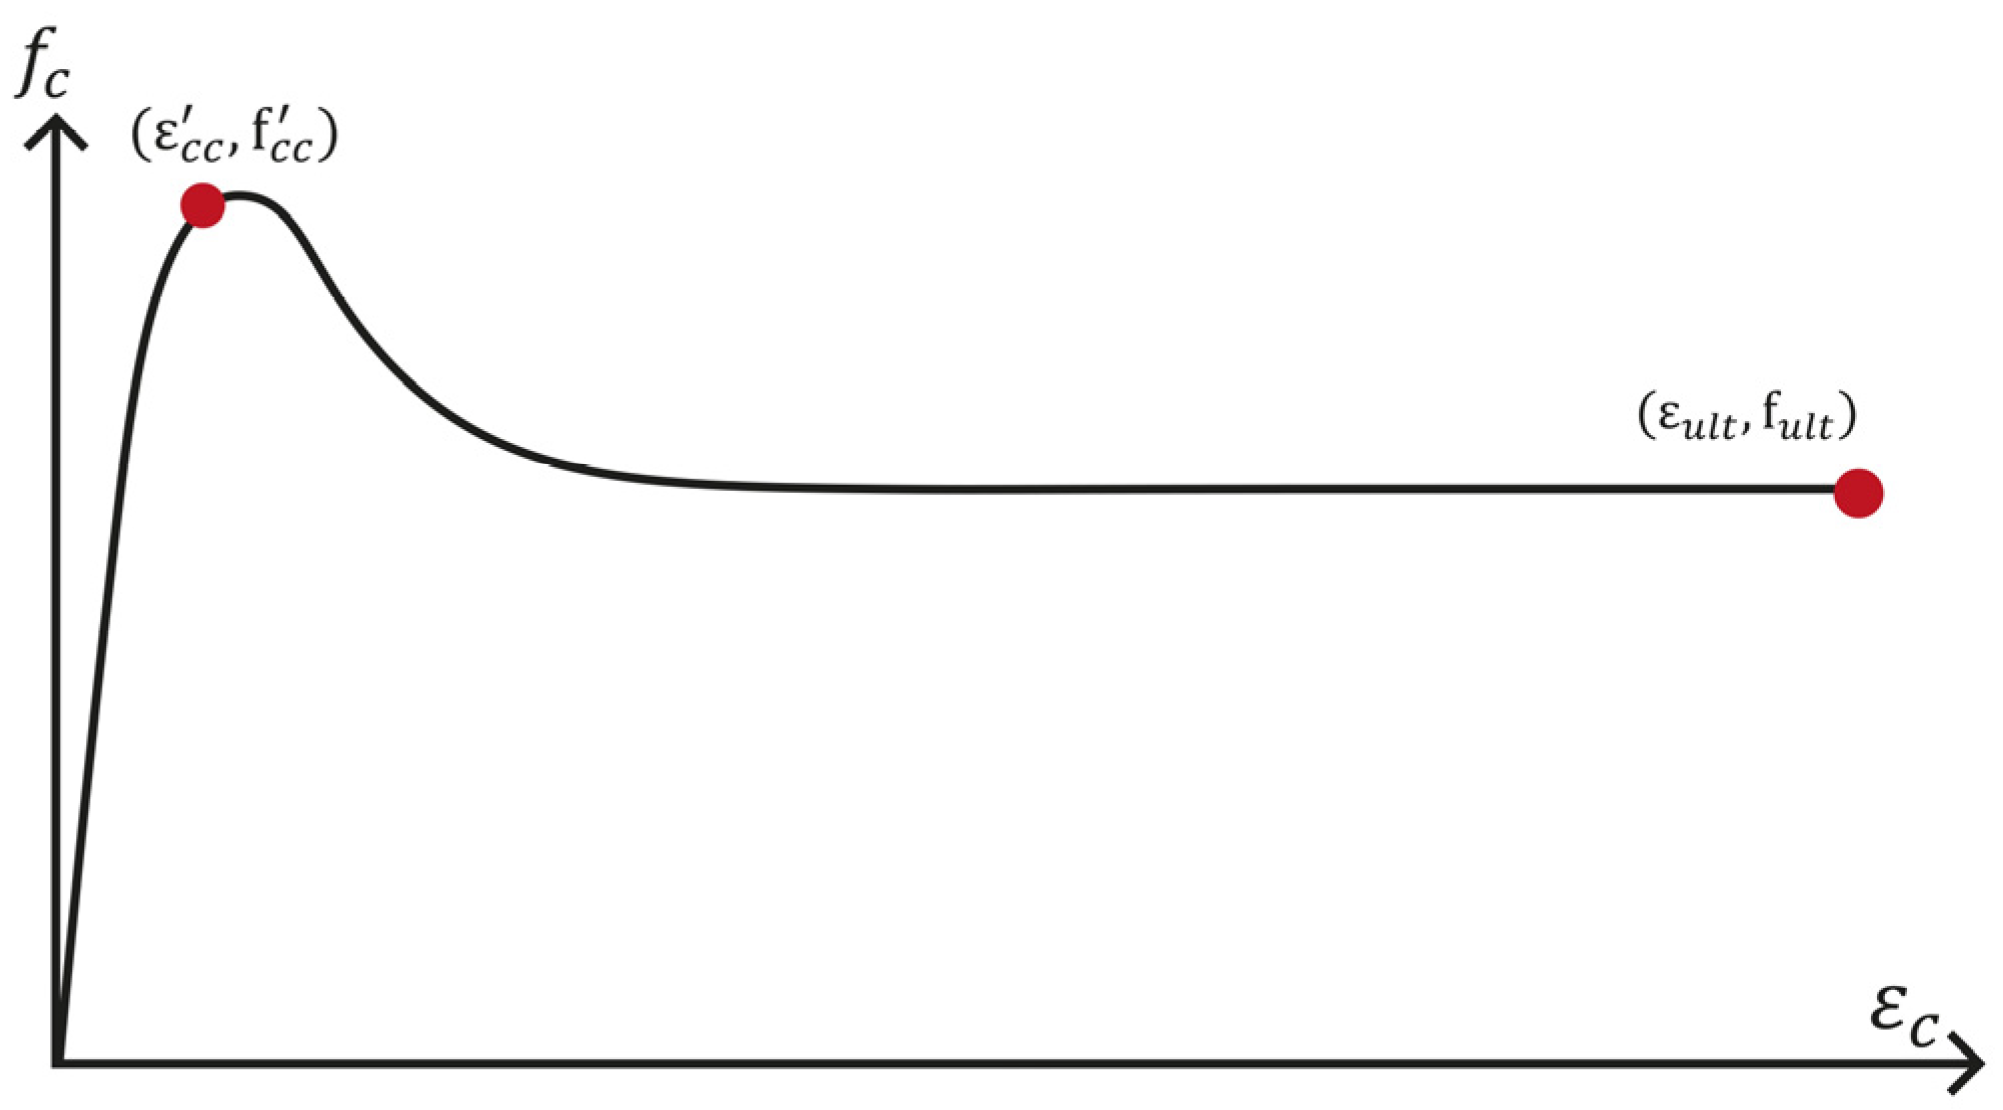
To understand and analyze the behavior of SMA-confined concrete, a schematic drawing of the axial stress-strain response of SMA-confined concrete is represented in
Figure 3. This drawing is based on observations made from test data on SMA-confined concrete and represents significant notes. As shown in
Figure 3, as the specimen is loaded beyond the elastic limit, it behaves nonlinearly, reaching its peak point at f′
cc stress and ε′
cc strain. As the loading continues, the stress-strain diagram is followed by a gradually descending branch to reach the failure point that is defined by the ultimate strain ε
ult and the corresponding ultimate stress f
ult. A review of previous research shows that various empirical equations have been developed to predict the stress-strain behavior of confined concrete. To develop an accurate constitutive model to predict the stress-strain behavior of SMA-confined concrete, it is essential to explore the characteristics of the peak axial and ultimate points [
26].
3. Collected Experimental Data
A database of the test results of SMA-confined plain concrete specimens under concentric monotonic and cyclic axial compressive loading was collected from the literature published from 2008 to 2022. The collected data included test results for normal-strength plain concrete. Among 67 test results collected, 42 test results were deemed useful for the regression analysis to obtain expressions for values of peak and ultimate stresses and corresponding strains. The database was refined based on the following criteria:
This study did not include test results on cubic and prismatic specimens. Only the test results of cylindrical specimens were considered for relationship-building.
Since the main objective of this study is to obtain expressions for the peak and ultimate stresses and corresponding strains of SMA-confined concrete, specimens of all grades of normal concrete were used.
Plain concrete cylindrical specimens without any longitudinal and transverse reinforcement were considered.
Specimens with partial SMA confinement were excluded from the study data sets.
This study includes the test results of cylindrical specimens of all sizes.
Because the purpose of the study is to obtain expressed relationships for SMA-confined concrete actively, so the specimens confined with SMA spirals in the martensite phase were considered and specimens confined with SMA spirals in the austenite phase were excluded.
As regards to the monotonic stress-strain curve of concrete cylindrical specimens confined with SMA spirals, closely follows the trend of the envelope of the cyclic stress-strain curve [
26], so in this study, all specimens confined with martensite SMA spirals under monotonic and cyclic loading, were considered for regression analysis.
Among 42 test results used for regression analysis, 17 specimens were confined with NiTi wire and 25 specimens were confined with NiTiNb wire. The strength of unconfined concrete ranged from 21.15 to 63.50 MPa. Additionally, the confinement pressure of the database ranged from 0.1754 to 5.3659 MPa with an average value of 1.7083 MPa.
Table 1 presents the experimental database used in this study.
Table 2 presents descriptive statistics of the variables used in the model development, including mean, median, mode, variance, skewness, standard error, standard deviation, kurtosis, maximum, minimum, and data range.
4. Regression Analysis
In many mathematical models in engineering, there are problems in which it is necessary to evaluate the parameters of the model and develop an empirical (or semi-empirical) equation based on the existing experimental data. Estimation of the parameters of such equations can be carried out by regression analysis. Regression analysis is the application of mathematical and statistical methods for the analysis of the experimental data and the fitting of the mathematical models to these data by the estimation of the unknown parameters of the models. For regression analysis, mathematical models are classified as linear or nonlinear with respect to unknown parameters. Most mathematical models encountered in engineering and science are nonlinear in the parameters. These parameters can be determined by the implementation of nonlinear regression methods [
63].
The theory of linear regression has been expounded by statisticians. Nonlinear regression is an extension of the linear regression methods used iteratively to arrive at the values of the parameters of the nonlinear models [
63]. The general form of the nonlinear regression model is expressed as Equation (2) [
64]:
In this equation,
is the dependent variable, f is a nonlinear function,
x is an independent variable,
is a vector of unknown parameters,
is independent and identically distributed random errors with mean zero and constant variance
, and
n is the number of experimental data [
64].
In MATLAB software, the Statistics and Machine Learning Toolbox include statistical functions and the Curve Fitting Toolbox provides various functions for linear and nonlinear regression analysis. Curve fitting in MATLAB can be done with the fit function. This function fits various types of curves or surfaces to the data. To obtain the coefficient estimates, the least-squares method minimizes the summed square of residuals. To begin fitting a regression, data are put into a form that fitting functions expect.
In SigmaPlot software, there are different types of nonlinear equations, such as Polynomial, Sigmoidal, Exponential, Hyperbolic, Power, Rational, Logarithmic, three-dimensional, and standard curves. The fitting curve for each type of equation in SigmaPlot is obtained by using experimental data and obtaining the unknown parameters in each function.
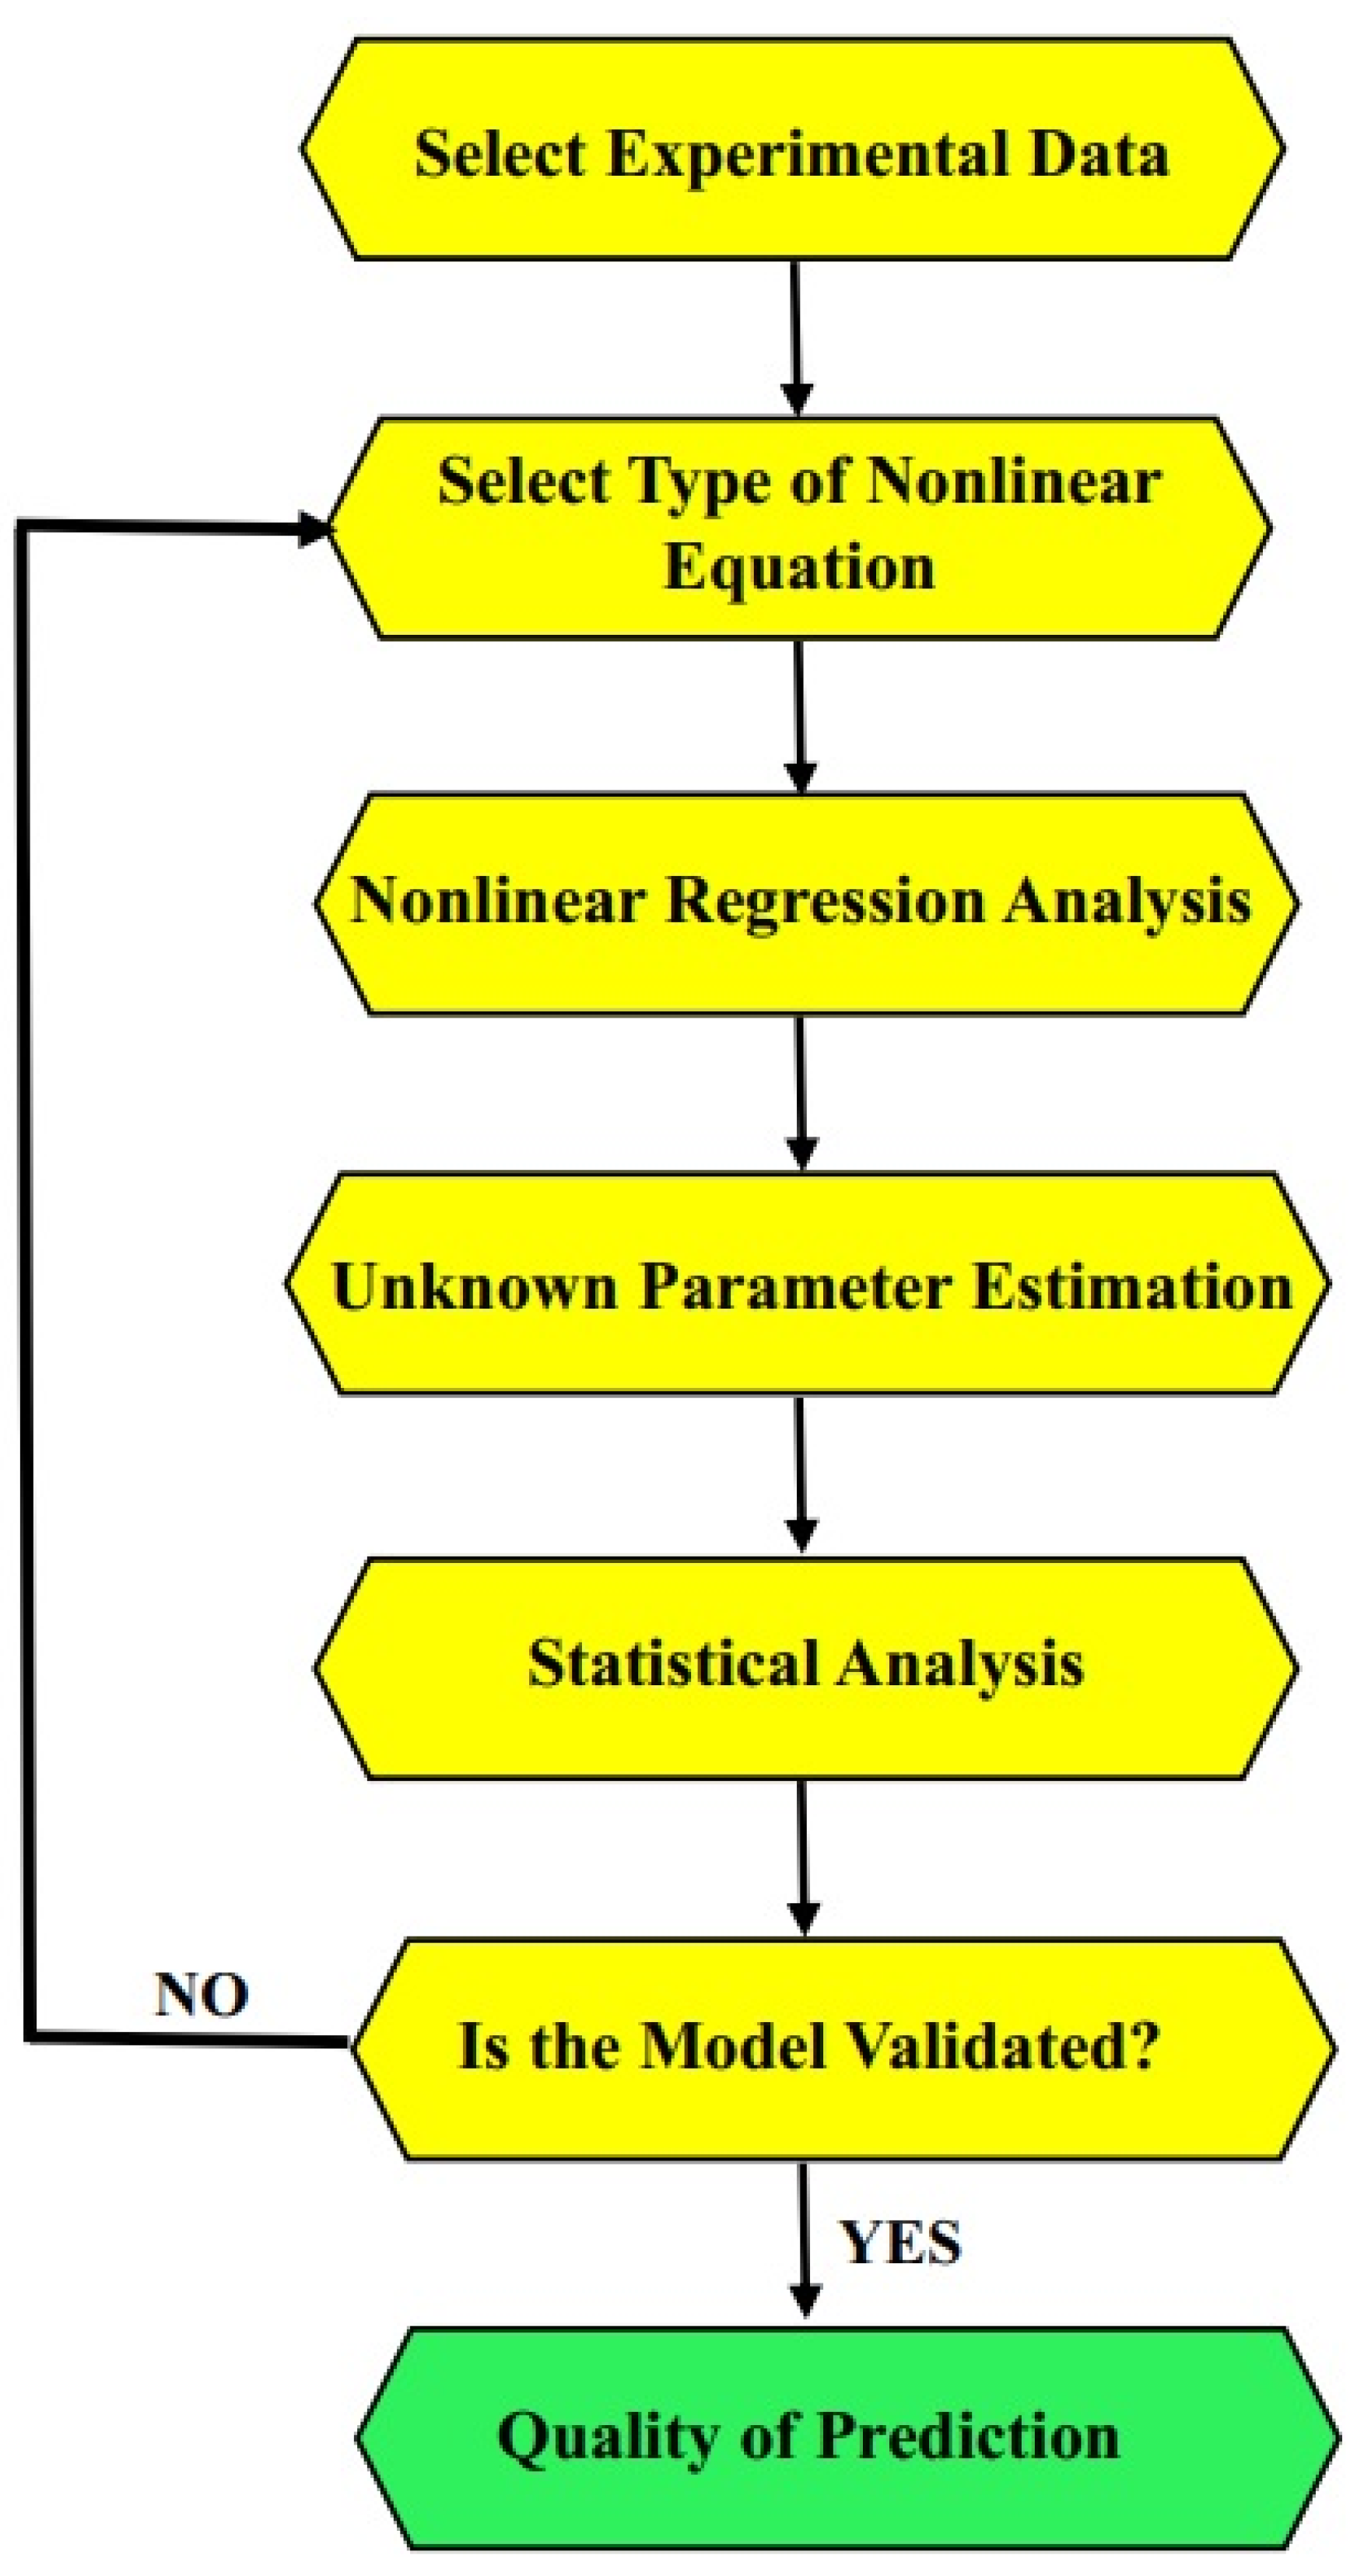
Figure 4 summarizes the different steps of nonlinear regression. As can be seen, whenever the selected nonlinear function is not able to evaluate the responses with proper accuracy, the type of function is changed and the nonlinear regression analysis is repeated until the appropriate equation is reached.
This section develops several numerical models to predict the compressive strength and axial strain of the concrete cylindrical specimens confined with SMA spirals. These models are based on nonlinear regression analyses which are implemented by MATLAB and SigmaPlot software.
4.1. 2D Expression for Prediction of Peak Compressive Strength
The peak strength equation is a mathematical relationship in which the confined concrete peak strength is expressed as a function of the unconfined concrete peak strength and the lateral confining pressure of the SMA spirals. The increased strength due to confinement pressure is represented by the strength enhancement factor, which is the ratio of the confined concrete peak compressive strength (fcc) to the unconfined concrete peak compressive strength (fco). The confinement ratio is the ratio of the lateral confining pressure provided by the confining materials (SMA spirals, in this study) to the unconfined concrete compressive strength.
A two-dimensional equation is a relationship in which the dependent variable (here the strength enhancement factor) is expressed in terms of an independent variable (here the confinement ratio). In general, two-dimensional peak strength expression for confined concrete is expressed as Equation (3), which is a linear relation [
65]:
Gradually, with developing confinement relationships, various nonlinear equations have been formulated for predicting the peak strength of confined concrete (Equation (4)) [
65]:
In Equations (3) and (4), is the strength enhancement factor and is the confinement ratio. and , are fitting parameters that must be determined using experimental database to obtain the peak strength equation.
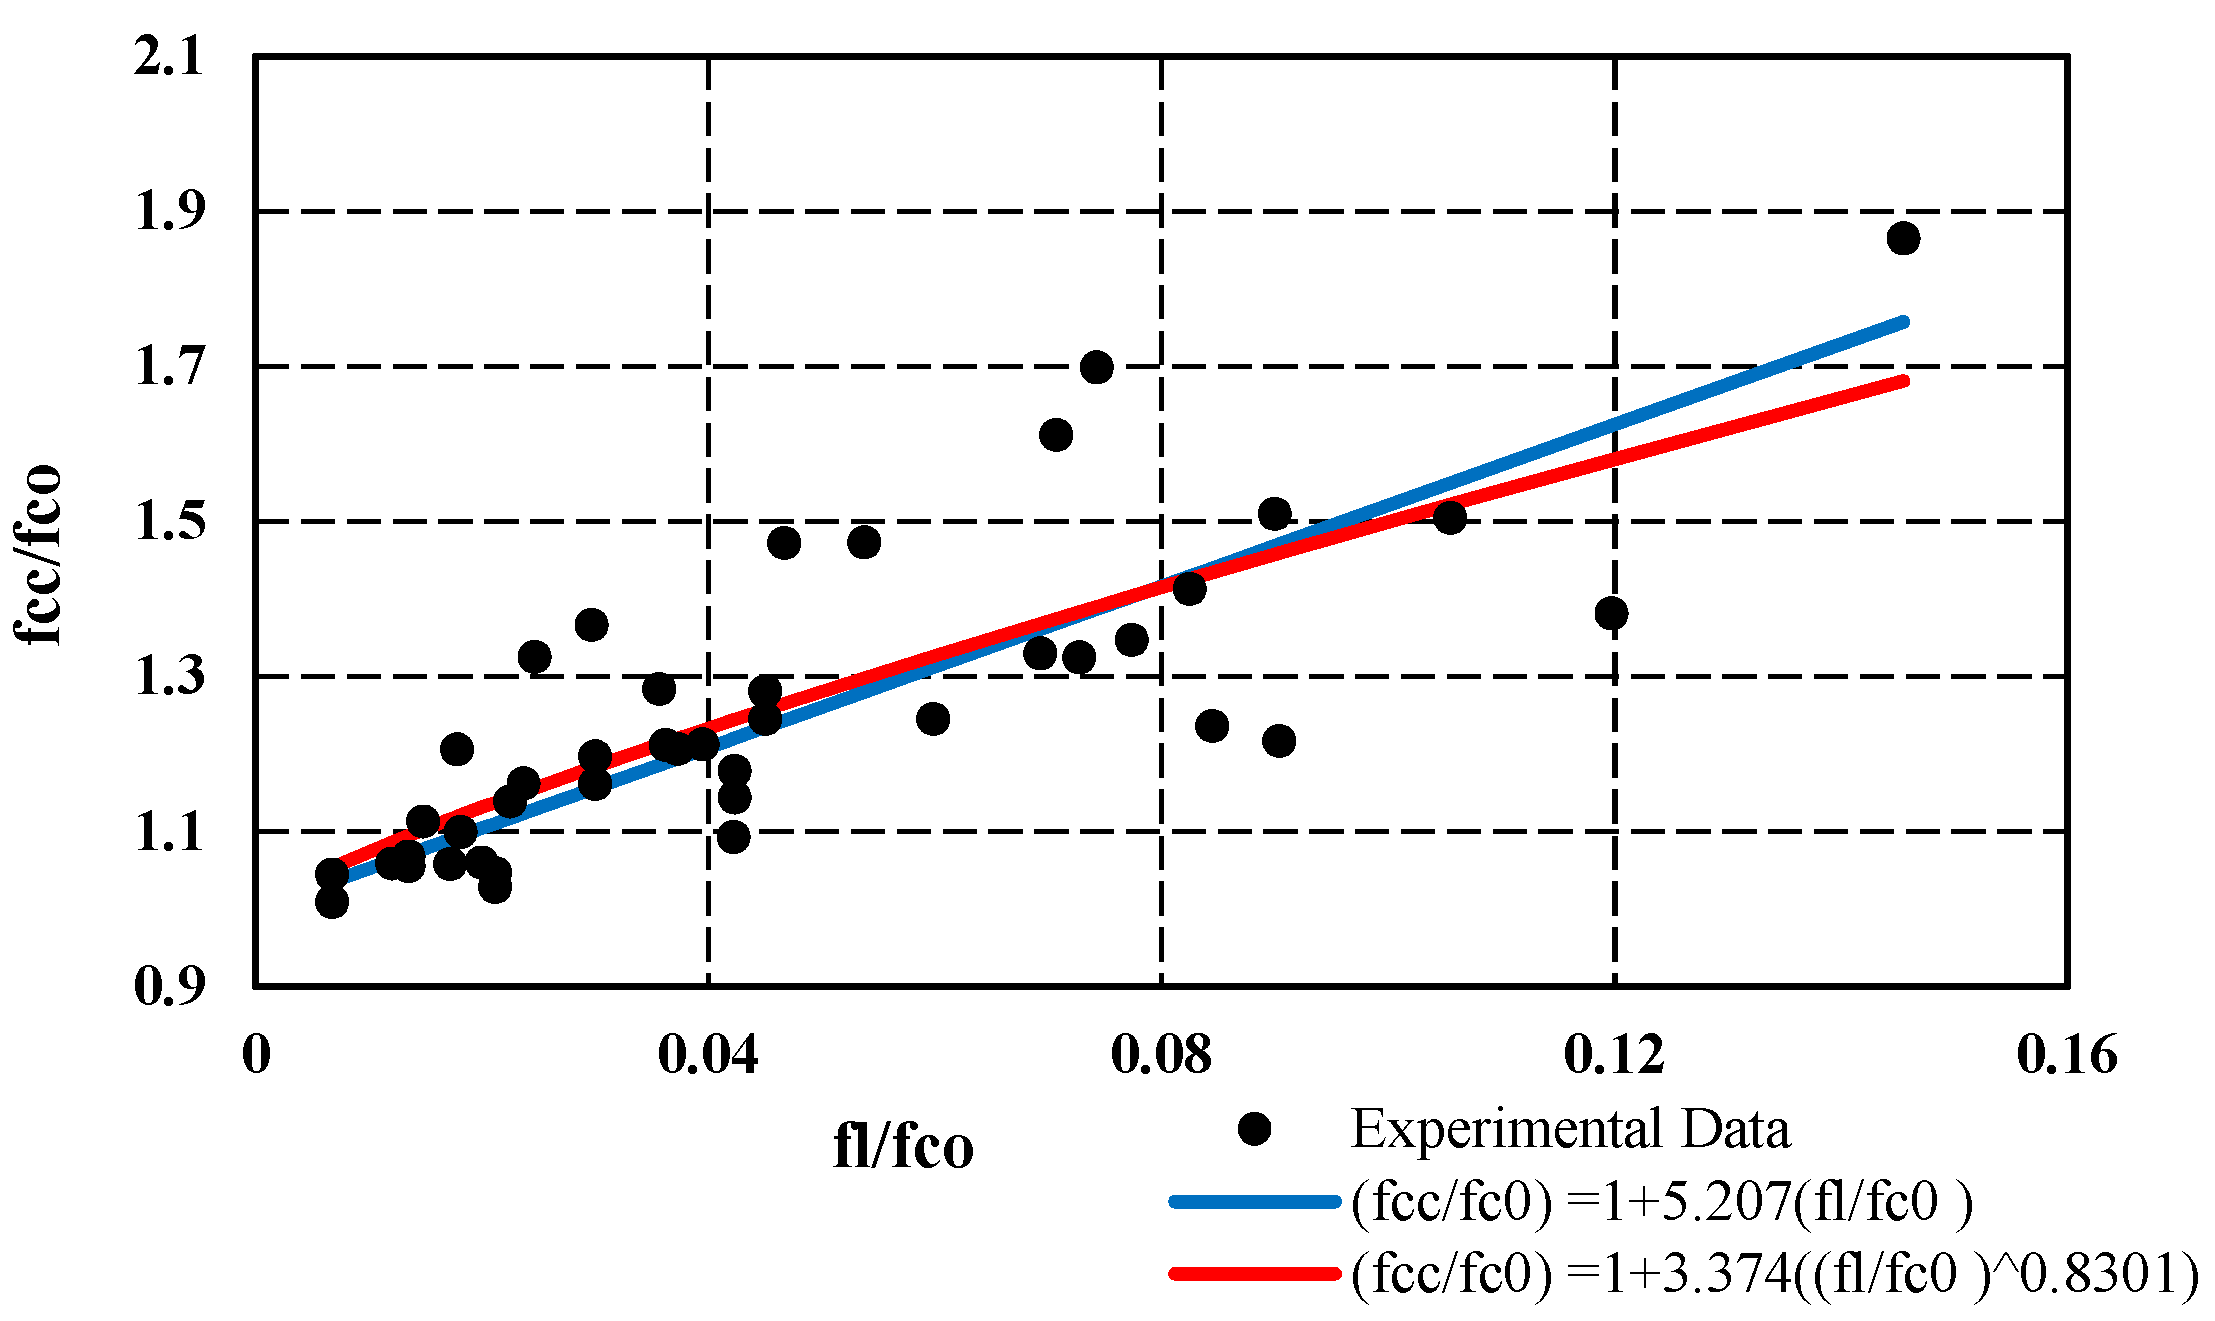
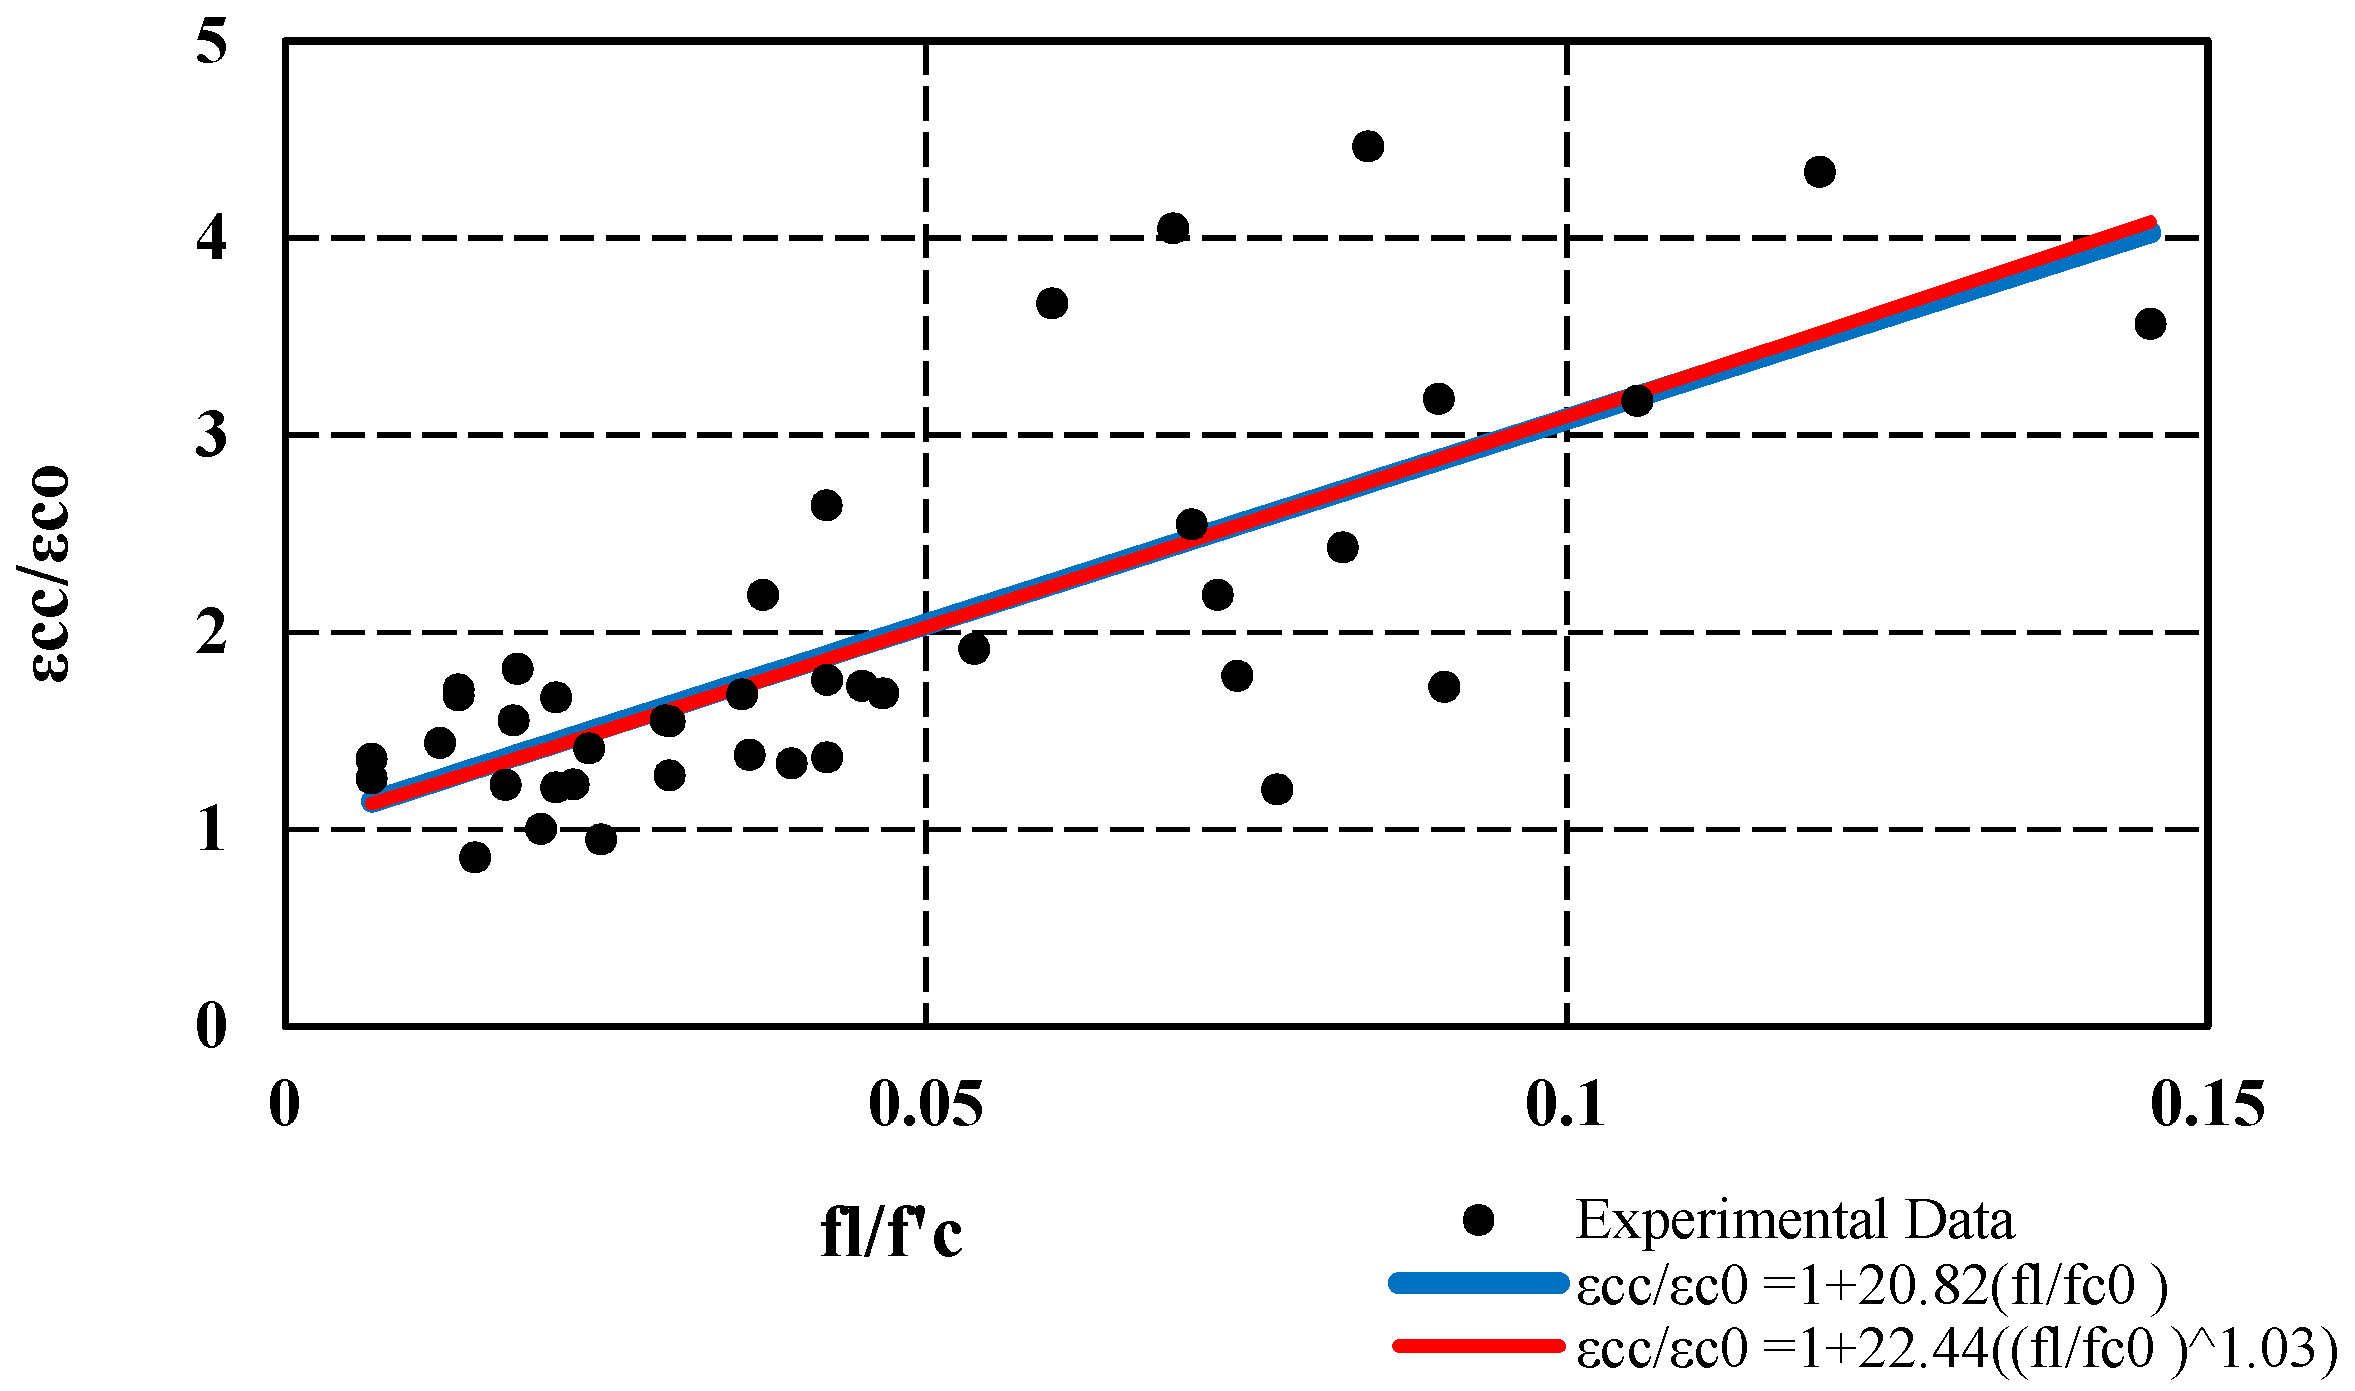
The reviews indicate that using Equations (3) and (4) to predict the peak strength of SMA-confined concrete, does not provide good results (
Table 3 and
Figure 5). Hence for predicting the peak strength of concrete cylindrical specimens confined with SMA spirals, five two-dimensional expressions were developed with the enhancement factor and confinement ratio (Equation (8a–e)).
Using nonlinear regression analysis done by MATLAB and SigmaPlot software, and according to statistical indicators including root mean square error [
66], and the coefficient of determination [
66,
67] (Equations (5)–(7)), the best expression is selected.
The purpose of regression analysis is to use existing data to obtain an expression for predicting the target variable (dependent) in terms of input variables (independent) [
68]. Nonlinear regression analysis is an extension of linear regression analysis that is used to obtain the best curve fitting of data in cases where the relationship between parameters is nonlinear. The coefficients in this type of regression analysis are calculated using an iterative algorithm [
65].
In these equations,
Xthe and
Xexp are the theoretical and experimental values, respectively, and
n shows the number of specimens.
and
are the mean values of the theoretical and experimental estimations, respectively. The R
2 (coefficient of determination) varies from 0 to 1, and a higher value indicates a better fit of a model. On the other hand, a lower RMSE (root mean square error) value indicates higher accuracy of the proposed model [
67].
.
Statistical criteria, including RMSE and R
2, are used to obtain the best fit relation. According to the statistical analyses, that results are shown in
Table 4, it can be seen that Equation (8e) has the maximum coefficient of determination (R
2 = 0.8110), and that the RMSE value of this equation (RMSE = 0.1032) is fairly similar to other proposed equations (RMSE = 0.1004 to 0.1131). Therefore, using two-dimensional equations, the Equation (8e) is the best for predicting the peak strength of concrete confined with SMA spirals.
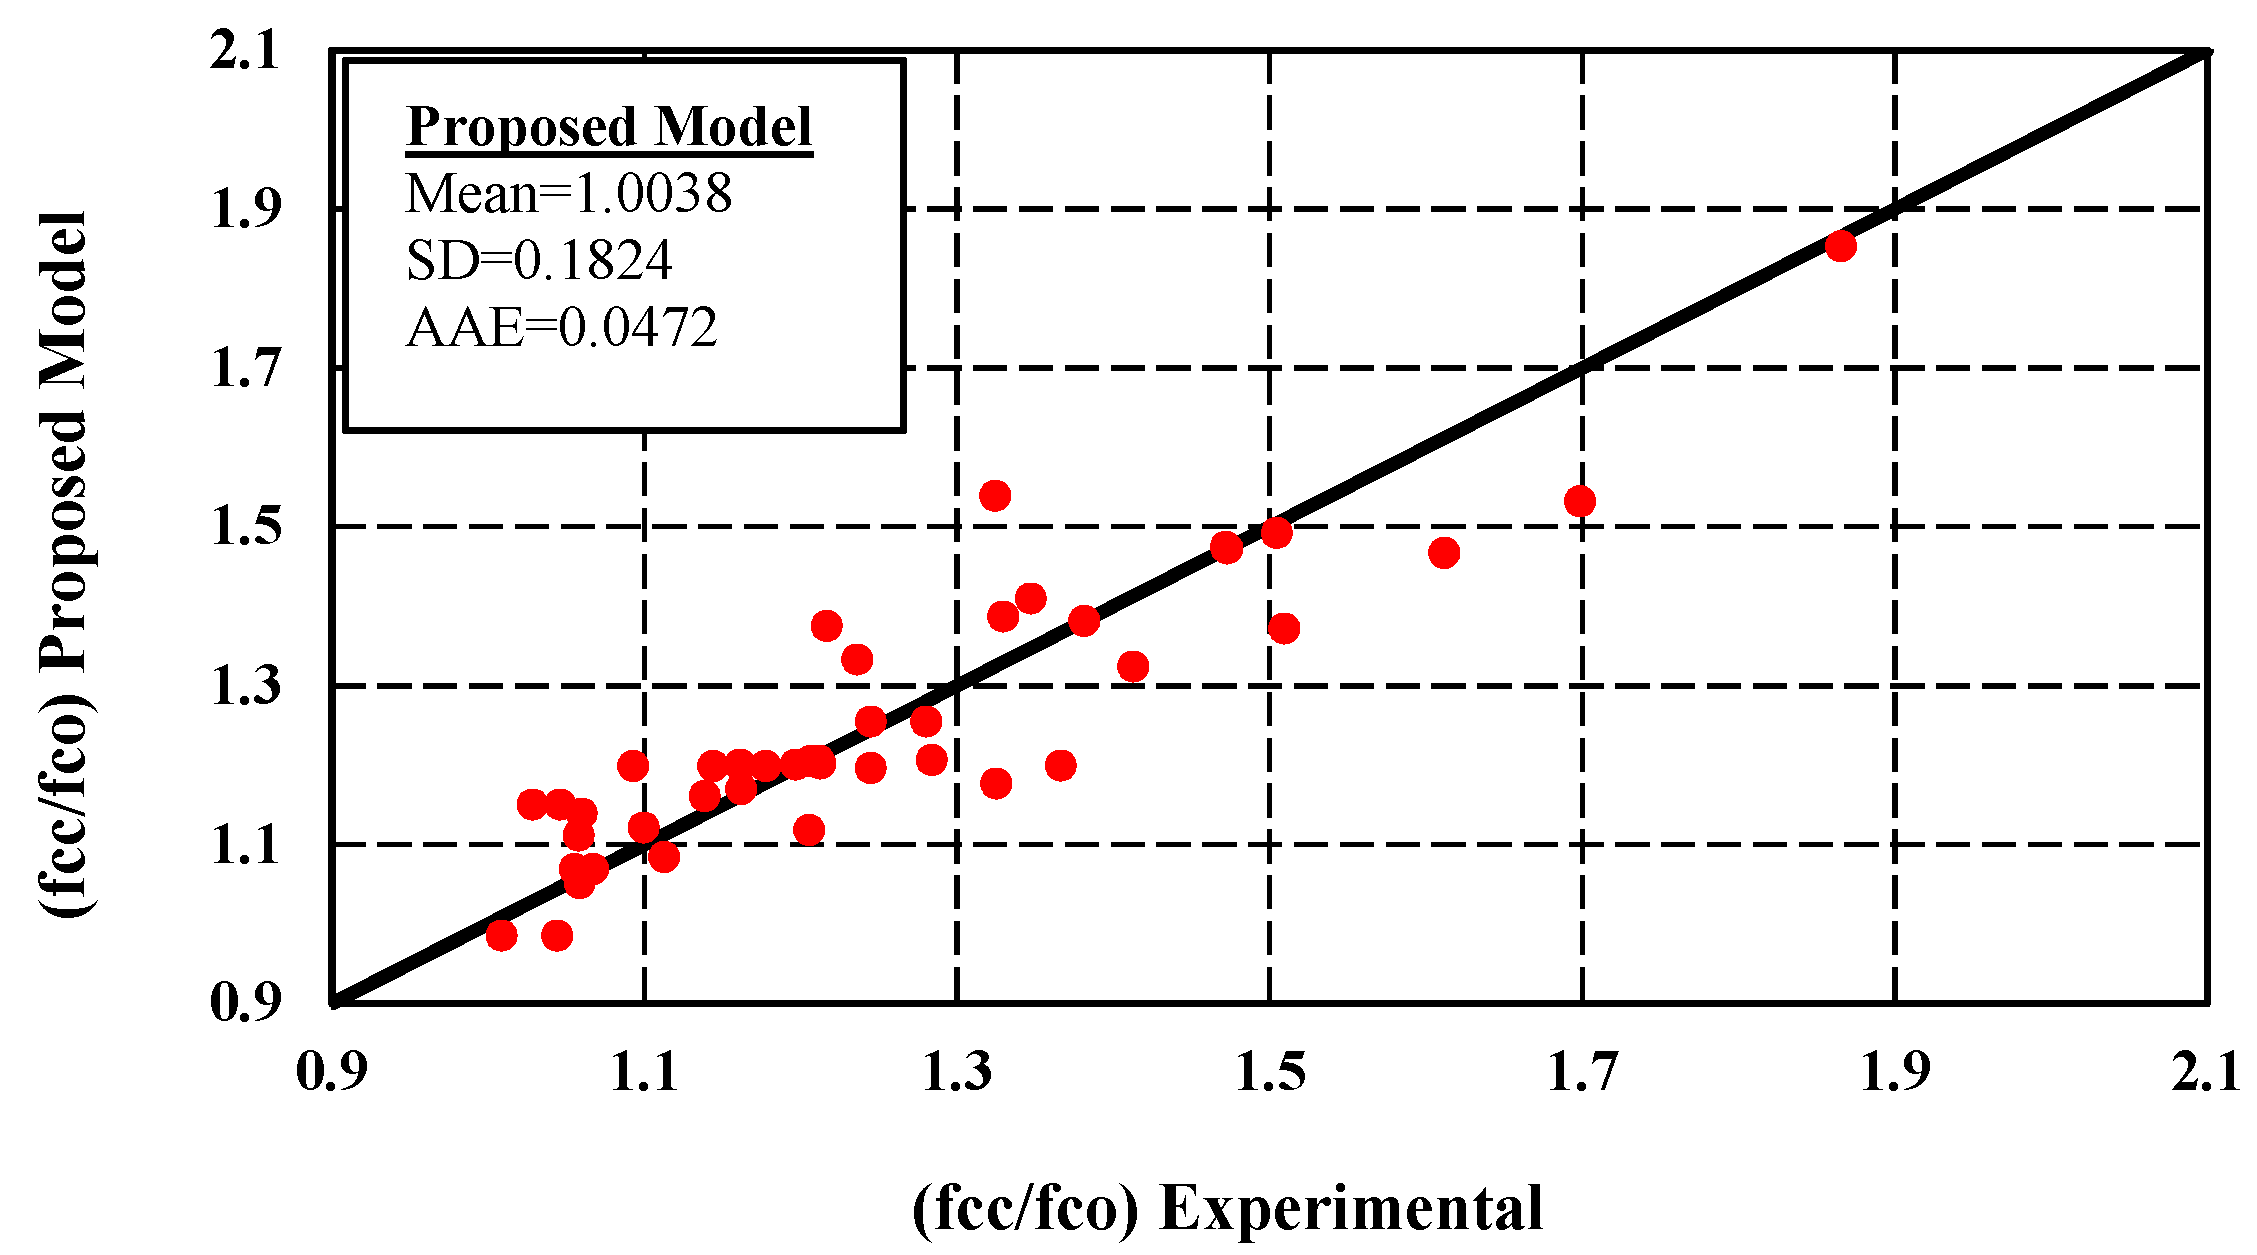
Figure 6 compares the strength enhancement factor values obtained from the proposed model (Equation (8e)), and experimental results.
This comparison uses the statistical indicators: average absolute error (AAE) to evaluate the proposed model accuracy, mean (M) to evaluate average overestimation or underestimation of the model compared to experimental results, and standard deviation (SD) to evaluate the magnitude of the associated scatter [
65,
69]. This comparison indicates that there is a good agreement between the model prediction and the test results. The measurements of these parameters are defined as follow:
4.2. 3D Expression for Prediction of Peak Compressive Strength
In
Section 4.1, the two-dimensional equations for predicting the peak strength of SMA-confined concrete were expanded. According to the resulting equations, it can be seen that the equations have a complex form. To simplify the form of the equations and make them easier to use, three-dimensional equations were defined.
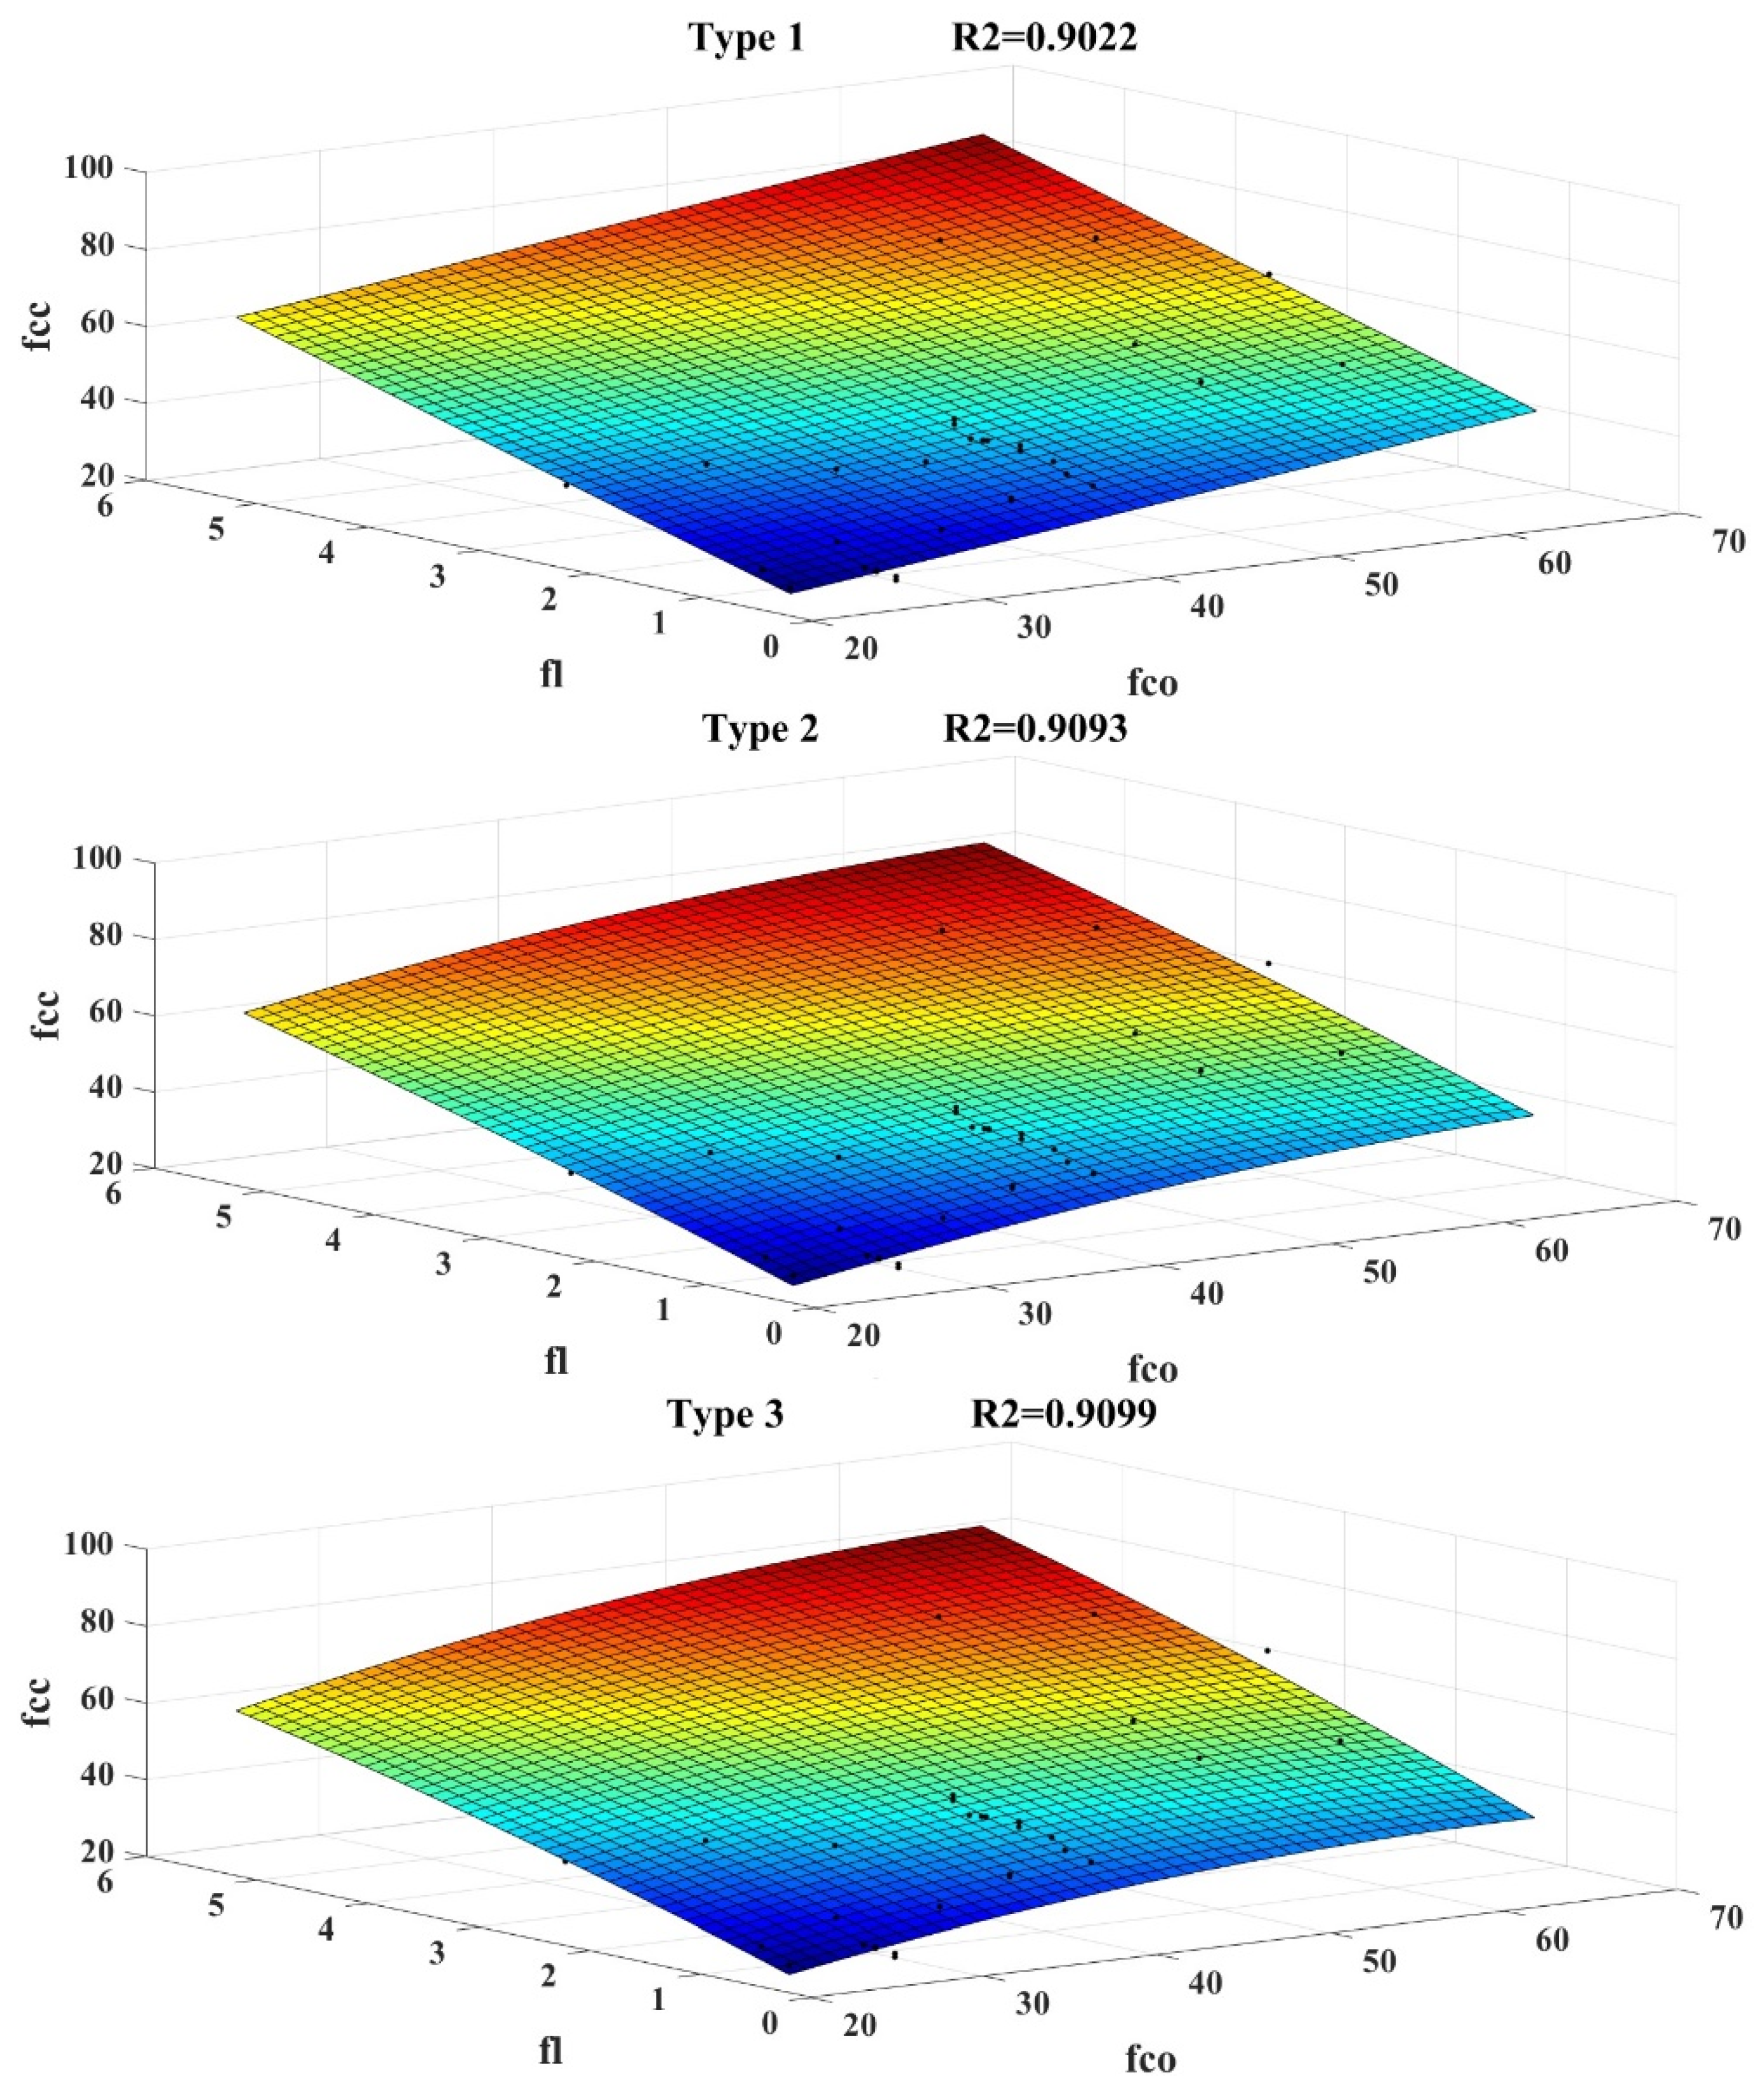
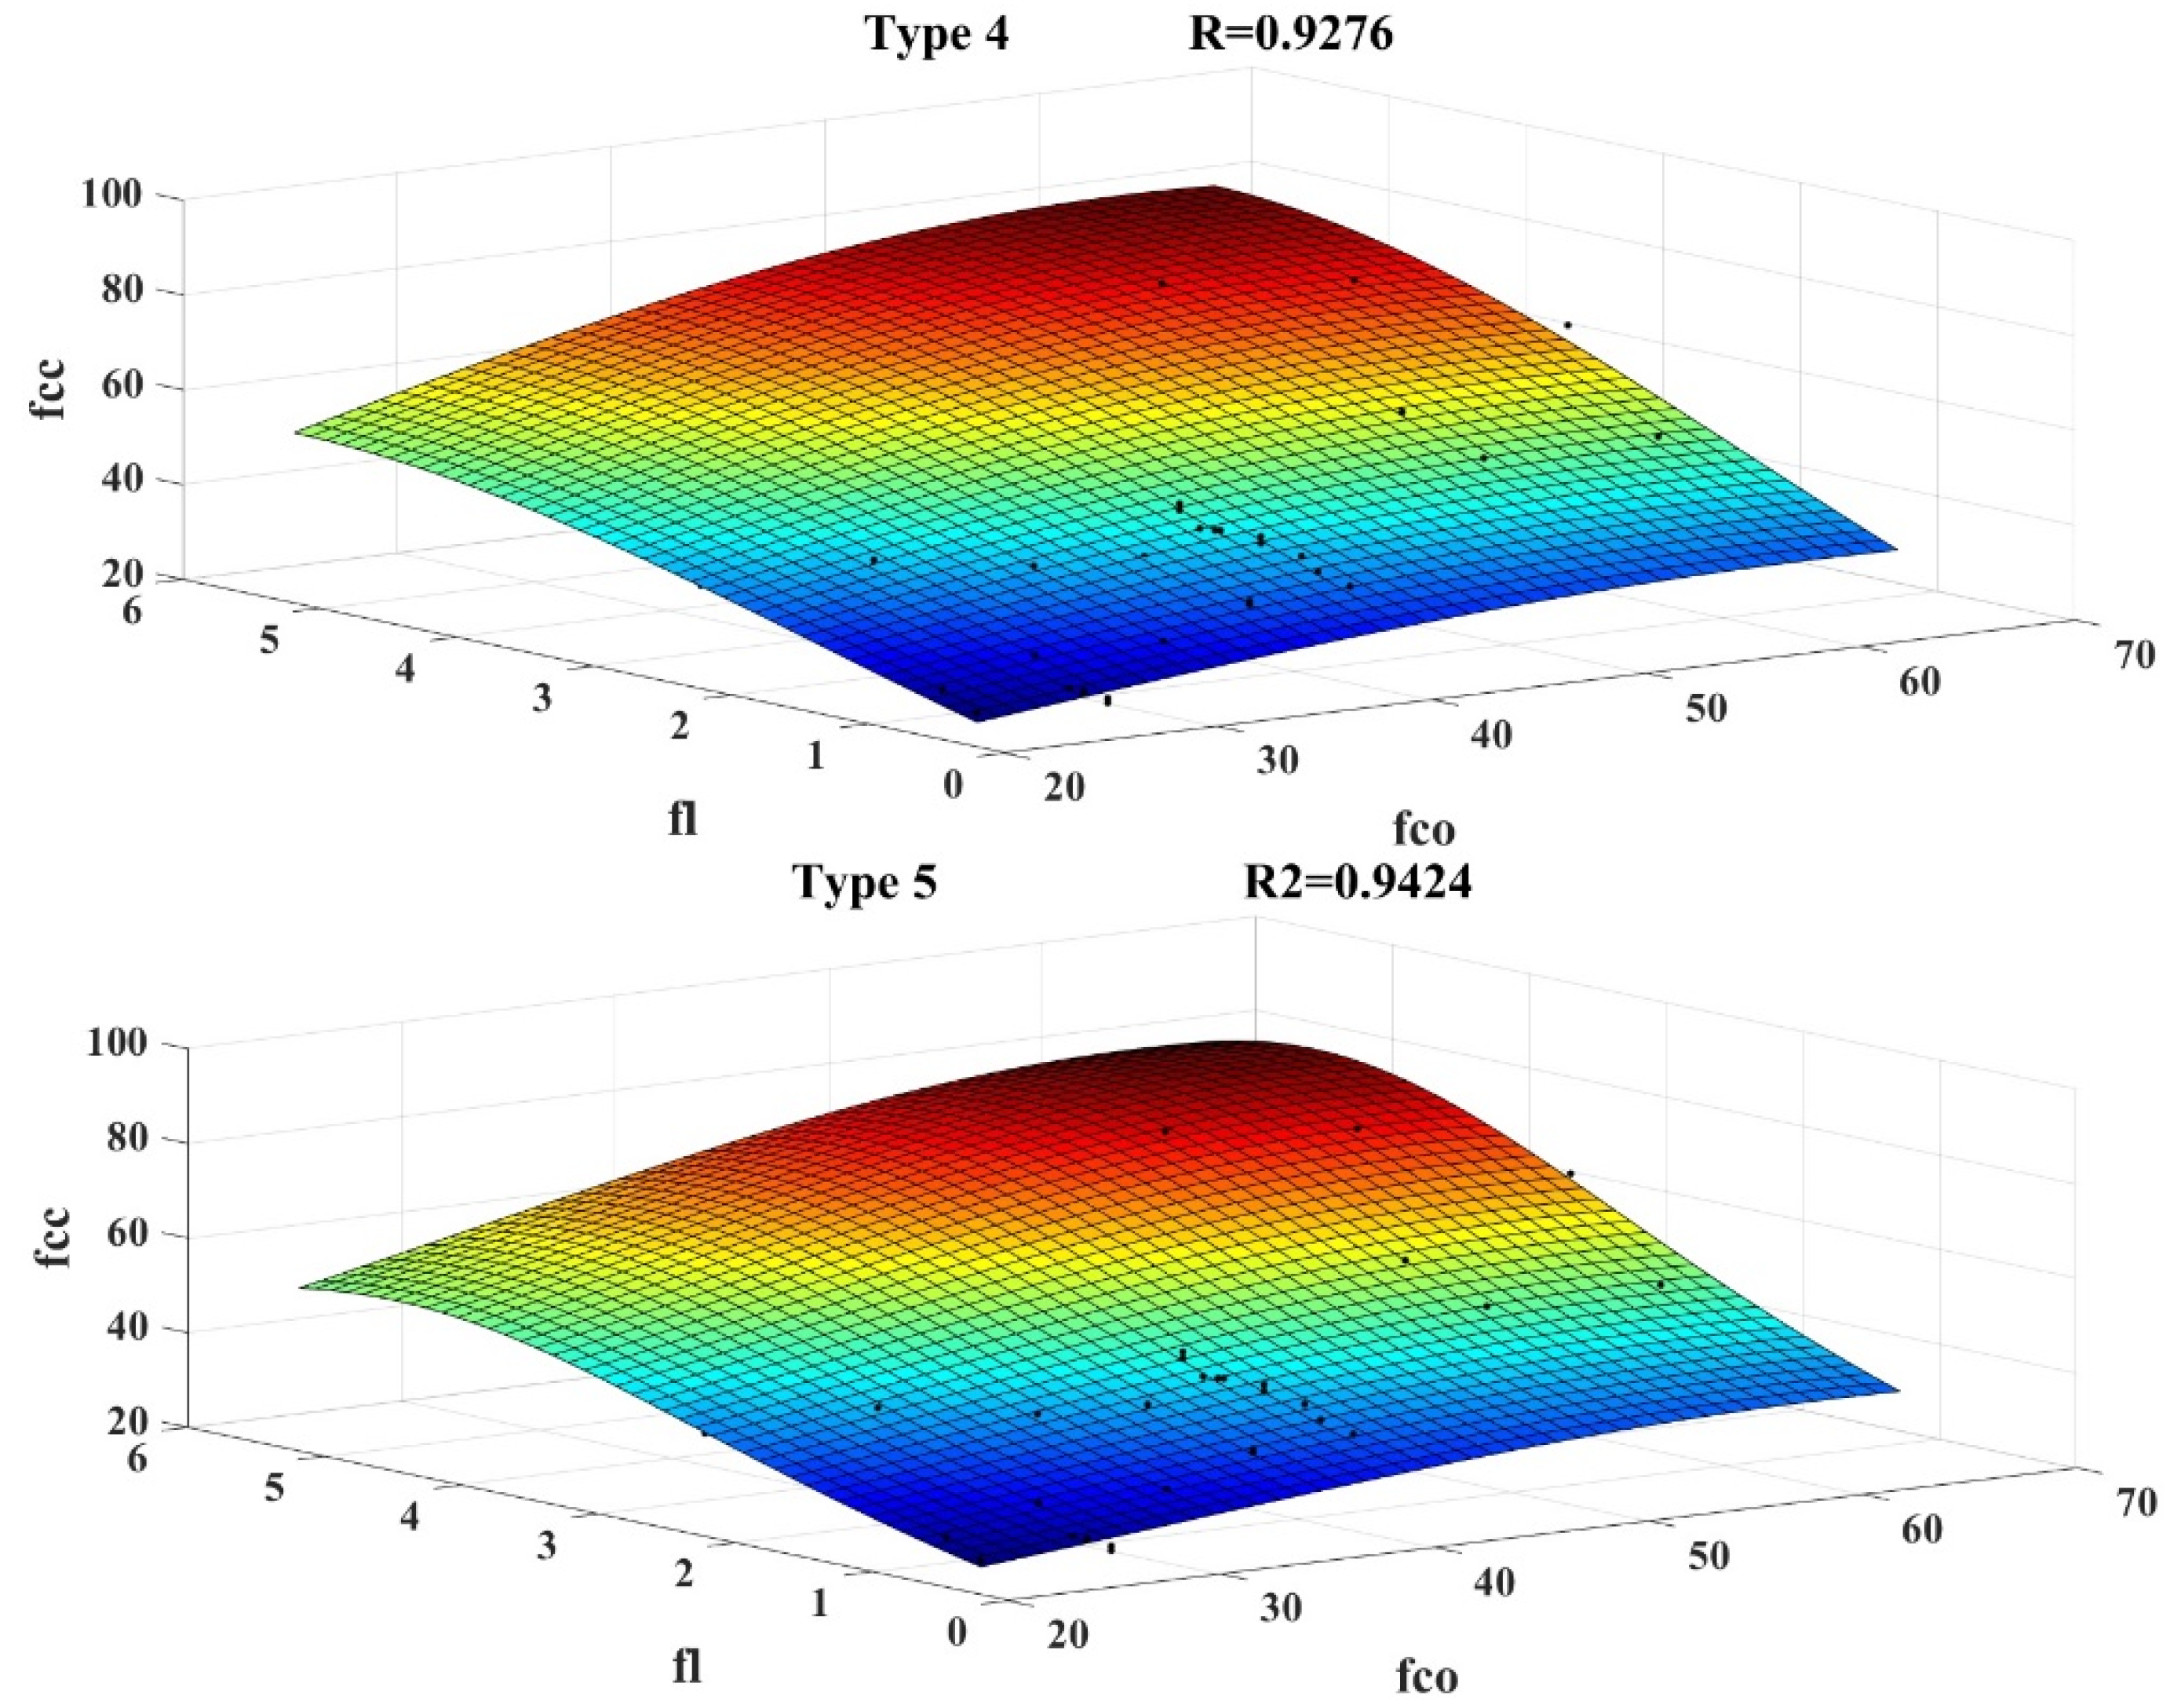
As explained earlier, the peak strength of concrete cylindrical specimens confined with SMA spirals depends on unconfined concrete peak compressive strength and the lateral confining pressure of the SMA spirals. Therefore, three-dimensional expressions can be utilized to define equations that can predict the peak strength of concrete cylindrical specimens confined with SMA spirals in terms of unconfined concrete peak strength and confining pressure. So five three-dimensional expressions were developed with the SMA-confined concrete strength, unconfined concrete strength, and lateral confinement pressure of the SMA spirals (Equation (12a–e)). The best expression is chosen using nonlinear regression analysis performed by MATLAB and SigmaPlot software and according to statistical indicators including root mean square error and coefficient of determination, the best expression is selected:
Equation (12e) has the highest coefficient of determination (R
2 = 0.9424) and the lowest RMSE value (RMSE = 3.6502) based on the statistical analyses shown in
Table 5 and
Figure 7. Therefore, Equation (12e) is the best three-dimensional equation for predicting the peak strength of concrete confined with SMA spirals.
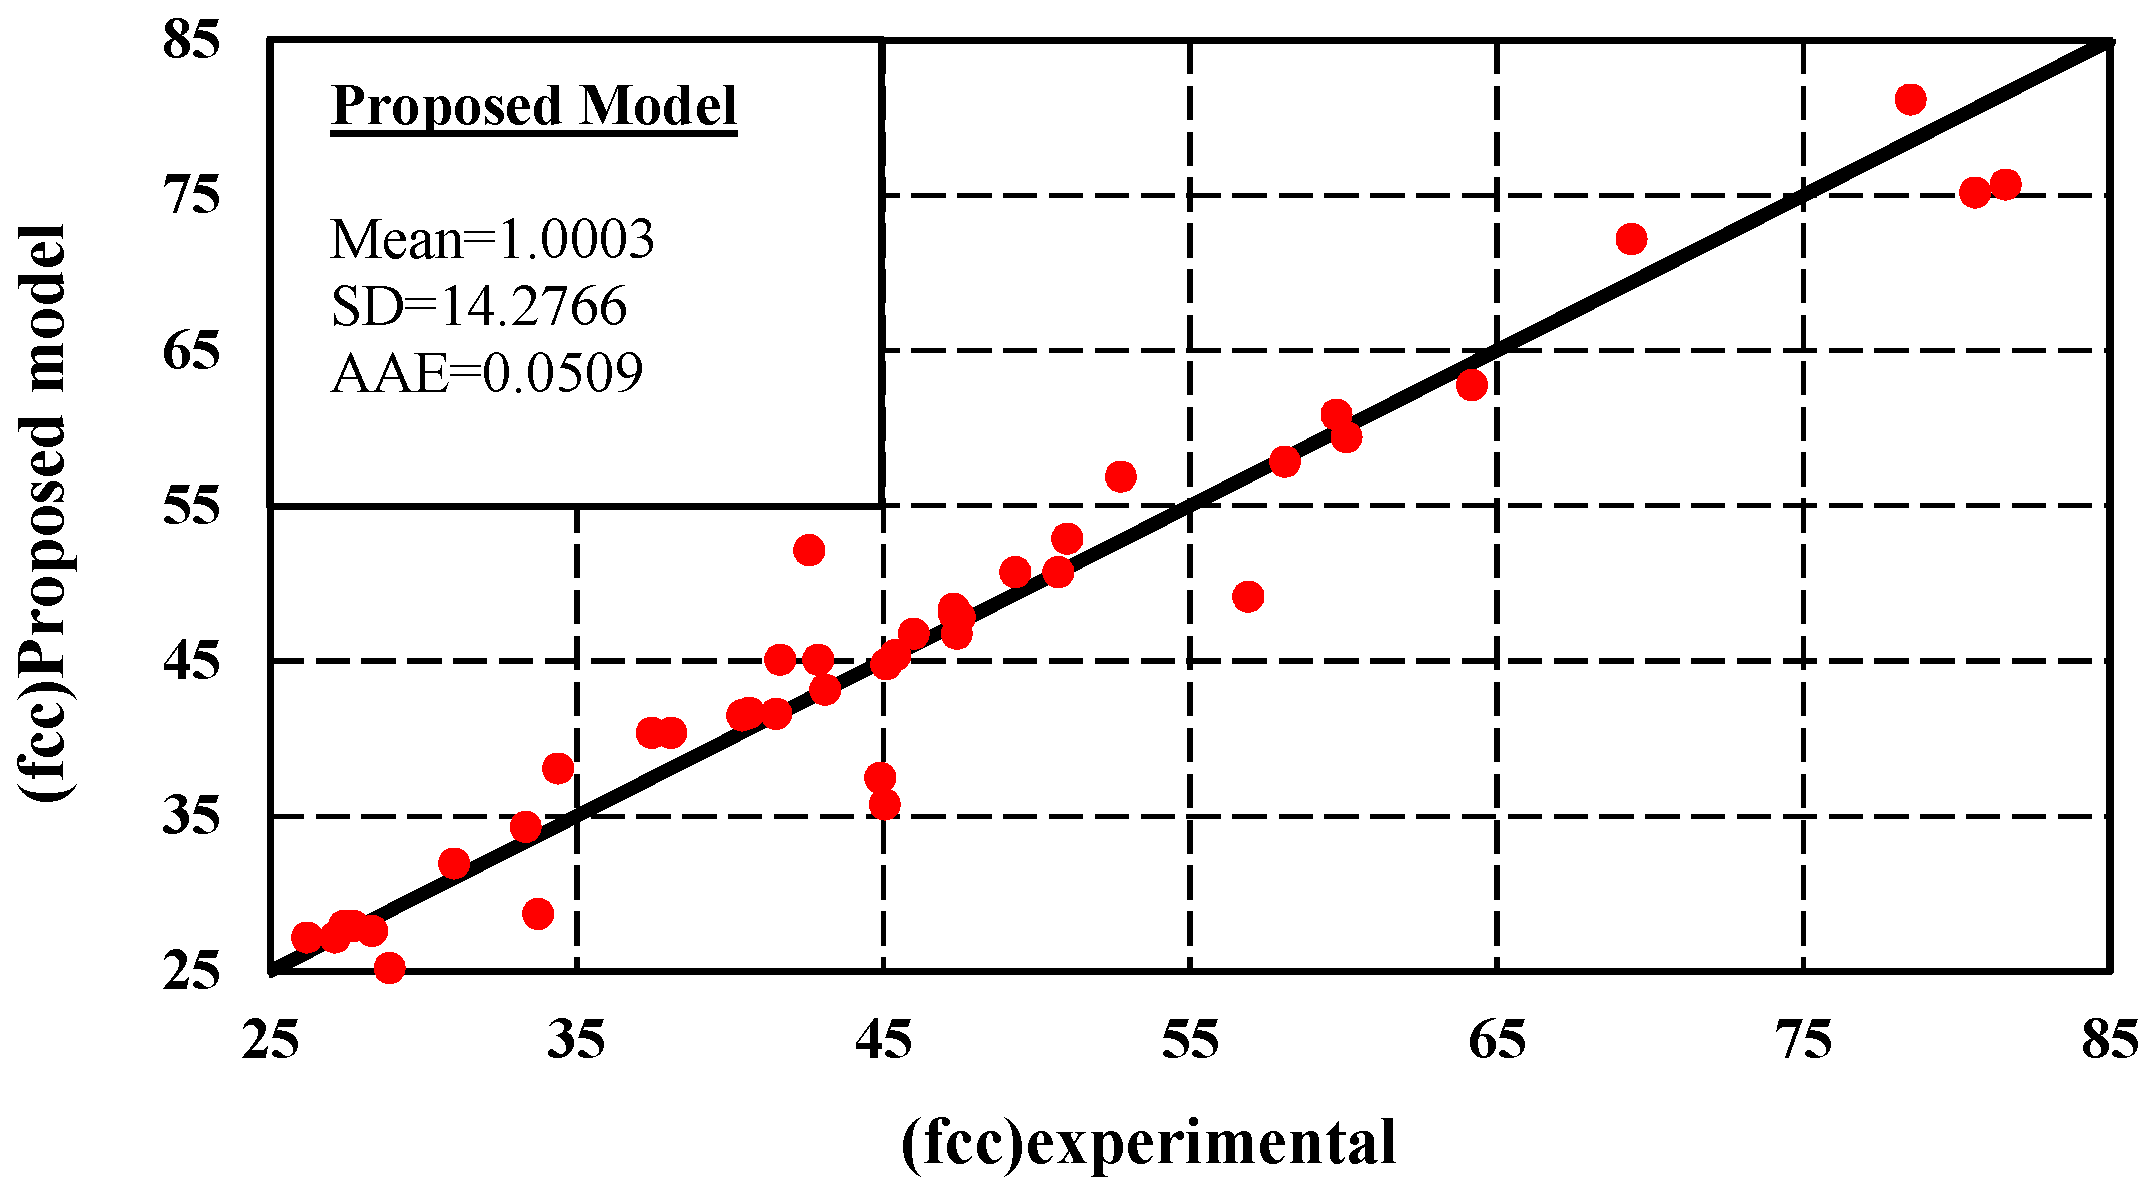
Figure 8 compares the SMA-confined concrete strength values derived from the suggested model (Equation (12e)) and experimental results. This comparison shows that the model forecast closely matches the test results.
Comparing two-dimensional and three-dimensional equations defined for predicting the peak strength of SMA-confined concrete shows that the resulting three-dimensional equation (Equation (12e)), in addition to having a simpler form than the two-dimensional equation (Equation (8e)), also has higher accuracy.
4.3. Prediction of Axial Strain Corresponding to Peak Compressive Strength
As explained earlier, to determine the stress-strain behavior of SMA-confined concrete, it is necessary to determine the peak point and ultimate point characteristics. After determining the peak strength (
), the axial strain corresponding to peak strength (
) must be determined. Expression of axial strain corresponding to confined concrete peak compressive strength (
) is a mathematical relationship in which the
is expressed as a function of the unconfined concrete peak compressive strength, axial strain corresponding to unconfined concrete peak strength, and the lateral confining pressure of the SMA spirals. In general, the two-dimensional expression for
in terms of the parameters
and
is expressed as Equation (13), which is a linear relation [
53]:
Gradually, with developing confinement relationships, various nonlinear equations have been formulated for predicting the axial strain corresponding to the peak strength of confined concrete (Equation (14)) [
53]:
The reviews indicate that using Equations (13) and (14) to predict the axial strain corresponding to the peak strength of SMA-confined concrete, does not provide good results (
Table 6 and
Figure 9).
As a result, five two-dimensional expressions were developed for predicting axial strain corresponding to the peak strength of concrete cylindrical specimens confined with SMA spirals (Equation (15a-e)). Using nonlinear regression analysis that is done by MATLAB and SigmaPlot software and according to statistical indicators including root mean square error and coefficient of determination, the best expression is selected.
According to the statistical analyses, which results are shown in
Table 7, it can be seen that Equation (15e) has the highest coefficient of determination (R
2 = 0.8378). Additionally, this equation has the lowest RMSE value (RMSE = 0.10) after Equation (15b). Since the value of R
2 is a very important parameter in assessing the model accuracy, some researchers have suggested that the coefficient of determination be the basis for best-fit curve selection [
66,
70,
71]. Therefore, Equation (15e) is the best for forecasting the axial strain corresponding to the peak strength of concrete confined with SMA spirals in terms of parameters
and
.
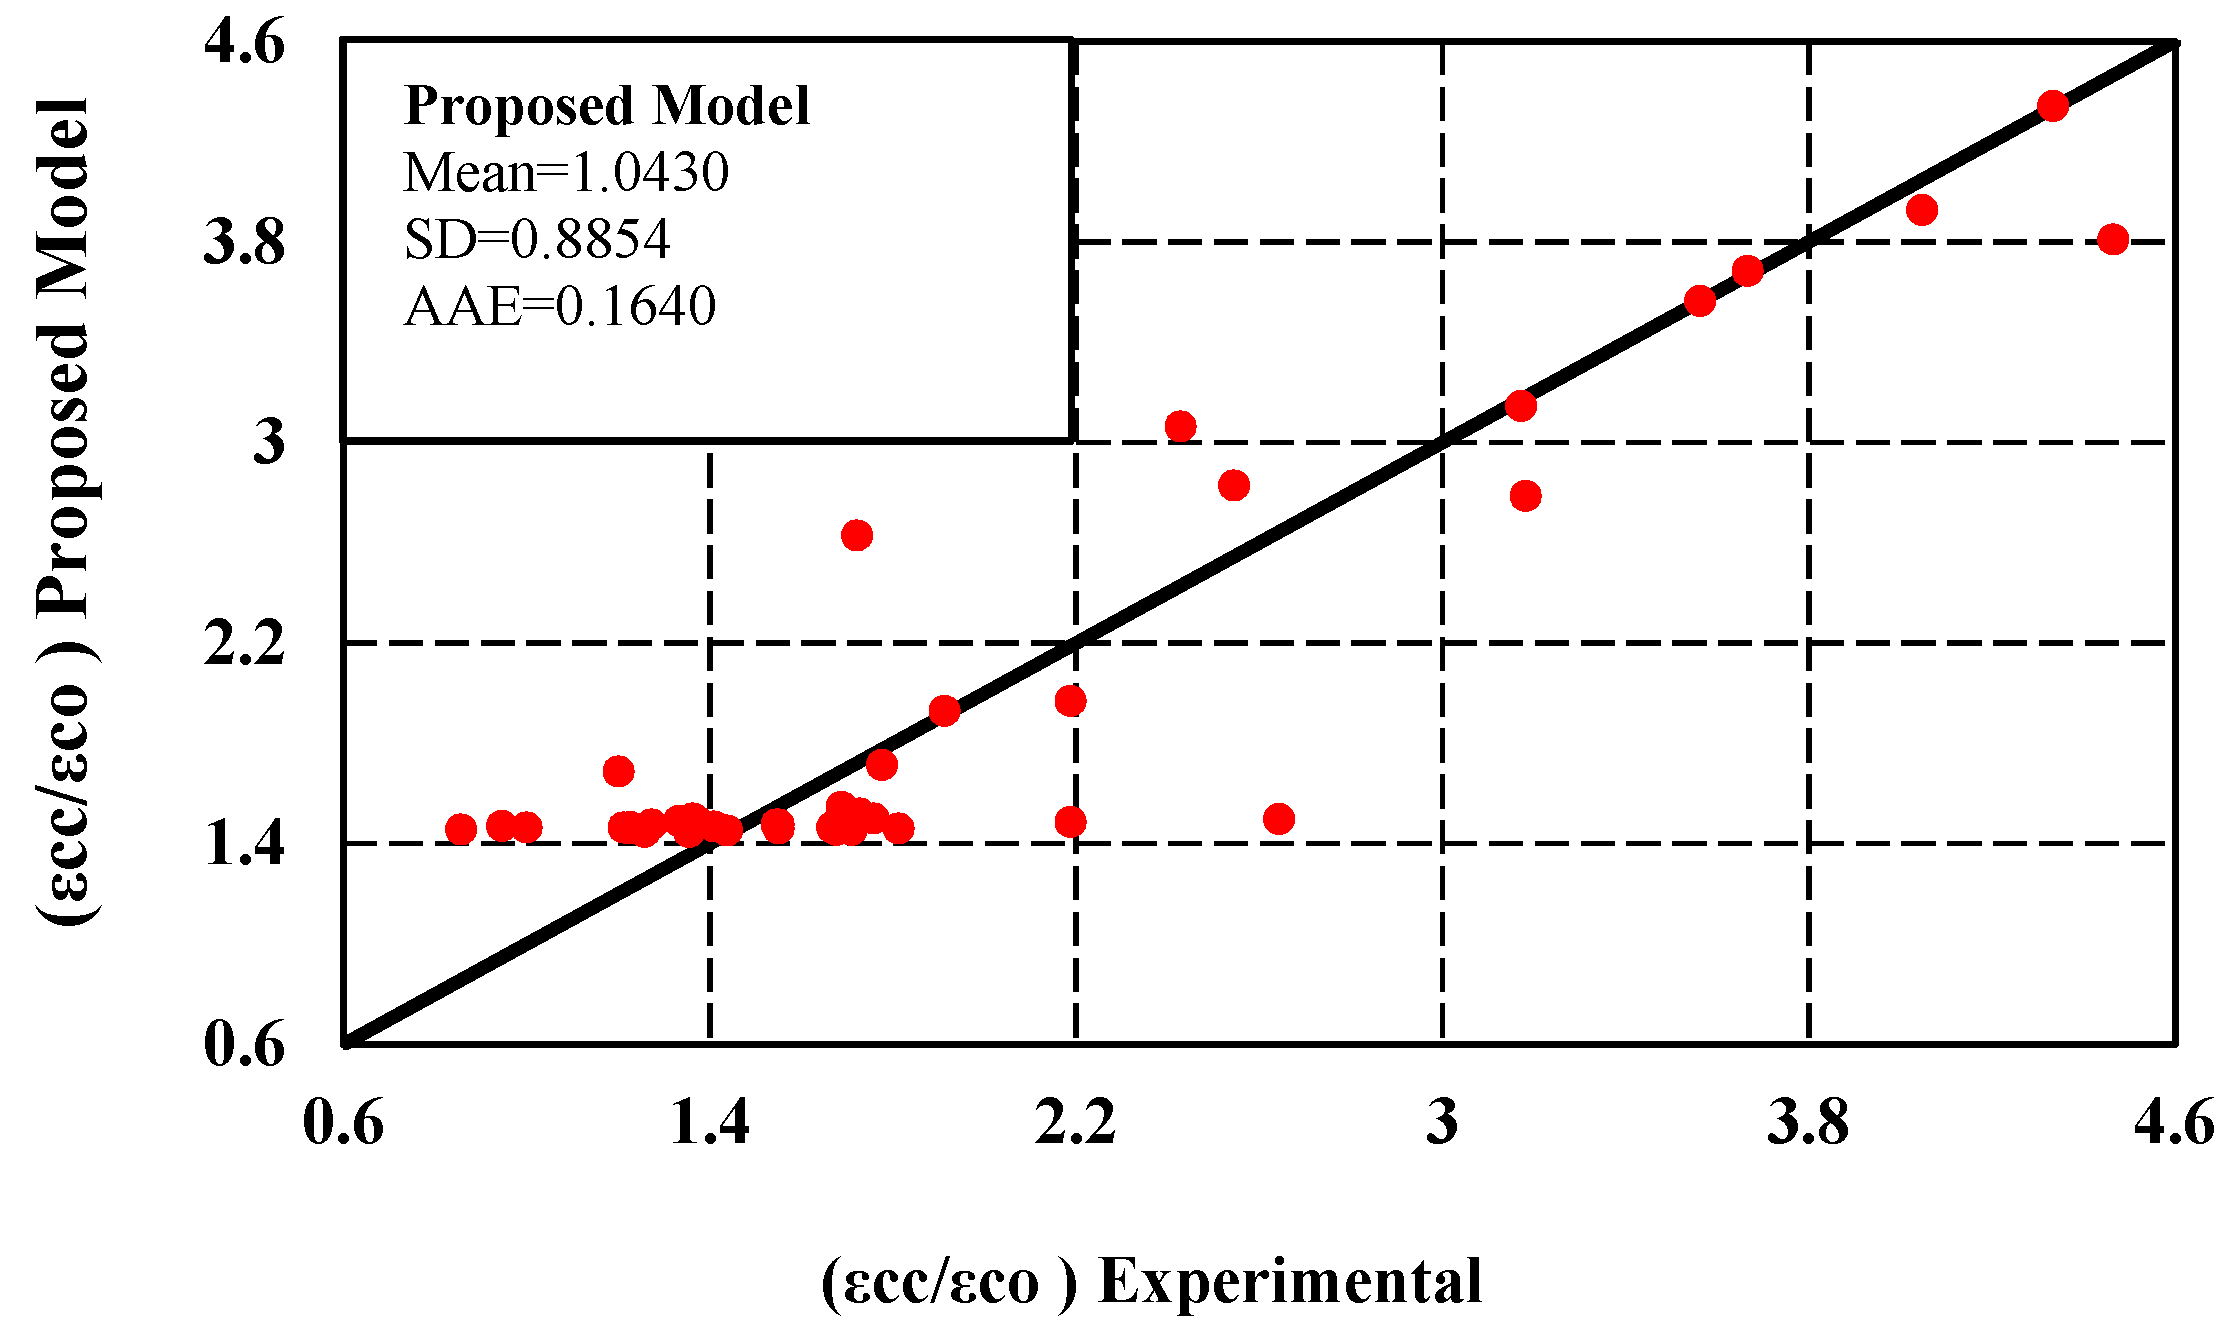
Figure 10 shows a comparison of the axial strain values derived from the proposed model (Equation (15e)) with the experimental results. This comparison indicates that the model’s prediction is consistent with the test results.
A review of previous research shows that to obtain an equation to predict axial strain corresponding to the peak strength of confined concrete, the equation can also be defined in terms of the parameters
and
. Therefore, for predicting the axial strain corresponding to the peak strength of SMA-confined concrete, five two-dimensional expressions were developed in terms of the parameters
and
. (Equation (16a-e)). Using nonlinear regression analysis and according to statistical indicators including root mean square error and coefficient of determination, the best equation is selected.
Equation (16e) has the highest coefficient of determination (R
2 = 0.8280) and the lowest RMSE value (RMSE = 0.5382), the results are shown in
Table 8. Therefore, in terms of the parameters
and
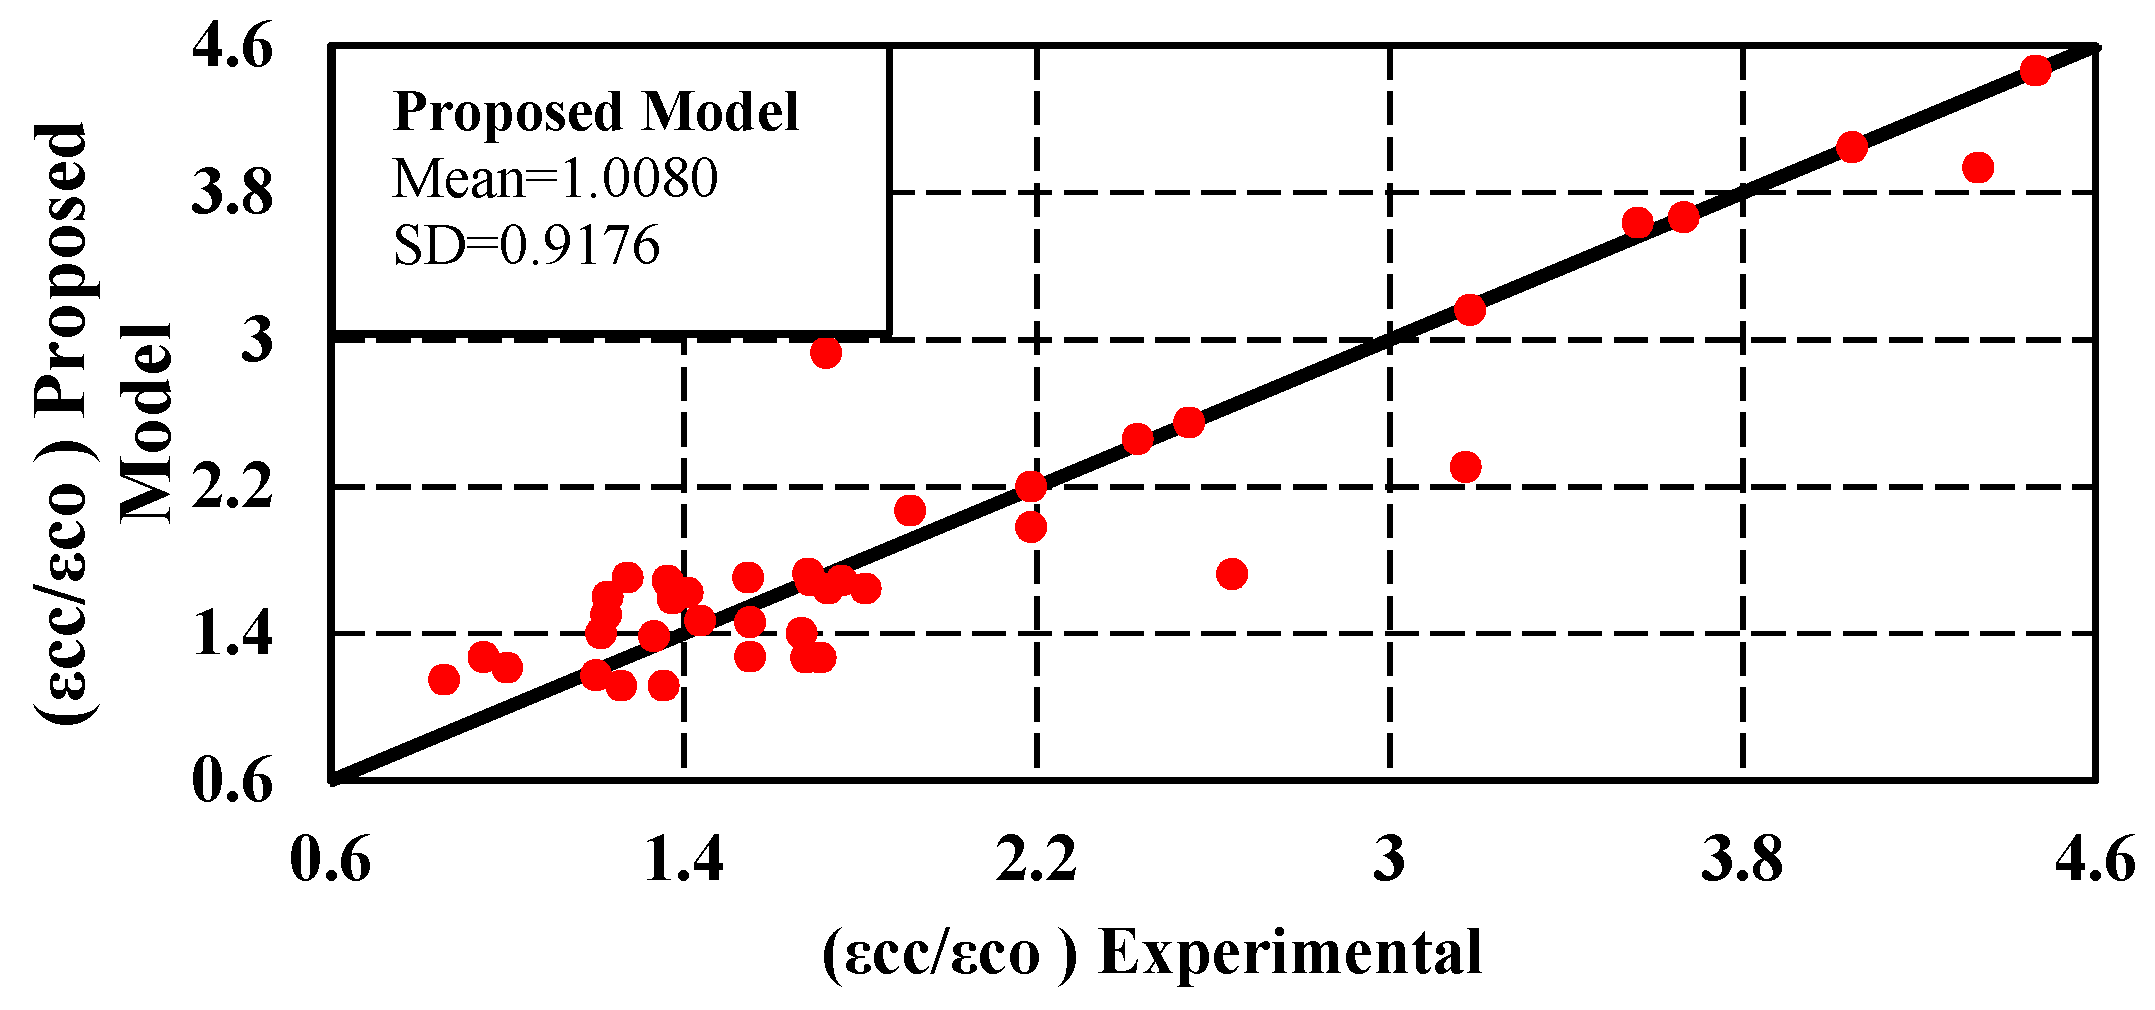
, Equation (16e) is the best for predicting the axial strain corresponding to the peak strength of concrete confined with SMA spirals.
Figure 11 compares axial strain values that were obtained using the proposed model (Equation (16e)) and experimental results. Based on this comparison, it can be seen that the predictions made by the model are in close agreement with the test results.
4.4. 2D Expression for Prediction of Ultimate Compressive Strength
As expressed before, after reaching the stress value of SMA-confined concrete to its peak point, the diagram is followed by a gradually descending branch. The failure point is defined by the ultimate strain (e
ult) and the corresponding ultimate stress (f
ult). In this section, the aim is to obtain the ultimate strength of the SMA-confined concrete. The Ultimate strength equation of SMA-confined concrete is a mathematical relationship in which the confined concrete ultimate strength is expressed as a function of the unconfined concrete peak strength and the lateral confining pressure of the SMA spirals. So, for predicting the ultimate strength of concrete cylindrical specimens confined with SMA spirals, five two-dimensional expressions were developed in terms of
and
(Equation (17a-e)). Using nonlinear regression analysis that is done by MATLAB and SigmaPlot software and according to statistical indicators including root mean square error and coefficient of determination, the best expression is selected.
According to the statistical studies, Equation (17c) has the highest coefficient of determination (
R2 = 0.6079) and the lowest RMSE value (RMSE = 0.2124). The results are shown in
Table 9. Therefore, Equation (17c) is the most accurate two-dimensional equation for predicting the ultimate strength of concrete confined by SMA spirals. Although Equation (17c) is the best for predicting the ultimate strength, the coefficient of determination of this equation is relatively low.
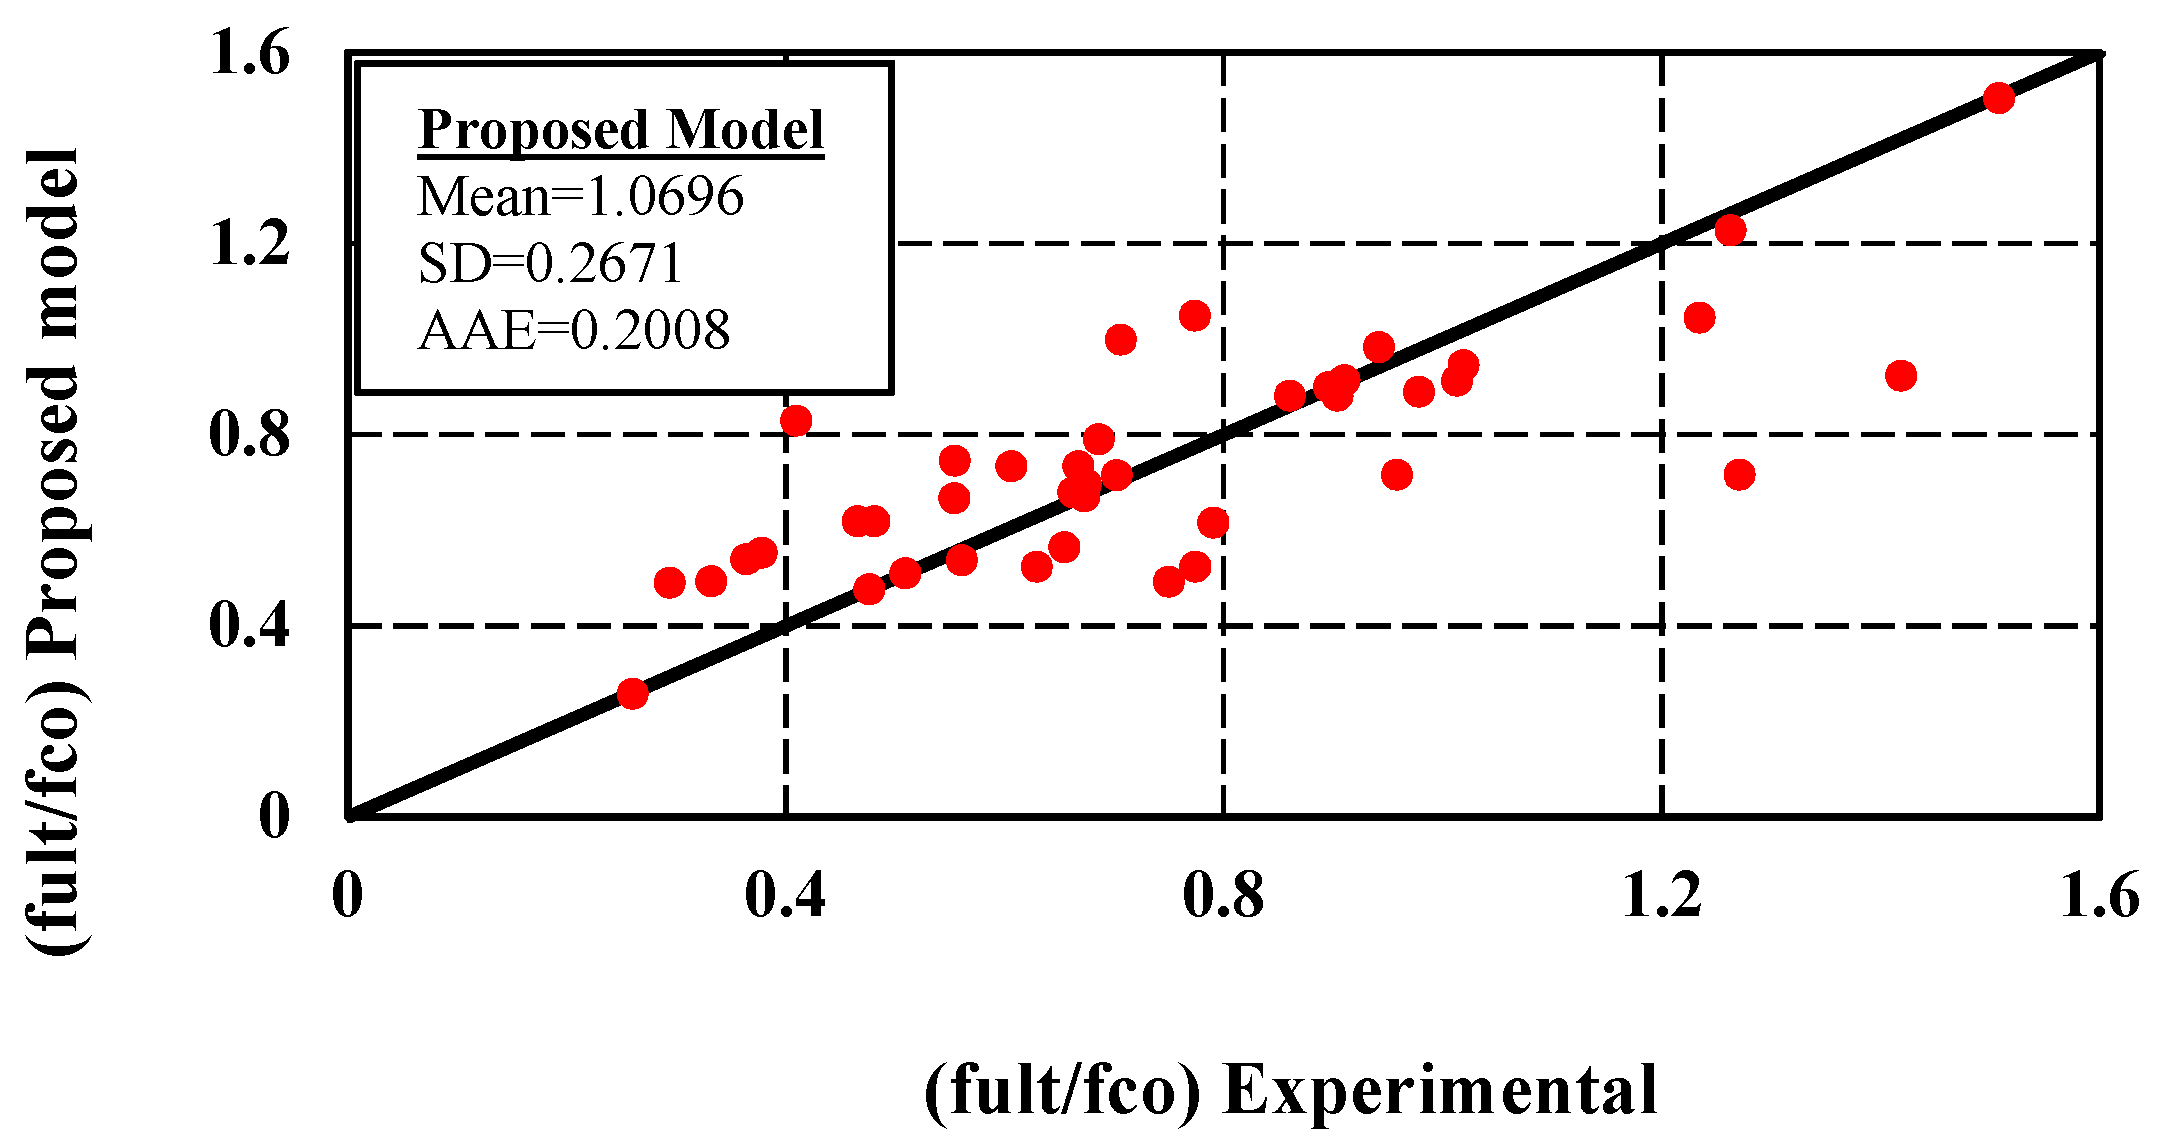
Figure 12 compares the
values obtained from the proposed model (Equation (17c) and experimental results. This comparison indicates that the model prediction and the test results correspond closely.
4.5. 3D Expression for Prediction of Ultimate Compressive Strength
As expressed earlier, the ultimate strength of concrete cylindrical specimens confined with SMA spirals depends on the peak strength of unconfined concrete and the lateral confining pressure of the SMA spirals. So, three-dimensional expressions can be used to define equations that can predict the ultimate strength of the SMA-confined concrete cylindrical specimens. Thus, five three-dimensional expressions were developed with the ultimate strength of confined concrete, unconfined concrete strength, and active confinement pressure (Equation (18a-e)). The best expression is chosen using nonlinear regression analysis and according to statistical indicators including root mean square error and coefficient of determination:
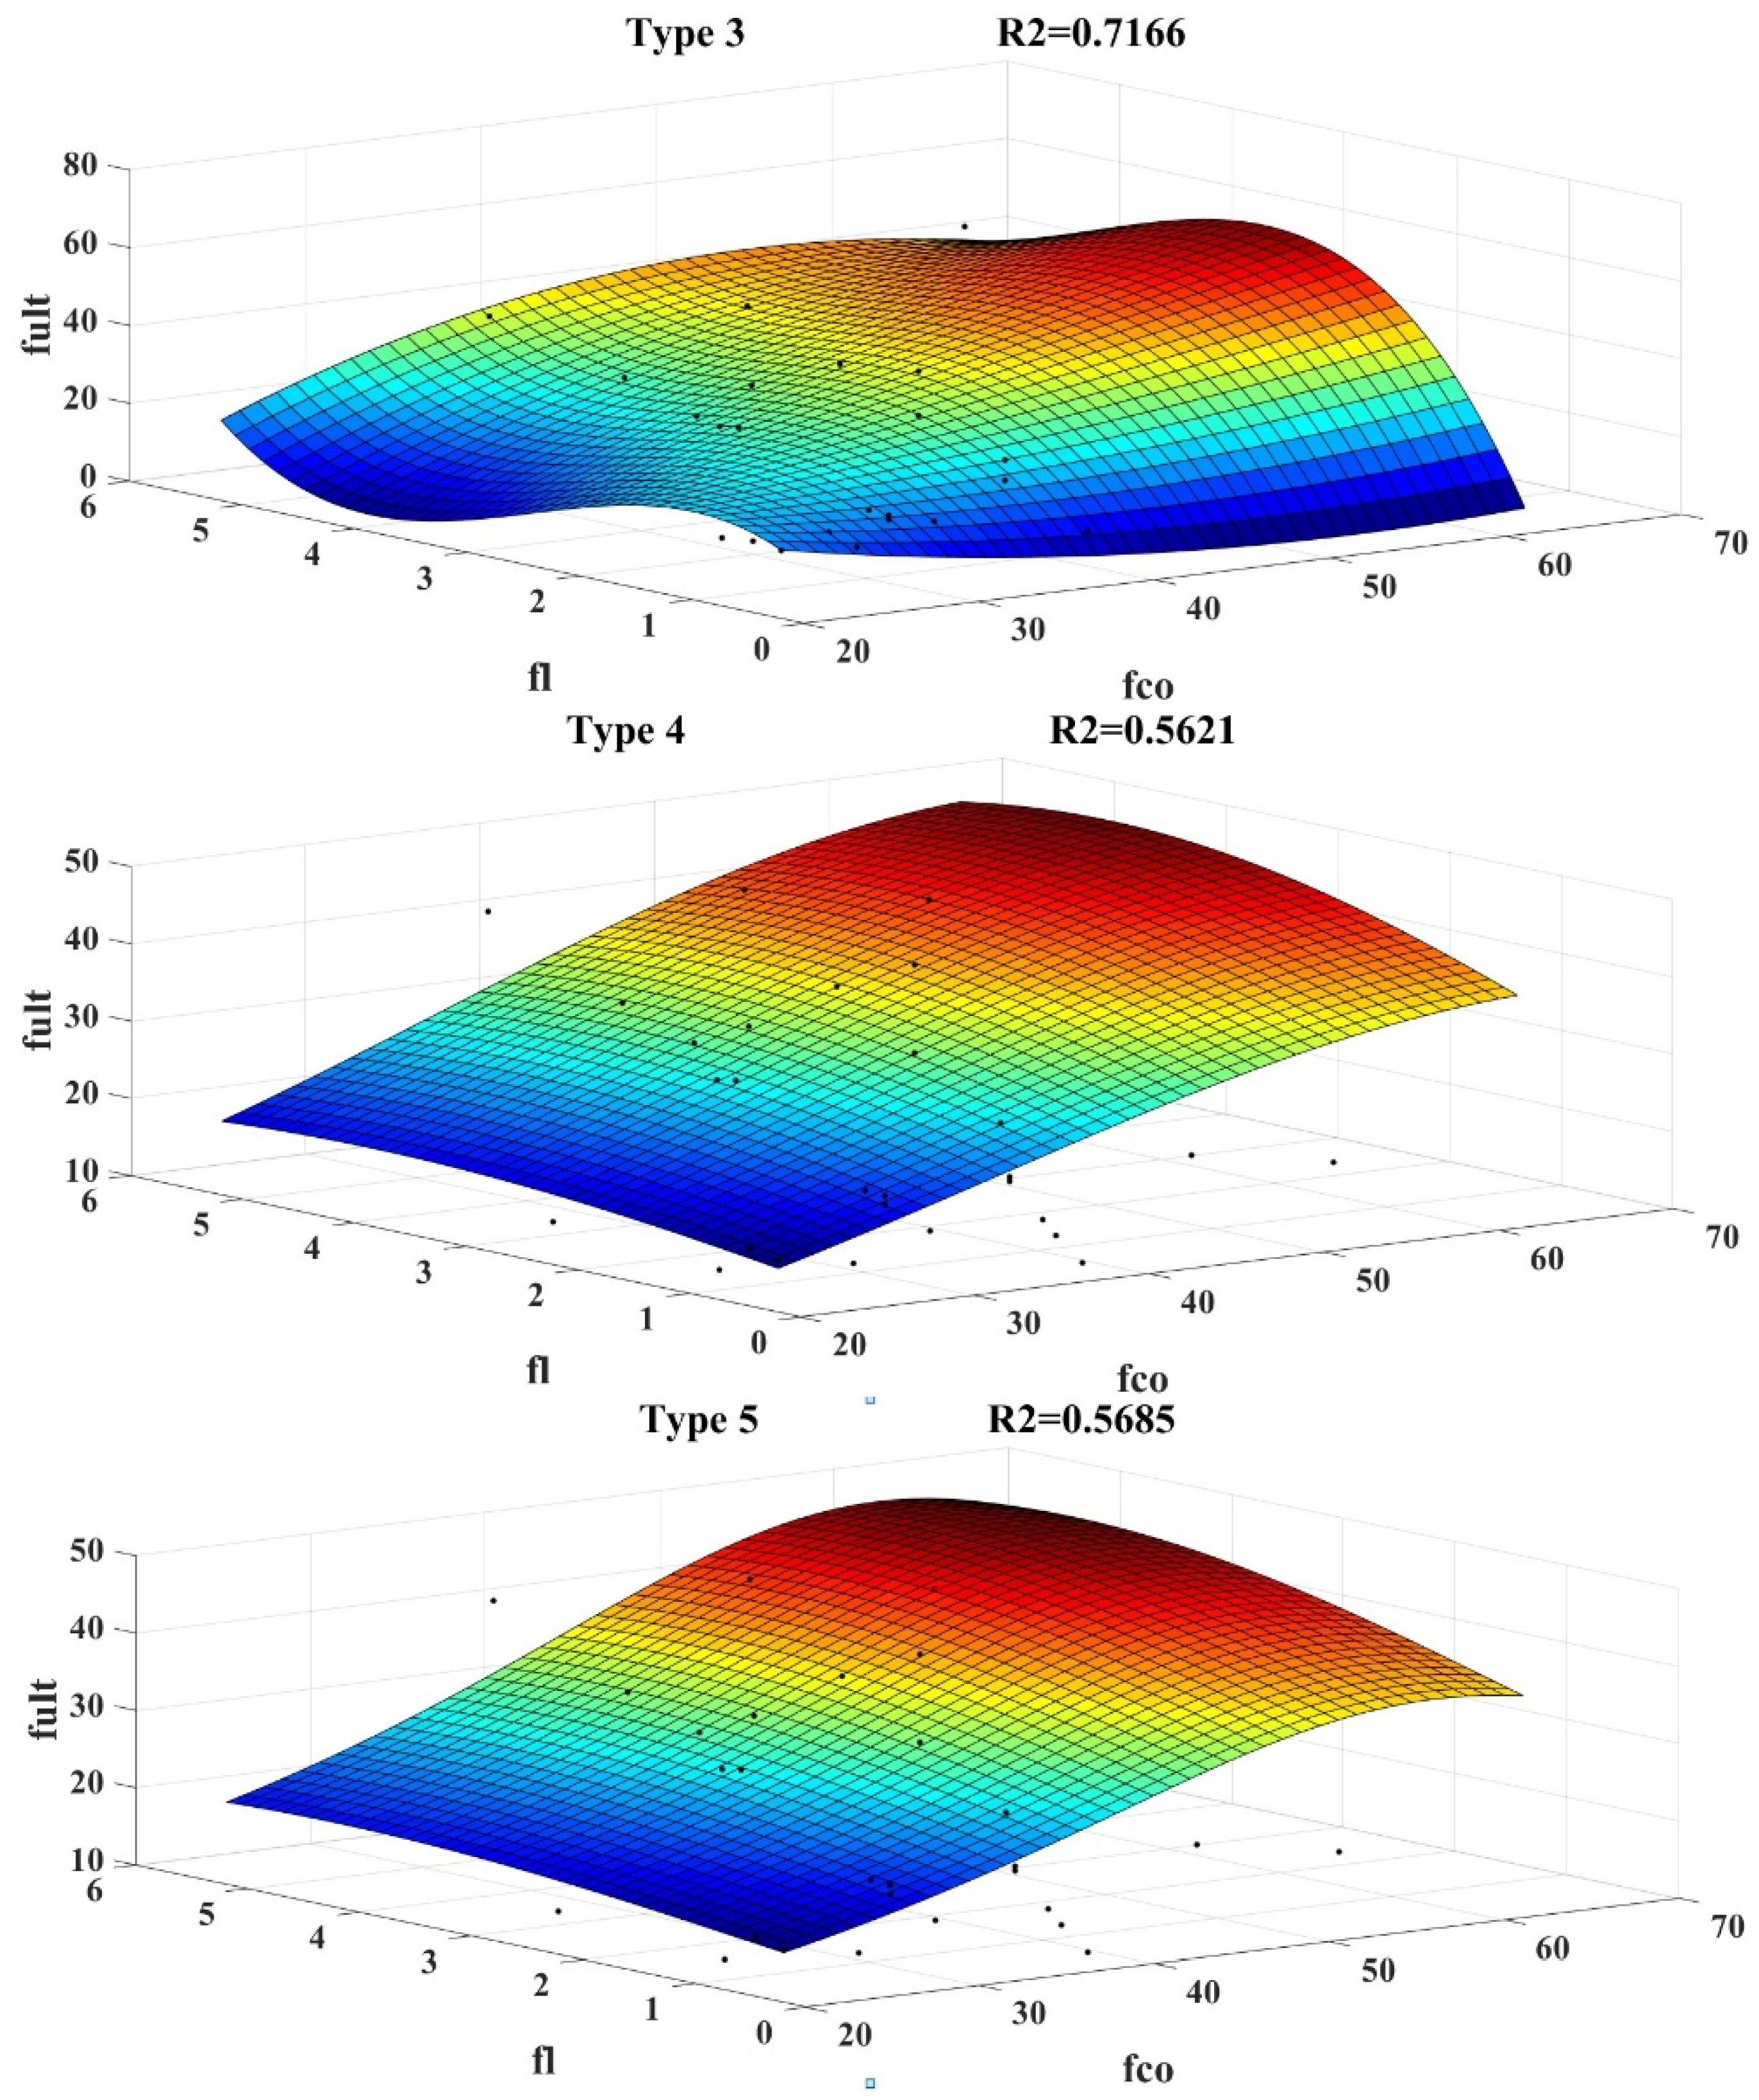
Results from the statistical analyses, which are shown in
Table 10 and
Figure 13, indicate that Equation (18c) has the maximum coefficient of determination (R
2 = 0.7166) and also the lowest RMSE value (RMSE = 6.5843). So, Equation (18c) is the best for predicting the ultimate strength of concrete confined by SMA spirals, when using a three-dimensional equation.
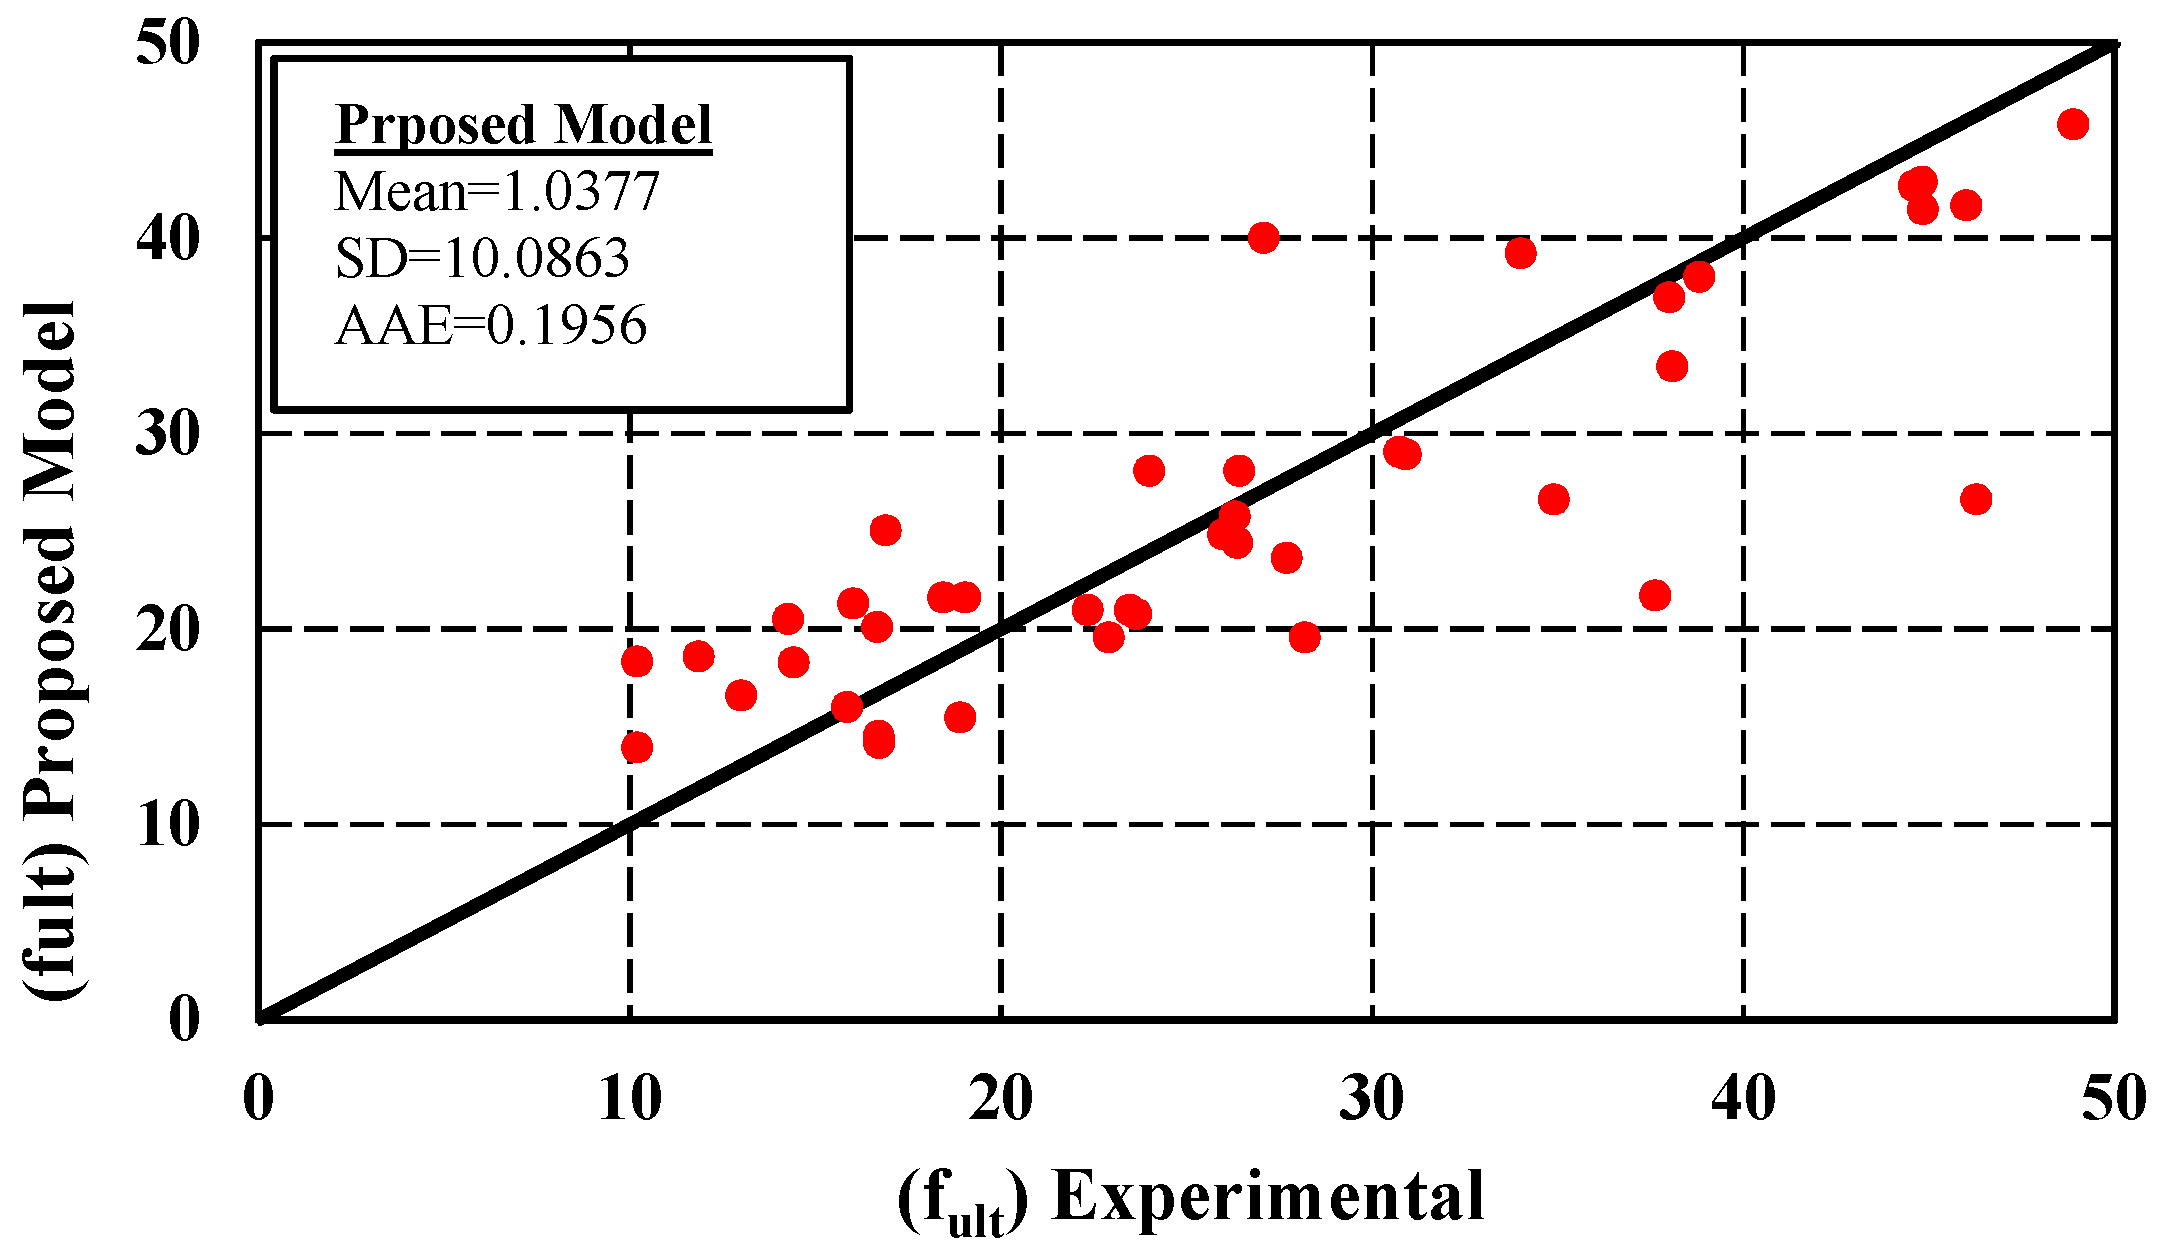
The ultimate strength values obtained from the suggested model (Equation (18c)) and experimental results are compared in
Figure 14. Through comparison, it can be shown that the model prediction and test results correspond fairly well.
4.6. Prediction of Ultimate Axial Strain
One of the most important advantages of concrete confined with SMA spirals is the considerable increase in ductility and ultimate strain of concrete. Therefore, the ultimate strain is an important parameter for the stress-strain behavior of the SMA-confined concrete. To predict the ultimate axial strain of SMA-confined concrete cylindrical specimens, five two-dimensional expressions in terms of the parameters
and
are developed (Equation (19a-e)) and according to statistical indicators including root mean square error and coefficient of determination, the best expression is selected.
Table 11 shows the results of the statistical analyses. Equation (19c) has the highest coefficient of determination (R
2 = 0.6411) and the lowest RMSE value (RMSE = 10.2092). Therefore, Equation (19c) is the best for predicting the ultimate axial strain of concrete confined with SMA spirals in terms of the parameters
and
. Although Equation (19c) is the best for predicting the ultimate strain, the coefficient of determination of this equation is relatively low.
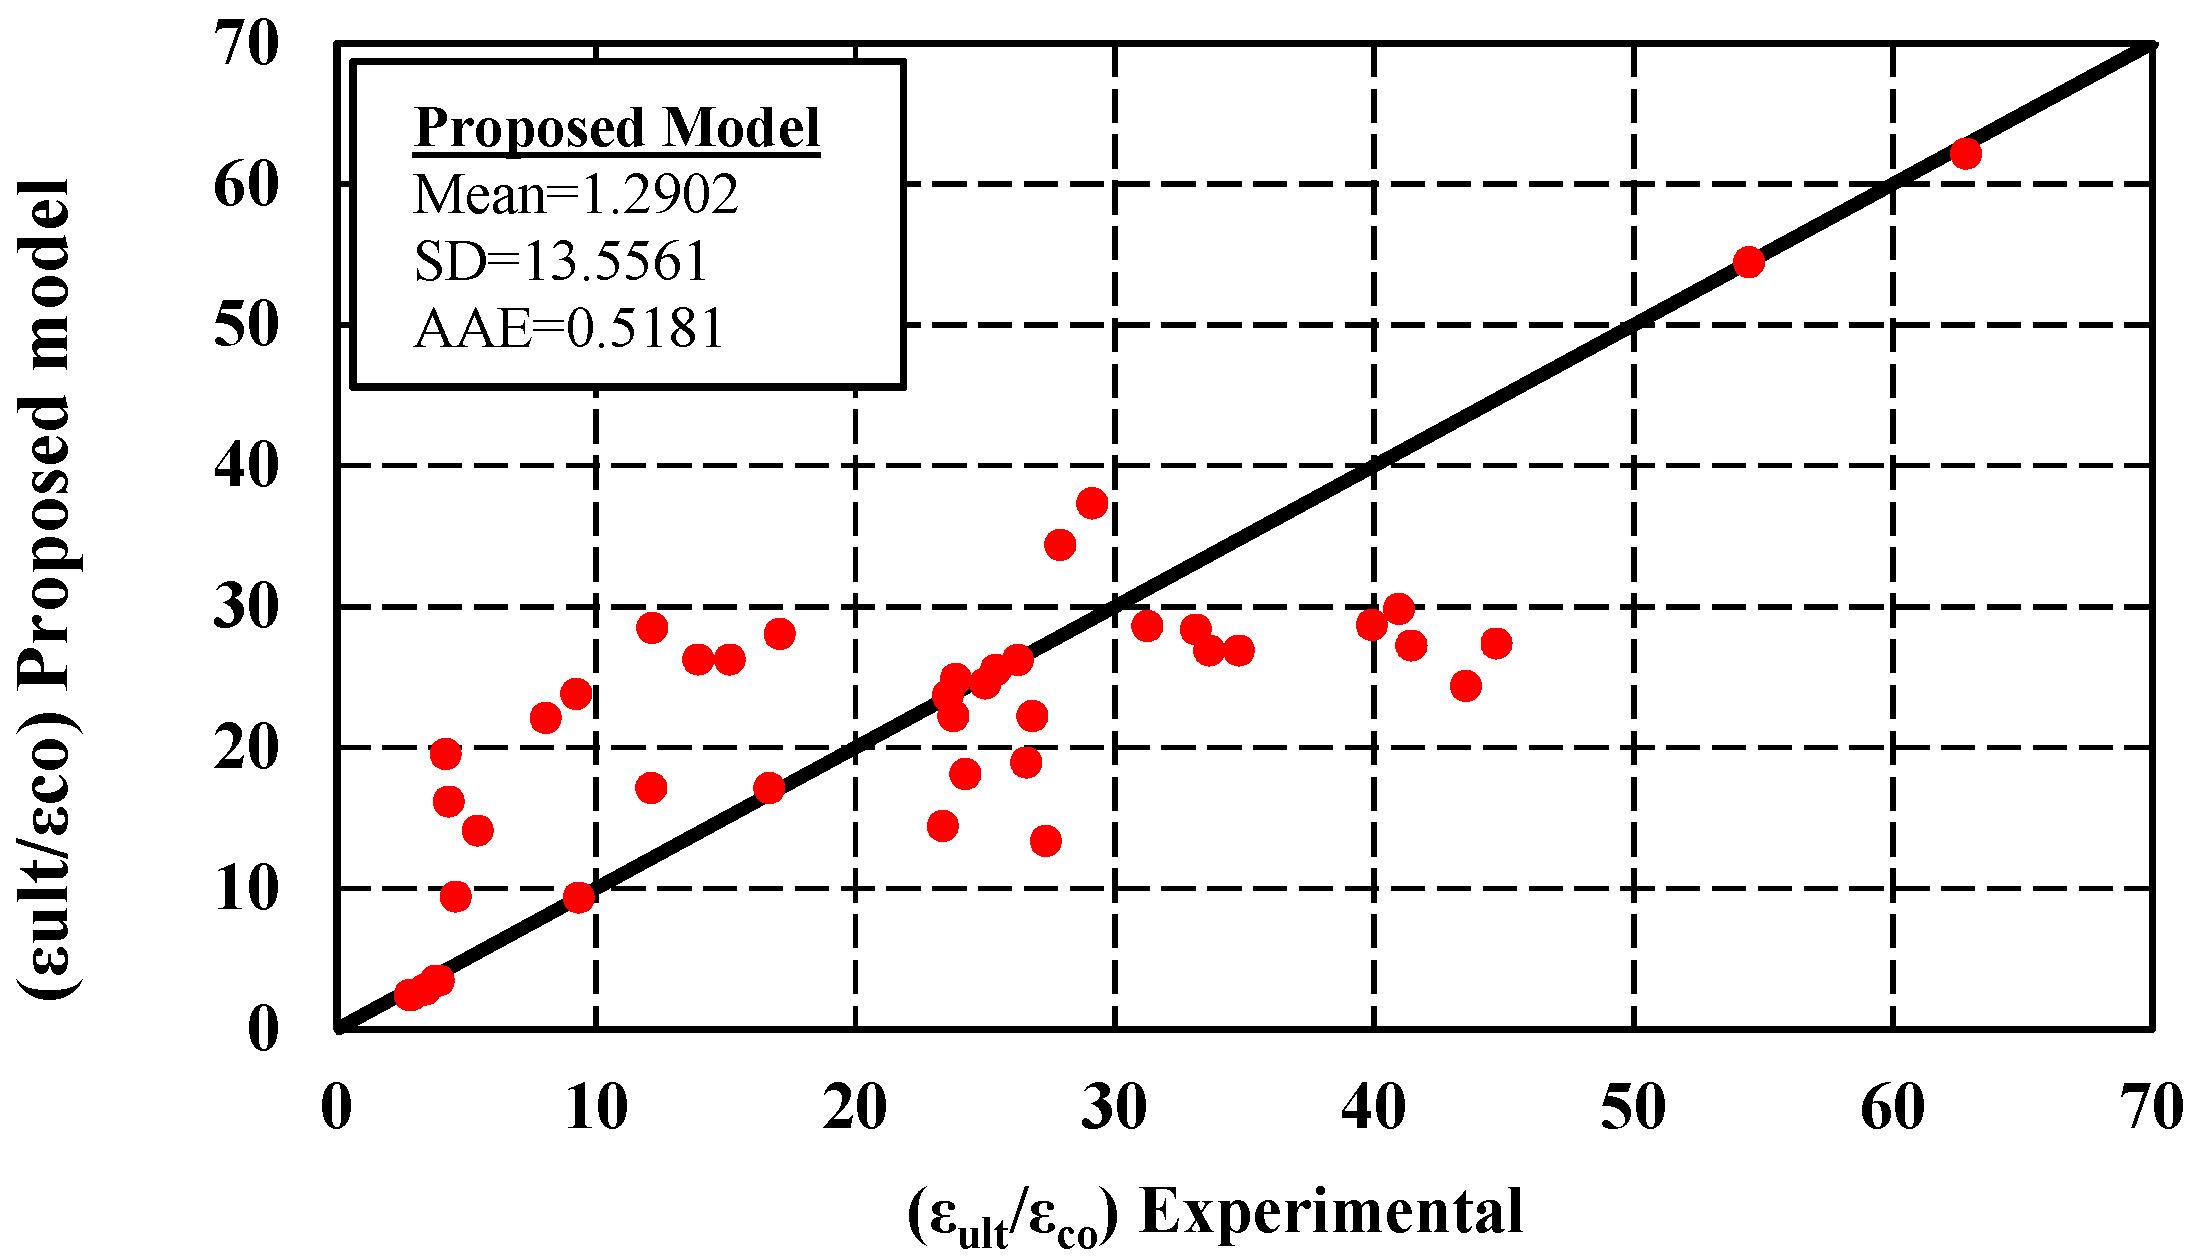
Figure 15, compares the ultimate axial strain values obtained from the proposed model (Equation (19c)) and experimental results. This comparison indicates that the model’s prediction and the test results are relatively similar to each other.
In Equation (19), the
ratio is used to obtain the ultimate axial strain of the SMA-confined concrete. In the following, to predict the ultimate axial strain of the concrete cylindrical specimens confined with SMA spirals, five two-dimensional equations are developed in terms of parameters
and
(Equation (20a-e)). The best expression is chosen with the use of nonlinear regression analysis and according to statistical indicators including root mean square error and coefficient of determination, the best expression is selected.
According to the statistical analyses, the results are shown in
Table 12, it can be seen that Equation (20e) has the highest coefficient of determination (R
2 = 0.9115) and the lowest RMSE value (RMSE = 6.7588). Therefore, Equation (20e) provides the most accurate results for predicting the ultimate axial strain of SMA-confined concrete. This strain is measured in terms of
and
.
A comparison of the ultimate axial strain values obtained from the proposed model (Equation (20e)) and experimental results are shown in
Figure 16. This comparison indicates that the model prediction is consistent with the test results.
5. Evaluation of Existing and Proposed Models
The review of previous research shows that various models have been presented for predicting the peak strength and the axial strain corresponding to the peak strength of concrete cylindrical specimens actively confined. Most of these equations are empirical relationships obtained by performing regression analysis on experimental data and obtaining linear or non-linear fitting curves for them, such as equations presented by other researchers [
25,
72,
73,
74,
75,
76,
77,
78]. Additionally, other researchers have tried to investigate the behavior of concrete cylindrical specimens confined with SMA spirals, such as Chen and Andrawes [
26]. In this section of the research, the performance of the existing models is compared with the proposed models using statistical indicators. These indicators include the coefficient of determination (R
2), mean, root mean square error (RMSE), relative root mean square error (RRMSE), relative square error (RSE), mean absolute error (MAE), relative mean absolute error (RMAE), average absolute error (AAE), and performance index (PI) which are defined in Equations (5)–(7), (9), (11) and (21)–(25) [
65,
66,
67,
70,
79]:
To evaluate the aforementioned model, accepted criteria need to be considered. Some criteria suggested by different researchers for model validity are as follows:
The R-squared value lies between 0 and 1, and a higher value indicates a better fit of a model [
65]. If a model gives |R| > 0.8 (R
2 > 0.64), a strong correlation exists between the predicted and measured values [
80].
A lower value indicates higher accuracy for the error measures introduced (RRMSE, RMAE, RSE, AAE). On the limit state, a completely exact model would have error measures equal to zero [
66].
Model accuracy is considered acceptable when the maximum value of RRMSE equals 0.2 and model accuracy is considered excellent when RRMSE is less than 0.1 [
81].
The smaller PI values indicate the better performance of the proposed models. If the maximum PI value equals 0.2, the results from the proposed model are close to the experimental results [
79].
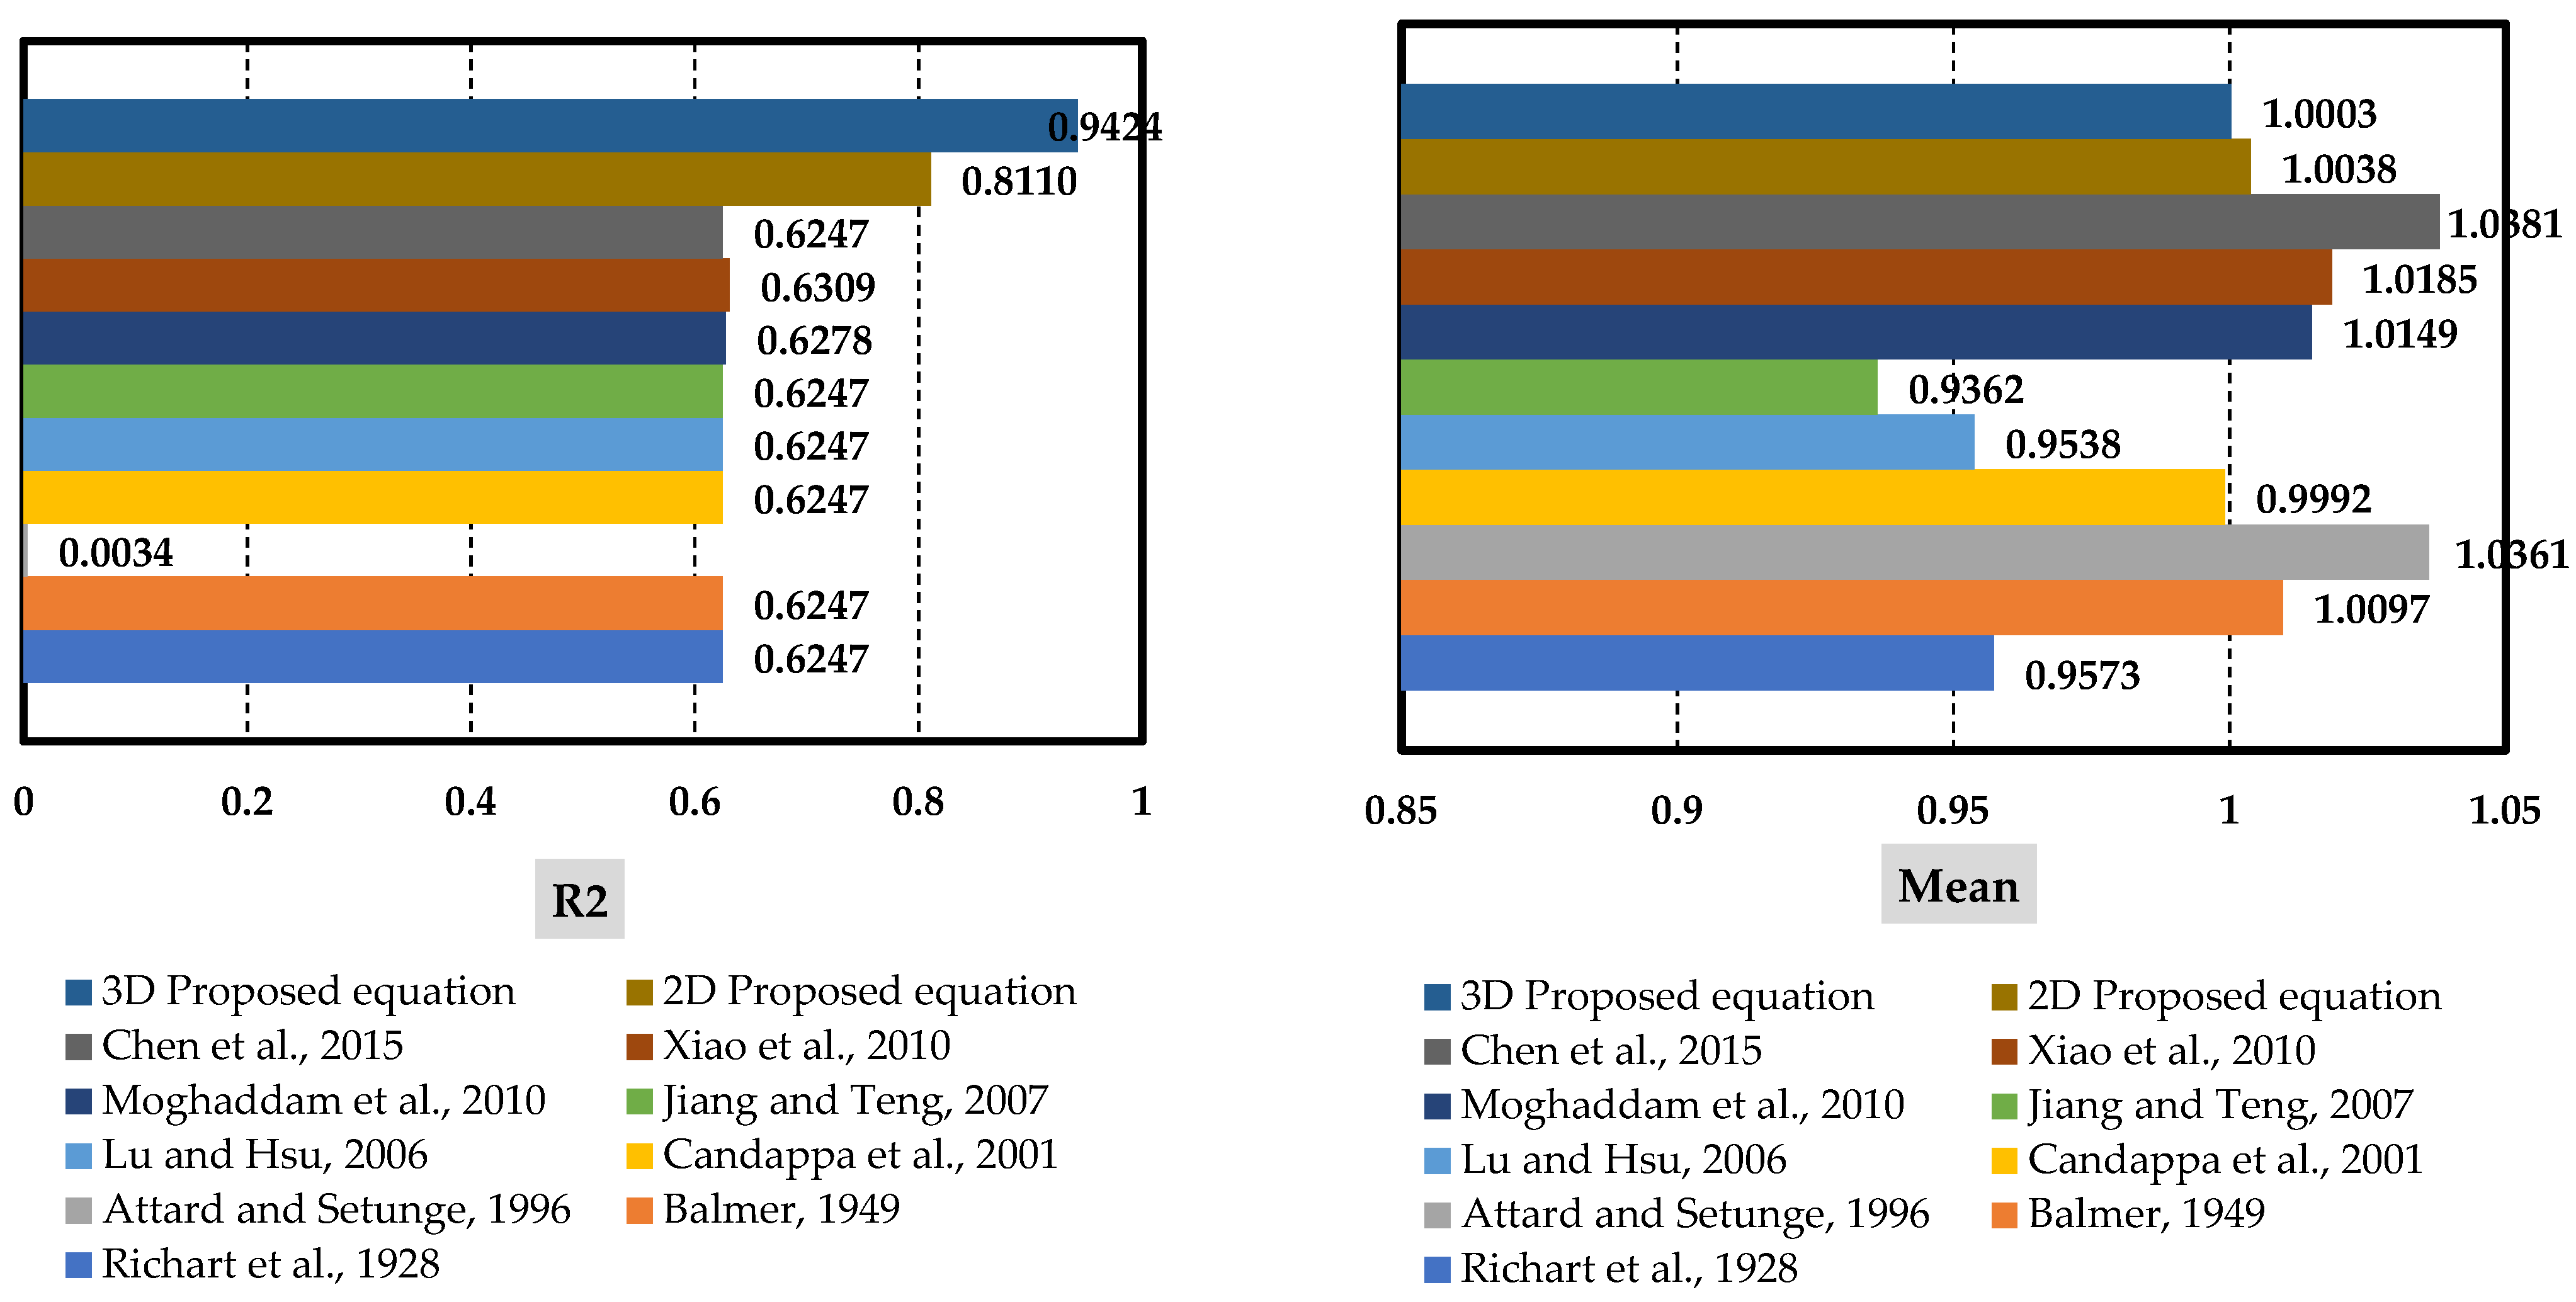
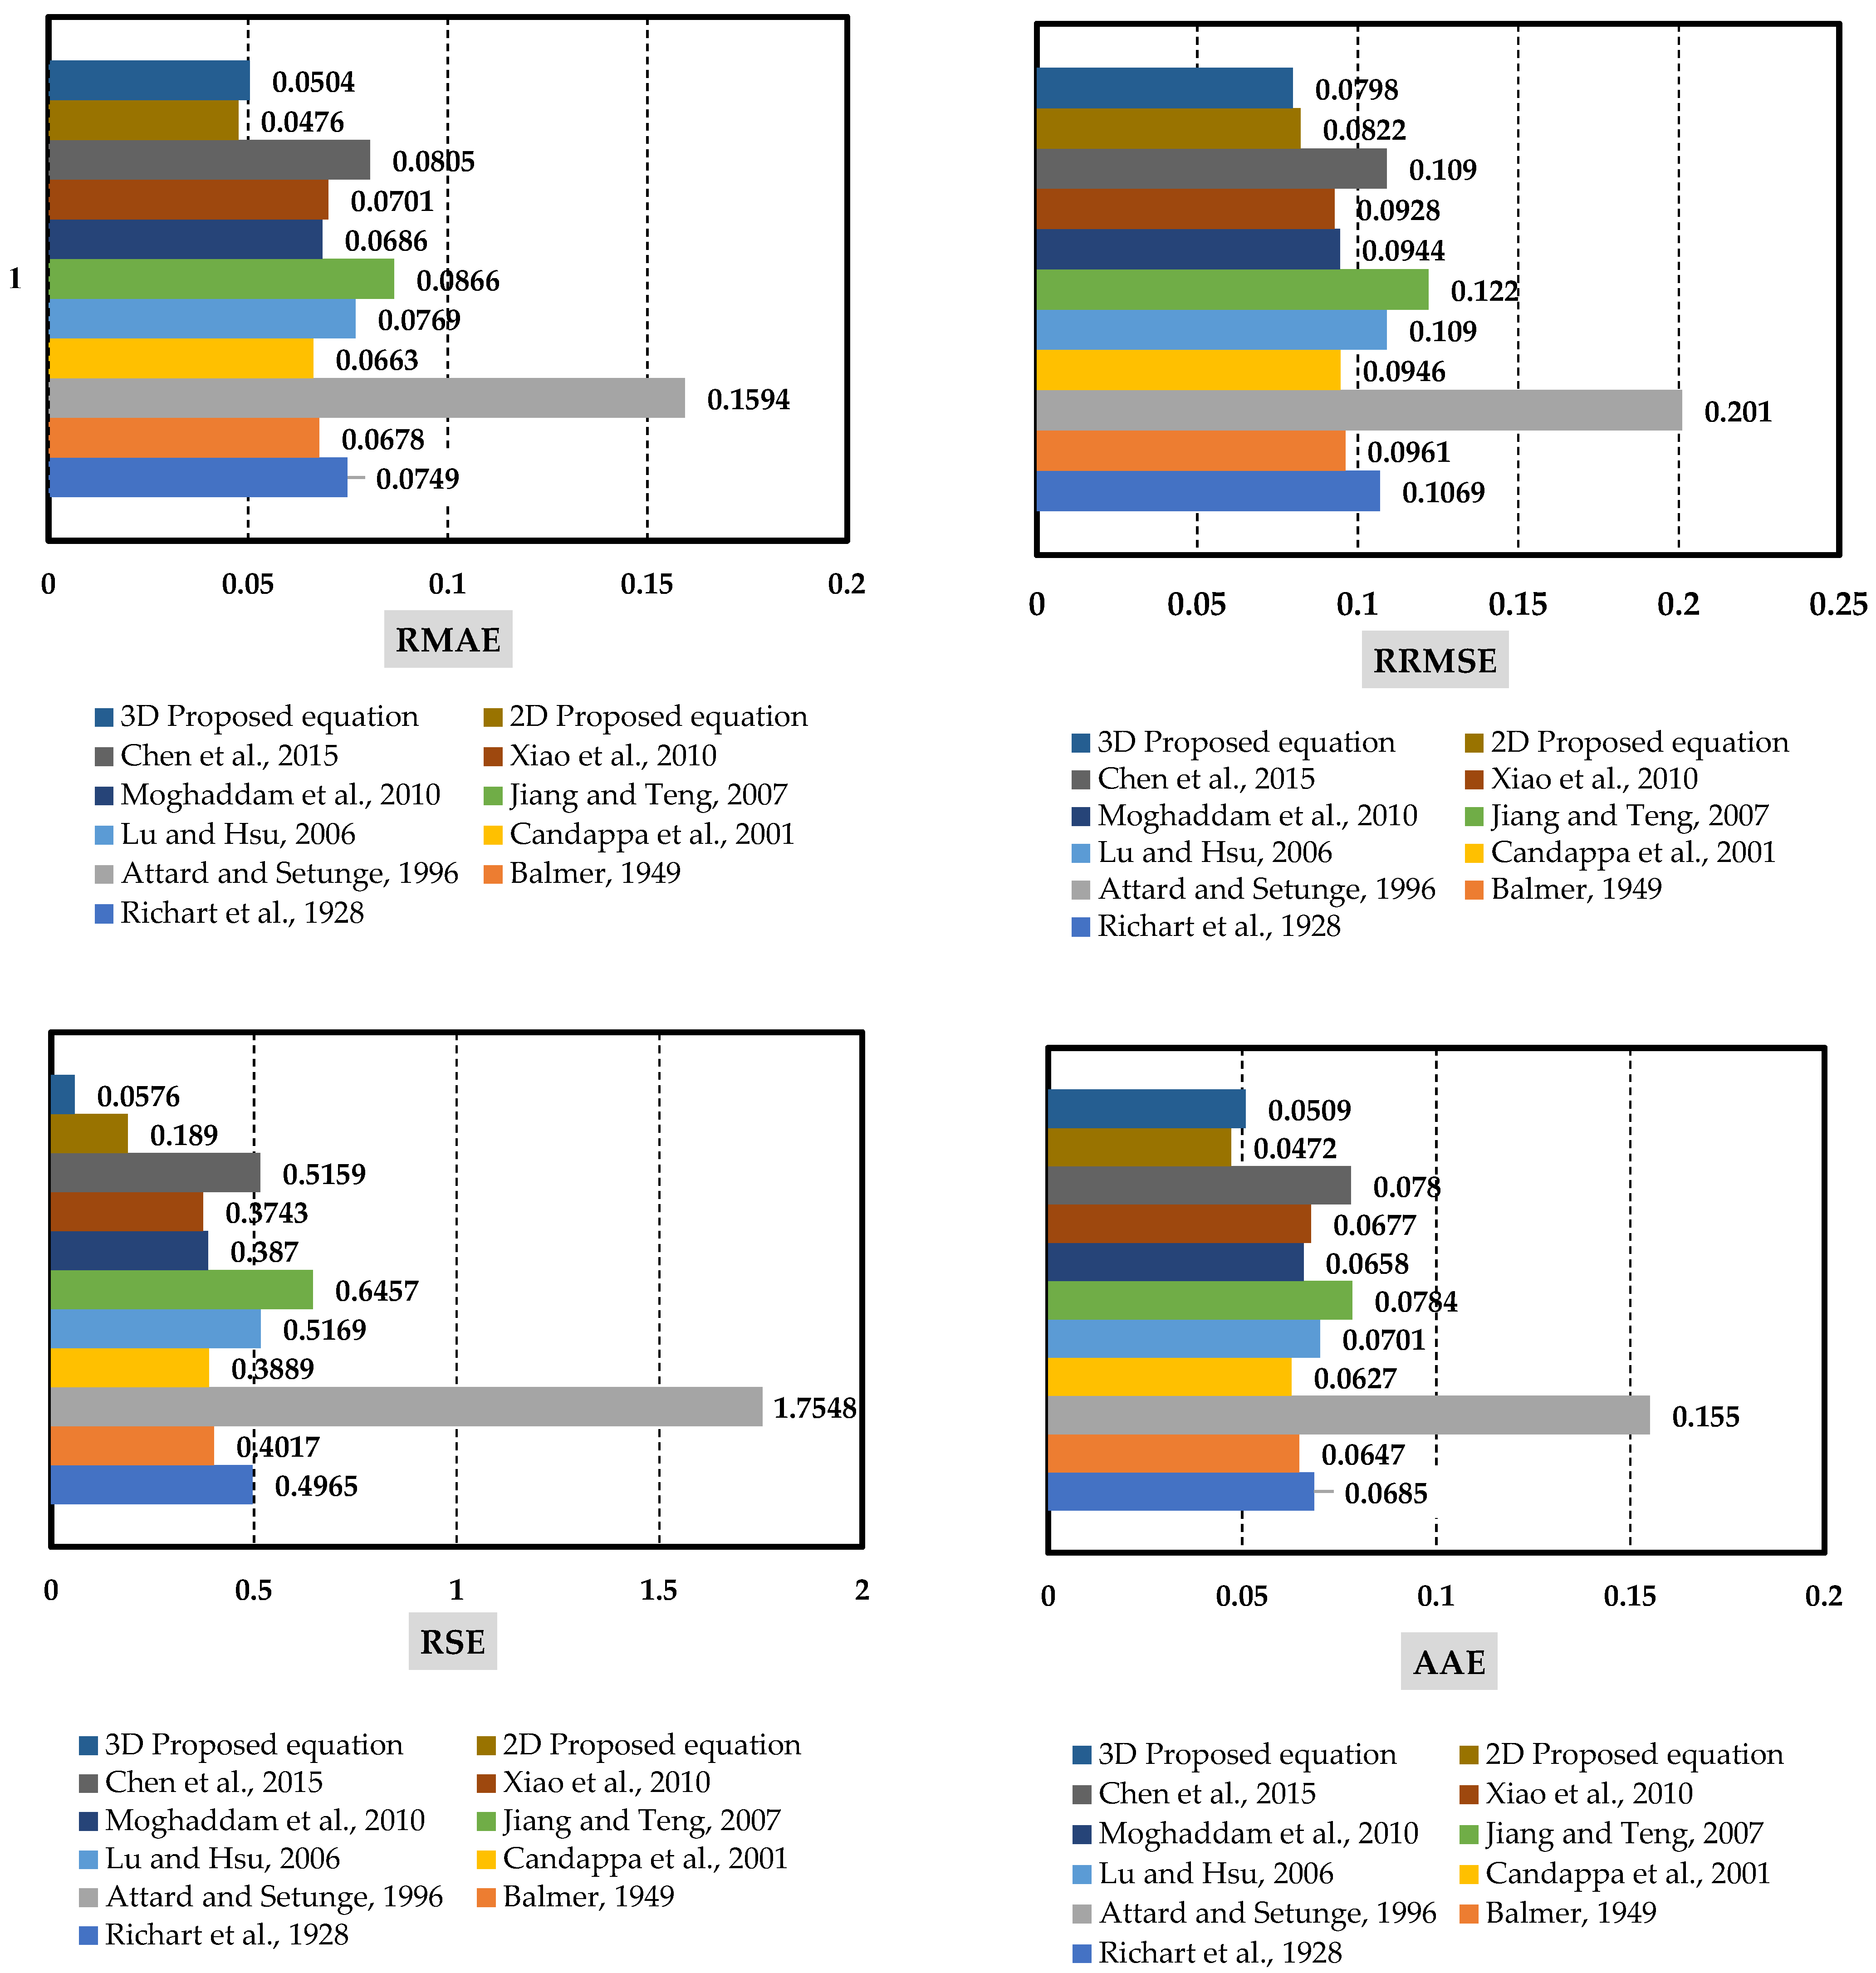
Table 13 presents the statistical indicators of the peak compressive strength models of actively confined concrete. Additionally,
Figure 17 shows the changes diagram of each indicator for the models presented by different researchers and the proposed models.
Considering the mentioned criteria, it can be seen that the two-dimensional and three-dimensional equations presented for calculating the peak strength of concrete confined with SMA spirals provide better results than other models. Additionally, by comparing the two-dimensional and three-dimensional expressions, it can be found that the three-dimensional equation (Equation (12e)) provides better results compared to the two-dimensional equation (Equation (8e)).
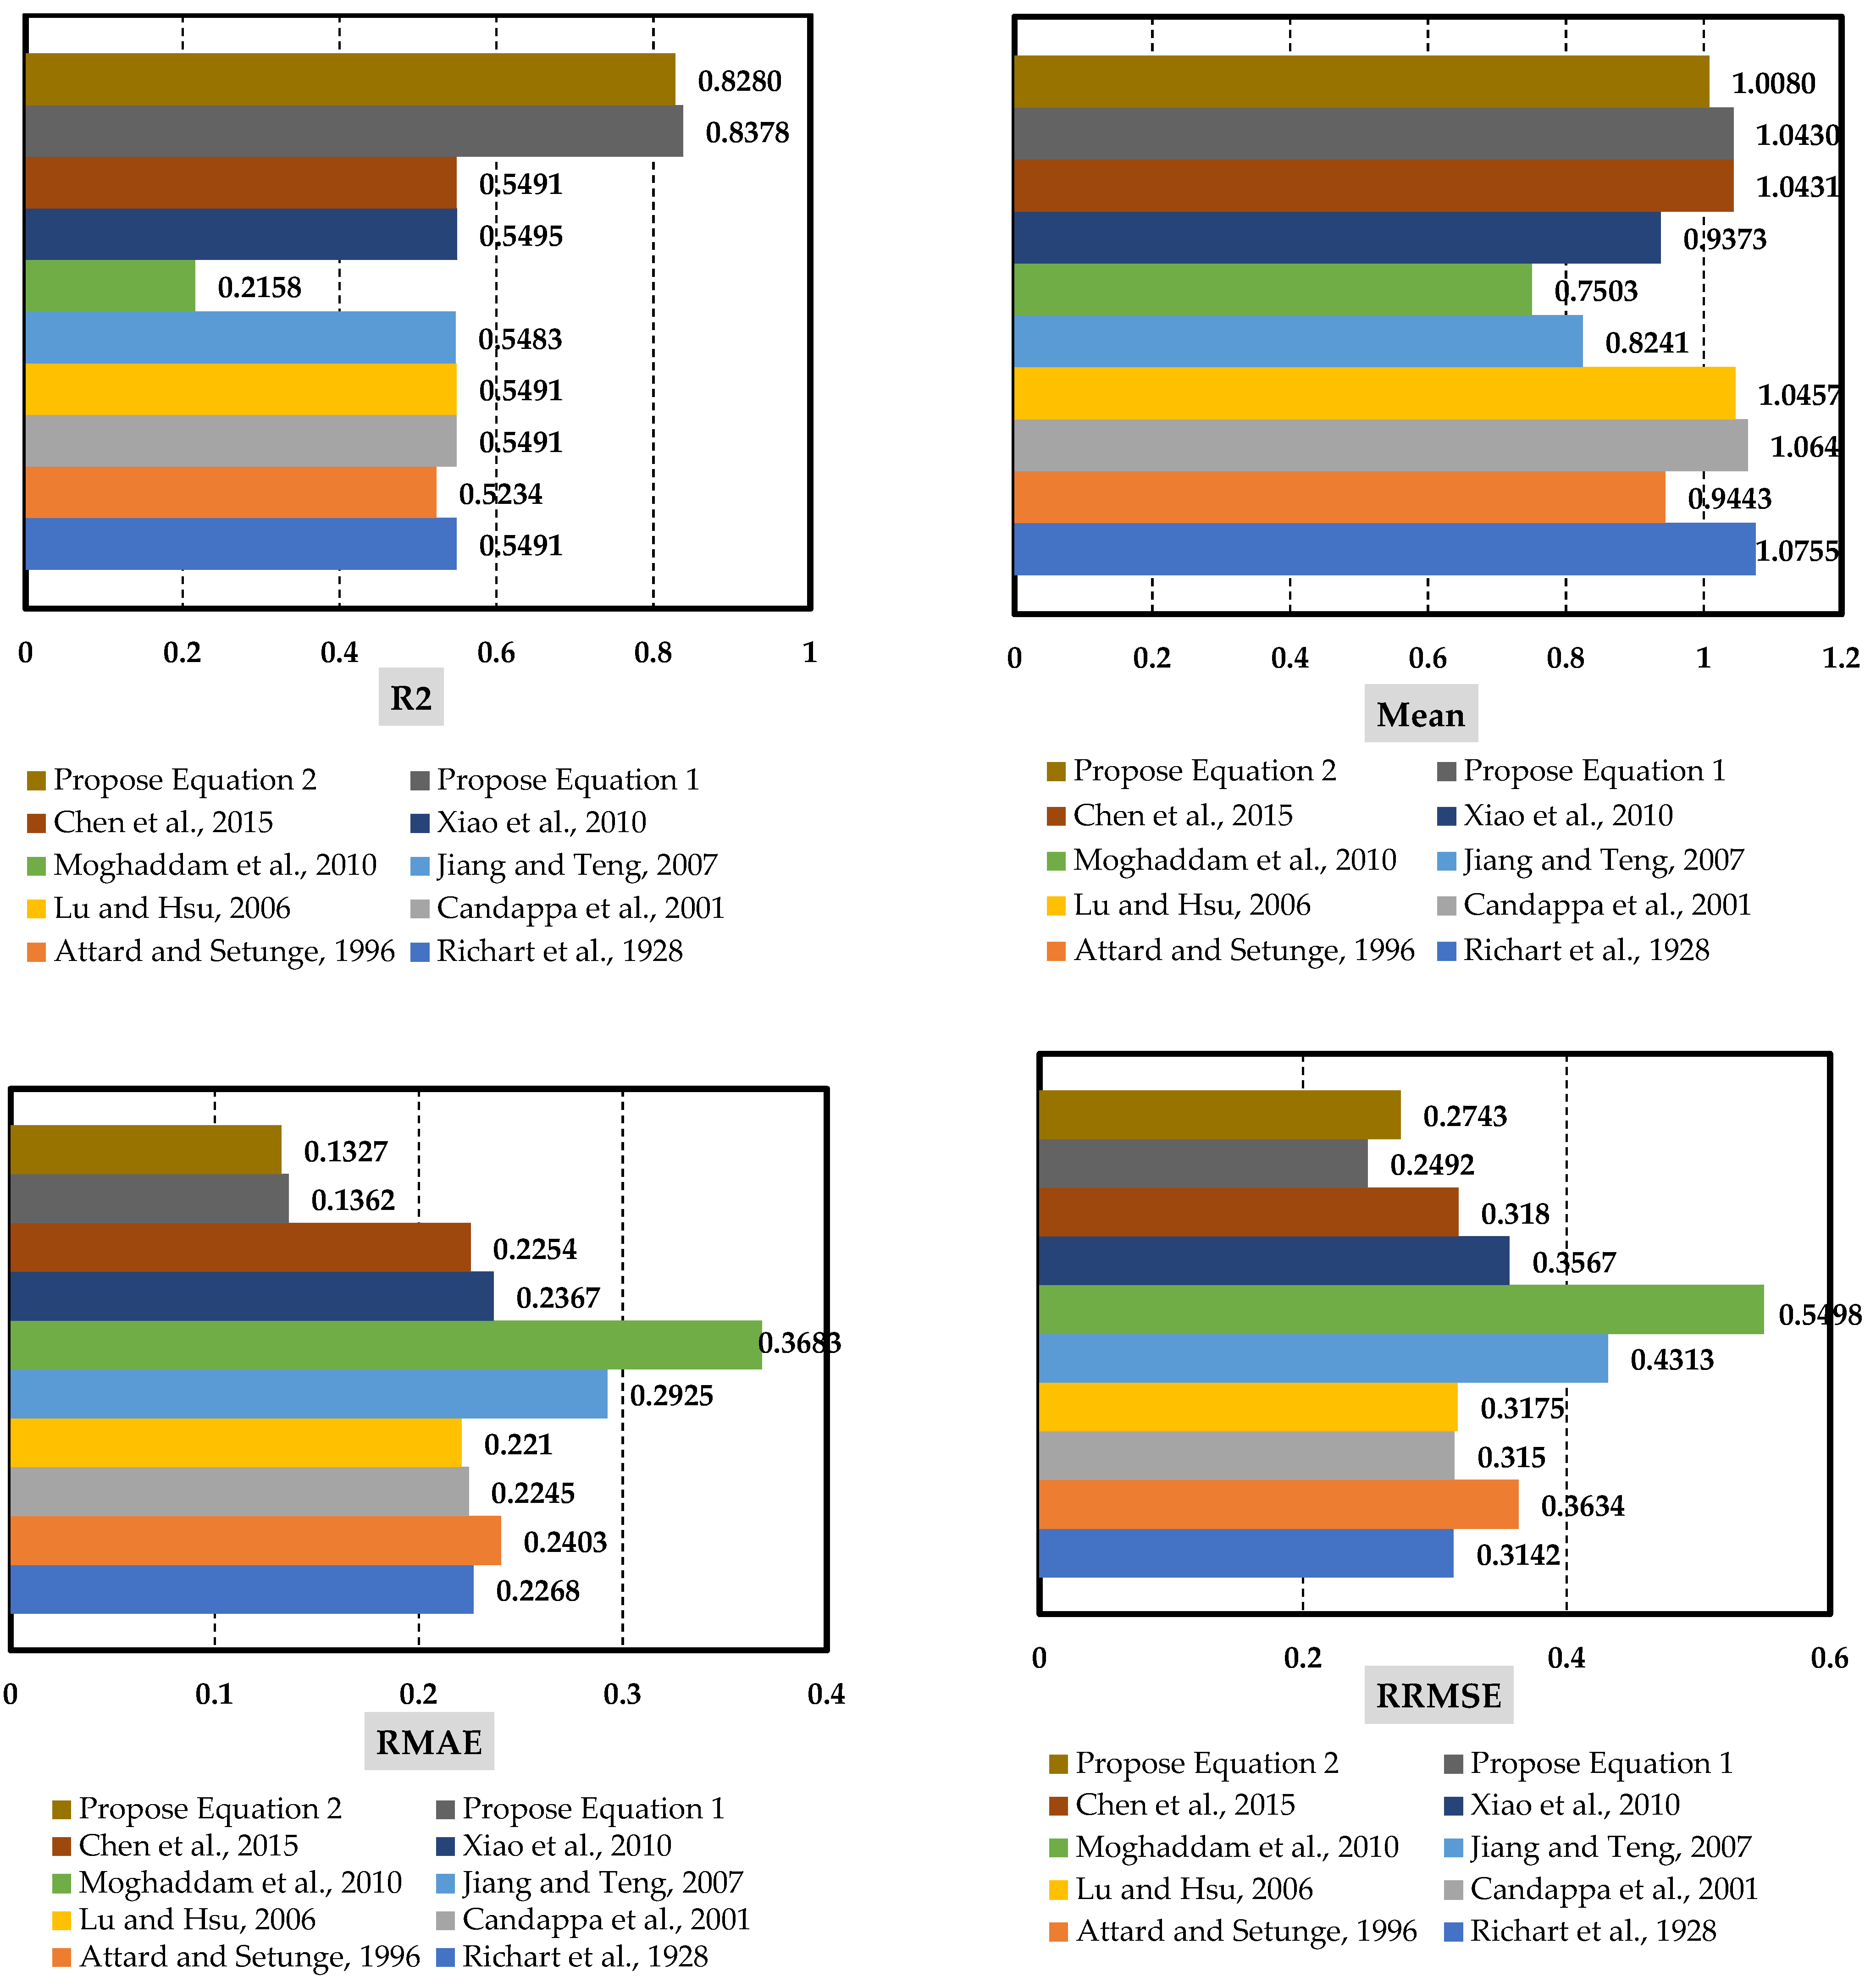
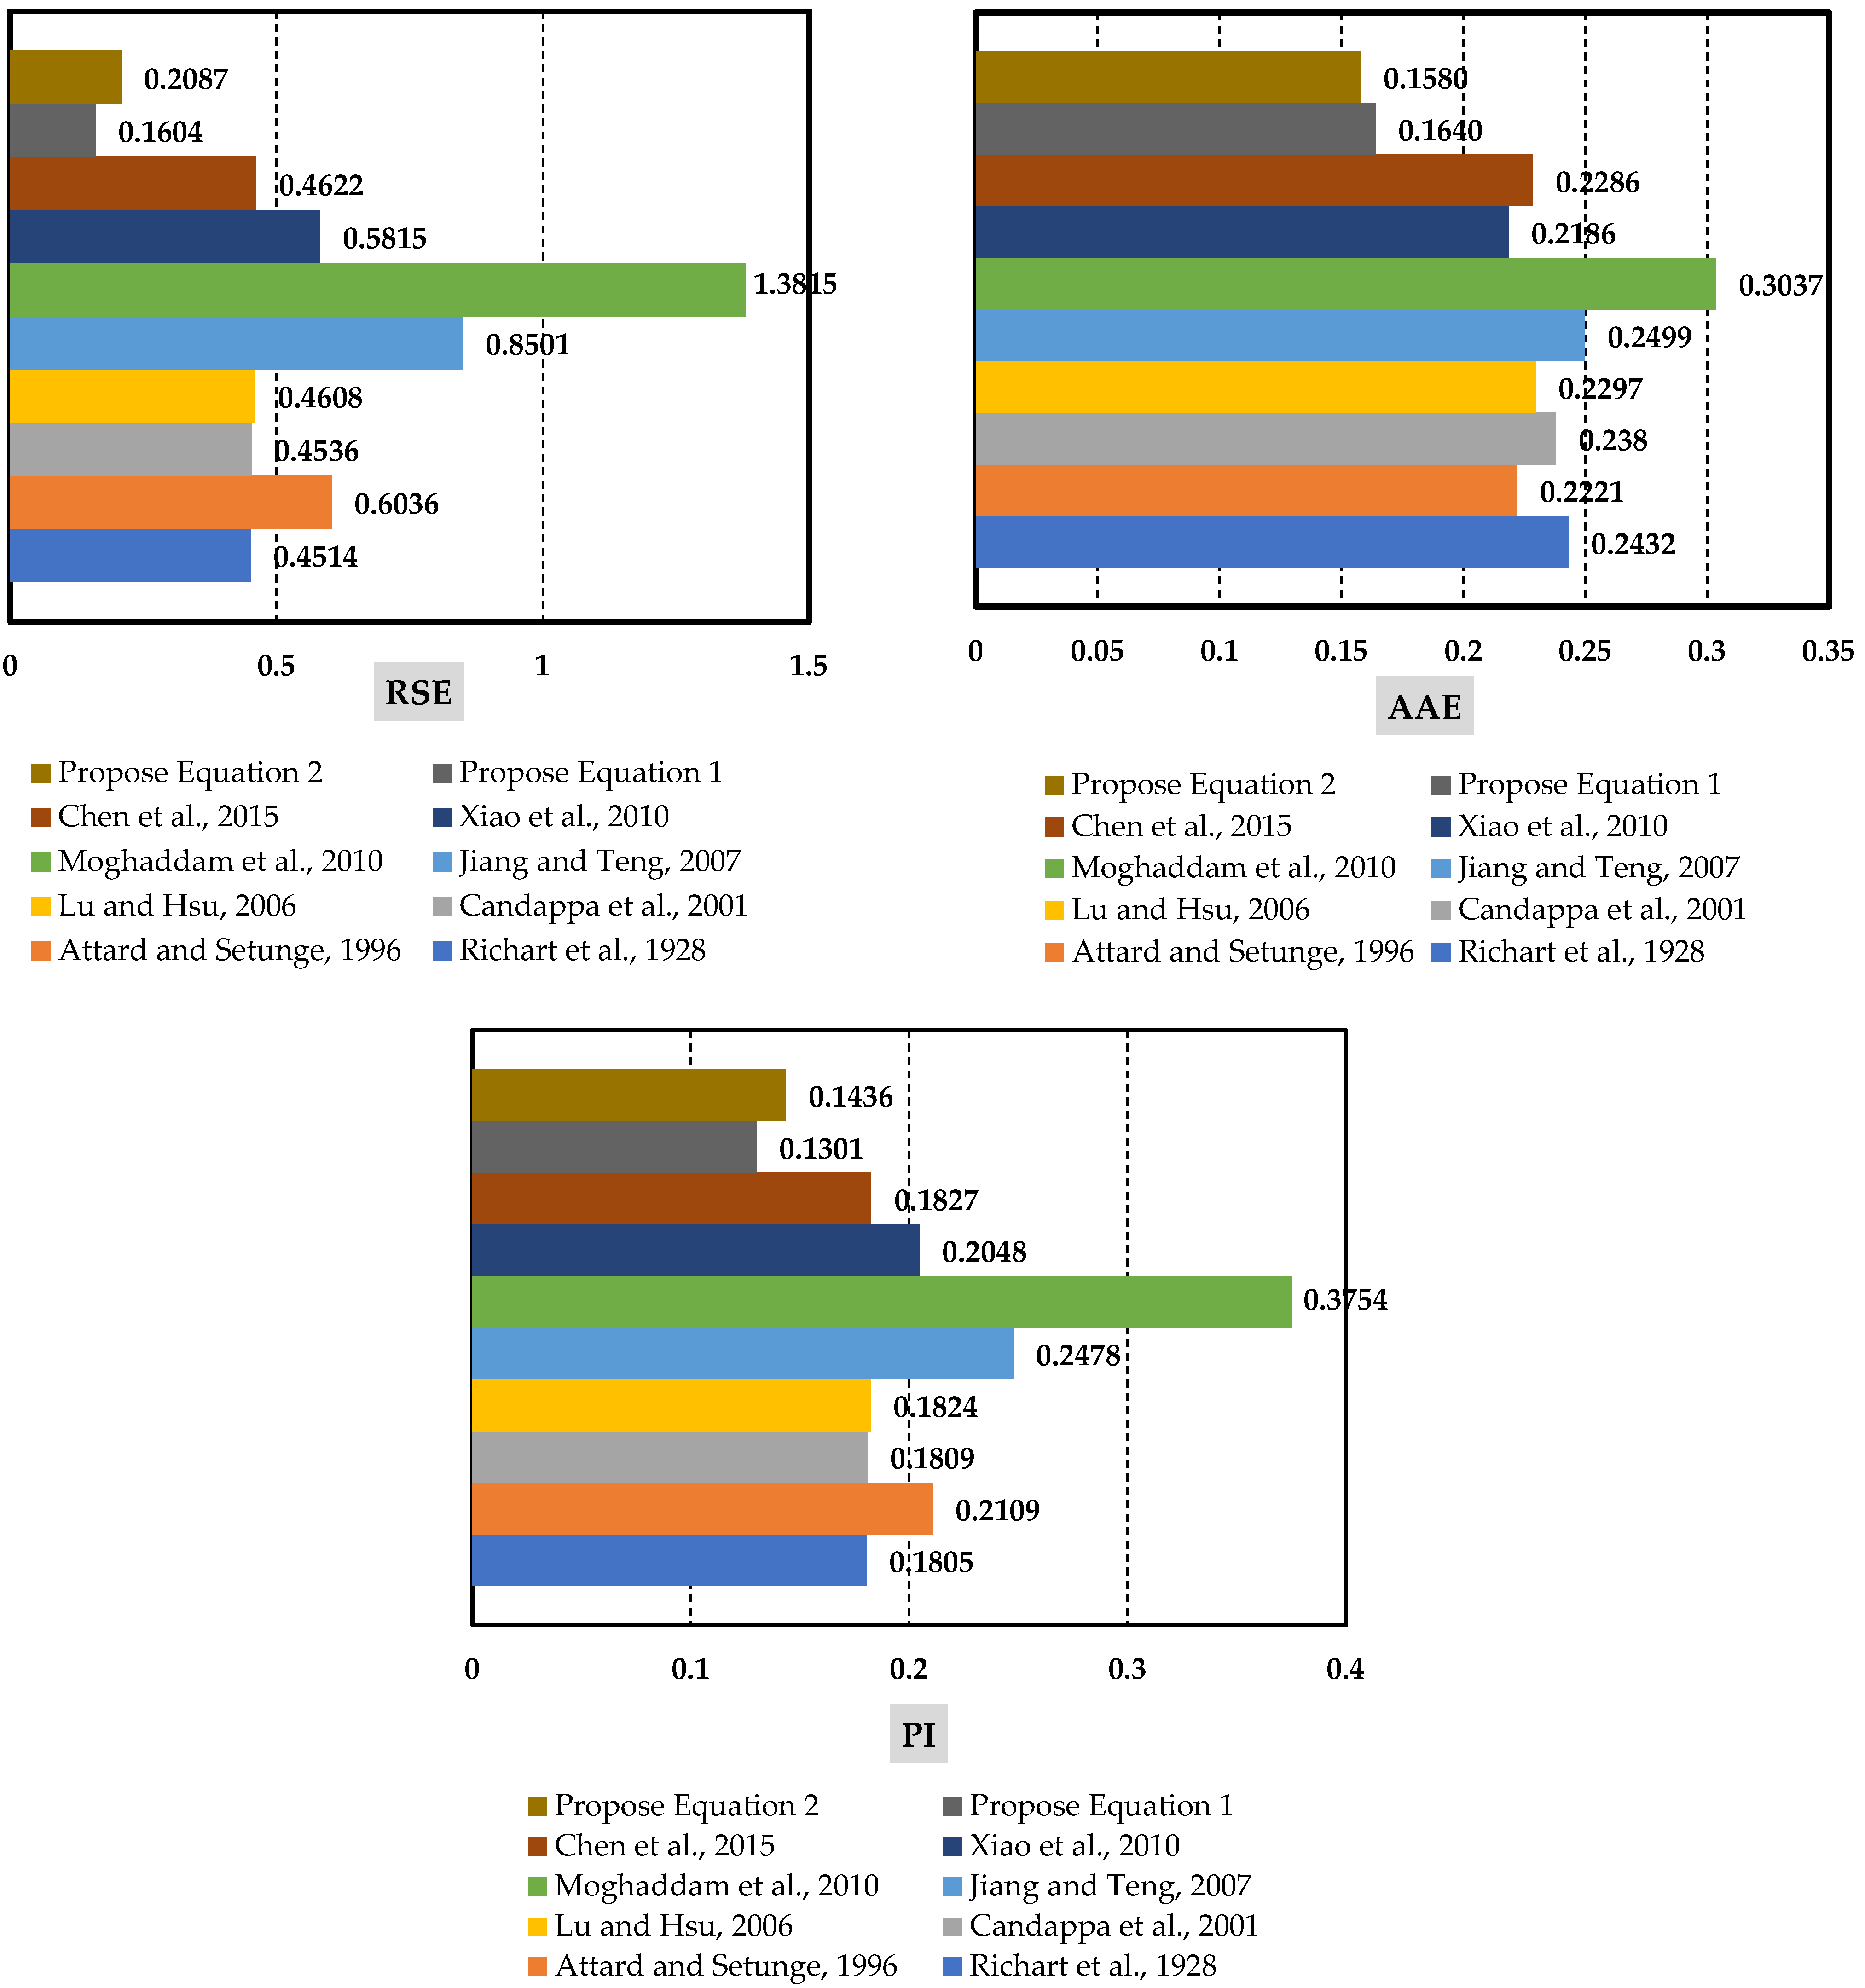
Table 14 presents the statistical indicators of the axial strain corresponding to the peak compressive strength models of actively confined concrete. Additionally,
Figure 18 shows the changes diagram of each indicator for the models presented by different researchers and the proposed models.
Considering the mentioned criteria, it can be seen that equations presented for calculating the axial strain corresponding to the peak strength of concrete confined with SMA spirals provide better results than other models. Additionally, by comparing the two presented expressions, it can be found that both proposed equations (Equations (15e) and (16e)) provide relatively the same performance.
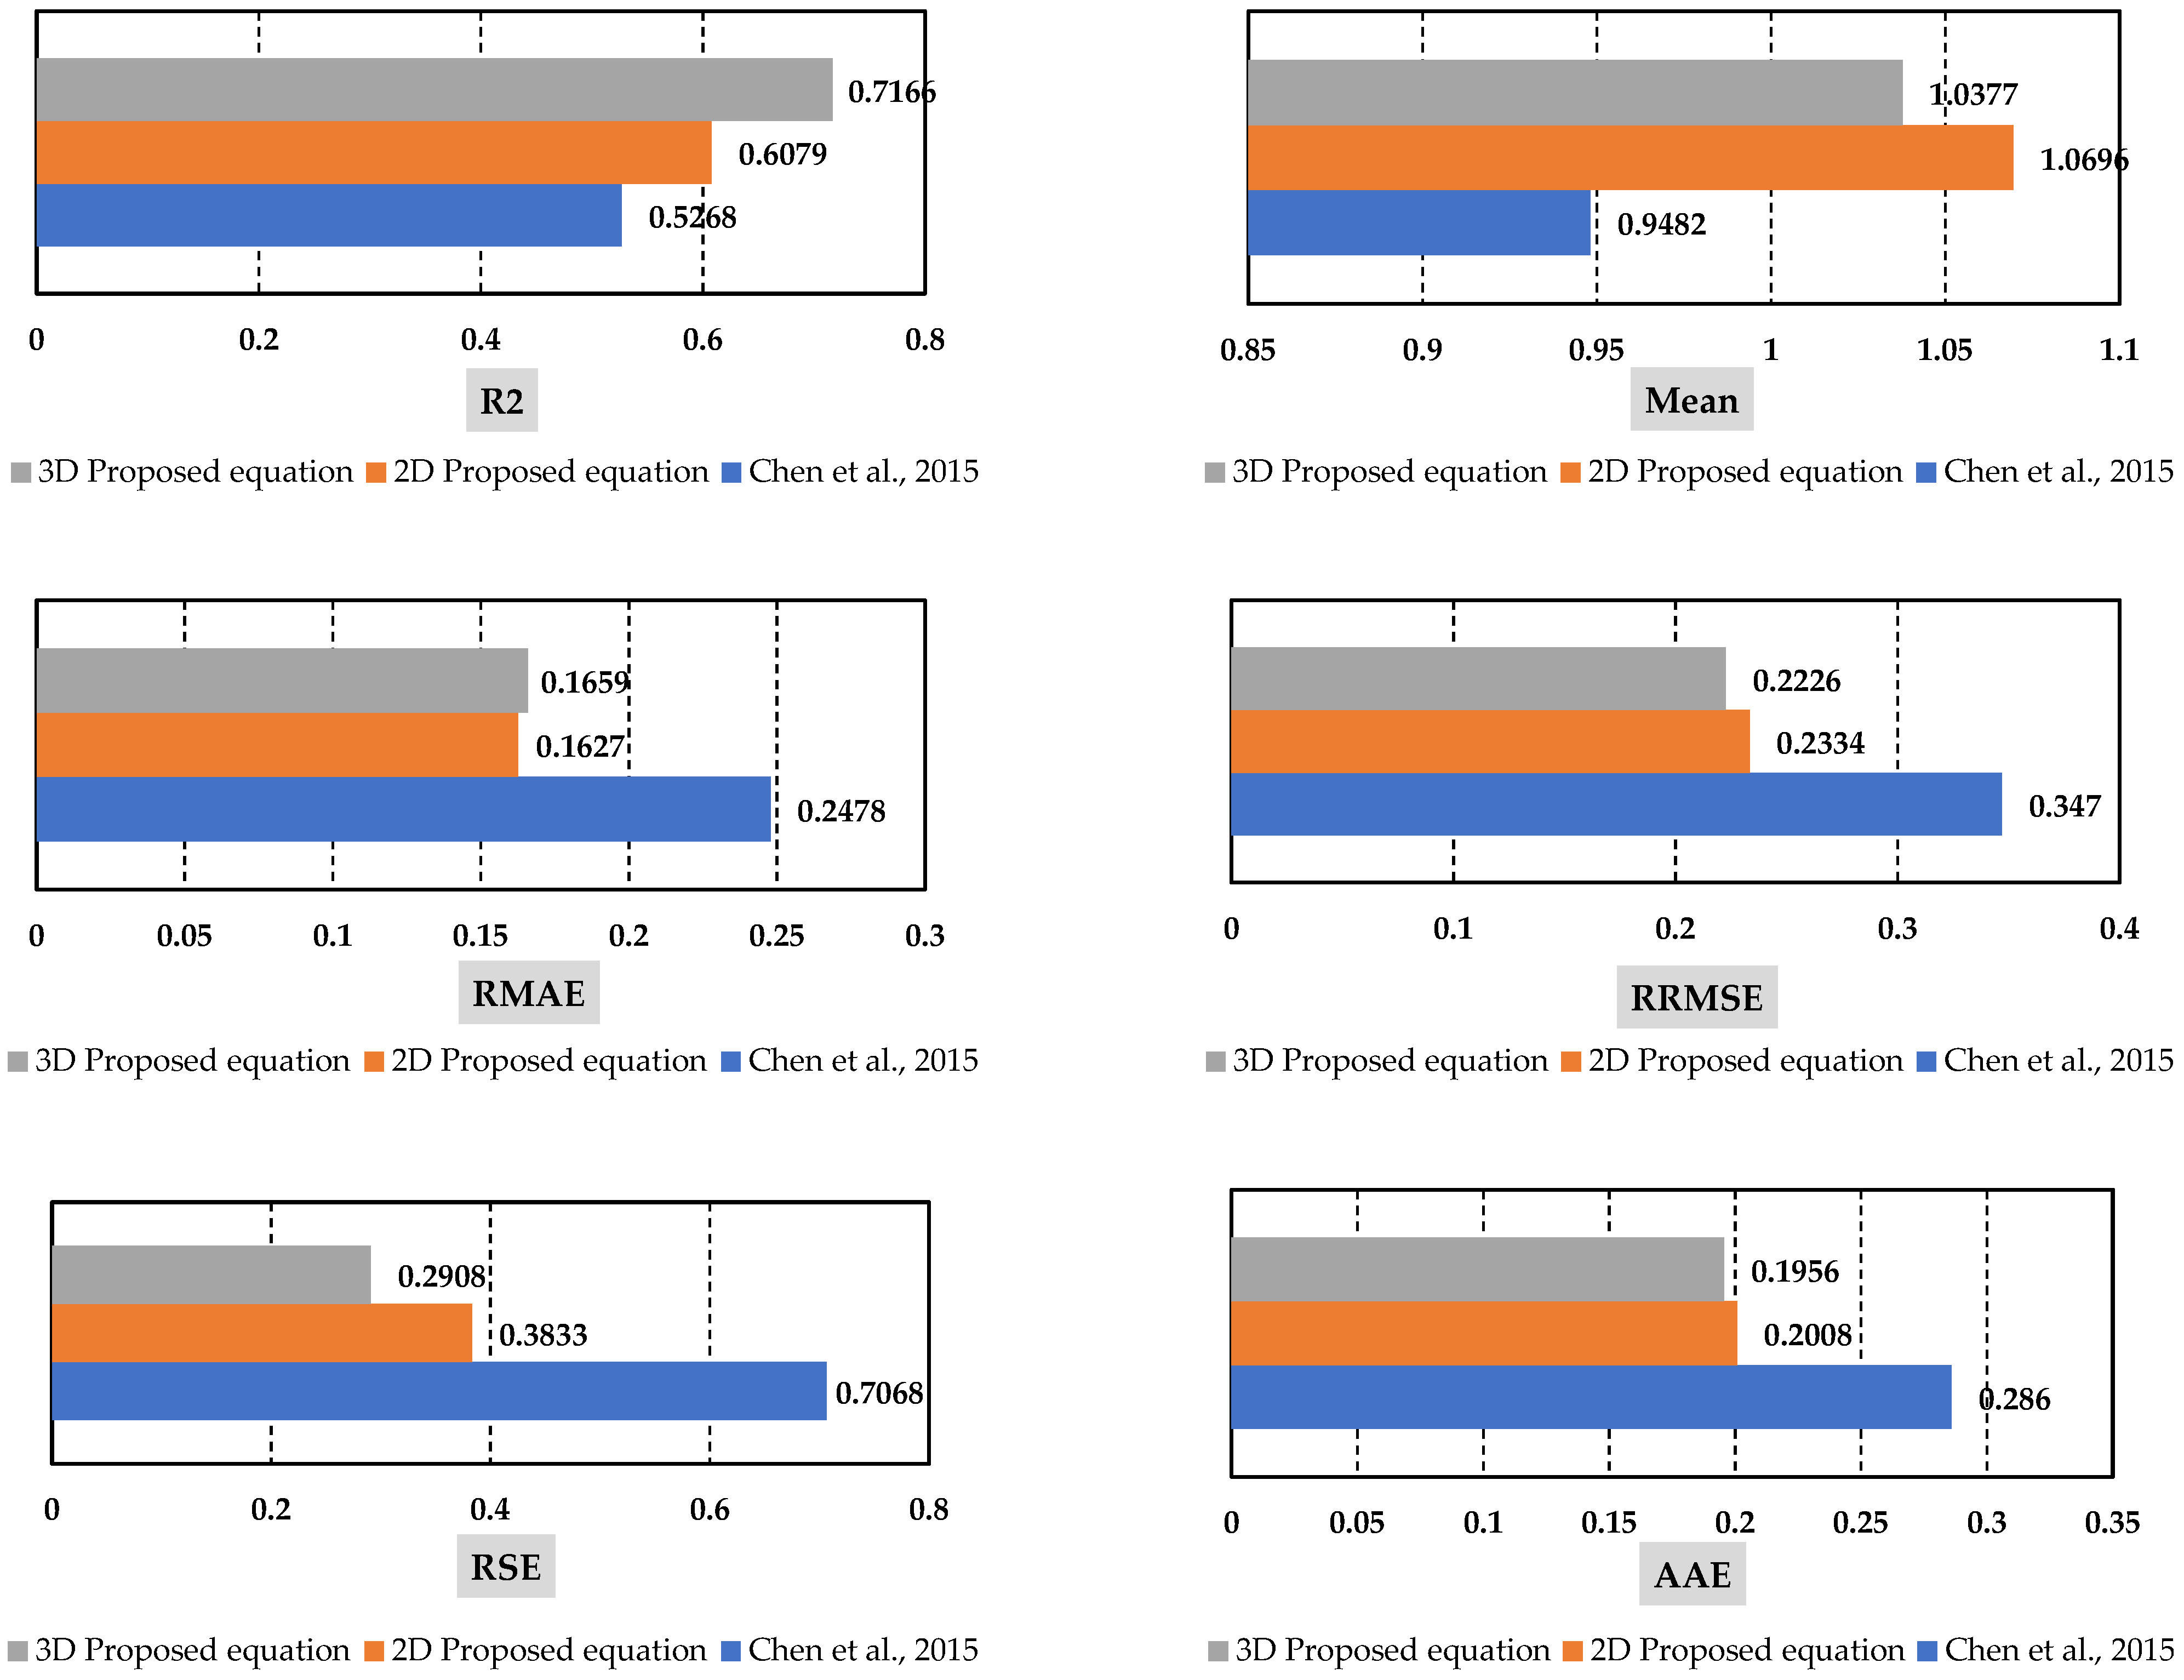
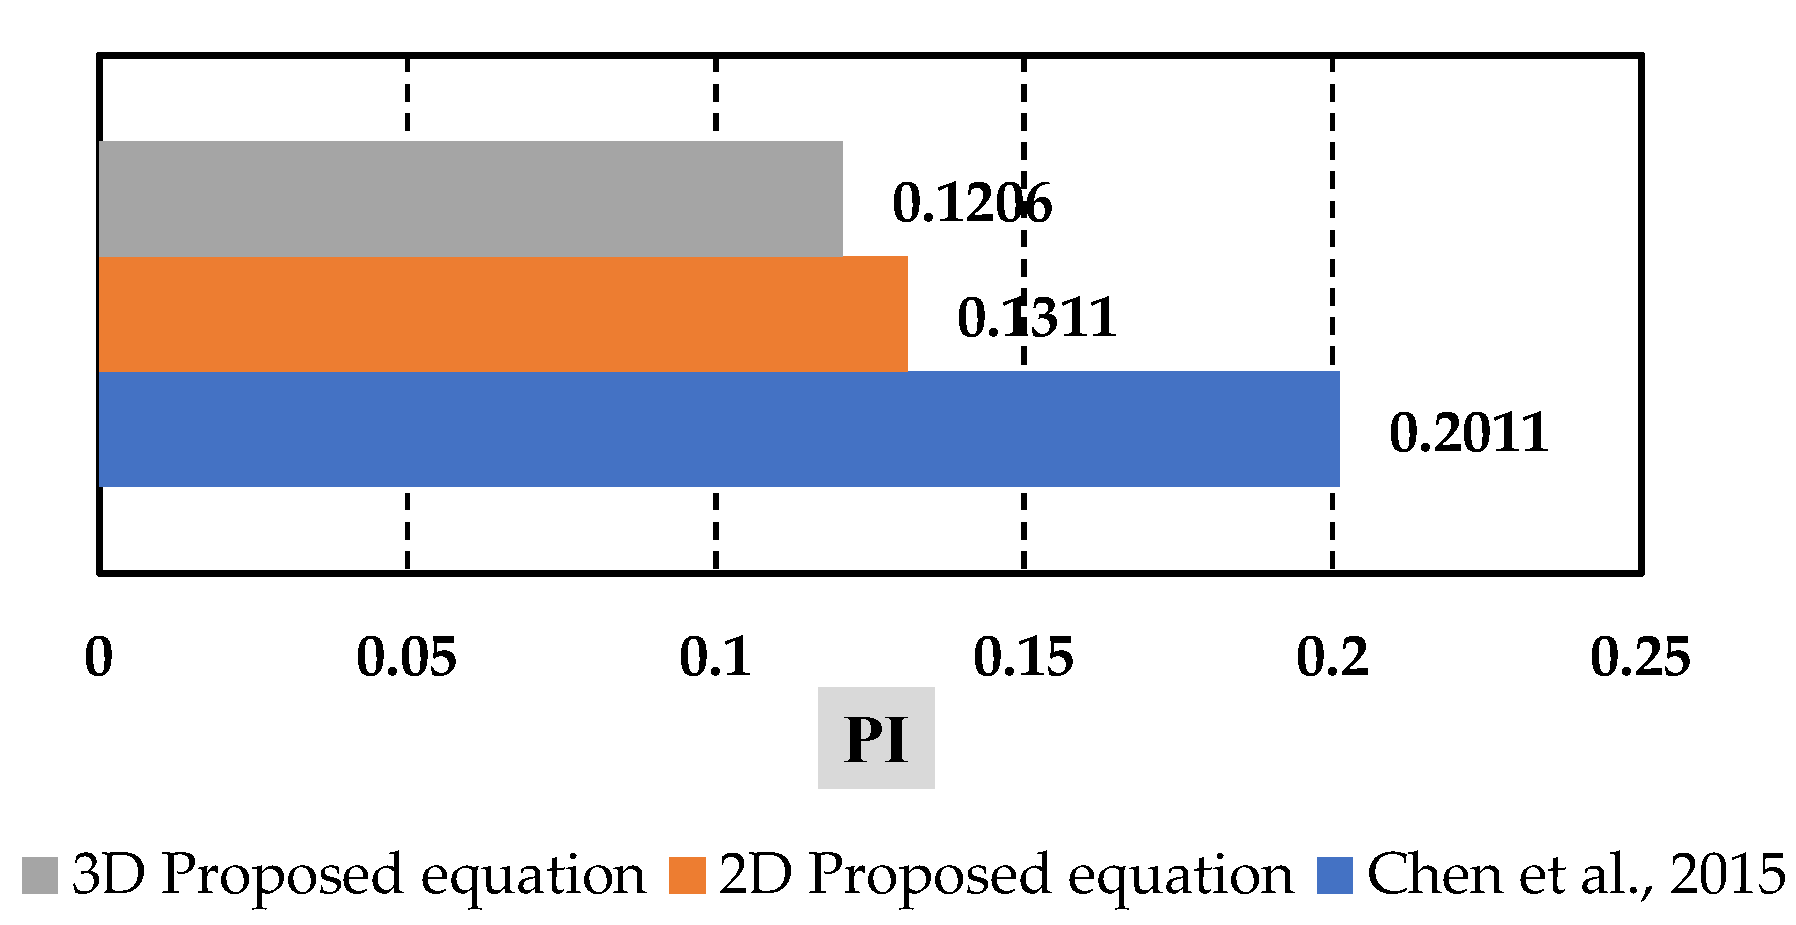
Table 15 presents the statistical indicators of the ultimate strength models of the SMA-confined concrete. Additionally
Figure 19 shows the changes diagram of each indicator for the model presented by Chen and Andrawes [
26] and the proposed models.
Considering the mentioned criteria, it can be seen that equations presented for calculating the ultimate strength of concrete confined with SMA spirals provide better results than Chen and Andrawes’ model. Additionally, by comparing the two presented expressions, it can be found that Equation (18c) has a better performance.
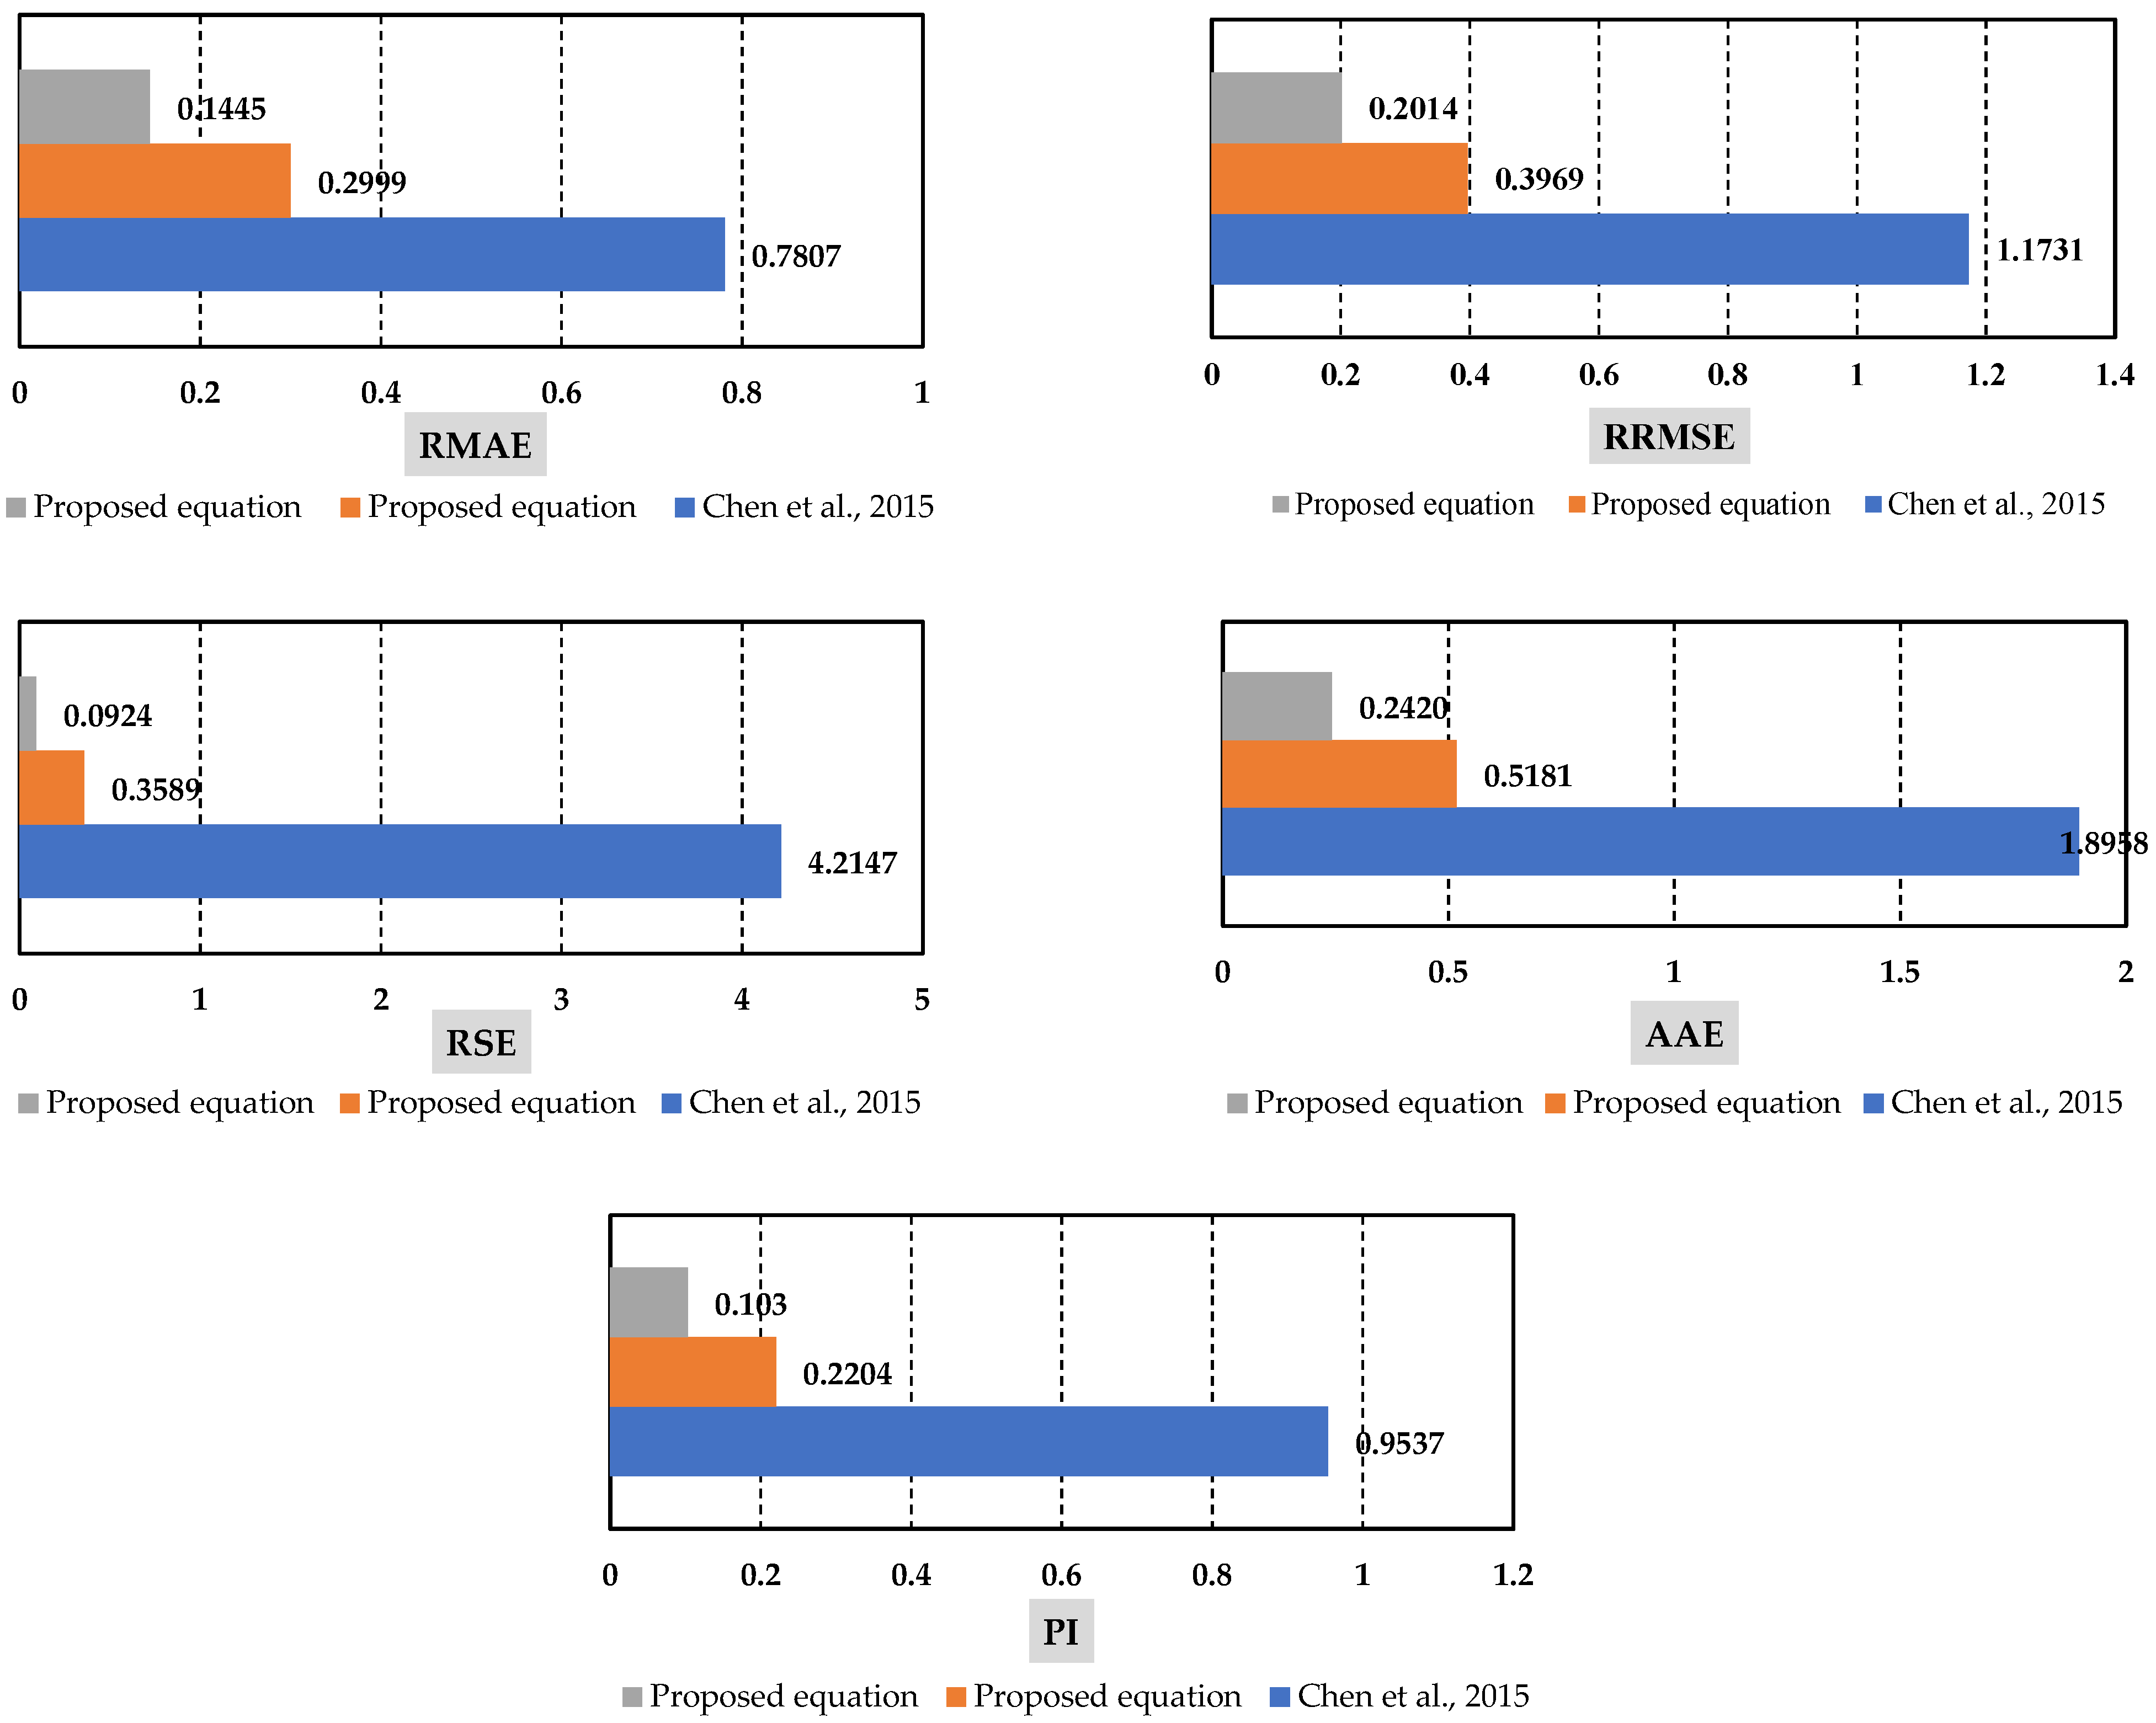
Table 16 presents the statistical indicators of the ultimate strain models of SMA-confined concrete. Additionally,
Figure 20 shows the change diagram of each indicator for the model presented by Chen and Andrawes [
26] and the proposed models.
Considering the mentioned criteria, it can be seen that the equations presented for calculating the ultimate strain of concrete confined with SMA spirals provide better results than Chen and Andrawes model. Additionally, by comparing the two presented expressions, it can be seen that the model that is expressed in terms of and (Equation (20e)) performs better.
6. Conclusions
In this paper, the required data including the results of experimental studies (published between 2008 and 2022) conducted on unreinforced concrete cylindrical specimens confined with SMA spirals, which are subjected to an axial compressive force (monotonic and cyclic) without eccentricity, were collected. By employing MATLAB and SigmaPlot software and performing several regression analyses, some relations were obtained for predicting the peak compressive strength, axial strain corresponding to peak compressive strength, ultimate compressive strength, and ultimate axial strain of unreinforced concrete cylindrical specimens actively confined with SMA spirals. Finally, the developed models were compared with the existing relations. The following significant points can be found by examining the results of this study:
To predict the peak compressive strength of the cylindrical specimens confined with SMA spirals, a 2D relationship was defined in terms of and . Furthermore, a 3D relationship was also developed in terms of fcc, fc0, and fl. The statistical investigations show that the proposed models have a higher R-square and less RRMSE than the existing relations. As a result, the obtained responses from the developed models are more accurate.
By comparing the proposed 2D and 3D relations for predicting the peak compressive strength of concrete specimens confined with SMA spirals, which has been implemented using statistical analysis, it can be observed that the 3D relation is more accurate than the 2D model.
In order to predict the axial strain corresponding to the peak compressive strength of the concrete cylindrical specimens actively confined with SMA spirals, two 2D models were developed so that one of these relations is in terms of and while the other relation was defined in terms of and . The statistical investigations show that the proposed relationships have a higher R-square and a lower RRMSE compared to the existing relations developed in the previous research.
To predict the ultimate compressive strength of the cylindrical concrete specimens confined with SMA spirals, a 2D relation was defined in terms of and a 3D relation was also defined in terms of , fc0 and fl. The conducted studies show that the proposed models have a higher R-square and less RRMSE than the existing models. It can be concluded that the proposed models can be more accurate in predicting the ultimate compressive strength of actively confined concrete specimens.
Due to predicting the ultimate axial strain of the actively confined concrete cylindrical specimens with SMA spirals, two 2D models were proposed so that one of these models was developed in terms of and , and the second model was extended in terms of and . The implemented statistical studies show that the proposed relation in terms of and is more accurate compared to the other proposed model. Generally, both proposed models have a higher R-square and less RMSE than the existing relations developed in previous research.
By using the relationships obtained from this research and knowing the unconfined concrete peak strength, axial strain corresponding to the unconfined concrete peak strength, and the lateral confining pressure, it is possible to predict the peak strength, ultimate strength, axial strain corresponding to the peak strength and ultimate strain of SMA-confined concrete cylindrical specimens, easily and without the need for experimental investigations.
7. Recommendations for Future Research
In this research, equations for predicting the mechanical properties of SMA-confined cylindrical concrete specimens were presented using nonlinear regression analysis. In future research, other methods such as Multi-Expression Programming (MEP) method can be used to predict the mechanical properties of SMA-confined cylindrical concrete specimens, and its advantages and disadvantages can be compared with the relationships presented in this research.
Author Contributions
Conceptualization, M.T. and A.R.M.; methodology, S.E.; software, S.E. and A.R.M.; validation, S.E. and A.R.M.; formal analysis, S.E.; investigation, S.E.; resources, A.R.M.; data curation, S.E.; writing—original draft preparation, S.E. and A.R.M.; writing—review and editing, M.T. and A.R.M.; visualization, S.E.; supervision, M.T. and A.R.M.; project administration, M.T. All authors have read and agreed to the published version of the manuscript.
Funding
This research received no external funding.
Data Availability Statement
Some or all data, models, or codes that support the findings of this study are available from the corresponding authors upon reasonable request.
Acknowledgments
This study was conducted with the support of the faculty of engineering research grant number 56327 at Ferdowsi University of Mashhad. The authors would like to thank the department of civil engineering for providing valuable support.
Conflicts of Interest
The authors declare no conflict of interest.
References
- Peng, J.; Xiao, L.; Zhang, J.; Cai, C.; Wang, L. Flexural behavior of corroded HPS beams. Eng. Struct. 2019, 195, 274–287. [Google Scholar] [CrossRef]
- Xiao, L.; Peng, J.; Zhang, J.; Ma, Y.; Cai, C. Comparative assessment of mechanical properties of HPS between electrochemical corrosion and spray corrosion. Constr. Build. Mater. 2020, 237, 117735. [Google Scholar] [CrossRef]
- Li, N.; Wang, F.; Song, G. New entropy-based vibro-acoustic modulation method for metal fatigue crack detection: An exploratory study. Measurement 2020, 150, 107075. [Google Scholar] [CrossRef]
- Yin, X.; Song, G.; Liu, Y. Vibration suppression of wind/traffic/bridge coupled system using multiple pounding tuned mass dampers (MPTMD). Sensors 2019, 19, 1133. [Google Scholar] [CrossRef] [PubMed]
- Gholipour, G.; Zhang, C.; Mousavi, A.A. Effects of axial load on nonlinear response of RC columns subjected to lateral impact load: Ship-pier collision. Eng. Fail. Anal. 2018, 91, 397–418. [Google Scholar] [CrossRef]
- Huo, L.; Li, X.; Chen, D.; Li, H.; Song, G. Identification of the impact direction using the beat signals detected by piezoceramic sensors. Smart Mater. Struct. 2017, 26, 085020. [Google Scholar] [CrossRef]
- Qi, B.; Kong, Q.; Qian, H.; Patil, D.; Lim, I.; Li, M.; Liu, D.; Song, G. Study of impact damage in PVA-ECC beam under low-velocity impact loading using piezoceramic transducers and PVDF thin-film transducers. Sensors 2018, 18, 671. [Google Scholar] [CrossRef] [PubMed]
- Zhang, C.; Gholipour, G.; Mousavi, A.A. Nonlinear dynamic behavior of simply-supported RC beams subjected to combined impact-blast loading. Eng. Struct. 2019, 181, 124–142. [Google Scholar] [CrossRef]
- Gao, X.-J.; Duan, P.-H.; Qian, H. Dynamic response analysis of long-span continuous bridge considering the effect of train speeds and earthquakes. Int. J. Struct. Stab. Dyn. 2020, 20, 2040013. [Google Scholar] [CrossRef]
- Liu, C.; Yang, W.; Yan, Z.; Lu, Z.; Luo, N. Base pounding model and response analysis of base-isolated structures under earthquake excitation. Appl. Sci. 2017, 7, 1238. [Google Scholar] [CrossRef]
- Qian, H.; Li, H.; Song, G. Experimental investigations of building structure with a superelastic shape memory alloy friction damper subject to seismic loads. Smart Mater. Struct. 2016, 25, 125026. [Google Scholar] [CrossRef]
- Zhang, C. Control force characteristics of different control strategies for the wind-excited 76-story benchmark building structure. Adv. Struct. Eng. 2014, 17, 543–559. [Google Scholar] [CrossRef]
- Perera, R.; Torres, L.; Ruiz, A.; Barris, C.; Baena, M. An EMI-based clustering for structural health monitoring of NSM FRP strengthening systems. Sensors 2019, 19, 3775. [Google Scholar] [CrossRef] [PubMed]
- Ji, S.-W.; Yeon, Y.-M.; Hong, K.-N. Shear Performance of RC Beams Reinforced with Fe-Based Shape Memory Alloy Stirrups. Materials 2022, 15, 1703. [Google Scholar] [CrossRef]
- Hong, C.; Qian, H.; Song, G. Uniaxial compressive behavior of concrete columns confined with superelastic shape memory alloy wires. Materials 2020, 13, 1227. [Google Scholar] [CrossRef] [PubMed]
- Choi, E.; Chung, Y.-S.; Cho, B.-S.; Nam, T.-H. Confining concrete cylinders using shape memory alloy wires. Eur. Phys. J. Spec. Top. 2008, 158, 255–259. [Google Scholar] [CrossRef]
- Karabinis, A.I.; Rousakis, T. Concrete confined by FRP material: A plasticity approach. Eng. Struct. 2002, 24, 923–932. [Google Scholar] [CrossRef]
- Li, J.; Zu, L.; Zhong, G.; He, M.; Yin, H.; Tan, Y. Stiffness characteristics of soft finger with embedded SMA fibers. Compos. Struct. 2017, 160, 758–764. [Google Scholar] [CrossRef]
- Abdelrahman, K.; El-Hacha, R. Analytical prediction model for circular SMA-confined reinforced concrete columns. Eng. Struct. 2020, 213, 110547. [Google Scholar] [CrossRef]
- Choi, E.; Nam, T.-H.; Cho, S.-C.; Chung, Y.-S.; Park, T. The behavior of concrete cylinders confined by shape memory alloy wires. Smart Mater. Struct. 2008, 17, 065032. [Google Scholar] [CrossRef]
- Chen, Q.; Andrawes, B. Cyclic stress–strain behavior of concrete confined with NiTiNb-shape memory alloy spirals. J. Struct. Eng. 2017, 143, 04017008. [Google Scholar] [CrossRef]
- Dundar, C.; Erturkmen, D.; Tokgoz, S. Studies on carbon fiber polymer confined slender plain and steel fiber reinforced concrete columns. Eng. Struct. 2015, 102, 31–39. [Google Scholar] [CrossRef]
- Ilki, A.; Peker, O.; Karamuk, E.; Demir, C.; Kumbasar, N. FRP retrofit of low and medium strength circular and rectangular reinforced concrete columns. J. Mater. Civ. Eng. 2008, 20, 169–188. [Google Scholar] [CrossRef]
- Wu, Y.-F.; Zhou, Y.-W. Unified strength model based on Hoek-Brown failure criterion for circular and square concrete columns confined by FRP. J. Compos. Constr. 2010, 14, 175–184. [Google Scholar] [CrossRef]
- Richart, F.E.; Brandtzæg, A.; Brown, R.L. A Study of the Failure of Concrete under Combined Compressive Stresses; University of Illinois at Urbana Champaign, College of Engineering: Champaign, IL, USA, 1928. [Google Scholar]
- Chen, Q. Experimental Testing and Constitutive Modeling of Concrete Confined with Shape Memory Alloys; University of Illinois at Urbana-Champaign: Champaign, IL, USA, 2015. [Google Scholar]
- Abdelrahman, K.; El-Hacha, R. Preliminary experimental investigation of reinforced concrete columns confined with NiTi SMA wires. In Concrete Repair, Rehabilitation and Retrofitting IV; CRC Press: Boca Raton, FL, USA, 2015; p. 119. [Google Scholar]
- Andrawes, B.; Shin, M. (Eds.) Seismic retrofitting of bridge columns using shape memory alloys. In Active and Passive Smart Structures and Integrated Systems 2008; SPIE: Washington, DC, USA, 2008. [Google Scholar]
- Andrawes, B.; Shin, M. (Eds.) Seismic retrofit of bridge columns using innovative wrapping technique. In Structures Congress 2008: Crossing Borders; ASCE: Reston, VI, USA, 2008. [Google Scholar]
- Andrawes, B.; Shin, M. Experimental investigation of concrete columns wrapped with shape memory alloy spirals. In Improving the Seismic Performance of Existing Buildings and Other Structures 2010; ASCE: Reston, VI, USA, 2010; pp. 835–840. [Google Scholar]
- Andrawes, B.; Shin, M.; Wierschem, N. Active confinement of reinforced concrete bridge columns using shape memory alloys. J. Bridge Eng. 2010, 15, 81–89. [Google Scholar] [CrossRef]
- Chen, Q.; Andrawes, B. (Eds.) Monotonic and cyclic experimental testing of concrete confined with shape memory alloy spirals. In Proceedings of the 10th US National Conference on Earthquake Engineering, Anchorage, Alaska, USA, 21–25 July 2014. [Google Scholar]
- Chen, Q.; Andrawes, B. (Eds.) Experimental testing and constitutive modeling of shape memory alloy confined concrete. In Proceedings of the Third Conference on Smart Monitoring, Assessment and Rehabilitation of Civil Structures, Antalya, Turkey, 7–9 September 2015. [Google Scholar]
- Choi, E.; Chung, Y.-S.; Choi, J.-H.; Kim, H.-T.; Lee, H. The confining effectiveness of NiTiNb and NiTi SMA wire jackets for concrete. Smart Mater. Struct. 2010, 19, 035024. [Google Scholar] [CrossRef]
- Cho, E.; Kim, Y.-W.; Chung, Y.-S.; Kim, H.-T.; Cho, B.-S. (Eds.) Cyclic behavior of concrete confined by active and passive jackets. In Smart Materials, Adaptive Structures and Intelligent Systems; ASME: New York, NY, USA, 2010. [Google Scholar]
- Deogekar, P.S.; Andrawes, B. Hybrid confinement of high strength concrete using shape memory alloys and fiber-reinforced polymers. J. Struct. Integr. Maint. 2018, 3, 22–32. [Google Scholar] [CrossRef]
- El-Hacha, R.; Abdelrahman, K. Confining RC columns subjected to concentric axial loading using Shape Memory Alloy wires. In Proceedings of the SMAR 2015 the 3rd Conference on Smart Monitoring, Assessment and Rehabilitation of Civil Structures, Antalya, Turkey, 7–9 September 2015; 8. [Google Scholar]
- El-Hacha, R.; Abdelrahman, K. Behaviour of circular SMA-confined reinforced concrete columns subjected to eccentric loading. Eng. Struct. 2020, 215, 110443. [Google Scholar] [CrossRef]
- Gholampour, A.; Ozbakkaloglu, T. (Eds.) Confinement of normal-and high-strength concrete by Shape Memory Alloy (SMA) Spirals. In IOP Conference Series: Materials Science and Engineering; IOP Publishing: Bristol, UK, 2018. [Google Scholar]
- Gholampour, A.; Ozbakkaloglu, T. Understanding the compressive behavior of shape memory alloy (SMA)-confined normal-and high-strength concrete. Compos. Struct. 2018, 202, 943–953. [Google Scholar] [CrossRef]
- Jung, D.; Deogekar, P.; Andrawes, B. Seismic performance of bridges with high strength concrete columns reinforced with SMA-FRP jackets. Smart Mater. Struct. 2019, 28, 035008. [Google Scholar] [CrossRef]
- Jung, D.; Wilcoski, J.; Andrawes, B. Bidirectional shake table testing of RC columns retrofitted and repaired with shape memory alloy spirals. Eng. Struct. 2018, 160, 171–185. [Google Scholar] [CrossRef]
- Mirzaee, Z.; Moavalli, M.; Shekarchi, M. Experimental investigation of compressive concrete elements confined with shape memory Ni-Ti wires. In Proceedings of the Fracture Mechanics of Concrete Elements and Concrete Structures–Assessment, Durability, Monitoring and Retrofitting of Concrete Structures Korea Concrete Institute, Seoul, Republic of Korea, 1–5 June 2010; pp. 23–28. [Google Scholar]
- Pan, S.; Yue, R.; Hui, H.; Fan, S. Lateral cyclic behavior of bridge columns confined with pre-stressed shape memory alloy wires. J. Asian Archit. Build. Eng. 2022, 21, 66–79. [Google Scholar] [CrossRef]
- Shin, M.; Andrawes, B. (Eds.) Application of shape memory alloys in the seismic retrofitting of bridge columns. In Proceedings of the the 14th World Conference on Earthquake Engineering, Beijing, China, 12–17 October 2008. [Google Scholar]
- Shin, M.; Andrawes, B. (Eds.) Uniaxial compression behavior of actively confined concrete using shape memory alloys. In Structures Congress 2009: Don’t Mess with Structural Engineers: Expanding Our Role; ASCE: Reston, VI, USA, 2009. [Google Scholar]
- Shin, M.; Andrawes, B. Experimental investigation of actively confined concrete using shape memory alloys. Eng. Struct. 2010, 32, 656–664. [Google Scholar] [CrossRef]
- Shin, M.; Andrawes, B. (Eds.) Cyclic behavior of concrete bridge columns retrofitted with innovative spirals. In Proceedings of the Structures Congress 2010, Orlando, FL, USA, 12–15 May 2010. [Google Scholar]
- Shin, M.; Andrawes, B. Lateral cyclic behavior of reinforced concrete columns retrofitted with shape memory spirals and FRP wraps. J. Struct. Eng. 2011, 137, 1282–1290. [Google Scholar] [CrossRef]
- Shin, M.; Andrawes, B. Emergency repair of severely damaged reinforced concrete columns using active confinement with shape memory alloys. Smart Mater. Struct. 2011, 20, 065018. [Google Scholar] [CrossRef]
- Shin, M.; Andrawes, B. Parametric study of RC bridge columns actively confined with shape memory alloy spirals under lateral cyclic loading. J. Bridge Eng. 2014, 19, 04014040. [Google Scholar] [CrossRef]
- Tran, H.; Balandraud, X.; Destrebecq, J. Improvement of the mechanical performances of concrete cylinders confined actively or passively by means of SMA wires. Arch. Civ. Mech. Eng. 2015, 15, 292–299. [Google Scholar] [CrossRef]
- Zuboski, G.R. Stress-Strain Behavior for Actively Confined Concrete Using Shape Memory Alloy Wires; The Ohio State University: Columbus, OH, USA, 2013. [Google Scholar]
- Tahmasebi, M. Evaluating Different Methods in Order to Retrofit Concrete Bridge Piers under Earthquake Force by Using SHAPE Memory Alloy; Ferdowsi University of Mashhad: Mashhad, Iran, 2021. (In Persian) [Google Scholar]
- Dębska, A.; Gwoździewicz, P.; Seruga, A.; Balandraud, X.; Destrebecq, J.-F. The application of Ni–Ti SMA wires in the external prestressing of concrete hollow cylinders. Materials 2021, 14, 1354. [Google Scholar] [CrossRef] [PubMed]
- Chen, Q.; Andrawes, B. Finite element analysis of actively confined concrete using shape memory alloys. J. Adv. Concr. Technol. 2014, 12, 520–534. [Google Scholar] [CrossRef]
- Chen, Q.; Andrawes, B. Experimentally validated modeling of concrete actively confined using SMA reinforcement. In Proceedings of the NCEE 2014, Anchorage, AK, USA, 21–25 July 2014. [Google Scholar]
- Chen, Q.; Andrawes, B. (Eds.) Plasticity modeling of concrete confined with NiTiNb shape memory alloy spirals. In Structures; Elsevier: Amsterdam, The Netherlands, 2017. [Google Scholar]
- Zafar, A.; Andrawes, B. Fabrication and cyclic behavior of highly ductile superelastic shape memory composites. J. Mater. Civ. Eng. 2014, 26, 622–632. [Google Scholar] [CrossRef]
- Billah, A.M.; Rahman, J.; Zhang, Q. (Eds.) Shape memory alloys (SMAs) for resilient bridges: A state-of-the-art review. In Structures; Elsevier: Amsterdam, The Netherlands, 2022. [Google Scholar]
- Zareie, S.; Issa, A.S.; Seethaler, R.J.; Zabihollah, A. (Eds.) Recent advances in the applications of shape memory alloys in civil infrastructures: A review. In Structures; Elsevier: Amsterdam, The Netherlands, 2020. [Google Scholar]
- Mander, J.B.; Priestley, M.J.; Park, R. Theoretical stress-strain model for confined concrete. J. Struct. Eng. 1988, 114, 1804–1826. [Google Scholar] [CrossRef]
- Mostoufi, N.; Constantinides, A. Linear and nonlinear regression analysis. In Applied Numerical Methods for Chemical Engineers: Katey Birtcher; Merken, S., Ed.; Academic Press: Cambridge, MA, USA, 2023; pp. 403–476. [Google Scholar]
- Huang, H.-H.; He, Q. Nonlinear regression analysis. International Encyclopedia of Education, 4th ed.; Elsevier: Amsterdam, The Netherlands, 2023; pp. 558–567. [Google Scholar]
- Singh, S.; Patra, N.R. Peak strength expression for concrete confined with fiber-reinforced polymer. ASCE-ASME J. Risk Uncertain. Eng. Syst. Part A Civ. Eng. 2018, 4, 04018024. [Google Scholar] [CrossRef]
- Ilyas, I.; Zafar, A.; Javed, M.F.; Farooq, F.; Aslam, F.; Musarat, M.A.; Vatin, N.I. Forecasting Strength of CFRP Confined Concrete Using Multi Expression Programming. Materials 2021, 14, 7134. [Google Scholar] [CrossRef] [PubMed]
- Arabshahi, A.; Gharaei-Moghaddam, N.; Tavakkolizadeh, M. (Eds.) Development of applicable design models for concrete columns confined with aramid fiber reinforced polymer using Multi-Expression Programming. In Structures; Elsevier: Amsterdam, The Netherlands, 2020. [Google Scholar]
- Bidkar, K.; Jadhao, P. Prediction of strength of remixed concrete by application of orthogonal decomposition, neural analysis and regression analysis. Open Eng. 2019, 9, 434–443. [Google Scholar] [CrossRef]
- Ozbakkaloglu, T.; Lim, J.C. Axial compressive behavior of FRP-confined concrete: Experimental test database and a new design-oriented model. Compos. Part B Eng. 2013, 55, 607–634. [Google Scholar] [CrossRef]
- Nguyen, T.; Kashani, A.; Ngo, T.; Bordas, S. Deep neural network with high-order neuron for the prediction of foamed concrete strength. Comput. Aided Civ. Infrastruct. Eng. 2019, 34, 316–332. [Google Scholar] [CrossRef]
- Gandomi, A.H.; Alavi, A.H.; Mirzahosseini, M.R.; Nejad, F.M. Nonlinear genetic-based models for prediction of flow number of asphalt mixtures. J. Mater. Civ. Eng. 2011, 23, 248–263. [Google Scholar] [CrossRef]
- Balmer, G.G. Shearing Strength of Concrete under High Triaxial Stress-Computation of Mohr’s Envelope as a Curve; Structural Research Laboratory Report, No. SP-23; United States Department of the Interior, Bureau of Reclamation: Washington, DC, USA, 1949. [Google Scholar]
- Attard, M.; Setunge, S. Stress-strain relationship of confined and unconfined concrete. Mater. J. 1996, 93, 432–442. [Google Scholar]
- Candappa, D.; Sanjayan, J.; Setunge, S. Complete triaxial stress-strain curves of high-strength concrete. J. Mater. Civ. Eng. 2001, 13, 209–215. [Google Scholar] [CrossRef]
- Lu, X.; Hsu, C.-T.T. Behavior of high strength concrete with and without steel fiber reinforcement in triaxial compression. Cem. Concr. Res. 2006, 36, 1679–1685. [Google Scholar] [CrossRef]
- Jiang, T.; Teng, J. Analysis-oriented stress–strain models for FRP–confined concrete. Eng. Struct. 2007, 29, 2968–2986. [Google Scholar] [CrossRef]
- Moghaddam, H.; Samadi, M.; Pilakoutas, K. Compressive behavior of concrete actively confined by metal strips, part B: Analysis. Mater. Struct. 2010, 43, 1383–1396. [Google Scholar] [CrossRef]
- Xiao, Q.; Teng, J.; Yu, T. Behavior and modeling of confined high-strength concrete. J. Compos. Constr. 2010, 14, 249–259. [Google Scholar] [CrossRef]
- Gandomi, A.H.; Roke, D.A. Assessment of artificial neural network and genetic programming as predictive tools. Adv. Eng. Softw. 2015, 88, 63–72. [Google Scholar] [CrossRef]
- Sharifi, Y.; Hosseinpour, M. Adaptive neuro-fuzzy inference system and stepwise regression for compressive strength assessment of concrete containing metakaolin. Iran Univ. Sci. Technol. 2019, 9, 251–272. [Google Scholar]
- Despotovic, M.; Nedic, V.; Despotovic, D.; Cvetanovic, S. Evaluation of empirical models for predicting monthly mean horizontal diffuse solar radiation. Renew. Sustain. Energy Rev. 2016, 56, 246–260. [Google Scholar] [CrossRef]
Figure 1.
Schematic of a concrete column confined with SMA spirals (active confinement).
Figure 1.
Schematic of a concrete column confined with SMA spirals (active confinement).
Figure 2.
Schematic of confinement, (a) confinement forces (b) effective confinement of SMA-confined reinforced concrete columns.
Figure 2.
Schematic of confinement, (a) confinement forces (b) effective confinement of SMA-confined reinforced concrete columns.
Figure 3.
Schematic drawing of the axial stress-strain response of SMA-confined concrete.
Figure 3.
Schematic drawing of the axial stress-strain response of SMA-confined concrete.
Figure 4.
Mathematical modeling and regression analysis 4 Developed models for SMA-active confined concrete cylindrical specimens.
Figure 4.
Mathematical modeling and regression analysis 4 Developed models for SMA-active confined concrete cylindrical specimens.
Figure 5.
Regression analysis results of Equations (2) and (3).
Figure 5.
Regression analysis results of Equations (2) and (3).
Figure 6.
Comparison of values obtained from the proposed model and experimental data.
Figure 6.
Comparison of values obtained from the proposed model and experimental data.
Figure 7.
Regression analysis diagrams of the three-dimensional equations for predicting the peak compressive strength of the SMA-confined concrete cylindrical specimens and comparing them with the experimental data.
Figure 7.
Regression analysis diagrams of the three-dimensional equations for predicting the peak compressive strength of the SMA-confined concrete cylindrical specimens and comparing them with the experimental data.
Figure 8.
Comparison of fcc values obtained from the proposed model and experimental data.
Figure 8.
Comparison of fcc values obtained from the proposed model and experimental data.
Figure 9.
Regression analysis results of Equations (12) and (13).
Figure 9.
Regression analysis results of Equations (12) and (13).
Figure 10.
Comparison of values obtained from the proposed model (Equation (15e)) and experimental data.
Figure 10.
Comparison of values obtained from the proposed model (Equation (15e)) and experimental data.
Figure 11.
Comparison of values obtained from the proposed model (Equation (16e)) and experimental data.
Figure 11.
Comparison of values obtained from the proposed model (Equation (16e)) and experimental data.
Figure 12.
Comparison of values obtained from the proposed model and experimental data.
Figure 12.
Comparison of values obtained from the proposed model and experimental data.
Figure 13.
Regression analysis diagrams of the three-dimensional equations for predicting the ultimate compressive strength of the SMA-confined concrete cylindrical specimens and comparing them with the experimental data.
Figure 13.
Regression analysis diagrams of the three-dimensional equations for predicting the ultimate compressive strength of the SMA-confined concrete cylindrical specimens and comparing them with the experimental data.
Figure 14.
Comparison of fult values obtained from the proposed model and experimental data.
Figure 14.
Comparison of fult values obtained from the proposed model and experimental data.
Figure 15.
Comparison of values obtained from the proposed model (Equation (19c)) and experimental data.
Figure 15.
Comparison of values obtained from the proposed model (Equation (19c)) and experimental data.
Figure 16.
Comparison of values obtained from the proposed model (Equation (20e)) and experimental data.
Figure 16.
Comparison of values obtained from the proposed model (Equation (20e)) and experimental data.
Figure 17.
The diagrams of each indicator for the peak compressive strength models are presented by different researchers and the proposed models [
25,
26,
68,
69,
70,
71,
72,
73,
74].
Figure 17.
The diagrams of each indicator for the peak compressive strength models are presented by different researchers and the proposed models [
25,
26,
68,
69,
70,
71,
72,
73,
74].
Figure 18.
The diagrams of each indicator for the axial strain correspond to the peak compressive strength models presented by different researchers and the proposed models [
25,
26,
69,
70,
71,
72,
73,
74].
Figure 18.
The diagrams of each indicator for the axial strain correspond to the peak compressive strength models presented by different researchers and the proposed models [
25,
26,
69,
70,
71,
72,
73,
74].
Figure 19.
The change diagrams of each indicator for the ultimate strength model presented by Chen and Andrawes [
26] and the proposed models.
Figure 19.
The change diagrams of each indicator for the ultimate strength model presented by Chen and Andrawes [
26] and the proposed models.
Figure 20.
The change diagrams of each indicator for the ultimate strain model are presented by Chen and Andrawes [
26] and also for the proposed models.
Figure 20.
The change diagrams of each indicator for the ultimate strain model are presented by Chen and Andrawes [
26] and also for the proposed models.
Table 1.
Experimental database of cylindrical specimens confined with SMA spirals.
Table 1.
Experimental database of cylindrical specimens confined with SMA spirals.
| Number | Reference | D (mm) | H
(mm) | Loading | εco | fco
(MPa) | dSMA (mm) | fSMA (MPa) | Pitch (mm) | Substance | fl
(MPa) | fcc (MPa) | εcc | fult (MPa) | εult |
|---|
| 1 | [16] | 150 | 300 | M | 0.0031 | 25.97 | 1 | 67.05 | 2 | NiTi | 0.3509 | 27.72 | 0.0052 | 23.64 | 0.0118 |
| 2 | [16] | 150 | 300 | M | 0.0031 | 25.97 | 1 | 67.05 | 2 | NiTi | 0.3509 | 27.41 | 0.0053 | 23.64 | 0.0122 |
| 3 | [16] | 150 | 300 | M | 0.0031 | 25.97 | 1 | 67.05 | 4 | NiTi | 0.1754 | 26.2 | 0.0042 | 23.47 | 0.0087 |
| 4 | [16] | 150 | 300 | M | 0.0031 | 25.97 | 1 | 67.05 | 4 | NiTi | 0.1754 | 27.12 | 0.0039 | 22.34 | 0.0089 |
| 5 | [26] | 152 | 305 | C | 0.0021 | 36.1 | 1.9 | 607 | 7.6 | NiTiNb | 2.9781 | 51 | 0.0051 | 34 | 0.0939 |
| 6 | [26] | 152 | 305 | C | 0.0023 | 55.4 | 1.9 | 607 | 7.6 | NiTiNb | 2.9781 | 81.6 | 0.0044 | 38 | 0.0719 |
| 7 | [46] | 150 | 300 | M | 0.0015 | 39 | 2 | 460 | 12.5 | NiTiNb | 1.5406 | 47.29 | 0.002 | 26.29 | 0.0381 |
| 8 | [47] | 152 | 305 | M | 0.0016 | 39.2 | 2 | 460 | 13 | NiTiNb | 1.4619 | 47.3 | 0.0035 | 25.98 | 0.0382 |
| 9 | [31] | 152 | 305 | M | 0.0018 | 35 | 3 | 865 | 25.41 | NiTi | 3.1645 | 42.58 | 0.0031 | 27.08 | 0.0168 |
| 10 | [35] | 150 | 300 | C | 0.0033 | 36.4 | 1 | 147.1 | 1 | NiTiNb | 1.5396 | 41.64 | 0.0058 | 34.88 | 0.046 |
| 11 | [35] | 150 | 300 | C | 0.0033 | 36.4 | 1 | 147.1 | 2 | NiTiNb | 0.7698 | 37.44 | 0.0055 | 22.9 | 0.04 |
| 12 | [35] | 150 | 300 | M | 0.0033 | 36.4 | 1 | 147.1 | 1 | NiTiNb | 1.5396 | 42.87 | 0.0045 | 46.27 | 0.05 |
| 13 | [35] | 150 | 300 | M | 0.0033 | 36.4 | 1 | 147.1 | 2 | NiTiNb | 0.7698 | 38.08 | 0.004 | 28.18 | 0.055 |
| 14 | [34] | 150 | 300 | M | 0.00209 | 30.16 | 1 | 223 | 1 | NiTi | 2.3340 | 40.63 | 0.00251 | 30.73 | 0.01928 |
| 15 | [34] | 150 | 300 | M | 0.00209 | 30.16 | 1 | 304 | 1 | NiTiNb | 3.1818 | 45.38 | 0.00663 | 38.08 | 0.0254 |
| 16 | [52] | 74.4 | 180 | M | 0.00121 | 26.52 | 1 | 186.703 | 2 | NiTi | 1.9699 | 45.05 | 0.00215 | 37.62 | 0.00412 |
| 17 | [53] | 100 | 200 | M | 0.004 | 21.15 | 0.5 | 800 | 8.33 | NiTi | 0.3769 | 25.5 | 0.0062 | 15.86 | 0.0217 |
| 18 | [53] | 100 | 200 | M | 0.004 | 21.15 | 0.5 | 800 | 5 | NiTi | 0.628 | 28.9 | 0.0062 | 16.72 | 0.0322 |
| 19 | [53] | 100 | 200 | M | 0.0056 | 31.46 | 0.5 | 800 | 5 | NiTi | 0.628 | 33.34 | 0.0056 | 16.02 | 0.0242 |
| 20 | [53] | 100 | 200 | M | 0.0056 | 25.46 | 0.5 | 800 | 8.33 | NiTi | 0.3769 | 28.33 | 0.0048 | 14.27 | 0.0257 |
| 21 | [53] | 100 | 200 | M | 0.0056 | 25.46 | 0.5 | 800 | 5 | NiTi | 0.628 | 33.74 | 0.0053 | 16.66 | 0.0235 |
| 22 | [32] | 152 | 305 | C | 0.0022 | 39.6 | 1.9 | 607 | 25.4 | NiTiNb | 0.8911 | 45.09 | 0.0027 | 14.41 | 0.0533 |
| 23 | [32] | 152 | 305 | C | 0.0022 | 39.6 | 1.9 | 607 | 19.05 | NiTiNb | 1.1881 | 45.99 | 0.0034 | 19.03 | 0.0523 |
| 24 | [32] | 152 | 305 | C | 0.0022 | 39.6 | 1.9 | 607 | 12.7 | NiTiNb | 1.7822 | 49.3 | 0.0038 | 23.99 | 0.0765 |
| 25 | [32] | 152 | 305 | C | 0.0022 | 39.6 | 1.9 | 607 | 6.35 | NiTiNb | 3.5643 | 59.78 | 0.007 | 48.88 | 0.1198 |
| 26 | [32] | 152 | 305 | M | 0.0022 | 39.6 | 1.9 | 607 | 19.05 | NiTiNb | 1.1881 | 47.4 | 0.0028 | 18.44 | 0.059 |
| 27 | [32] | 152 | 305 | M | 0.0022 | 39.6 | 1.9 | 607 | 12.7 | NiTiNb | 1.7822 | 50.71 | 0.0038 | 26.41 | 0.074 |
| 28 | [33] | 152 | 305 | C | 0.0016 | 30.5 | 1.9 | 607 | 15.9 | NiTiNb | 1.4235 | 44.9 | 0.0027 | 16.9 | 0.0663 |
| 29 | [33] | 152 | 305 | C | 0.0016 | 30.5 | 1.9 | 607 | 10.2 | NiTiNb | 2.2190 | 40.4 | 0.0035 | 30.9 | 0.1005 |
| 30 | [33] | 152 | 305 | C | 0.0016 | 30.5 | 1.9 | 607 | 5.1 | NiTiNb | 4.4379 | 56.9 | 0.0057 | 46 | 0.053 |
| 31 | [33] | 152 | 305 | C | 0.0022 | 50 | 1.9 | 607 | 19.1 | NiTiNb | 1.1850 | 58.1 | 0.0031 | 18.9 | 0.0585 |
| 32 | [33] | 152 | 305 | C | 0.0022 | 50 | 1.9 | 607 | 12.7 | NiTiNb | 1.7822 | 64.2 | 0.0037 | 27.7 | 0.0958 |
| 33 | [33] | 152 | 305 | C | 0.0022 | 50 | 1.9 | 607 | 6.4 | NiTiNb | 3.5365 | 80.6 | 0.0056 | 44.8 | 0.0641 |
| 34 | [27] | 100 | 200 | M | 0.0021 | 39.67 | 1.9 | 485 | 10 | NiTi | 2.7488 | 52.75 | 0.0085 | 38.81 | 0.05858 |
| 35 | [39] | 100 | 200 | M | 0.0024 | 24.9 | 3.5 | 279 | 36 | NiTi | 1.4905 | 31 | 0.0088 | 10.2 | 0.0983 |
| 36 | [39] | 100 | 200 | M | 0.0028 | 63.5 | 3.5 | 279 | 20 | NiTi | 2.6829 | 69.4 | 0.0074 | 44.58 | 0.0735 |
| 37 | [39] | 100 | 200 | M | 0.0024 | 24.9 | 3.5 | 558 | 36 | NiTi | 2.9810 | 34.4 | 0.0104 | 11.86 | 0.0958 |
| 38 | [39] | 100 | 200 | M | 0.0028 | 63.5 | 3.5 | 558 | 20 | NiTi | 5.3658 | 78.5 | 0.0125 | 44.82 | 0.0478 |
| 39 | [56] | 152 | 305 | M | 0.0016 | 39.2 | 2 | 447 | 26 | NiTiNb | 0.7103 | 43.1 | 0.0029 | 13 | 0.0374 |
| 40 | [56] | 152 | 305 | M | 0.0016 | 39.2 | 2 | 447 | 39 | NiTiNb | 0.4735 | 41.5 | 0.0023 | 10.2 | 0.0377 |
| 41 | [56,57] | 152 | 305 | M | 0.0021 | 56.8 | 2 | 600 | 25.4 | NiTiNb | 0.9760 | 60.1 | 0.00257 | 16.7 | 0.0574 |
| 42 | [56,57] | 152 | 305 | M | 0.0016 | 39.2 | 2 | 447 | 13 | NiTiNb | 1.4206 | 47.49 | 0.0022 | 26.36 | 0.04 |
Table 2.
Descriptive statistics of the variables used in the model development based on 42 data.
Table 2.
Descriptive statistics of the variables used in the model development based on 42 data.
| | εc0 | f’co (MPa) | fl (MPa) | f’cc (MPa) | εcc | f’cu (MPa) | εcu |
|---|
| Mean | 0.0026 | 36.5636 | 1.7083 | 45.7317 | 0.0048 | 26.5600 | 0.0497 |
| Median | 0.0022 | 36.4000 | 1.4762 | 44.9750 | 0.0043 | 24.9850 | 0.0489 |
| Mode | 0.0022 | 39.6000 | 1.7822 | #N/A | 0.0053 | 23.6400 | 0.0400 |
| S. Variance | 0.0000 | 112.6950 | 1.5027 | 208.6242 | 0.0000 | 123.1089 | 0.0008 |
| Skewness | 1.5166 | 0.8838 | 0.9729 | 0.8412 | 1.3771 | 0.4801 | 0.4744 |
| Standard error | 0.00017 | 1.6381 | 0.1892 | 2.2287 | 0.00035 | 1.7120 | 0.0044 |
| Standard deviation | 0.0011 | 10.6158 | 1.2259 | 14.4438 | 0.0023 | 11.0954 | 0.0288 |
| Kurtosis | 2.1913 | 0.5337 | 0.6549 | 0.5186 | 2.3414 | −0.8242 | −0.3766 |
| Maximum | 0.0056 | 63.5000 | 5.3659 | 81.6000 | 0.0125 | 48.8800 | 0.1198 |
| Minimum | 0.0012 | 21.1500 | 0.1754 | 25.5000 | 0.0020 | 10.2000 | 0.0041 |
| Range | 0.0044 | 42.3500 | 5.1904 | 56.1000 | 0.0105 | 38.6800 | 0.1157 |
Table 3.
Regression analysis results of Equations (2) and (3).
Table 3.
Regression analysis results of Equations (2) and (3).
| Relation | RMSE | R2 | R | RMSE |
|---|
| 0.1200 | 0.6119 | 0.7822 | 0.1200 |
| 0.1186 | 0.6301 | 0.7938 | 0.1186 |
Table 4.
Regression analysis results of two-dimensional equations for predicting the peak compressive strength of the SMA-confined concrete cylindrical specimens.
Table 4.
Regression analysis results of two-dimensional equations for predicting the peak compressive strength of the SMA-confined concrete cylindrical specimens.
| Type | R | R2 | RMSE |
|---|
| Type 1 | 0.8371 | 0.7008 | 0.1095 |
| Type 2 | 0.8736 | 0.7631 | 0.1030 |
| Type 3 | 0.8877 | 0.7881 | 0.1004 |
| Type 4 | 0.8550 | 0.7310 | 0.1131 |
| Type 5 | 0.9005 | 0.8110 | 0.1032 |
Table 5.
Regression analysis results of three-dimensional equations for predicting the peak compressive strength of the SMA-confined concrete cylindrical specimens.
Table 5.
Regression analysis results of three-dimensional equations for predicting the peak compressive strength of the SMA-confined concrete cylindrical specimens.
| Type | R | R2 | RMSE |
|---|
| Type 1 | 0.9498 | 0.9022 | 4.631 |
| Type 2 | 0.9536 | 0.9093 | 4.579 |
| Type 3 | 0.9539 | 0.9099 | 4.6275 |
| Type 4 | 0.9631 | 0.9276 | 4.0916 |
| Type 5 | 0.9708 | 0.9424 | 3.6502 |
Table 6.
Regression analysis results of Equations (12) and (13).
Table 6.
Regression analysis results of Equations (12) and (13).
| Relation | R | R2 | RMSE |
|---|
| 0.7409 | 0.5490 | 0.6237 |
| 0.7411 | 0.5493 | 0.6312 |
Table 7.
Regression analysis results of equations for predicting the axial strain corresponding to the maximum compressive strength of the SMA-confined concrete cylindrical specimens.
Table 7.
Regression analysis results of equations for predicting the axial strain corresponding to the maximum compressive strength of the SMA-confined concrete cylindrical specimens.
| Type | R | R2 | RMSE |
|---|
| Type 1 | 0.8594 | 0.7386 | 0.5215 |
| Type 2 | 0.8917 | 0.7952 | 0.4757 |
| Type 3 | 0.8383 | 0.7028 | 0.5919 |
| Type 4 | 0.8879 | 0.7883 | 0.5266 |
| Type 5 | 0.9153 | 0.8378 | 0.4888 |
Table 8.
Regression analysis results of equations for predicting the axial strain corresponding to the peak compressive strength of the SMA-confined concrete cylindrical specimens.
Table 8.
Regression analysis results of equations for predicting the axial strain corresponding to the peak compressive strength of the SMA-confined concrete cylindrical specimens.
| Type | R | R2 | RMSE |
|---|
| Type 1 | 0.6839 | 0.4677 | 0.7039 |
| Type 2 | 0.7443 | 0.5540 | 0.6812 |
| Type 3 | 0.7084 | 0.5019 | 0.7419 |
| Type 4 | 0.7389 | 0.5456 | 0.7319 |
| Type 5 | 0.9099 | 0.8280 | 0.5382 |
Table 9.
Regression analysis results of two-dimensional equations for predicting the ultimate compressive strength of the SMA-confined concrete cylindrical specimens.
Table 9.
Regression analysis results of two-dimensional equations for predicting the ultimate compressive strength of the SMA-confined concrete cylindrical specimens.
| Type | R | R2 | RMSE |
|---|
| Type 1 | 0.7474 | 0.5586 | 0.2186 |
| Type 2 | 0.7699 | 0.5927 | 0.2131 |
| Type 3 | 0.7797 | 0.6079 | 0.2124 |
| Type 4 | 0.7344 | 0.5394 | 0.2302 |
| Type 5 | 0.7270 | 0.5285 | 0.2875 |
Table 10.
Regression analysis results of three-dimensional equations for predicting the ultimate compressive strength of the SMA-confined concrete cylindrical specimens.
Table 10.
Regression analysis results of three-dimensional equations for predicting the ultimate compressive strength of the SMA-confined concrete cylindrical specimens.
| Type | R | R2 | RMSE |
|---|
| Type 1 | 0.7311 | 0.5345 | 7.7616 |
| Type 2 | 0.7329 | 0.5371 | 7.9467 |
| Type 3 | 0.8465 | 0.7166 | 6.5843 |
| Type 4 | 0.7497 | 0.5621 | 7.7289 |
| Type 5 | 0.7540 | 0.5685 | 7.6724 |
Table 11.
Regression analysis results of equations for predicting the ultimate axial strain of the SMA-confined concrete cylindrical specimens.
Table 11.
Regression analysis results of equations for predicting the ultimate axial strain of the SMA-confined concrete cylindrical specimens.
| Type | R | R2 | RMSE |
|---|
| Type 1 | 0.7359 | 0.5415 | 11.1938 |
| Type 2 | 0.7824 | 0.6121 | 10.4511 |
| Type 3 | 0.8007 | 0.6411 | 10.2092 |
| Type 4 | 0.7270 | 0.5285 | 12.7382 |
| Type 5 | 0.7889 | 0.6224 | 12.0911 |
Table 12.
Regression analysis results of equations for predicting the ultimate axial strain of the concrete cylinders confined with SMA spirals.
Table 12.
Regression analysis results of equations for predicting the ultimate axial strain of the concrete cylinders confined with SMA spirals.
| Type | R | R2 | RMSE |
|---|
| Type 1 | 0.7901 | 0.6243 | 10.1333 |
| Type 2 | 0.8756 | 0.7666 | 8.2318 |
| Type 3 | 0.8837 | 0.7810 | 8.2355 |
| Type 4 | 0.8844 | 0.7822 | 9.1832 |
| Type 5 | 0.9547 | 0.9115 | 6.7588 |
Table 13.
Statistical indicators of the peak compressive strength models of actively confined concrete.
Table 13.
Statistical indicators of the peak compressive strength models of actively confined concrete.
| Reference | Peak Compressive Strength Models of Actively Confined Concrete | R2 | Mean | RMSE | MAE | RMAE | AAE | RSE | PI |
|---|
| [25] | | 0.6247 | 0.9573 | 0.1341 | 0.0940 | 0.0749 | 0.0685 | 0.4965 | 0.0597 |
| [72] | | 0.6247 | 1.0097 | 0.1206 | 0.0850 | 0.0678 | 0.0647 | 0.4017 | 0.0537 |
| [73] |
| 0.0034 | 1.0361 | 0.2521 | 0.1999 | 0.1594 | 0.1550 | 1.7548 | 0.1899 |
| [74] | | 0.6247 | 0.9992 | 0.1187 | 0.0832 | 0.0663 | 0.0627 | 0.3889 | 0.0528 |
| [75] | | 0.6247 | 0.9538 | 0.1368 | 0.0964 | 0.0769 | 0.0701 | 0.5169 | 0.0609 |
| [76] | | 0.6247 | 0.9362 | 0.1530 | 0.1086 | 0.0866 | 0.0784 | 0.6457 | 0.0681 |
| [77] | | 0.6278 | 1.0149 | 0.1184 | 0.0860 | 0.0686 | 0.0658 | 0.3870 | 0.0527 |
| [78] | | 0.6309 | 1.0185 | 0.1164 | 0.0879 | 0.0701 | 0.0677 | 0.3743 | 0.0517 |
| [26] | | 0.6247 | 1.0381 | 0.1367 | 0.1010 | 0.0805 | 0.0780 | 0.5159 | 0.0609 |
| 2D Proposed Equation | Equation (8e) | 0.8110 | 1.0038 | 0.1032 | 0.0597 | 0.0476 | 0.0472 | 0.1890 | 0.0432 |
| 3D Proposed Equation | Equation (12e) | 0.9424 | 1.0003 | 3.6502 | 2.3052 | 0.0504 | 0.0509 | 0.0576 | 0.0405 |
Table 14.
Statistical indicators of the axial strain corresponding to the peak compressive strength models of actively confined concrete.
Table 14.
Statistical indicators of the axial strain corresponding to the peak compressive strength models of actively confined concrete.
| Reference | Peak Compressive Strength Models of Actively Confined Concrete | R2 | Mean | RMSE | RRMSE | MAE | RMAE | AAE | RSE | PI |
|---|
| [25] | | 0.5491 | 1.0755 | 0.6165 | 0.3142 | 0.4449 | 0.2268 | 0.2432 | 0.4514 | 0.1805 |
| [73] | | 0.5234 | 0.9443 | 0.7129 | 0.3634 | 0.4715 | 0.2403 | 0.2221 | 0.6036 | 0.2109 |
| [74] | | 0.5491 | 1.0640 | 0.6180 | 0.3150 | 0.4405 | 0.2245 | 0.2380 | 0.4536 | 0.1809 |
| [75] | | 0.5491 | 1.0457 | 0.6229 | 0.3175 | 0.4335 | 0.2210 | 0.2297 | 0.4608 | 0.1824 |
| [76] | | 0.5483 | 0.8241 | 0.8461 | 0.4313 | 0.5739 | 0.2925 | 0.2499 | 0.8501 | 0.2478 |
| [77] | | 0.2158 | 0.7503 | 1.0786 | 0.5498 | 0.7226 | 0.3683 | 0.3037 | 1.3815 | 0.3754 |
| [78] | | 0.5495 | 0.9373 | 0.6998 | 0.3567 | 0.4644 | 0.2367 | 0.2186 | 0.5815 | 0.2048 |
| [26] | | 0.5491 | 1.0431 | 0.6239 | 0.3180 | 0.4325 | 0.2254 | 0.2286 | 0.4622 | 0.1827 |
| Proposed Equation | Equation (15e) | 0.8378 | 1.0430 | 0.4888 | 0.2492 | 0.2673 | 0.1362 | 0.1640 | 0.1604 | 0.1301 |
| Proposed Equation | Equation (16e) | 0.8280 | 1.0080 | 0.5382 | 0.2743 | 0.2603 | 0.1327 | 0.1580 | 0.2087 | 0.1436 |
Table 15.
Statistical indicators of the ultimate strength models of SMA-confined concrete.
Table 15.
Statistical indicators of the ultimate strength models of SMA-confined concrete.
| Reference | Ultimate Compressive Strength Models of Actively Confined Concrete | R2 | Mean | RMSE | RRMSE | MAE | RMAE | AAE | RSE | PI |
|---|
| [26] | | 0.5268 | 0.9482 | 9.2161 | 0.3470 | 6.5822 | 0.2478 | 0.2860 | 0.7068 | 0.2011 |
| 2D Proposed Equation | Equation (17c) | 0.6079 | 1.0696 | 0.1854 | 0.2334 | 0.1292 | 0.1627 | 0.2008 | 0.3833 | 0.1311 |
| 3D Proposed Equation | Equation (18c) | 0.7166 | 1.0377 | 5.9121 | 0.2226 | 4.4072 | 0.1659 | 0.1956 | 0.2908 | 0.1206 |
Table 16.
Statistical indicators of ultimate strain models of SMA confined concrete.
Table 16.
Statistical indicators of ultimate strain models of SMA confined concrete.
| Reference | Ultimate Compressive Strength Models of Actively Confined Concrete | R2 | Mean | RMSE | RRMSE | MAE | RMAE | AAE | RSE | PI |
|---|
| [26] |
| 0.0529 | 2.8511 | 0.0583 | 1.1731 | 0.0388 | 0.7807 | 1.8958 | 4.2147 | 0.9537 |
| Proposed Equation | Equation (19c) | 0.6411 | 1.2902 | 8.9113 | 0.3969 | 6.7345 | 0.2999 | 0.5181 | 0.3589 | 0.2204 |
| Proposed Equation | Equation (20e) | 0.9115 | 1.1155 | 4.5214 | 0.2014 | 3.2435 | 0.1445 | 0.2420 | 0.0924 | 0.1030 |
| Disclaimer/Publisher’s Note: The statements, opinions and data contained in all publications are solely those of the individual author(s) and contributor(s) and not of MDPI and/or the editor(s). MDPI and/or the editor(s) disclaim responsibility for any injury to people or property resulting from any ideas, methods, instructions or products referred to in the content. |
© 2022 by the authors. Licensee MDPI, Basel, Switzerland. This article is an open access article distributed under the terms and conditions of the Creative Commons Attribution (CC BY) license (https://creativecommons.org/licenses/by/4.0/).

