Article

Study on Seismic Performance of TID-LRB Hybrid Control System under Multi-Level Earthquakes

1
College of Civil Engineering, Anhui Jianzhu University, Hefei 230601, China
2
Department of Civil Engineering, Hefei University of Technology, Hefei 230009, China
*
Author to whom correspondence should be addressed.
Buildings 2022, 12(9), 1465; https://doi.org/10.3390/buildings12091465
Submission received: 23 August 2022 / Revised: 6 September 2022 / Accepted: 13 September 2022 / Published: 16 September 2022
(This article belongs to the Special Issue Advanced Studies of Risk Resistant Building Structures)

Abstract

:
The seismic response characteristics of a lead-rubber-bearing(LRB) base-isolated structure under rare and very rare earthquakes were investigated. The acceleration, ductility coefficient, and shear strain of the LRB increase significantly under very rare earthquakes in comparison to rare earthquakes; in particular, the shear strain of the LRB may exceed the ultimate shear strain and cause damage to the base-isolated structure. The criterion selected for the optimum tuned inerter damper (TID) of the TID–LRB hybrid control system is the minimization of the mean value of the maximum shear strain of the LRB. For each inertance mass ratio of the TID, there exists an optimum tuning frequency ratio and damping ratio of the TID to minimize the shear strain of the LRB, and the effectiveness is increased with a higher inertance mass ratio. By equipping the TID with appropriate parameters, the safety of the LRB during rare and very rare earthquakes can be ensured. Finally, the pounding response of the base-isolated structure collision with the moat wall under very rare earthquakes was analyzed. It was observed that under very rare earthquakes, the ductility coefficients of the superstructure by equipping with the suitable TID were improved, and the shear strain of the LRB was reduced. In addition, equipping the TID can reduce the required width of the isolation joint to avoid collision between the isolation layer and the moat wall, and with an increase in the inertance mass ratio, the required width of the isolation joint is smaller.

1. Introduction

Base-isolation technology is a widely used vibration-control method in engineering, and rubber-isolation bearing is one of the most mature techniques among them [1]. Compared with the traditional structure, the story drifts and absolute accelerations of base-isolated structures under earthquakes are effectively reduced, but the isolation bearing is significantly deformed. In addition, under strong earthquakes, the superstructure may enter a nonlinear state, resulting in an increased ductility demand [2,3,4,5]. On the other hand, the excessive horizontal displacements of the isolation bearing under strong earthquakes not only cause instability of the rubber bearings, but also cause a collision between the isolation layer and the surrounding moat wall [6]. Some tests and numerical studies have shown that the collision between the isolation layer and moat wall may lead to the yield of the superstructure and increase the probability of structural collapse [7,8,9]. In the “Seismic Ground Motion Parameters Zonation Map of China” (regulation GB 18036-2015) [10], a “4-level ground motion” was proposed by adding the very rare ground motion on the original “3-level ground motion”. The horizontal displacements of the isolation bearings and dynamic responses of the superstructure may increase significantly under very rare earthquakes, which increases the possibility of damage to the base-isolated structure and collision with adjacent structures.
To effectively control the horizontal displacement of the isolation bearing and story drifts of the superstructure under strong earthquakes, a base-isolated structure is often equipped with a certain number of dampers to form a passive, active, or semi-active hybrid control system. Inertia-based dampers have recently gained popularity in structural-vibration control owing to their significant mass-enhancement effect. Ikago et al. [11] proposed a new seismic-control device composed of an inerter, a damper, and a spring, called a tuned viscous mass damper (TVMD), and the effectiveness of the TVMD for seismic excitation was verified by numerical analyses and shake-table tests. This is the first real energy-dissipation system of an inerter–damper–spring network. Lazar et al. [12] proposed a new system of the tuned inerter damper (TID) based on the inerter instead of the mass element in the TMD and demonstrated that the performance could potentially be improved. Saitoh [13] assessed three types of systems incorporating a gyro-mass and presented the performance of a so-called “gyro-mass” provided for mitigating displacements of base-isolation systems. Domenico et al. [14,15] proposed a tuned mass-damper inerter (TMDI) and determined its optimal parameters based on a probabilistic framework. Sun et al. [16] introduced the H2 norm performances of ID- and TID-based isolation systems and obtained closed-form solutions for the optimal parameters of TID. Feng et al. [17] proposed two types of base-isolation systems with TID in serial or parallel to enhance the seismic-isolation performance of the traditional base-isolation system, and optimally tuned the TID isolation systems using the H2 norm criterion. Ye et al. [18] derived close-form solutions for the modal characteristics and seismic response of a base-isolated structure equipped with additional inerters by the modal-superposition method and carried out an extensive parametric study to investigate the effect of supplement inerters on both the modal characteristics and seismic response of the structure–isolator–inerter system. Jangid [19] studied the optimum damping- and tuning-frequency ratio of a tuned inerter damper (TID) for a base-isolated structure using a numerical-searching technique under stationary white-noise and filtered white-noise earthquake excitation. In these studies on TID, the superstructure of the base-isolated structure was always transformed into a linear–elastic single-degree-of-freedom system, and the seismic was always considered a single-level ground motion. It is necessary to consider the possibility of the superstructure entering a nonlinear state under strong earthquakes and the effectiveness of the TID under multilevel earthquakes, such as rare earthquakes and very rare earthquakes. Furthermore, if the base-isolated structure collides with the moat wall, the performance of the TID is a problem worthy of attention.
In this study, two systems were considered and compared, namely, a BIS system (only an LRB base-isolated structure) and a TID–LRB hybrid control system (an LRB base-isolated structure with TID). Multilevel earthquakes were introduced creatively. The different failure modes of the BIS system when there existed no collision or collision with a moat wall were investigated. For the TID–LRB hybrid control system, the optimum parameters and the effectiveness of the TID under multilevel earthquakes were studied. In particular, the research on the effectiveness of the TID on the control of the pounding responses of the base-isolated structure is another innovation. The remainder of this paper is organized as follows. The next section provides the equations of motion of the TID–LRB hybrid control system and provides the ground-motion input. Section 3 analyzes seismic responses of the BIS system under rare and very rare earthquakes and obtains the failure mode under very rare earthquakes. Section 4 determines the optimum parameters and investigates the effectiveness of the TID for the TID–LRB hybrid control system under multilevel earthquakes. Section 5 studies the pounding responses and failure mode of the BIS system collision with the moat wall and the performance of the TID in controlling the pounding responses of the base-isolated structure under very rare earthquakes. Section 6 presents the conclusions drawn from the numerical results.

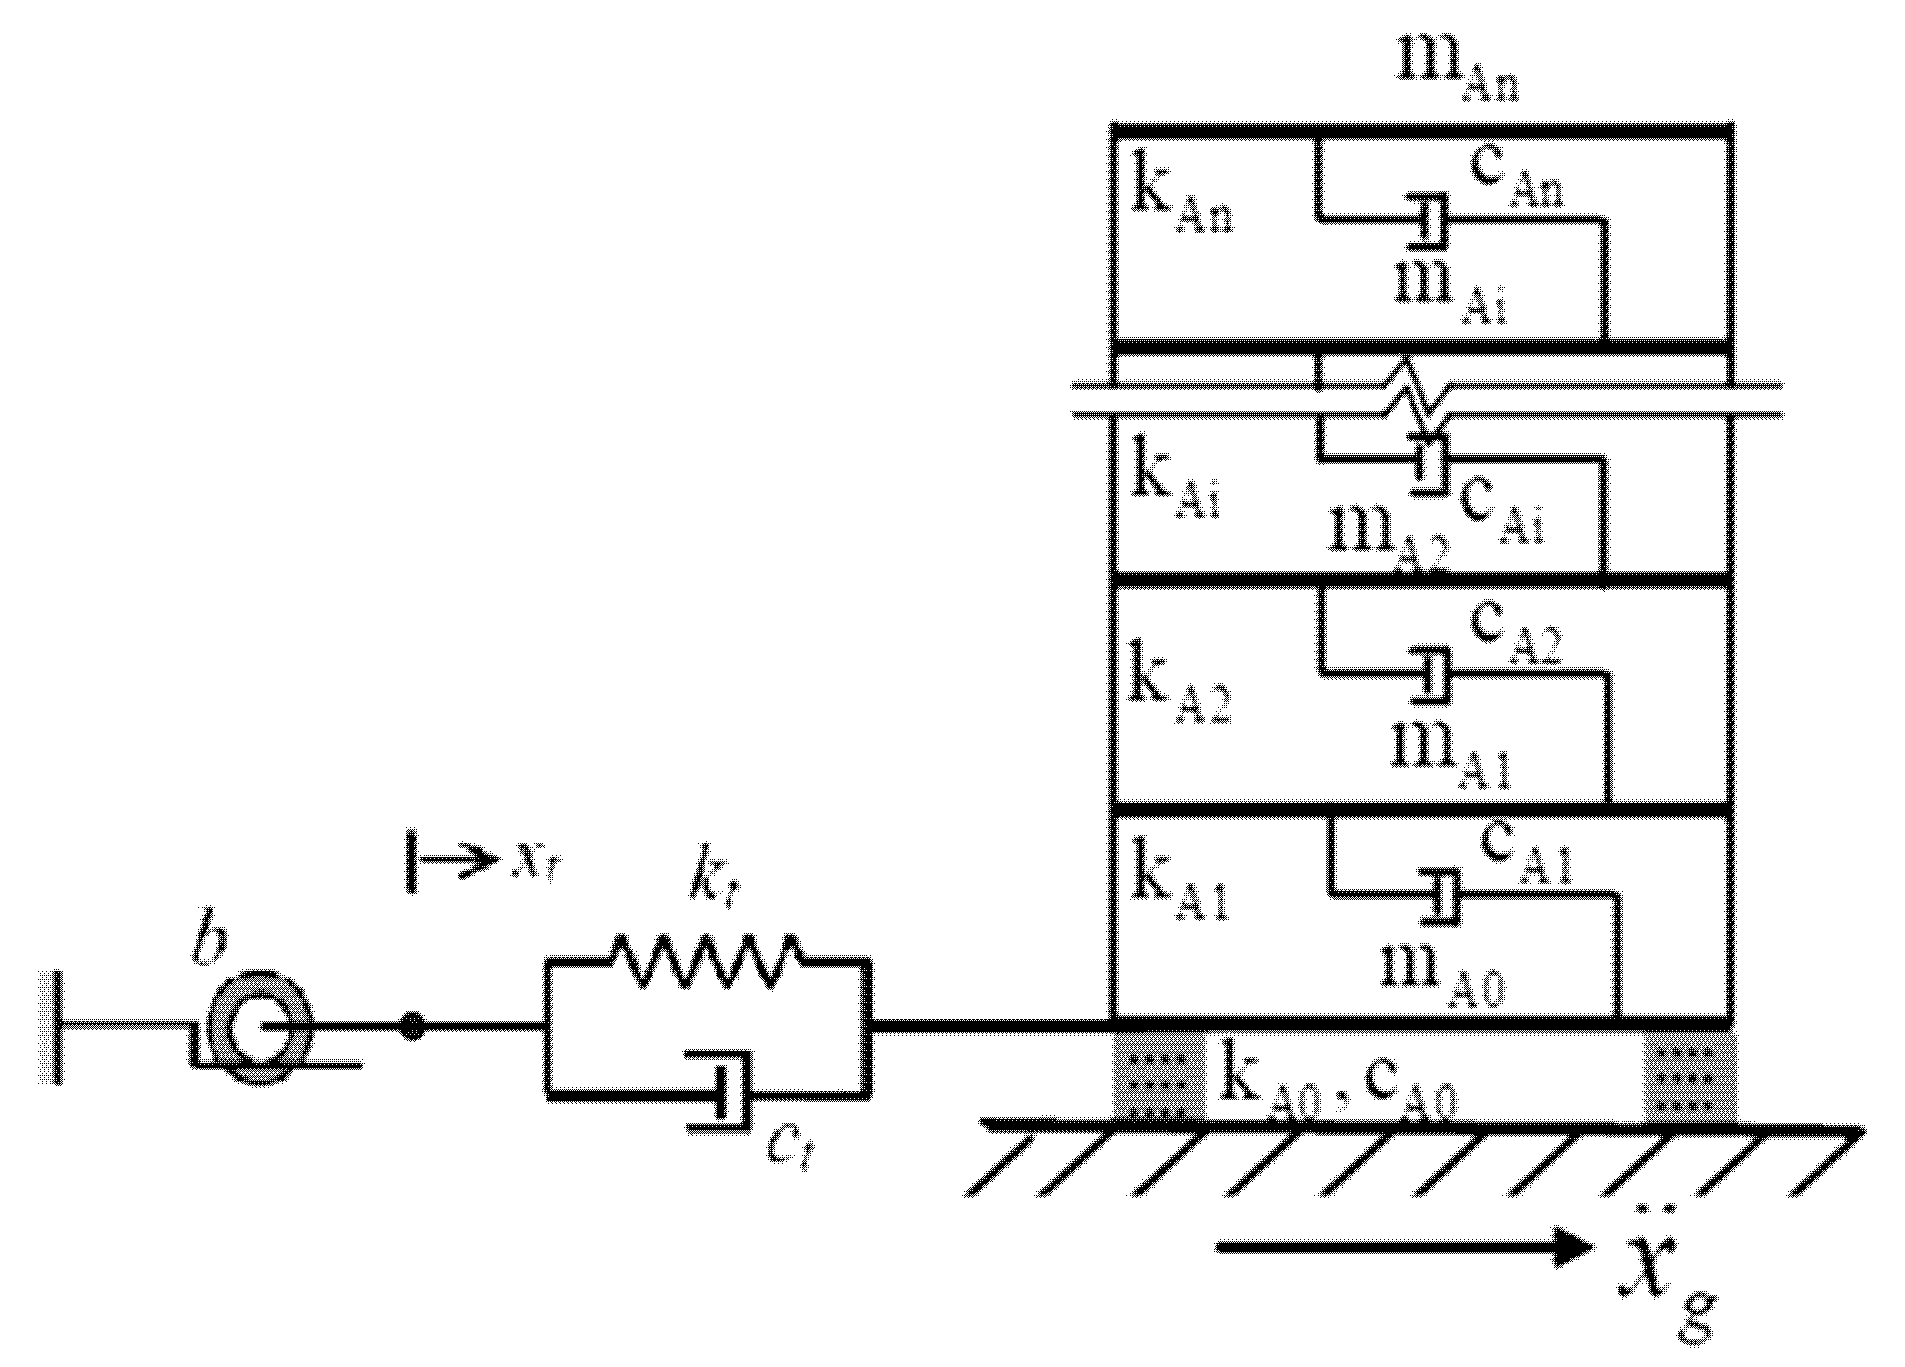
2. TID–LRB Hybrid Control System

2.1. The Equations of Motion

An n-story structure with LRB base isolation and supplemental TID is considered, as shown in Figure 1. The TID is composed of an inertial device with inertance b, damper ct, and spring kt [19]. m A i , c A i , and k A i represent the mass, damping, and elastic stiffness of the ith floor (i = 0 represents the isolation layer), respectively. The Bouc–Wen model is used to characterize the hysteretic behavior of the inter-story restoring force of the LRB and the superstructure. The expression is:
f i = α i k A i u i + ( 1 α i ) k A i d y i Z i ,
where αi represents the ratio of the post-yielding to pre-yielding stiffness of the ith floor, assumed as 0.1; u i is the inter-story displacement of the ith floor; d y i is the yield inter-story displacement of the ith floor; and Z i is the nondimensional hysteretic displacement component of the ith floor that satisfies the following equation:
Z ˙ i = A i u ˙ i d y i β i | u ˙ i d y i | | Z i | η i 1 Z i γ i u ˙ i d y i | Z i | η i
where A i , β i , γ i , and η i are the dimensionless parameters. In this study, A = 1 , β = γ = 0 . 5 , and η = 2 .
The governing equations of motion of the TID–LRB hybrid control system excited by ground acceleration are as follows:
m A n x ¨ n + c A n ( x ˙ n x ˙ n 1 ) + α k A n ( x n x n 1 ) + ( 1 α ) k A n d y n Z n = m A n x ¨ g m A i x ¨ i + c A i ( x ˙ i x ˙ i 1 ) + α k A i ( x i x i 1 ) + ( 1 α ) k A i d y i Z i c A ( i + 1 ) ( x ˙ i + 1 x ˙ i ) α k A ( i + 1 ) ( x i + 1 x i ) ( 1 α ) k A ( i + 1 ) d y ( i + 1 ) Z i + 1 = m A i x ¨ g ( i = 1 , , n 1 ) m A 0 x ¨ 0 + c A 0 x ˙ 0 + α k A 0 x 0 + ( 1 α ) k A 0 d y 0 Z 0 c A 1 ( x ˙ 1 x ˙ 0 ) α k A 1 ( x 1 x 0 ) ( 1 α ) k A 1 d y 1 Z 1 + c t ( x ˙ 0 x ˙ t ) + k t ( x 0 x t ) = m A 0 x ¨ g b x ¨ t + c t ( x ˙ t x ˙ 0 ) + k t ( x t x 0 ) = 0
where x t , x 0 , and x i ( i = 1 , , n ) are the displacements of the TID, LRB, and superstructure relative to the ground, respectively.
The mass of the superstructure is m s = m A 1 + m A 2 + + m A n ; the total mass and weight of the base-isolated structure are m a l l = m A 0 + m s and W = m a l l g , respectively; the uncoupled natural frequency, natural period, and damping ratio of the base-isolated structure are ω b = α 0 k A 0 / m a l l , T b = 2 π / ω b , and ξ b = c A 0 / ( 2 m a l l ω b ) , respectively; the inertance mass ratio is R Z = b / m a l l ; the stiffness and damping of the TID are ω t = k t / b and ξ t = c t / ( 2 b ω t ) , respectively; the frequency ratio is f = ω t / ω b ; and the yield-strength ratio of the base-isolated structure is expressed as q b = Q b / ( m a l l g ) , where Q b is the yield shear force of the LRB.
The superstructure of the base-isolated structure is a five-story reinforced concrete-frame structure, and mA1 = mA2 = mA3 = mA4 = mA5 = mA0. The inter-story elastic stiffness of different floors is taken as kA1 = kA2 = kA3 = kA4 = kA5 = k. The value of k is selected to provide the fundamental period of the fixed-base superstructure as 0.5 s. The yield-strength coefficient of each floor is evenly distributed along the height, and the yield shear force of each floor is proportional to the elastic earthquake-action force calculated according to the rare ground motion, which is considered to be Fy1 = F, Fy1 =   14 15 F, Fy1 =   12 15 F, Fy1 =   9 15 F, and Fy1 =   5 15 F. The modal damping ratio is assumed as 0.05 in all modes of vibration [20].
It is assumed that only one specification of the LRB is used for convenience in parameter research. The following relationship [4] can be established between the isolation period T b and the vertical compressive stress of the bearing σ, the thickness TR of the rubber inside the bearing, and the shear modulus of the rubber G:
T b = 2 π σ T R G g 2 . 0 σ T R G
Considering G = 0.4 MPa and σ = 12 MPa, T b is assumed to be 3.0 s, 3.5 s, and 4.0 s, and the corresponding TR are calculated to be 75, 102, and 133 mm, respectively. The mechanical properties of the LRB can be described by the parameters of isolation period T b , yield-strength ratio q b , yield displacement d y 0 , and damping ratio ξ b . It is considered that T b = 3.0 s, 3.5 s, and 4.0 s; q b = 0.06; d y 0 = 7.5 mm; and ξ b = 0.15 .

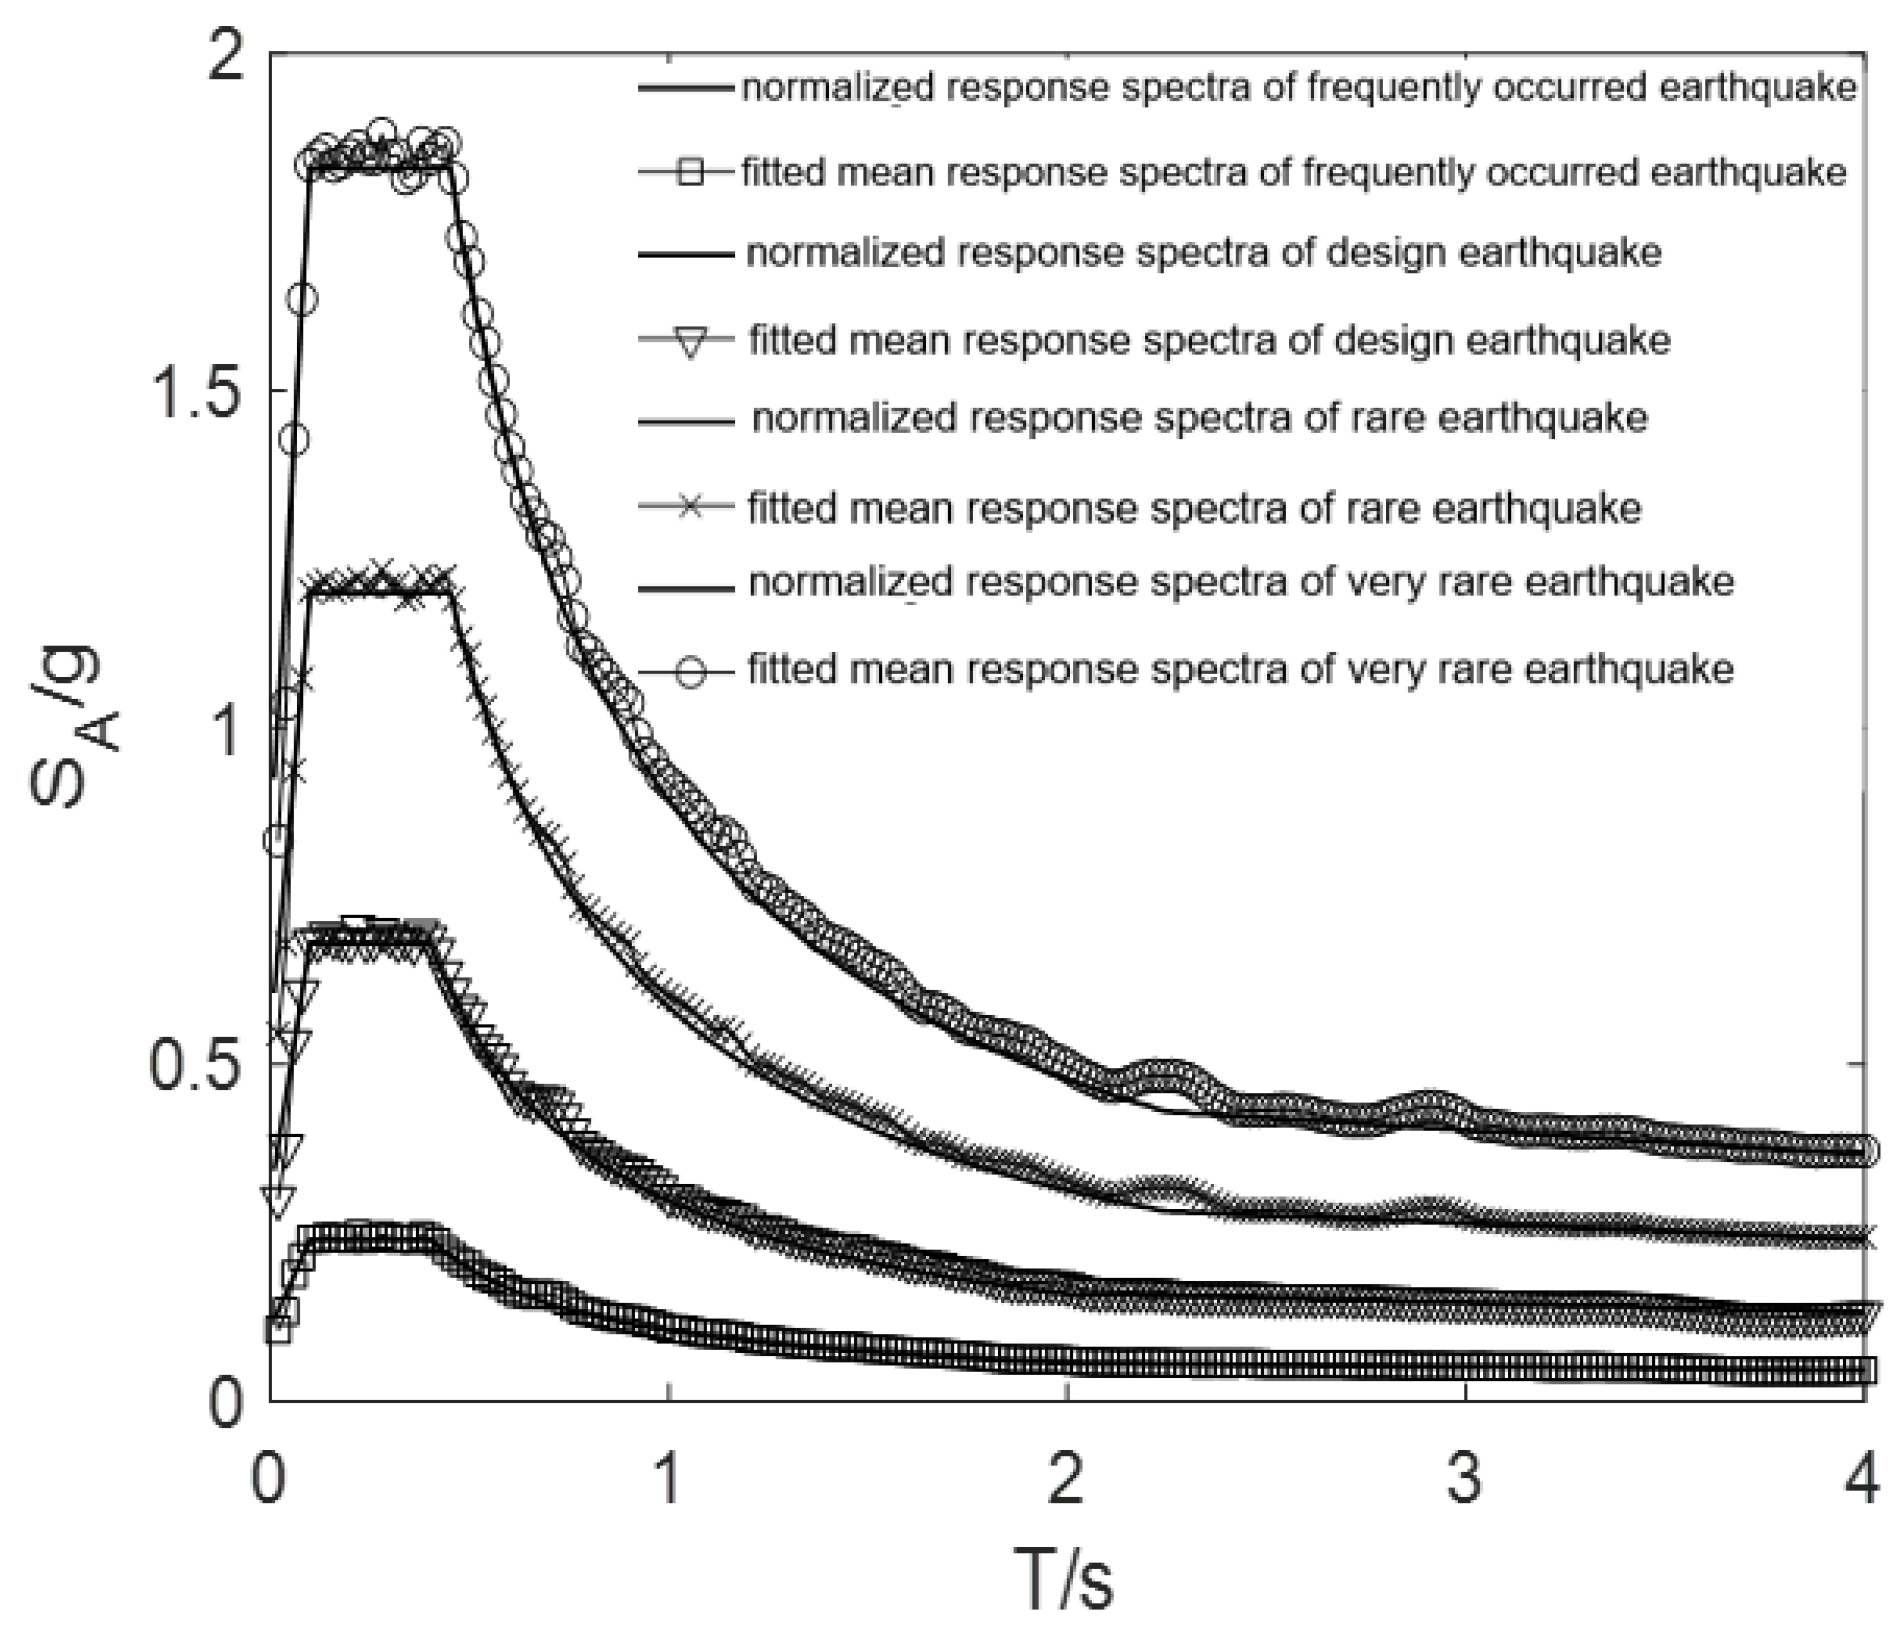
2.2. Ground-Motion Input

For the case of 8 degrees (0.3 g) of seismic precautionary intensity, class II site category, and earthquake group II [21], the peak acceleration of the design ground motion, rare ground motion, and very rare ground motion are 0.300 g, 0.570 g, and 0.870 g, respectively, and the corresponding design characteristic period is 0.40 s, 0.45 s, and 0.45 s respectively. A rare earthquake is an earthquake corresponding to the exceedance probability of 2% in 50 years, and a very rare earthquake corresponds to an earthquake with an annual exceedance probability of 10−4. Sixteen far-field earthquakes, recommended by ATC-63 [22], were selected as the input. The basic information of these selected ground motions is presented in Table 1. Before the time-history analysis, SeismoMatch [23] was used to adjust the ground motions. Figure 2 shows a comparison between the normalized response spectrum and the fitted mean response spectrum. It can be observed that the fitting effect was good.

3. Seismic Response and Failure Mode of BIS System

Seismic responses of the BIS system under rare and very rare earthquakes were analyzed and compared. Then the failure mode of the BIS system under very rare earthquakes was obtained.

3.1. Definition Indices of Seismic Response

The maximum acceleration a m i j ( a m i j = m a x | a i j | ), maximum inter-story drift u m i j ( u m i j = m a x | u i j | ), ductility coefficient μ m i j ( μ m i j = m a x | a i j | / d y i j ) of the ith floor, and maximum shear strain γ m i j ( γ m j = m a x | u m 0 j | / T R ) of the LRB under the jth ground motion were defined. The following indices of seismic responses, which are the mean value of maximum acceleration a m i , mean value of maximum inter-story drift u m i , mean value of maximum ductility coefficient μ m i of the ith floor, and mean value of maximum shear strain of LRB γ m , are expressed as
a m i = j = 1 N g a m i j N g , u m i = j = 1 N g u m i j N g , μ m i = j = 1 N g μ m i j N g , γ m = j = 1 N g γ m j N g
where N g = 16 . According to previous research, the ultimate collapse state of the superstructure is μ = 10 [24]; for LRB, γ = 450% corresponds to the ultimate shear strain.

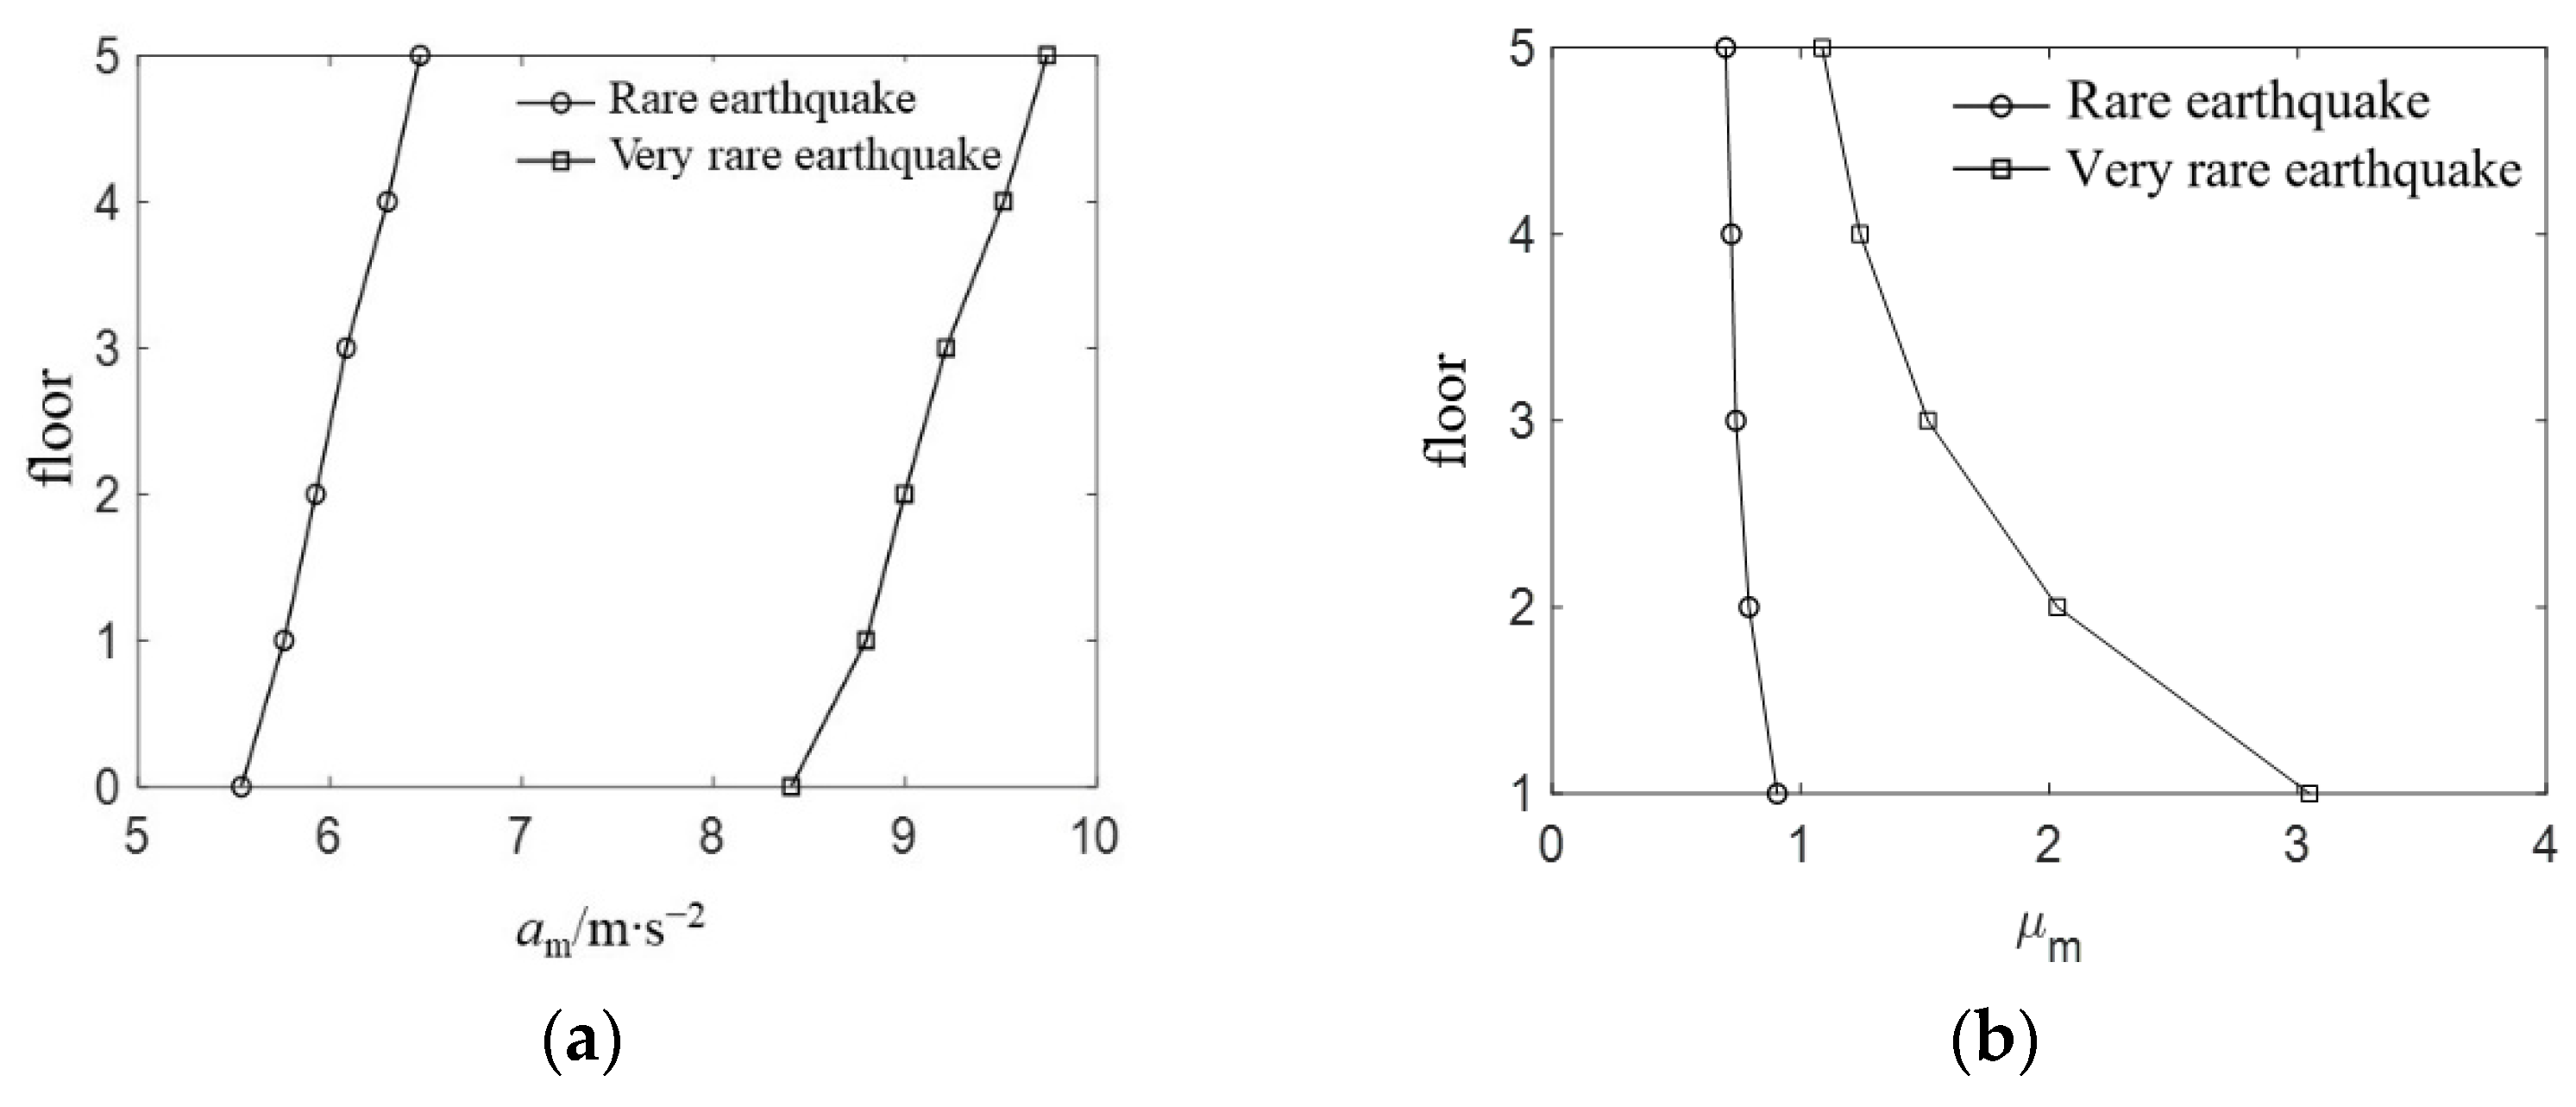
3.2. Seismic Response and Failure-Mode Analysis

In Figure 3, Figure 4 and Figure 5, the mean values of the maximum accelerations and maximum ductility coefficients of the BIS system with different isolation periods under rare and very rare earthquakes are shown. It can be seen that the acceleration and ductility coefficient increased significantly under very rare earthquakes compared to the responses under rare earthquakes. Under rare earthquakes, the superstructure was in a linear elastic state; however, under very rare earthquakes, the superstructure entered a nonlinear state. Comparing the results in Figure 3, Figure 4 and Figure 5, it can be observed that a long isolation period reduced the acceleration, ductility coefficient, and plastic deformation of the superstructure under very rare earthquakes.
The mean values of the maximum horizontal displacement and shear strain of the LRB with isolation periods of 3.0 s, 3.5 s, and 4.0 s under rare and very rare earthquakes are listed in Table 2. With an increase in the isolation period, the horizontal displacement of the LRB gradually increased, whereas the shear strain gradually decreased. The isolation period is proportional to the thickness of the rubber inside the bearing. Under the same earthquake, the longer the isolation period was, the larger the horizontal displacement of the isolation bearing was. For the shear strain of the isolation bearing, although the horizontal displacement of the isolation bearing became larger, the thickness of the rubber also increased, resulting in a reduction in the shear strain of the isolation bearing. The maximum shear strains of the LRB exceeded the ultimate maximum shear strain (450%) under very rare earthquakes, resulting in failure of the LRB.

4. Optimum TID for TID–LRB Hybrid Control System

4.1. Description of Optimization Problem

From Section 3, the LRB of the BIS system had a very large horizontal displacement and shear strain under rare and very rare earthquakes. In particular, the LRB may be damaged during very rare earthquakes. Therefore, it is necessary to consider the TID–LRB hybrid control system. The criterion for the optimality of the TID was the minimization of the mean value of the maximum shear strain of the LRB under rare earthquakes. On this basis, the effectiveness of the TID on controlling the seismic responses of the base-isolated structure under very rare earthquakes was studied. Two dimensionless quantities of performance indices were defined, namely, R 1 and R 2 :
R 1 = γ m γ m 0 , R 2 = μ m 1 μ m 10 ,
where R 1 and R 2 represent the response ratio of the mean value of the maximum shear strain of the LRB and the mean maximum ductility coefficient of the first floor of the superstructure, respectively; γ m and μ m 1 represent the mean value of the maximum shear strain of the LRB and the mean maximum ductility coefficient of the first floor of the TID–LRB hybrid control system, respectively; and γ m 0 and μ m 10 represent the mean value of the maximum shear strain of the LRB and the mean maximum ductility coefficient of the first floor of the BIS system, respectively. Thus, the problem of optimizing the design of the TID can be expressed by the following mathematical expression:
Find   R Z , o p t , ξ t , o p t , f o p t Minimize   R 1

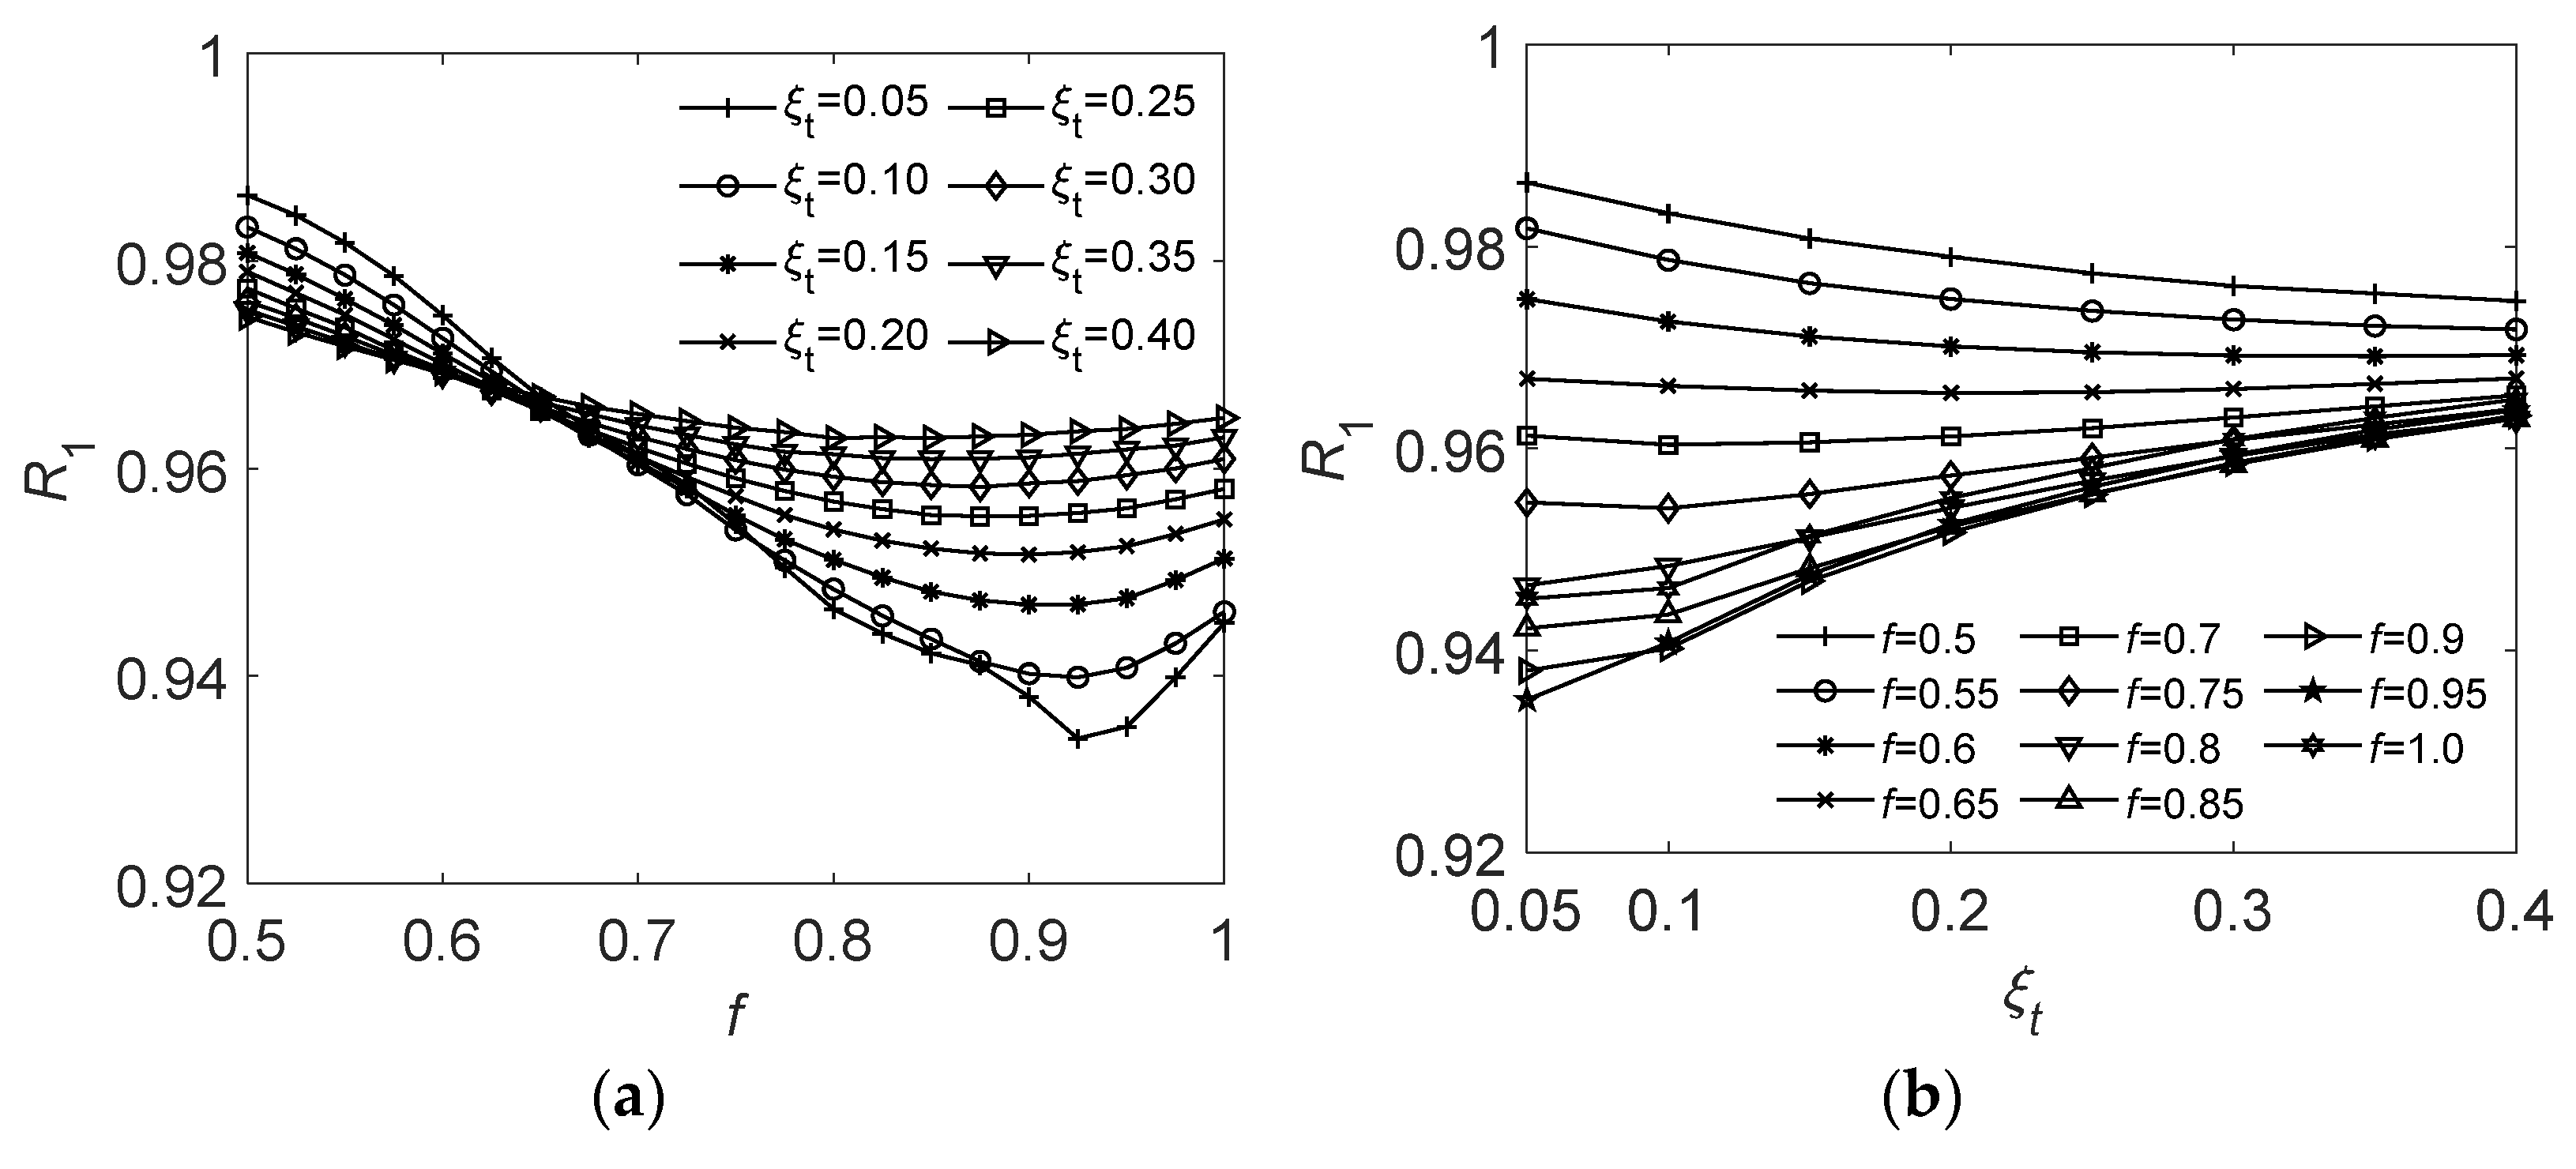
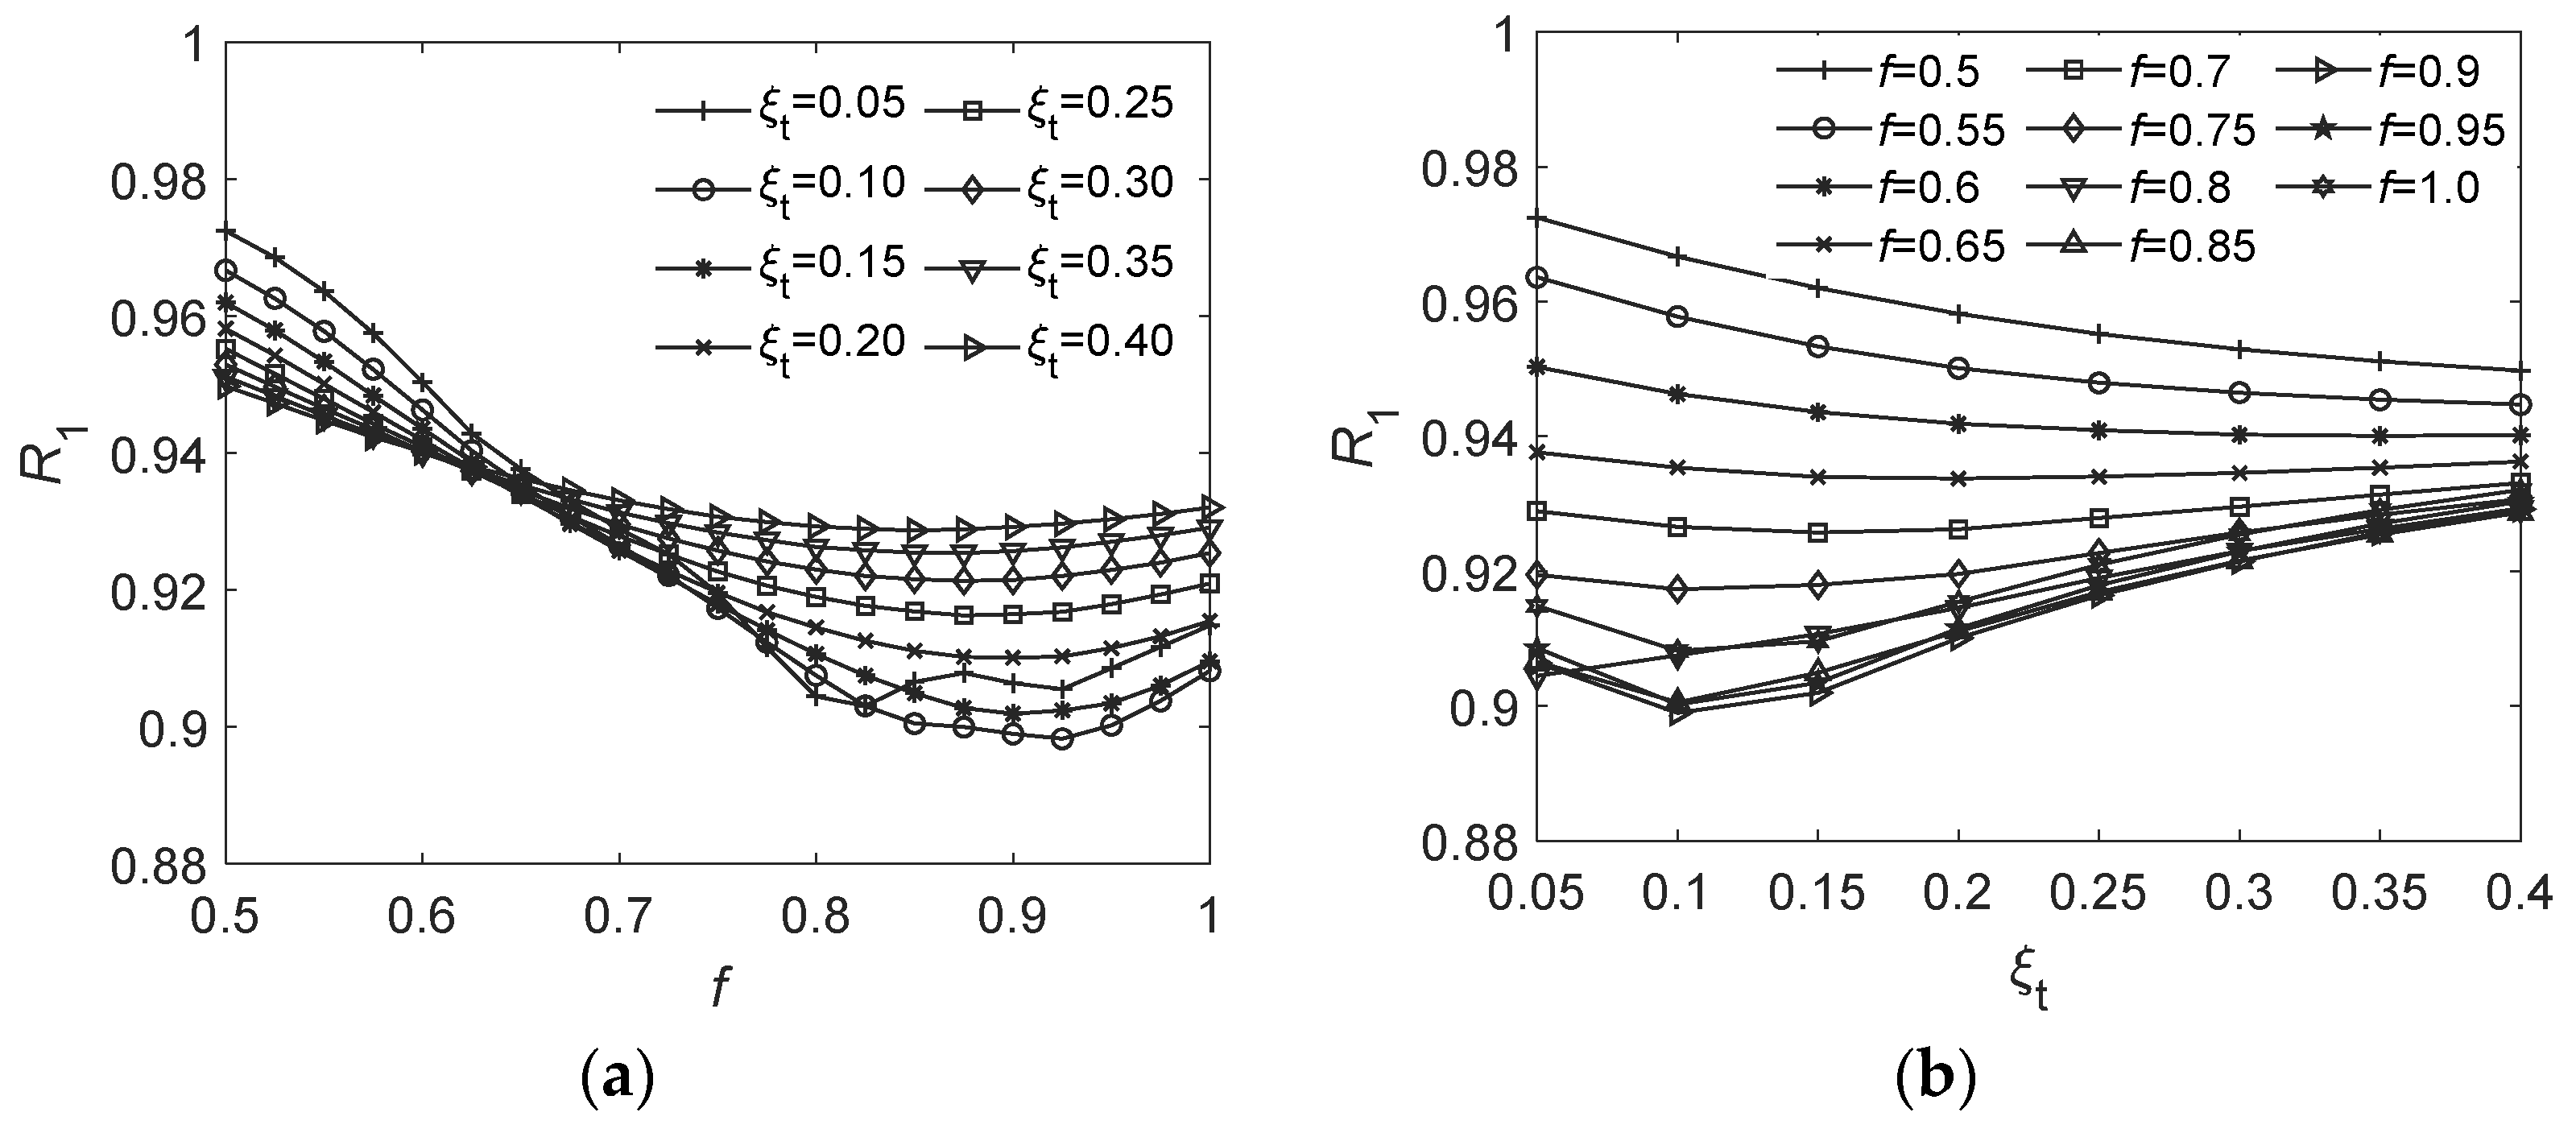
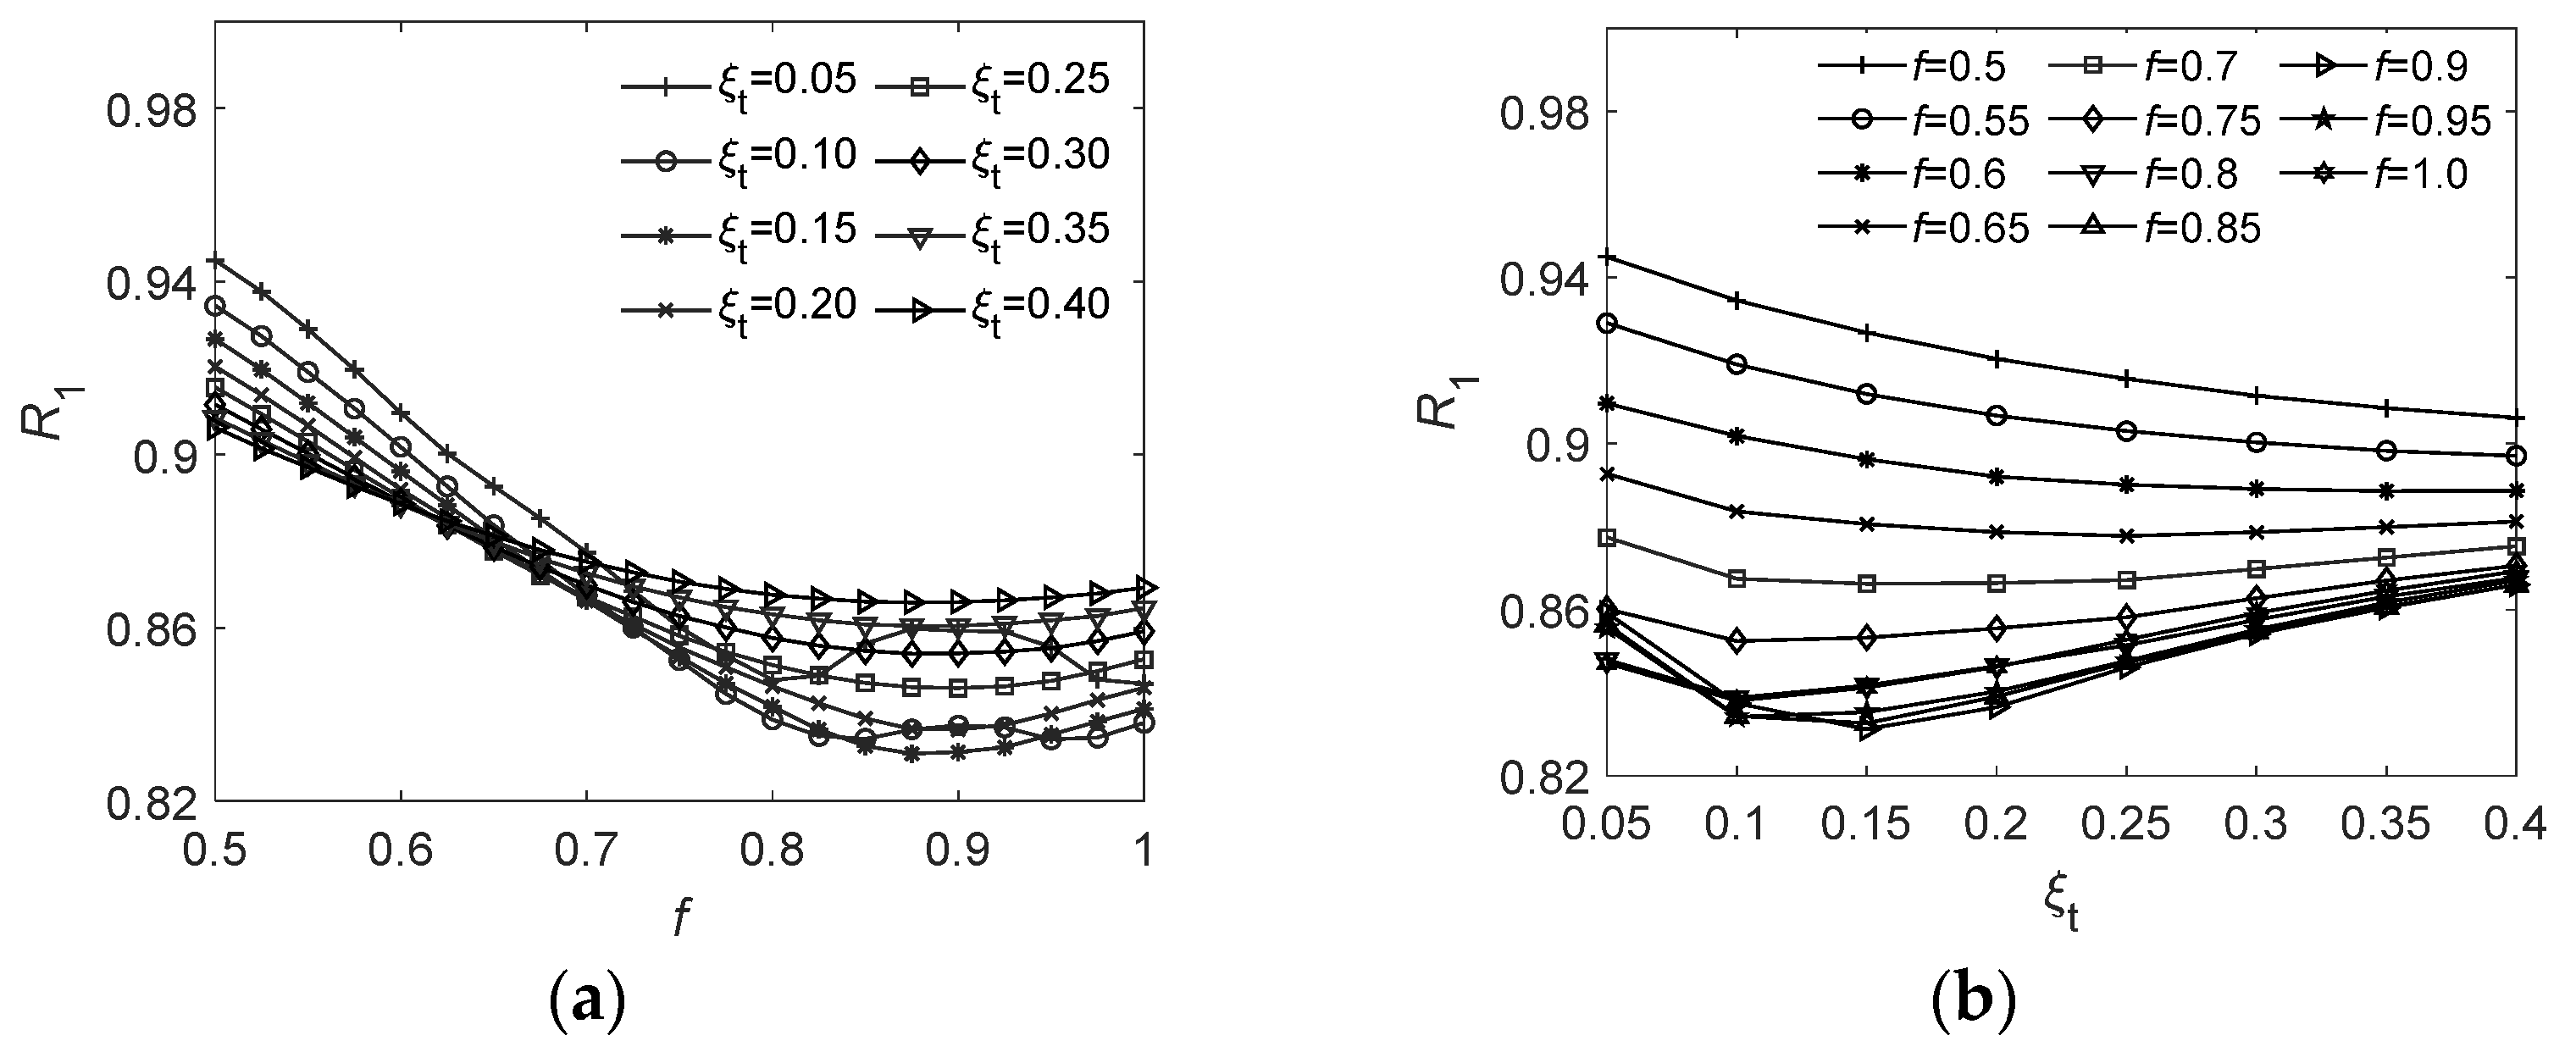
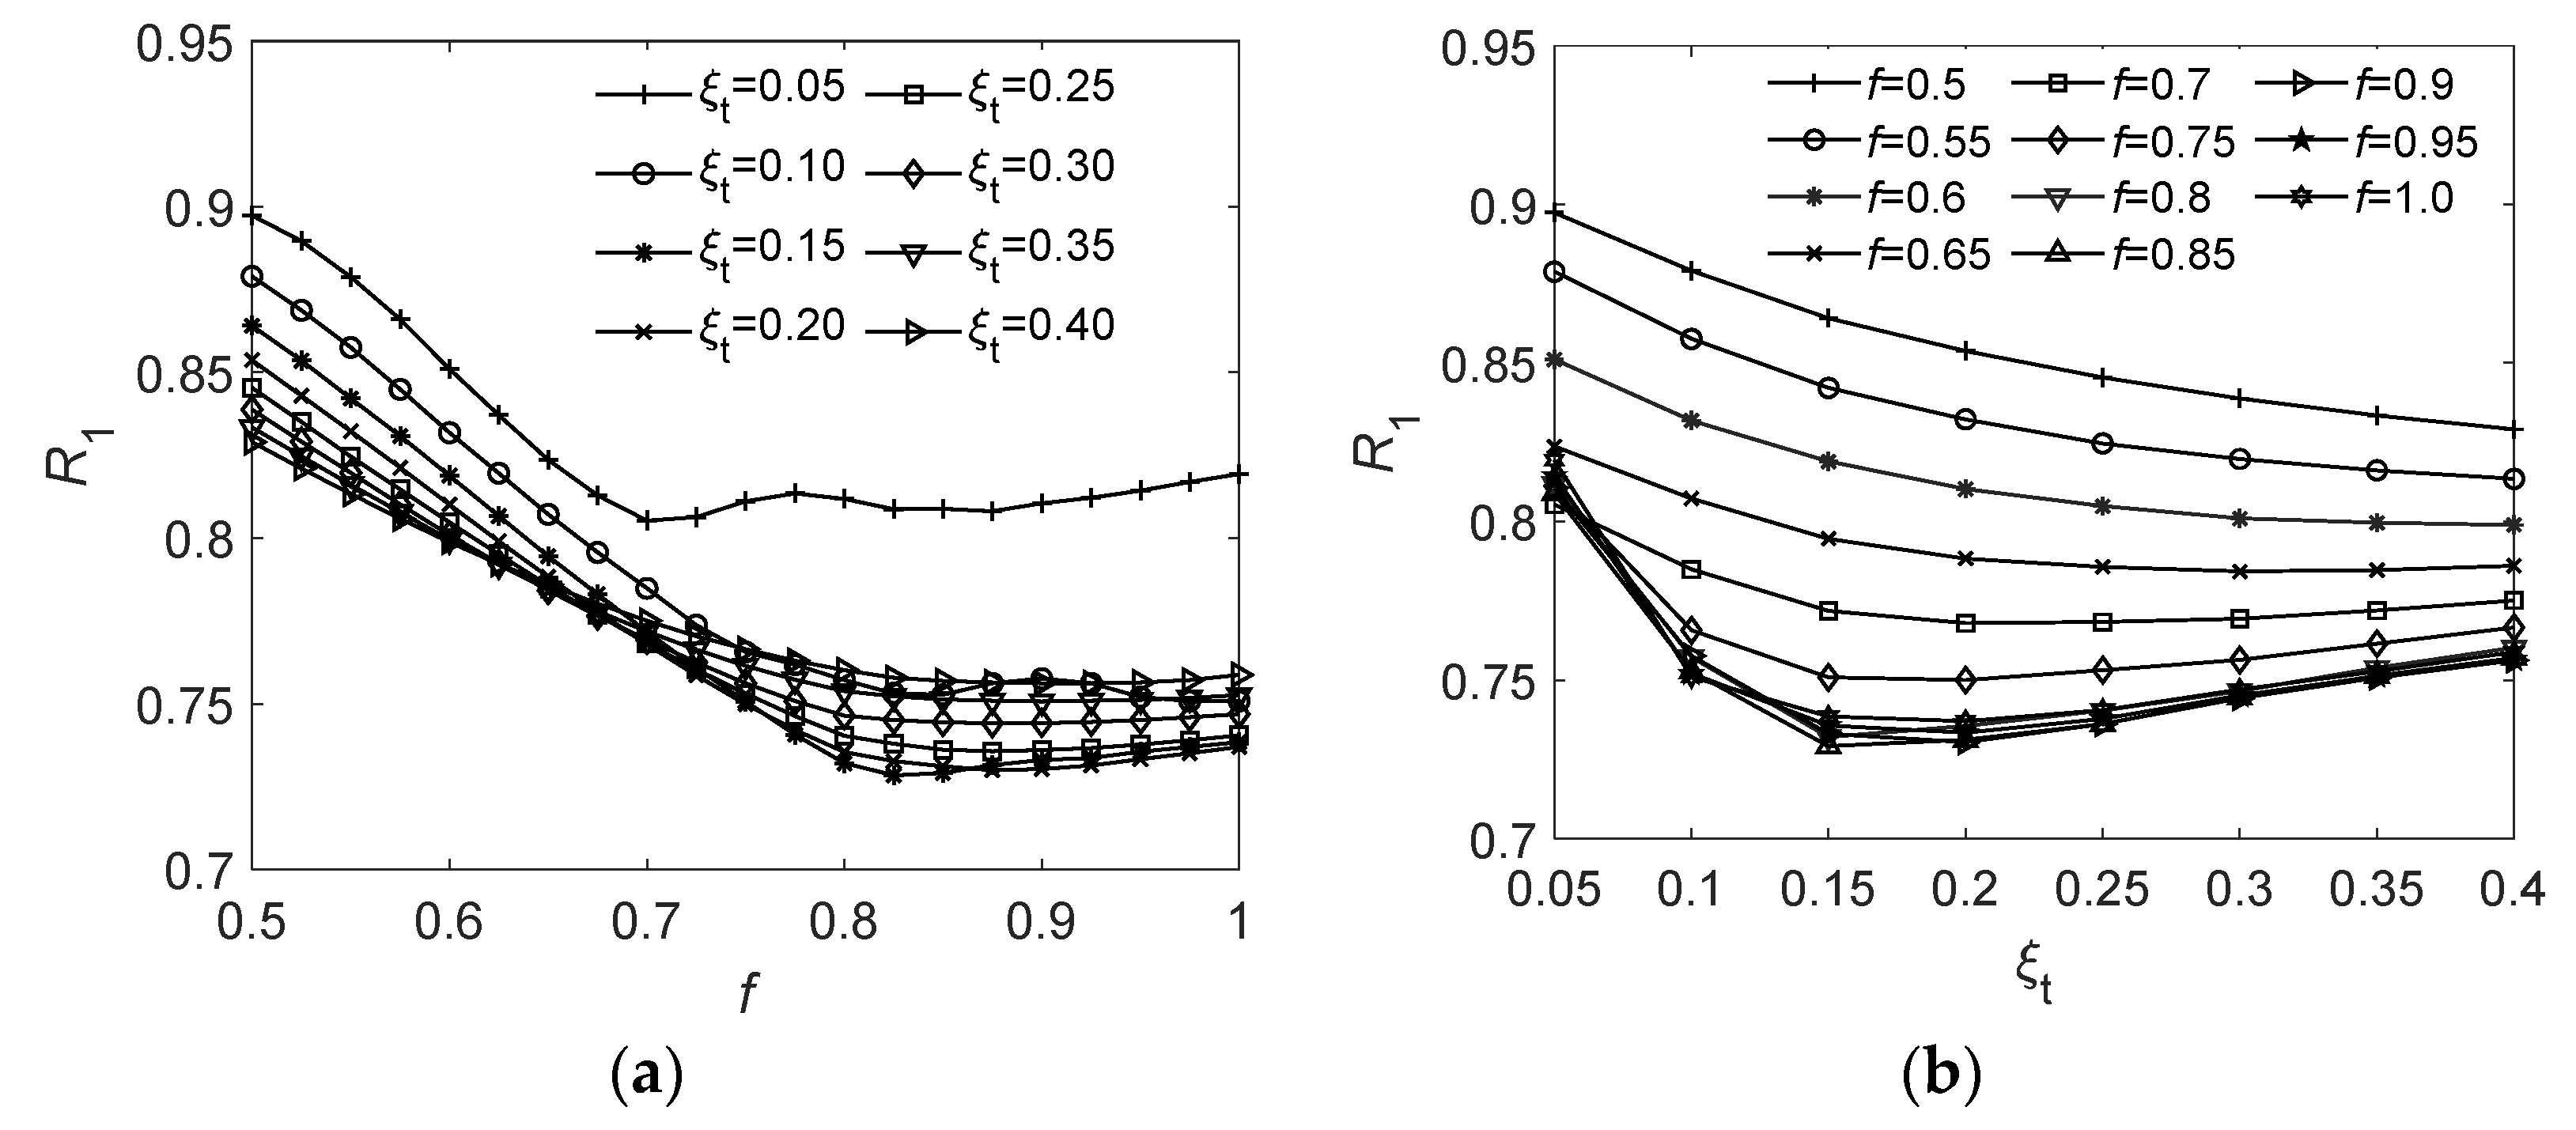
4.2. Parametric Study

The parametric study method was used to analyze the influence of the three parameters of the TID on R 1 . The range of R z was (0.05, 0.6), the range of ξ t was (0.05, 0.4), and the range of f was (0.5, 1.2).
In Figure 6, Figure 7, Figure 8 and Figure 9, the variation of R 1 against ξ t and f under rare earthquakes for the TID–LRB hybrid control system with an isolation period of 3.5 s is shown, where R z is 0.05, 0.1, 0.2, and 0.4, respectively. When R z and ξ t were constant, with an increase in f, R 1 first decreased and then increased, and there existed an optimal value f at which the minimum value of R 1 could be obtained. When R z and f were constant and f was small, R 1 decreased with an increase in ξ t ; when f was large, R 1 decreased first and then increased with an increase in ξ t , and there existed an optimal value ξ t to obtain the minimum value of R 1 . For each value of R z , there existed an optimal value of ξ t and f to obtain the minimum value of R 1 .
In Table 3, Table 4 and Table 5, the optimization parameters of the supplemental TID for the TID–LRB hybrid control system are presented. For the isolation periods of 3.0 s, 3.5 s, and 4.0 s, the seismic responses of the base-isolated structure were analyzed under rare earthquakes and very rare earthquakes. With an increase in R z , the optimal parameter ξ t , o p t tended to increase; in contrast, f o p t showed a decreasing trend. With an increase in R z , R 1 gradually decreased, indicating a better control on the horizontal displacement and shear strain of the LRB. The optimization results show that the supplemental TID can not only reduce the shear strain of the LRB, but also reduce the superstructure ductility coefficients. However, the control effect on the ductility coefficients of the superstructure was weakened by the larger R z .
Comparing the effectiveness of the TID under rare and very rare earthquakes, although the optimal parameters of the TID were obtained under rare earthquakes, the TID also controlled the shear strain of the LRB and the superstructure ductility coefficients under very rare earthquakes well. In particular, the effectiveness of the TID on the superstructure ductility coefficients under very rare earthquakes was better than that under rare earthquakes. It can also be seen from Table 3, Table 4 and Table 5 that for the base-isolated structure with isolation periods of 3.0 s, 3.5 s, and 4.0 s, when the value of R z was greater than a certain value, and both ξ t and f took the optimal value, the mean value of the maximum shear strain of the LRB under very rare earthquakes was less than the ultimate shear strain of 450%, ensuring that the LRB would not be damaged during very rare earthquakes.
The variation in the mean value of the maximum displacement and maximum force of the TID against R z under rare earthquakes is shown in Figure 10. The mean value of the maximum displacement gradually decreased with an increase in R z , and the mean value of the maximum force gradually increased with an increase in R z . The longer the isolation period, the greater the displacement and corresponding force of the TID.

5. Pounding Response Analysis

The horizontal displacement and shear strain of the LRB can be reduced using the TID. Table 6, Table 7 and Table 8 list the mean values of the maximum horizontal displacement and shear strain of the LRB under rare and very rare earthquakes. The horizontal displacement of the LRB under very rare earthquakes greatly increases compared to that under rare earthquakes. The width of the isolation joint between the isolated structure and the surrounding moat wall is always determined by the horizontal displacement of the LRB during rare earthquakes. Thus, the isolation layer of the base-isolated structure with or without the TID may collide with the moat wall under very rare earthquakes.
The maximum horizontal displacement of the LRB for the BIS system under the jth rare earthquake is denoted as Dmaxj, which is used as the reference displacement for the study of the collision with the moat wall under very rare earthquakes. The widths between the base-isolated structure and the moat wall on the left and right sides are equal, and are denoted by ds. When ds is 1.0 Dmaxj, 1.1 Dmaxj, 1.2 Dmax, etc., the pounding responses of the maximum acceleration, maximum inter-story drift, and ductility coefficient of the ith floor for the base-isolated structure under the jth very rare earthquake are denoted as a i j , u i j , and μ i j , respectively. Under the earthquakes selected in Section 1.2, the mean value of the maximum pounding responses of the base-isolated structure can be obtained using Formula (5) as ds increases to different degrees relative to Dmax.

5.1. Pounding Responses and Failure Mode of BIS System

Pounding responses of the BIS system collision with the moat wall under very rare earthquakes were analyzed. In Figure 11, Figure 12 and Figure 13, the mean values of the maximum accelerations and ductility coefficients of the BIS system with different isolation periods under very rare earthquakes are shown. The acceleration of the isolation layer that collides with the moat wall is increased, but the accelerations of the superstructure are nearly unaffected by the collision. The ductility coefficients of the superstructure increases significantly, particularly when the width of the isolation joint is small. The ductility coefficients of some floors exceed 10, which could cause the collapse of the superstructure. With the gradual increase in ds from 1.0Dmax, the acceleration of the isolation layer and ductility coefficients of the superstructure gradually decrease until there is no collision between the isolation layer and moat wall, and the seismic responses of the base-isolated structure decrease to the seismic responses without collision.
The variation in the mean value of the maximum shear strain of the LRB against ds considering pounding under very rare earthquakes is shown in Figure 14. When ds is small, the horizontal movement of the LRB is limited by the moat wall. Therefore, the maximum horizontal displacement of the LRB is equal to ds. The corresponding maximum shear strain of the LRB is the ratio of ds to the thickness of the rubber TR. With an increase in ds, the horizontal displacement and shear strain of the LRB also increase. Until there is no collision between the isolation layer and moat wall, the horizontal displacement and shear strain of the LRB remain constant, which is equal to that in the case of no collision.
When ds is small, the setting of the moat wall can limit the horizontal displacement and shear strain of the LRB, but the acceleration of the LRB and the ductility coefficients of the superstructure may increase, which can cause the failure of the superstructure. When ds is large, the maximum shear strain of the LRB may exceed the ultimate shear strain, resulting in the failure of the LRB.

5.2. Pounding Responses of TID–LRB Hybrid Control System

For the TID–LRB hybrid control system, the pounding responses under very rare earthquakes are different for different values of R z . The pounding responses of the base-isolated structure with an isolation period of 3.5 s are shown in Figure 15, Figure 16, Figure 17, Figure 18 and Figure 19. Compared with the pounding responses of the BIS system, the mean values of the maximum accelerations and ductility coefficients of the base-isolated structure in the TID–LRB hybrid control system are reduced. When R z increases gradually, the mean values of the maximum accelerations and ductility coefficients decrease gradually. For the TID–LRB hybrid control system, although the base-isolated structure may still collide with the moat wall under very rare earthquakes, the ductility coefficients of the superstructure can be reduced to less than 10 by selecting appropriate parameters of the TID to prevent the collapse of the superstructure.
The pounding responses of the TID–LRB hybrid control system under very rare earthquakes are listed in Table 9, Table 10 and Table 11. The mean value of the LRB maximum shear strain γ m , the mean value of the LRB maximum acceleration am0, and the mean value of the ductility coefficient of the first floor μ m 1 were studied. Increasing the width of the isolation joint ds can reduce the pounding responses of the base-isolated structure. For the same width of the isolation joint ds, equipping with TID can reduce the pounding responses of the base-isolated structure, and with an increase in R z , the control effect is more obvious. The larger the value of R z , the better the effectiveness of the TID. In particular, when the width of the isolation joint ds is small, the base-isolated structure with TID may still collide with the moat wall under very rare earthquakes, but the ductility coefficients of the superstructure can be reduced to prevent the collapse of the superstructure by adopting appropriate parameters of the TID.
With an increase in ds, the shear strain of the LRB gradually increases until there is no collision. The bold font numbers in Table 9, Table 10 and Table 11 are the statistical results of the seismic responses without collisions, and the corresponding spacing are the required minimum widths of the isolation joint for no collision to occur. Equipping with TID can reduce the required minimum width of the isolation joint that prevents collisions. With an increase in R z , the corresponding spacing gradually decreases, and the mean value of the maximum shear strain of the LRB also gradually decreases until it does not exceed the ultimate shear strain of 450% to ensure the safety of the LRB.
The mean values of the maximum displacement and force of the supplemental TID under very rare earthquakes are shown in Figure 20 and Figure 21. With an increase in ds, the displacement and force of the TID gradually increase. For the same width of the isolation joint ds, with an increase in R z , the displacement of the TID gradually decreases and the force gradually increases. With the prolongation of the isolation period, the mean value of the maximum displacement and force of the TID gradually increase.

6. Conclusions

This research focuses on studying and comparing the seismic responses of an LRB base-isolated structure with and without the TID under rare and very rare earthquakes. In addition, the pounding responses are studied. The following conclusions are drawn from the results of this study.
  • For the BIS system, the acceleration, ductility coefficient, and shear strain of the LRB increase significantly under very rare earthquakes compared to rare earthquakes; in particular, the shear strain of the LRB may exceed the ultimate shear strain and cause damage to the base-isolated structure.
  • Prolonging the isolation period of the BIS system can reduce the acceleration, ductility coefficients, and plastic deformations of the superstructure. Furthermore, with a longer isolation period, the horizontal displacement of the LRB increases; in contrast, the shear strain of the LRB decreases.
  • For each inertance-mass ratio of the TID, there exists an optimal value of tuning frequency ratio and damping ratio to minimize the shear strain of the LRB. Although the optimal parameters of the TID were obtained under rare earthquakes, it also alleviated the seismic responses of the base-isolated structure under very rare earthquakes.
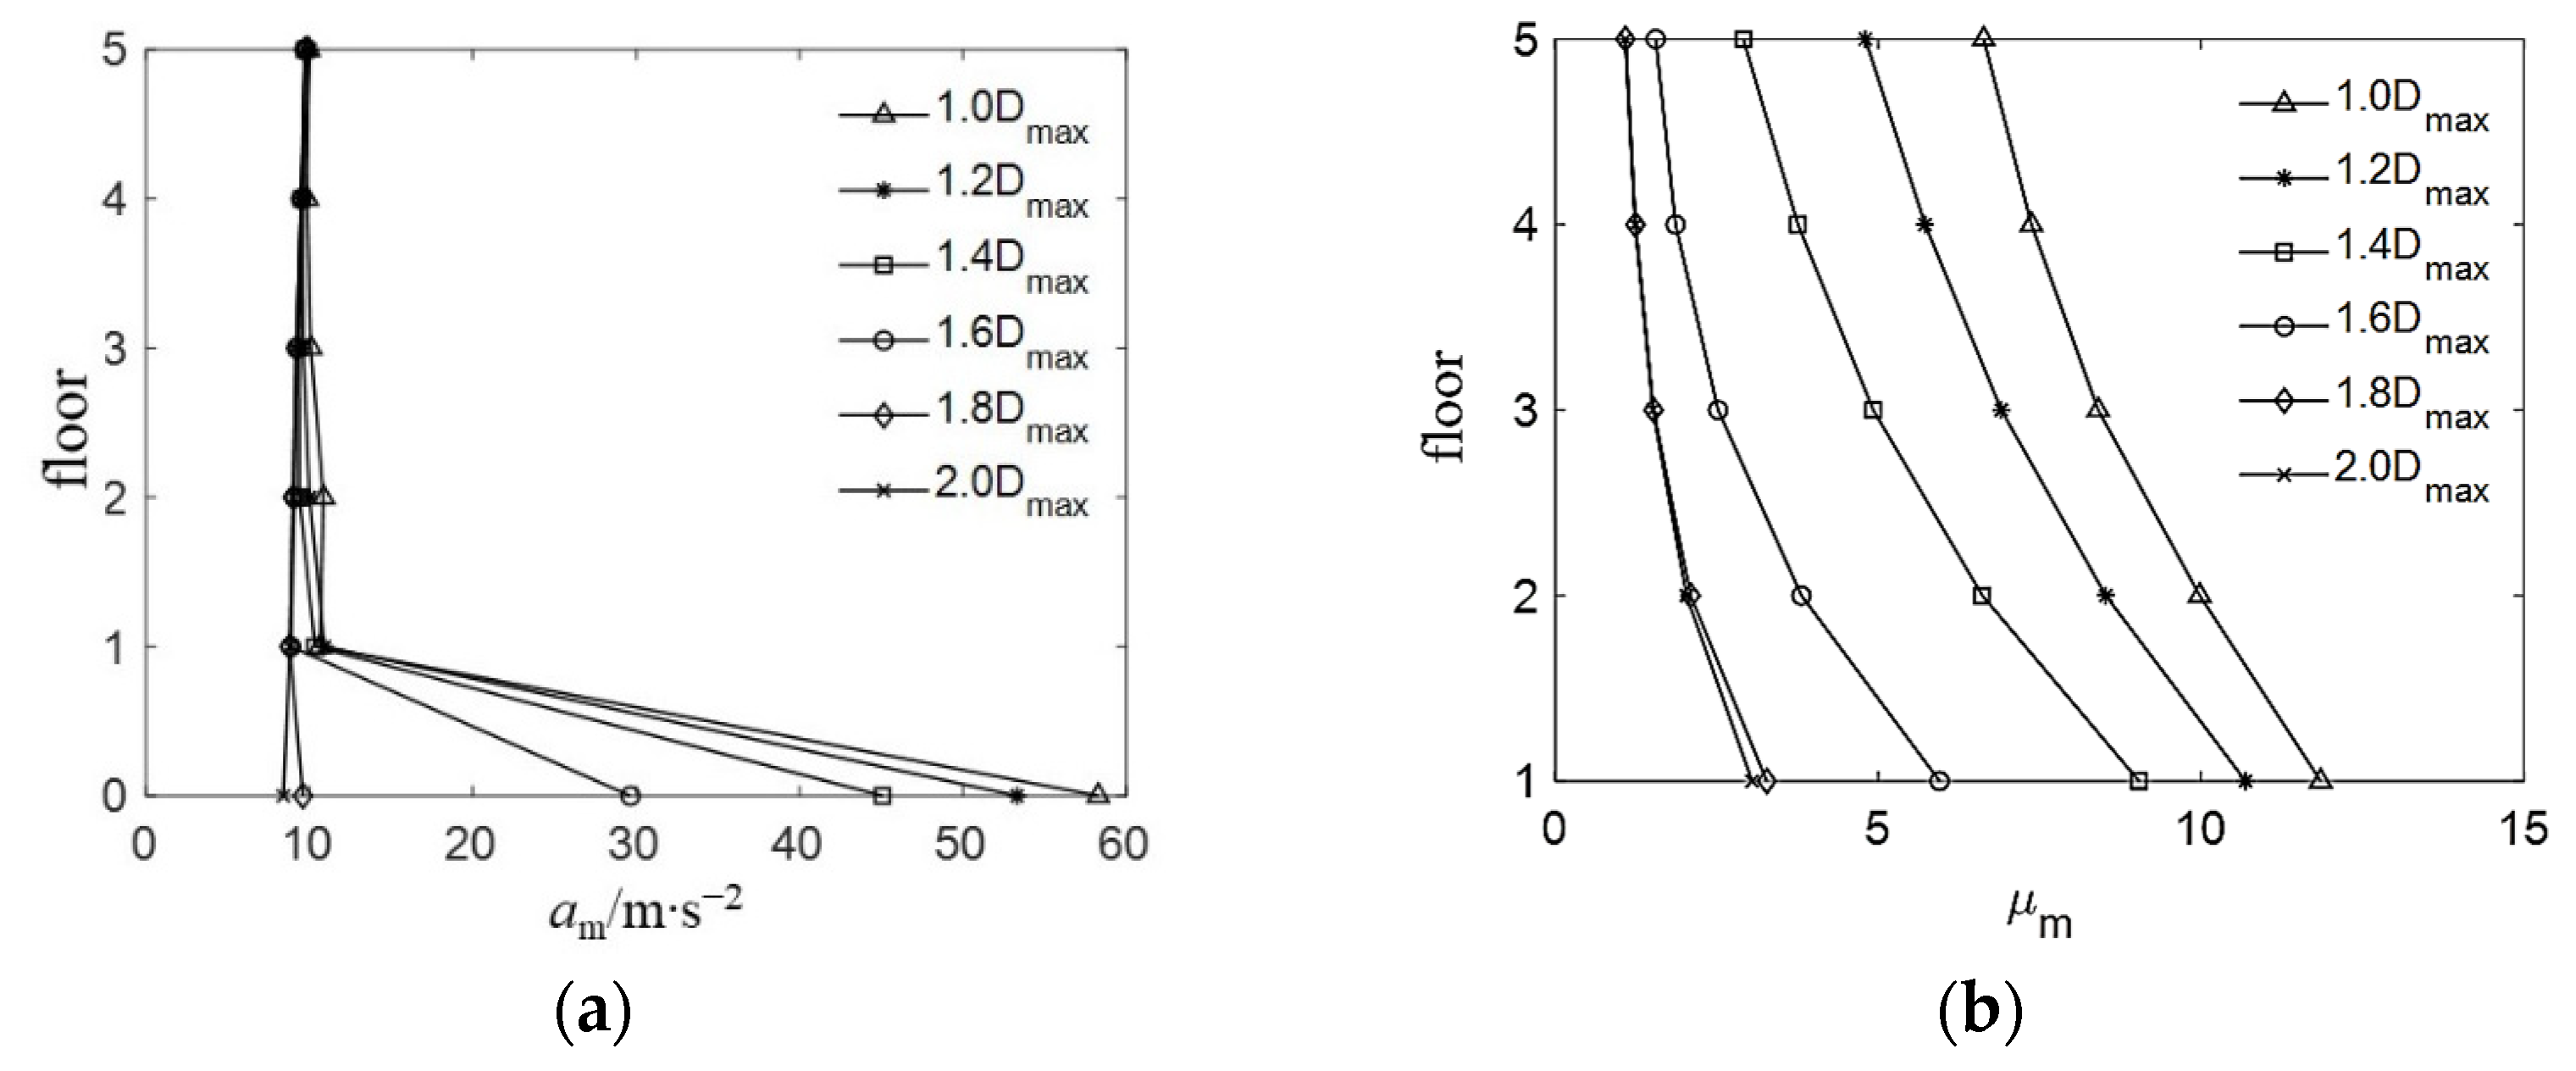
  • For the BIS system under very rare earthquakes, when the width of the isolation joint is insufficient, the moat wall can limit the horizontal displacement and shear strain of the LRB, but it may increase the acceleration response of the LRB and the ductility coefficients of the superstructure, which may cause the failure of the superstructure. The base-isolated structure with the TID may still collide with the moat wall under very rare earthquakes, but the ductility coefficients of the superstructure can be reduced to prevent the collapse of the superstructure by selecting appropriate parameters of the TID.
  • For the BIS system, when the width of the isolation joint is large, the shear strain of the LRB may exceed its ultimate shear strain, resulting in the failure of the LRB. Equipping with a suitable TID can reduce the shear strain of the LRB to not exceed the ultimate shear strain and ensure the safety of the LRB.
  • Equipping with the TID can reduce the required minimum width of the isolation joint to prevent collision. With an increase in the inertance mass ratio, the corresponding required minimum width gradually decreases.

Author Contributions

Conceptualization, X.H. and Z.H.; methodology, X.H. and Z.H.; software, X.H.; validation, X.H., Z.H. and Y.L.; formal analysis, X.H.; investigation, L.N.; resources, X.H.; data curation, X.H.; writing—original draft preparation, X.H.; writing—review and editing, Z.H., Y.L. and L.N.; visualization, X.H.; supervision, Z.H.; project administration, Y.L.; funding acquisition, X.H. and Z.H. All authors have read and agreed to the published version of the manuscript.

Funding

The research is supported by the National Natural Science Foundation of China (grant No. 52178283), the Research Foundation of AnHui JianZhu University (grant No. 2019QDZ51), and the Natural Science Foundation of Anhui Provincial Education Department-Key Project (grant No. KJ2020A0451).

Data Availability Statement

All data used to support the findings of this study are included in the article.

Acknowledgments

We would like to express our gratitude to the editor and reviewers for their valuable comments in improving the quality of this paper.

Conflicts of Interest

The authors declare no conflict of interest.

References

  1. Zhu, H.P.; Zhou, F.Y.; Yuan, Y. Development and Analysis of the Research on Base Isolated Structures. Eng. Mech. 2014, 31, 1–10. [Google Scholar]
  2. Daniel, O.; Foti, D.; Bozzo, L. Comparative study of the inelastic response of base isolated buildings. Earthq. Eng. Struct. Dyn. 2002, 32, 151–164. [Google Scholar]
  3. Kikuchi, M.; Black, C.J.; Aiken, I.D. On the response of yielding seismically isolated structures. Earthq. Eng. Struct. Dyn. 2008, 37, 659–679. [Google Scholar] [CrossRef]
  4. Zhu, H.P.; Tan, P.; Ye, K. Investigation of seismic performance of LRB base-isolated structures subjected to extremely rare earthquakes. J. Build. Struct. 2019, 40, 122–131. [Google Scholar]
  5. Huang, X.; Liu, Y.; Hu, Z. Seismic behavior of LRB base-isolated structure under extreme rare earthquakes. Earthq. Eng. Eng. Dyn. 2021, 41, 233–243. [Google Scholar]
  6. Huang, X.; Zhu, H.P. Study on impact of adjacent base-isolated structures under near-fault earthquake. J. Civ. Eng. Manag. 2011, 28, 249–253. [Google Scholar]
  7. Becker, T.C.; Bao, Y.; Mahin, S.A. Extreme behavior in a triple friction pendulum isolated frame. Earthq. Eng. Struct. Dyn. 2017, 46, 2683–2698. [Google Scholar] [CrossRef]
  8. Bao, Y.; Becker, T.C. Effect of design methodology on collapse of friction pendulum isolated moment-resisting and concentrically-braced frames. J. Struct. Eng. 2018, 144, 04018203. [Google Scholar] [CrossRef]
  9. Masroor, A.; Mosqueda, G. Experimental simulation of base-isolated buildings pounding against moat wall and effects on superstructure response. Earthq. Eng. Struct. Dyn. 2012, 41, 2093–2109. [Google Scholar] [CrossRef]
  10. GB 18036-2015; Seismic Ground Motion Parameters Zonation Map of China. Standardization Administration of the People’s Republic of China: Beijing, China, 2015.
  11. Ikago, K.; Saito, K.; Inoue, N. Seismic control of single-degree-of-freedom structure using tuned viscous mass damper. Earthq. Eng. Struct. Dyn. 2012, 41, 453–474. [Google Scholar] [CrossRef]
  12. Lazar, I.F.; Neild, S.A.; Wagg, D.J. Using an inerter-based device for structural vibration suppression. Earthq. Eng. Struct. Dyn. 2014, 43, 1129–1147. [Google Scholar] [CrossRef]
  13. Saitoh, M. On the performance of gyro-mass devices for displacement mitigation in base isolation systems. Struct. Control Health Monit. 2012, 19, 246–259. [Google Scholar] [CrossRef]
  14. De Domenico, D.; Ricciardi, G. Optimal design of a novel tuned inerter damper system for reducing the displacement demand of base-isolated structures. In Proceedings of the AIMETA 2017-Proceedings of the 23rd Conference of the Italian Association of Theoretical and Applied Mechanics, Salerno, Italy, 4–7 September 2017. [Google Scholar]
  15. De Domenico, D.; Ricciardi, G. An enhanced base isolation system equipped with optimal tuned mass damper inerter(TMDI). Earthq. Eng. Struct. Dyn. 2018, 47, 1169–1192. [Google Scholar] [CrossRef]
  16. Sun, H.X.; Zuo, L.; Wang, X.; Peng, J.; Wang, W. Exact H2 optimal solutions to inerter-based isolation systems for building structures. Struct. Control Health Monit. 2019, 26, e2357. [Google Scholar] [CrossRef]
  17. Qian, F.; Luo, Y.; Sun, H.; Tai, W.C.; Zuo, L. Optimal tuned inerter dampers for performance enhancement of vibration isolation. Eng. Struct. 2019, 198, 109464. [Google Scholar] [CrossRef]
  18. Ye, K.; Shu, S.; Hu, L.; Zhu, H. Analytical solution of seismic response of base-isolated structure with supplemental inerter. Earthq. Eng. Struct. Dyn. 2019, 48, 1083–1090. [Google Scholar] [CrossRef]
  19. Jangid, R.S. Optimum Tuned Inerter Damper for Base-Isolated Structures. J. Vib. Eng. Technol. 2021, 9, 1483–1497. [Google Scholar] [CrossRef]
  20. Liu, J.B.; Du, X.L. Structural Dynamics; Machinery Industry Press: Beijing, China, 2005; pp. 118–119. (In Chinese) [Google Scholar]
  21. GB 50011-2010; Code for Seismic Design of Buildings. China Architecture & Building Press: Beijing, China, 2010.
  22. Applied Technology Council. Quantification of Building Seismic Performance Factors: ATC-63; Applied Technology Council: Redwood City, CA, USA, 2008. [Google Scholar]
  23. SeismoSoft. SeismoMatch 2016 User Manuals [DB/OL]; SeismoSoft Company: Pavia, Italy, 2016; Available online: http://www.seismosoft.com (accessed on 10 May 2022).
  24. Priestley, M.J.N.; Calvi, G.M.; Kowalsky, M.J. Displacement-Based Seismic Design of Structures; IUSS Press: Pavia, Italy, 2007. [Google Scholar]
Figure 1. Structure model of the TID–LRB hybrid control system.
Buildings 12 01465 g001
Figure 2. Comparison of target spectra to mean response spectra of matched ground motions.
Buildings 12 01465 g002
Figure 3. (a) Mean value of maximum acceleration; (b) mean value of the maximum ductility coefficient of the BIS system under rare and very rare earthquakes ( T b = 3.0 s).
Buildings 12 01465 g003
Figure 4. (a) Mean value of maximum acceleration; (b) mean value of the maximum ductility coefficient of the BIS system under rare and very rare earthquakes ( T b = 3.5 s).
Buildings 12 01465 g004
Figure 5. (a) Mean value of maximum acceleration; (b) mean value of the maximum ductility coefficient of the BIS system under rare and very rare earthquakes ( T b = 4.0 s).
Buildings 12 01465 g005
Figure 6. Variation of the performance index R 1 against (a) f and (b) ξ t under rare earthquakes ( T b = 3.5 s, R z = 0.05).
Buildings 12 01465 g006
Figure 7. Variation of the performance index R 1 against (a) f and (b) ξ t under rare earthquakes ( T b = 3.5 s, R z = 0.1).
Buildings 12 01465 g007
Figure 8. Variation of the performance index R 1 against (a) f and (b) ξ t under rare earthquakes ( T b = 3.5 s, R z = 0.2).
Buildings 12 01465 g008
Figure 9. Variation of the performance index R 1 against (a) f and (b) ξ t under rare earthquakes ( T b = 3.5 s, R z = 0.4).
Buildings 12 01465 g009
Figure 10. Variation of mean value of TID maximum displacement and maximum force against R z under rare earthquakes.
Buildings 12 01465 g010
Figure 11. Pounding responses of the base-isolated structure without TID under very rare earthquakes ( T b = 3.0 s): (a) mean value of maximum acceleration; (b) mean value of the maximum ductility coefficient.
Buildings 12 01465 g011
Figure 12. Pounding responses of the base-isolated structure without TID under very rare earthquakes ( T b = 3.5 s): (a) mean value of maximum acceleration; (b) mean value of the maximum ductility coefficient.
Buildings 12 01465 g012
Figure 13. Pounding responses of the base-isolated structure without TID under very rare earthquakes ( T b = 4.0 s): (a) mean value of maximum acceleration; (b) mean value of the maximum ductility coefficient.
Buildings 12 01465 g013
Figure 14. Variation of mean value of LRB maximum shear strain against ds considering pounding under very rare earthquakes.
Buildings 12 01465 g014
Figure 15. Pounding responses of the base-isolated structure with TID under very rare earthquakes ( T b = 3.5 s,   R z = 0.2 ): (a) mean value of maximum acceleration; (b) mean value of the maximum ductility coefficient.
Buildings 12 01465 g015
Figure 16. Pounding responses of the base-isolated structure with TID under very rare earthquakes ( T b = 3.5 s,   R z = 0.3 ): (a) mean value of maximum acceleration; (b) mean value of the maximum ductility coefficient.
Buildings 12 01465 g016
Figure 17. Pounding responses of the base-isolated structure with TID under very rare earthquakes ( T b = 3.5 s,   R z = 0.4 ): (a) mean value of maximum acceleration; (b) mean value of the maximum ductility coefficient.
Buildings 12 01465 g017
Figure 18. Pounding responses of the base-isolated structure with TID under very rare earthquakes ( T b = 3.5 s,   R z = 0.5 ): (a) mean value of maximum acceleration; (b) mean value of the maximum ductility coefficient.
Buildings 12 01465 g018
Figure 19. Pounding responses of the base-isolated structure with TID under very rare earthquakes ( T b = 3.5 s, R z = 0.6 ): (a) mean value of maximum acceleration; (b) mean value of the maximum ductility coefficient.
Buildings 12 01465 g019
Figure 20. Variation of mean value of the TID maximum displacement against ds for very rare earthquakes: (a) T b = 3.0 s; (b) T b = 3.5 s; (c) T b = 4.0 s.
Buildings 12 01465 g020
Figure 21. Variation of mean value of the TID maximum force against ds for very rare earthquakes: (a) T b = 3.0 s; (b) T b = 3.5 s; (c) T b = 4.0 s.
Buildings 12 01465 g021
Table 1. Basic information of selected ground motions.
NumberNameRecording StationComponentAp/g
GM01Cape MendocinoCape MendocinoRIO3600.549
GM02Chi-ChiCHY01NS0.440
GM04DuzceBoluBL0000.728
GM05FriuliTolmezzoA-TMZ2700.315
GM06Hector MineHectorHEC0000.266
GM07ImperialDeltaH-DLT2620.238
GM08ImperialEl Centro Array#11H-E112300.380
GM09KobeNishi-AkashiNIS0900.503
GM10KobeShin-OsakaSHI0000.243
GM11KacaeliArcelikARC0900.150
GM12KacaeliDuzceDZC1800.312
GM15Loma PrietaCapitolaCAP0000.529
GM16Loma PrietaGilroy Array #3G030000.555
GM20San FernandoLA-Hollywood Stor FFPEL0900.210
GM21Superstition HillsEl Centro Imp. Co. CentB-ICC0900.258
GM22Superstition HillsPoe RoadB-POE2700.446
Table 2. Mean values of the maximum horizontal displacement and shear strain of the LRB under rare and very rare earthquakes.
BIS SystemRare EarthquakesVery Rare Earthquakes
um/m γ m / % um/m γ m / %
T b = 3.0 s0.235 m3130.405 m540
T b = 3.5 s0.315 m3080.543 m532
T b = 4.0 s0.403 m3030.690 m518
Table 3. Optimal parameters and the effectiveness of the TID ( T b = 3.0 s).
R Z   ξ t , o p t   f o p t Rare EarthquakeVery Rare Earthquake
γ m ( % ) R 1 μ m 1 R 2 γ m ( % ) R 1 μ m 1 R 2
0.050.051.0252990.9550.8950.9885180.9582.8050.920
0.10.10.9752910.9270.8940.9875050.9342.7230.893
0.150.150.902830.9010.8940.9874880.9042.6600.873
0.20.20.852750.8760.8900.9834750.8792.5630.841
0.250.250.852680.8550.8850.9774650.8622.4710.810
0.30.30.7752610.8340.8890.9824530.8382.4550.805
0.350.30.7752560.8150.8940.9874420.8182.4320.798
0.40.30.752490.7960.9010.9954310.7982.4400.800
0.450.30.752440.7770.9111.0054220.7812.4410.801
0.50.30.752380.7580.9221.0184120.7632.4450.802
0.60.30.752280.7260.9491.0483930.7292.4740.812
Table 4. Optimal parameters and the effectiveness of the TID ( T b = 3.5 s).
R Z   ξ t , o p t   f o p t Rare EarthquakeVery Rare Earthquake
γ m ( % ) R 1 μ m 1 R 2 γ m ( % ) R 1 μ m 1 R 2
0.050.050.9252880.9340.7750.9754940.9282.160.888
0.10.100.9252760.8980.7640.9614730.8892.010.827
0.150.100.902660.8630.7600.9564550.8551.950.802
0.20.150.8752560.8300.7480.9414360.8181.850.761
0.250.150.852470.8010.7480.9424190.7871.860.765
0.30.150.8252390.7750.7510.9454050.7611.870.769
0.350.150.8252310.7510.7530.9483900.7331.840.757
0.40.150.8252240.7280.7580.9533790.7121.830.753
0.450.200.8252190.7110.7520.9473670.6901.740.716
0.50.200.8252130.6920.7590.9553590.6741.750.720
0.60.200.8252030.6590.7710.9703440.6461.800.740
Table 5. Optimal parameters and the effectiveness of the TID ( T b = 4.0 s).
R Z ξ t , o p t f o p t Rare EarthquakeVery Rare Earthquake
γ m ( % ) R 1 μ m 1 R 2 γ m ( % ) R 1 μ m 1 R 2
0.050.051.052740.9020.6960.9484650.8981.680.834
0.10.11.0252580.8500.6740.9184340.8381.520.755
0.150.11.02440.8040.6720.9164080.7881.470.730
0.20.151.02330.7670.6580.8973880.7491.360.675
0.250.151.02240.7380.6570.8953740.7221.340.665
0.30.201.02170.7150.6460.8803630.7011.280.636
0.350.201.02110.6950.6480.8833520.6801.270.631
0.40.201.02050.6750.6520.8883430.6621.270.631
0.450.250.9751990.6550.6540.8913340.6451.260.626
0.50.250.9751940.6390.6590.8983240.6251.280.636
0.60.250.9751850.6090.6730.9173090.5971.330.660
Table 6. Mean values of the maximum horizontal displacement and shear strain of the LRB ( T b = 3.0 s).
Rare EarthquakesVery Rare Earthquakes
um/m γ m / % um/m γ m / %
BIS system0.2353130.405540
TID–LRB hybrid control system R Z = 0.1 0.2182910.378505
R Z = 0.2 0.2062750.356475
R Z = 0.3 0.1962610.339453
R Z = 0.4 0.1872490.324431
R Z = 0.5 0.1792380.309412
R Z = 0.6 0.1712280.295393
Table 7. Mean values of the maximum horizontal displacement and shear strain of the LRB ( T b = 3.5 s).
Rare EarthquakesVery Rare Earthquakes
um/m γ m / % um/m γ m / %
BIS system0.3153080.543532
TID–LRB hybrid control system R Z = 0.1 0.2832760.483473
R Z = 0.2 0.2612560.445436
R Z = 0.3 0.2442390.412405
R Z = 0.4 0.2282240.386379
R Z = 0.5 0.2172130.367359
R Z = 0.6 0.2072030.351344
Table 8. Mean values of the maximum horizontal displacement and shear strain of the LRB ( T b = 4.0 s).
Rare EarthquakesVery Rare Earthquakes
um/m γ m / % um/m γ m / %
BIS system0.4033030.690518
TID–LRB hybrid control system R Z = 0.1 0.3432580.578434
R Z = 0.2 0.3102330.517388
R Z = 0.3 0.2902170.483363
R Z = 0.4 0.2732050.456343
R Z = 0.5 0.2581940.431324
R Z = 0.6 0.2451850.411309
Table 9. Pounding responses of the base-isolated structure under very rare earthquakes ( T b = 3.0 s).
ds = 1.0Dmaxds = 1.2Dmaxds = 1.4Dmaxds = 1.6Dmaxds = 1.8Dmax
γm
(%)
am0
(m/s2)
μ m 1 γm
(%)
am0
(m/s2)
μ m 1 γm
(%)
am0
(m/s2)
μ m 1 γm
(%)
am0
(m/s2)
μ m 1 γm
(%)
am0
(m/s2)
μ m 1
Without TID32158.311.938353.310.744545.19.050529.65.95389.63.3
R Z = 0.1 32053.110.738247.09.244333.66.649215.73.75049.52.8
R Z = 0.2 31950.59.838140.78.243927.25.247012.23.04758.22.6
R Z = 0.3 31946.49.138136.46.943319.14.04538.12.44538.12.4
R Z = 0.4 31941.78.437829.35.942413.43.04318.12.44318.12.4
R Z = 0.5 31836.67.537327.85.04109.62.54128.02.44128.02.4
R Z = 0.6 31831.76.736623.54.13918.72.53938.02.53938.02.5
Table 10. Pounding responses of the base-isolated structure under very rare earthquakes ( T b =3.5 s).
ds = 1.0Dmaxds = 1.2Dmaxds = 1.4Dmaxds = 1.6Dmaxds = 1.8Dmax
γm
(%)
am0
(m/s2)
μ m 1 γm
(%)
am0
(m/s2)
μ m 1 γm
(%)
am0
(m/s2)
μ m 1 γm
(%)
am0
(m/s2)
μ m 1 γm
(%)
am0
(m/s2)
μ m 1
Without TID31564.912.437655.011.043747.49.549731.66.353210.12.6
R Z = 0.1 31456.910.937547.79.043634.85.647011.62.54738.42.0
R Z = 0.2 31450.09.737540.46.942417.13.34368.41.84368.41.8
R Z = 0.3 31447.68.637030.04.940111.72.44058.31.84058.31.8
R Z = 0.4 31340.46.935921.13.53778.82.03798.31.83798.31.8
R Z = 0.5 31035.35.534615.72.63598.31.83598.31.83598.31.8
R Z = 0.6 30528.04.333313.22.43448.21.83448.21.83448.21.8
Table 11. Pounding responses of the base-isolated structure under very rare earthquakes ( T b =4.0 s).
ds = 1.0Dmaxds = 1.2Dmaxds = 1.4Dmaxds = 1.6Dmaxds = 1.8Dmax
γm
(%)
am0
(m/s2)
μ m 1 γm
(%)
am0
(m/s2)
μ m 1 γm
(%)
am0
(m/s2)
μ m 1 γm
(%)
am0
(m/s2)
μ m 1 γm
(%)
am0
(m/s2)
μ m 1
Without TID30864.813.036964.411.742853.89.748837.26.25189.52.1
R Z = 0.1 30758.510.936849.37.642124.53.44348.41.54348.41.5
R Z = 0.2 30748.98.436128.84.53888.31.43898.31.43898.31.4
R Z = 0.3 30536.15.834916.32.43638.21.33648.21.33648.21.3
R Z = 0.4 30029.44.433311.42.03438.21.33438.21.33438.21.3
R Z = 0.5 29418.33.031610.71.93248.11.33248.11.33248.11.3
R Z = 0.6 28416.12.43019.41.83098.11.33098.11.33098.11.3
Publisher’s Note: MDPI stays neutral with regard to jurisdictional claims in published maps and institutional affiliations.

