Abstract
Soils from the superficial layers of the Guabirotuba formation (in Brazil) are problematic due to their expansive and low-bearing capacity. Stabilizing these soils with a calcium-based binder is a technique that must be explored. Therefore, this study aims to determine the mechanical behavior of stabilized sedimentary silts with cement and binder in various conditions. Four types of fine soils were used in deformed conditions. These soils were mixed with cement and compacted to measure their mechanical behavior. The specimens were tested in unconfined compressive and split tensile tests prepared with respect to several molding conditions: the moisture content, the curing period, durability cycles, the dry unit weight, the cement content, the cement type, and the soil type. This study was also carried out to develop a simplified approach to estimating the unconfined compressive strength (qu or UCS) and split tensile strength (qt or STS) of soil-cement or soil-cement–binder mixes. The results further demonstrate the influence of the porosity/volumetric cement index (η/Civ) on the qu- and qt-adjusted two new parameters—bo = 0.174 (dependent on cement) and k = 2.565 (dependent on the type of soil)—proposed herein for all mixtures studied. Using the proposed new parameters, a unique equation was developed to estimate the strength of the compacted blends as a function of the porosity and binder content, with an acceptance of 93% and an error close to 6%.
1. Introduction
Cement is one of the most widely used construction materials in the world. It has wide usage in the engineering sector with respect to infrastructure projects, residential and commercial buildings, and many more applications. In addition, cement is also utilized in soil stabilization projects. Improving the soil with cement results in an increase in strength and durability, where in return, the stabilization provides a higher bearing capacity and reduced settlement. In addition to those benefits, cement in soil reduces expansion and improves workability. The negative environmental impacts during cement production (mainly CO2 emissions) and the use of natural resources such as limestone rock have forced the soil stabilization industry to seek alternative solutions to improve the engineering properties of problematic soils. These alternatives involve the use of binders such as natural pozzolans, fibers (natural and synthetic), industrial and construction waste, and new techniques such as biocementation, biologging, and geopolymerization.
One of the widely used calcite-based natural pozzolans, gypsum, was utilized by Yilmaz and Civelekoglu [1] to stabilize swelling clay. The study’s results revealed that gypsum could be used to improve clay’s swell percent and strength parameters. Previous research findings on fiber-reinforced soils show that adding fiber results in increased soil’s peak and residual shear strengths. Among these studies, Li and Zornberg [2] reported that the incorporation of fibers into cohesive and granular soils results in an increased peak shear strength and limits post-peak strength loss. In another study, Freilich, Li, and Zornberg [3] used clay fibers and studied the undrained shear response. The authors reported that fibers homogeneously distribute stresses around the soil. Studies [3,4,5,6] studied the deformation modes of fine-grained soils and came to similar conclusions.
On the other hand, rice husks, bottom ash, and fly ash, known to be the most widely present industrial waste additives, were used to partially replace cement to stabilize clay. It was reported by Indraratna et al. [7], Xiao et al. [8], Bhurtel et al. [9], and Kumar et al. [10] that, up to specific content, incorporating those materials improves the strength and stiffness of the cemented clay. Previous scholars have conducted some necessary research on the potential utilization of marble dust as a geo-material. Most of the available literature concentrated on using marble dust and glass powder to stabilize expansive soils [11,12,13,14]. Yilmaz and Yurdakul [13] conducted a study on a soil–marble dust mixture with up to 40% marble dust. They reported an increasing strength as the amount of marble dust increased. Jain et al. [15] also reported increased strength when enhancing the soil with marble dust. They also found that the marble dust decreases the alkalinity of the soil and the plasticity index (PI). As an emerging field, 15 different types of bio-cements were reported in around 2400 publications by 2016 [16].
However, the cement continues to be one of the world’s most utilized materials, demonstrating the development of great metropolises in countries across the globe. In this way, studies regarding the soil-cement dosage necessary to employ minor amounts of cement and a decreased compacting effort in the field are necessary to help reduce the indiscriminate consumption of the binder when it is required for use in engineering works with respect to the economy, workability, access, the durability of the material, or efficiency.
Another disadvantage of cement–soil stabilization is its long-term stability. Durability is the ability of materials to withstand chemical attacks, retain their integrity and stability, and be exposed to harmful weather conditions for a long period of time [17]. According to research, cement stabilization benefits decrease during weather cycles [18]. In this regard, reducing cement use and improving durability may be an option to mitigate these shortcomings.
More recently, rational relationships were developed to control the strength development in cemented soils such as that of the cement ratio in concrete. These relationships account for the amount of cement, the porosity, and the water content of the artificially cemented soils and can give accurate results regarding the behavior of these materials [19,20,21].
Many researchers adopted and extended the approach to account for the different binders used along with cement, including various types of pozzolans. Ekinci et al. [22] successfully used the binder index (Xiv) rather than the proposed cement index (Civ) to control the strength and rigidity of cemented clay mixed with hydrated lime and copper slag. In other studies, Ekinci et al. [22] also included the wood ash volumetric content in the relationship, and Al-Subari et al. [23] accounted for the use of waste rubber powder in the mixture. Baldovino et al. [24] employed the cement index Civ to access an optimal water content of stabilized soil under several molding conditions with a similar approach. Baldovino et al. [25] combined glass powder and dolomitic lime to enhance problematic silty soil’s strength, durability, and microstructure.
However, all the previous empirical relations were developed for silty and clayey soils and did differentiate the influence of the cement type and binders on the different types of soils and variations, such as the molding conditions and curing periods, in order to adjust the parameters influencing the η/Civ with respect to the origin of the soils (i.e., residual, sedimentary, and transported). Furthermore, the split tensile strength was not studied either. Therefore, this research aims to mainly study the influence of cement in silty soils of a sedimentary origin and thus create an exclusive empirical relationship (using unconfined compressive and split tensile tests) for this type of soil as a function of the η/Civ index.
2. Materials and Methods
The experimental program was divided into two stages. The first stage involved conducting characterization tests of silty soils and cement. In the second stage, samples were molded, cured, and tested in unconfined compression and split tensile evaluations. According to recent studies on soil improvement, the unconfined compressive strength and split tensile strength tests are the most common experiments [26,27,28].
2.1. Materials
In the present study, the four materials employed were silty sedimentary soils, different types of cement, roof tile waste, and distilled water.
The soil samples were collected in a disturbed state from zones in Curitiba City (Brazil), at a depth of 2~3 m. The collected soils belong to the second and third layers of the Guabirotuba Formation, located in Curitiba, which predominantly features fine-grained soils (clays and silts). Table 1 shows the soils’ physical properties and the collection’s specifications in the field. According to the unified soil classification system (USCS), all soils used are classified as silts (MH or ML), found in different colors, ranging from pink, yellow, and brown to reddish. The collected soil specimens are shown in Figure 1, and their chemical compositions are shown in Table 2.
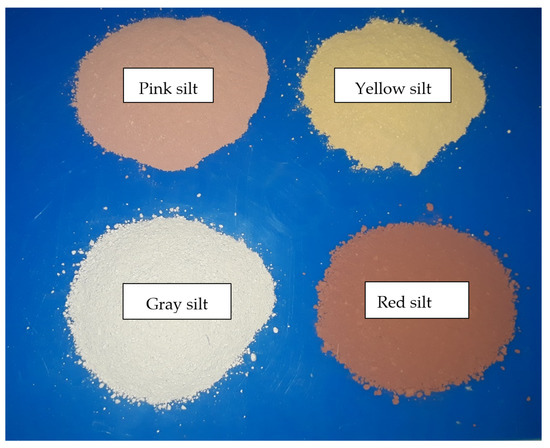
Figure 1.
Appearance and color of the silts used in this study.
Eight types of cement—produced in Brazil—used in this study were Type II, which is incorporated with pozzolanic material and possesses a low hydration heat; Type IV, which has 15% to 50% pozzolanic material, thus providing stability for its use with reactive aggregates and in acid attack environments, where it would mainly be attacked by sulfates; and Type V, which provides excellent initial strength. Brazilian types of cement follow the requirements of the standard NBR 16697 [29]. Brazilian cement is composed principally of calcium oxide (CaO), silicon dioxide (SiO2), and aluminum oxide (Al2O3). Table 3 shows the physical and chemical properties of these cements. The roof tiles (waste residue class A [30] or waste code 170103 [31] and the pink silt soil were collected from the same place and tiles were crushed by a mechanical crusher. This waste was used because it is generated in large quantities in the city of Curitiba and some other parts of the world. The percentages of RT were selected considering previous studies where residues were used up to 30% by weight. The specific gravity of crushed roof tile is 2.38. Results of the characterization tests of the crushed roof tile are presented in Table 4. Figure 2 shows X-ray diffraction analysis (XRD), which was carried out on a roof tile waste sample, and the following phases were detected: quartz (SiO2), sericite [KAl2(AlSi3O10)(OH)2], and hematite (Fe2O3).
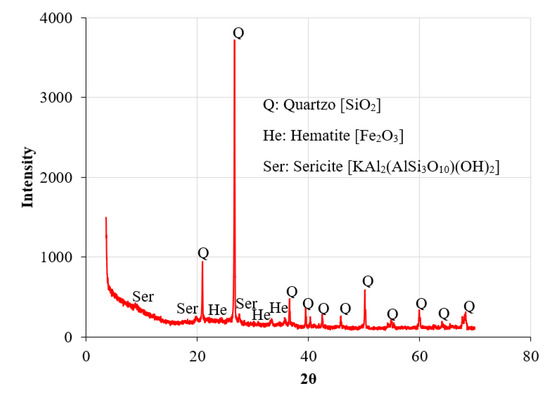
Figure 2.
X-Ray diffractometry of a roof tile waste sample.

Table 1.
Geotechnical properties of the silts and some observations of the collection.
Table 1.
Geotechnical properties of the silts and some observations of the collection.
| Properties | Value or Comment | |||
|---|---|---|---|---|
| Pink Silt | Yellow Silt | Gray Silt | Red Silt | |
| Consistency Limits ASTM D4318 [32] | ||||
| Liquid limit, % | 53.1 | 50.82 | 44.74 | 47.74 |
| Plastic limit, % | 31.8 | 35.96 | 26.43 | 33.5 |
| Plastic index, % | 21.3 | 14.86 | 18.31 | 14.24 |
| Specific gravity ASTM D854 [33] | 2.71 | 2.62 | 2.83 | 2.61 |
| Particle Size Distribution NBR 6502 [34] | ||||
| Coarse sand (0.6 mm < diameter < 2 mm), % | 0 | 5 | 0 | 2.81 |
| Medium sand (0.2 mm < diameter < 0.6 mm), % | 7.5 | 12 | 15 | 6.52 |
| Fine sand (0.06 mm < diameter < 0.2 mm), % | 25.9 | 18 | 25 | 16.38 |
| Silt (0.002 mm < diameter < 0.06 mm), % | 57.6 | 60 | 60 | 54 |
| Clay (diameter < 0.002 mm), % | 9.3 | 5 | 0 | 20.29 |
| Effective size (D10), mm | 0.0025 | 0.003 | 0.01 | 0.004 |
| Mean particle diameter (D50), mm | 0.025 | 0.038 | 0.04 | 0.034 |
| Uniformity coefficient (Cu) | 20 | 8.3 | 5.5 | 6.2 |
| Coefficient of curvature (Cc) | 0.45 | 1.3 | 1.05 | 1.2 |
| USCS Classification ASTM D2487 [35] | MH | MH | ML | ML |
| Color | Pink | Yellow | Gray | Red |
| pH in water | 3.8 | 4.2 | 4.7 | 3.6 |
| Compaction Characteristics (NBR 7182-16) | ||||
| Optimum moisture (from Proctor test), % | 28.5 | 26.5 | 27.0 | 31.4 |
| Maximum Dry unit weight (from Proctor test), kN/m3 | 13.83 | 13.72 | 14.52 | 13.95 |
| Collection site | South of Curitiba—Housing Construction | Southeast of Curitiba—Road slope | Southeast of Curitiba-qqqqqRoad slope | West of Curitiba—Building Construction |
| Depth of collection (m) | 2 | 2~2.5 | 2.5 | 3 |
| Type of collection | Manually (with the help of a backhoe) | Manually (with the help of a backhoe) | Manually | Manually (with the help of a backhoe) |
Table 2.
Soils’ chemical composition.
Table 2.
Soils’ chemical composition.
| Compost | Concentration (%) | |||
|---|---|---|---|---|
| Pink Silt | Yellow Silt | Gray Silt | Red Silt | |
| SiO2 | 53.12 | 48.78 | 49.82 | 48.30 |
| Al2O3 | 24.30 | 44.51 | 43.40 | 43.64 |
| Fe2O3 | 10.46 | 0.61 | 0.12 | 1.04 |
| CaO | 0.03 | - | - | - |
| MgO | 0.28 | - | - | - |
| K2O | 0.39 | 0.84 | 0.29 | 1.65 |
| Na2O | 0.02 | - | - | - |
| TiO2 | 1.37 | 0.92 | 0.52 | 1.04 |
| MnO | 0.17 | - | - | - |
| P2O5 | 0.22 | - | - | - |
| SO3 | - | 4.12 | 4.82 | 4.32 |
| LOI | 9.64 | 0.22 | 1.03 | 1.05 |
Table 3.
Some physical and chemical properties of cements following the NBR 16697 [29].
Table 3.
Some physical and chemical properties of cements following the NBR 16697 [29].
| Properties | Type IV—Pozzolanic Portland Cement with Low Heat of Hydration | Type II—Pozzolanic Portland Cement | Type V—Early Strength Portland Cement |
|---|---|---|---|
| MgO (%) | 2.94 | 3.68 | 4.11 |
| SO3 (%) | 2.27 | 2.54 | 2.99 |
| CaO (%) | 45.04 | 54.46 | 60.73 |
| Insoluble residue (%) | 25.62 | 11.04 | 0.77 |
| Axial resistance at 28 days (MPa) | 45.4 | 41 | 53 |
| Fineness (%) | 0.49 | 1.83 | 0.04 |
| Density (GSC) | 2.83 | 3.15 | 3.11 |
Table 4.
Physical properties of the roof tile waste.
Table 4.
Physical properties of the roof tile waste.
| Roof Tile Property | Value |
|---|---|
| Plastic index, % | Nonplastic |
| Specific gravity | 2.38 |
| Fine gravel (4.75 mm < φ < 19 mm) | 22.0% |
| Coarse sand (2.0 mm < φ < 4.75 mm) | 17.0% |
| Medium sand (0.425 mm < φ < 2.0 mm) | 12.0% |
| Fine sand (0.075 mm < φ < 0.425 mm) | 8.0% |
| Silt (0.002 mm < φ < 0.075 mm) | 29.0% |
| Clay (φ < 0.002 mm) | 12.0% |
| Mean particle (D50) | 0.20 mm |
| Collection site | South of Curitiba—Housing Construction |
2.2. Methods
The types of soil and their respective stabilizations with cement are shown in Table 5. Eight strategic blends were made with each type of silt. Each blend entails stabilization with respect to one or more cement types, molding moisture content, molding dry unit weights, curing period, and testing conditions (split tensile and compressive strength tests). In addition, each split tensile and compression test comprises 25 types of mixtures for 1802 specimens tested.
Table 5.
Molding conditions for silt-cement mixes.
Specimens for strength tests were prepared by using a stainless-steel mold with a height of 100 mm and a diameter of 50 mm by applying static compaction. The silt soils were dried in an oven at a temperature of 100 ± 5 °C and divided into uniformly dispersed portions to mix with different cement [C] and roof tile waste contents [RT] (when appropriate). The mixture of the soils with cement and roof tile (when appropriate) was prepared as homogeneously as possible. Subsequently, regarding the molding conditions shown in Table 5 and Table 6, a calculated amount of water was added to the mix.
Table 6.
Molding condition for yellow silt–cement mixes.
In order to achieve the maximum dry density during the preparation of specimens, the mold volume and weight of the proposed mixture were calculated, where quantities required for each specimen were determined. To reach the desired density, it was necessary to compact the specimens into three layers. The preparation, mixing, and compaction times of the samples were less than 10 min, thereby avoiding an early cement reaction in water. Test samples were weighted with a precision scale of 0.01 g and dimensions measured with a calibrator with an error of 0.01 mm. Once the samples were prepared, samples were taken from each specimen to determine the molding moisture content. Thus, the specimens’ initial porosity (η) was calculated using Equations (1) and (2) for cement-soil and cement-soil-roof tile, respectively:
where , , and are the specific gravity of the soil, cement, and roof tile grains, respectively. To maintain the moisture content, the specimens were covered with a plastic wrap. Finally, the curing of the specimens was achieved by storing the test specimens in a humidity chamber (see Table 6), at an average temperature of 22 °C to 25 °C, to prevent significant changes in the moisture until the day of testing. Before compression and tensile tests, to resist suction that would influence the strength response, the samples were submerged in water for 24 h to saturate the samples [19,37]. In addition, the moisture content in the soil-cement and soil-cement–RT mixes was cross-checked after each UCS and STS test. Roof tile–soil-cement specimens after splitting tensile and unconfined compressive tests are presented in Figure 3a,b. Note the shear-type ruptures during compression and tensile rupture after tension.
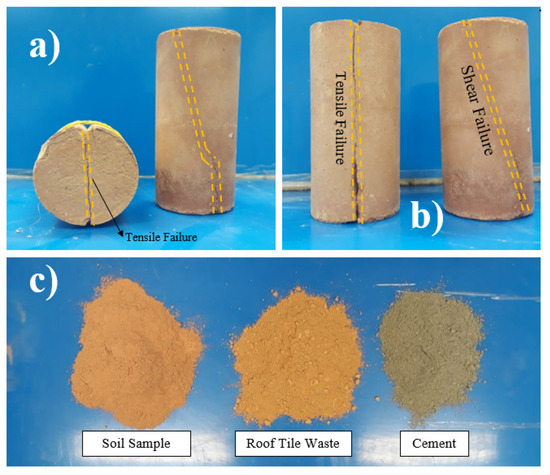
Figure 3.
Details of raw materials and specimens: (a) Specimens after splitting tensile (front tensile failure) and unconfined compressive strength tests; (b) Specimens after splitting tensile (longitudinal tensile failure) and unconfined compressive strength tests (longitudinal shear failure); and (c) colors and appearances of raw materials (soil sample, crushed roof tile, and cement).
Furthermore, samples were also prepared for tensile/compression tests after 3, 6, and 12 wet–dry (W–D) and freeze–thaw (F–T) cycles. The specimens (for F–T cycles) were removed from the humid chamber after seven days of curing. Each cycle started with freezing in a freezer for 23 h. After freezing, samples were returned to the moist chamber for 24 h. This procedure was repeated 3, 6, and 12 times. After seven days of curing in humid chamber, each cycle started with the wet cycle in a water tank for 5 h. After wetting, samples were placed in an oven at 71 °C for 42 h. After 3, 6, and 12 W–D and F–T cycles, the specimens were subjected to UCS and STS tests. ASTM D560 [38] and ASTM D559 [39] for F–T and W-T cycles were followed, respectively.
Sample dimensions with a diameter of ±0.5 mm and height of ±1 mm, dry unit weight () of ±1%, and water content (ω) of ±0.5% [40,41,42] were the errors considered while performing strength tests. To assess the repeatability of strength tests, three identical samples were produced at each molding condition, curing time, and cement content.
Automatic load frame equipped with calibrated ring to measure axial load up to 10 kN was used to perform the unconfined compression and spit tensile tests. The test was carried out using a 1.3 mm/min automated system to measure the applied force with 2.5 N resolution and 0.01 mm deformation sensitivity. NBR 5739 [43] standard was adapted to perform the unconfined compression tests. In the cases where the peak strength is not experienced, the UCS corresponds to the strength at 20% strain deformation. When the axial stress–strain curve exhibited a maximum peak in a test, the UCS (qu) was selected in accordance with the following expression:
where is the rupture load at the peak of the axial stress–strain curve and is the corrected transversal area of the test specimen. Tensile strength is an essential parameter for predicting the suitability of base and sub-base material in pavement construction. Brazilian standard NBR 7222 [44] was adopted to perform the split tensile strength tests. Split tensile strength qt was adopted in accordance with the following expression:
where is the rupture load at the peak of the diametral stress–strain curve, and D and H are the diameter and height of the test specimen, respectively [41].
3. Optimization Model: Design Parameters
To introduce a model to estimate the strength of the artificially cemented soils, two parameters of the tested specimens were considered: voids and cement volume. The voids are represented by the initial porosity (η) of the mixes (depending on the dry unit weight of the mix (γd), the cement content (C), and the unit weight of the soil and cement grains (γss and γsc, respectively)); the cement volume is represented by the volumetric cement content (Civ). Two parameters (η and Civ) form the η/Civ index. The concept of the porosity/volumetric cement content index (η/Civ) was introduced in the literature by Consoli et al. [19] based on the concept of the voids/cement index introduced by Larnach [45]. Consoli et al. [19] concluded that the mechanical resistance of stabilized soils could be calculated as a function of η/Civ, as shown in Equation (5):
Equation (1) has also been empirically extended for new geomaterials such as soil-lime [20], soil-lime-fly ash [27], and soil-cement-fiber [21]. According to Equation (5), qt and qu increase when η/Civb decreases. The value of Aq (in kPa) increases depending on the curing time, molding moisture content, and soil type. This theoretical equation was proposed by Consoli et al. [20] and da Rocha et al. [37] and verified by Henzinger et al. [27] and Baldovino et al. [41]. The exponents b and k are empirical coefficients.
In this study, to optimize the strength of all the mixtures, the criterion of the porosity-volumetric content of cement introduced by [19] was used. According to Rios et al. [46], the values of b and k vary depending on the type of binder and soil mineralogy. For soil-cement, the values of b converge at 0.28 and for soil-lime at 0.11–0.12. As verified by Baldovino et al. [41,47,48] and Moreira et al. [48] in recent studies with sedimentary silts, the values of b and k for soil-cement and lime are different from those reported in the literature (the values of b converge for 0.44 and 0.20 for soil-cement and lime-soil, respectively). In this way, this research calculates constants b and k for cement silts. Considering the studies of Consoli et al. [19,49], Henzinger et al. [27], Baldovino et al. [41], Rios et al. [46], and Hafani et al. [50], the values for b are less than the values of k. Recently, studies by Diambra et al. [51] concluded that the values of b are the inverse of the value of k (b = 1/k) for sand soil-cement mixes, taking into account the failure stress state of the composite soil-cement (sand matrix and cement phase). For this study, a similar concept was adopted, i.e., the values of b were considered a product of the constant k influenced by a bo coefficient (b = bok) taken as an optimizing parameter. Thus, a new formula for qt and qu was proposed as a function of the η, Civ, bo, and k parameters, as shown by Equation (6):
The values of η and Civ are pre-established values for each specimen through weight–volume relationships (using Equations (1) and (2)), so the values of bo and k must be calculated. To calculate the parameters bo and k, a simple optimization was used considering the molding conditions of each specimen and their respective mechanical responses. The coefficient of determination (R2) was chosen to optimize the prediction of UCS and STS. Using the exponents of adjustments bo and k help improve the behavior of experimental strength results. Thus, the optimization of the unconfined compressive strength was performed using the coefficient of determination R2 as the main parameter, given as
where qu is the experimental compressive strength of each specimen, is the theoretical or calculated compressive strength (through [19]) of each specimen, and is the average compressive strength of all experimental specimens. The optimization of the split tensile strength was determined using the coefficient of determination R2 as the main parameter, given as
where qt is the experimental split tensile strength of each specimen, is the theoretical or calculated split tensile strength of each specimen, and is the average split tensile strength of all experimental specimens. The MAPE, a statistical method to measure a prediction’s accuracy, was utilized as a verifier of the R2 values in each optimization process. During the optimization process, the optimizing parameter bo was considered an independent variable, while parameters k and Aq were considered dependent variables of bo. In turn, the pair comprising bo and k was taken as the direct influence of the value of Aq.
4. Results and Discussion
4.1. Optimizing Parameters bo and k
Figure 4 shows the optimization design of parameters bo and k as a function of the coefficient of determination (R2). The solver was run 100 times, and the best 25 results were plotted. All the results converged toward the exact solution of parameters bo and k. The best coefficient of determination and MAPE (in %) results were obtained when the values of bo and k were close to 0.174 and 2.565, respectively. The coefficients of determination of the 50 equations that controlled the strength of the mixtures reached values greater than 0.90, except for the mixtures YS + CPV + [ω = 14.67%] + STS and YS + OC + 7 − d + UCS, where coefficients of 0.88 were obtained for both. In addition, Table 7 shows the calculation of the parameters of Aq of each mixture depending on the optimization with the values bo and k used (0.174 and 2.565, respectively). According to Table 7, all mixtures are controlled by a single equation:
where Aq varies according to each mixture and is the value that potentiates the decrease/increase in strength. In addition, Table 7 shows that the values of qu and qt approach a mean value at of each mix. The MAPE values converged for an error close to 6%. The Aq parameters, on average, were higher in the mixtures made with pink silt. Therefore, these mixtures are more efficient than the others over 28 days. However, the cement content, the molding density, the curing period, and the curing conditions are variables that can improve the efficiency of a mixture of silt with respect to the mixture with another silt and with the same or another type of binder. These efficiency conditions are determined depending, for example, on the design specifications of a project where stabilization with cement could potentially be applied to manufacture earthen bricks, in the stabilization of soils for the base and sub-base of pavements, for the stability of slopes, for improving problematic soils under shallow foundations, and for earth-compacted deep foundations.
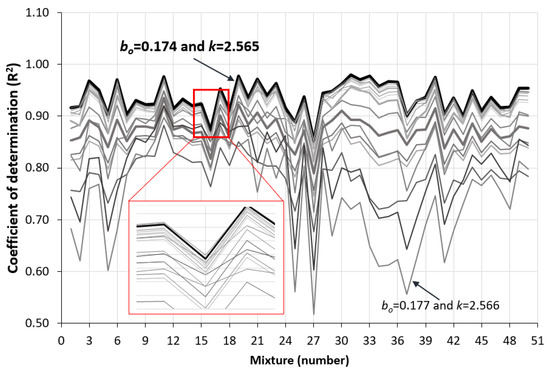
Figure 4.
Optimization parameters bo and k for all mixes.
Table 7.
Optimization for Aq parameter for each mix using the coefficient of determination/MAPE and its corresponding normalization values with the parameter .
4.2. Influence of Porosity/Volumetric Cement Content on UCS and STS
The porosity/volumetric cement content index directly influences all the mixtures’ compressive and tensile strengths, as shown in Figure 5 and Figure 6, respectively. The voids and the porosity (η) in the blends seem to have a superior influence on the unconfined compressive strength (qu) and split tensile strength (qt) rather than the volumetric content of cement. Therefore, increasing the porosity requires an increase in cement content proportional to the compensation for voids due to inadequate compaction and to maintain a constant strength.
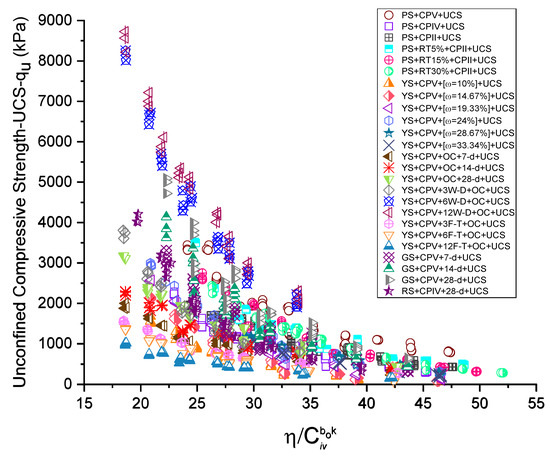
Figure 5.
Influence of porosity/volumetric cement index, adjusted at bo = 0.174 and k = 2.565, on unconfined compressive strength for several types of sedimentary silts stabilized with distinct cements and molded in several conditions of moisture using various curing times.
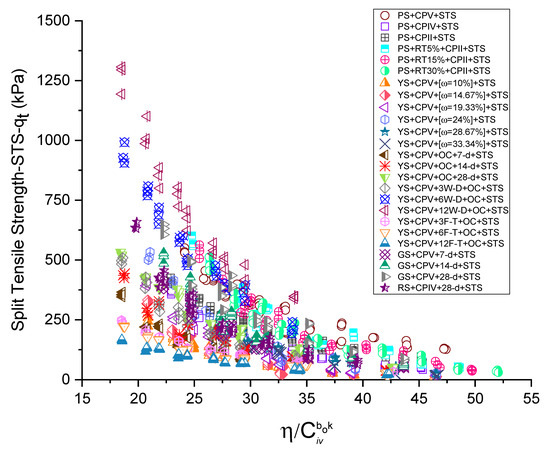
Figure 6.
Influence of porosity/volumetric cement index, adjusted at bo = 0.174 and k = 2.565, on split tensile strength for several types of sedimentary silts stabilized with distinct cements and molded in several conditions of moisture using various curing times.
Besides compression and tensile strength, it is of great interest for the construction industry to know the performance of stabilized soils in harsh climatic conditions [25]. In this study, durability was also studied in yellow silt-cement mixes. Furthermore, Figure 5 and Figure 6 provide graphs that show the influence of the porosity-volumetric cement content on the compressive and split tensile strengths for cycles 3, 6, and 12. When the mixtures were subjected to durability cycles by W–D, the strengths were higher than those reached in the standard curing period of 7 to 14 or 28 days and can be evidenced in the variation of the parameter Aq (see Table 7). When comparing Aq = 16.58 for the YS + CPV + 12W–D + OC + STS mix and the Aq = 6.01 for the YS + OC + 28-d + UCS mix, a 175% increase when employing the F–T cycles was measured. Meanwhile, the opposite happened with the strength parameters using F–T cycles in the yellow silt, where they decreased by 120% in reference to the 28-day cure.
Changes in qu and qt due to the molding moisture content and the dry unit weight in the yellow silt were also studied. The moisture content varied from 10% to 33%. Accordingly, as observed in Figure 5 and Figure 6, the values of qu and qt increased up to 28%, and after reaching this percentage, the strength parameters started to reduce. This demonstrates that the amount of water and the density regarding the reaction with the cement have great importance. In other words, to achieve the most significant strength development in terms of compressive and split tensile strength, three factors are essential: porosity, cement volume, and water quantity. This hypothesis is also valid for those mixtures compacted under optimal conditions. Therefore, compacting the yellow silt above the line ω = 28% is more convenient.
Regarding the pink silt stabilized with cement and RT, note that adding such waste material increased the mechanical response (qu and qt). However, as Table 7 shows, the values of Aq are consistent with the increase in the RT content. Such an observation might be explained by the fact that the RT is principally composed of quartz and sericite, minerals that present a more dispersed fabric (i.e., with respect to how many minerals fragment along well-defined parallel planes). Furthermore, no presence of pozzolanic/amorphous material was monitored in the RT. Nevertheless, the RT has the lowest specific gravity among the mixed materials (GSRT = 2.38) and 41% of the fines, which means a high percentage of a specific surface where RT can—in return—serve as a filler in the blend. However, in soil-cement-roof tile reactions, a portion of added cement occupies the specific surface of the RT, and a greater amount of cement will be needed to cement the surface of the roof tile in the case of an RT content increase. Thus, and considering the above, the excessive increase in the RT content for a constant percentage of cement decreases the split tensile and compressive strength, as reported by Moreira et al. [48]. Nevertheless, RT can reduce cement usage, serving as a potential environmentally friendly solution.
Gray and red silt were compacted between γd = 14 and γd = 16 kN/m3 using 23% and 25% molding moistures, respectively. The η/Civ influence on qu and qt with adjustments more significant than 90% of the specimens have an error close to 5.9%. Pozzolanic cement was added in red soil and high early strength cement in gray soil. The type of cement directly influences UCS and STS; for example, after a 28-day cure, the Aq (in kPa) value increases 60% in gray silt-cement mixes and red silt-cement mixes. Finally, comparing the silt-cement mixes after the 28-day cure (independent of ω and dependent on the porosity-to-volumetric cement content), the development of the strength was ranked from highest to lowest accordingly: gray silt + CPV (28 days), pink silt + CPV (28 days), red silt + CP IV (28 days), and yellow silt + CPV + mold moisture of 28.67% (28 days).
Cement is a hydraulic binder and a primary soil-stabilizing agent, as it is independent of the minerals available in the soil to be treated, depending only on the appearance of water, which is accessible in most soils. This is one of the main reasons why cement can be applied alone to engender the stabilizing and binding actions essential in different types of soils. Soil-cement is a mixture of soil, measured amounts of Portland cement, and water compacted to a high density. Soil-cement can be further defined as a material produced by mixing, compacting, and curing a soil/aggregate mixture; Portland cement, possibly mixtures including pozzolans; and water to form a hardened material with specific engineering properties. Typically, well-graded soils containing gravel, coarse sand, and fine sand, with or without minor amounts of silt or clay, require about 5% or less of cement by weight, while gravels require about 10% by weight of cement, sands around 7 to 12%, silts around 12 to 15%, and clays around 12 to 20% by weight of cement. The behavior of soil strength can be comprehensively understood if the three components of shear strength are well defined, namely, cohesion, dilatation, and friction. Cohesion encompasses any cementing, natural or artificial, or inter-particle bonds. The friction and dilatancy components are challenging to uncouple, but both are a direct function of the normal force operating on the shear surface. The chemical bonds between cement and mineral surfaces are more critical in fine-grained mixtures, such as soil cement, than in coarse-grained mixtures, such as concrete. The development of long-term strength in certain soil-cement mixtures is due to a hypothesis that follows the proposals of polarizing ions close to silica surfaces.
4.3. Sole Empirical Relationship Strength for Silt-Cement Mixes
The normalization of the compression and tensile strengths has been performed to propose a relationship to predict the strength parameters of the four silt soils of the Guabirotuba Formation stabilized with cement. According to this research, the compression strength (qu) and split tensile strength (qt) of soils mixed with cement can be represented in a hyperbolic way according to Equation (9). The results in Figure 5 and Figure 6 and Table 6 lead to an identical form of Equation (9), where Aq, 0.446, and 2.565 are scalar numbers dependent on the soil type and the cementing agent used for the mixes. According to Equation (9), the mechanical behavior of cement-stabilized silts soils is directly influenced by the η/Civ index adjusted at 0.446 scalars. In order to obtain the estimative equation to predict the compressive and tensile strength (UCS and STS) of the silt soils of the Guabirotuba Formation stabilized with cement, it was chosen to first establish the influence of the porosity/volumetric lime content on the compressive strength and tensile strength, as shown in Figure 4 and Figure 5. Thus, the ratio η/Civ of each of the samples subjected to the strength tests was determined. To obtain the general equation for the addition of qu and qt, the value of Civ was optimized/raised to an exponent b = bo and k = 0.446; with this mathematical operation, there is an increase in the coefficient of determination of both qt and qu. The value of 0.446 depends on the soil type and agent used during the stabilization process. The value of k was 2.565(k = 0.446/bo) with the mathematical adjustments. The values of b = bok and k are constant for each curing period, moisture content, and W–D/F–T cycle both for UCS and STS, but the value of Aq is variable in the proposed equation and increases depending on the molding condition of the mix.
If the value of η/Civ decreases, the results of qt and qu will potentially increase; if η/Civ0.446 increases, the values of qt and qu decrease. Consoli et al. [49] found this same tendency in the strength parameters with variations of η/Civ.
The equations that define the behavior of qt and qu for each curing period and that form are shown in Table 7. According to Consoli et al. [49], to find the estimative equation of the artificially cemented soils with the use of the η/Civ ratio, one must first determine all the normalization parameters with the use of a particular value, whereas in this study, such a parameter was found to be η/Civbok = Ω (omega). The value of Ω was determined within the range that represents in Figure 4 and Figure 5. The value chosen was = Ω = 35, which reveals the mean strength value for all strength tests. Thus, for the PS + CPV + UCS mix, the normalization value can be calculated as qu = 12.30·106 (35)−2.565. Solving this expression yields a value of qu = 1345 kPa. In the same manner, the other normalization values of all mixes are shown in Table 7.
After performing the normalization value’s calculation, the strength parameters were normalized, dividing the value of each test specimen’s experimental compressive strength and tensile strength by the value of the normalization parameter of its corresponding curing period. Thus, the normalization was obtained by dividing Equation (6) by an arbitrary specific value of compression and tensile strength (qu-n and qt-n), corresponding to a value of a porosity-adjusted data, = Ω, as in Equation (10):
Thus, with the value of Ω = 35, Equation (10) converts to
The normalized qu/qu-n and qt/qt-n values of the 1802 test specimens subjected to compressive and tensile strength tests have the same tendency as described in Equation (11). The values corresponding to normalized qu-n and qt-n are shown in Figure 7, with the respective trend. The normalized values obtain a coefficient of determination, R2, of 0.93, demonstrating a unique tendency of all the experimental points and normalized points, and for all curing periods/moisture content of the specimens. Therefore, if the values of experimental bo and k are applied in Equation (11), the estimation expression for the calculation of tensile and compressive strength for the studied soils (pink, yellow, gray, and red) and any molding condition is as described by Equation (11). By knowing the Ω value of a single specimen mixed with a specific soil type, cement, molding condition, and curing period, and since its respective result of qt or qu is known, the values of qt or qu for any value of can be estimated. Therefore, it is possible to use this equation to undertake projects involving soil-cement mixtures without the need for a comprehensive testing program, which is demanding with respect to both time and money.
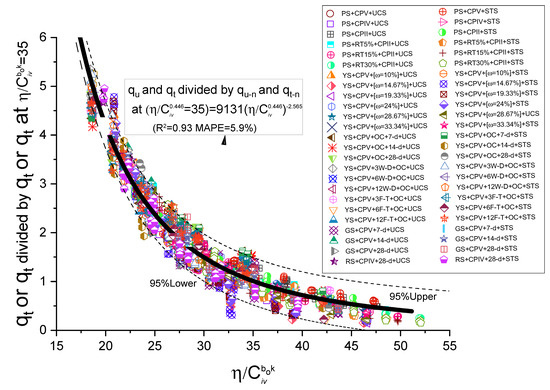
Figure 7.
Normalization of unconfined compressive strength (qu) and split tensile strength (qt) (for the whole range of η/Civ0.446) by dividing for qu and qt at η/Civ0.446 = 35 (see Table 7) considering strength of cement-treated silty soils using 7, 14 and, 28 days of curing and several types of moisture-molding content.
The porosity of the compacted blends (η) is expressed as a percentage; instead of the cement volume, the cement’s volumetric content is described as a percentage of the total volume (Civ). Thus, the index voids’ volume/cement volume becomes the index η/Civ and is inserted into the internal empirical exponent again. The dosing method presented in the present study consists of the acquisition of the porosity/volumetric cement content curve (η/Civ) as a function of the simple compressive strength (qu), called the dosing curve. Employing the dosage curve (Figure 4 and Figure 7), it is possible to establish a relationship between the porosity and volumetric cement content (or of a binder in general) that meets the strength required in the project. In this way, the designer can reasonably decide the amount of cement and compaction energy to be used, meeting the planned strength at the lowest acceptable cost. With the η/Civ index, it may also be possible to achieve compaction control in the field, enabling an increase in the amount of cement in such a way as to harmonize insufficient compaction. If a lower level of compaction than established is found, the loss of resistance resulting from this fact can be reliably estimated; therefore, corrective measures can be taken, such as the reinforcement of the layer or even the reduction of the transmitted load. Thus, it is possible to establish a rational dosage method with these empirical formulations. The high percentage of determination coefficients demonstrates the effectiveness of the model proposed in the present study. In general, the parameter η/Civ makes it possible to harmonize the effects of porosity and the volumetric content of cement with respect to the simple and diametrical compressive strength, providing a mutual equivalence between these parameters to keep the values of qu or qt constant, though different values can be assumed in the exponent.
5. Conclusions
Based on the experimental and theoretical data presented in this research, and considering the limitations of the study, the following conclusions can be drawn:
- This study developed an equation for estimating the compression and split tensile strength of cement-stabilized soil in the geological formation of Guabirotuba in Curitiba, Brazil. The equation was validated in four soft and fine soils of the formation (sedimentary silts), approximating the experimental values of 93% for adjustment and an error close to 6%. The single normalized qu and qt as a function of molding moisture content and the dry unit weights can be extended to any molding condition of the silty soils stabilized with early strength and pozzolanic cement.
- The porosity/volumetric cement content ratio (η/Civ0.446) is a parameter that influences and estimates the cement-stabilized soils’ strength studied herein. In all the soil cement mixtures, the reduction in the initial molding porosity and the increased cement quantity led to the increase in the tensile and compressive strength after several days of curing.
- Durability studies revealed that compression and split tensile strengths increased as the curing period extended when subjected to wet-dry cycles. Contrary to what has been reported for during wet-dry the cycles, the freeze-thaw results indicate that these values decreased by 120% in reference to the 28-day curing compared to earlier ages.
- Adding recycled, pulverized roof tiles to pink silt synergistically increases their strength parameters (qu and qt). However, no further increase has been monitored with the increased RT content. This observation can be explained by the presence of quartz and sericite, minerals that present a more dispersed fabric and none of the pozzolanic ingredients of RT.
- The use of recycled construction waste may result in reductions in costs and environmental impacts.
Author Contributions
Conceptualization, J.A.B. and R.I.; methodology, J.A.B. and A.E.; validation, J.A.B., R.I. and A.E.; formal analysis, J.A.B.; investigation, J.A.B.; resources, R.I.; writing—original draft preparation, J.A.B. and A.E.; writing—review and editing, R.I. and A.E.; visualization, R.I.; supervision, R.I.; funding acquisition, R.I. All authors have read and agreed to the published version of the manuscript.
Funding
This study was financed in part by the Coordenação de Aperfeiçoamento de Pessoal de Nível Superior (CAPES)-Finance Code 001, CNPq and Fundação de Araucária do Paraná in Brazil.
Institutional Review Board Statement
Not applicable.
Informed Consent Statement
Not applicable.
Data Availability Statement
No further data is available.
Acknowledgments
The authors want to thank the Federal University of Technology-Paraná for the support provided.
Conflicts of Interest
The authors declare no conflict of interest.
References
- Yilmaz, I.; Civelekoglu, B. Gypsum: An Additive for Stabilization of Swelling Clay Soils. Appl. Clay Sci. 2009, 44, 166–172. [Google Scholar] [CrossRef]
- Li, C.; Zornberg, J.G. Validation of Discrete Framework for the Design of Fiber-Reinforced Soil. In Proceedings of the Geosynthetics Research and Development in Progress, Austin, TX, USA, 24–26 January 2005. [Google Scholar]
- Freilich, B.J.; Li, C.; Zornberg, J.G. Effective Shear Strength of Fiber-Reinforced Clays. In Proceedings of the 9th International Conference on Geosynthetics—Geosynthetics: Advanced Solutions for a Challenging World, ICG 2010, Guarujá, Brazil, 23–27 May 2010. [Google Scholar]
- Tang, C.; Shi, B.; Gao, W.; Chen, F.; Cai, Y. Strength and Mechanical Behavior of Short Polypropylene Fiber Reinforced and Cement Stabilized Clayey Soil. Geotext. Geomembr. 2007, 25, 194–202. [Google Scholar] [CrossRef]
- Özkul, Z.H.; Baykal, G. Shear Behavior of Compacted Rubber Fiber-Clay Composite in Drained and Undrained Loading. J. Geotech. Geoenviron. Eng. 2007, 133, 767–781. [Google Scholar] [CrossRef]
- Ekinci, A.; Vaz Ferreira, P.M.; Rezaeian, M. The Mechanical Behaviour of Compacted Lambeth-Group Clays with and without Fibre Reinforcement. Geotext. Geomembr. 2021, 50, 1–19. [Google Scholar] [CrossRef]
- Indraratna, B.; Balasubramaniam, A.S.; Khan, M.J. Effect of Fly Ash with Lime and Cement on the Behaviour of a Soft Clay. Q. J. Eng. Geol. 1995, 28, 131–142. [Google Scholar] [CrossRef]
- Xiao, H.; Shen, W.; Lee, F.H. Engineering Properties of Marine Clay Admixed with Portland Cement and Blended Cement with Siliceous Fly Ash. J. Mater. Civ. Eng. 2017, 29, 04017177. [Google Scholar] [CrossRef]
- Bhurtel, A.; Eisazadeh, A. Strength and Durability of Bottom Ash and Lime Stabilized Bangkok Clay. KSCE J. Civ. Eng. 2020, 24, 404–411. [Google Scholar] [CrossRef]
- Kumar, A.; Gupta, D. Behavior of Cement-Stabilized Fiber-Reinforced Pond Ash, Rice Husk Ash-Soil Mixtures. Geotext. Geomembr. 2016, 44, 466–474. [Google Scholar] [CrossRef]
- Agrawal, V.; Gupta, M. Expansive Soil Stabilization Using Marble Dust. Int. J. Earth Sci. Eng. 2011, 4, 59–62. [Google Scholar]
- Ali, R.; Khan, H.; Shah, A.A. Expansive Soil Stabilization Using Marble Dust and Bagasse Ash. J. Sci. Res. 2014, 3, 2812–2816. [Google Scholar]
- Yilmaz, F.; Yurdakul, M. Evaluation of Marble Dust for Soil Stabilization. Acta Phys. Pol. A 2017, 132, 710–711. [Google Scholar] [CrossRef]
- Baldovino, J.; Izzo, R.; Ekinci, A. Strength, durability, and microstructure of lime production residue glass powder binder-based geomaterial. Acta Geotechnica. 2022, 1–14. [Google Scholar] [CrossRef]
- Jain, A.K.; Jha, A.K.; Shivanshi. Geotechnical Behaviour and Micro-Analyses of Expansive Soil Amended with Marble Dust. Soils Found. 2020, 60, 737–751. [Google Scholar] [CrossRef]
- Ivanov, V.; Stabnikov, V. Construction Biotechnology Biogeochemistry, Microbiology and Biotechnology of Construction Materials and Processes Preface. Green Energy Technol. 2017, 1, 1–317. [Google Scholar] [CrossRef]
- Dempsey, B.J.; Thompson, M.R. Durability Properties of Lime-Soil Mixtures. Highw. Res. Board 1968, 235, 61–75. [Google Scholar]
- Lu, Y.; Liu, S.; Zhang, Y.; Li, Z.; Xu, L. Freeze-Thaw Performance of a Cement-Treated Expansive Soil. Cold Reg. Sci. Technol. 2020, 170, 102926. [Google Scholar] [CrossRef]
- Consoli, N.C.; Foppa, D.; Festugato, L.; Heineck, K.S. Key Parameters for Strength Control of Artificially Cemented Soils. J. Geotech. Geoenviron. Eng. 2007, 133, 197–205. [Google Scholar] [CrossRef]
- Consoli, N.C.; Prietto, P.D.M.; da Silva Lopes, L.; Winter, D. Control Factors for the Long Term Compressive Strength of Lime Treated Sandy Clay Soil. Transp. Geotech. 2014, 1, 129–136. [Google Scholar] [CrossRef]
- Consoli, N.C.; Arcari Bassani, M.A.; Festugato, L. Effect of Fiber-Reinforcement on the Strength of Cemented Soils. Geotext. Geomembr. 2010, 28, 344–351. [Google Scholar] [CrossRef]
- Ekinci, A.; Scheuermann Filho, H.C.; Consoli, N.C. Copper Slag–Hydrated Lime–Portland Cement Stabilised Marine-Deposited Clay. Proc. Inst. Civ. Eng. Ground Improv. 2019, 175, 51–63. [Google Scholar] [CrossRef]
- Al-Subari, L.; Ekinci, A.; Aydın, E. The Utilization of Waste Rubber Tire Powder to Improve the Mechanical Properties of Cement-Clay Composites. Constr. Build. Mater. 2021, 300, 124306. [Google Scholar] [CrossRef]
- Baldovino, J.J.A.; dos Izzo, R.L.S.; Feltrim, F.; da Silva, É.R. Experimental Study on Guabirotuba’s Soil Stabilization Using Extreme Molding Conditions. Geotech. Geol. Eng. 2020, 38, 2591–2607. [Google Scholar] [CrossRef]
- Baldovino, J.J.A.; Izzo, R.L.S.; Rose, J.L.; Domingos, M.D.I. Strength, Durability, and Microstructure of Geopolymers Based on Recycled-Glass Powder Waste and Dolomitic Lime for Soil Stabilization. Constr. Build. Mater. 2021, 271, 121874. [Google Scholar] [CrossRef]
- Muñoz, Y.O.; dos Santos Izzo, R.L.; de Almeida, J.L.; Baldovino, J.A.; Rose, J.L. The role of rice husk ash, cement and polypropylene fibers on the mechanical behavior of a soil from Guabirotuba formation. Transp. Geotech. 2021, 31, 100673. [Google Scholar] [CrossRef]
- Henzinger, C.; Schuhmacher, S.A.; Festugato, L. Applicability of the Porosity/Binder Index to Nonhomogeneous Mixtures of Fine-Grained Soil with Lignite Fly Ash. J. Mater. Civ. Eng. 2018, 30, 06018013. [Google Scholar] [CrossRef]
- Silva, É.R.D.; Baldovino, J.D.J.A.; Dos Santos Izzo, R.L. Green-reinforced Sedimentary Silt with Natural Curaua Fiber. J. Nat. Fibers 2022, 1–13. [Google Scholar] [CrossRef]
- ABNT NBR 16697; Cimento Portland—Requisitos. ABNT: São Paulo, Brazil, 2018.
- Linhares, S.P.; Ferreira, J.A.; Ritter, E. Avaliação Da Implantação Da Resolução n. 307/2002 Do CONAMA Sobre Gerenciamento Dos Resíduos de Construção Civil. Estud. Tecnológicos Em Eng. 2007, 3, 176–194. [Google Scholar] [CrossRef]
- Parliament, T.H.E.E.; Council, T.H.E.; The, O.F.; Union, E. Official Journal of the European Communities. Anal. Proc. 2000, 21, 196. [Google Scholar] [CrossRef]
- ASTM. ASTM D4318-10; Stardard Test Methods for Liquid Limit, Plastic Limit and Plasticity Index of Soils. ASTM International: West Conshohocken, PA, USA, 2010.
- ASTM. ASTM D854; Standard Test Methods for Specific Gravity of Soil Solids by Water Pycnometer. ASTM International: West Conshohocken, PA, USA, 2014.
- ABNT NBR 6502; Rochas e Solos. Associação Brasileira de Normas Técnicas: São Paulo, Brazil, 1995.
- ASTM. ASTM D 2487-11; Standard Practice for Classification of Soils for Engineering Purposes (Unified Soil Classification System). ASTM International: West Conshohocken, PA, USA, 2017; pp. 1–5. [CrossRef]
- ABNT NBR 7182; Solo-Ensaio de Compactação. Associação Brasileira de Normas Técnicas: São Paulo, Brazil, 2016.
- da Rocha, C.G.; Consoli, N.C.; Dalla Rosa Johann, A. Greening Stabilized Rammed Earth: Devising More Sustainable Dosages Based on Strength Controlling Equations. J. Clean. Prod. 2014, 66, 19–26. [Google Scholar] [CrossRef]
- ASTM. ASTM D560; Standard Test Methods for Freezing and Thawing Compacted Soil-Cement Mixtures. ASTM International: West Conshohocken, PA, USA, 2016.
- ASTM. D559/D559M; Standard Test Methods for Wetting and Drying Compacted Soil-Cement Mixtures. ASTM International: West Conshohocken, PA, USA, 2015; pp. 1–6. [CrossRef]
- Consoli, N.C.; da Silva Lopes, L.; Heineck, K.S. Key Parameters for the Strength Control of Lime Stabilized Soils. J. Mater. Civ. Eng. 2009, 21, 210–216. [Google Scholar] [CrossRef]
- Baldovino, J.A.; Moreira, E.B.; dos Izzo, R.L.S.; Rose, J.L. Empirical Relationships with Unconfined Compressive Strength and Split Tensile Strength for the Long Term of a Lime-Treated Silty Soil. J. Mater. Civ. Eng. 2018, 30, 06018008. [Google Scholar] [CrossRef]
- Consoli, N.C.; Winter, D.; Leon, H.B.; Scheuermann Filho, H.C. Durability, Strength, and Stiffness of Green Stabilized Sand. J. Geotech. Geoenviron. Eng. 2018, 144, 04018057. [Google Scholar] [CrossRef]
- ABNT NBR 5739; Concreto-Ensaios de Compressão de Corpos de Prova Cilíndricos. Associação Brasileira de Normas Técnicas: São Paulo, Brazil, 2007; Volume 9.
- ABNT NBR 7222; Concreto e Argamassa—Determinação Da Resistência à Tração Por Compressão Diametral de Corpos de Prova Cilíndricos. ABNT: São Paulo, Brazil, 2011.
- Larnach, W.J. Relationship between Dry Density, Voids/Cement Ratio and the Strength of Soil-Cement Mixtures. Civ. Eng. Public Work. Rev. 1960, 60, 903–905. [Google Scholar]
- Rios, S.; Viana da Fonseca, A.; Consoli, N.C.; Floss, M.; Cristelo, N. Influence of Grain Size and Mineralogy on the Porosity/Cement Ratio. Géotechnique Lett. 2013, 3, 130–136. [Google Scholar] [CrossRef]
- Baldovino, J.A.; Moreira, E.B.; Teixeira, W.; Izzo, R.L.S.; Rose, J.L. Effects of Lime Addition on Geotechnical Properties of Sedimentary Soil in Curitiba, Brazil. J. Rock Mech. Geotech. Eng. 2018, 10, 188–194. [Google Scholar] [CrossRef]
- Moreira, E.B.; Baldovino, J.A.; Rose, J.L.; Luis dos Santos Izzo, R. Effects of Porosity, Dry Unit Weight, Cement Content and Void/Cement Ratio on Unconfined Compressive Strength of Roof Tile Waste-Silty Soil Mixtures. J. Rock Mech. Geotech. Eng. 2019, 11, 369–378. [Google Scholar] [CrossRef]
- Consoli, N.C.; Vaz Ferreira, P.M.; Tang, C.S.; Veloso Marques, S.F.; Festugato, L.; Corte, M.B. A Unique Relationship Determining Strength of Silty/Clayey Soils—Portland Cement Mixes. Soils Found. 2016, 56, 1082–1088. [Google Scholar] [CrossRef]
- Hanafi, M.; Abki, A.; Ekinci, A.; Baldovino, J.D.J.A. Mechanical properties of alluvium clay treated with cement and carbon fiber: Relationships among strength, stiffness, and durability. Int. J. Pavement Eng. 2022, 1–17. [Google Scholar] [CrossRef]
- Diambra, A.; Ibraim, E.; Peccin, A.; Consoli, N.C.; Festugato, L. Theoretical Derivation of Artificially Cemented Granular Soil Strength. J. Geotech. Geoenviron. Eng. 2017, 143, 04017003. [Google Scholar] [CrossRef] [Green Version]
Publisher’s Note: MDPI stays neutral with regard to jurisdictional claims in published maps and institutional affiliations. |
© 2022 by the authors. Licensee MDPI, Basel, Switzerland. This article is an open access article distributed under the terms and conditions of the Creative Commons Attribution (CC BY) license (https://creativecommons.org/licenses/by/4.0/).