Abstract
The essence of sustainable urbanization is to take a holistic approach to the harmonious development of economic, social, cultural and environmental protection. This paper applies the urban sustainability assessment system to analyze the characteristics of indicators related to the quality of the built environment and environmental pressure of 91 cities in four major megalopolises in China from 2010 to 2018. It also combines statistical methods to summarize the general features of urban development through a comprehensive urban performance evaluation by comparative and classification analysis for the purpose of scientific guidance on sustainable urbanization. The comparative results showed that in terms of urban sustainability, the Yangtze River Delta performed best, followed by JingJinJi, Pearl River Delta and Shandong Peninsula. Of which, the quality of built environment in JingJinJi and the environment pressure in the Shandong Peninsula require particular attention to improve and decrease, respectively. Moreover, cities can be grouped into six development types through performance clustering including three positive and three negative types. The characteristics of all types are summarized, and the performance of the specific indicators are detailed compared to serve as a guiding basis for making generic recommendations of sustainable urbanization.
1. Introduction
The urbanization trend is a consensus that is a precondition for development in the developing world [1]. By 2015, 16 of the world’s 24 megacities (cities with more than 10 million people) had located in Asia [2]. Twelve of the world’s twenty-one megacities (with more than 10 million people) are in the Asian region and are still expanding [3]. These highly urbanized areas have not only attracted significant investment but have also developed into economic centers. They have even become attractive cultural complexes with a good infrastructure and resource, making for a dynamic and diverse urban environment with potential for development [4]. However, in recent decades, the pace of population decline is faster in the rest of Asia, and growth led by a booming population is coming to an end [5,6,7]. In China, urban shrinkage has gradually become an emerging phenomenon in recent years. The research on the Chinese context is not yet comprehensive, but the existing reports show that cities in some regions are experiencing population decline, particularly in the less developed cities and border areas, and even in the most developed coastal regions [8,9,10,11,12]. Moreover, Japan, a developed country, is also experiencing significant population decline in its cities and generating many urban problems, especially in economic downturns and increased employment pressures. The population of less urbanized Southeast Asian cities, such as Thailand and Vietnam, are also likely to start decreasing earlier than expected [13]. So, many experts [8,9,10,11,13] argue that developing countries in Asia are probably going to face a longer period of lower population growth than Japan in the coming period, unless sustainable levels of urban development can be improved through effective approaches.
Since the 21st century, China has been experiencing the fastest urbanization rate in the world. The urbanization rate increased from 10.64% in 1949 to 59.58% in 2018, with an average annual growth rate of over 0.7% [14,15]. Although researchers hold different opinions on the beginning and specific stages of China’s urbanization process, most can agree that the adoption of the reform and opening-up policy and China’s urban population exceeding half of the country’s population nearly a decade ago were two important turning points in the process [16,17,18]. The period from 2010 to the present can be considered a period of accelerated urbanization due to the urbanization rate has not exceeded 70% with the possibility of further development [18]. Some urbanization responses have misled developing countries to think that they should shift most of their traditional rural population to cities, or they have over-emphasized massive investment in urban infrastructure and the development of land to build housing to accommodate more people, etc. These actions seem to have transformed the appearance of cities in a short period of time [19,20].
The superposition of various urban environmental problems is complicated and the distribution differences between regions are significant. The layout and environmental governance of megalopolises to promote urbanization, however, has become the focus of the government and researchers [21,22]. Therefore, making a coordinated plan for the larger agglomeration faces huge challenges. Effective quantitative assessment is critical for finding coping strategies in areas with complex urban environments such as China. Sustainable urbanization does not only emphasize the dynamic balance of the quality of the built environment and its environmental pressure during urbanization [23,24,25]. It goes beyond the narrow scope of urban areas into individual sustainable cities—and beyond that into the development of each megalopolis. It aims to bring about the harmonious development of different regions in the whole country. China’s large population base, its high speed of economic growth, its energy shortage and its fragile environment are key factors that must be taken into account when establishing a sustainable urbanization model with Chinese characteristics [26]. It is clear that sustainable urbanization must adhere to the national policy based of coordinated development between all parties in China.
Therefore, based on a detailed understanding of the sustainable development of the four major megalopolises, it is possible to compare and discuss the universal development characteristics of cities throughout the country so as to achieve the ultimate goal of providing a basis for decision makers to plan a national sustainable urbanization path. For this, we need a detailed understanding of the current urban performance of cities in the four megalopolises through the application of urban sustainability assessment system. Comparative and categorical analyses were conducted to extract general performance patterns for different types of cities and to make targeted recommendations. We expect that the research process and results of this study will not only provide reference for the future development of Chinese cities but can also be applied to the study of sustainable urbanization in other developing countries at the same stage.
2. Materials and Methods
2.1. Study Area
The Yangtze River Delta, Pearl River Delta, JingJinJi and Shandong Peninsula are four of 11 megalopolises that have approved Chinese government plans since 2015 (Figure 1) [27]. Among them, the first three megalopolises have gained consensus from many parties and are considered to be pioneering regions in China to promote economic, social and regional integration with strong development momentum [28,29,30]. The Shandong Peninsula has also attracted domestic and overseas attention both in terms of its international location relations and its own comprehensive strength. It is the fourth largest megalopolis in China with the most development potential after the above three megalopolises [21].
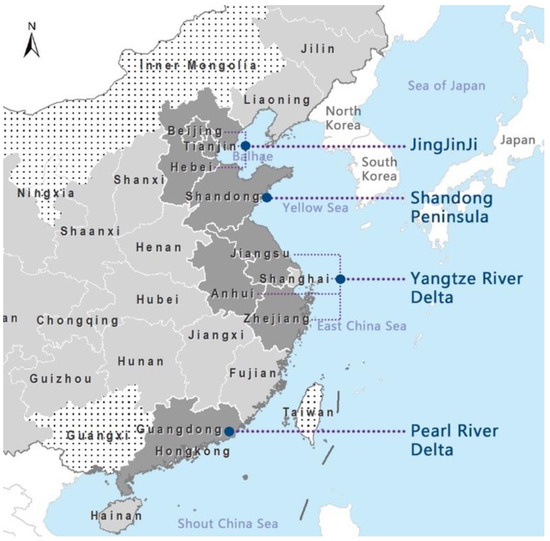
Figure 1.
The location of study areas in China.
These four comparable megalopolises have been chosen as representative for several reasons. Firstly, they have good economic foundations which is an important base for the feasibility of implementation of strategic recommendations, advanced concepts and technologies related to sustainable urbanization. This allows us to apply the results of our evaluation in a practical way. In 2018, the per capita gross domestic product (GDP) of those four regions all exceeded $10,000/person (Figure 2), and their economic strength ranked among the top five in China with the largest increase in 9 years [31,32]. The increase in Shandong Peninsula is much higher than other megalopolises. As a result of this growth, the Chinese National Development and Reform Commission explicitly calls for the promotion of a multi-level, permanent consultation and coordination mechanism for megalopolises from now on [33]. These representative megalopolises, which have entered a phase of rapid urbanization earlier, will provide rich experiences for other megalopolises that are going through or have not yet developed to the same phase. Meanwhile, the future development of these urban agglomerations deserves sufficient attention. Lastly, the locational characteristics of cities in the megalopolises were taken into consideration, leading to the identification of two northern and two southern megalopolises, each of which includes coastal and inland cities, allowing our study to be more extensive and generalized. Along with economic development and social progress, their environmental problems have become increasingly serious. Some cities have long-term pursuits of high GDP growth at the expense of ecological resource protection which has led to significant impact on the environment [34,35]. So, the study of the sustainable urbanization of these typical megalopolises is particularly necessary and valuable for replication in other regions.
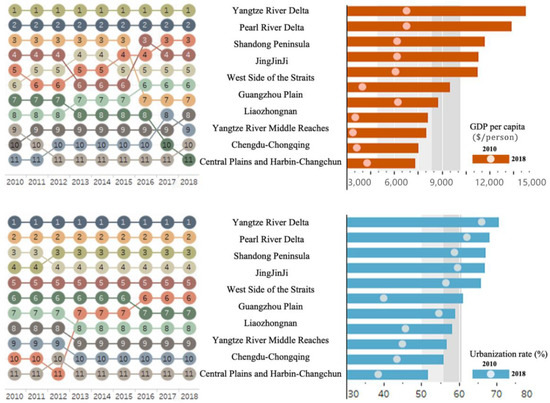
Figure 2.
Comparative analysis of GDP and Urbanization rate among 11 megalopolises in China from 2010 to 2018. (Data source: China Statistical Yearbook 2011–2019 [36]).
All applied databases for cities within these four megalopolises are derived from authoritative government statistics from 2010 to 2018 [36]. This data is available on public platforms for easy access and to allow all parties to replicate and build on their results by referencing our research.
2.2. Urban Sustainability Indicators for Performance Evaluation
To accurately compare the performance of sustainable urbanization in four typical megalopolises in China, our proven assessment system of urban sustainability has been used in this research. In it, urban sustainability is developed in the context of China’s rapid urbanization, based on sustainable development goals (SDGs) and a detailed critical literature review. It involves four dimensions of the sustainability: economic, social, cultural and environmental. This is then summarized into two main focuses, namely quality of built environment (Qu) and environmental pressures (Pu), which are two urgent concerns for achieving sustainable urbanization in China at the current time. The urban sustainability assessment system is positioned as an easy-to-understand evaluation criteria, not only to highlight the importance of these two key dimensions and to facilitate reach consensus. It is expected to be easily applied by all parties and to gain consensus for joint promotion of sustainable urban policies. For this reason, the ratio of these two categories is defined as the urban sustainability (Su), which is inspired by a classic input-output efficiency model of economics [37,38]. This means the criteria by which the degree of sustainability of the city can be measured as follows:
The selection of evaluation indicators is based on 14 existing reports on sustainable urban assessment tools formulated by the Chinese government and official scientific research institutions from 2000 to the present shown in Table 1. Moreover, several well-known international evaluation systems, such as Leadership in Energy and Environmental Design (LEED), Comprehensive Assessment System for Built Environment Efficiency (CASBEE), the City Development Index (CDI) etc., were used as reference materials for the above 14 assessment tools. Their focus, scoring methods and number of indicators of each evaluation system are different with no uniform standard. The indicator categories mostly focus on economic growth, human settlements, resource utilization, energy conservation, and environmental quality. Based on the above tools, the indicators have been simplified and sorted out as follows: (1) ranking those that appear more frequently and excluding those that appear less than 20% of the time; (2) excluding subjective indicators that cannot be objectively quantified; (3) excluding indicators for which data cannot be obtained from publicly available government platforms; and (4) merging indicators that are repetitive or have co-linearity with others. Through this process, 17 indicators were used in the assessment system of urban sustainability, grouped by subordinate categories and listed in Table 2. The quality of built environment (Qu) consists of urbanization economies (four sub-indicators), infrastructure development (four sub-indicators) and urban attraction (three sub-indicators). Environmental pressures (Pu) consist of resource consumption (two sub-indicators) and environmental pollution (four sub-indicators).

Table 1.
The general list of 14 Chinese urban sustainability assessment tools.

Table 2.
List of indicators and their weights.
2.3. Weighting Method of Principal Component Analysis (PCA)
Determining weighting criteria is important for scientific evaluation. Most scholars prefer quantitative methods that assign weights after standardizing the statistical values of relevant indicators, which can avoid excessive influence or emphasize individual subjectivity. Principal component analysis (PCA) has proven to be very effective and reasonable in some classic evaluation systems, such as the ecological footprint published by Wackernagel and Rees in 1992 [53], City Development Index published by UN-habitat in 1997 [54], etc. The weights are generally determined in two ways: one is the weight of the indicator that is equal to the weight of the variance contribution of the principal components, and the other is a normalization of the weighted average of the coefficients of the indicator in the linear combination of the principal components [55,56,57]. The application of principal component analysis in this study makes use of the principle of information condensation of data, using the former variance interpretation ratio for the weight calculation. The specific steps are: (1) preparing the standardized data using the min-max scaling method [58]; (2) calculating the principal component scores of the indicator in each category separately; (3) taking the percentage of the scores as the weight of corresponding indicator to represent its contribution to the principal evaluation category. All indicators with weighted scores are shown in Table 2 and are calculated as follows:
where is the component score coefficient matrix; is the weight of all representative indicators in each category of Qu and Pu; is the standardized statistical value of sub-indicators. Further, is the weighted score of each indicator.
2.4. Hierarchical Clustering for Comparative Analysis of Classifications
Hierarchical clustering, also known as hierarchical cluster analysis, was used to classify 91 cities in the study area for comparative analysis. It is an algorithm that groups similar objects into what are called clusters [59,60]. In theory, hierarchical clustering begins by treating each observation as a separate cluster. Each cluster is different from the others, and the objects in each cluster are roughly similar to each other. The clustering process executes the following two steps in an iterative manner. (1) the identification of the two nearest clusters, and (2) the joining of the two most similar clusters. This process of iteration lasts until all clusters have been grouped into one type. Data for cluster analysis using SPSS should be prepared as follows: (1) the rows are the observations (individuals) and the columns are the variables; (2) all missing values, if any, in the data must be deleted; (3) the data must be standardized to make the variables comparable [61,62,63].
where is the center of cluster i, and ni is the number of points. Δ is the combining cost of joining the clusters of A and B.
3. Descriptive Statistics Analysis of Urban Performance Indicators
To understand the development of each of the urban environment indicators before assessment, the most important megalopolises (Yangtze River Delta, Pearl River Delta, JingJinJi and Shandong Peninsula) and the highest administrative level cities in China (Beijing and Shanghai) were extracted and analyzed together with China’s average data (except autonomous regions). All data are the national statistical data from 2010 to 2018, originally collected from the China Statistical Yearbook (2011–2019) and publicly available on government websites.
3.1. Urbanization Economies
Since the establishment of megalopolises in the 2000s, the Pearl River Delta, the Yangtze River Delta and the JingJinJi have grown rapidly in a stable urbanization process since before 2010 (Figure 3). This is the result of guidance from the national authorities and the most developed first-tier cities (Beijing, Shanghai, Guangzhou and Shenzhen), which are densely populated agglomerations with enormous economic and political influence. Although the start time of the Shandong Peninsula’s development is far behind other megalopolises, the growth of the urban population is quite significant after the opening up, especially with the implementation of the outline of urbanization development starting in 2012 [64], and the level of urbanization in the city surged within a year. All four metropolises have reached the upper middle ranking of the world economy since 2014 with a GDP per capita of over $10,000/person. The economic status of Yangtze River Delta and Pearl River Delta cities are relatively better and the GDP per capita, and have been in excess of the average national level for a long time. The economic divide between China’s lagging north and its booming south is rapidly widening, due to rapid gains in export trade and high-tech industries in southern cities during accelerated urbanization [65]. The economic development speed of Shandong Peninsula and JingJinJi are about the same. The slowdown in the growth of the secondary industry and the decline in investment demand caused the overall slowdown of economic growth in China around 2015, then the economy returned to a state of rapid growth. Although the proportion of China’s tertiary industry is increasing year by year and approaching 50%, it still lags behind the world average of 63.0% (statistical value in 2017). The unsatisfactory development of the service sector leads to a lag in the transformation of the employment structure and a low urbanization level [66].
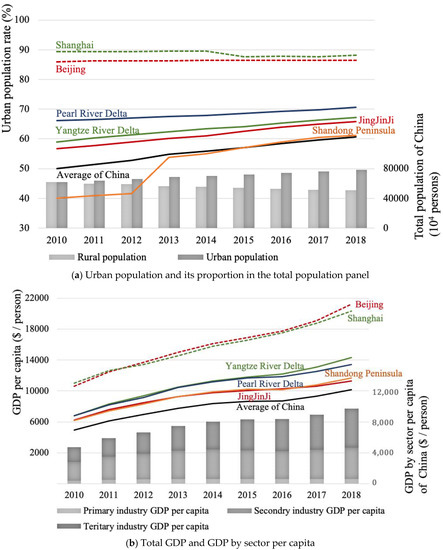
Figure 3.
The trend of urbanization economies in China from 2010 to 2018. (Data source: China Statistical Yearbook 2011–2019 [36]).
3.2. Infrastructure Development
Over the past 30 years of reform, China’s infrastructure stock has ranked first in the world through moderately advanced large-scale infrastructure construction. In particular, the level of infrastructure development in the four megalopolises is generally higher than China’s average, but in JingJinJi it is relatively insufficient (Figure 4). Despite almost 30% of infrastructure investment being spent on building railroads and highways, urban transit infrastructure is still underdeveloped in many cities of these megalopolises [67]. The area of construction land per capita in China just exceeded the world average in 2014, but there is still a gap of nearly twice as much residential area per capita as in developed countries [68]. With the influx of urban population in a short period of time, a series of problems have emerged, such as insufficient public activity space, inconvenient transport networks, inadequate housing supply, etc. There is a significant decline in GDP shown in the figure at around 2014, especially in the first-tier cities. Moreover, the residential land area has not increased significantly in the past 9 years. According to the 2010 census, the per capita housing area of 55% of Chinese households is less than 30 m2. The per capita housing area in the more developed areas of the southeast coast is relatively low, and the demand for housing improvement is growing stronger. The good phenomenon is that there has been a growing awareness of the ecological and social value of urban green spaces in recent years [69,70]. Despite the fact that cities are still under great pressure from construction, they are attempting to increase green space such as the “plant where possible” policy implemented in Beijing [71]. However, the energy consumption during infrastructure development cannot be ignored for the changing lifestyle expectations and demographic trends, especially the demand for household energy demand.
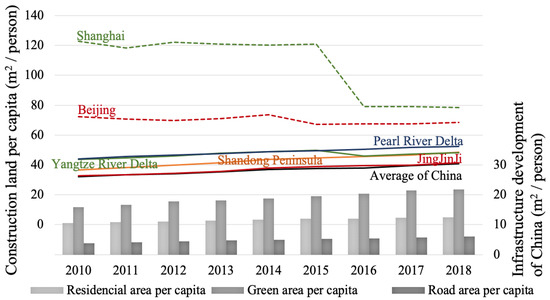
Figure 4.
The trend of infrastructure development in China from 2010 to 2018. (Data source: China Statistical Yearbook 2011–2019 [36]).
3.3. Urban Attraction
Foreign direct investment (FDI) in a country, attracting high-quality human resources and advanced technologies, is a key indicator that could represent the environmental improvement of the innovation and technology industry to some extent [72,73]. It is pointed out that an attractive investment environment is one of the most essential conditions for the promotion of FDI. With the support of a series of policies to stabilize foreign investment, the four megalopolises have increased their exposure to the world and enhanced their attractiveness to foreign investment and are now all exceeding the Chinese average shown in Figure 5. In particular, the FDI in the Yangtze River Delta is two to four times higher than in other regions in 2018, thanks to the pioneering planning for the international financial center, making a free and convenient environment for investment, trade and transportation [74]. The measures include a further reduction in investment restrictions and continued optimization of the investment conditions. Foreign trade growth has declined or grown slowly, mainly due to two shifts: (1) consumption has transformed from physical to service consumption; (2) attractive products have changed from resource-consuming and sloppy products to technology-intensive and high-performance products since 2015. In 2016, driven by policy measures such as the reform of the commercial system and the reduction in foreign investment restrictions, foreign-invested companies showed a rapid recovery. However, they immediately fell back in JingJinJi and Shandong Peninsula regions mainly due to low income and technological innovation industry trade protections. In addition, investment in tourism is seen as a strategic industry. The extent of its development can directly reflect a city’s potential to shape its cultural identity and the attractiveness of international cooperation.
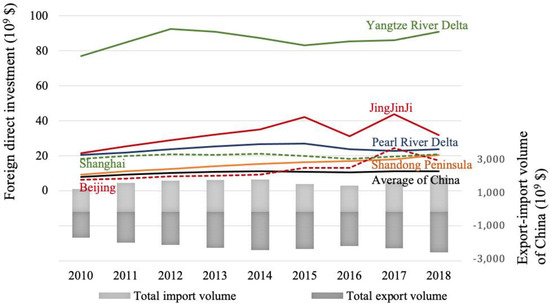
Figure 5.
The trend of urban attraction in China from 2010 to 2018. (Data source: China Statistical Yearbook 2011–2019 [36]).
3.4. Resource Consumption
Figure 6 shows that there is a significant linear relationship between energy consumption and GDP. The Shandong Peninsula is the largest resource consumption megalopolis in China. The intensity of its energy extraction far exceeds that of other regions and the output is already exceeding storage. This kind of massive consumption of resources is a detrimental factor to sustainable urbanization. It is followed by JingJinJi, whose energy intensity is also greater than the average level of China, but it is already being controlled and beginning to decrease. From the national average curve, the value of energy consumption per capita began to decrease when per capita GDP was USD 10,000, similar to the environmental Kuznets curve [75]. The results of the third economic census in 2010 showed that the energy consumption intensity of the transportation, storage and postal industries was 1.35 tons of standard coal per CNY 10,000, which has surpassed other industries to become the sector with the highest energy consumption intensity. Therefore, in the Yangtze River Delta and Pearl River Delta regions where these industries are prominent, their energy intensity continues to rise and even grow faster. In contrast, the pressure on water consumption improves when the GDP reaches USD 7000–10,000 per capita in both China and its four megalopolises. However, the Yangtze River Delta, where high-tech industries are concentrated, is over-intensive in water consumption. Although the efficiency increased, much more water is consumed for economic growth than is saved. Its water stress is extremely higher than other megalopolises. In comparison, the intensity of water resources in the other three megalopolises is lower than or close to the national average due to different industrial structures, lack of water resources or water conservation concerns, etc.
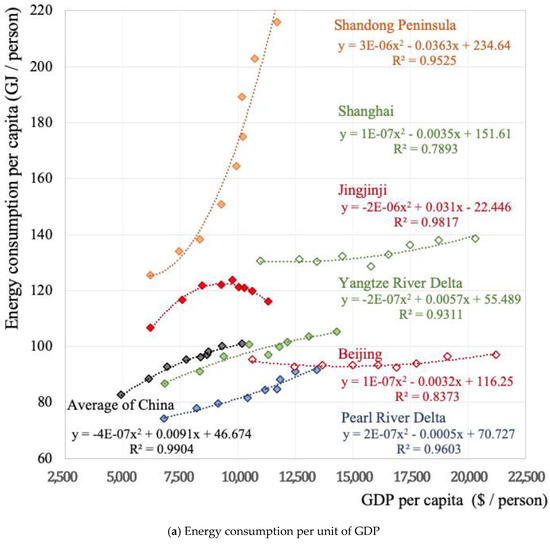
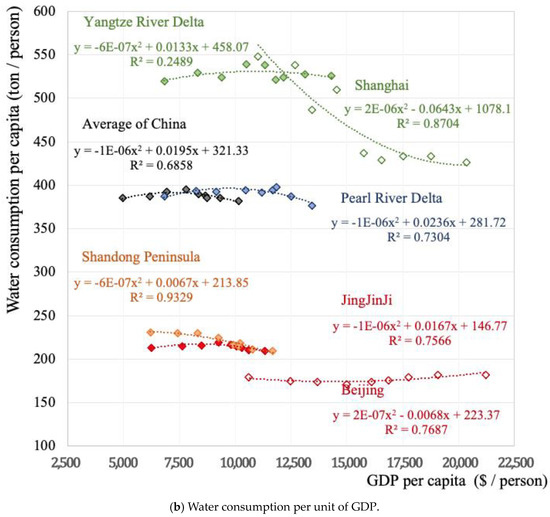
Figure 6.
The trend of resource consumption in China (each point represents an average value of the variable for the cities in that group for each year in the data set from 2010 to 2018). (Data source: China Statistical Yearbook 2011–2019 [36]).
3.5. Environmental Pollution
The enjoyment of a healthy environment has been recognized as a human right by the UN General Assembly in the face of environmental pollution and climate change [76]. The Chinese government’s policy to deal with water quality issues mainly relies on strengthening monitoring capabilities and enforcement mechanisms. As early as 1986, the “Regulations on Technical Policies for the Prevention and Control of Water Pollution” were promulgated. In addition, the “Water Pollution Law,” distributed in 2008, tried to increase the effect of early legislation by increasing penalties [77,78]. When the GDP reaches about USD 10,000/person, wastewater discharge intensity begins to decline in most regions of China (Figure 7). Although the national average wastewater discharge intensity is low, the wastewater discharge intensity remains high in the Yangtze River Delta and the Pearl River Delta, especially in their large coastal cities. The JingJinJi and Shandong Peninsula regions with more inland cities have better sewage control than the national average. Since the Chinese government promulgated “Ten Articles on Air Quality” in 2013, the overall national air quality has been improved [79], especially the air pollution far lower than the domestic average in Yangtze River Delta and Pearl River Delta. Most cities have made active efforts to control emissions of harmful pollutants such as SO2, NOx, soot and dust by upgrading detection and filtration technologies and using clean energy. In Yangtze River Delta and Pearl River Delta, the air pollution is far lower than the domestic average. As the curve shows in Figure 7, SO2 emissions are in a rapid decline across urban agglomerations, with their peak emissions all occurring when the GDP reached about USD 7000/person. From the data released by NASA in 2018 [80], China remains the third largest emitter of SO2 in the world, and environmental pollution still cannot be ignored.
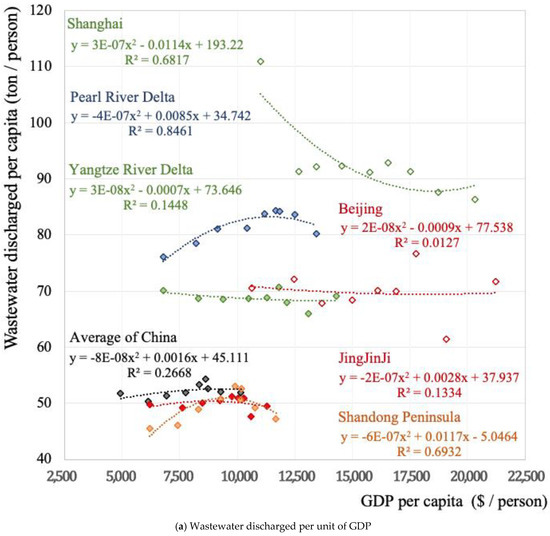
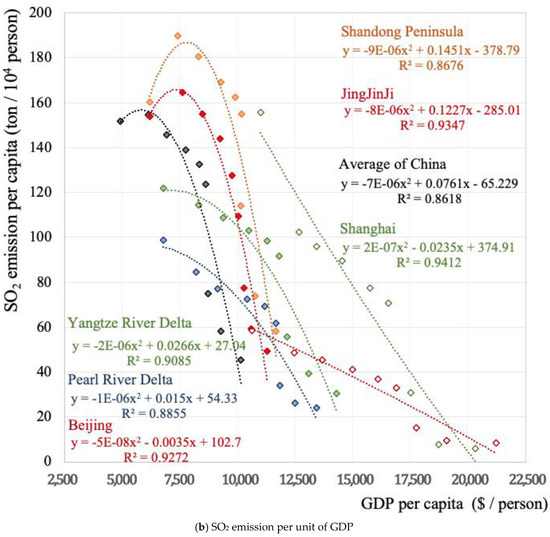
Figure 7.
The trend of environmental pollution in China (each point represents an average value of the variable for the cities in that group for each year in the data set). (Data source: China Statistical Yearbook 2011–2019 [36]).
4. Comparative Assessment Results with Classification Analysis
4.1. Assessment Results Analysis among Four Megalopolises
Rapid urbanization makes rapid economic growth in emerging economies and cities play crucial roles in driving megalopolises’ development. In terms of the quality of the built environment (Figure 8 and Table 3), all four megalopolises show continuously positive trends from 2010 to 2018 with a steady growth rate. The Qu score in Pearl River Delta was 0.182 in 2010 and 0.262 in 2018, always staying in the leading position. It is followed by the Yangtze River Delta, Shandong Peninsula, and JingJinJi. Although the ranking of the cities has not changed in 9 years, the growth rates of the Shandong Peninsula and the Yangtze River Delta are relatively fast, as seen from the slopes of their regression lines. Their compound annual growth rate (CAGR) reached 7.31% and 6.04%, respectively. The gap between the top three megalopolises is getting smaller, but the gap between them and JingJinJi (in fourth) is increasing. Geographically, the southern regions of China have generally prospered whereas the northern regions have lagged, and the gap between them will likely continue to increase in the coming years. This is due to the dynamic economic activity in the south, which has created a boost to urban development. However, despite their abundance of resources, the northern regions have been adversely affected by slower fixed investment, transformation, and upgradation. Therefore, it is still necessary to deal with horizontal disparities in domestic regions, as they have huge implications for sustainable growth and the corresponding policymaking.
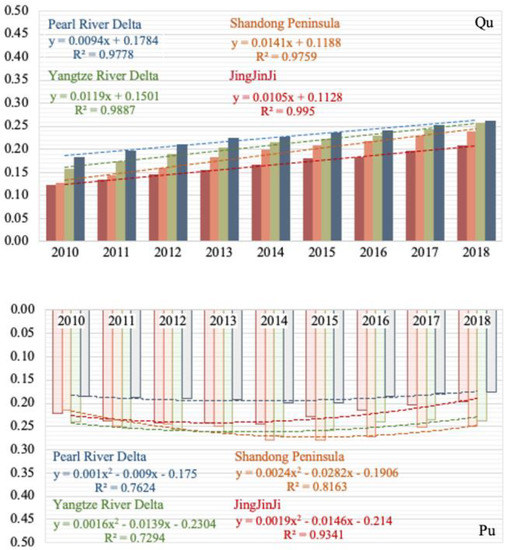
Figure 8.
Data comparative analysis of Qu and Pu among four megalopolises.

Table 3.
Data comparative analysis among four megalopolises.
From the comparison of Pu (Figure 8 and Table 3), one can see that the current environmental pressure of the Pearl River Delta megalopolis is the smallest and is significantly better than other megalopolises, followed by JingJinJi, Yangtze River Delta and the Shandong Peninsula in 2018. The U-shaped regression characteristic indicates that the environmental pressures of the four megalopolises increase with time at the initial of the study period, but later these pressures diminish, starting just before 2016. Among them, the upward shift of the JingJinJi and Pearl River Delta regions occurred earlier, probably around 2012. The Yangtze River Delta and the Shandong Peninsula occur relatively late, resulting in a more significant gap between the two sets of regions. From the perspective of environmental pressure alleviation trends, JingJinJi has seen the fastest environmental improvement, with an average annual compound decline rate of 1.4%. Other regions are less than 1%. The regional cooperation in JingJinJi proved to be an efficient governance model for the protection and restoration of ecosystems and the prevention and control of pollution. However, the environmental load of the Shandong Peninsula, which has relied on heavy industry, has increased during this time period. The ranking of the Shandong Peninsula has changed from third to first in 9 years, indicating that its urban environmental problems have become increasingly prominent.
4.2. The Sustainability Performance Clustering Classification
According to sustainability performance analysis, the 91 sample cities are formed into 6 clusters by using the hierarchical clustering of Ward Linkage Method, which was originally presented in 1963 [81]. From the dendrogram, different characteristics of these six clusters of cities emerge, which we could summarize into six different cluster types (Table 4 and Figure 9). Furthermore, when considering the sustainability performance combined with the results in Figure 10, it can be seen that the six types are:

Table 4.
List of cities by sustainability performance clustering classification.
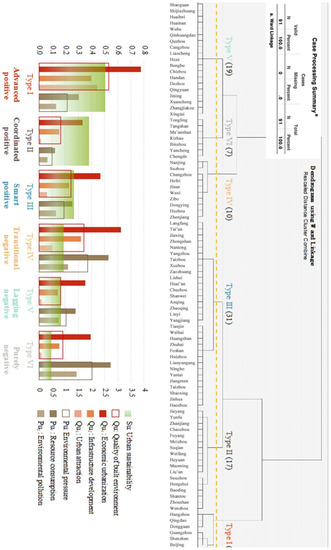
Figure 9.
Result of hierarchical Clustering and comparison of the mean evaluation scores of each indicator categories among six types of cities in 2018.
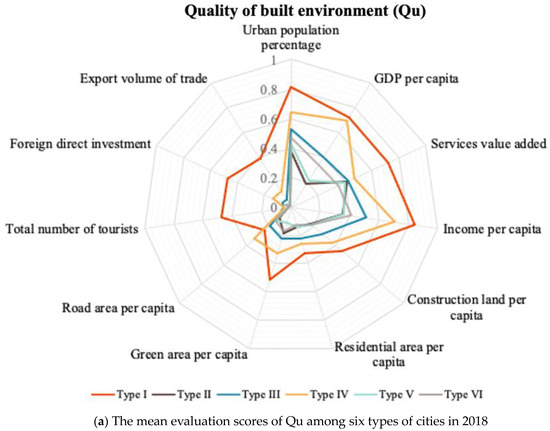
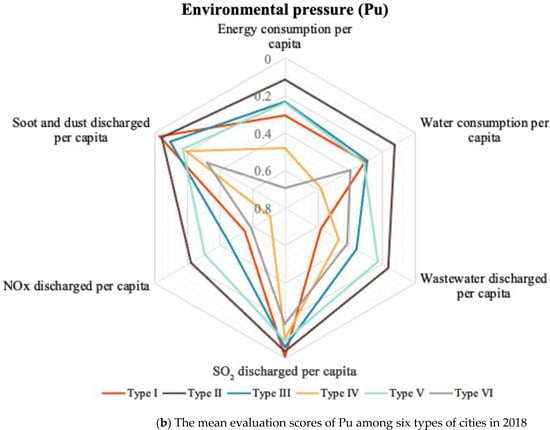
Figure 10.
Comparison of the mean evaluation scores among six types of cities in 2018.
- (1)
- Advanced positive type: there are seven cities in this type, including Shanghai, Beijing, Shenzhen, Guangzhou, Dongguan, Qingdao and Hangzhou. These cities have advanced economies with high urbanization and high-level administrative division. This cluster has the highest Qu points among all these six types, and the Pu points are relatively low. Therefore, the difference between Qu and Pu is significant and the sustainability performance is remarkable. The reason is that most of China’s mega cities are included in this type, such as Beijing, Shanghai and Shenzhen. Their urban population, GDP and income are incredibly high compared to other cities. The control of SO2 discharge, soot and dust discharge, water and energy consumption is done well, which makes those cities grow efficiently and sustainably. Such cities are on the right track and would likely continue to have high performance in the near future. Cities such as Beijing, Shanghai and Shenzhen are already recognized as international mega cities with world-leading infrastructure and outstanding urban attractiveness, and their aggregation attracts young talent which further improves the GDP and incomes, etc. These cities should be aware, however, of the additional challenges they are about to face, which need to be carefully handled. These challenges include the inadequacy of residential areas, green spaces and infrastructure. For cities such as Hangzhou, Qingdao and Dongguan, industrial upgrading will be a priority, as well as how to increase their GDP and income while effectively controlling their NOx emission and wastewater discharges.
- (2)
- Coordinated positive type: there are 17 cites in this type, which can be represented by Wenzhou, Zhoushan, Shantou, Liu’an, Maoming, Heyuan and Weifang. These cities are in a well-coordinated but relatively low position in terms of urban quality and environment. It has the lowest Pu value among all six types, even though its Qu value is low, but the combined values are positive and the sustainability performance is remarkable. Most cities in this type are small, or are sub-cities to mega cities with quite a clear function. For this reason, there is not much pressure from political leaders, and the GDP value is low. However, the SO2 discharge, soot and dust discharge are highly controlled, making their sustainability performance outstanding. Most of these cities are non-heavy industry based, for example the modern agriculture industry in Weifang or the world-famous small commodity trading market for Wenzhou, etc. Their reasonable industrial structures make them even more sustainable than most of those larger cities. Despite their low population, GDP and income, they will maintain a high performance in sustainable development if they remain in control of environmental pressures and manage their industrial structure.
- (3)
- Smart positive type: there are 31 cities in this type (the largest number of cities of any type). Some of the representative cities are Haozhou, Jinhua, Shaoxing, Ningbo, Weihai, Tianjin, Jiaxing, Tai’an, etc. Both Qu and Pu values for this type are at a moderate level, but there are subtle differences between the two dimensions in this type of city, meaning that the sustainable performance of these cities is still in a positive state of development. These cities are steadily improving, with joint implementation of urban construction and environmental control strategies. Most of them are the middle cities of China. Although their statistics values vary, the urban population, GDP, services, and incomes are generally high enough, whereas the SO2 discharge, soot and dust, energy consumption, etc., seem to be well controlled. Their status, however, is still sensitive. Compared to cities in Type I, their Qu values are much lower, and Pu are relatively high. Therefore, cities such as Tai’an and Huangshan should make full use of their tourism resources to develop non-heavy industries and reduce environmental pressures. Some other cities need to focus on controlling environmental pressures, such as Xuzhou, Foshan, Ningbo and Linyi. Other heavy industries, such as Linyi’s building materials and panels industry, need to be upgraded to more green industries such as Ningbo’s petroleum processing and coking industries in order to maintain a more positive sustainability performance.
- (4)
- Transitional negative type: there are 10 cities in this type, include Nanjing, Suzhou, Changzhou, Hefei, Jinan, Wuxi, Zibo, and Dongying, etc. These cities are in the process of industrial transformation and upgrading but are relatively developed. They have very high Qu values, but at the same time have a significantly high value of Pu. The absolute value of Qu is not enough to cover the Pu value, which makes its sustainability performance low. Most of the cities in this type are heavy industry cities, such as Suzhou, Zibo, Dongying, etc. Although their positive efforts to contribute to the city’s GDP have resulted in a relatively good population, income and road infrastructure, the problems of environmental pollution caused by heavy industry are significant. This is especially true for excessive emissions of Nox and excessive energy consumption, which have resulted in these cities having higher Pu values than Qu values. For this type of city, a heavy industry is a double-edged sword for their sustainability performance. On the one hand, the industries have created more income and jobs and given the cities a higher Qu value. On the other hand, they have had a huge negative impact on the environment. Based on this, their priority should be to focus on the control of environmental pressure. For example, Zibo and Dongying require comprehensive industrial restructuring and upgrading, including reduction in the traditional fossil energy consumption and actively laying out new energy sources such as wind and solar power, etc.
- (5)
- Lagging negative type: there are 19 cities in this type, including Shaoguan, Shijiazhuang, Huaibei, Heze, Xingtai, etc. The sustainability performance of this type of city is relevantly low, with the lowest Qu values and slightly higher Pu values than other types. These cities are mostly small or middle-sized cities and have for a long time lagged behind in their environmental governance capacity. They particularly lack urban attractiveness and infrastructure development, although the cities are of medium population, GDP and income. These cities also have high environmental pressures from Nox emissions and energy consumption, causing their future sustainable development to be of concern. As a result, cities with medium amounts of urban development have faced the same situation as some negative mega cities. They have similar Qu values to some positive cities, but it is not well controlled enough to combat the high Pu values that make their sustainability performance overall negative. Therefore, the suggested solution would be to make proper policy for their city’s industrial development, especially the heavy industry-based cities such as Shijiazhuang and Handan. It is heartening to see that some cities are embarking on more green industries, such as the city of Dezhou which has been working hard to develop the largest solar industry in recent years. This is the beginning of a good trend that will help turn negative performance into positive performance in the near future.
- (6)
- Purely negative type: there are seven cities in this type including Tongling, Tangshan, Ma’anshan, Rizhao, Binzhou, Yancheng and Chengde. These cities have the highest Pu values and relatively low Qu values among all six types of cities, showing a remarkable state of unsustainable development. It can be found that most of these cities are heavy industrial cities with high energy consumption and high pollution. To produce higher GDP, urban population and income, they consume overly large amounts of energy, causing much higher Nox discharge and many other environmental problems. For the cities in this type, most of them rely on heavy-industry and natural resource consumption, such as Tongling, Tangshan, Ma’anshan and Binzhou. The coal industry and petroleum industry are the mainstay of their economies. However, they should be aware that once urban resources are depleted, they cannot be repaired, even at great cost. Therefore, a strict policy of energy saving, consumption reduction and tighter control of environmental pressures will work best for these cities. This will take sustained patience over several years to gradually transform into positive sustainability performance.
5. Conclusions
By comparing the sustainability performance results of four major Chinese megacities, the following main conclusions are obtained:
From the comparative analysis of the data from 2010 to 2018, (1) all four megalopolises show continuously positive trends in terms of the quality of the built environment with a steady growth rate. The Pearl River Delta has the highest Qu score, followed by the Yangtze River Delta, Shandong Peninsula and JingJinJi. (2) Environmental pressure first experienced an upward and then a downward trend. The Pearl River Delta megalopolis has the least environmental pressure, followed by JingJinJi, Yangtze River Delta and the Shandong Peninsula in 2018. Comprehensively, (3) the Pearl River Delta has the highest level of sustainable development, ranking at the top for nine consecutive years. It is followed by JingJinJi, Yangtze River Delta and Shandong Peninsula. Additionally, the JingJinJi megalopolis has the fastest improvement of urban sustainability. In general, (1) the sustainability of each megalopolis is showing a positive trend of improvement (2) but due to the different speed of improvement, the gap between the urban agglomerations could potentially widen, which may cause imbalanced development of the entire country and is not conducive to the coordinated development in the future.
Based on the sustainability performance clustering, cities can be classified into six types. The cities of advanced positive, coordinated positive and smart positive type have an overall positive sustainability performance, whereas the remaining three types of transitional negative, lagging negative and purely negative type have negative sustainability performance with different degrees of environmental pressure. The corresponding characteristics and implications of the different types of cities mentioned above provide a reference for cities in similar situations. These cities can be informed by indicators that they need to pay more attention to in order to avoid unsustainable risks.
There is an urgent need to further expand the scope of urban sustainable development research to gradually cover more regions all over the world in the future, for example, by establishing interconnections between cities based on their complementarity. A visual diagnostic and evaluation system can also be established for each city to facilitate real-time self-examination and provide decision aids for city policymakers. In the next stage, as developing countries are prepared to enter a new status of deceleration stage or terminal stage, the evaluation systems need to be optimized and enriched as well. All of the above are prospects for our future research.
Author Contributions
Conceptualization, X.F. and W.G.; methodology, X.F. and X.S.; software, X.S. and T.K.P.; validation, X.F. and W.G.; formal analysis, T.K.P.; investigation, X.F. and X.S.; resources, X.S.; data curation, T.K.P.; writing—original draft preparation, X.F.; visualization, T.K.P.; supervision, W.G. All authors have read and agreed to the published version of the manuscript.
Funding
This research is funded by the Key Technology Research and Development Program of Shandong, grant number 2019GSF110004.
Acknowledgments
This study was supported by the Innovation Institute for Sustainable Maritime Architecture Research and Technology (iSMART) of Qingdao University of Technology. We would like to acknowledge and express our gratitude to all the people who helped complete this research and to the editors and reviewers for their suggestions for improving the manuscript.
Conflicts of Interest
The authors declare no conflict of interest.
References
- Behera, S.R.; Dash, D.P. The effect of urbanization, energy consumption, and foreign direct investment on the carbon dioxide emission in the SSEA (South and Southeast Asian) region. Renew. Sustain. Energy Rev. 2017, 70, 96–106. [Google Scholar] [CrossRef]
- United Nations|Department of Economic and Social Affairs Publications. 2018 Revision of World Urbanization Prospects. 2018. Available online: https://desapublications.un.org/publications/2018-revision-world-urbanization-prospects (accessed on 30 July 2022).
- Arfanuzzaman, M.; Dahiya, B. Sustainable urbanization in Southeast Asia and beyond: Challenges of population growth, land use change, and environmental health. Growth Change 2019, 50, 725–744. [Google Scholar] [CrossRef]
- UN. UN-Habitat Sustainable Urbanization in Asia: A Sourcebook for Local Governments; UN: Nairobi, Kenya, 2012. [Google Scholar]
- Higo, M.; Klassen, T.R. Retirement in Japan and Korea in an era of rapid population aging. In Retirement in Japan and South Korea: The Past, the Present and the Future of Mandatory Retirement; Routledge: England, UK, 2015; pp. 1–29. [Google Scholar]
- Kajimura, M. Changes in the Demographic Structure and Economic Growth in East and Southeast Asia. ISEAS Yusof Ishak Institute. 2020. Available online: http://hdl.handle.net/11540/12284 (accessed on 30 July 2022).
- Nogimori, M.; Seki, S.; Kumagai, S. The Uneven Economic Recovery in Asia; Japan Research Institute: Tokyo, Japan, 2020; Volume 3. [Google Scholar]
- Yang, Z.; Dunford, M. City shrinkage in China: Scalar processes of urban and hukou population losses. Reg. Stud. 2018, 52, 1111–1121. [Google Scholar] [CrossRef]
- Dunford, M.; Weidong, L. The Geographical Transformation of China; Routledge: England, UK, 2014; ISBN 131761478X. [Google Scholar]
- Li, H.; Mykhnenko, V. Urban shrinkage with Chinese characteristics. Geogr. J. 2018, 184, 398–412. [Google Scholar] [CrossRef]
- Yang, Z.; Dunford, M. Cluster evolution and urban industrial dynamics in the transition from a planned to a socialist market economy: The case of Beijing. Spat. Econ. Anal. 2017, 12, 50–71. [Google Scholar] [CrossRef]
- Liu, Z.; Liu, S.; Song, Y. Understanding urban shrinkage in China: Developing a multi-dimensional conceptual model and conducting empirical examination from 2000 to 2010. Habitat Int. 2020, 104, 102256. [Google Scholar] [CrossRef]
- Gonzalez, E.T.; Mendoza, M.L. Governance in Southeast Asia: Issues and Options; PIDS Discussion Paper Series; Philippine Institute for Development Studies (PIDS): Makati City, Philippines, 2002. [Google Scholar]
- Henderson, J.V.; Quigley, J.; Lim, E. Urbanization in China: Policy Issues and Options; Brown University: Providence, RI, USA, 2009; unpublished manuscript. [Google Scholar]
- Kirkby, R.J.R. Urbanization in China: Town and Country in a Developing Economy 1949–2000 AD; Routledge: England, UK, 2018; Volume 3, ISBN 1351171623. [Google Scholar]
- Lin, J.Y.; Liu, Z. Fiscal decentralization and economic growth in China. Econ. Dev. Cult. Change 2000, 49, 1–21. [Google Scholar] [CrossRef]
- Zhang, L.; LeGates, R.; Zhao, M. Understanding China’s Urbanization: The Great Demographic, Spatial, Economic, and Social Transformation; Edward Elgar Publishing: Cheltenham, UK, 2016; ISBN 1783474742. [Google Scholar]
- Chaolin, G.U.; Liya, W.U.; Cook, I. Progress in research on Chinese urbanization. Front. Archit. Res. 2012, 1, 101–149. [Google Scholar] [CrossRef]
- Henderson, J.V. Cities and development. J. Reg. Sci. 2010, 50, 515–540. [Google Scholar] [CrossRef]
- Chan, K.W. Fundamentals of China’s urbanization and policy. China Rev. 2010, 63–93. [Google Scholar]
- Fang, X.; Shi, X.; Phillips, T.K.; Du, P.; Gao, W. The coupling coordinated development of urban environment towards sustainable urbanization: An empirical study of Shandong Peninsula, China. Ecol. Indic. 2021, 129, 107864. [Google Scholar] [CrossRef]
- Li, S.; Xiao, W.; Zhao, Y.; Xu, J.; Da, H.; Lv, X. Quantitative analysis of the ecological security pattern for regional sustainable development: Case study of Chaohu Basin in Eastern China. J. Urban Plan. Dev. 2019, 145, 4019009. [Google Scholar] [CrossRef]
- Yi, S. Research on Sustainable Development Strategy and Evaluation Model of the of Urban Wastewater Treatment System in China; Shanghai Institute of Technology: Shanghai, China, 2010; pp. 4918–4922. [Google Scholar]
- Cheshmehzangi, A.; Zhu, Y.; Li, B. Application of environmental performance analysis for urban design with Computational Fluid Dynamics (CFD) and EcoTect tools: The case of Cao Fei Dian eco-city, China. Int. J. Sustain. Built Environ. 2017, 6, 102–112. [Google Scholar] [CrossRef]
- Fang, X.; Shi, X.; Gao, W. Measuring urban sustainability from the quality of the built environment and pressure on the natural environment in China: A case study of the Shandong Peninsula region. J. Clean. Prod. 2020, 289, 125145. [Google Scholar] [CrossRef]
- Fang, C.; Li, G.; Wang, S. Changing and Differentiated Urban Landscape in China: Spatiotemporal Patterns and Driving Forces. Environ. Sci. Technol. 2016, 50, 2217–2227. [Google Scholar] [CrossRef] [PubMed]
- Harrison, J.; Gu, H. Planning megaregional futures: Spatial imaginaries and megaregion formation in China. Reg. Stud. 2021, 55, 77–89. [Google Scholar] [CrossRef]
- Meng, L.; Crijns-Graus, W.H.J.; Worrell, E.; Huang, B. Impacts of booming economic growth and urbanization on carbon dioxide emissions in Chinese megalopolises over 1985–2010: An index decomposition analysis. Energy Effic. 2018, 11, 203–223. [Google Scholar] [CrossRef]
- Yu, J.; Zhou, K.; Yang, S. Land use efficiency and influencing factors of urban agglomerations in China. Land Use Policy 2019, 88, 104143. [Google Scholar] [CrossRef]
- Wan, H.; Rieckmann, J.M.; Hou, G. Cluster of Financial Industry of Urban Agglomeration in China—A Panel Data Study. In Proceedings of the 2018 5th International Conference on Industrial Economics System and Industrial Security Engineering (IEIS), Beijing, China, 3–6 August 2018; pp. 1–9. [Google Scholar]
- Guo, L.; Qu, Y.; Wu, C.; Wang, X. Identifying a pathway towards green growth of Chinese industrial regions based on a system dynamics approach. Resour. Conserv. Recycl. 2018, 128, 143–154. [Google Scholar] [CrossRef]
- Guan, X.; Wei, H.; Lu, S.; Dai, Q.; Su, H. Assessment on the urbanization strategy in China: Achievements, challenges and reflections. Habitat Int. 2018, 71, 97–109. [Google Scholar] [CrossRef]
- Fang, C.; Yu, D. China’s Urban Agglomerations; Springer: Berlin/Heidelberg, Germany, 2020; ISBN 9811515514. [Google Scholar]
- Cohen, B. Urbanization in developing countries: Current trends, future projections, and key challenges for sustainability. Technol. Soc. 2006, 28, 63–80. [Google Scholar] [CrossRef]
- Fang, L.; Song, H. Notice of Retraction: Research on Differences of Capacity for Sustainable Development of Shandong Peninsula City Groups. In Proceedings of the 2011 International Conference on E-Business and E-Government (ICEE), Shanghai, China, 6–8 May 2011; pp. 1–3. [Google Scholar]
- National Bureau of Statistics China Statistical Yearbook. Available online: http://www.stats.gov.cn/tjsj/ (accessed on 30 July 2022).
- Borza, M. The Connection between Efficiency and Sustainability—A Theoretical Approach. Procedia Econ. Financ. 2014, 15, 1355–1363. [Google Scholar] [CrossRef]
- Leibeistein, H. General X-Efficiency Theory & Economic Development; Oxford University Press: Oxford, UK, 1978; ISBN 019502379X. [Google Scholar]
- State Environmental Protection Administration The Ecological Counties, Ecological Cities Construction Evaluation System (2003 Trial version). Environmental Protection; State Environmental Protection Administration The Ecological Counties. 2003. Available online: https://www.epd.gov.hk/epd/english/links/mainchina/link_mainchina.html (accessed on 30 July 2022).
- Zhang, W. The concept and discussion of China’s Livable Cities Scientific Evaluation Standards. Urban Plan. Forum 2007, 3, 30–34. [Google Scholar]
- Shang, l.; Su, X.; Wang, M.; Wang, M. Research Progress on Urban Low-Carbon Index Evaluation. Urban Rural Plan. 2018, 1, 78–83. [Google Scholar]
- Ministry of Housing and Urban-Rural Development; Ministry of Finance; National Development and Reform Commission. Green and Low-carbon Cities Evaluation Indicators; Ministry of Housing and Urban-Rural Development; Ministry of Finance; National Development and Reform Commission: Beijing, China, 2011.
- Ministry of Housing and Urban-Rural Development; Ministry of Finance; National Development and Reform Commission. National Environmental Protection Model City Assessment Index and Implementation Rules; Ministry of Housing and Urban-Rural Development; Ministry of Finance; National Development and Reform Commission: Beijing, China, 2011.
- Ministry of Housing and Urban-Rural Development; Ministry of Finance; National Development and Reform Commission. National Ecological Civilization Pilot Policy Evaluation System; Ministry of Housing and Urban-Rural Development; Ministry of Finance; National Development and Reform Commission: Beijing, China, 2013.
- Ministry of Housing and Urban-Rural Development; Ministry of Finance; National Development and Reform Commission. Technical Criterion for Ecosystem Status Evaluation; Ministry of Housing and Urban-Rural Development; Ministry of Finance; National Development and Reform Commission: Beijing, China, 2015.
- National Development and Reform Commission of PRC. Evaluation System for the Construction of National Ecological Civilization Model City (Trial Version); National Development and Reform Commission of PRC: Beijing, China, 2016.
- National Development and Reform Commission of PRC. China Green Development Index System; National Development and Reform Commission of PRC: Beijing, China, 2016.
- National Development and Reform Commission of PRC. Evaluation System for Ecological Civilization Construction; National Development and Reform Commission of PRC: Beijing, China, 2016.
- Zong, J.; Li, Y.; Lin, L.; Bao, W. Evaluation indicators for green cities. IOP Conf. Ser. Earth Environ. Sci. 2017, 267, 052009. [Google Scholar] [CrossRef]
- Ministry of Housing and Urban-Rural Development; Ministry of Finance; National Development and Reform Commission. Evaluation System of the Construction Target of the National Ecological Civilization Pilot Zone; Ministry of Housing and Urban-Rural Development; Ministry of Finance; National Development and Reform Commission: Beijing, China, 2018.
- Standardization Administration of China. Indicators for City Services and Quality of Life; Standardization Administration of China: Beijing, China, 2019.
- Ministry of Housing and Urban-Rural Development; Ministry of Finance; National Development and Reform Commission. New-Type Urbanization—Evaluation Index System of Quality City (Trial Version); Ministry of Housing and Urban-Rural Development; Ministry of Finance; National Development and Reform Commission: Beijing, China, 2020.
- Wackernagel, M.; Rees, W. Our Ecological Footprint: Reducing Human Impact on the Earth; New Society Publishers: Gabriola Island, BC, Canada, 1998; Volume 9, ISBN 086571312X. [Google Scholar]
- Huang, L.; Wu, J.; Yan, L. Defining and measuring urban sustainability: A review of indicators. Landsc. Ecol. 2015, 30, 1175–1193. [Google Scholar] [CrossRef]
- Zhang, W.L. The application of principal component analysis in SPSS. Mark. Res. 2005, 12, 31–34. [Google Scholar]
- Guo, H.; Yang, C.; Liu, X.; Li, Y.; Meng, Q. Simulation evaluation of urban low-carbon competitiveness of cities within Wuhan city circle in China. Sustain. Cities Soc. 2018, 42, 688–701. [Google Scholar] [CrossRef]
- Adler, N.; Golany, B. Including principal component weights to improve discrimination in data envelopment analysis. J. Oper. Res. Soc. 2002, 53, 985–991. [Google Scholar] [CrossRef]
- Dodge, Y.; Cox, D.; Commenges, D. The Oxford Dictionary of Statistical Terms; Oxford University Press on Demand: Oxford, UK, 2006; ISBN 0199206139. [Google Scholar]
- Johnson, S.C. Hierarchical Clustering Schemes. Psychometrika 1967, 32, 241–254. [Google Scholar] [CrossRef]
- Murtagh, F.; Contreras, P. Algorithms for hierarchical clustering: An overview. Wiley Interdiscip. Rev. Data Min. Knowl. Discov. 2012, 2, 86–97. [Google Scholar] [CrossRef]
- Romesburg, C. Cluster Analysis for Researchers; Lulu Press: Morrisville, NC, USA, 2004; ISBN 1411606175. [Google Scholar]
- Kaufman, L.; Rousseeuw, P.J. Finding groups in Data: An Introduction to Cluster Analysis; John Wiley & Sons: Hoboken, NJ, USA, 2009; Volume 344, ISBN 0470317485. [Google Scholar]
- Gower, J.C. A comparison of some methods of cluster analysis. Biometrics 1967, 23, 623–637. [Google Scholar] [CrossRef] [PubMed]
- Meng, W.; Hu, B.; He, M.; Liu, B.; Mo, X.; Li, H.; Wang, Z.; Zhang, Y. Temporal-spatial variations and driving factors analysis of coastal reclamation in China. Estuar. Coast. Shelf Sci. 2017, 191, 39–49. [Google Scholar] [CrossRef]
- Fang, C.; Zhao, S. A comparative study of spatiotemporal patterns of urban expansion in six major cities of the Yangtze River Delta from 1980 to 2015. Ecosyst. Health Sustain. 2018, 4, 95–114. [Google Scholar] [CrossRef]
- Shi, B.; Yang, H.; Wang, J.; Zhao, J. City green economy evaluation: Empirical evidence from 15 sub-provincial cities in China. Sustainability 2016, 8, 551. [Google Scholar] [CrossRef]
- Wilkins, K.; Zurawski, A. Infrastructure Investment in China|Bulletin–June Quarter 2014. Bulletin 2014. Available online: https://www.rba.gov.au/publications/bulletin/2014/jun/bu-0614-4a.html (accessed on 30 July 2022).
- Ellsworth-Krebs, K. Implications of declining household sizes and expectations of home comfort for domestic energy demand. Nat. Energy 2020, 5, 20–25. [Google Scholar] [CrossRef]
- Qian, Y.; Zhou, W.; Li, W.; Han, L. Understanding the dynamic of greenspace in the urbanized area of Beijing based on high resolution satellite images. Urban For. Urban Green. 2015, 14, 39–47. [Google Scholar] [CrossRef]
- Wang, X.-J. Analysis of problems in urban green space system planning in China. J. For. Res. 2009, 20, 79–82. [Google Scholar] [CrossRef]
- Zhou, W.; Wang, J.; Qian, Y.; Pickett, S.T.A.; Li, W.; Han, L. The rapid but “invisible” changes in urban greenspace: A comparative study of nine Chinese cities. Sci. Total Environ. 2018, 627, 1572–1584. [Google Scholar] [CrossRef]
- Contractor, F.J.; Dangol, R.; Nuruzzaman, N.; Raghunath, S. How do country regulations and business environment impact foreign direct investment (FDI) inflows? Int. Bus. Rev. 2020, 29, 101640. [Google Scholar] [CrossRef]
- Yeung, G. Foreign direct investment and investment environment in Dongguan Municipality of Southern China. J. Contemp. China 2001, 10, 125–154. [Google Scholar] [CrossRef][Green Version]
- Li, X.; Lu, Y.; Huang, R. Whether foreign direct investment can promote high-quality economic development under environmental regulation: Evidence from the Yangtze River Economic Belt, China. Environ. Sci. Pollut. Res. 2021, 28, 21674–21683. [Google Scholar] [CrossRef] [PubMed]
- Li, T.; Wang, Y.; Zhao, D. Environmental Kuznets curve in China: New evidence from dynamic panel analysis. Energy Policy 2016, 91, 138–147. [Google Scholar] [CrossRef]
- Babbar, K.; Martin, J.; Ruiz, J.; Parray, A.A.; Sommer, M. Menstrual health is a public health and human rights issue. Lancet Public Health 2022, 7, e10–e11. [Google Scholar] [CrossRef]
- Swanson, T.; Lin, T. Economic Growth and Environmental Regulation: China’s Path to a Brighter Future; Routledge: England, UK, 2009; Volume 20, ISBN 1135247471. [Google Scholar]
- Liu, J.; Xue, J.; Yang, L.; Shi, B. Enhancing green public procurement practices in local governments: Chinese evidence based on a new research framework. J. Clean. Prod. 2019, 211, 842–854. [Google Scholar] [CrossRef]
- Yang, J.; Ma, J.; Sun, Q.; Han, C.; Guo, Y.; Li, M. Health benefits by attaining the new WHO air quality guideline targets in China: A nationwide analysis. Environ. Pollut. 2022, 308, 119694. [Google Scholar] [CrossRef] [PubMed]
- Dahiya, S.; Myllyvirta, L. Global SO 2 Emission Hotspot Database; Greenpeace Environment Trust: Beijing, China, 2019; pp. 1–3. [Google Scholar]
- Ward, J.H. Hierarchical Grouping to Optimize an Objective Function. J. Am. Stat. Assoc. 1963, 58, 236–244. [Google Scholar] [CrossRef]
Publisher’s Note: MDPI stays neutral with regard to jurisdictional claims in published maps and institutional affiliations. |
© 2022 by the authors. Licensee MDPI, Basel, Switzerland. This article is an open access article distributed under the terms and conditions of the Creative Commons Attribution (CC BY) license (https://creativecommons.org/licenses/by/4.0/).