
Nonlinear Response of RC Columns Subjected to Equal Energy-Double Impact Loads

 , and
, and 
Abstract
:1. Introduction
2. Finite Element Analysis
2.1. Study Specimen Descriptions and Test Setup
2.2. Finite Element Model
2.2.1. Structural Modeling
2.2.2. Material Modeling
2.2.3. Strain Rate Effect
2.2.4. The Creation of Axial Load in the RC Column Specimens
2.2.5. Modelling of RC Columns under Double Impact Loading
3. Numerical Results and Discussions
3.1. Impact Responses
3.2. Damage Pattern
3.3. Effect of the Impact Momentum
3.4. Effect of Axial Load
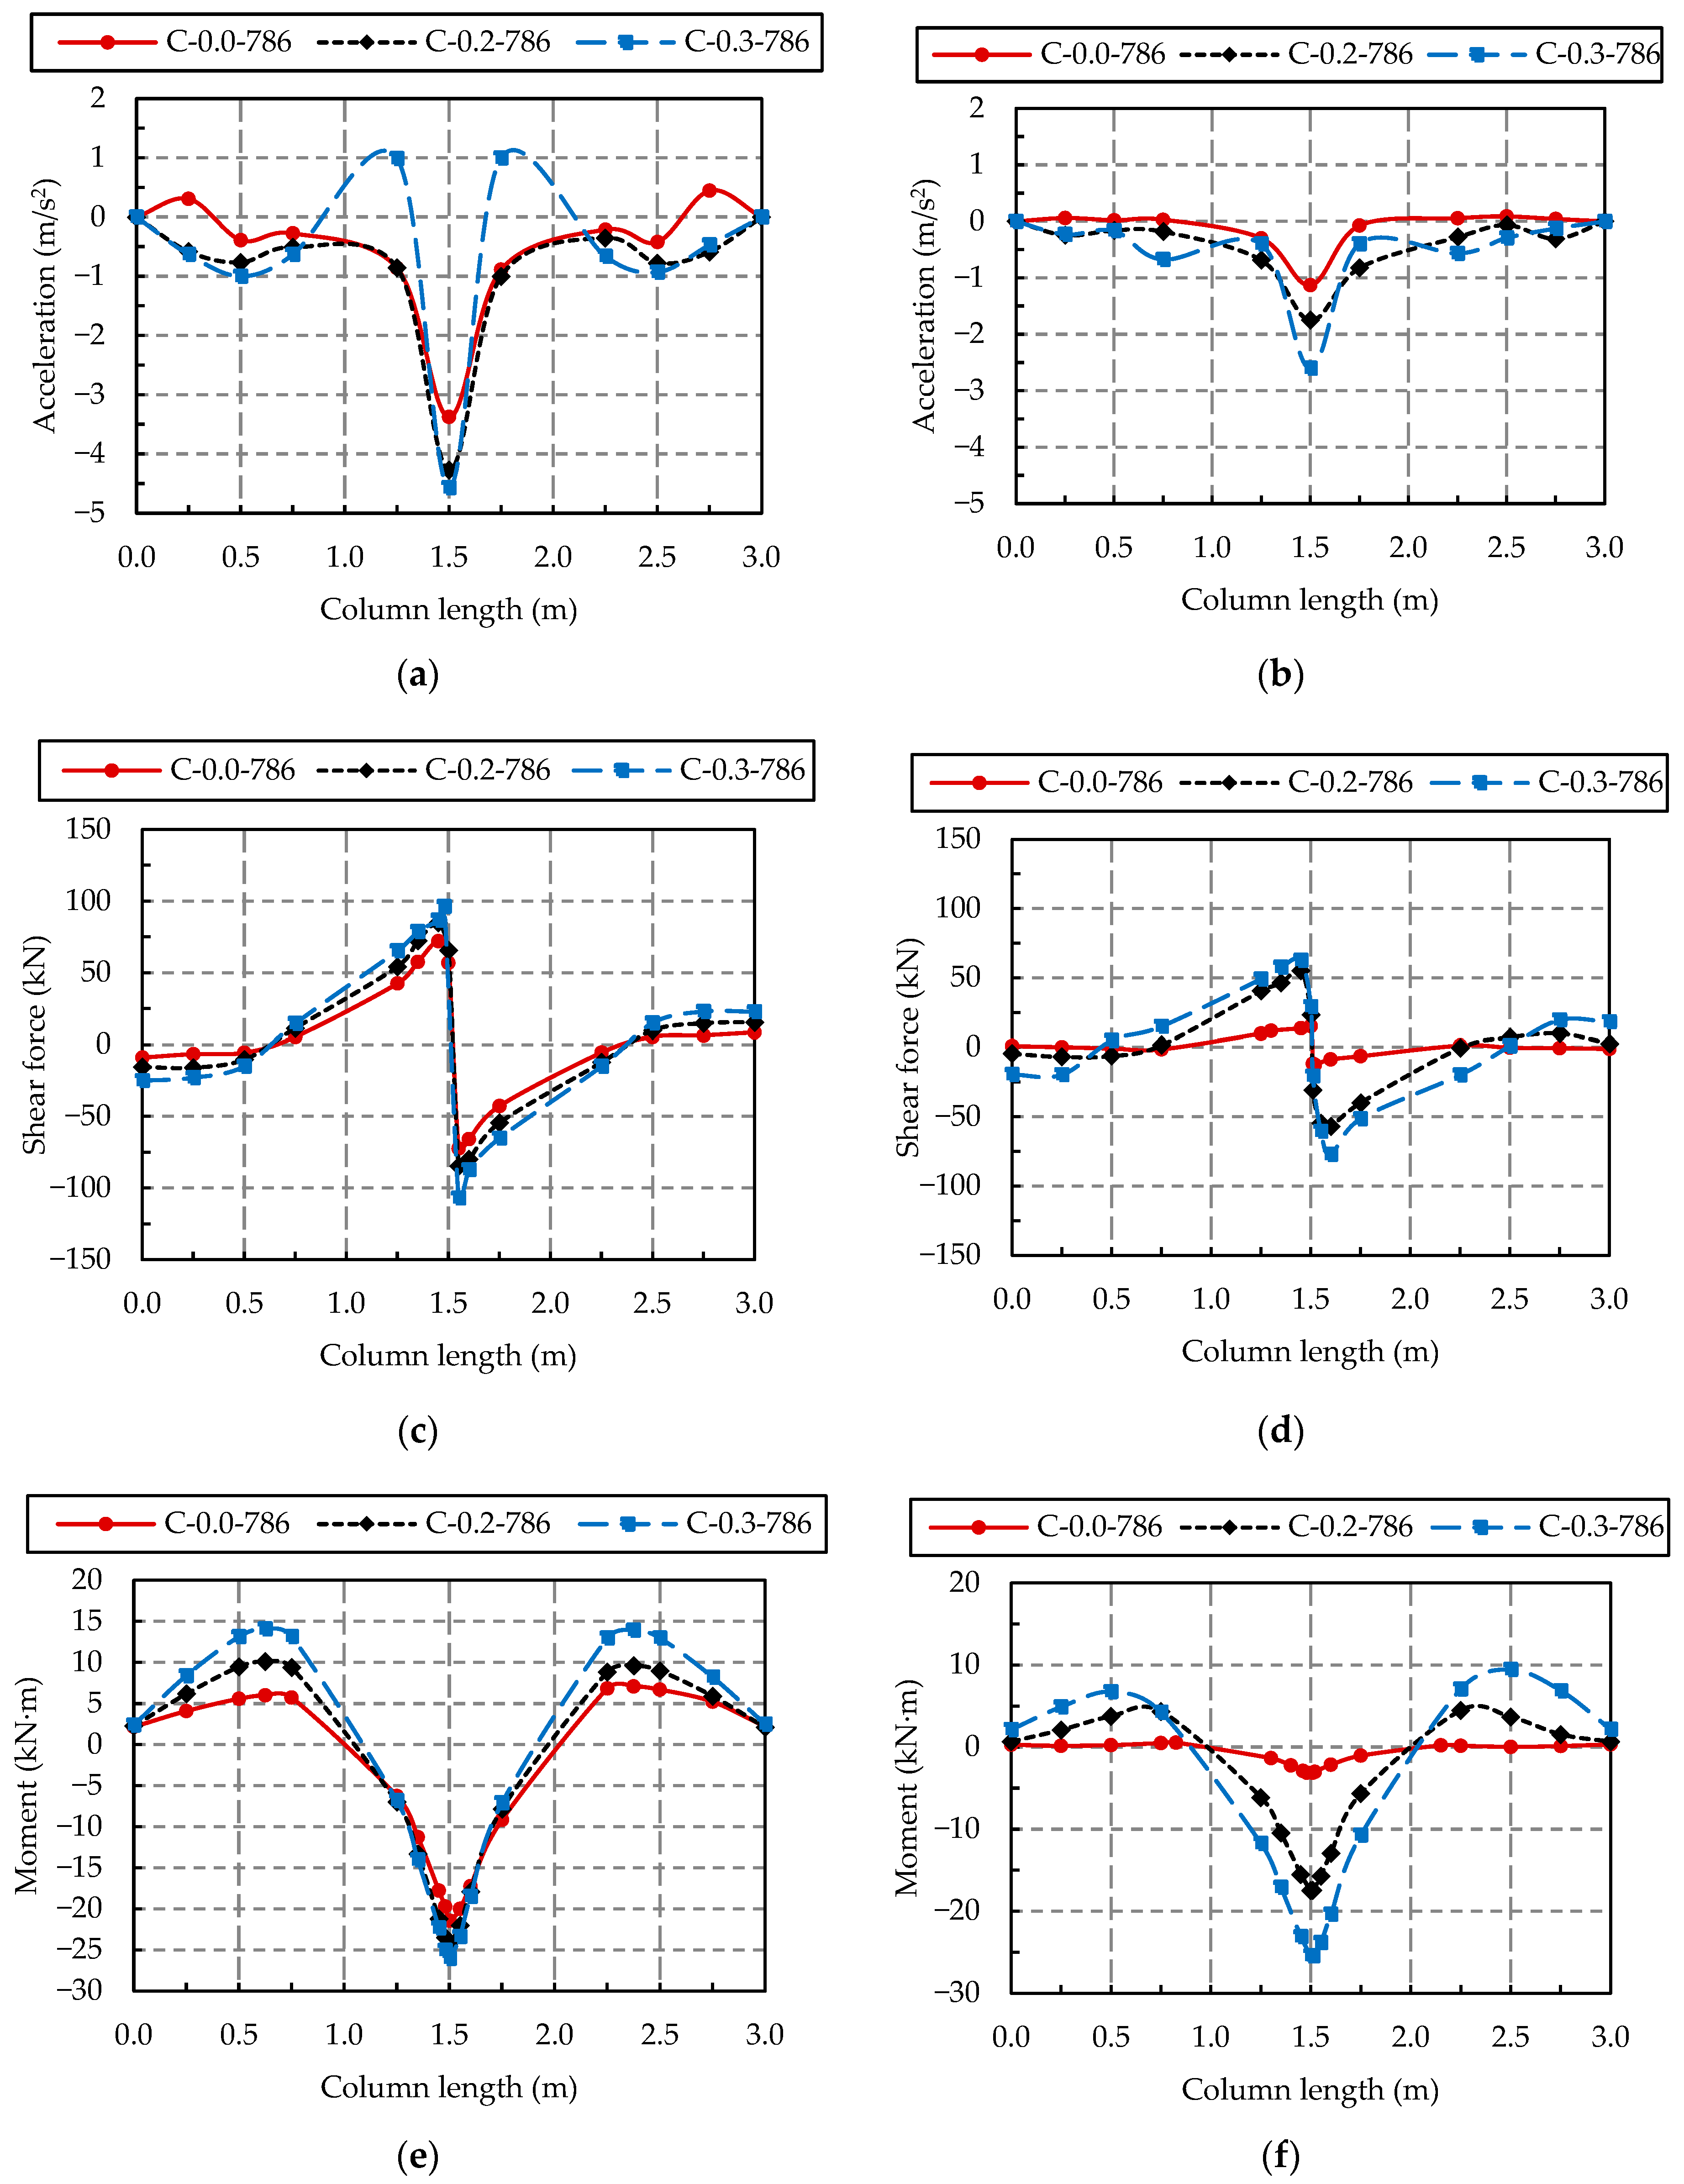
3.5. Distribution of the Internal Forces
3.6. Colliding Index in Deflection Prediction
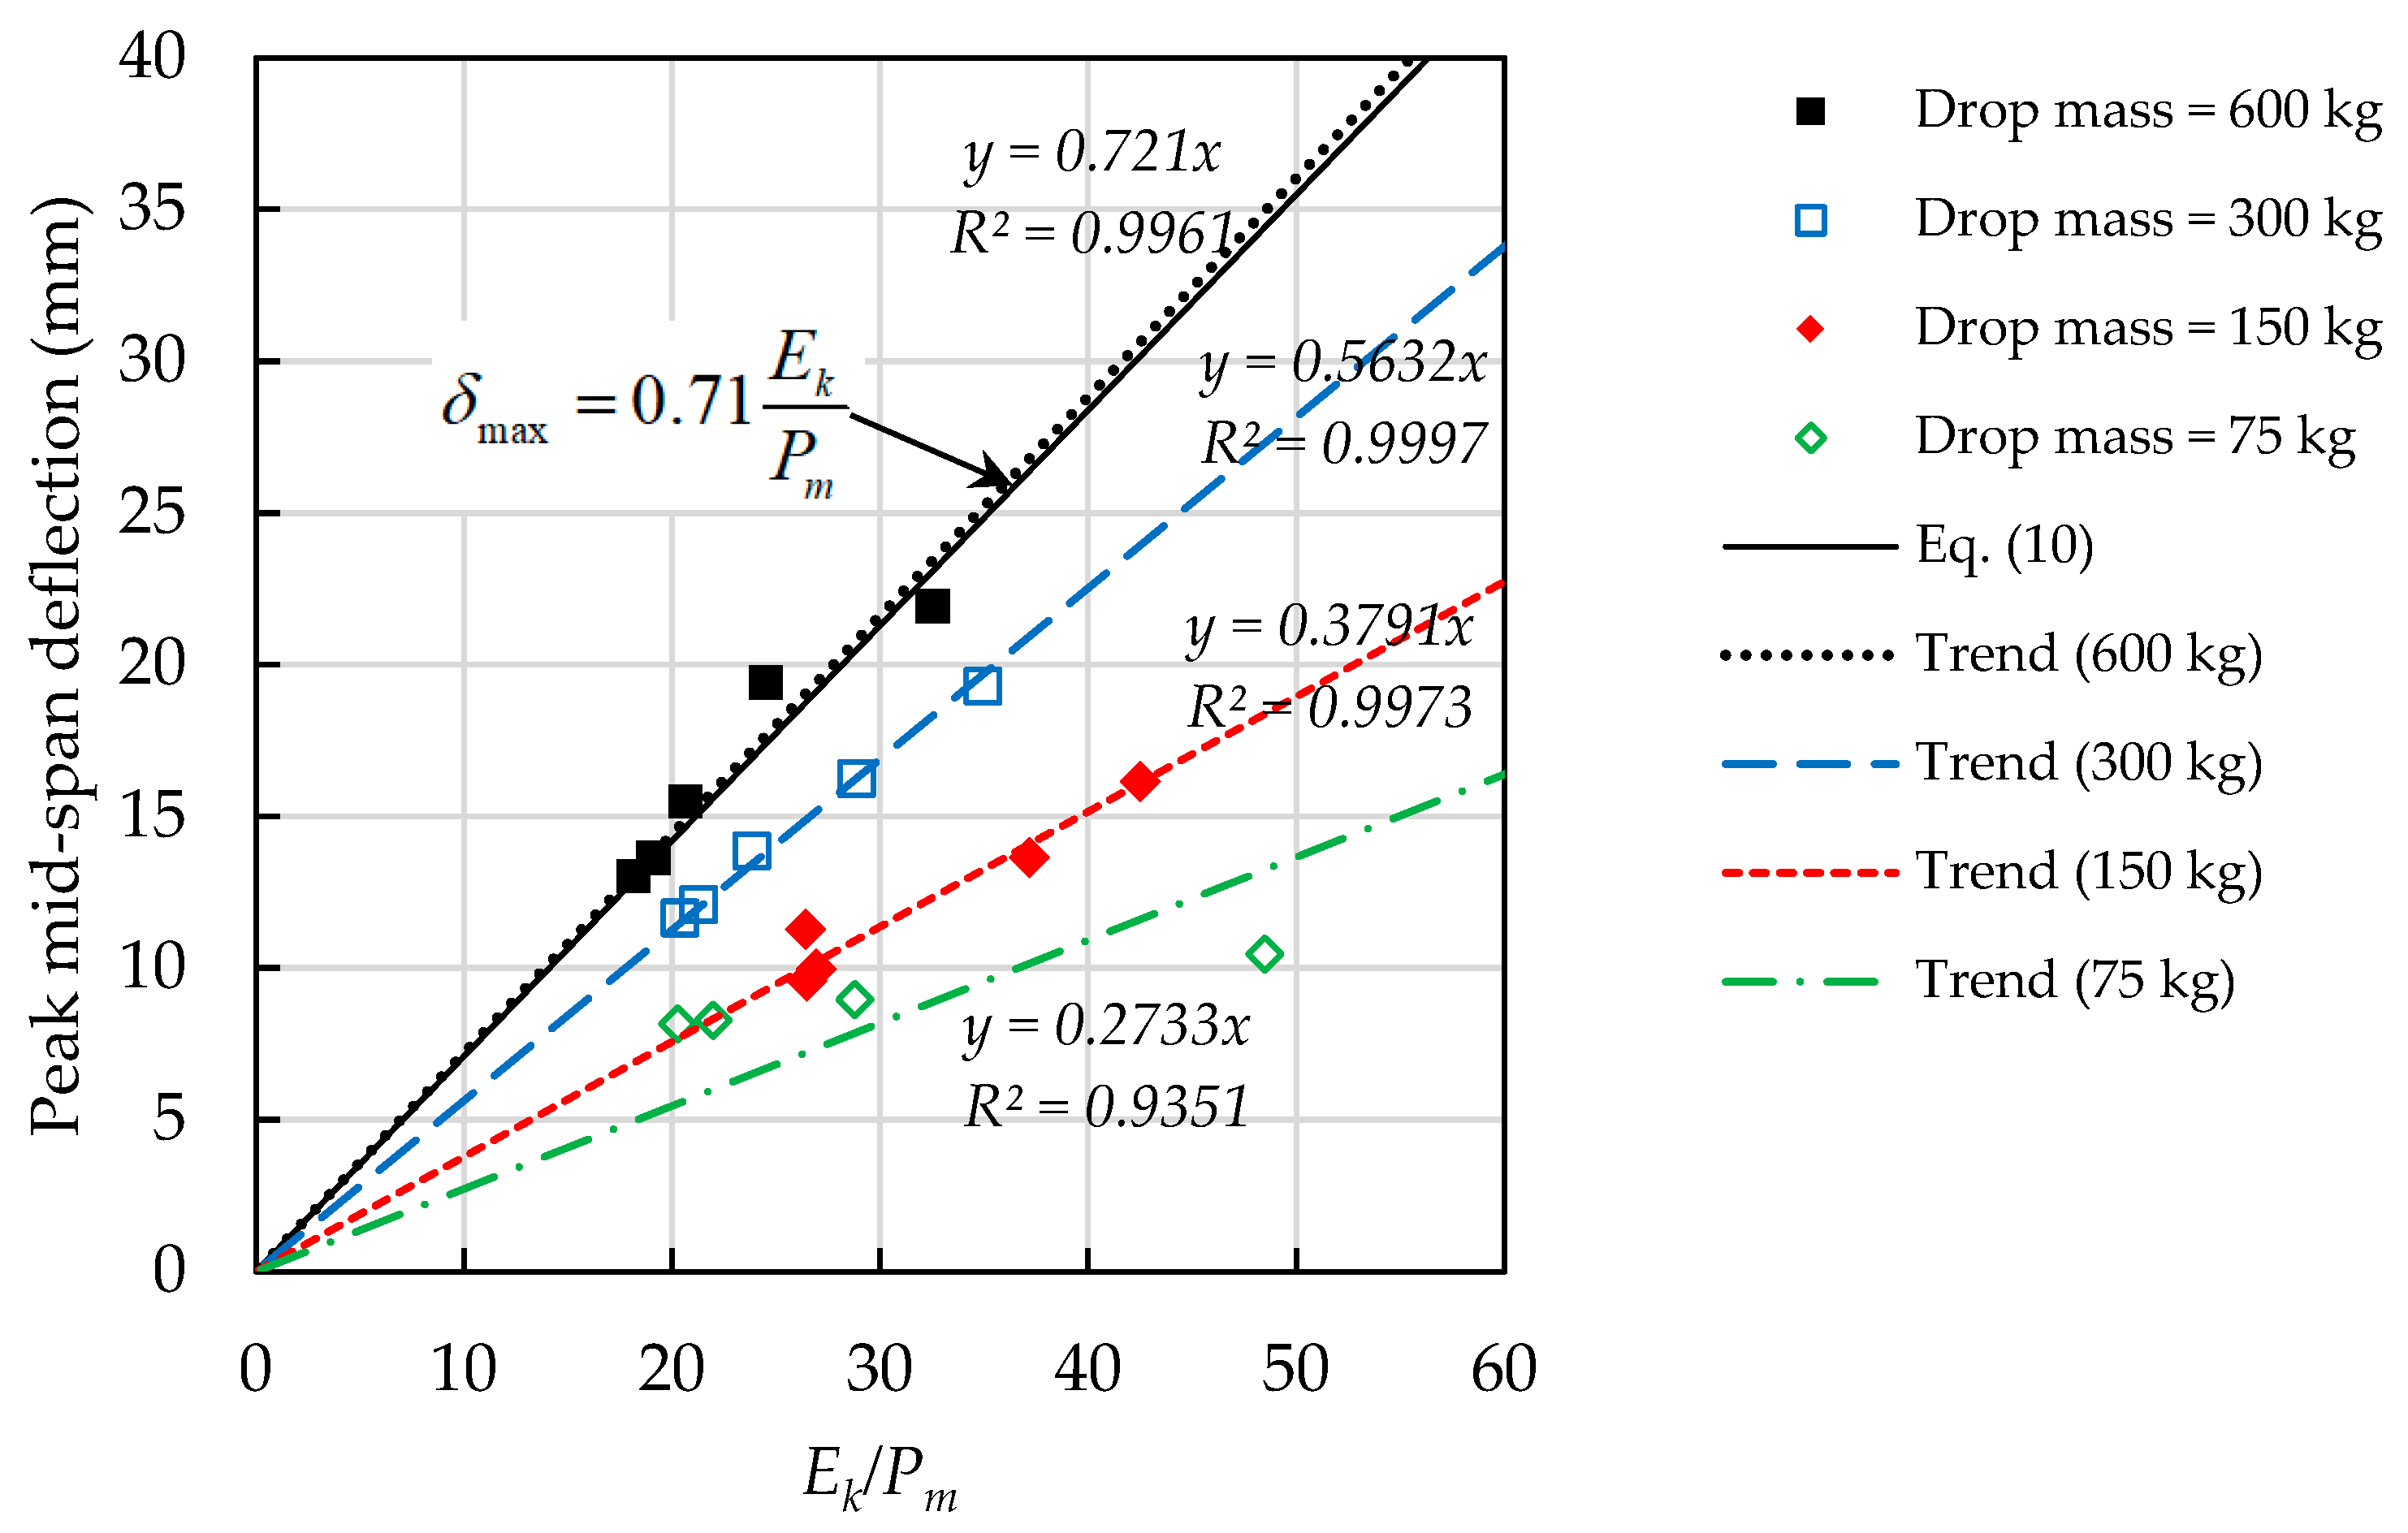
3.7. Empirical Equation for Predict the Maximum Deflection of RC Member
4. Conclusions
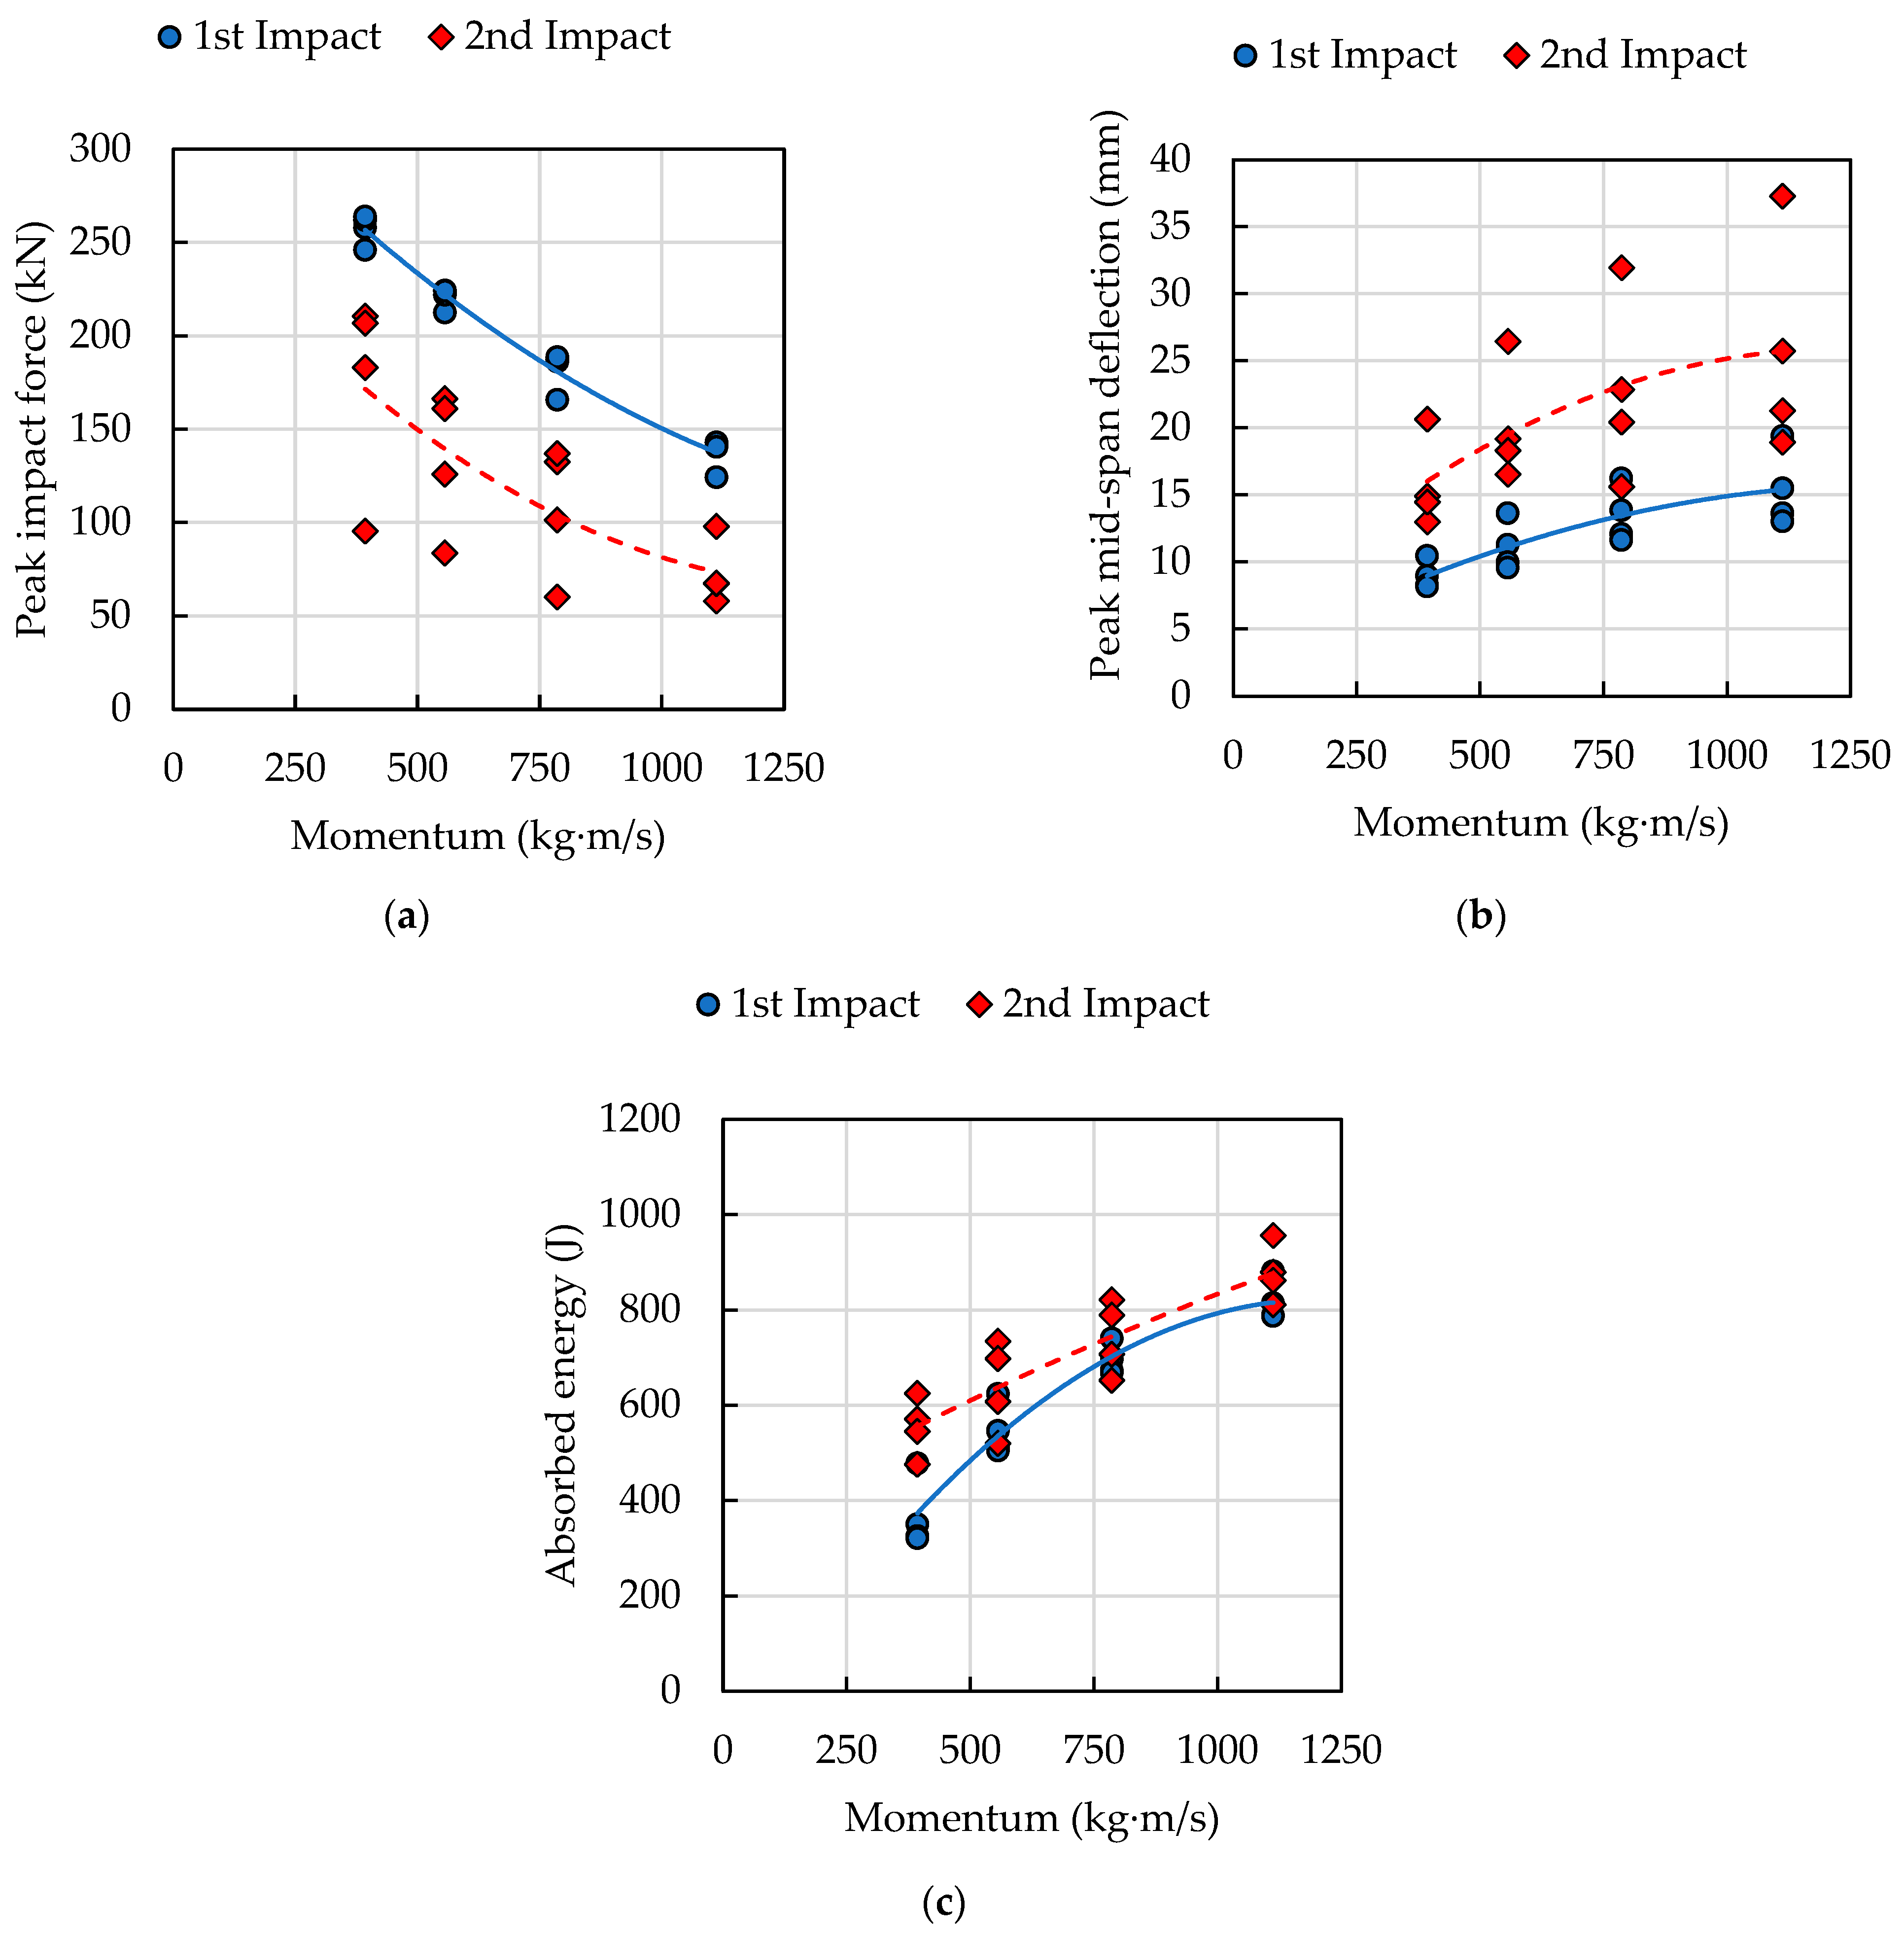
- Defining the damage and deflection from impact by using only the impact energy could be misleading due to the effect of impact momentum. Under the same level of the input impact energy, the different combinations of dropped mass and impact velocity create a difference in impact momentum, which results in a variation in the impact response of the RC column. Increasing impact momentum tends to increase the overall flexural damage and yields larger mid-span deflection but lowers the peak impact force. On the other hand, lower impact momentum yields more local damage with smaller mid-span deflection but higher peak impact force. In an extreme case where the impact momentum increases from 393 to 1112 kg·m/s, the peak mid-span deflection of the specimen without axial load increases by around 85%, while the peak impact force decreases by around 50%.
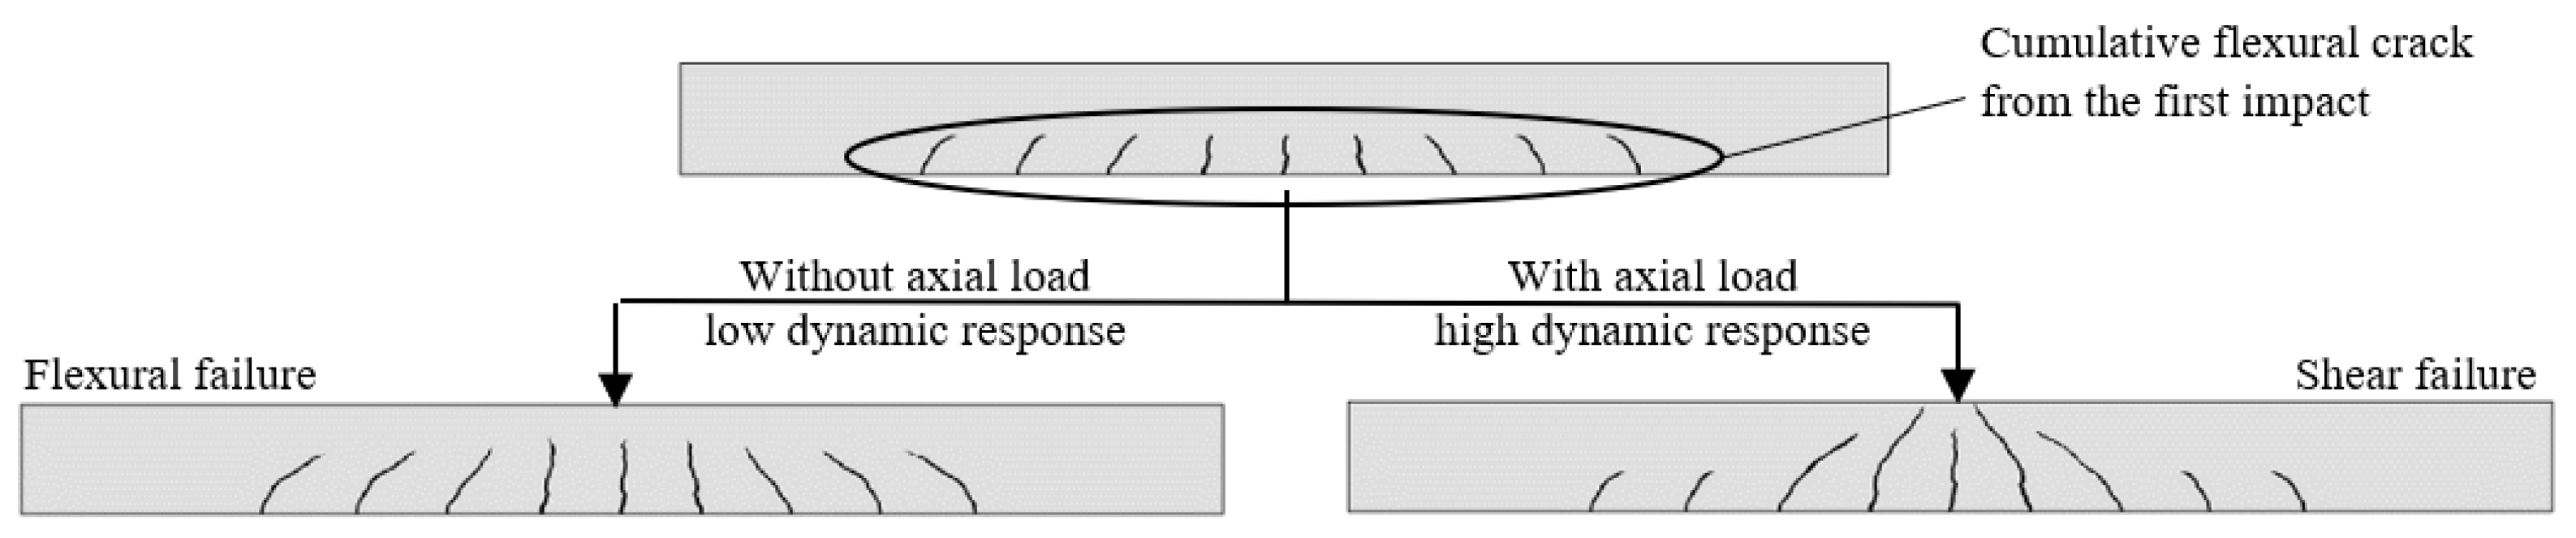
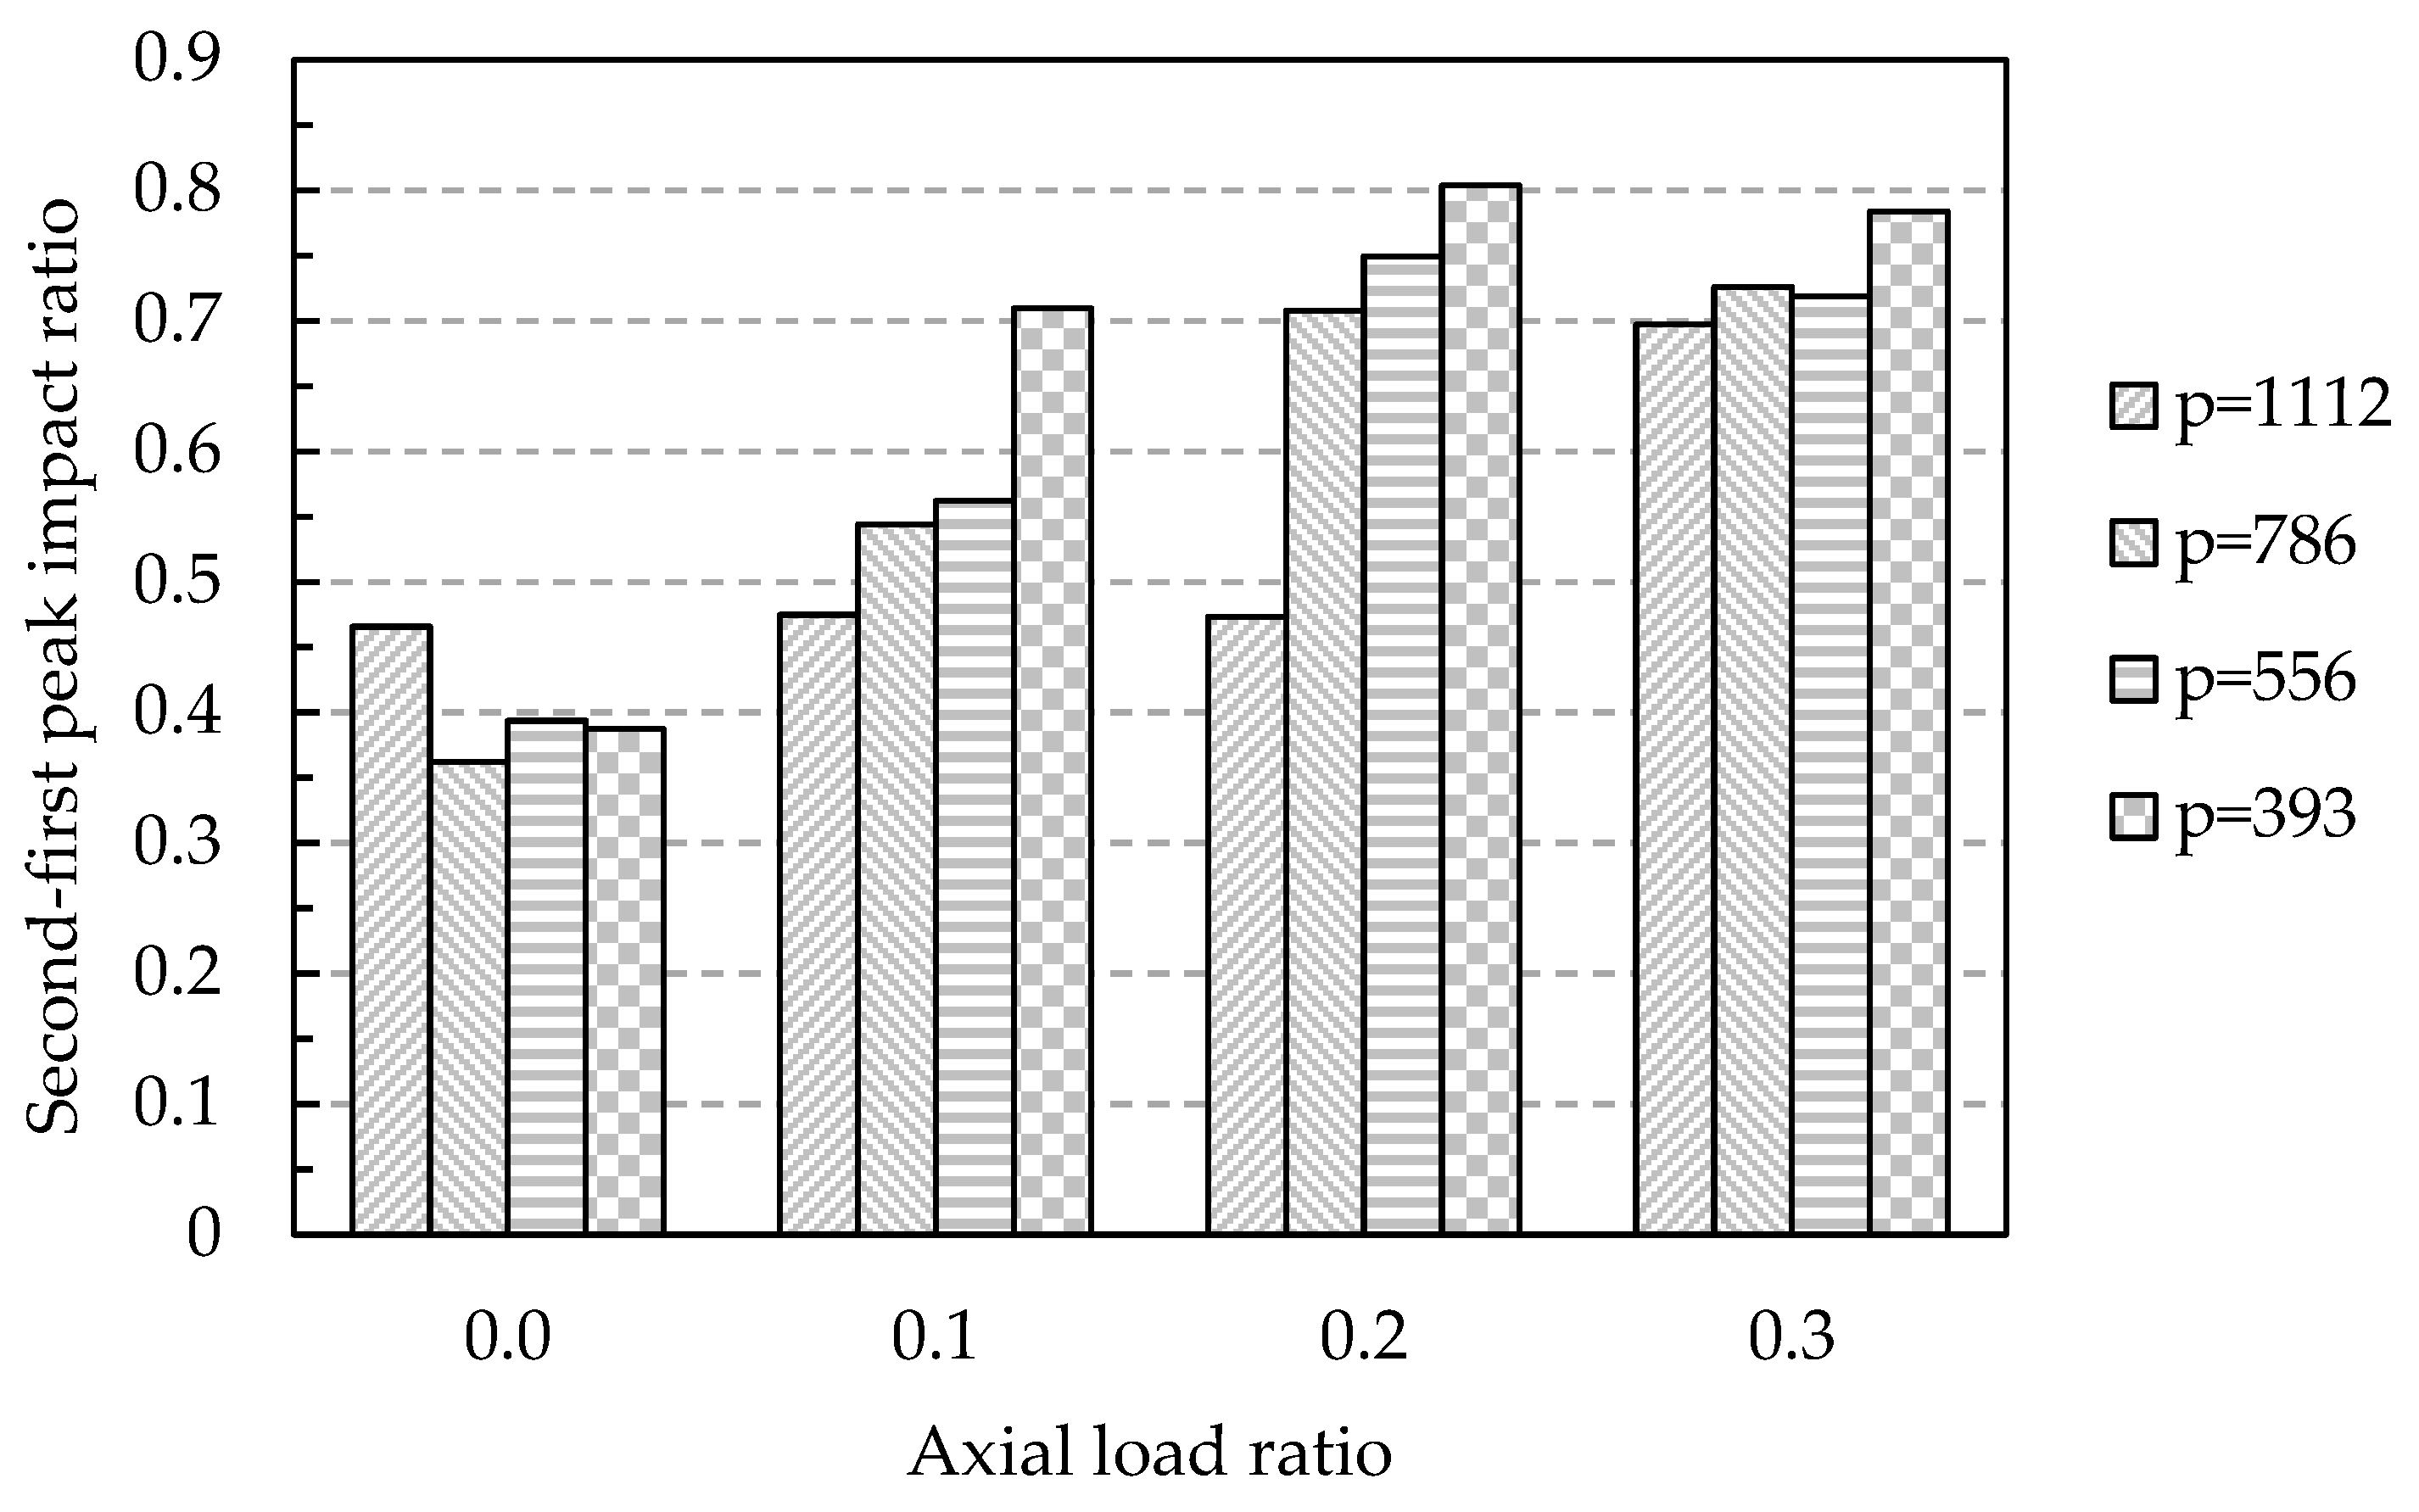
- Regardless of the inhibitory effect on flexural crack development of the influence of the axial load, increasing the axial load ratio above 0.2 of the concrete cross-sections led to a change in failure mode from flexural mode previously induced by the first impact to shear and crushing mode under the second impact. This is because the axial load contributes to the increase in flexural resistance and effectively maintains it throughout the first impact. However, the flexural damage due to the first impact reduced the shear transfer capacity of the concrete section, which led to shear failure. For practical design of structures under repeated impact loading, an additional shear reinforcement should be added to prevent sudden shear failure.
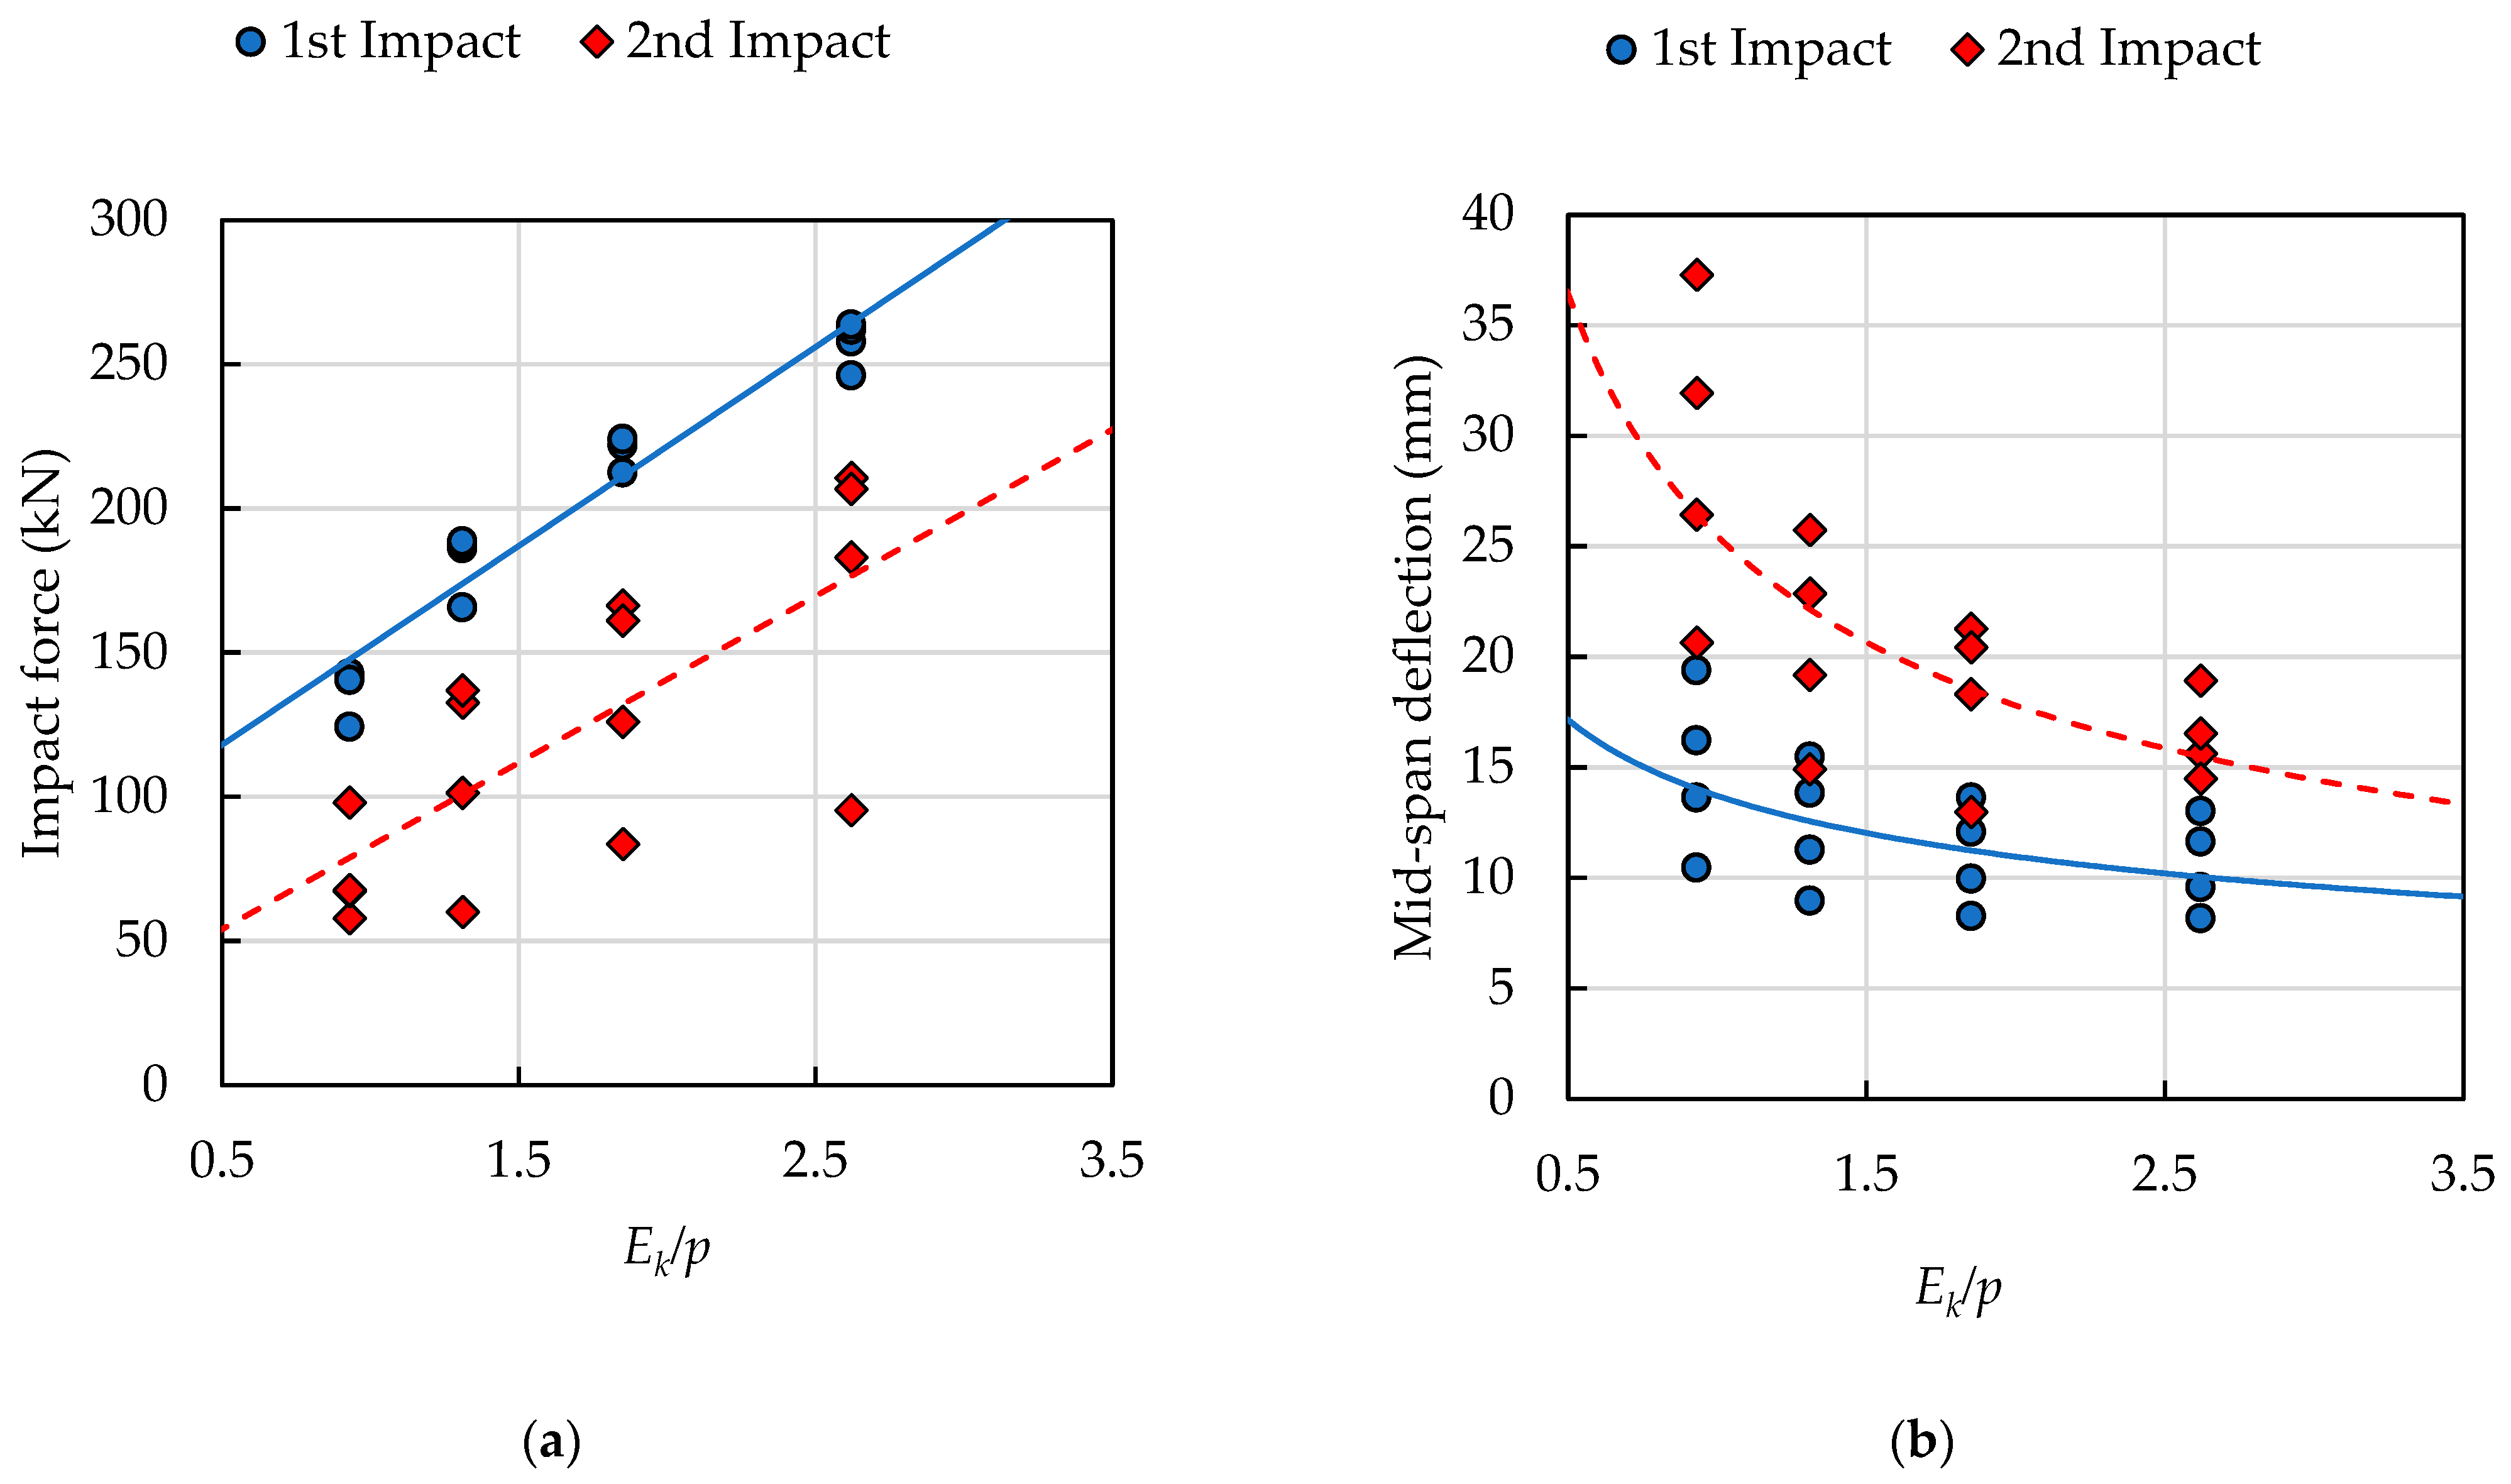
- The colliding index was used to clearly indicate the level of the collision based on the effect of the momentum under given kinetic energy. It is evidenced that the colliding index affects the behavior of the RC column under double impact loads, where the peak impact force increases proportionally to the increasing colliding index. The peak mid-span deflection decreases with the increasing colliding index.
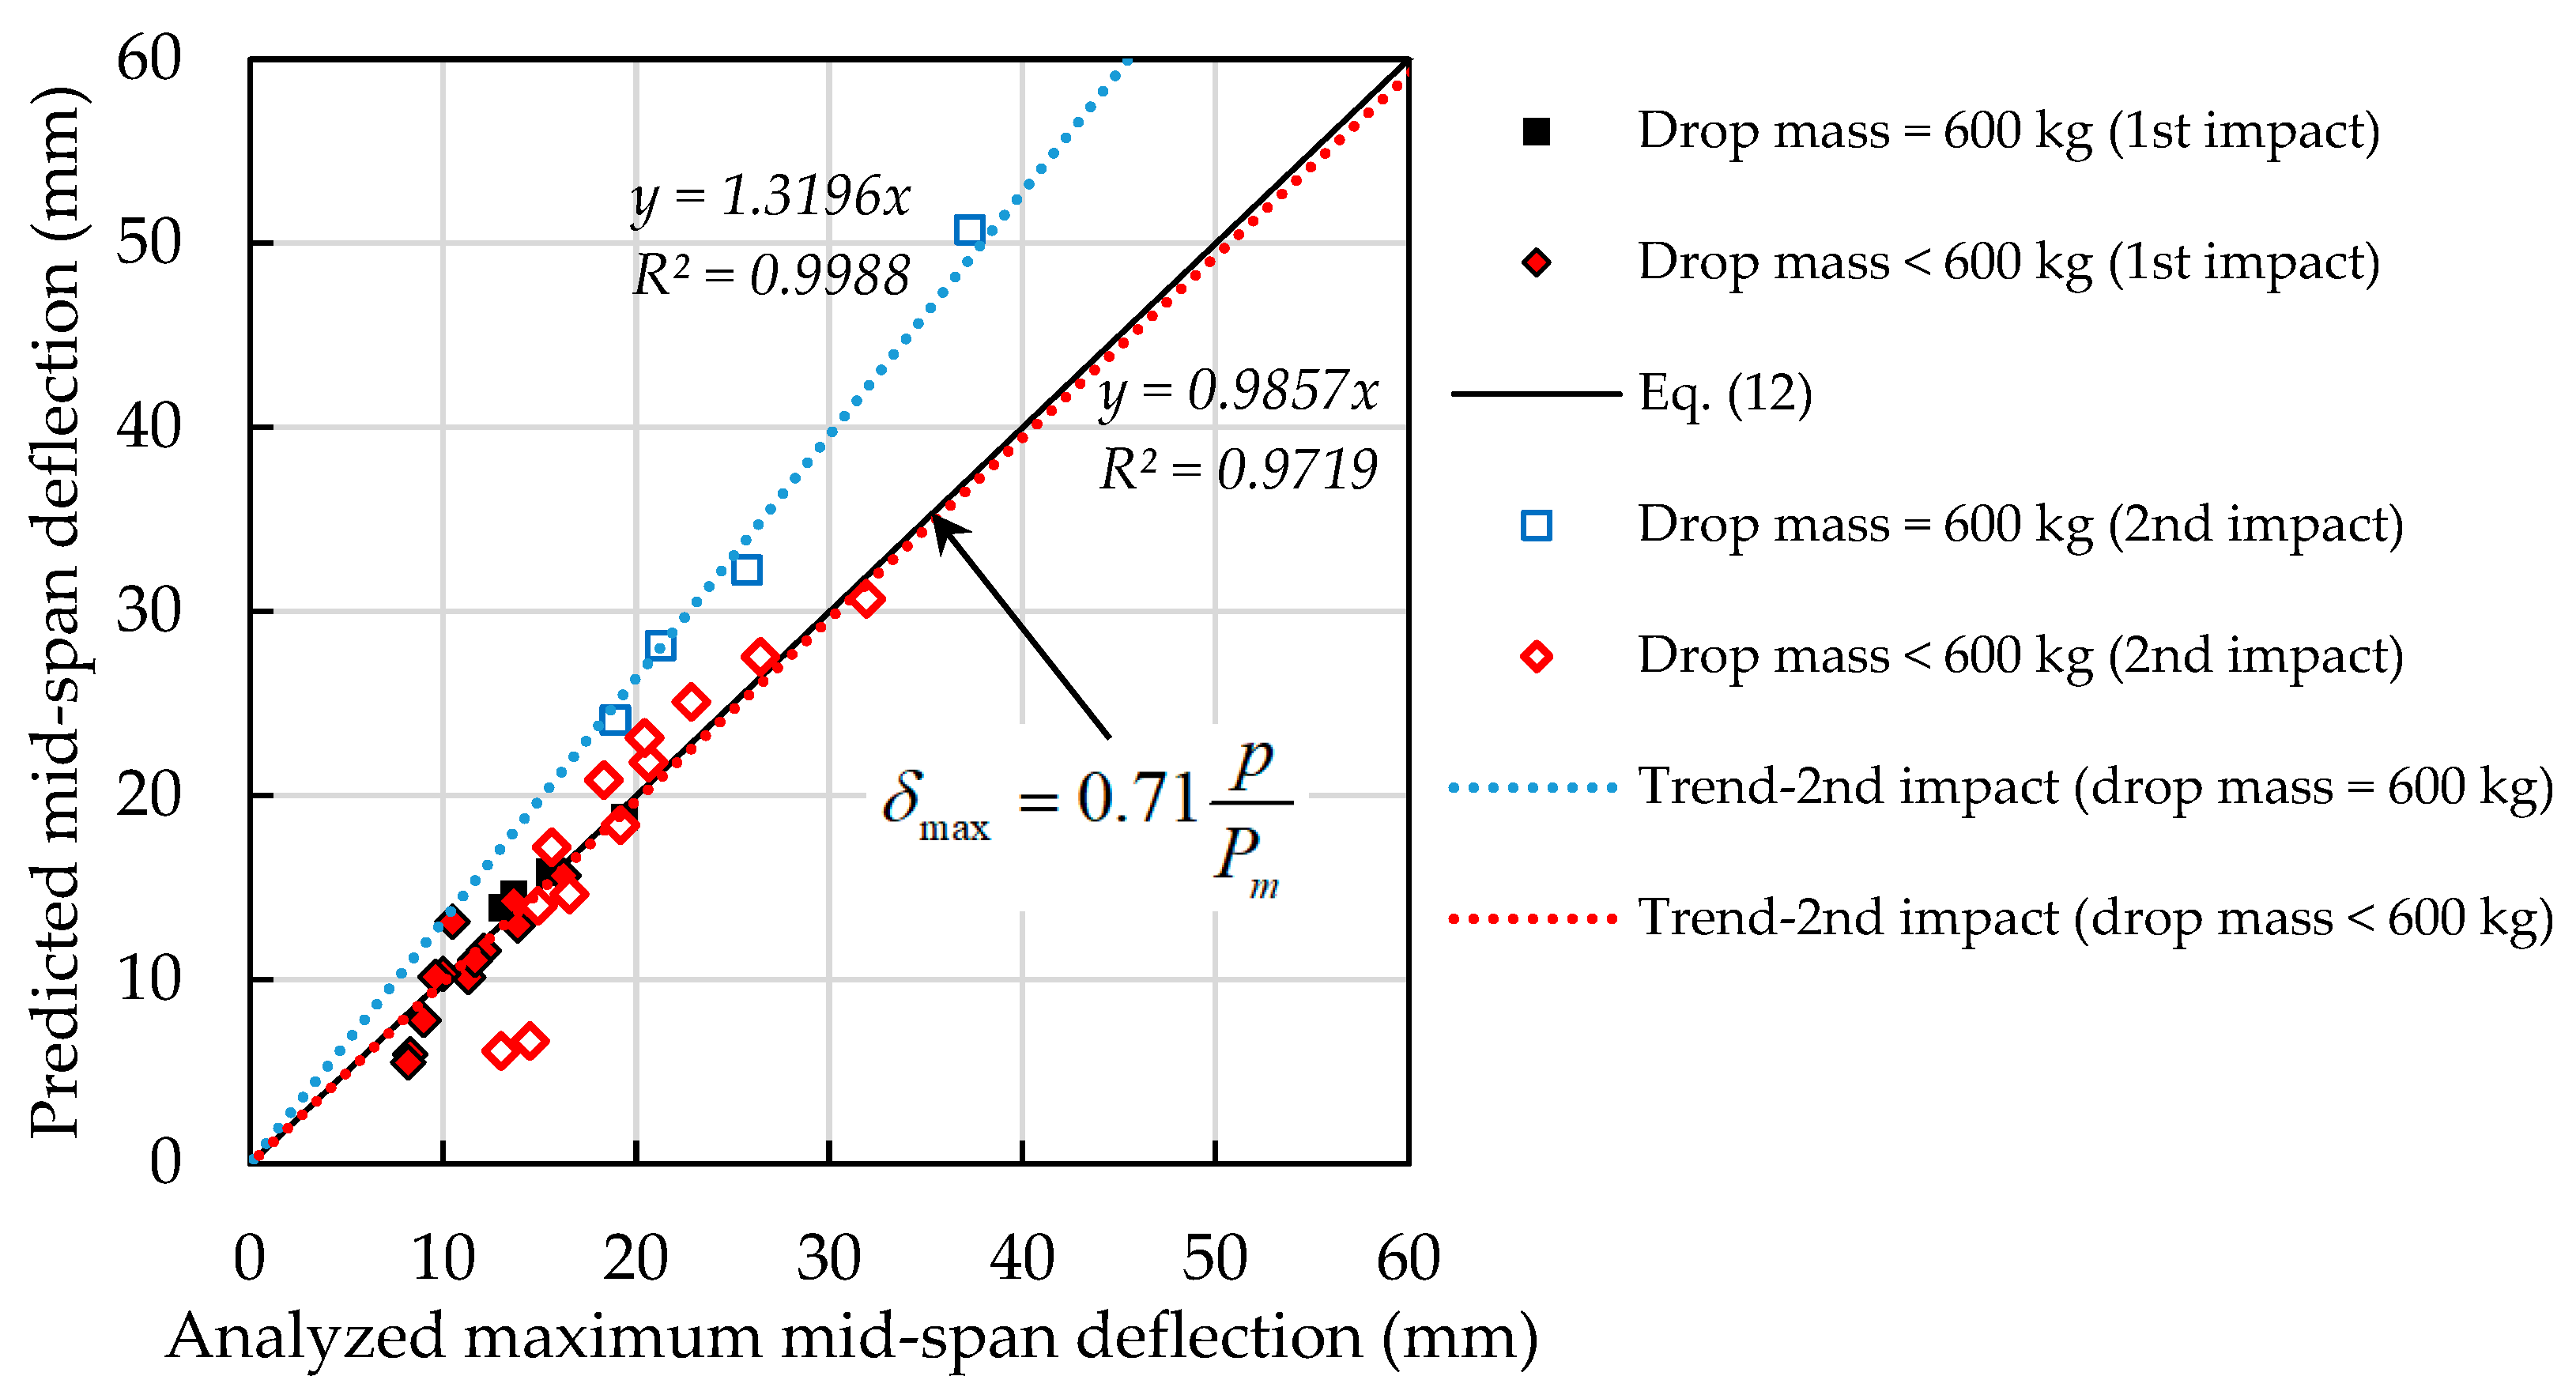
- The newly proposed modified equation, which included the effect of the colliding index on the mid-span defection, yielded a more accurate result in predicting the maximum mid-span deflection of every specimen under equal energy but different momentum impact.
- In this study, the investigation was carried out to reveal the effect of impact momentum and axial load. In future studies, damage assessment, evaluation of the impact capacity of the damaged RC member, and the strengthening method shall be further researched.
Author Contributions
Funding
Institutional Review Board Statement
Informed Consent Statement
Data Availability Statement
Conflicts of Interest
References
- Hansapinyo, C.; Latcharote, P.; Limkatanyu, S. Seismic building damage prediction from GIS-based building data using artificial intelligence system. Front. Built Environ. 2020, 6, 576919. [Google Scholar] [CrossRef]
- Ketsap, A.; Hansapinyo, C.; Kronprasert, N.; Limkatanyu, S. Uncertainty and Fuzzy Decisions in Earthquake Risk Evaluation of Buildings. Eng. J. 2019, 23, 89–105. [Google Scholar] [CrossRef]
- Saicheur, K.; Hansapinyo, C. Seismic Loss Estimation and Reduction after Structural Rehabilitation in Chiang Rai City. Walailak J. Sci. Technol. 2017, 14, 485–499. [Google Scholar]
- Saicheur, K.; Hansapinyo, C. Structural repair prioritization of buildings damaged after earthquake using fuzzy logic model. J. Disaster Res. 2016, 11, 559–565. [Google Scholar] [CrossRef]
- Zhao, M.; Wu, G.; Wang, K. Comparative Analysis of Dynamic Response of Damaged Wharf Frame Structure under the Combined Action of Ship Collision Load and Other Static Loads. Buildings 2022, 12, 1131. [Google Scholar] [CrossRef]
- Hansapinyo, C.; Wongmatar, P.; Vimonsatit, V.; Chen, W. Pounding of Seismically Designed Low-rise Reinforced Concrete Frames. Proc. Inst. Civ. Eng. Struct. Build. 2019, 172, 819–835. [Google Scholar] [CrossRef]
- Wongmatar, P.; Hansapinyo, C.; Bi, K.; Vimonsatit, V. The effect of shear and bending capacities on impact behavior of RC beams. In Proceedings of the 24th Australian Conference on the Mechanics of Structures and Materials (ACMSM24), Perth, Australia, 6–9 December 2016; Taylor and Francis: Abingdon, UK, 2016; pp. 561–566. [Google Scholar]
- Wongmatar, P.; Hansapinyo, C.; Vimonsatit, V.; Chen, W. Recommendations for Designing Reinforced Concrete Beams Against Low Velocity Impact Loads. Int. J. Struct. Stab. Dyn. 2018, 18, 1850104. [Google Scholar] [CrossRef]
- Pham, T.M.; Hao, H. Plastic hinges and inertia forces in RC beams under impact loads. Int. J. Impact. Eng. 2017, 103, 1–11. [Google Scholar] [CrossRef]
- Zhao, D.; Yi, W.; Kunnath, S.K. Shear mechanisms in reinforced concrete beams under impact loading. J. Struct. Eng. 2017, 143, 04017089. [Google Scholar] [CrossRef]
- Saatic, S.; Vecchio, F.J. Effects of shear mechanisms on impact behavior of reinforced concrete beams. ACI Struct. J. 2009, 106, 78–86. [Google Scholar]
- Ožbolt, J.; Sharma, A. Numerical simulation of reinforced concrete beams with different shear reinforcements under dynamic impact loads. Int. J. Impact. Eng. 2011, 38, 940–950. [Google Scholar] [CrossRef]
- Magnusson, J.; Hallgren, M.; Ansell, A. Air-blast-loaded, high-strength concrete beams. Part I: Experimental investigation. Mag. Concr. Res. 2010, 62, 127–136. [Google Scholar] [CrossRef]
- Jahami, A.; Temsah, Y.; Khatib, J.; Baalbaki, O.; Kenai, S. The behavior of CFRP strengthened RC beams subjected to blast loading. Mag. Civil. Eng. 2021, 103, 10309. [Google Scholar]
- Thilakarathna, H.M.I.; Thambiratnam, D.P.; Dhanasekar, M.; Perera, N. Numerical simulation of axially loaded concrete columns under transverse impact and vulnerability assessment. Int. J. Impact. Eng. 2010, 37, 1100–1112. [Google Scholar] [CrossRef]
- Liu, B.; Fan, W.; Guo, W.; Chen, B.; Liu, R. Experimental investigation and improved FE modeling of axially-loaded circular RC columns under lateral impact loading. Eng. Struct. 2017, 152, 619–642. [Google Scholar] [CrossRef]
- Gholipour, G.; Zhang, C.; Mousavi, A.A. Effects of axial load on nonlinear response of RC columns subjected to lateral impact load: Ship-pier collision. Eng. Fail. Anal. 2018, 91, 397–418. [Google Scholar] [CrossRef]
- Hansapinyo, C.; Limkatanyu, S.; Zhang, H.; Imjai, T. Residual Strength of Reinforced Concrete Beams under Sequential Small Impact Loads. Buildings. 2021, 11, 518. [Google Scholar] [CrossRef]
- Jin, L.; Zhang, R.; Du, X.; Dou, G. Structural behavior of the steel fiber reinforced concrete beam under multiple impact loadings: An experimental investigation. Int. J. Damage Mech. 2019, 29, 503–526. [Google Scholar] [CrossRef]
- Kishi, N.; Mikami, H.; Matsuoka, K.G.; Ando, T. Impact Behavior of Shear-Failure-Type RC Beams Without Shear Rebar. Int. J. Impact Eng. 2002, 27, 955–968. [Google Scholar] [CrossRef]
- Fujikake, K.; Li, B.; Soeun, S. Impact response of reinforced concrete beam and its analytical evaluation. J. Struct. Eng. ASCE 2009, 135, 938–950. [Google Scholar]
- Tachibana, S.; Masuya, H.; Nakamura, S. Performance based design of reinforced concrete beams under impact. Nat. Hazards Earth Syst. Sci. 2010, 10, 1069–1078. [Google Scholar] [CrossRef]
- Tantrapongsaton, W.; Hansapinyo, C.; Wongmatar, P.; Limkatanyu, S.; Zhang, H.; Charatpangoon, B. Analysis of colliding index on impact behavior of RC columns under repeated impact loading. Comput. Concr. 2022, 31, 19–32. [Google Scholar]
- Yu, Y.J.; Cho, J.Y. Analysis of Effect of Momentum on the Behavior of RC Beams Under Low Velocity Impact Loading. Struct. Under Shock. Impact XV WIT Trans. Built Environ. 2018, 180, 149–157. [Google Scholar]
- Hwang, H.J.; Yang, F.; Zang, L.; Baek, J.W.; Ma, G. Effect of Impact Load on Splice Length of Reinforcing Bars. Int. J. Concr. Struct. Mater. 2020, 14, 40. [Google Scholar] [CrossRef]
- Jin, L.; Lan, Y.; Zhang, R.; Du, X. Impact resistance of RC beams under different combinations of mass and velocity: Mesoscale numerical analysis. Arch. Civ. Mech. Eng. 2020, 20, 119. [Google Scholar] [CrossRef]
- ACI 318–19. Building Code Requirements for Reinforced Concrete and Commentary; American Concrete Institute: Farmington Hills, MI, USA, 2019. [Google Scholar]
- LS–DYNA. LS-DYNA Keyword User’s Manual; Version 971; Livermore Software Technology Corporation: Livermore, CA, USA, 2007; Volume 1. [Google Scholar]
- Hallquist, J.O. LS-DYNA Theory Manual; Livermore Software Technology Cooperation: Livermore, CA, USA, 2006. [Google Scholar]
- Liu, G.R.; Quek, S.S. The Finite Element Method; Butterwirth-Heineman, Elsevier Science Ltd.: Oxford, UK, 2003. [Google Scholar]
- Hughes, T.J.R.; Liu, W.K. Nonlinear finite element analysis of shells: Part II. Three-dimensional shells. Comput. Methods Appl. Mech. Eng. 1981, 27, 331–362. [Google Scholar] [CrossRef]
- Hughes, T.J.R.; Liu, W.K. Nonlinear finite element analysis of shells: Part I. Two-dimensional shells. Comput. Methods Appl. Mech. Eng. 1981, 27, 167–181. [Google Scholar] [CrossRef]
- Tantrapongsaton, W.; Hansapinyo, C. Impact response of reinforced concrete columns with different axial load under low-velocity impact loading. Key Eng. Mater. 2019, 803, 322–330. [Google Scholar] [CrossRef]
- Tantrapongsaton, W.; Hansapinyo, C.; Wongmatar, P.; Chaisomphob, T. Flexural reinforced concrete members with minimum reinforcement under low-velocity impact load. Int. J. GEOMATE 2018, 14, 129–136. [Google Scholar] [CrossRef]
- Malvar, L.J.; Ross, A.C. Review of strain rate effects for concrete in tension. ACI Mater. J. 1998, 95, 735–739. [Google Scholar]
- CEB Bulletins. Concrete Structures under impact and impulsive loading. In Comité Euro-International du Béton; Bulletin d’Information: Lausanne, Switzerland, 1988. [Google Scholar]
- Malvar, L.J. Review of static and dynamic properties of steel reinforcing bars. ACI Mater. J. 1998, 95, 609–616. [Google Scholar]
- Johansson, A.; Fredberg, J. Structural Behaviour of Prestressed Concrete Beams during Impact Loading. Master’s Thesis, Chalmers University of Technology, Gothenburg, Sweden, 2015. [Google Scholar]
- Qin, F.; Pingan, W. Main factors affecting failure modes of blast loaded RC beams. Chin. J. Comput. Mech. 2003, 1, 39–42. [Google Scholar]
- Ye, J.; Wang, Y.; Cai, J.; Chen, Q.; He, A. Evaluation of Residual Lateral Capacities of Impact-Damaged Reinforced Concrete Members. Buildings 2022, 12, 669. [Google Scholar] [CrossRef]


| Specimen | Axial Load Ratio (P/Agfc’) | Dropped Mass (kg) | Velocity (m/s) | Momentum (kg·m/s) | Impact Energy, Ek (J) |
|---|---|---|---|---|---|
| C-0.0-1112 | 0.0 | 600 | 1.85 | 1112 * | 1029 * |
| C-0.0-786 | 300 | 2.62 | 786 * | ||
| C-0.0-556 | 150 | 3.71 | 556 * | ||
| C-0.0-393 | 75 | 5.24 | 393 * | ||
| C-0.1-1112 | 0.1 | 600 | 1.85 | 1112 * | 1029 * |
| C-0.1-786 | 300 | 2.62 | 786 * | ||
| C-0.1-556 | 150 | 3.71 | 556 * | ||
| C-0.1-393 | 75 | 5.24 | 393 * | ||
| C-0.2-1112 | 0.2 | 600 | 1.85 | 1112 * | 1029 * |
| C-0.2-786 | 300 | 2.62 | 786 * | ||
| C-0.2-556 | 150 | 3.71 | 556 * | ||
| C-0.2-393 | 75 | 5.24 | 393 * | ||
| C-0.3-1112 | 0.3 | 600 | 1.85 | 1112 * | 1029 * |
| C-0.3-786 | 300 | 2.62 | 786 * | ||
| C-0.3-556 | 150 | 3.71 | 556 * | ||
| C-0.3-393 | 75 | 5.24 | 393 * |
| Axial Load Ratio | Static Bending Capacity Pub (kN) | Static Shear Capacity Puv (kN) | Capacity Ratio (Puv/Pub) |
|---|---|---|---|
| 0.0 | 158.7 | 148.0 | 0.93 |
| 0.1 | 179.7 | 170.0 | 0.95 |
| 0.2 | 200.5 | 192.0 | 0.96 |
| 0.3 | 220.8 | 214.0 | 0.97 |
| Segment | Material Model | Parameter | Value |
|---|---|---|---|
| Concrete | *MAT_CONCRETE_DAMAGE_REL3 (*MAT_072R3) | Density | 2400 kg/m3 |
| Compressive strength | 40.0 MPa | ||
| Reinforcement | *MAT_PIECEWISE_LINEAR_PLASTICITY (*MAT_024) | Density | 7850 kg/m3 |
| Young’s modulus | 200 GPa | ||
| Poisson’s ratio | 0.3 | ||
| Tangent modulus | 2 GPa | ||
| Yield strength (Rebar) | 500 MPa | ||
| Yield strength (Stirrup) | 318 MPa | ||
| Prestressing wire | *MAT_ELASTIC (*MAT_001) | Density | 7850 kg/m3 |
| Young’s modulus | 167 GPa | ||
| Poisson’s ratio | 0.3 | ||
| Guiding cable | *MAT_NULL (*MAT_009) | Density | 7850 kg/m3 |
| Young’s modulus | 167 GPa | ||
| Poisson’s ratio | 0.001 | ||
| Thermal element | *MAT_ELASTIC_PLASTIC_THERMAL (*MAT_004) | Density | 7850 kg/m3 |
| Young’s modulus | 200 GPa | ||
| Poisson’s ratio | 0.3 | ||
| CTE | 0.001 | ||
| Hammer | *MAT_RIGID (*MAT_020) | Young’s modulus | 200 GPa |
| Poisson’s ratio | 0.3 | ||
| Supports | *MAT_RIGID (*MAT_020) | Young’s modulus | 200 GPa |
| Poisson’s ratio | 0.3 |
| Specimen | Colliding Index (Ek/p) | Peak Impact Force (kN) | Peak Mid-Span Deflection (mm) | Absorbed Energy (J) | |||
|---|---|---|---|---|---|---|---|
| 1st Impact | 2nd Impact | 1st Impact | 2nd Impact | 1st Impact | 2nd Impact | ||
| C-0.0-1112 | 0.93 | 124.24 | 57.87 | 19.39 | 37.27 | 881 | 956 |
| C-0.0-786 | 1.31 | 165.71 | 59.98 | 16.23 | 31.93 | 740 | 821 |
| C-0.0-556 | 1.85 | 212.44 | 83.61 | 13.64 | 26.43 | 624 | 734 |
| C-0.0-393 | 2.62 | 246.09 | 95.33 | 10.46 | 20.64 | 478 | 625 |
| C-0.1-1112 | 0.93 | 141.41 | 67.16 | 15.49 | 25.73 | 814 | 879 |
| C-0.1-786 | 1.31 | 186.14 | 101.29 | 13.85 | 22.85 | 696 | 789 |
| C-0.1-556 | 1.85 | 224.17 | 125.93 | 11.28 | 19.18 | 546 | 698 |
| C-0.1-393 | 2.62 | 257.87 | 182.96 | 8.97 | 14.91 | 350 | 571 |
| C-0.2-1112 | 0.93 | 142.82 | 67.59 | 13.63 | 21.27 | 788 | 862 |
| C-0.2-786 | 1.31 | 187.33 | 132.57 | 12.09 | 20.43 | 673 | 707 |
| C-0.2-556 | 1.85 | 221.96 | 166.31 | 9.97 | 18.31 | 511 | 608 |
| C-0.2-393 | 2.62 | 261.96 | 210.55 | 8.28 | 12.98 | 325 | 476 |
| C-0.3-1112 | 0.93 | 140.52 | 97.96 | 13.03 | 18.92 | 787 | 811 |
| C-0.3-786 | 1.31 | 188.63 | 136.91 | 11.64 | 15.62 | 669 | 652 |
| C-0.3-556 | 1.85 | 224.00 | 161.02 | 9.58 | 16.53 | 505 | 520 |
| C-0.3-393 | 2.62 | 263.82 | 206.77 | 8.17 | 14.48 | 321 | 545 |
Publisher’s Note: MDPI stays neutral with regard to jurisdictional claims in published maps and institutional affiliations. |
© 2022 by the authors. Licensee MDPI, Basel, Switzerland. This article is an open access article distributed under the terms and conditions of the Creative Commons Attribution (CC BY) license (https://creativecommons.org/licenses/by/4.0/).
Share and Cite
Tantrapongsaton, W.; Hansapinyo, C.; Limkatanyu, S.; Zhang, H.; Vimonsatit, V. Nonlinear Response of RC Columns Subjected to Equal Energy-Double Impact Loads. Buildings 2022, 12, 1420. https://doi.org/10.3390/buildings12091420
Tantrapongsaton W, Hansapinyo C, Limkatanyu S, Zhang H, Vimonsatit V. Nonlinear Response of RC Columns Subjected to Equal Energy-Double Impact Loads. Buildings. 2022; 12(9):1420. https://doi.org/10.3390/buildings12091420
Chicago/Turabian StyleTantrapongsaton, Warakorn, Chayanon Hansapinyo, Suchart Limkatanyu, Hexin Zhang, and Vanissorn Vimonsatit. 2022. "Nonlinear Response of RC Columns Subjected to Equal Energy-Double Impact Loads" Buildings 12, no. 9: 1420. https://doi.org/10.3390/buildings12091420
APA StyleTantrapongsaton, W., Hansapinyo, C., Limkatanyu, S., Zhang, H., & Vimonsatit, V. (2022). Nonlinear Response of RC Columns Subjected to Equal Energy-Double Impact Loads. Buildings, 12(9), 1420. https://doi.org/10.3390/buildings12091420