


Experimental Study on Freezing Mode to Reduce Frost Heave


Abstract
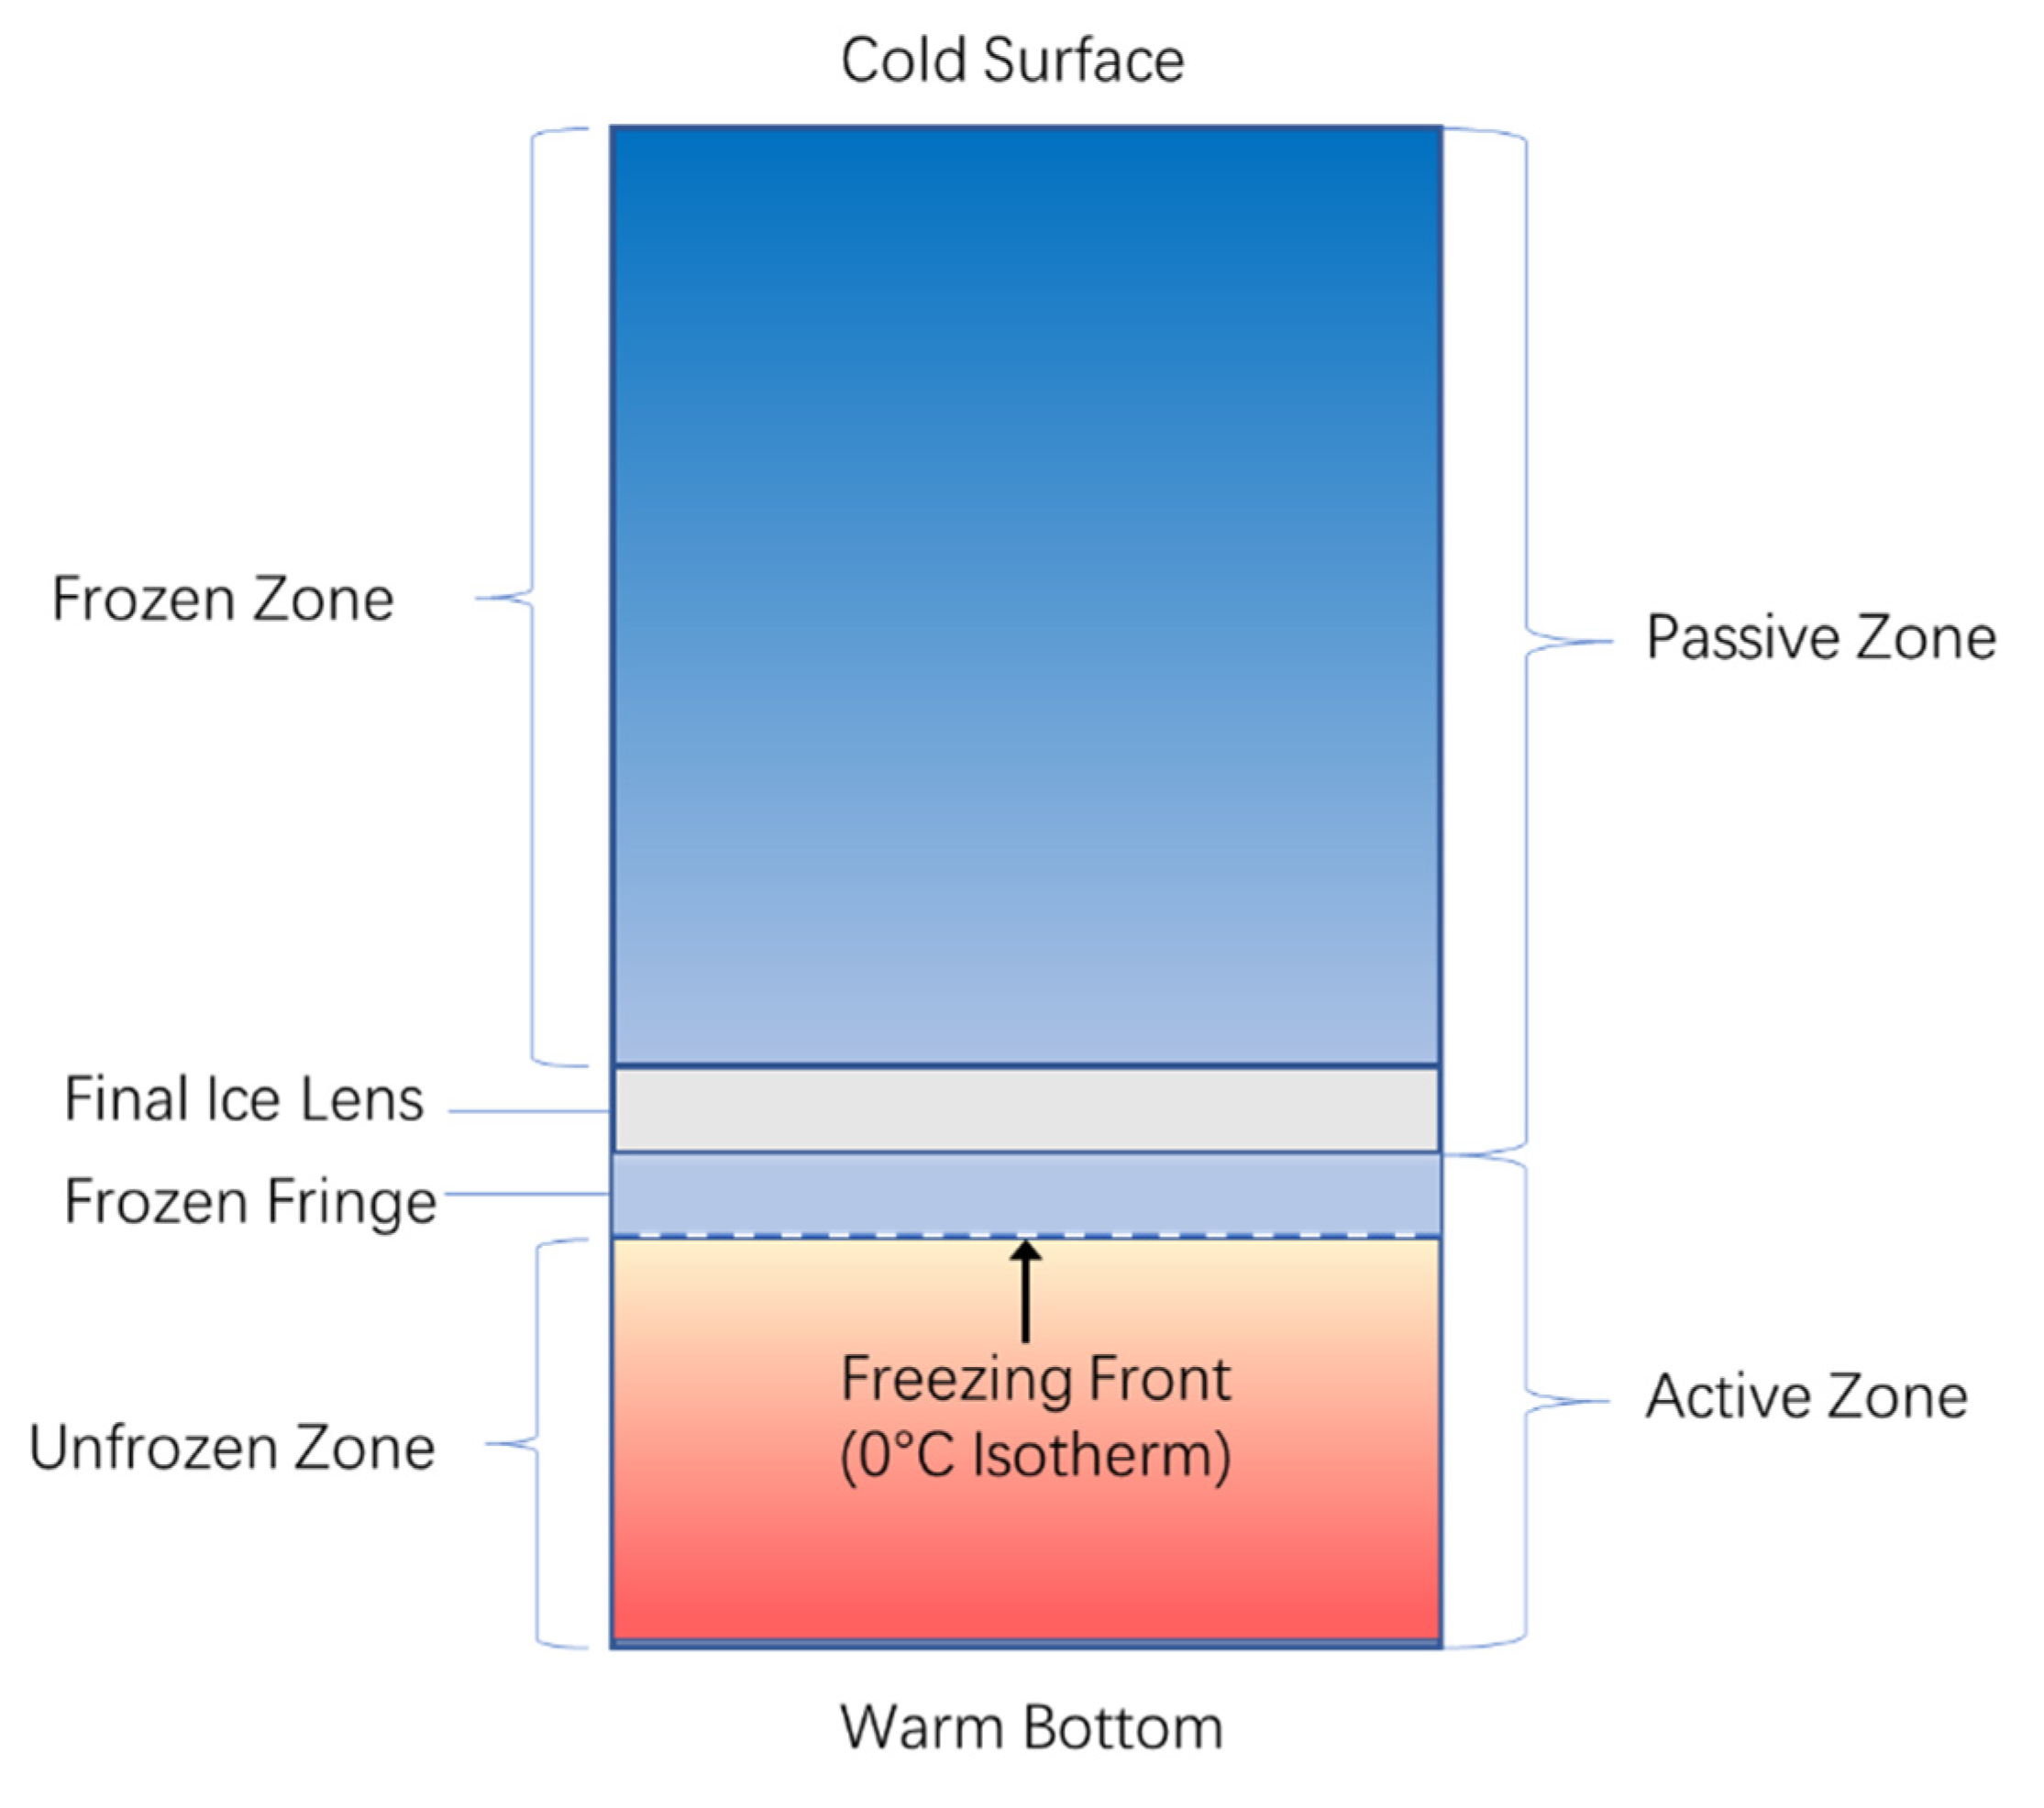
:1. Introduction
2. Apparatus and Materials
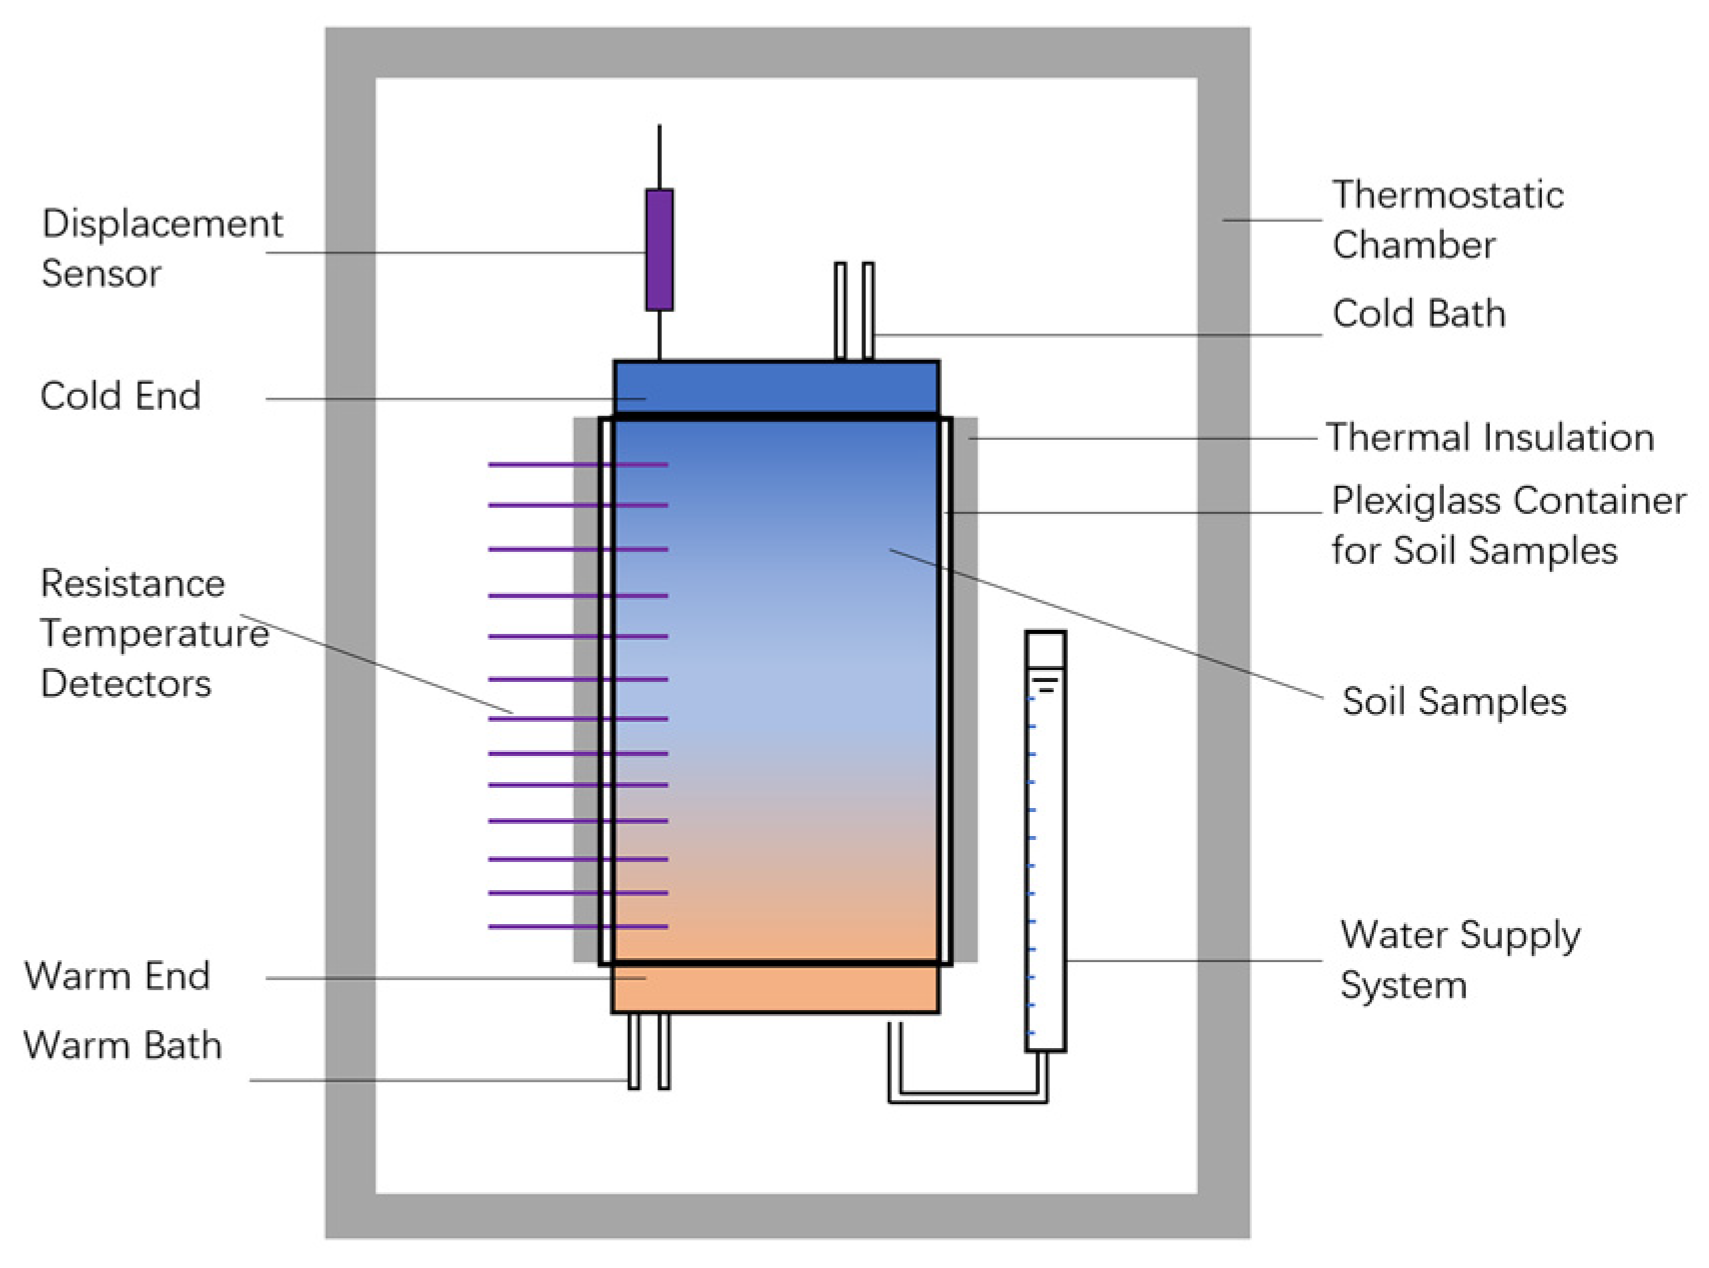
2.1. Apparatus
2.2. Materials
2.3. Methods
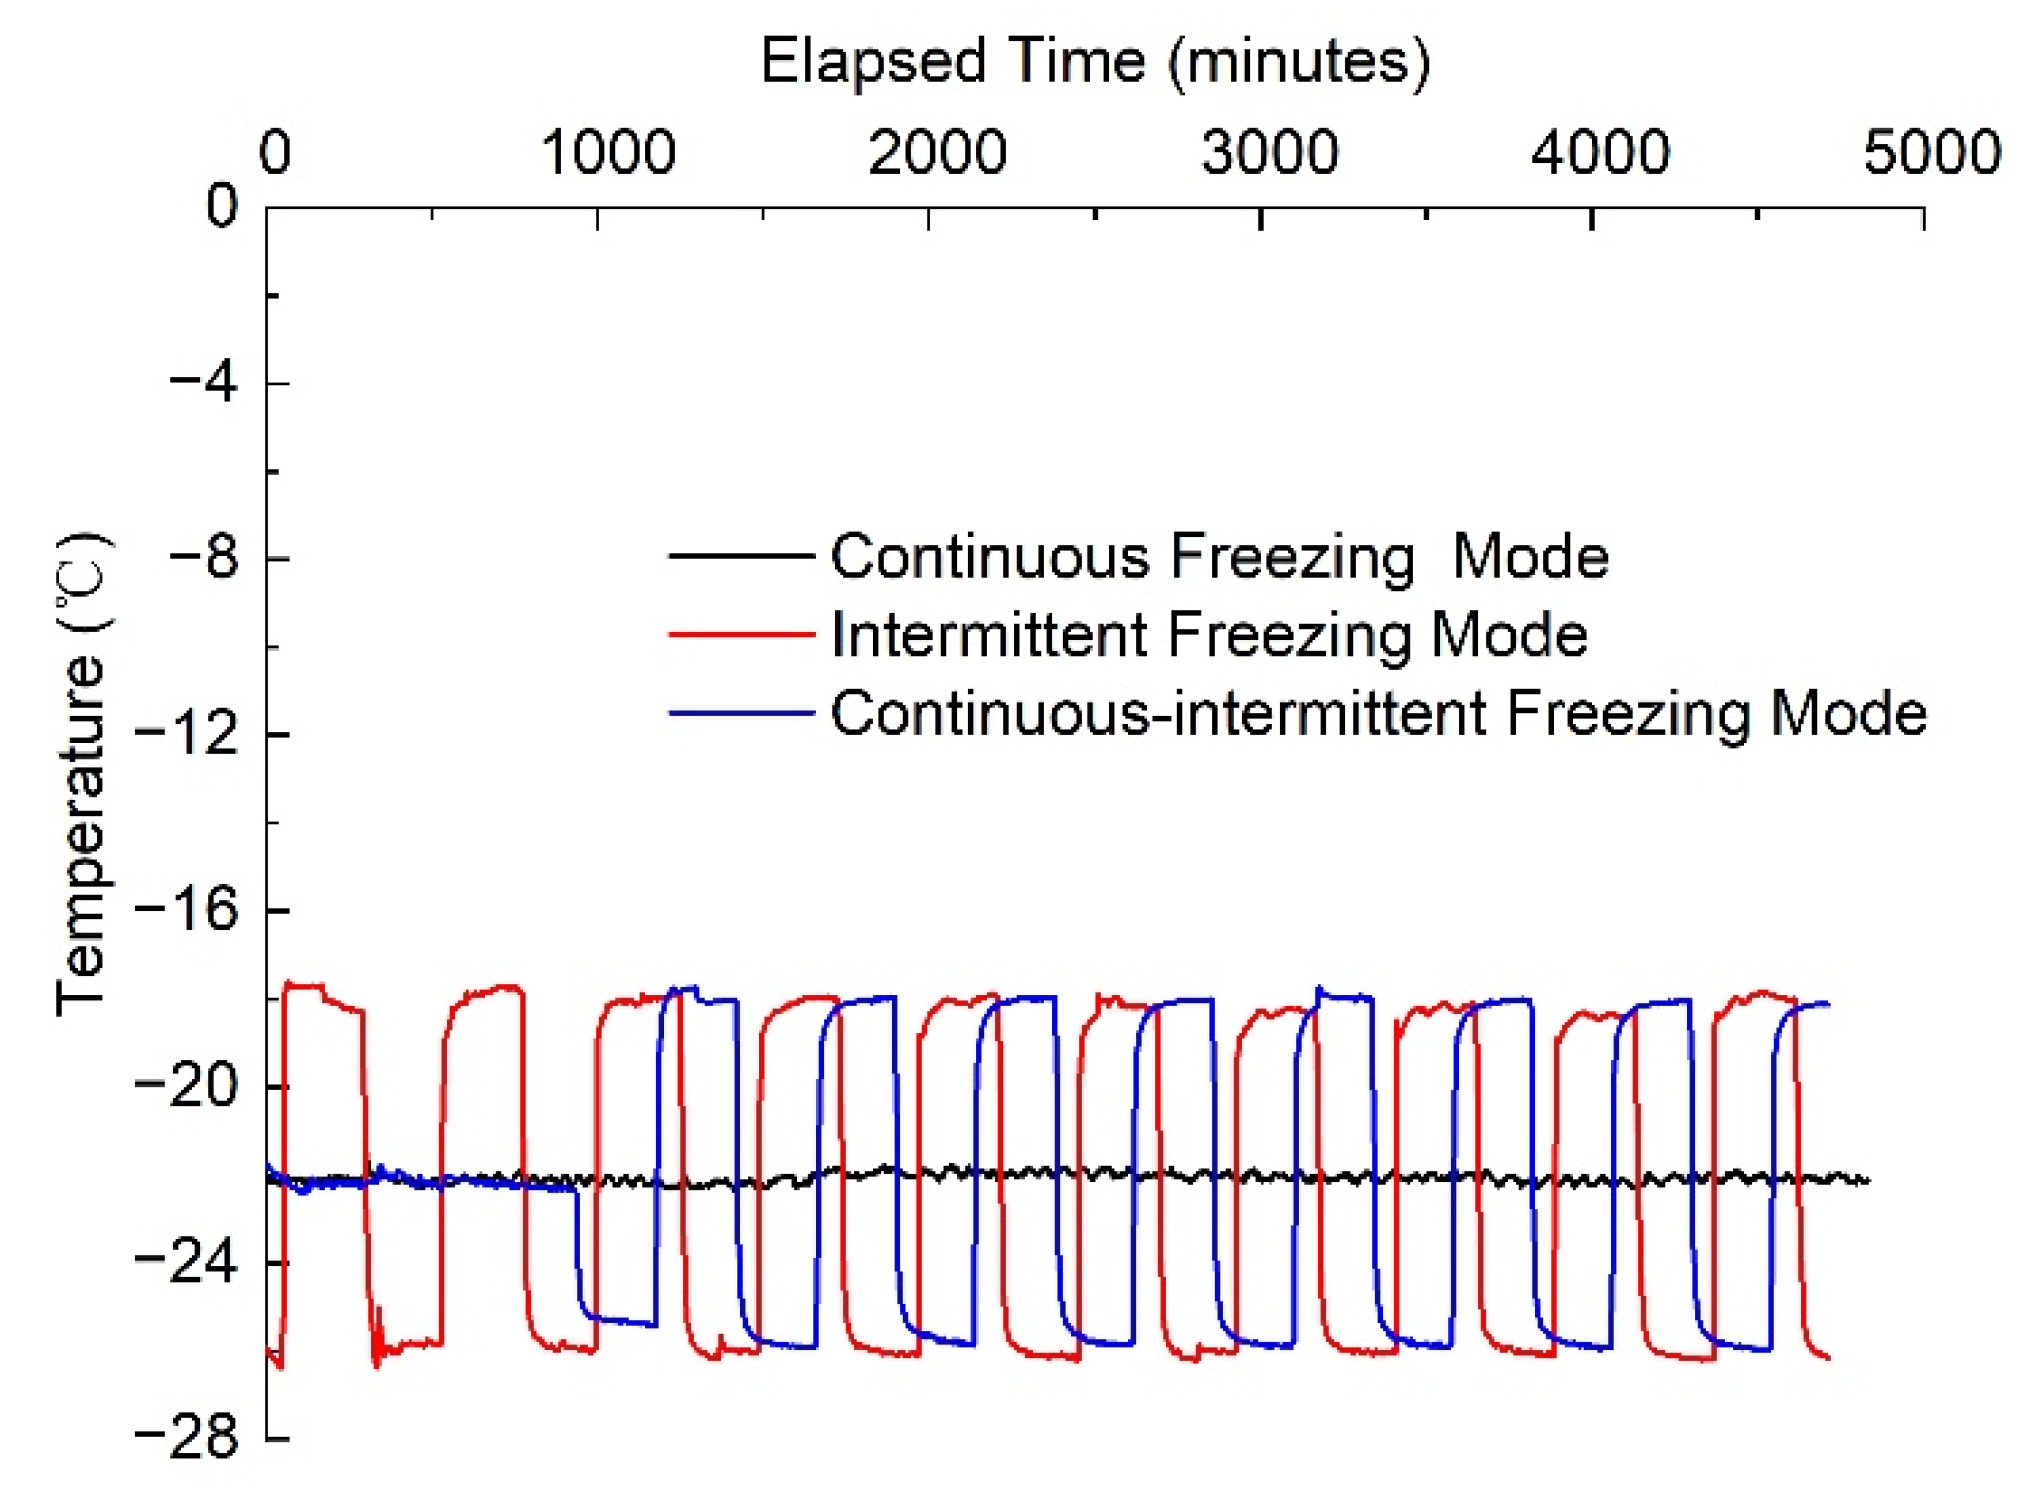
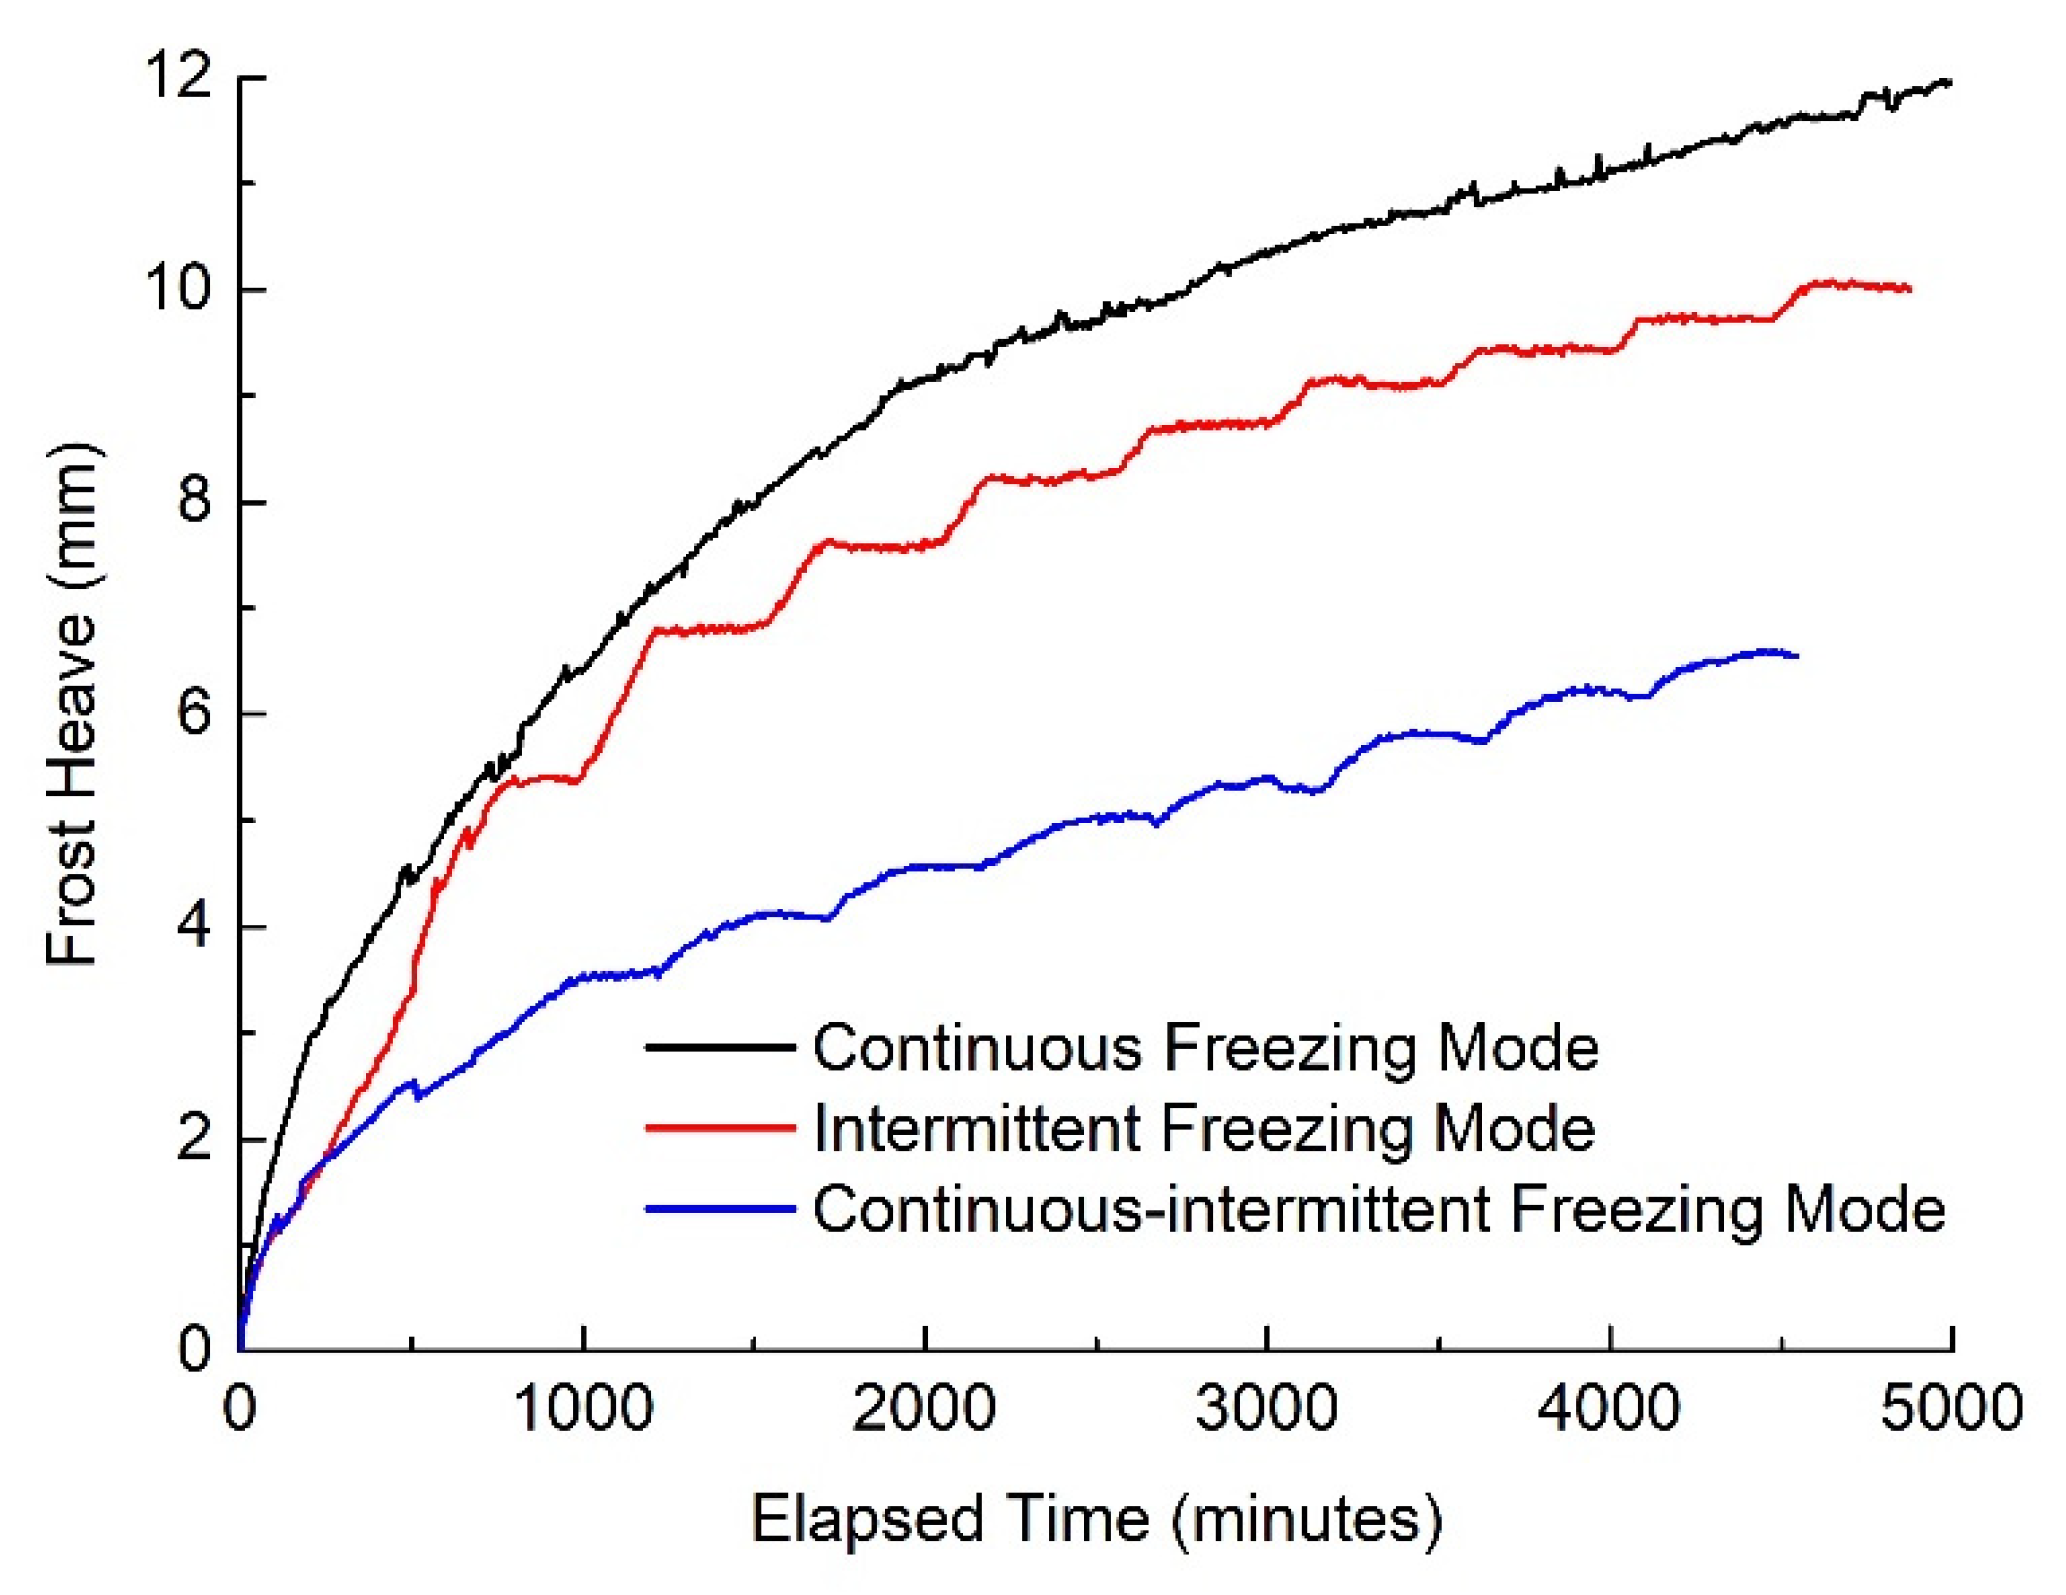
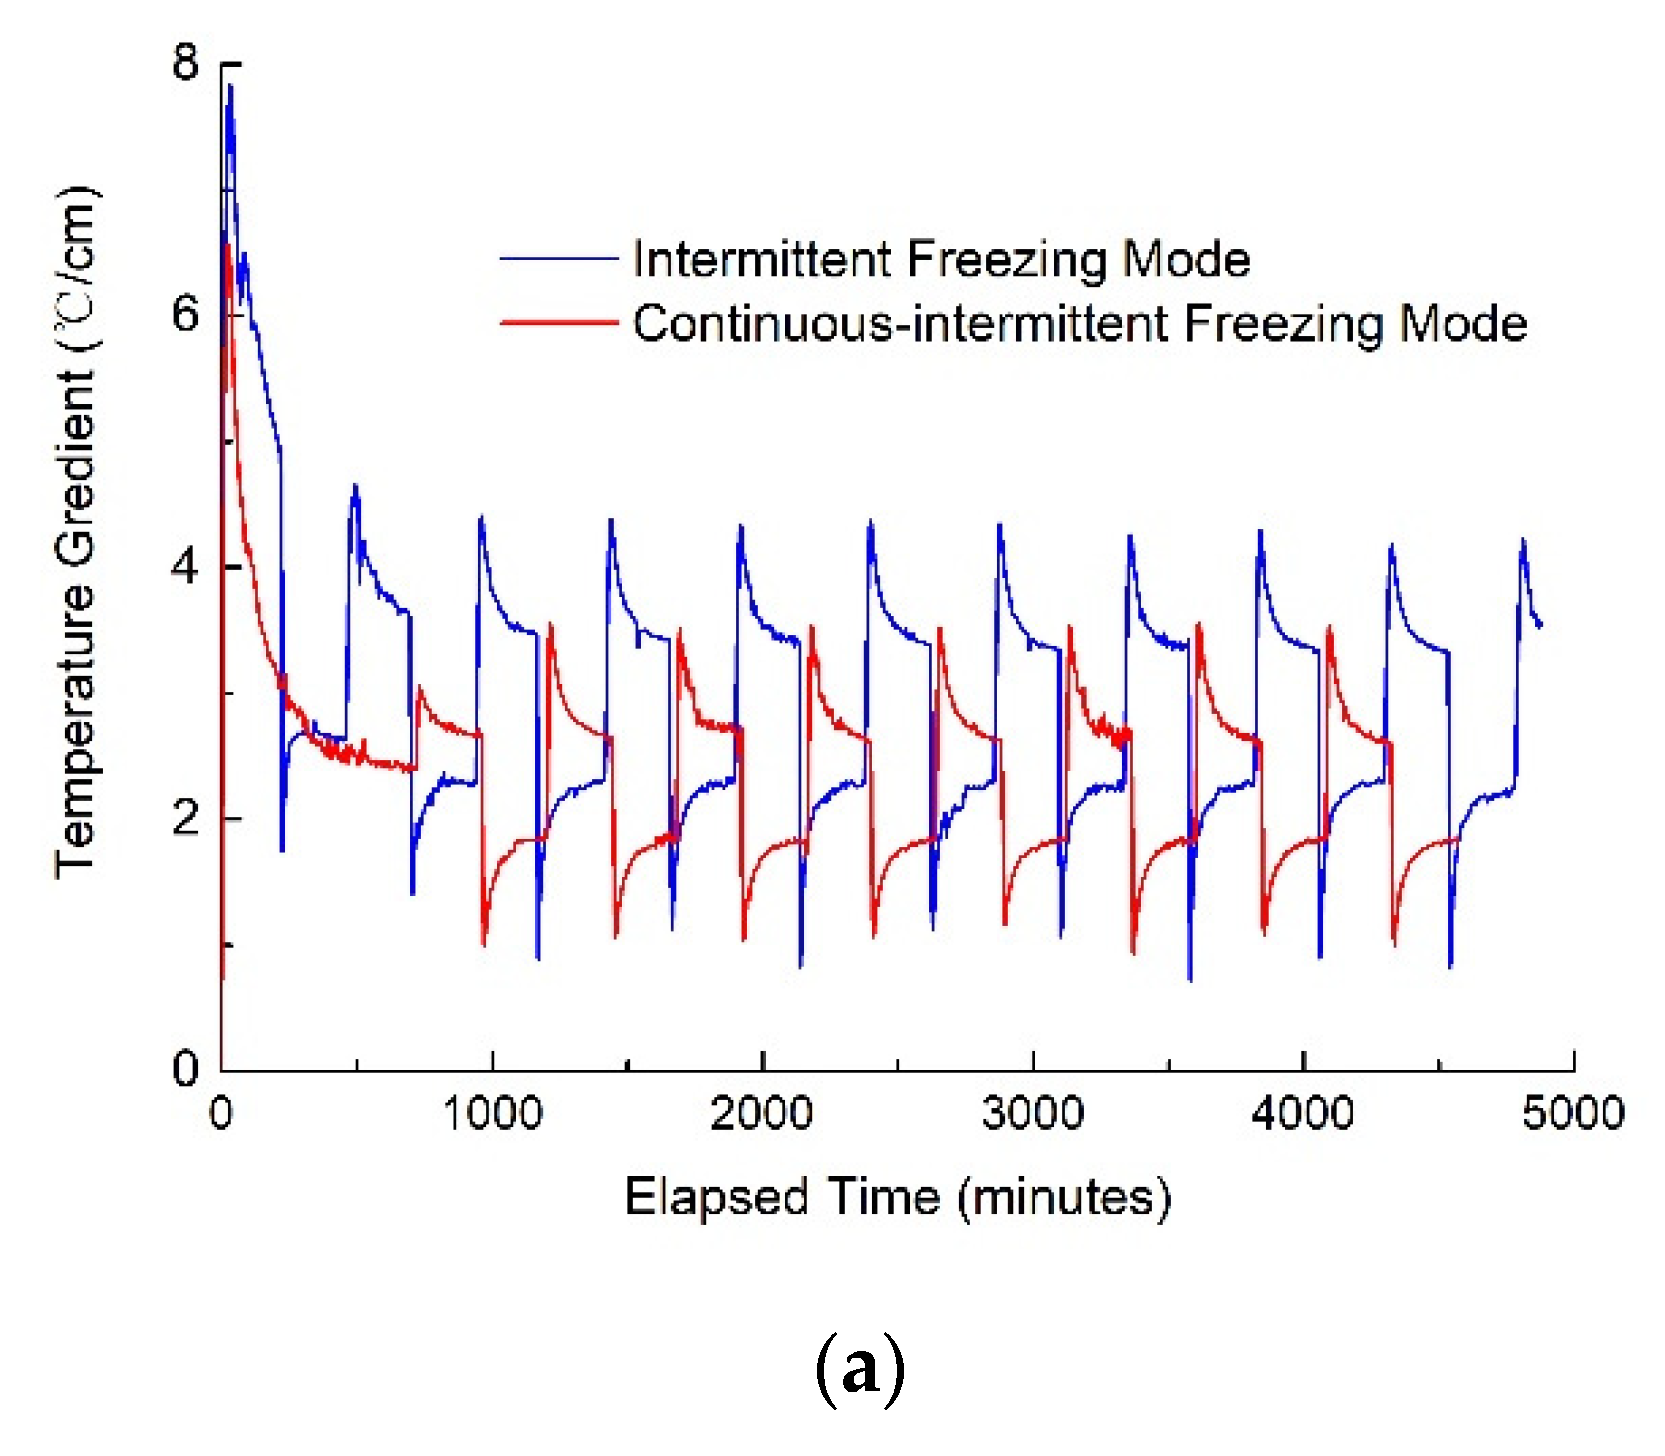
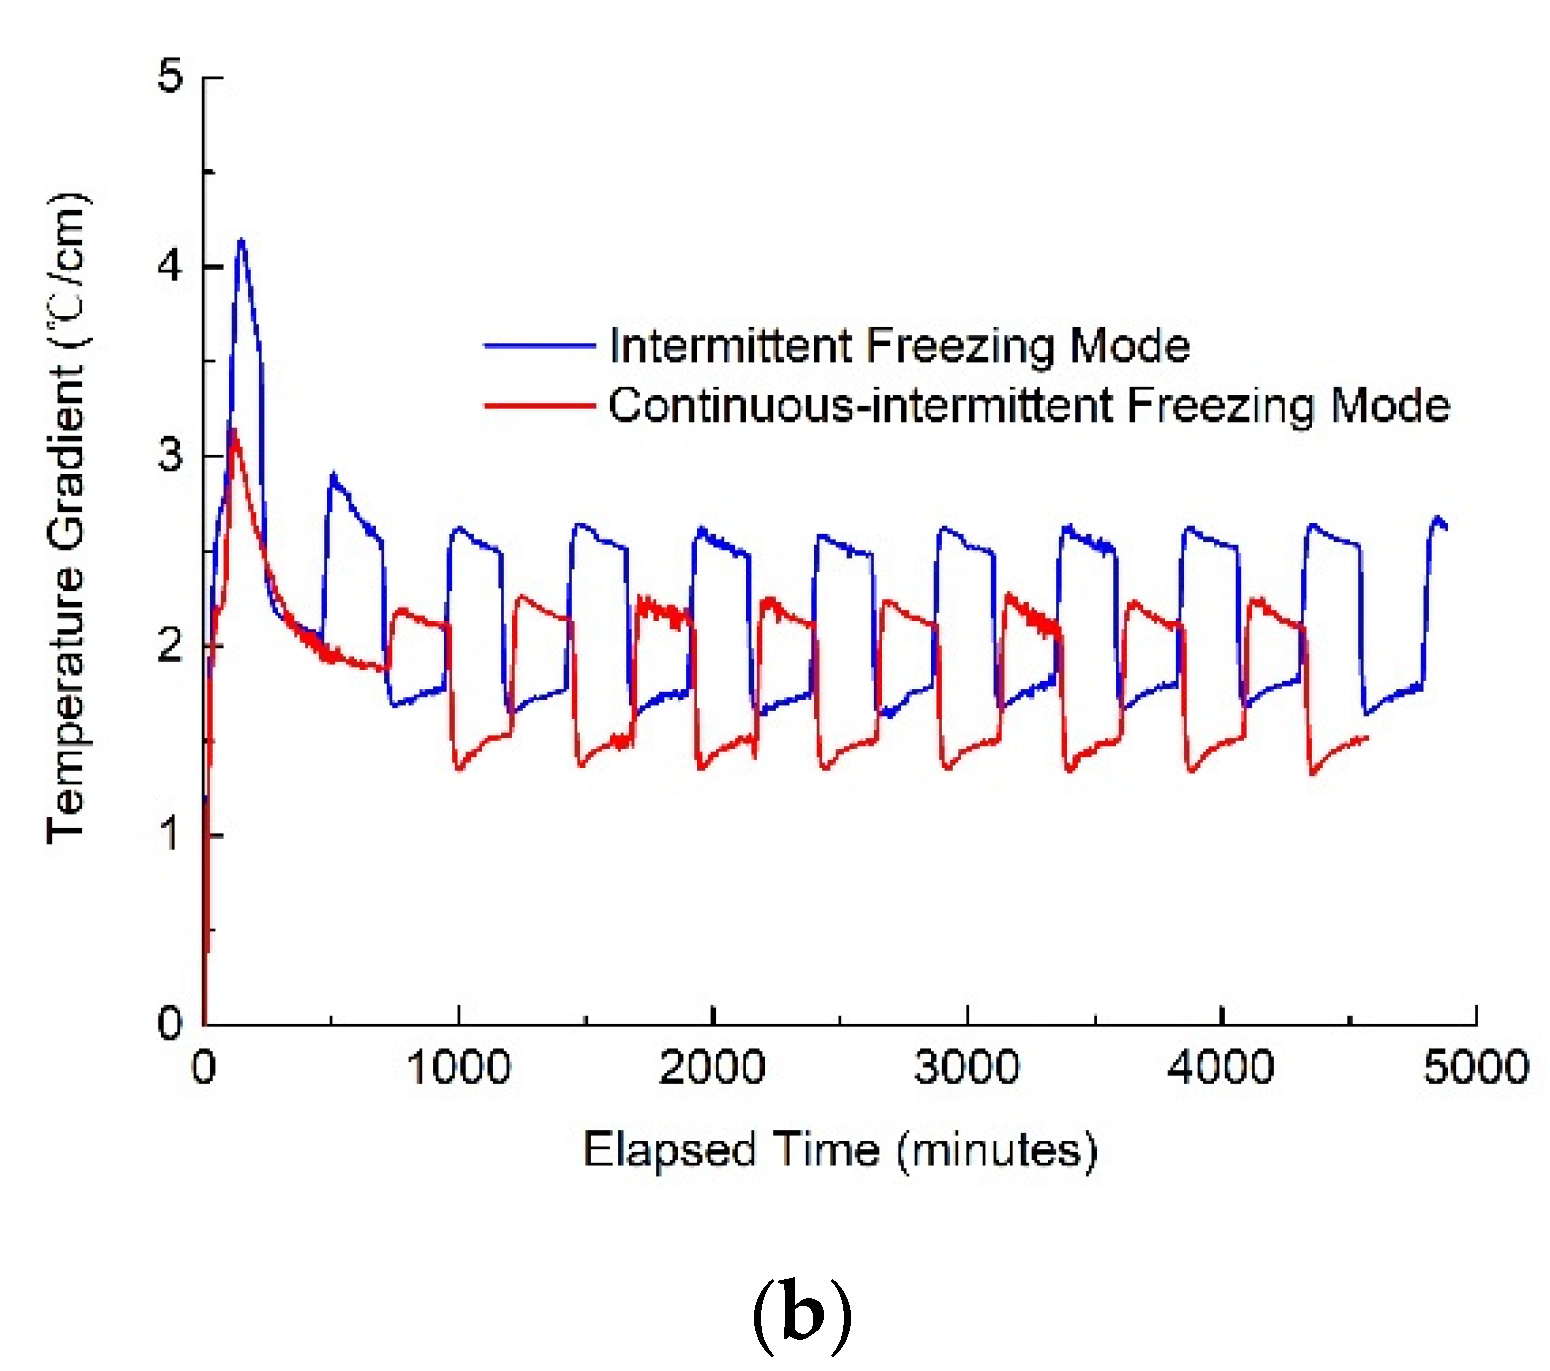
2.3.1. Frost Heave Tests in the Three Different Freezing Modes
2.3.2. Frost Heave Tests in the Continuous-Intermittent Freezing Mode
3. Results and Discussion
3.1. Effects of the Three Different Freezing Modes
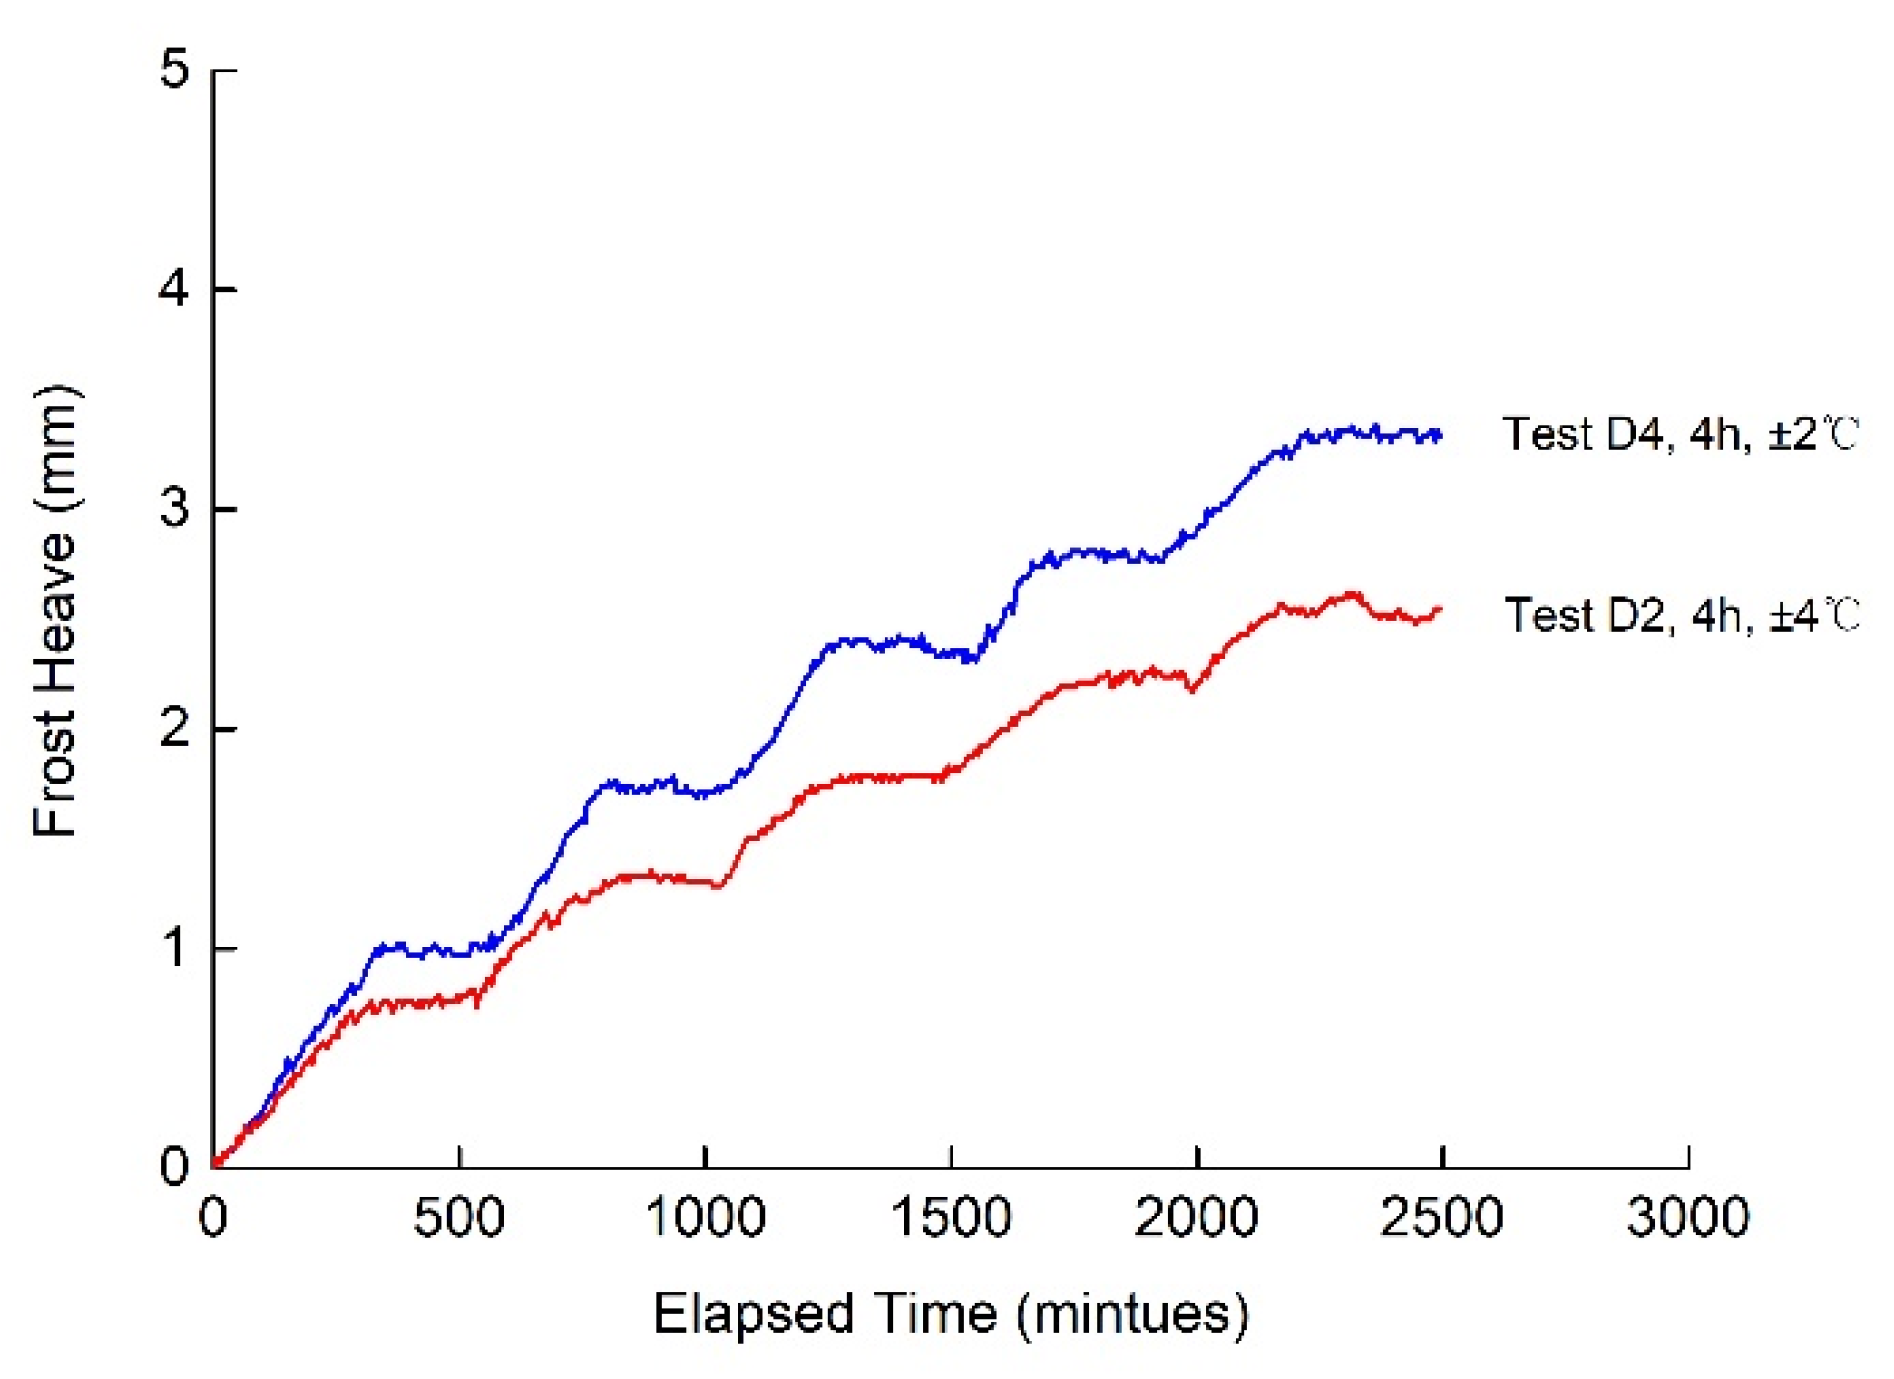
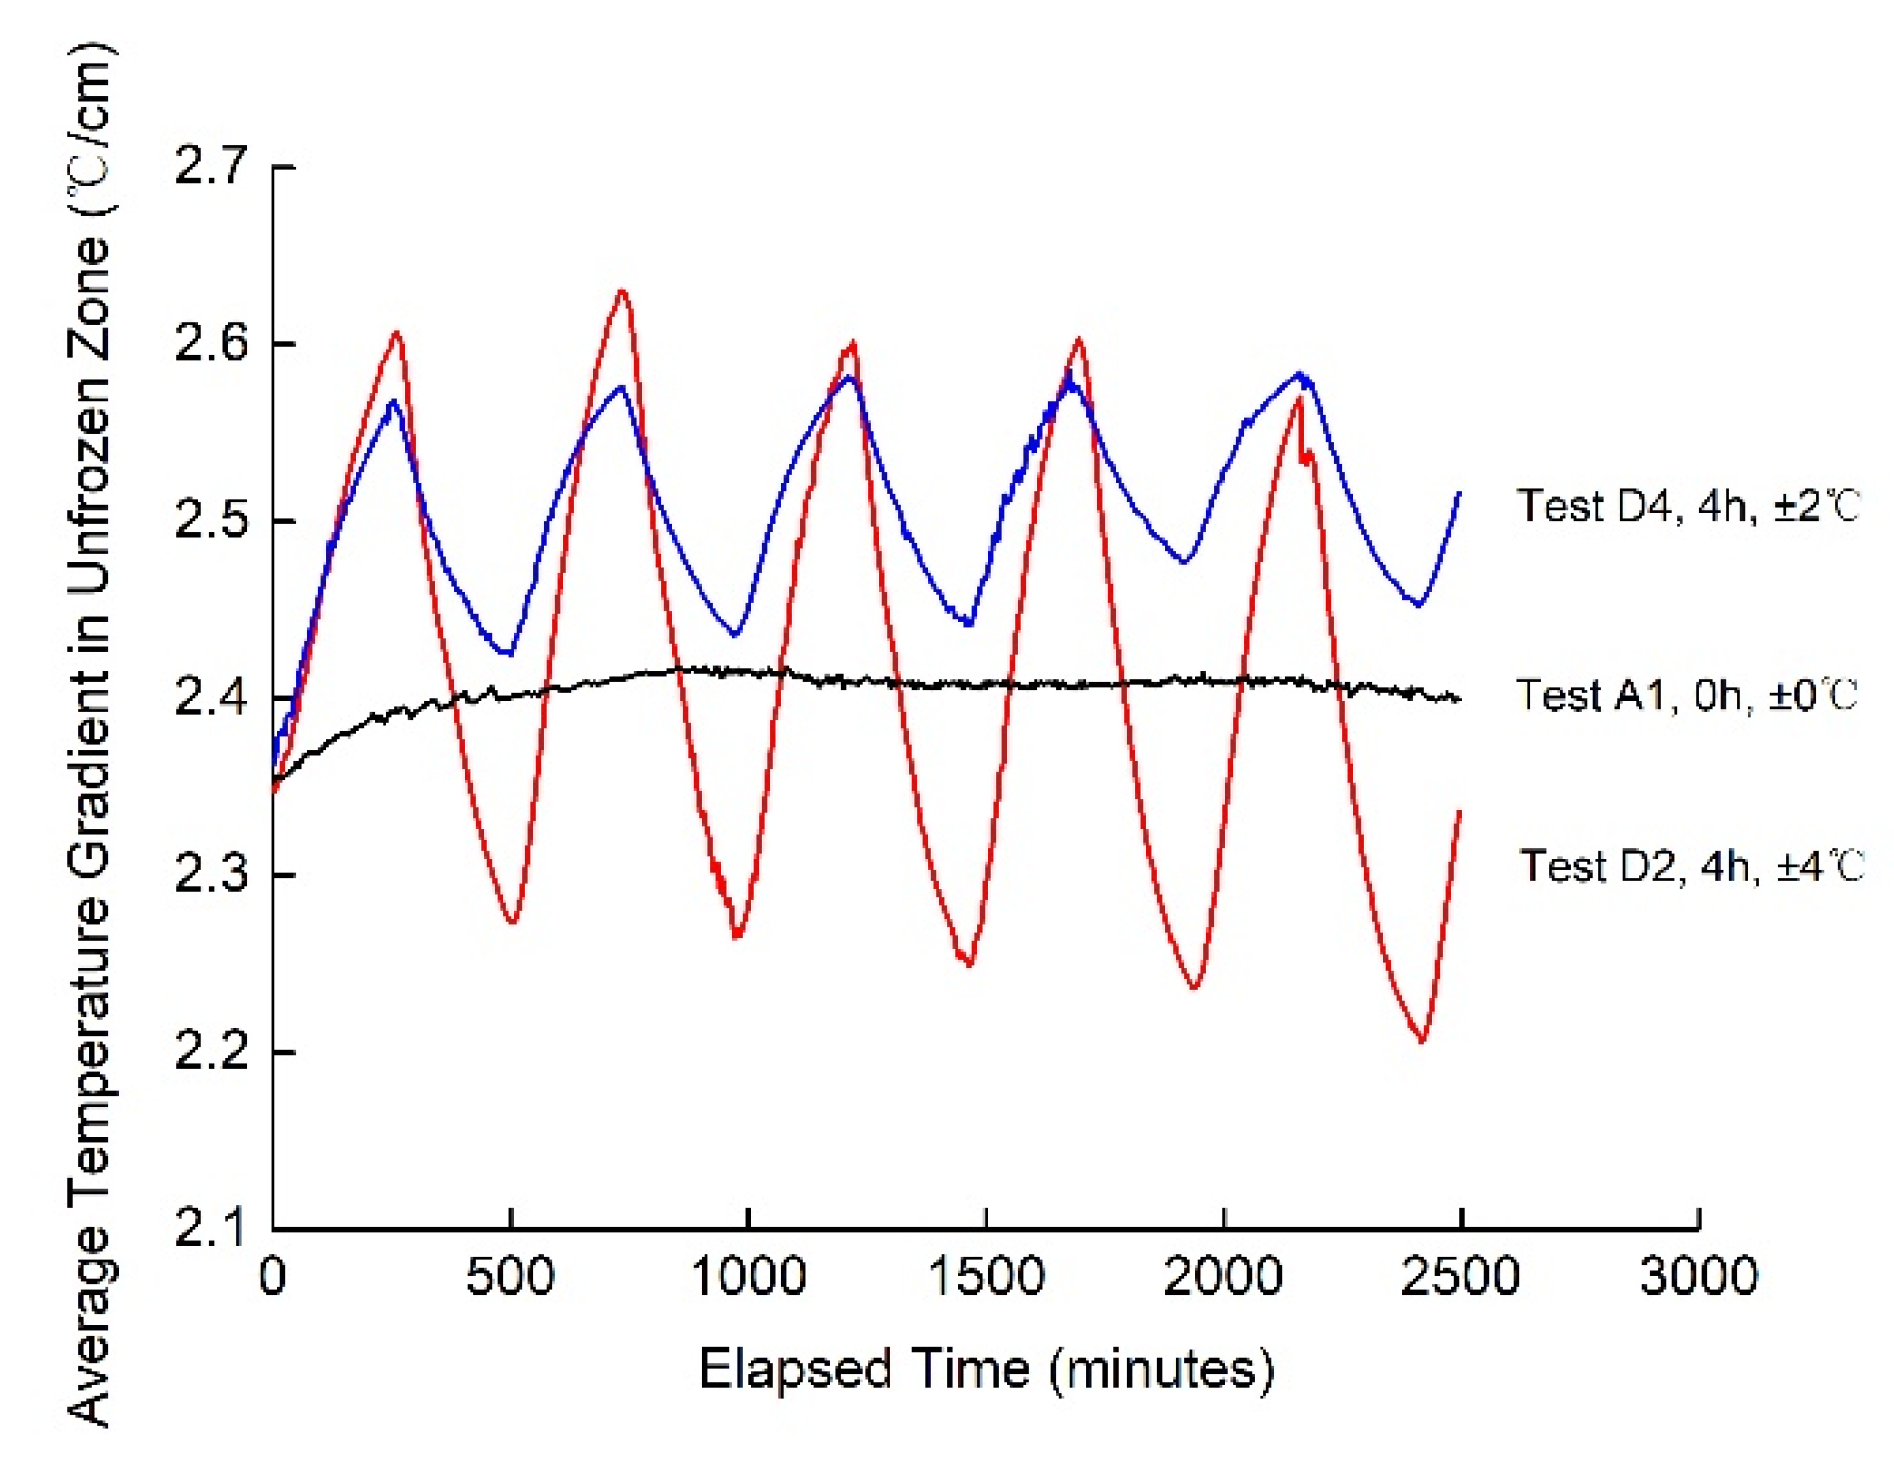
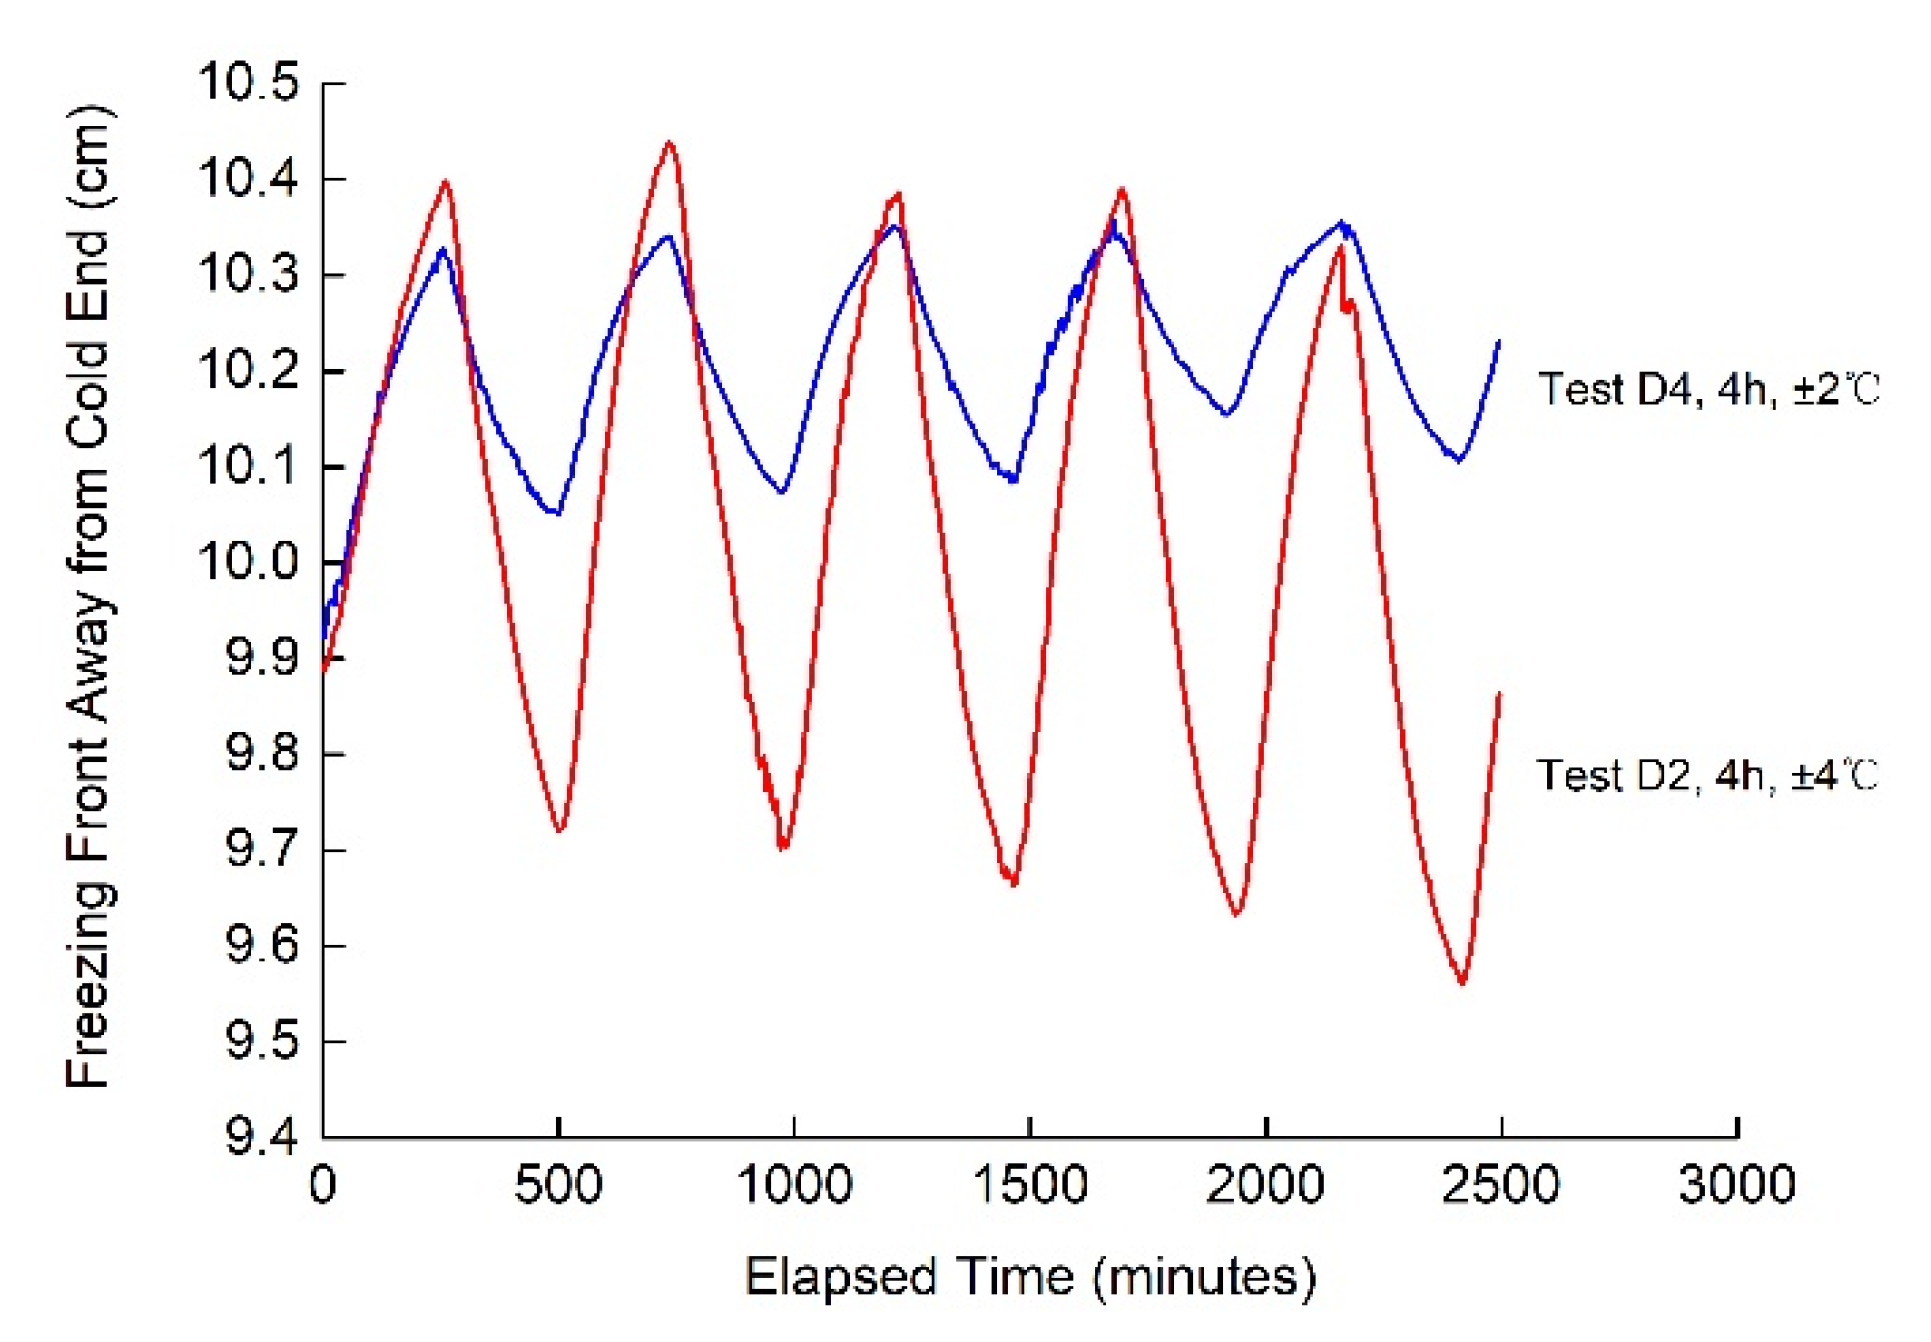
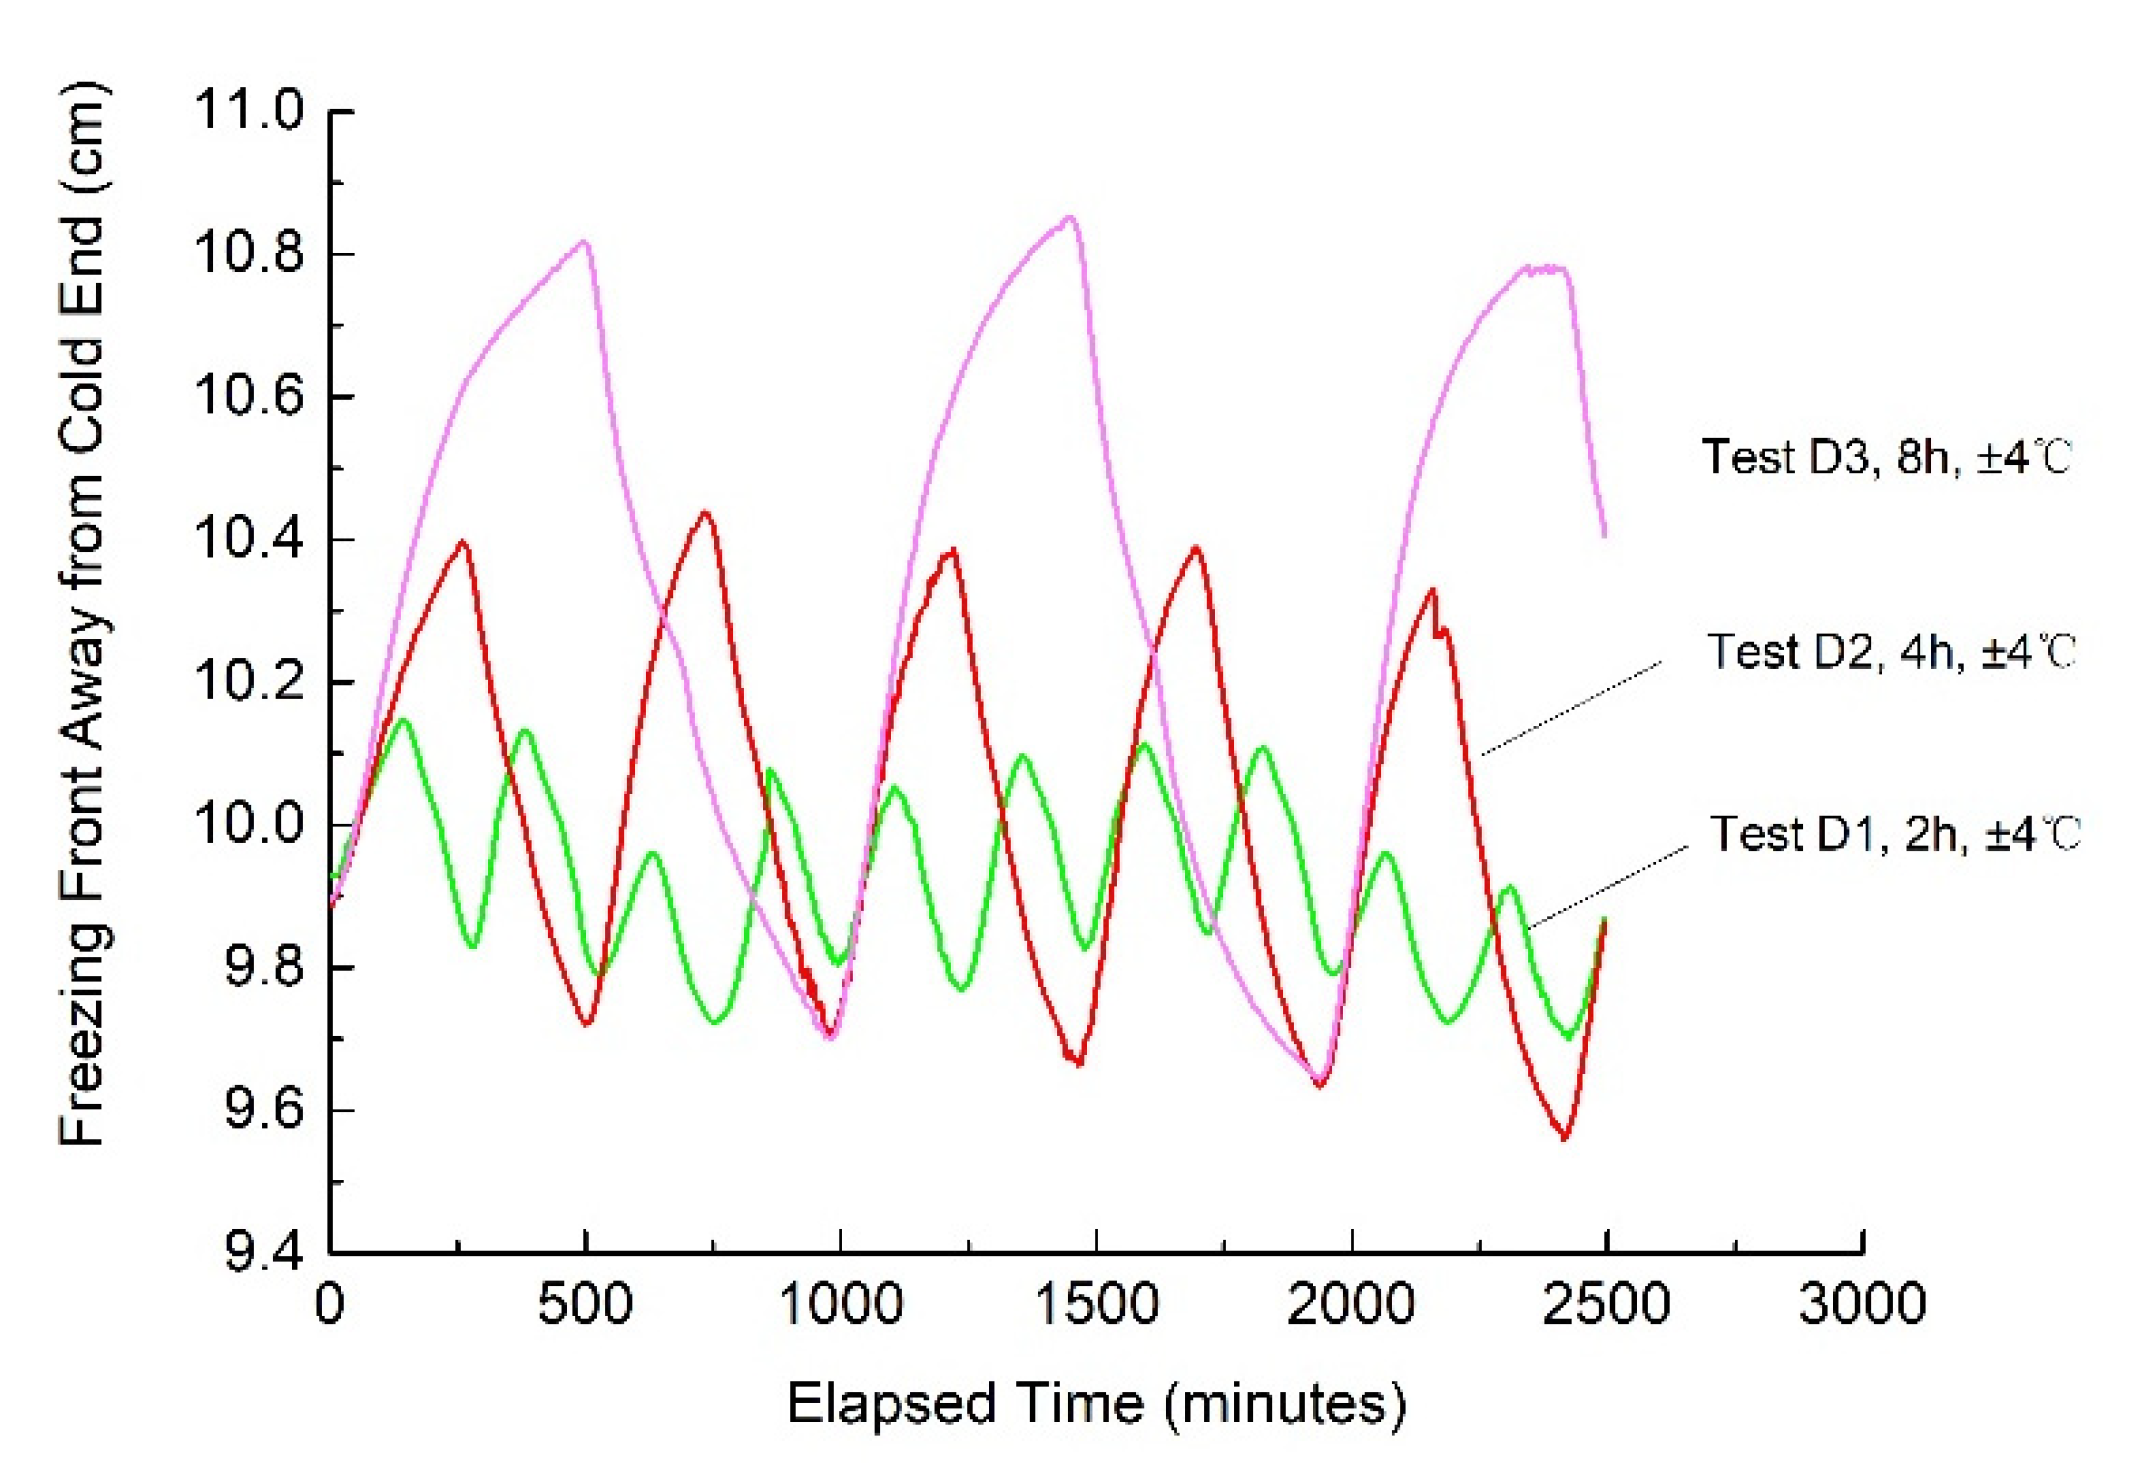
3.2. Effects of the Amplitudes and Periods of Temperature Change on Frost Heave in the Continuous-Intermittent Freezing Mode
3.2.1. Effects of the Amplitudes of Temperature Change on Frost Heave
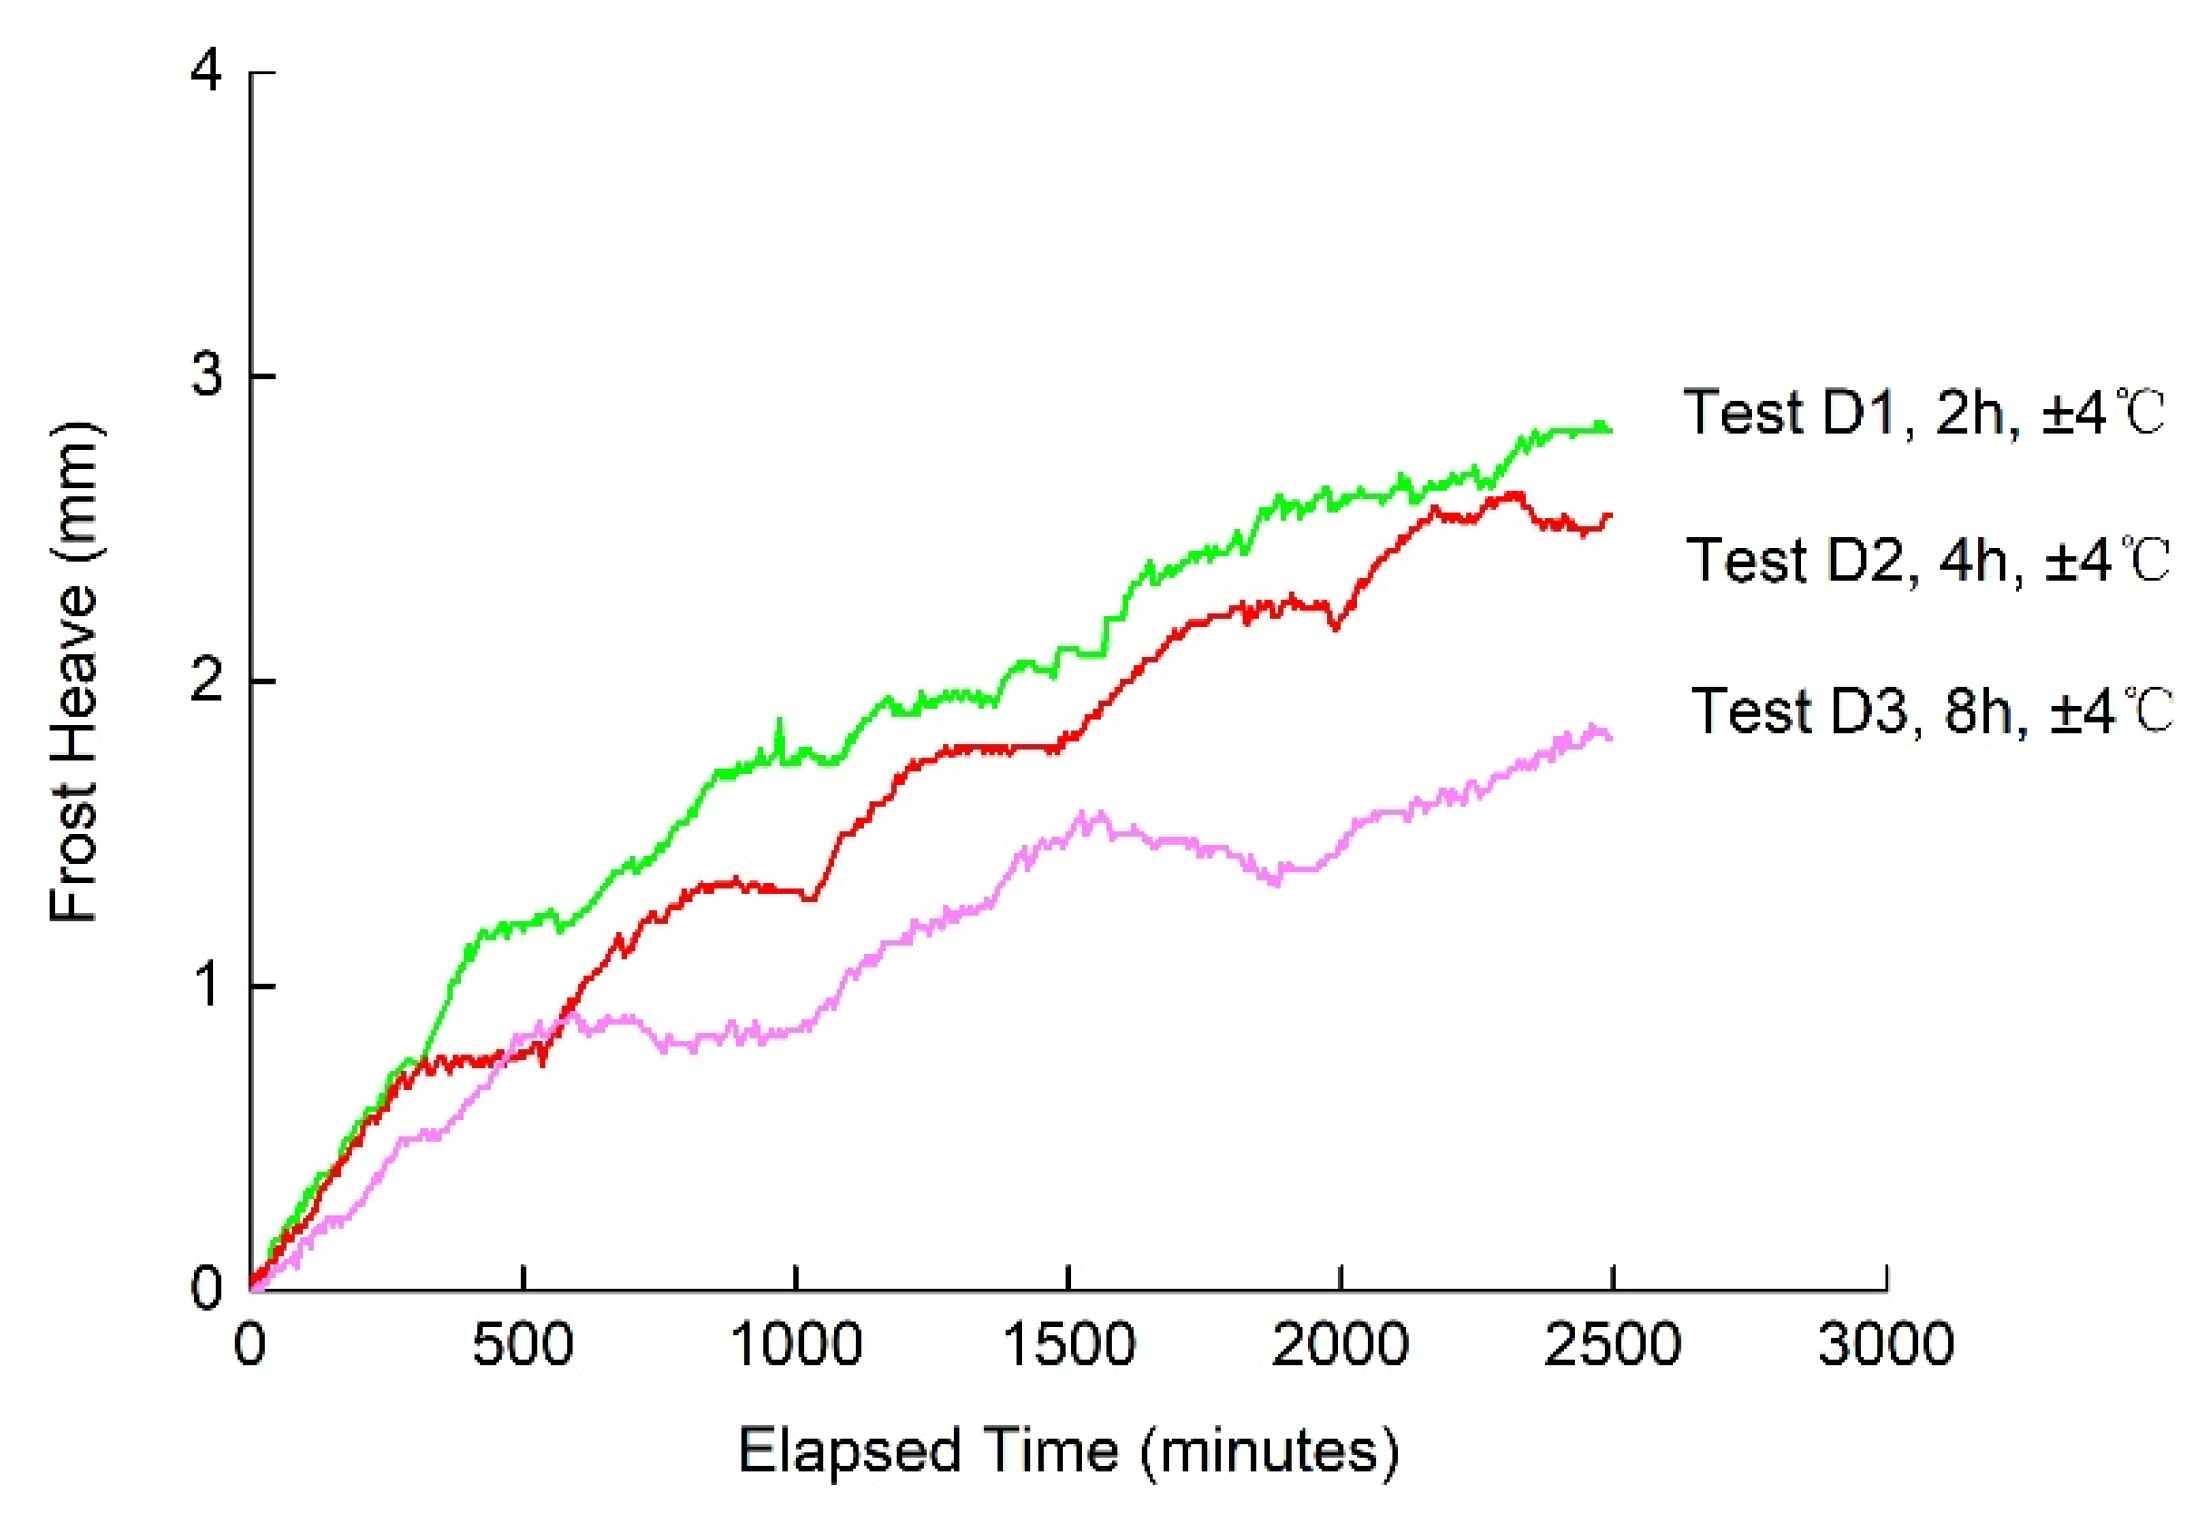
3.2.2. Effects of the Periods of Temperature Change on Frost Heave
4. Conclusions
Author Contributions
Funding
Institutional Review Board Statement
Informed Consent Statement
Data Availability Statement
Acknowledgments
Conflicts of Interest
References
- Neuendorf, K.K.E.; Mehl, J.P., Jr.; Jackson, J.A. Glossary of Geology, 5th ed.; American Geosciences Institute: Alexandria, VA, USA, 2011. [Google Scholar]
- Nagle, G. Hazards, 2nd ed.; Nelson Thornes: Cheltenham, UK, 1998. [Google Scholar]
- Dashjamts, D. Research on geotechnical properties of frost heaving soil hazards on foundations in Ulaanbaatar area of Mongolia. In Proceedings of the International Forum on Strategic Technology 2010, Ulsan, Korea, 13–15 October 2010. [Google Scholar]
- Schaus, L.; Popik, M. Frost heaves: A problem that continues to swell. In Proceedings of the 2011 Annual Conference of the Transportation Association of Canada, Edmonton, AB, Canada, 11–14 September 2011. [Google Scholar]
- Chang, D.K.; Lacy, H.S. Artificial ground freezing in geotechnical engineering. In Proceedings of the 6th International Conference on Case Histories in Geotechnical Engineering, Rolla, MO, USA, 11–16 August 2008. [Google Scholar]
- Li, S.Y.; Zhang, M.Y.; Tian, Y.B.; Pei, W.S.; Zhong, H. Experimental and numerical investigations on frost damage mechanism of a canal in cold regions. Cold Reg. Sci. Technol. 2015, 116, 1–11. [Google Scholar] [CrossRef]
- Ma, W.; Zhang, L.; Yang, C. Discussion of the applicability of the generalized Clausius–Clapeyron equation and the frozen fringe process. Earth-Sci. Rev. 2015, 142, 47–59. [Google Scholar] [CrossRef]
- Jafari, D.; Filippeschi, S.; Franco, A.; Marco, P.D. Unsteady experimental and numerical analysis of a two-phase closed thermosyphon at different filling ratio. Exp. Therm. Fluid Sci. 2017, 81, 164–174. [Google Scholar] [CrossRef]
- Wang, Y.; Wang, D.; Ma, W.; Wen, Z.; Chen, S.; Xu, X. Laboratory observation and analysis of frost heave progression in clay from the Qinghai-Tibet Plateau. Appl. Therm. Eng. 2018, 131, 381–389. [Google Scholar] [CrossRef]
- Li, H.; Lai, Y.; Wang, L.; Yang, X.; Jiang, N.; Li, L.; Wang, C.; Yang, B. Review of the state of the art: Ingeractions between a buried pipeline and frozen soil. Cold Reg. Sci. Technol. 2019, 157, 171–186. [Google Scholar] [CrossRef]
- Zhang, M.; Zhang, X.; Lai, Y.; Lu, J.; Wang, C. Variations of the temperatures and volumetric unfrozen water contents of fine-grained soils during a freezing–thawing process. Acta Geotech. 2020, 15, 595–601. [Google Scholar] [CrossRef]
- Miller, R.D. Freezing and heaving of saturated and unsaturated soils. Highw. Res. Rec. 1972, 393, 1–11. [Google Scholar]
- Miller, R.D. Lens initiation in secondary frost heaving. In Proceedings of the International Symposium on Frost Action in Soils, Lulea, Sweden, 16–18 February 1977. [Google Scholar]
- Konrad, J.M.; Morgenstern, N.R. The segregation potential of a freezing soil. Can. Geotech. J. 1981, 18, 482–491. [Google Scholar] [CrossRef]
- Otto, J. A new concept of frost heave characteristics of soils. Cold Reg. Sci. Technol. 1989, 16, 271–279. [Google Scholar]
- Newman, G.P.; Wilson, G.W. Heat and mass transfer in unsaturated soils during freezing. Can. Geotech. J. 1997, 34, 63–70. [Google Scholar] [CrossRef]
- Cao, H.Z. Research on Fields Coupling in Saturated Granular Soil Freezing Process. Ph.D. Thesis, Chinese Academy of Sciences, Beijing, China, 2006. [Google Scholar]
- Cao, H.Z.; Liu, S.; Jiang, F.; Liu, J. The theoretical study on frost heave for saturated granular-soil numerical simulation of 1-D segregating model based on equilibrium of force and phase. Chin. J. Theor. Appl. Mech. 2007, 39, 848–857. [Google Scholar]
- Satoshi, A.; Kohei, N. Tensile strength of frozen soil in the temperature range of the frozen fringe. Cold Reg. Sci. Technol. 2009, 57, 13–22. [Google Scholar]
- Lai, Y.M.; Pei, W.S.; Zhang, M.Y.; Zhou, J.Z. Study on theory model of hydro-thermal–mechanical interaction process in saturated freezing silty soil. Int. J. Heat Mass Transfer. 2014, 78, 805–819. [Google Scholar] [CrossRef]
- Bai, R.Q.; Lai, Y.M.; Zhang, M.Y.; Gao, J.Q. Water–vapor–heat behavior in a freezing unsaturated coarse-grained soil with a closed top. Cold Reg. Sci. Technol. 2018, 115, 120–126. [Google Scholar] [CrossRef]
- Taylor, G.S.; Luthin, J.N. A model for coupled heat and moisture transfer during soil freezing. Can. Geotech. J. 1978, 15, 548–555. [Google Scholar] [CrossRef]
- Gilpin, R.R. A model for the prediction of ice lensing and frost heave in soils. Water Resour. Res. 1980, 16, 918–930. [Google Scholar] [CrossRef]
- Hopke, S.W. A model for frost heave including overburden. Cold Reg. Sci. Technol. 1980, 14, 13–22. [Google Scholar] [CrossRef]
- Nixon, J.F. Field frost heave predictions using the segregation potential concept. Cold Reg. Sci. Technol. 1982, 19, 526–529. [Google Scholar] [CrossRef]
- Nixon, J.F. The role of convective heat transport in the thawing of frozen soils. Can. Geotech. J. 1975, 12, 425–429. [Google Scholar] [CrossRef]
- Shen, M.; Branko, L. Modeling of coupled heat, moisture and stress field in freezing soil. Cold Reg. Sci. Technol. 1987, 14, 237–246. [Google Scholar]
- Hu, K. Development of Separated Ice Model Coupled Heat and Moisture Transfer in Freezing Soils. Ph.D. Thesis, China University of Mining and Technology, Xuzhou, China, 2011. [Google Scholar]
- Fadhl, B.; Wrobel, L.C.; Jouhara, H. Numerical modelling of the temperature distribution in two-phase closed thermosyphon. Appl. Therm. Eng. 2013, 60, 122–131. [Google Scholar] [CrossRef]
- Na, S.; Sun, W. Computational thermo-hydro-mechanics for multiphase freezing and thawing porous media in the finite deformation range. Comput. Methods Appl. Mech. Eng. 2017, 318, 667–700. [Google Scholar] [CrossRef]
- Wu, D.Y.; Lai, Y.M.; Zhang, M.Y. Thermo-hydro-salt-mechanical coupled model for saturated porous media based on crystallization kinetics. Cold Reg. Sci. Technol. 2017, 133, 94–107. [Google Scholar] [CrossRef]
- Bai, R.Q.; Lai, Y.M.; Zhang, M.Y.; Yu, F. Theory and application of a novel soil freezing characteristic curve. Appl. Therm. Eng. 2018, 129, 1106–1114. [Google Scholar] [CrossRef]
- Li, S.Y.; Lai, Y.M.; Zhang, M.Y. Centrifuge and numerical modeling of the frost heave mechanism of a cold-region canal. Acta Geotech. 2019, 14, 1113–1128. [Google Scholar] [CrossRef]
- Yu, F.; Guo, P.J.; Lai, P.J.; Stolle, D. Frost heave and thaw consolidation modelling. Part 1: A water flux function for frost heaving. Can. Geotech. J. 2020, 57, 1581–1594. [Google Scholar] [CrossRef]
- Liu, Q.H.; Wang, Z.Z.; Li, Z.C.; Wang, Y. Transversely isotropic frost heave modeling with heat–moisture–deformation coupling. Acta Geotech. 2020, 15, 1273–1287. [Google Scholar] [CrossRef]
- Park, D.S.; Shin, M.B.; Seo, Y.K. Development of numerical analysis model for the calculation of thermal conductivity of thermo-syphon. J. Korean Geotech. Soc. 2021, 37, 5–15. [Google Scholar]
- Zhou, G.Q. Analysis of mechanism of restraining soil freezing swelling by using intermission method. J. China Univ. Min. Technol. 1999, 28, 413–416. [Google Scholar]
- Zhou, Y.; Zhou, G.Q. Intermittent freezing mode to reduce frost heave in freezing soils—Experiments and mechanism analysis. Can. Geotech. J. 2012, 49, 686–693. [Google Scholar] [CrossRef]
- Konrad, J.M. Influence of freezing mode on frost heave characteristics. Cold Reg. Sci. Technol. 1988, 15, 161–175. [Google Scholar] [CrossRef]
- Konrad, J.M. Influence of cooling rate on the temperature of ice lens formation in clayey silts. Cold Reg. Sci. Technol. 1989, 15, 161–175. [Google Scholar] [CrossRef]
- Zhou, G.H.; Zhou, Y.; Hu, K.; Wang, Y.J.; Shang, X.Y. Separate-ice frost heave model for one-dimensional soil freezing process. Acta Geotech. 2018, 13, 207–217. [Google Scholar] [CrossRef]
- Gilpin, R.R. A model of the “liquid-like” layer between ice and a substrate with applications to wire regelation and particle migration. J. Colloid Interface Sci. 1979, 68, 235–251. [Google Scholar] [CrossRef]
- Gilpin, R.R. Theoretical studies of particle engulfment. J. Colloid Interface Sci. 1980, 74, 44–63. [Google Scholar] [CrossRef]
- Nixon, J.F. Discrete ice lens theory for frost heave in soil. Can. Geotech. J. 1991, 28, 843–859. [Google Scholar] [CrossRef]
- Neill, K.O.; Miller, R.D. Exploration of a rigid ice model of frost heave. Water Resour. Res. 1985, 21, 281–296. [Google Scholar] [CrossRef]
- Konrad, J.M.; Morgenstern, N.R. A mechanistic theory of ice lens formation in fine-grained soils. Can. Geotech. J. 1980, 17, 473–486. [Google Scholar] [CrossRef]
- Konrad, J.M.; Morgenstern, N.R. Effects of applied pressure on freezing soils. Can. Geotech. J. 1982, 19, 494–505. [Google Scholar] [CrossRef]
- Hu, K.; Zhou, G.Q.; Zhang, Q. Research on segregation heave based on infrared thermal scan. J. China Coal Soc. 2015, 40, 347–352. [Google Scholar]


| Particle Size/mm. | >0.05 | 0.05~0.01 | 0.01~0.005 | <0.005 |
|---|---|---|---|---|
| Percentage/% | 5.5 | 44.5 | 17 | 33 |
| Material | Wp(%) | WL(%) | ds | Ip |
| Silty clay | 14.2 | 27.0 | 2.72 | 12.8 |
| Testing Number | Freezing Mode | Testing Description |
|---|---|---|
| A1 | Continuous freezing mode | With water supply Without vertical loads |
| B1 | Intermittent freezing mode | |
| C1 | Continuous-intermittent freezing mode |
| Testing Number | Warm End Temperature/°C | Cold End Temperature/°C | Amplitude of Temperature Change/°C | Period of Temperature Change/h |
|---|---|---|---|---|
| D1 | +12 | −22 | ±4 | 2 |
| D2 | +12 | −22 | ±4 | 4 |
| D3 | +12 | −22 | ±4 | 8 |
| D4 | +12 | −22 | ±2 | 4 |
Publisher’s Note: MDPI stays neutral with regard to jurisdictional claims in published maps and institutional affiliations. |
© 2022 by the authors. Licensee MDPI, Basel, Switzerland. This article is an open access article distributed under the terms and conditions of the Creative Commons Attribution (CC BY) license (https://creativecommons.org/licenses/by/4.0/).
Share and Cite
Hu, K.; Wu, Y.; Gao, Z.; Wang, S.; Yang, Z. Experimental Study on Freezing Mode to Reduce Frost Heave. Buildings 2022, 12, 1367. https://doi.org/10.3390/buildings12091367
Hu K, Wu Y, Gao Z, Wang S, Yang Z. Experimental Study on Freezing Mode to Reduce Frost Heave. Buildings. 2022; 12(9):1367. https://doi.org/10.3390/buildings12091367
Chicago/Turabian StyleHu, Kun, Yan Wu, Zhaoguo Gao, Shaowei Wang, and Zhao Yang. 2022. "Experimental Study on Freezing Mode to Reduce Frost Heave" Buildings 12, no. 9: 1367. https://doi.org/10.3390/buildings12091367
APA StyleHu, K., Wu, Y., Gao, Z., Wang, S., & Yang, Z. (2022). Experimental Study on Freezing Mode to Reduce Frost Heave. Buildings, 12(9), 1367. https://doi.org/10.3390/buildings12091367