Abstract
After the sustainability of heritage buildings (HBs) has been evaluated and it is determined that rehabilitation is needed, then the life-cycle cost (LCC) of energy for HBs can be analyzed. The objective of this research was to evaluate the LCC of energy for HBs and develop a comprehensive life-cycle model that will aid in expenditure planning and budget allocation. This study was validated through the weighted sums method and two case studies—Murabba Palace (MP), Saudi Arabia; and Grey Nuns Building (GN), Canada—were evaluated. For any HB, the project life cycle includes planning, manufacturing, transportation, construction, operation, and maintenance phases. Saudi Arabian and Canadian experts completed questionnaires to attribute a percentage of importance of each of the aforementioned phases with respect to energy consumption. The findings from this study will enable facility managers to make effective rehabilitation decisions. The operation phase has the highest impact on the energy consumption, gas consumption, and cost of the building in both case studies. Moreover, the findings from this study can be used to establish cost-effective intervention strategies. Their responses were employed in the development of a life-cycle model. Excel® and Minitab® were used to calculate Cronbach’s alpha values for data reliability, and the project LCC of energy for the two case studies was studied. The operation phase appeared to be the most energy-consuming phase in both case studies, contributing the most to the cost of the building.
1. Introduction
Heritage buildings are part of human creation, which produces icons for a country, provides local identity, reflects the cultural values and background, represents a source of memory, historical events, and also contributes to the tourism business industry [1].
The buildings contribute significantly to global energy and water consumption. They also account for about two-fifth of global greenhouse gas emission and solid waste generation [2,3,4,5,6]. Increasing the sustainability of buildings will help in decreasing energy consumption, greenhouse gas emissions, and air pollution; improve the health and living conditions of occupants; and increase productivity and employment rate [4,7]. Therefore, it is imperative to accurately determine the sustainability of buildings, and for this, sustainability-rating tools are needed [8,9].
The UK, for example, follows the Standard Assessment Procedure (SAP) to calculate buildings’ energy performance. On a scale of 1 to 100, SAP measures the efficiency of the thermal and heating systems in a building [10]. Based on the SAP results presented by the UK government in 2006, the energy performance of older buildings proved to be much lower than that of the more recent ones. To put it into perspective, the SAP rating of more than 40% of buildings constructed prior to 1919 was less than 41, whereas the rating of most buildings built in 1990 was over 70 [11]. Despite the intuitive results, several researchers have criticized SAP [12,13] since its inflexibility generates inaccurate results for older buildings.
Several sustainability tools and frameworks exist that provide a comprehensive analysis by considering economic, ecological, and social aspects, but not specific to heritage buildings. By analyzing frameworks such as BREEAM, LEED, and ITACA, it is evident that these frameworks fall short in two main categories. The first drawback is that these frameworks analyze buildings within a local context. This implies that these tools, when exploited globally on different buildings, would not provide an accurate analysis due to variations in climate, building materials, and historical significance from region to another. As a result, countries repurpose such tools to fit their local context. BREEAM, for example, was repurposed as HK-BREEAM for China [14]. The second drawback is that these frameworks overlook economic and financial aspects, which are usually essential requirements in such projects. A simple and yet alarming example is that these tools could approve a building project only based on its environmental impact.
When the sustainability of a building has been assessed and it has been decided that rehabilitation is necessary, rehabilitation projects should be evaluated not only based on their environmental impact as a whole, but also on their project life-cycle cost (LCC) of energy. This would offer a more holistic evaluation of the environmental, economic, and financial costs associated with the project.
The main objective of this research is to develop a comprehensive life-cycle cost (LCC) of energy assessment for heritage buildings (HBs). In what follows, a review of the energy performance of HBs is presented, as well as a brief description of the phases of a project life cycle. A detailed description of the project LCC of energy analysis for HBs is presented. Model development and validation are also conducted for the LCC of energy analysis. Moreover, this research aims to evaluate the LCC of energy for HBs and develop a comprehensive life-cycle model that will aid in expenditure planning and budget allocation.
2. Research Background
2.1. Energy Performance of Heritage Buildings
A building’s energy performance is characterized as the energy consumption (actual or estimated) for its proper functioning [15]. It is determined by considering parameters such as the surrounding environment, climate, exposure to the sun, energy generation within the building itself, indoor environment, and insulation.
HBs are known to be less energy efficient than modern buildings, the latter of which is constructed according to energy efficiency-based standards. HBs also generate 40% more emissions from energy use than modern buildings do. Nevertheless, a lot of materials are used in the construction of modern buildings, reducing the net life-cycle emission to only 8% lower than that of heritage buildings [16].
Evaluating energy performance in HBs is different from evaluating that of modern buildings since modern buildings require a very in-depth design of the building envelope and HVAC system [17]. Most measures to determine the energy performance of HBs opt to reduce operational energy use without considering the life-cycle scope (Lidelöw 2018). Available software programs for energy-efficiency evaluation have been reported to be inherently inflexible and thus generate biased energy efficiency ratings of older buildings [12,13]. The most well-known calculation technique for measuring energy performance of HBs in both static and dynamic software is the same as that used to measure energy performance of modern buildings. Such calculation techniques have been reported to have weak flexibility when applying them to historical buildings. Their modeling can only be improved by modifying the inputs. However, there is no systematic method of doing so for each building. Overall, dynamic software programs such as BEST Open Studio generate better results for the energy assessment of HBs than static software such as DOCETpro 2010 [17].
According to Li et al. [18], since the construction stage of buildings is deeply dependent on supports from urban, national, and global economies, a hybrid systems analysis combining input–output analysis and process analysis was conducted in this work from a multi-scale perspective. Based on the multi-scale intensity databases, the embodied energy consumption and greenhouse gas emissions driven by the infrastructure engineering of case buildings in Beijing are systematically quantified at urban, national, and global scales, with primary inputs in particular steel, cement, lime, and metal products. Hence, when tracing sources along the supply chains, the effects of building construction at the urban, national, and global scales are calculated as 39.12%, 55.21%, and 5.67% of energy consumption and 68.78%, 24.41%, and 6.80% of greenhouse gas emissions.
Lucchi and Buda [19] presented a summary of existing urban-sustainability rating tools for their possible application in historic urban environments, facing the debate between urban heritage preservation and environmental sustainability. In addition, Urban Green Rating Systems (UGRSs) make a transparent and systematic decision-making tool for evaluating the sustainability in urban planning, relating economic, environmental, and social aspects. The research aimed at comparing different UGRS approaches for cities and neighborhood restoration. Furthermore, Lucchi et al. [20] pointed out that the promotion on the market of highly modified products, with a low visual impact color and that are aesthetically wise, disseminated the integration of photovoltaic (PV) systems in heritage buildings. Therefore, the study aimed at reconstructing a Swiss and Italian legislative and authorization framework to emphasize prospects, potential, limits, and points of contact among such areas.
2.2. Project Life-Cycle Phases for HBs
A project, by definition, is a set of tasks carried out individually or collaboratively to achieve a specific target. As a result, a project has to go over multiple phases before reaching its complete form. A project life cycle is divided into six phases, with the seventh being the demolition phase. Since this work focused on preserving HBs, we considered only six phases when analyzing the project LCC of energy.
2.2.1. Planning Phase
A core component of any project involves detailing tasks and defining the end goal and milestones. Thus, it is only logical that the initial phase of any project is the planning phase. During this phase, the scope of the project is identified in terms of its end goal, required resources (such as financial costs, manpower, and timeframe), and participating entities (such as stakeholders and investors), in what is called “scope management” [13]. The scope of the project serves as a wide-eyed view of the entire project. The project team would then break the project down into milestones, each with a set of detailed tasks and activities, and schedule for start and completion and dependencies such as resources, materials, and costs. With the milestones identified, the project budget is outlined to provide an estimated cost of the operation, labor, and equipment. The milestones and budget provide a guideline that would aid in tracking progress. The last step of this phase is to document the scope and milestones, and this documentation is called a quality plan. This plan ensures accurate documentation of the project, along with control measures and criteria. This would reassure the customer and enable progress tracking within the organization. With that, project planning is complete and ready to be executed [21].
2.2.2. Manufacturing Phase
Execution of the project begins with the manufacturing phase. One crucial task in this phase is to calculate the embodied energy of the manufacturing materials to be used. For this, some data collection on the materials is needed. Specifically, intensities of the building materials and their prices are retrieved from the bill of materials prepared by the project contractors. After verifying retrieved data, an Economic Input–Output Life-Cycle Assessment (EIO-LCA) spreadsheet model (developed by the authors of this article) can be computed to determine the total initial embodied energy of each material. This calculation is performed by multiplying the national average price and the net quantities (accounting for waste) delivered to the site by the sectoral intensity contributions of the material. In the current study, wastage factors were retrieved from Concordia University and the Royal Commission for Riyadh.
2.2.3. Transportation Phase
Materials for the execution of the project are needed to be transported to the construction site. Similar to the manufacturing phase, a critical aspect in the transportation phase involves assessing the impact of transportation on the environment. A significant drawback of existing assessment methods is that they consider only emissions from construction and operations. However, one particularly interesting assessment is the Life-Cycle Assessment (LCA). Unlike existing environmental impact assessment methods, LCA provides a more comprehensive assessment framework that considers greenhouse gas emissions, energy use, and overall environmental impact of the transportation phase [22].
2.2.4. Construction Phase
The construction phase involves several steps, including groundwork at the site and equipment installation for mechanical and electrical work. In order to formalize the execution of such activities, a process-based LCA can be employed. Construction drawings, design-specification sheets, and additional manufacturer information can serve as input for the analysis. Information regarding construction, equipment used on-site, and distance to the site can be retrieved from the primary contractor and supplier records. Another important piece of information for the LCA is the construction energy, which includes electricity and diesel fuel for lighting and energy supply to construction equipment. In this study, for a more holistic energy analysis, the energy used for transportation of materials to the site was also compiled.
2.2.5. Operation Phase
Energy requirements for a building’s operation can also be determined from a process-based LCA. In this study, two case studies were evaluated, and design specifications of their electrical and mechanical equipment, along with each building’s forecasted usage pattern per year, were exploited in order to determine the operating energy requirements. Electricity is the operating energy for the considered buildings in the case studies, and it includes electricity for functions such as cooling, ventilating, lighting, equipment operation, and water supply.
2.2.6. Maintenance Phase
Maintenance is the last phase of the project LCC of energy. Its energy consumption can be determined by using a procedure similar to that for analyzing the energy requirement of the manufacturing materials of the building. In this study, however, the estimated life span of the building materials was used.
2.3. Embodied Energy and Sustainability of Heritage Buildings
The conflicting views on the energy performance of heritage buildings stem from how people perceive their environmental sustainability. To contextualize this, views on modernizing buildings favor upgrading heritage buildings to be more energy-efficient regardless of their embodied energy. On the other hand, views in favor of sustaining heritage buildings strongly believe in the value of their embodied energy; hence, such buildings are far more environmentally friendly than how the opposing views perceive them. According to Pisello et al. [23], Milani [24], and Inc. [25] the embodied energy of heritage buildings is defined as “the sum of all the energy required for extracting, processing, delivering, and installing the materials needed to construct a building”. Thus, according to their views, the embodied energy of heritage buildings has been expended as part of their construction. This argument is further bolstered by the fact that, since the current energy performance and operation cost of the building is not only based on its energy consumption, reusing an existing building implies no waste or generation of additional energy as compared to building a new building.
Further arguments were also based on the fact that many older buildings were constructed by using traditional materials (e.g., stone, brick, and lime) that will have been subjected to little or no processing or manufacturing, particularly before the Industrial Revolution [26]. Arguably, the processing that took place would have been achieved without the use of fossil fuels, using other sources such as timber (biomass). Furthermore, the local and the vernacular origins of most of the materials will have minimized the distance for the transportation of the materials, and many materials used for construction would have been close to their natural state. Accordingly, the embodied energy of the fabric used to construct many older buildings is very low in comparison with modern buildings [22]. Therefore, from a conservationist point of view, the environmental cost of using energy to demolish or construct a new building is higher. In sustainable terms, it is more realistic to preserve and reuse existing buildings because of their embodied energy; in this way, natural resources are conserved, and long-term energy savings are possible.
2.4. Modification of Existing Heritage Buildings Structure for Reuse
Alteration for reuse is part of the conservation process of managing change to culturally significant buildings that could sustain their heritage values while engaging in opportunities to enhance, develop and improve their energy performance [27]. However, according to Al-Sakkaf et al. [6], the alteration can interfere with a building’s breathing performance. It can lead to a loss of character, distortion of appearance, and loss of historic fabric. Therefore, it is important to identify the significance of the building. This, in return, requires an understanding of what the nature of the structure is, who values it and why, how these values relate to the fabric, and how significant are these values compared to the advantages of reuse. The perception of heritage values and the historical significance of heritage buildings is crucial to making appropriate decisions about the required enhancements for better energy efficiency improvement. This is in line with the BS 7913 (2013, Section 4), which states that “understanding the significance of a historic building enables effective decision making about its future” [28].
Thus, the significance of a historic building is closely related to the value that is placed upon it by the people and the wider society and how it continues to be viewed as an asset to them. This value is a combination of its emotional, historical, spiritual, and cultural significance. Without these considerations, any good intention and “reuse” initiative is likely to compromise the building’s value for future generations. As a result, it is paramount to understand such a building’s construction history, its modifications and uses, its cultural significance, and its protected status to make more informed decisions. Besides the intrinsic values that these buildings hold, a clear and structured analysis of their current, intended, and proposed performance is also equally crucial in the repurposing process [7,29].
To that end, it is essential to have tools and frameworks that provide a comprehensive analysis of such buildings by considering the economic, ecological, and social aspects. One such tool is the sustainability rating. By observing some of the frameworks that implement such an analysis (for example, BREEAM, LEED, and ITACA), it becomes evident that these frameworks fall short in two main categories. The first drawback is that these frameworks analyze buildings within a local context, or, in other words, analyze in a “one size fits all” fashion. What this implies is that such tools, when exploited globally on different buildings, would not provide an accurate analysis due to variations in climate, materials, and historical significance. As a result, countries repurpose such tools to fit their local context. One example is BREEAM, which was repurposed as HK-BREEAM for China [14]. The second drawback is that these frameworks overlook the economic and financial aspects, which are usually an essential requirement in such projects. A simple and yet alarming example is that such tools could approve a building project because of its environmental impact (environmentally efficient) regardless of the actual cost to construct it.
2.5. Energy Simulation for Heritage Buildings
Fahmy et al. [30] examined the usage of GRC walls as a new construction method in the housing industry under future climate change. They considered three different external wall specifications for three climatic zones scenario in Egypt. They evaluated three different external wall evaluations for energy consumption, energy cost, and thermal comfort. The experiments simulated building performance and took into account the thermal the nature of the materials. Simulation results confirmed the existence of climatic zones. A recommendation of 10 cm GRC (C2) wall specification was given as a better alternative to replace the prevalent outer wall specification in Egypt. This prevalent specification is that of a single wall made of half red-brick–Ct, as it is promising for the future in terms of energy performance and will thus minimize energy consumption and cost.
In addition, the authors Radhi et al. [31] evaluated the impact of climate interactive © systems (CRFS) on cooling energy in fully glazed buildings. This research combined the computational fluid dynamics and the simulation of a building’s energy to determine boundary conditions, as well as to generate geometrical models based on a newly constructed multi-story building. According to Hygh et al. [32], the energy load of a building can be calculated in a precise way by simulating building models. However, these models cannot be manipulated when the building is still in the primary stages of the design process. This is because, during the early stages, the availability of an assessment tool that is capable of providing feedback in response to varying the high-level design parameters is required. The authors then proposed a novel modeling strategy in order to determine the energy load of a building during the primary stages of the building design. They indicated that the utilization of standardized regression coefficients (SRCs) can serve as a useful indicator of how the heating and cooling loads are affected by each design variable.
2.6. Energy Consumption Prediction
Abanda et al. (2013) [33] reported research gaps in the area of computational modeling with respect to understanding the interrelation between the models themselves and calculations of different parameters such as greenhouse gas emissions, energy, and cost. Moreover, understanding this interrelationship between the model and these parameters will enable the analysis and design of more energy efficient and sustainable buildings. Wong et al. [34] described prototype architecture as a means to put in place a system to predict and simulate carbon emission during building projects. This would entail the use of “virtual prototype technologies”, which is an area of study that is lacking in the literature. They indicated that the visualization technique, as developed in their study, helps provide an interactive tool for decision-makers to manage a construction project. Moreover, Fumo and Biswas [35] presented information on linear regression analysis for residential and whole-building energy consumption in single-family homes. The energy consumption in residential buildings was observed to be higher.
2.7. Greenhouse Gas (GHG)
In terms of analyzing GHG systems, Rincón-Quintero et al. [36] proposed the design of a Photovoltaic Thermal Integrated Greenhouse System (PVTIGS) that could be used for heating a biogas plant within the climatic context of IIT Delhi, India. PVTIGS has various applications. It can be used for generating space heating, enhancing the production of biogas, and various other applications. They pointed out that the greenhouse room temperature varies between 38 and 47 °C, which is considered to be suitable for biogas production. Additionally, Attar et al. [37] employed a Transient System Simulation Tool (TRNSYS) to simulate and evaluate the performance of solar water heating systems (SWHS) for a greenhouse, based on the Tunisian weather. They stated that the stored solar energy alone could not meet the total requirements of heating. Hence, it is necessary to use an auxiliary heating system such as a fuel boiler or electric energy.
Furthermore, Yildirim and Bilir [38] discussed the evaluation of the renewable energy option for the required total energy need of a greenhouse. Solar photovoltaic panels were selected and connected on a grid to assist a ground source heat pump in generating enough energy for the lighting. They concluded that the energy payback time of the system was found to be 4.9 years. The authors reported a greenhouse gas payback time of 5.7 years based on natural gas electricity generation, as compared to 2.6 years for coal-based electricity generation.
3. Methodology
This section covers the research methodology in detail. Four steps are involved in the study of the evaluating of a life-cycle cost of energy for heritage buildings. A review of the literature was first conducted to retrieve relevant information from two main sources—review articles and technical sheets for current studies.
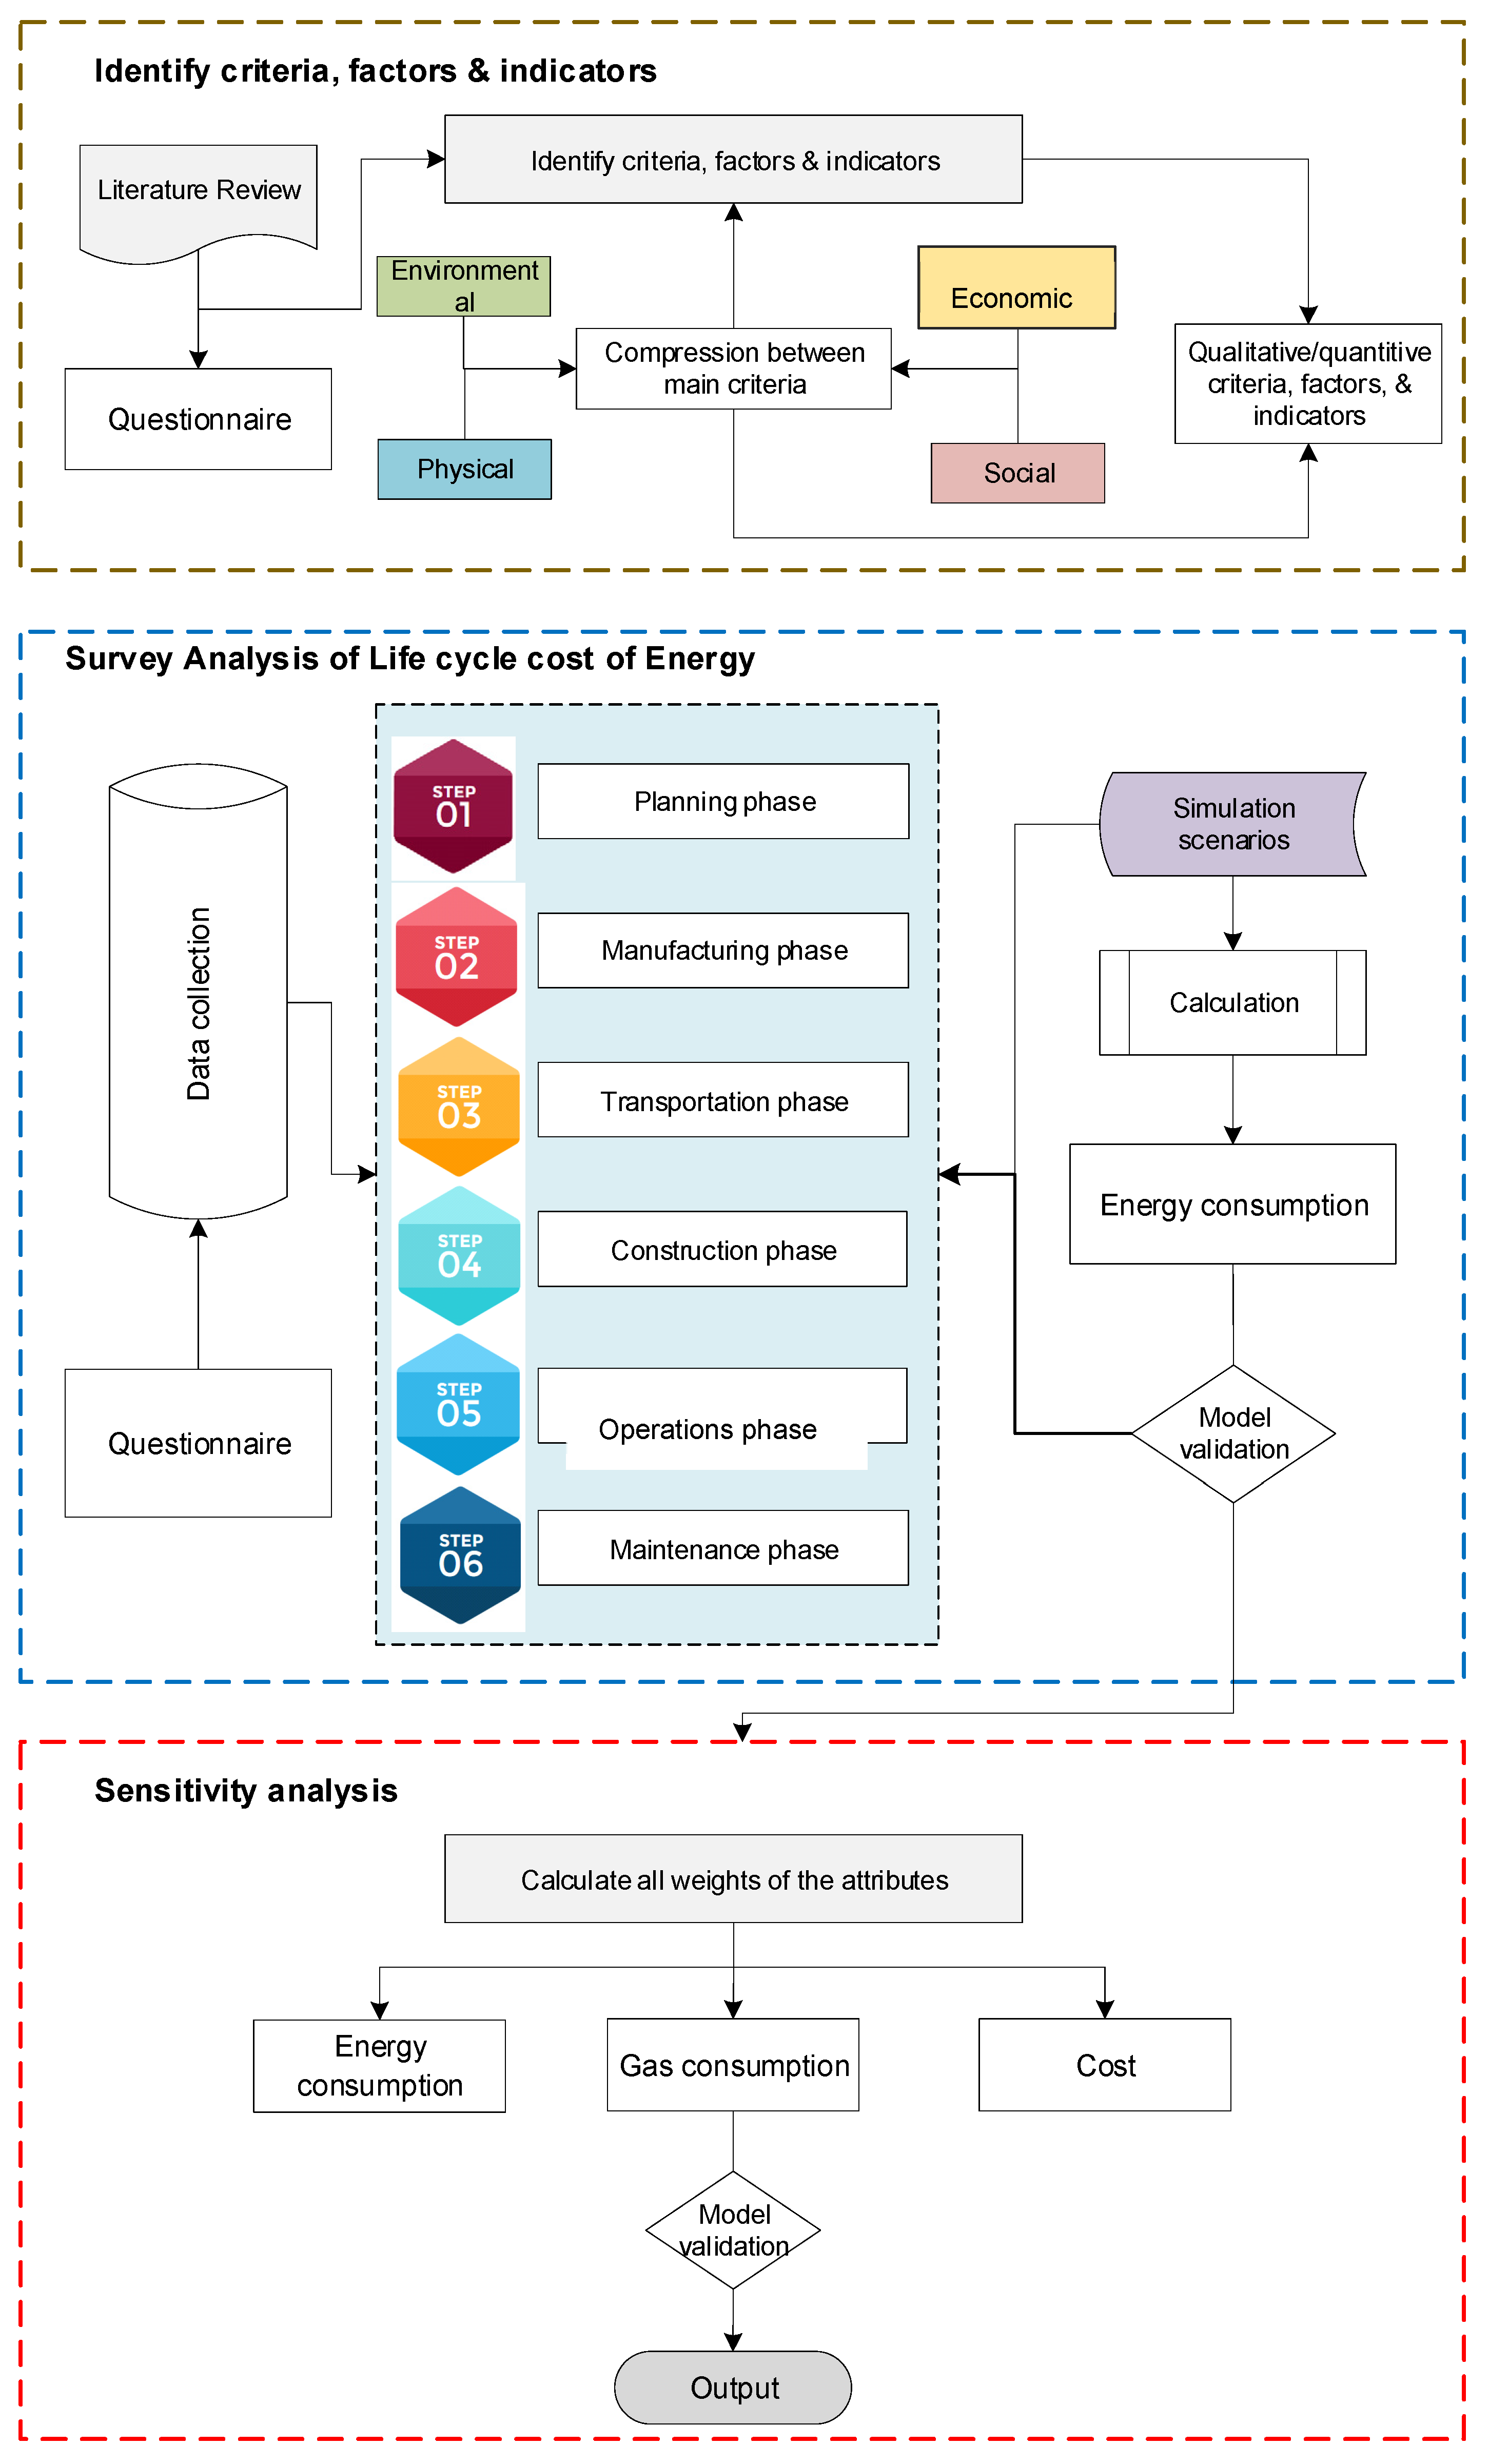
Detailed methodology, presented in Figure 1, was developed to attain the final goal of establishing and validating a project life-cycle assessment model of energy for heritage buildings. The research methodology is divided into two modules to evaluate the current condition of life-cycle cost of energy in heritage buildings, as follows:
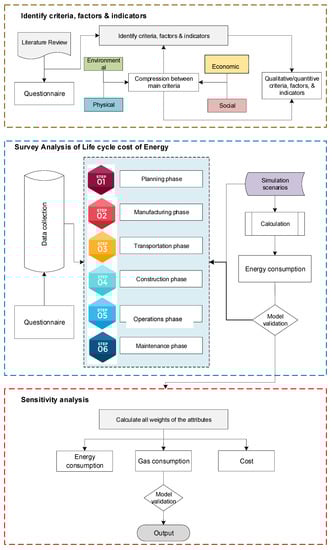
Figure 1.
Framework of heritage buildings life-cycle cost of energy.
- Identify criteria, factors, and indicators affecting the condition of life-cycle cost of energy.
- Perform an analysis of the life-cycle cost of energy of heritage buildings.
One of the recent methods, Building Information Modeling (BIM), is used to evaluate the condition of life-cycle cost of energy of buildings. In addition, BIM has been an exponentially growing field for the past decades and has gained momentum with respect to research studies and case studies implementing relevant models to facilitate the modeling, decision-making, and efficient operation of buildings and facilities with a heritage value.
- 3.
- Perform a model validation.
- 4.
- Conduct a sensitivity analysis.
3.1. Life-Cycle Assessment Model for HBs
From Figure 1, the described life cycles consist of three main stages, each modeled as a system of input, process, and output. Six phases that affect heritage buildings are considered in the project LCC of energy and two case studies are evaluated—Murabba Palace (MP), Saudi Arabia; and Grey Nuns Building (GN), Canada. The steps for model development are summarized as follows. (1) Identification of the criteria, factors, and indicators: The main objective is to identify quantitative and qualitative factors and indicators. The review of the literature and answers from the questionnaires were compiled and processed. Different percentages for each life-cycle phase were identified, which were then applied to real electricity- and gas-consumption data, as well as to the actual energy-consumption-cost data. (2) Calculation of energy (electricity + gas) consumption: Here, energy consumption of heritage buildings in both case studies was calculated. A model for each building was built, and energy consumption was calculated and cross-validated with the actual energy-consumption data obtained from the Royal Commission of Riyadh and Concordia University’s Facility Management Department. (3) Survey analysis: Based on the LCC of energy, the goal of this step is to evaluate the life-cycle phases with respect to their significance and rankings. For this, answers from the questionnaires were used to validate the proposed model of the LCC of energy for HBs. Moreover, for model validation, a sensitivity analysis was used to confirm the impact on the energy consumption, gas consumption, and cost of heritage buildings.
3.2. Model Validation
A weighted sum is calculated to evaluate the sustainability assessment index for HBs. For validation, multi-criteria decision-making methods, namely Fuzzy TOPSIS, Simple Additive Weight SAW, Weighted Sum Model WSM, Weighted Product Model WPM, and OCRA, were applied to evaluate the sustainability of heritage buildings.
Simple Additive Weight (SAW) is the simplest and most popular MCDM method [39]. Its simplicity favors its use as a benchmark to evaluate other MCDM methods. Its formula is shown in Equation (1) [38].
where we have the following:
| = sustainability index; | |
| = total local weight for each factor; | |
| = total global weight for each factor. |
Weighted Sum Model (WSM) assigns, for each alternative, a weight calculated by using Equation (3) [39]. Thus, in the case of minimization, the more preferable alternatives would be the ones with higher weights and vice versa.
where we have the following:
| = represents the performance of each alternative. | |
| = represents a measure of performance in the normalized matrix. | |
| = represents the weight of each factor. |
The Weighted Product Model (WPM) is an accessible multi-criteria decision analysis (MCDA) or Multi-Criteria Decision Making (MCDM) method. Despite its similarity to the WSM method, it applies multiplication instead of addition, as shown in Equation (3) [40].
where we have the following:
| S | = sustainability index; |
| P | = total achieved score for all factors; |
| = total score for all factors. |
Operational Competitiveness Rating Analysis (OCRA) is one of the less common MCDM techniques. It relies on independently evaluating both the relative cost and benefit of alternatives, both of which provide decision-makers with a holistic evaluation. The formula used is shown in Equation (4) [41].
where we have the following:
| Y | = total index; |
| = global weight of factors; | |
| = local weight of factors. |
A sensitivity analysis measures the robustness of a model by observing the impact of varied weights of an attribute on the model output. The robustness of a model is evaluated based on the ability of the model to withstand significant changes in its input parameters. Since each sensitivity analysis simulation involves a specific change in the weight of an attribute, a sensitivity analysis can serve to identify relevant attributes and weights for a given model. In this study, attributes include the phases of planning, manufacturing, transportation, construction, operation, and maintenance. The two case studies that were analyzed are Murabba Palace, Saudi Arabia; and Grey Nuns Building, Canada. The weight of each attribute (project life-cycle phase) was increased by +15%, and the performance of the life-cycle assessment model was evaluated. For example, the weight of an attribute, , is increased by . Thus, its resulting weight, , will be . For each weight change, the weights of other attributes can be calculated from Equations (5) and (6), and the total weight of all attributes must equal 100%. Note that the number of simulations for each attribute must be equal.
where and represent the original and modified weights of the main attribute, respectively; and and represent the original and modified weights of other attributes, respectively.
4. Data Collection and Findings
4.1. Observations, Interviews, Questionnaires, and Case Studies
For documentation purposes, observations were conducted on the sustainability of HBs. Interviews with experts were carried out for two main reasons: (1) to help identify research problems and objectives and (2) to gather information on the various aspects leveraged to assess a building’s sustainability. The conducted interviews fall into two categories—structured and non-structured. Structured interviews help to identify, through a set of questions, the significance of different sustainability assessment attributes. Such interviews were held with project managers, civil engineers, architects, and heritage specialists. On the other hand, non-structured interviews help to identify, at the beginning of the research, the research problems and objectives through meetings with subject-matter experts (project managers, building sustainability experts, and heritage specialists).
The purpose of the questionnaires is to identify the affected factors of the life-cycle energy-cost model. It is conducted by using Google Sheets. In addition, the questionnaire was not as straight forward as the interviews. Specifically, it had to be repeatedly adjusted to ensure the feasibility of filling it out within the allocated timeframe (15–20 min). The wording of the questions had to be changed to avoid confusion and ensure clarity for the targeted audience. The questionnaire was sent to 150 Saudi and Canadian experts who specialize in the fields of heritage buildings, sustainability, and construction. Out of the 150 experts, 40 filled the questionnaire. Moreover, 11 of the 40 had more than 10 years of experience, and 7 had less than 5 years of experience. Of the 40 experts who were selected to fill out the questionnaire, 17 are from KSA and 23 are from Canada. The vast majority of them are heritage specialist in both KSA and Canada. The rationale behind choosing experts from Canada and Saudi Arabia as candidates for the questionnaire is to allow diversification in terms of the weights of the attributes. Both countries differ with respect to climate, environmental conditions, heritage culture and values, and energy and water resources. The questionnaire data were analyzed by using Fuzzy theory; this variation would result in different weights for the selected assessment attributes (Table 1). Thus, these weights would provide a context for the sustainability assessment process, as they would account for regional variations.

Table 1.
Frequency of degree of importance for each factor and indicator.
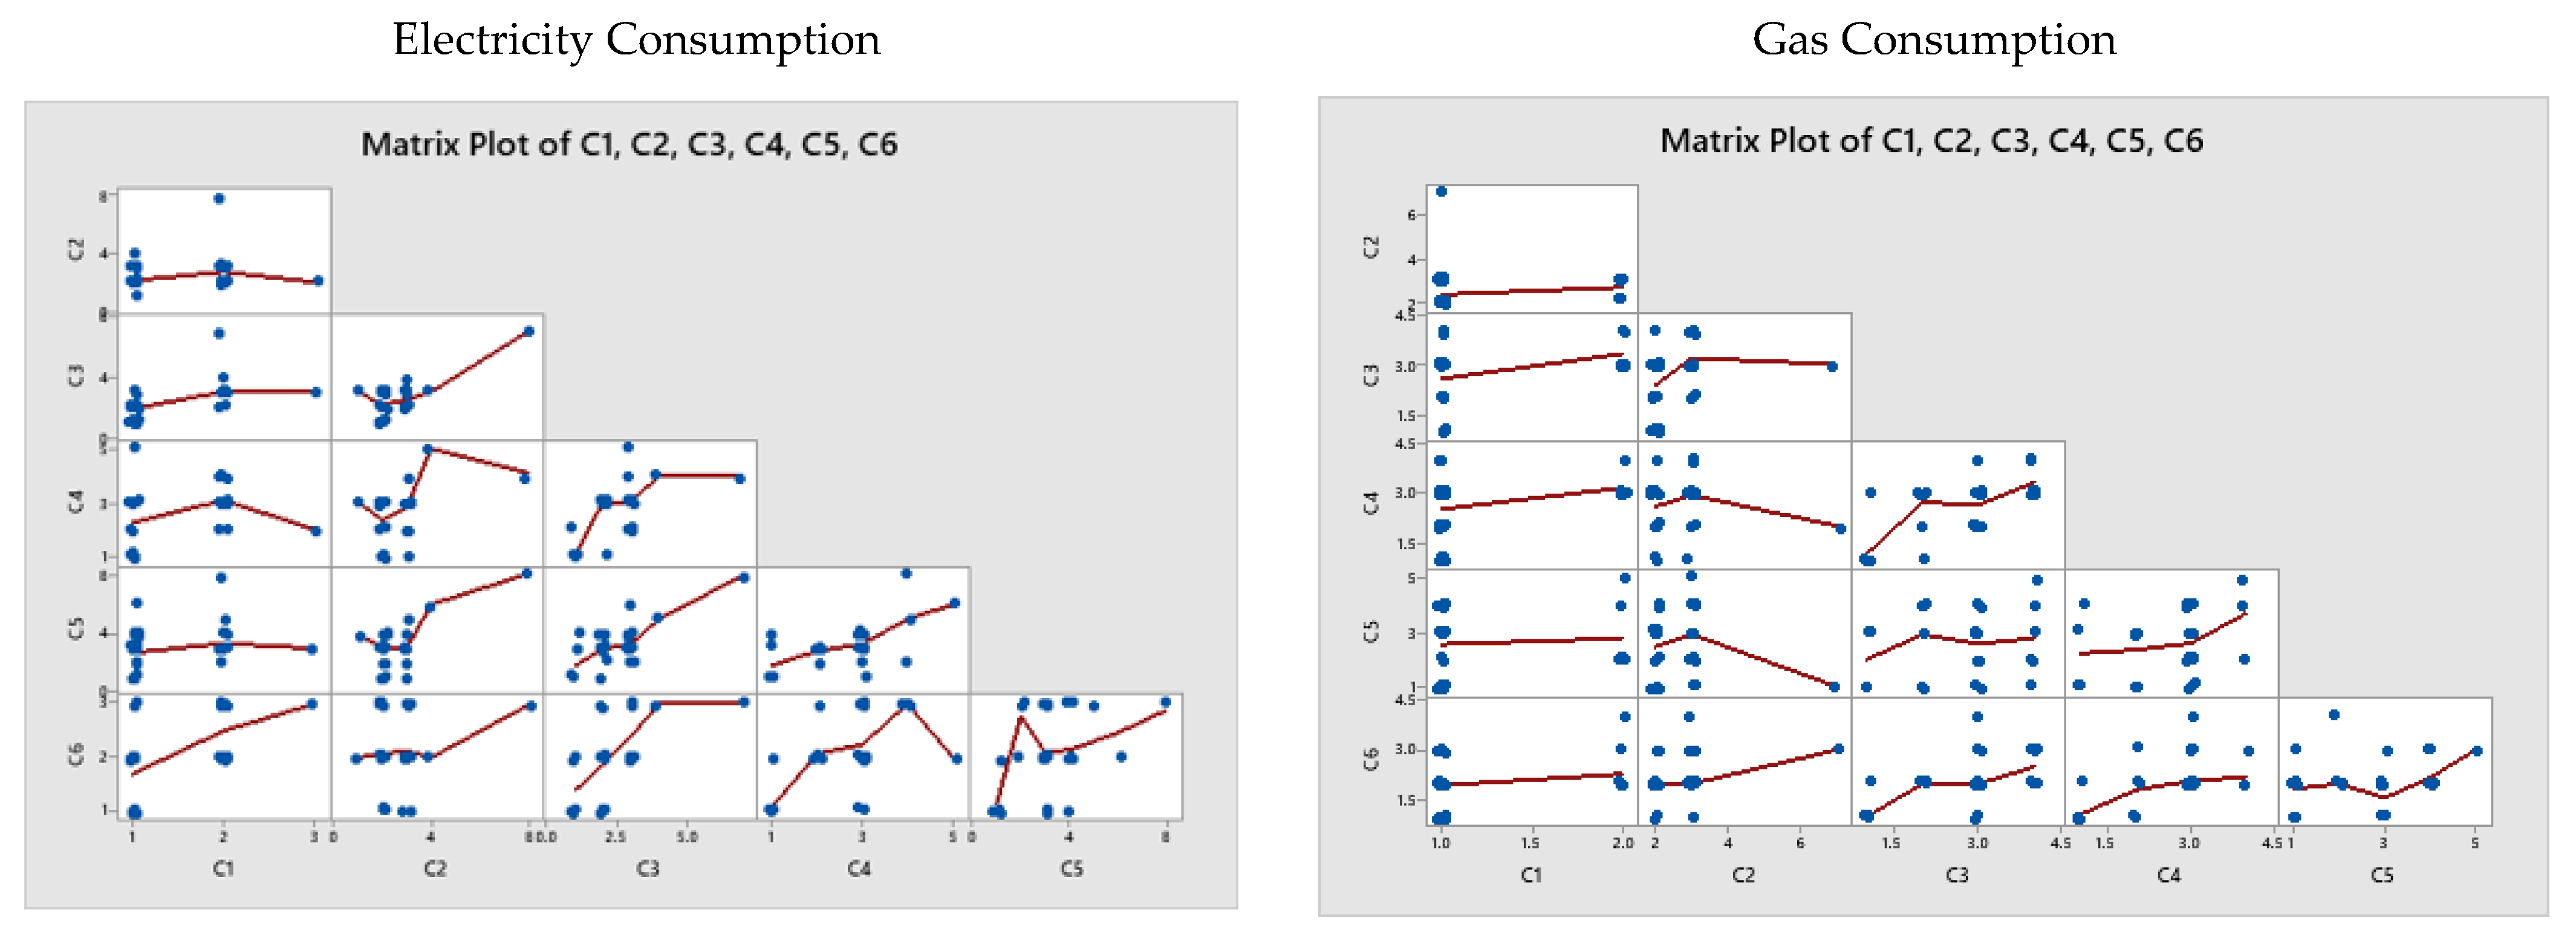
The questionnaire was divided into four parts: (1) area of expertise, (2) location of experience (Saudi Arabia or Canada), (3) percentage of energy consumption in each phase that is reported in the calculated total life cycle, and (4) percentage of carbon emission in each phase that is reported in the calculated total life cycle (see Figure 2). Data reliability and expert preferences that were collected as part of this model were validated in the same way as the methodology implemented in Section 3.1. Tables for inputs, outputs, and Cronbach’s alpha values were calculated by using Excel®, and Minitab® results are presented in Figure 2.
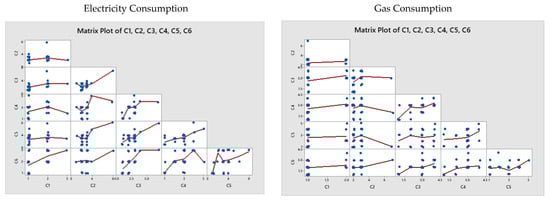
Figure 2.
The matrix of Cronbach alpha analysis using Minitab® (electricity and gas consumption).
Below are descriptions of the two case studies that were evaluated in this work:
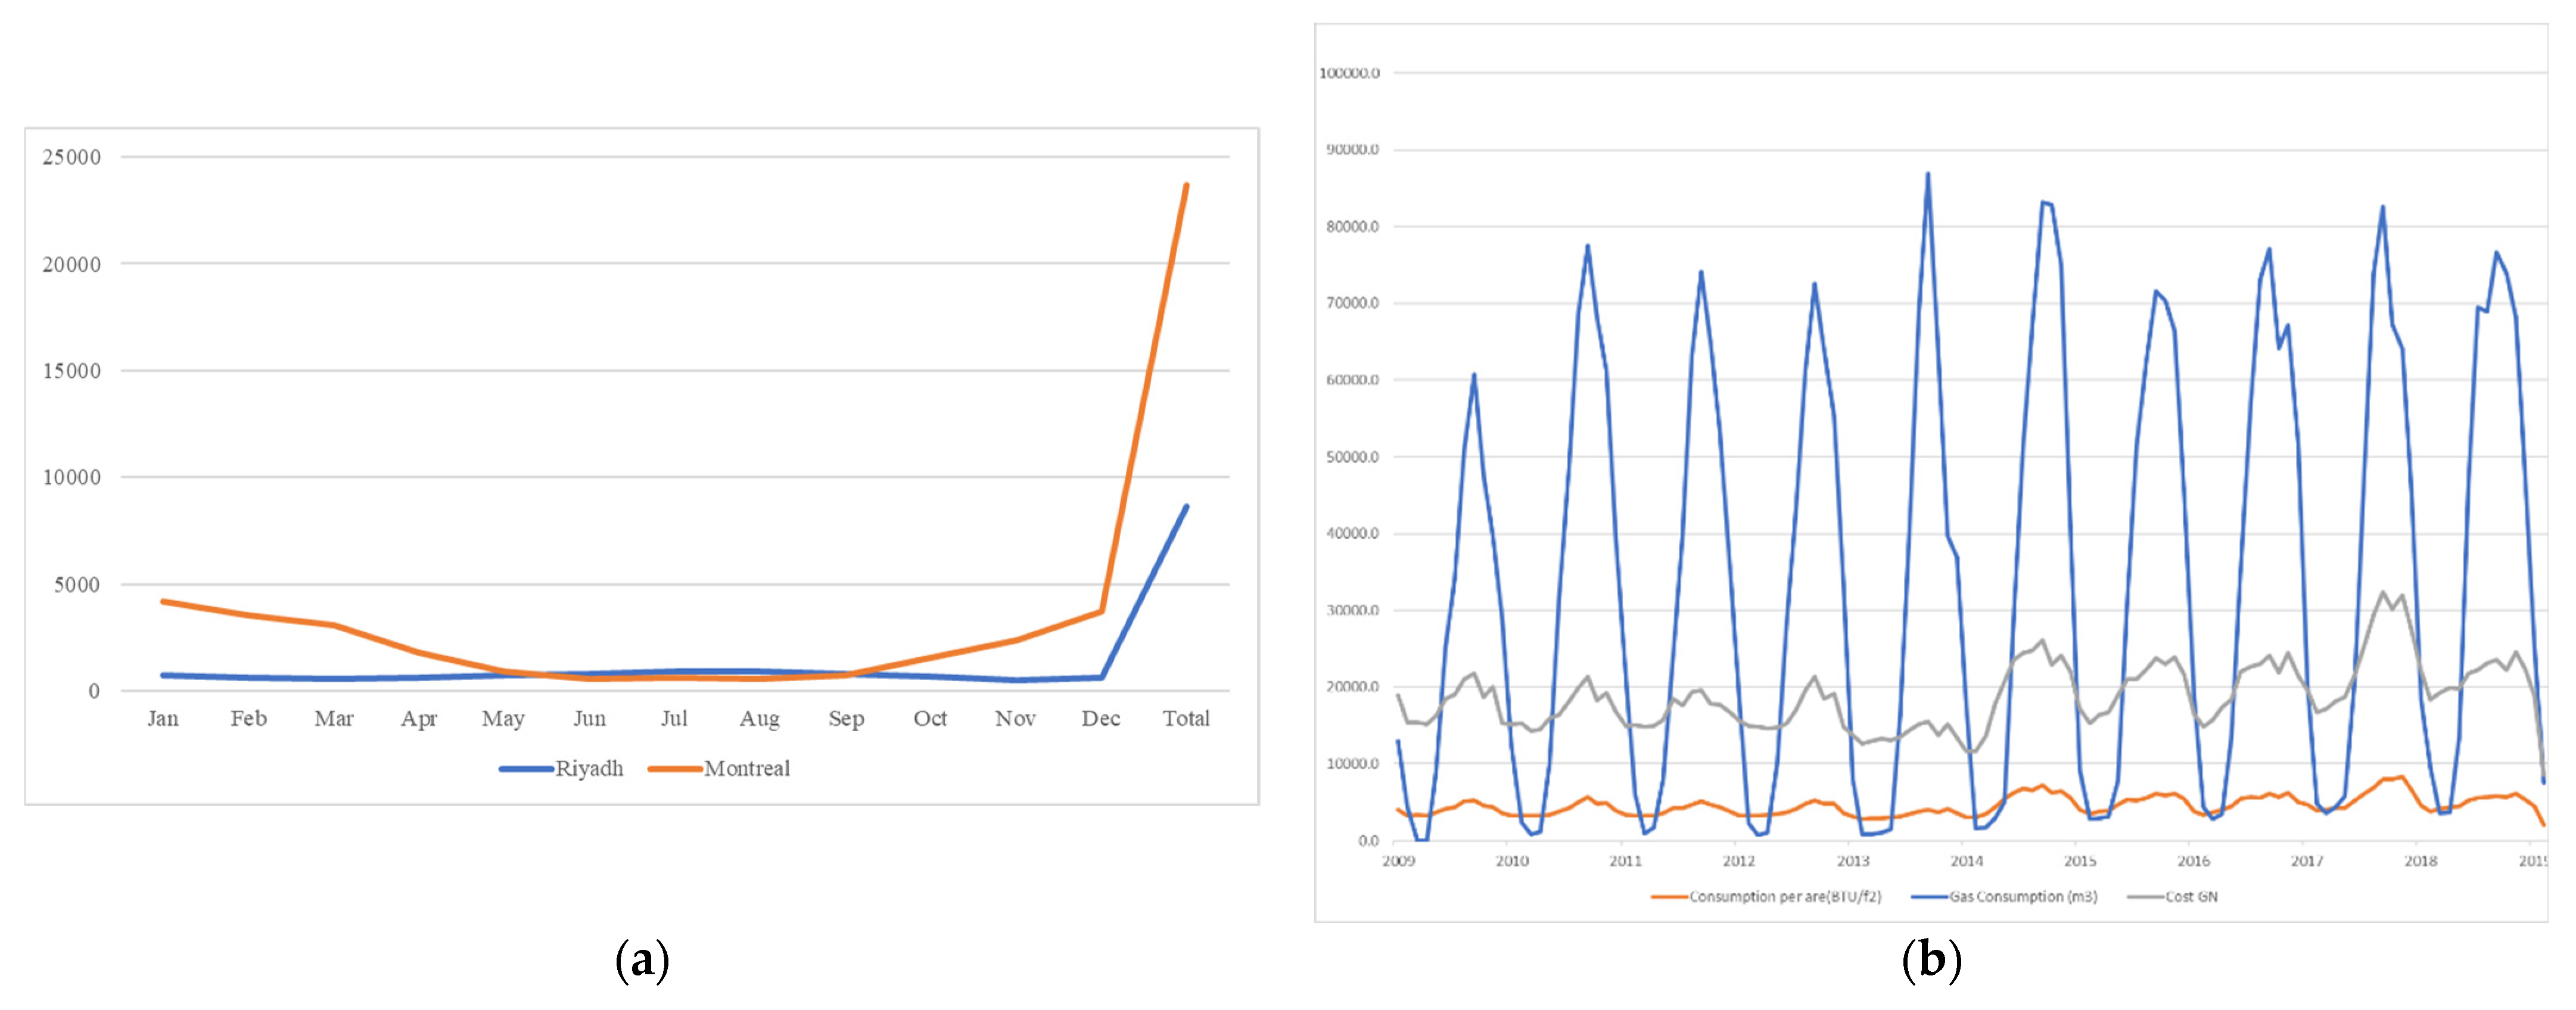
Murabba Palace (MP) is a historic site spanning an area of 9844 m2 that was constructed a century and a half ago located in Riyadh, Saudi Arabia. Murabba Palace serves as a museum and is also used for business purposes. It was made of traditional materials such as bricks and palm-leaf stalks (Arab News 2012), and its walls were constructed from a straw-based material (IRCICA 2017). Data such as the total annual energy consumption, a five-year record of energy proficiency, all architectural plans (for the Revit model and the energy simulation model using ArchiCAD®), and the electrical plans were readily available. Riyadh Development Authority provided pertinent information on energy consumption, water use, and material use (Figure 3a).
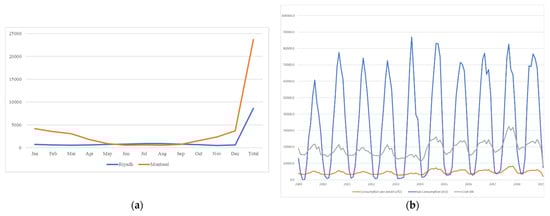
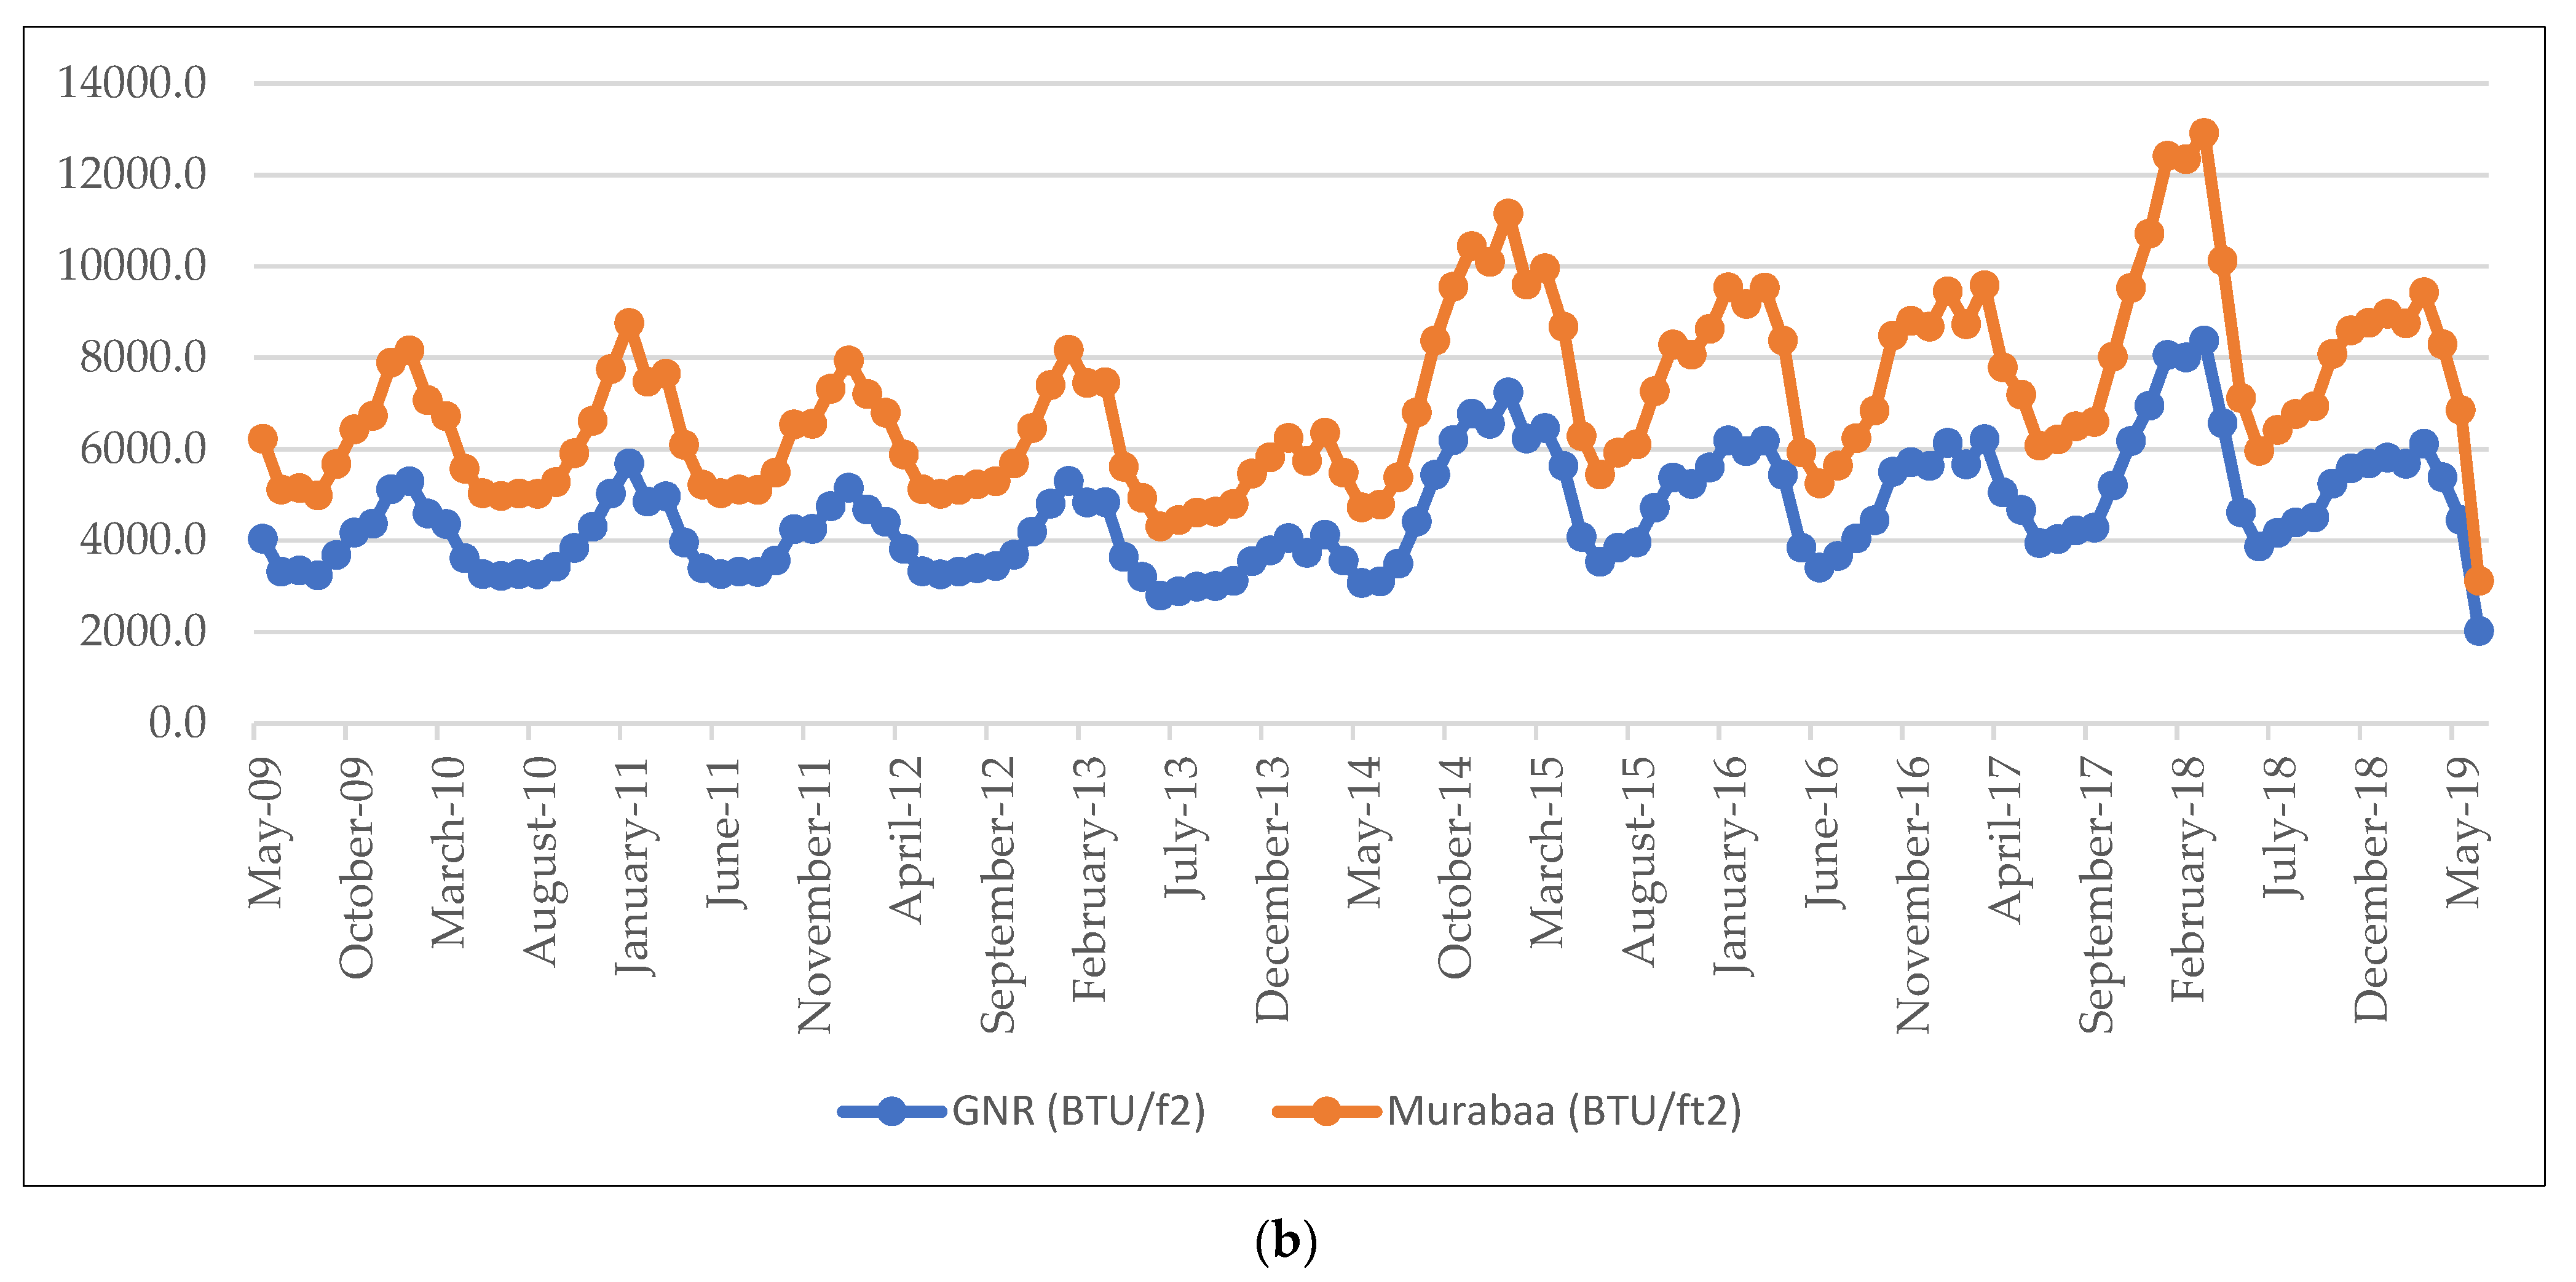
Figure 3.
Chart for total energy consumption. (a) Chart for total energy consumption for Riyadh and Montreal in MWh. (b) Grey Nuns Building—total energy consumption.
Grey Nuns Motherhouse (GN) is located in Montreal, Canada; it spans an area of . It was a residence for nuns, and it became a Concordia University property in 2007. Currently, Grey Nuns Motherhouse provides accommodation to 598 Concordia undergraduate students. The building is valuable to its community due to its connection to native Canadians and the presence of the graves of some nuns in its basement [42]. In 2011, it was also enlisted as a National Historic Site. Data such as the total annual energy consumption, a five-year record of energy proficiency, all architectural plans (for the Revit model and the energy simulation model using ArchiCAD®), and electrical plans were readily available. Concordia University’s Facility Management provided pertinent information on energy consumption, water use, and material use (Figure 3b).
4.2. Building Information Modeling (BIM) for MP and GN
Building Information Modeling (BIM) was carried out by using Autodesk’s Revit® software. AutoCAD® drawings (provided by the Riyadh Development Authority) were used as primary input for the Revit® model. The model further demonstrated properties of both the external façade and the internal spaces with the purpose of collecting data for the sustainability assessment model and acting as a basis to simulate energy use. Other outputs of this step included the following: (1) the effective area of the ground floor used in energy consumption calculations to estimate the “greenery provision value” and the reduction value of the heat island effect for the non-roofed area; (2) the area of external walls included in the assessment of the building’s envelope; (3) the area of the roof to be included in the assessment of the heat-island effect; (4) the area of the building envelope exposed to the prevailing wind, which was used as input for wind movement analysis of the building; and (5) the total count of interior spaces to determine the score of indicators for the factors energy, indoor environmental quality, and water use. The ArchiCAD® model was developed by leveraging AutoCAD® drawings of the six-story floor plans. The ArchiCAD® model enabled the extraction of data such as the floor area of each room, gross area of each floor and the entire building, area and material of walls and partitions, cladding area and type, number of fixtures in each bathroom, height of each floor, and generation of the AutoCAD® file [43].
To perform the energy simulation, AutoCAD® was exported to Revit®, which performs the simulation based on the building size and materials used. The ArchiCAD® model can provide the building’s daily, monthly, and yearly energy consumption (Figure 4). Furthermore, it can compare energy use in different countries that have varying energy demands. Such data were used in the calculation of the energy factor and account for the observed percent improvements from varying input parameters.

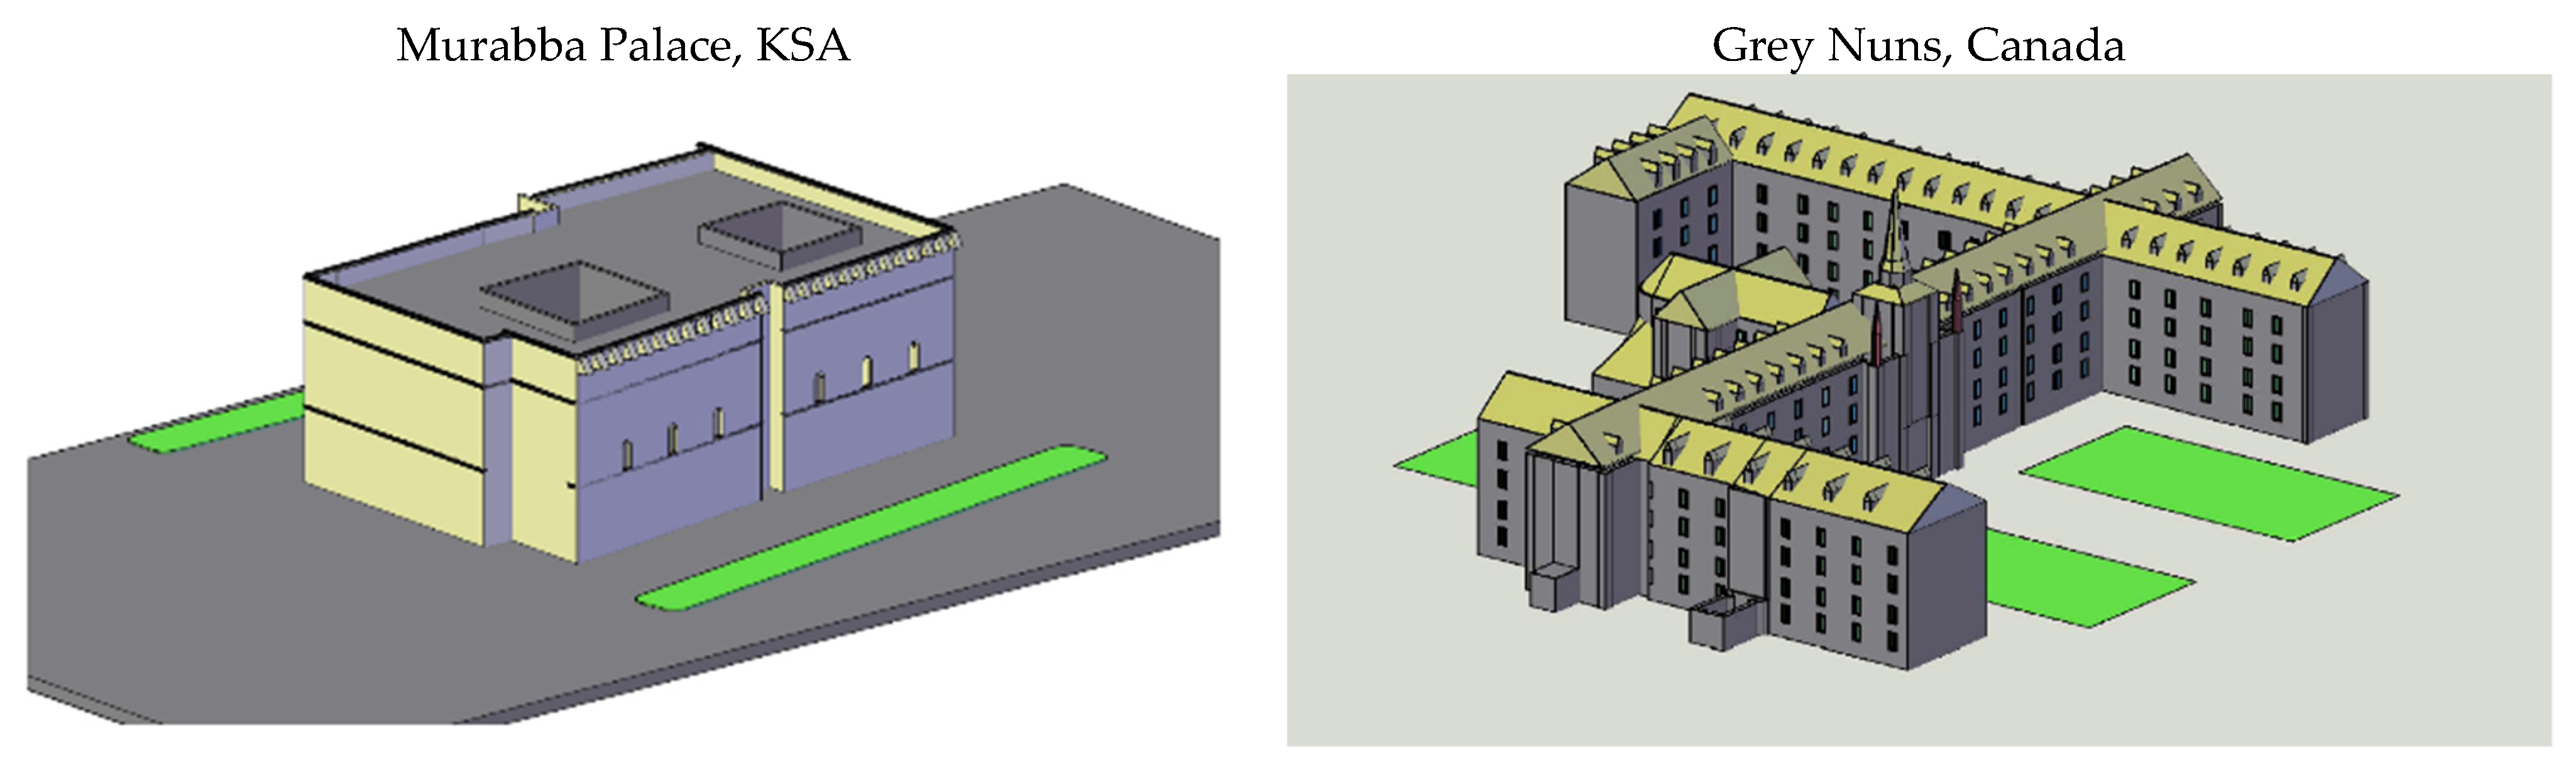
Figure 4.
BIM model development of MP and GN.
The simulation results were similar to the building’s actual energy consumption. For instance, the total energy consumption in Montreal was 23,000 MWh, whereas the simulation results reported a value of 23,656 MWh. An error of 0.0285 was calculated, which is within the accepted range (0–0.5). In addition, since the goal of this rating system is to provide an accurate and context-aware assessment of buildings in different countries, simulations of the two cities, Riyadh (Saudi Arabia) and Montreal (Canada), were performed. The results show that the total energy consumption in cold cities (Montreal) is much higher than that in warm cities (Riyadh), because the energy needed for heating and hot-water supply in cold cities is much higher than that needed for cooling in hot-climate cities. This also leads to higher greenhouse gas emissions, in which there is a positive correlation between energy consumption and the emission of greenhouse gases. Surprisingly, both buildings had a very significant carbon footprint.
4.3. Energy Simulation Model
Energy simulation is a tool for analyzing and understanding the complex behavior of energy. It is employed to analyze building energy surveys and evaluate architectural design. Energy simulation is also based on traditional methods of calculating energy loads in heating, ventilation, refrigeration, and air-conditioning [44]. A simulation of construction power was performed to analyze a building’s energy performance in order to understand the relationship between the transient factor design and the properties of the building’s energy consumption [45]. The energy simulation model was developed by using ArchiCAD® software. It simulated the building’s daily, monthly, and yearly energy consumption. Connected with Rhino and Grasshopper, ArchiCAD® was the software of choice due to its seamless workflow [46,47,48,49].
The significance of weather conditions on a building’s performance mandates the use of reliable climate data for energy modeling. To understand the significance of reliable weather data and the different dynamics related to energy simulation, a study [50] is highlighted that performed energy simulations for different envelopes. Weather data were integrated in one of the Shibam city buildings (registered as a UNESCO World Heritage Site) [51]. In preliminary simulations, three different weather-data files were tested, and all of them produced very similar and accurate results. Further analysis showed that the files contained data for locations that were in close vicinity to one another (within a few kilometers). Although there were significant discrepancies in wind conditions among the different files, the result was not affected since the building is not very susceptible to wind. Findings from this study showed that a design team should use a weather file that is representative of the local context of the building. The design team has the freedom to use a ready-made weather file or create a weather file from scratch by either collecting data from local sources (EPW1) or mining their own data (EPW2). Interestingly, the second option proved to be more lucrative for the design team in the study. The total cost for setting up an independent weather station for the building was about USD 2500. After running the data logger for several months, very close measurements were generated, similar to those of MIT and UMASS weather stations, which could be seamlessly converted into −1257-EPW formats. This implies that, in a situation where climate data are not available, design teams should collect their own weather data over a period of at least a few months in order to better assess the weather conditions of the building site. In addition, the data collected should reflect normal weather conditions. This means that data collected in abnormal years or months would be of limited use. Collecting data by using the EPW1 approach proved to be extremely time-consuming, as it required a significant amount of manual labor to merge, synchronize, and input data sources. For the case studies in the present study, two different weather files were obtained from the Climate Consultant® software. These files were then imported into ArchiCAD® to perform energy simulation with the local climate data of both buildings. In order to evaluate the energy efficiency of each building, information on the shape of the building, wall thickness, direction, openings percentage, and orientation were required. In other words, simulations can be represented as scenarios. The following serves as an example:
(Scenario No. 1, mud; Scenario No. 1, stone; and Scenario No. 1, concrete)
Six scenarios were analyzed for MP and GN, and an attempt was made to simulate each scenario for each building. One drawback, however, was that ArchiCAD® is not able to support curves; hence, all openings were modeled as straight lines. The data for each case are summarized as follows: (1) the simulation was performed for all months of the year; (2) the reflection of each was 20%, and solid resistance was 1.87 k/s; (3) the brick thinness in the ceiling was 30 cm; (4) a single glass type with a thinness of 6 mm was used; (5) the residential building type was considered, and the model was treated as one mass; (6) the area of a model for each case was between 10 and 15 km2; and (6) the results were recorded for the average energy consumption per year.
To begin the simulation, the construction material (e.g., mud) and other materials for the next scenario were defined (Figure 5). Several options were assumed for each building in the case studies, and the walls were considered as external (“envelope construction material”). Alternatives of different component assemblies are depicted in Table 2a–c.
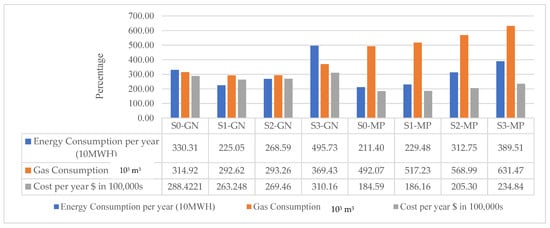
Figure 5.
Comparison between real and simulated scenarios of GN and MP.
Table 2.
Simulation scenarios for both case studies.
4.4. Emissions Analysis
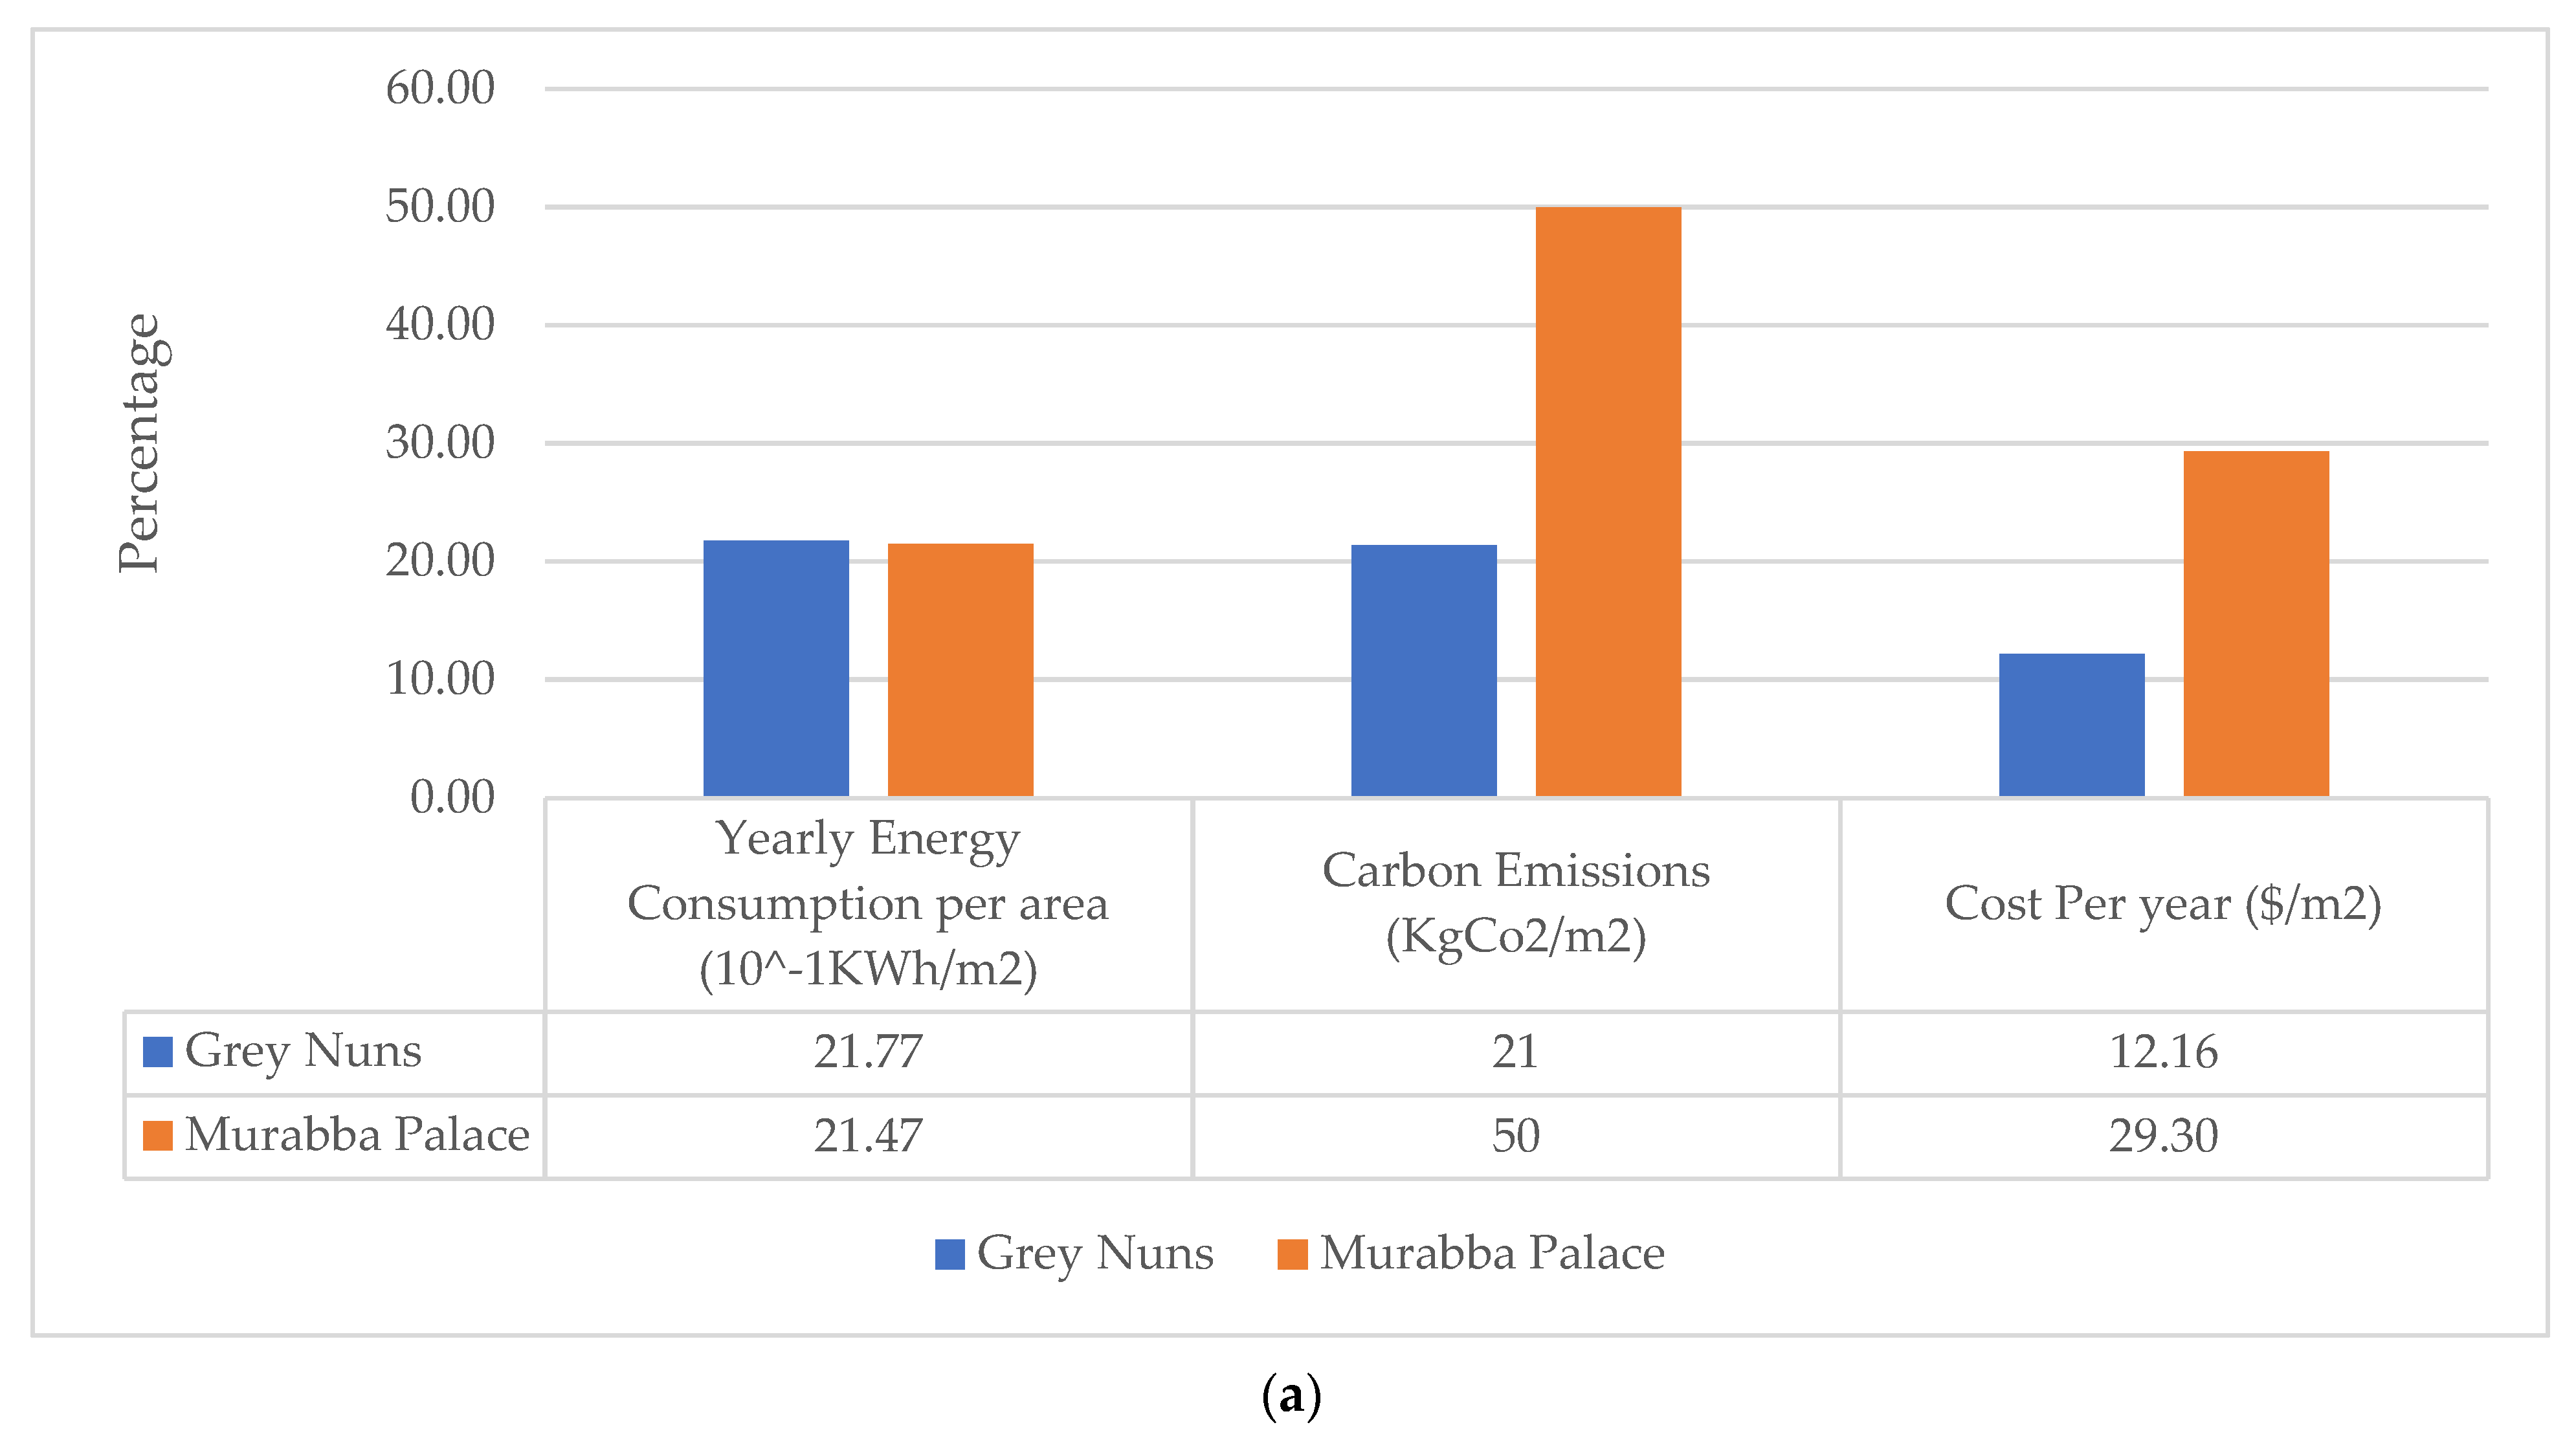
Three simulations were performed for MP and GN, respectively. Each simulation covered different envelope materials (mud, stone, and concrete). Each building had different energy conditions and, consequently, resulted in different scores for the energy factor. These simulations would provide contexts for the envelope material. Simulated data were compared to the actual energy-consumption data, and the results are shown in Figure 6 and Table 3a,b. For instance, the actual energy consumption of GN is 3,303,099 kWh, while simulation results showed a yearly energy consumption of 2,250,501 kWh. Furthermore, concrete buildings consumed the highest amount of energy for both GN and MP. The mud building, in the case of GN, and the stone building, in the case of MP, showed the lowest energy consumption. Similarly, the highest gas consumption, in the case of MP, was that of the concrete building, while the lowest was that of the stone building. Values of energy and gas consumption are reflected directly in the yearly cost. For instance, the stone material, in the case of MP, had the highest energy and gas consumption across the different material envelopes, and, as a result, the stone material yielded the highest cost.

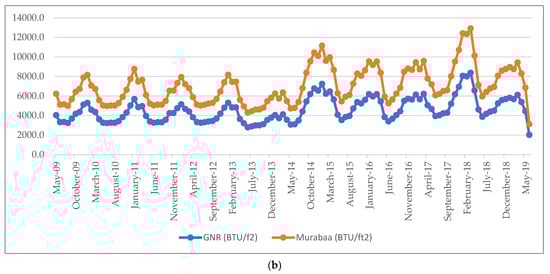
Figure 6.
Energy and carbon consumption. (a) Energy, carbon consumption, and cost per m2. (b) Energy consumption for Murabba Palace and Grey Nuns Building.
Table 3.
Energy consumption for Riyadh and Montreal.
5. Model Implementation
5.1. Life-Cycle Analysis of Energy Consumption in HBs
In this section, the project LCC of energy for HBs is revisited. Particularly, the different project life-cycle phases are analyzed to evaluate the significance of each phase, as well as the associated energy and gas consumption and cost.
After ensuring the reliability and consistency of the data obtained from questionnaires, questionnaire responses were analyzed and presented in Figure 7a,b to illustrate electricity consumption, gas consumption, and cost, respectively, for both case studies. In Figure 7c, we can see that the operation phase had the highest energy and gas consumption for both buildings, with energy consumption of almost 150,000 kWh per area and 20,000 kWh per area for GN and MP, respectively. Similarly, for all the six project life-cycle phases, the cost of the operation phase was also the highest, with values of 222,085 CAD/m2 and 142,134 CAD/m2 for GN and MP, respectively. The planning phase, however, had the lowest energy and gas consumption and cost in both GN and MP, with costs of 5768 CAD/m2 and 3692 CAD/m2, respectively. Energy-savings generated from using mud envelope material rather than the current stone envelope material was calculated as 1,052,598 kWh per year for GN.
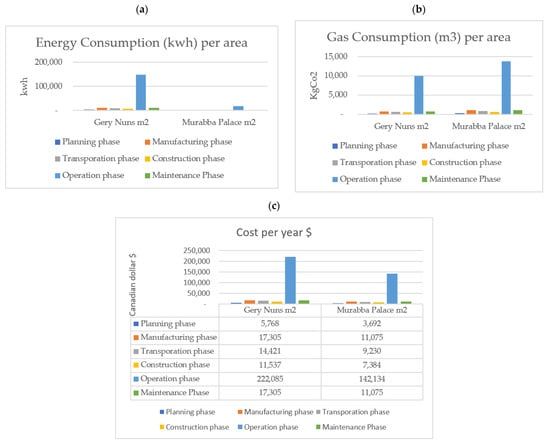
Figure 7.
Cost in the life-cycle phases of both case studies. (a) Electricity consumption in the life-cycle phases of both case studies. (b) Gas consumption in the life-cycle phases of both case studies. (c) Cost in the life-cycle phases of both case studies.
5.2. Sensitivity Analysis
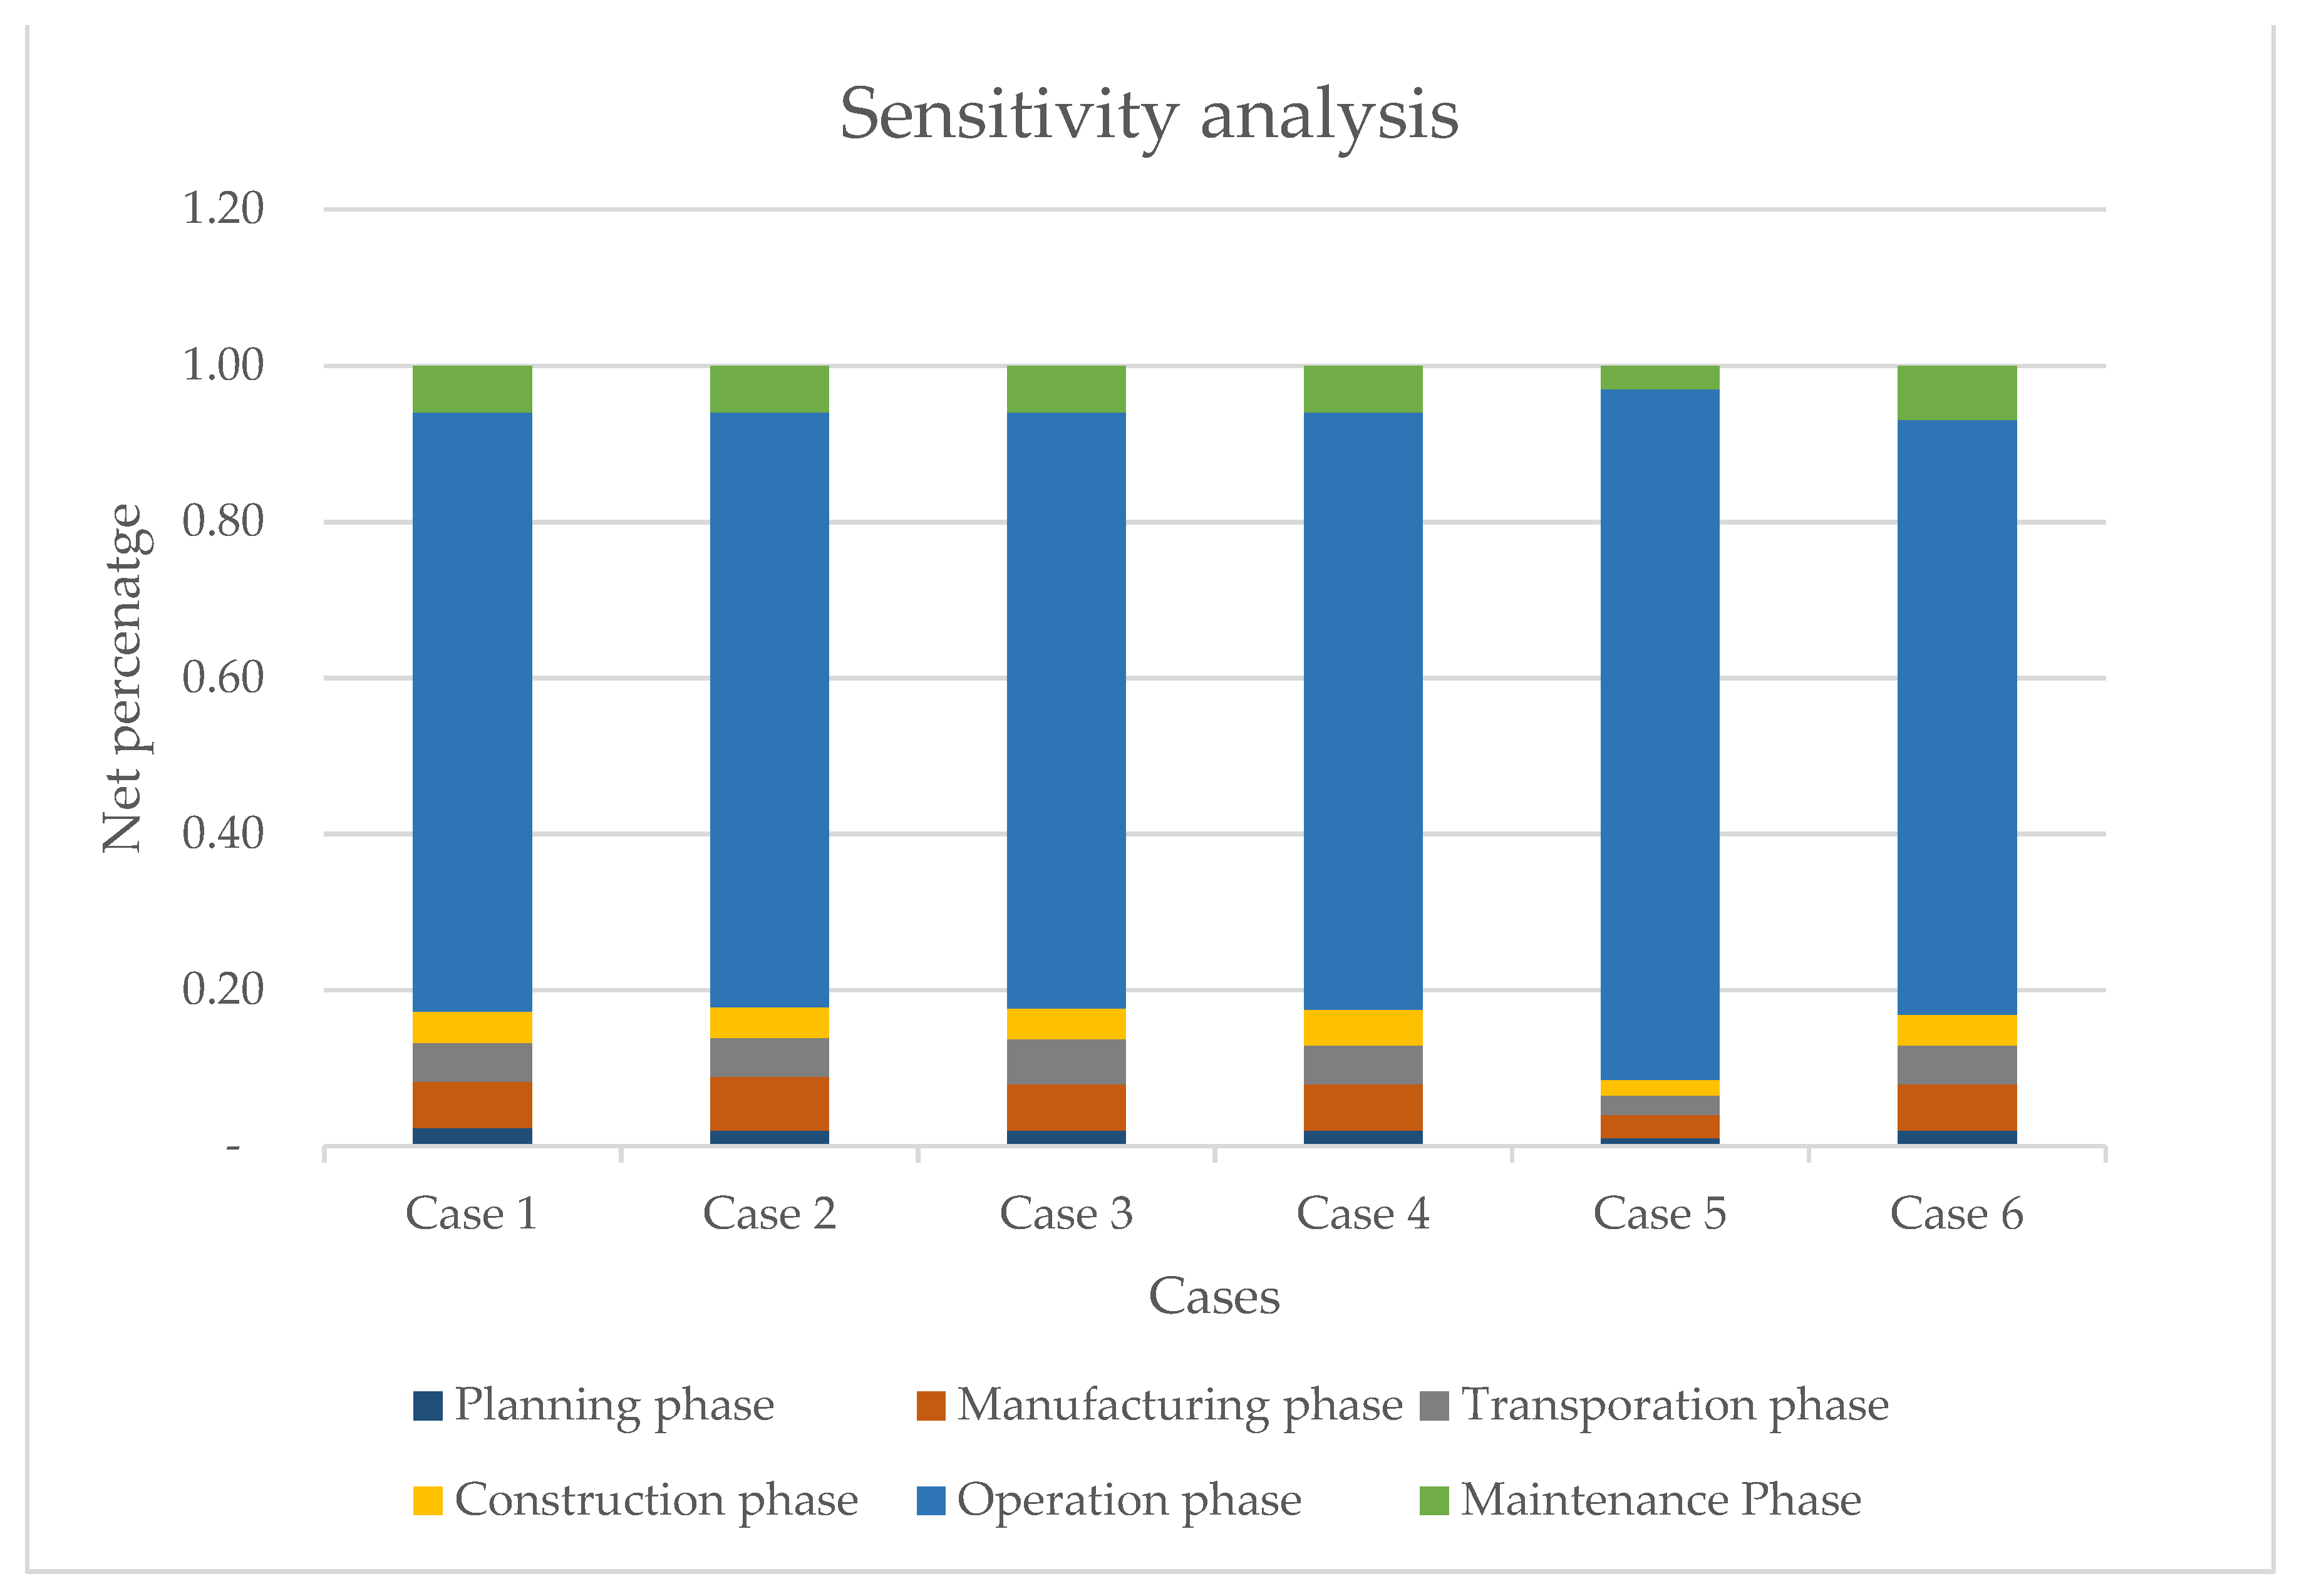
For both case studies, a sensitivity analysis was performed with respect to the LCC of energy for HBs. Figure 8 shows the impact of weight changes on the overall LCC of energy by highlighting the percent difference of LCC of energy on the y-axis. It is evident that the LCC of energy is not greatly affected by significant weight changes. The least percent difference in the LCC of energy is seen in the first and fourth cases, while similar percent differences can be observed in the second, third, and sixth cases (reduction from 0.77 to 0.76). However, for the fifth case, a significantly greater percent difference for the LCC of energy can be observed. Therefore, for both case studies, compared to the other life-cycle phases, the operation phase greatly impacts energy and gas consumption and cost.
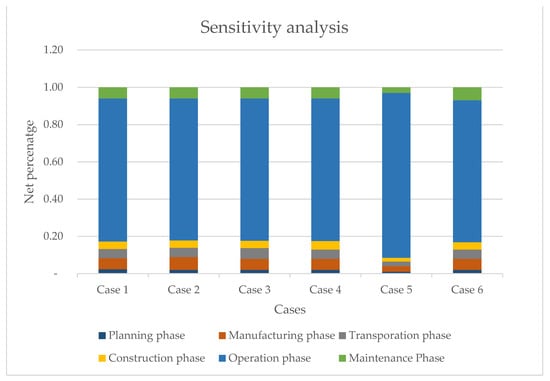
Figure 8.
Sensitivity analysis of LCC of energy for HBs.
The six cases are described as follows: Case 1—the weight of the planning phase was increased by +15%; Case 2—the weight of the manufacturing phase was increased by +15%; Case 3—the weight of the transportation phase was increased by +15%; Case 4—the weight of the construction phase was increased by +15%; Case 5—the weight of the operation phase was increased by +15%; and Case 6—the weight of the maintenance phase was increased by +15%.
6. Results and Discussion
In this research, the results from all the decision-making techniques for the Murabba Palace and Grey Nuns Building that separately used the Fuzzy TOPISS (FT) and Simple Additive Weight (SAW) produced a very similar sustainability index for the Murabba Palace, with an overall evaluation of Unsatisfied. Similarly, the OCRA technique resulted in an Unsatisfied rating with a very low index of 24.09%. The Weighted Sum Model (WSM) technique resulted in a Pass rating, while the Weighted Product Model (WPM) was the only technique that resulted in a Satisfied rating. For the Grey Nuns Building, the FT technique resulted in a Satisfied rating, with an index of 62.84%. Furthermore, both the SAW and WPM techniques resulted in similar scores of 83.02% and 83.35%, respectively, with an overall rating of Silver. In addition, the WSM resulted in a Pass rating, while the OCRA reported an Unsatisfied rating, with an index of 40.35%.
7. Conclusions
In this research, a life-cycle cost (LCC) of energy analysis for heritage buildings was developed. The project’s life-cycle phases include planning, manufacturing, transportation, construction, operation, and maintenance phases. A model was developed and validated based on a sensitivity analysis and case studies. Saudi Arabian and Canadian experts completed questionnaires to attribute a percentage of importance to each of the aforementioned phases with respect to energy consumption. Two case studies—Murabba Palace (MP), Saudi Arabia; and Grey Nuns Building (GN), Canada—were then evaluated. The operation phase appeared to be the most energy-consuming phase in both case studies. For GN, energy consumption per year is 3303 MWh, and carbon emission is 314,924.8 kg CO2. As a result, the cost per year is USD 288,422.09 per m2. For MP, energy consumption per year is 2114 MWh, and the carbon emission is 492,070 kg CO2. As a result, the cost per year is USD 184,590.14 per m2. Hence, the operation phase has the highest impact on the energy consumption, gas consumption, and cost of the building in both case studies. GN in operation phase has 147,000 kwh, which is the highest, while MP has 21,000 kwh. The findings from this study will assist facility managers in making efficient rehabilitation decisions. Moreover, the operation phase has the highest impact on the energy consumption, gas consumption, and cost of the building in both case studies. However, it establishes cost-effective intervention strategies.
Despite the research contributions, due to limited time, only the energy factor was investigated in detail from the list of factors. Other factors were not investigated in as much detail. Moreover, the list of factors presented in this work is not exhaustive. Sustainability is an evolving concept, and more factors continue to be added to the list. In addition, only one case study from Canada and one from KSA were analyzed. It is necessary to evaluate more case studies from other Canadian provinces and elsewhere in the world to see the effect of social, cultural, and climatic differences in different areas. Moreover, insufficient or manually stored data increased the labor-intensiveness of the work in this research. Water-use and revenue data were not available for both case studies. Manual drawings were retrieved for Murabba Palace and AutoCAD® versions needed to be created prior to further analysis. Moreover, BIM models had to be created from scratch for both case studies.
To sum up, this research recommended the following:
- ▪
- One area of potential research is to focus on the weight determination process. Particularly, the weights used in our research were focused on Canada and Saudi Arabia. Thus, as an extension, the weights from more countries could be studied in terms of their impact on the overall sustainability rating. This will also improve the model flexibility.
- ▪
- Saudi Arabia has four weather zones, and the developed rating model examined a heritage building in one of the four zones. The rating model can also be examined for other types of heritage buildings present in the other three zones in Saudi Arabia.
- ▪
- Since a majority of the building assessment systems are re-evaluated yearly or every two years, the Sustainability Assessment of Heritage Building (SAHB) should follow the same re-evaluation frequency in order to keep the system up to date.
- ▪
- Course certification on sustainability development is essential for the person assessing the building in order for him or her to be able to perform an authentic assessment.
- ▪
- Since SAHB works well for residential buildings, a similar model can be developed for commercial buildings, such as schools and hospitals.
- ▪
- It is necessary that building professionals decide on the prerequisite criteria for SAHB. This cannot be performed now, based on the suggestions of experts, until the model has been extensively applied for heritage buildings.
Author Contributions
A.A.-S. and A.B. developed the methodology and concept; A.A.-S. and T.Z. aided in developing the methodology and concept; A.A.-S., A.B. and T.Z. analyzed the findings and the results of the models and aided in writing the article; A.B. and T.Z. supervised this study. All authors have read and agreed to the published version of the manuscript.
Funding
This research received no external funding.
Informed Consent Statement
Not applicable.
Data Availability Statement
The data presented in this study are available upon request from the corresponding author.
Conflicts of Interest
The authors declare no conflict of interest.
References
- Al-Sakkaf, A. Sustainability Assessment of Heritage Buildings. Ph.D. Thesis, Concordia University, Montreal, QC, Canada, 2020. Available online: https://spectrum.library.concordia.ca/id/eprint/987627/ (accessed on 19 April 2020).
- Pandey, A.; Asif, M. Assessment of energy and environmental sustainability in South Asia in the perspective of the Sustainable Development Goals. Renew. Sustain. Energy Rev. 2022, 165, 112492. [Google Scholar] [CrossRef]
- Kurniawan, T.A.; Othman, M.H.D.; Singh, D.; Avtar, R.; Hwang, G.H.; Setiadi, T.; Lo, W.-H. Technological solutions for long-term storage of partially used nuclear waste: A critical review. Ann. Nucl. Energy 2021, 166, 108736. [Google Scholar] [CrossRef]
- United Nations Environmental Programme. UN Enviroment Annual Report, Empowering People to Protect the Planet. 2016. Available online: https://doi.org/978-92-807-3638-0 (accessed on 21 February 2022).
- Shamseldin, A.K.M. Including the building environmental efficiency in the environmental building rating systems. Ain Shams Eng. J. 2018, 9, 455–468. [Google Scholar] [CrossRef]
- Al-Sakkaf, A.; Zayed, T.; Bagchi, A.; Abdelkader, E. Sustainability Rating Tool and Rehabilitation Model for Heritage Buildings. In Proceedings of the Annual Conference of the Canadian Society of Civil Engineering (CSCE), Laval, QC, Canada, June 2019; pp. 1–11. [Google Scholar]
- MacNaughton, P.; Cao, X.; Buonocore, J.; Cedeno-Laurent, J.; Spengler, J.; Bernstein, A.; Allen, J. Energy savings, emission reductions, and health co-benefits of the green building movement. J. Expo. Sci. Environ. Epidemiol. 2018, 28, 307–318. [Google Scholar] [CrossRef]
- Mahmoud, S.; Zayed, T.; Fahmy, M. Development of sustainability assessment tool for existing buildings. Sustain. Cities Soc. 2018, 44, 99–119. [Google Scholar] [CrossRef]
- Al-Sakkaf, A.; Ahmed, R. Applicability of BIM in Heritage Buildings. Int. J. Digit. Innov. Built Environ. 2019, 8, 20–37. [Google Scholar] [CrossRef]
- Walker, R.; McKenzie, P.; Liddell, C.; Morris, C. Estimating fuel poverty at household level: An integrated approach. Energy Build. 2014, 80, 469–479. [Google Scholar] [CrossRef]
- Department for Levelling Up, Housing and Communities. DCLG Annual Report (February). 2006. Available online: www.parliament.uk (accessed on 26 January 2022).
- Baker, P.; Glasgow, C.U. U-Values and Traditional Buildings In situ Measurements and Their Comparisons to Calculated Values 2011. Volume 19. Available online: https://docplayer.net/329714-Technical-paper-10-u-values-and-traditional-buildings.html (accessed on 19 May 2022).
- Al-Sakkaf, A.; Zayed, T.; Bagchi, A. A Sustainability Based Framework for Evaluating the Heritage Buildings. Int. J. Energy Optim. Eng. 2020, 9, 49–73. [Google Scholar] [CrossRef]
- Reddy, A.S.; Raj, P.A.; Kumar, P.R. Developing a Sustainable Building Assessment Tool (SBAT) for Developing Countries—Case of India. In Urbanization Challenges in Emerging Economies: Resilience and Sustainability of Infrastructure; Society of Civil Engineers: Reston, VA, USA, 2018; pp. 137–148. [Google Scholar] [CrossRef]
- Giraldo-Soto, C.; Erkoreka, A.; Mora, L.; Uriarte, I.; Del Portillo, L.A. Monitoring System Analysis for Evaluating a Building’s Envelope Energy Performance through Estimation of Its Heat Loss Coefficient. Sensors 2018, 18, 2360. [Google Scholar] [CrossRef]
- Sodiq, A.; Baloch, A.A.; Khan, S.A.; Sezer, N.; Mahmoud, S.; Jama, M.; Abdelaal, A. Towards modern sustainable cities: Review of sustainability principles and trends. J. Clean. Prod. 2019, 227, 972–1001. [Google Scholar] [CrossRef]
- Chen, Q.; Kleinman, L.; Dial, A. Energy Performance of Campus LEED® Buildings: Implications for Green Building and Energy Policy. J. Green Build. 2015, 10, 137–160. [Google Scholar] [CrossRef]
- Subramanian, A.S.R.; Gundersen, T.; Adams, T.A. Modeling and simulation of energy systems: A review. Processes 2018, 6, 238. [Google Scholar] [CrossRef]
- Lucchi, E.; Buda, A. Urban green rating systems: Insights for balancing sustainable principles and heritage conservation for neighbourhood and cities renovation planning. Renew. Sustain. Energy Rev. 2022, 161, 112324. [Google Scholar] [CrossRef]
- Lucchi, E.; Dall’Orto, I.; Peluchetti, A.; Toledo, L.; Pelle, M.; López, C.P.; Guazzi, G. Photovoltaic technologies in historic buildings and protected areas: Comprehensive legislative framework in Italy and Switzerland. Energy Policy 2022, 161, 112772. [Google Scholar] [CrossRef]
- Di Giovine, M.A. World heritage. In Encyclopedia of Tourism; Springer International Publishing: Cham, Switzerland, 2019. [Google Scholar] [CrossRef]
- Matute, J.M.; Chester, M.; Eisenstein, W.; Pincetl, S. Life-Cycle Assessment for Transportation Decision Making (No. 14-1287). In Proceedings of the ransportation Research Board 93rd Annual Meeting, Washington, DC, USA, 14–16 January 2014. [Google Scholar]
- Pisello, A.L.; Petrozzi, A.; Castaldo, V.L.; Cotana, F. On an innovative integrated technique for energy refurbishment of historical buildings: Thermal-energy, economic and environmental analysis of a case study. Appl. Energy 2016, 162, 1313–1322. [Google Scholar] [CrossRef]
- Milani, B. Building Materials in a Green Economy: Community-Based Strategies for Dematerialization. 2005. Available online: http://www.greeneconomics.net/MilaniThesis.pdf (accessed on 13 January 2022).
- Archaeological Services Inc. Port Dalhousie Heritage Conservation District Guidelines for Conservation and Change. 2001. Available online: https://www.stcatharines.ca/en/building-and-renovating/resources/Documents/Port-Dalhousie-District-Guidelines.pdf (accessed on 18 May 2021).
- Ureche-Trifu, C. Minimal Intervention and Decision Making in Conserving the Built Heritage. 2018. Available online: https://curve.carleton.ca/system/files/etd/b6471698-b6ca-484e-acb0-1e91f9d584ff/etd_pdf/37c211d2d47fbc33b453816de5ae5d2f/ureche-trifu-minimalinterventionanddecisionmakinginconserving.pdf (accessed on 23 February 2022).
- England, H. Making Changes to Heritage Assets Historic England Advice Note 2. 2016. Available online: https://www.historicengland.org.uk/advice/planning/planning-system/ (accessed on 29 March 2022).
- Hasenfus, E.L. Measuring the Capital Energy Value in Historic Structures. 2013. Available online: https://repository.upenn.edu/hp_theses/224/ (accessed on 17 April 2022).
- Intergovernmental Panel on Climate Change. Summary for Policymakers. In Climate Change 2013—The Physical Science Basis: Working Group I Contribution to the Fifth Assessment Report of the Intergovernmental Panel on Climate Change; Cambridge University Press: Cambridge, UK, 2013; pp. 1–30. [Google Scholar] [CrossRef]
- Fahmy, M.; Mahdy, M.M.; Nikolopoulou, M. Prediction of future energy consumption reduction using GRC envelope optimization for residential buildings in Egypt. Energy Build. 2014, 70, 186–193. [Google Scholar] [CrossRef]
- Radhi, H.; Sharples, S.; Fikiry, F. Will multi-facade systems reduce cooling energy in fully glazed buildings? A scoping study of UAE buildings. Energy Build. 2013, 56, 179–188. [Google Scholar] [CrossRef]
- Hygh, J.S.; DeCarolis, J.F.; Hill, D.B.; Ranjithan, S.R. Multivariate regression as an energy assessment tool in early building design. Build. Environ. 2012, 57, 165–175. [Google Scholar] [CrossRef]
- Abanda, F.; Tah, J.; Cheung, F. Mathematical modelling of embodied energy, greenhouse gases, waste, time–cost parameters of building projects: A review. Build. Environ. 2013, 59, 23–37. [Google Scholar] [CrossRef]
- Wong JK, W.; Li, H.; Wang, H.; Huang, T.; Luo, E.; Li, V. Toward low-carbon construction processes: The visualisation of predicted emission via virtual prototyping technology. Autom. Constr. 2013, 33, 72–78. [Google Scholar] [CrossRef]
- Fumo, N.; Rafe Biswas, M.A. Regression analysis for prediction of residential energy consumption. Renew. Sustain. Energy Rev. 2015, 47, 332–343. [Google Scholar] [CrossRef]
- Rincón-Quintero, A.D.; Del Portillo-Valdés, L.A.; Meneses-Jácome, A.; Sandoval-Rodríguez, C.L.; Rondón-Romero, W.L.; Ascanio-Villabona, J.G. Trends in Technological Advances in Food Dehydration, Identifying the Potential Extrapolated to Cocoa Drying: A Bibliometric Study. In International Conference on Intelligent Information Technology; Springer: Cham, Switzerland, 2020; pp. 167–180. [Google Scholar]
- Attar, I.; Naili, N.; Khalifa, N.; Hazami, M.; Farhat, A. Parametric and numerical study of a solar system for heating a greenhouse equipped with a buried exchanger. Energy Convers. Manag. 2013, 70, 163–173. [Google Scholar] [CrossRef]
- Yildirim, N.; Bilir, L. Evaluation of a hybrid system for a nearly zero energy greenhouse. Energy Convers. Manag. 2017, 148, 1278–1290. [Google Scholar] [CrossRef]
- Mobin, M.; Dehghanimohammadabadi, M.; Salmon, C. Food product target market prioritization using MCDM approaches. In Proceedings of the 2014 Industrial and Systems Engineering Research Conference (ISERC), Montreal, QC, Canada, 13 May 2014. [Google Scholar]
- Sotoudeh-Anvari, A.; Sadjadi, S.J.; Molana, S.M.H.; Sadi-Nezhad, S. A new MCDM-based approach using BWM and SAW for optimal search model. Decis. Sci. Lett. 2018, 395–404. [Google Scholar] [CrossRef]
- Budiharjo, A.P.W.; Muhammad, A. Comparison of Weighted Sum Model and Multi Attribute Decision Making Weighted Product Methods in Selecting the Best Elementary School in Indonesia. Int. J. Softw. Eng. Its Appl. 2017, 11, 69–90. [Google Scholar] [CrossRef]
- Wang, M.; Liu, S.; Wang, S.; Lai, K.K. A weighted product method for bidding strategies in multi-attribute auctions. J. Syst. Sci. Complex. 2010, 23, 194–208. [Google Scholar] [CrossRef]
- Roman-Liu, D.; Groborz, A.; Tokarski, T. Comparison of risk assessment procedures used in OCRA and ULRA methods. Ergonomics 2013, 56, 1584–1598. [Google Scholar] [CrossRef]
- Al-Sakkaf, A.; Bagchi, A.; Zayed, T.; Mahmoud, S. Sustainability assessment model for heritage buildings. Smart Sustain. Built Environ. 2021. [Google Scholar] [CrossRef]
- Alwan, Z.; Greenwood, D.; Gledson, B. Rapid LEED evaluation performed with BIM based sustainability analysis on a virtual construction project. Constr. Innov. 2015, 15, 134–150. [Google Scholar] [CrossRef]
- Sousa, J. Energy simulation software for buildings: Review and comparison. CEUR Workshop Proc. 2012, 923, 57–68. [Google Scholar]
- Abdelkader, E.; Al-Sakkaf, A.; Ahmed, R. A comprehensive comparative analysis of machine learning models for predicting heating and cooling loads. Decis. Sci. Lett. 2020, 9, 409–420. [Google Scholar] [CrossRef]
- Coakley, D.; Raftery, P.; Keane, M. A review of methods to match building energy simulation models to measured data. Renew. Sustain. Energy Rev. 2014, 37, 123–141. [Google Scholar] [CrossRef]
- Enzyme. 2016. Available online: http://www.weareenzyme.com/tools-for-sustainable-design (accessed on 23 June 2021).
- Al-Sakkaf, A. Towards a Climate-Sensitive Vernacular Architecture: In the Arabian Peninsula; LAP LAMBERT Academic Publishing: Chisinau, Moldova, 2019. [Google Scholar]
- Al-Sakkaf, A. Preserving Yemeni Architecture in the Era of Civilization and Development. Int. J. Environ. Sustain. Green Technol. (IJESGT) 2020, 12, 1–12. [Google Scholar] [CrossRef]


Publisher’s Note: MDPI stays neutral with regard to jurisdictional claims in published maps and institutional affiliations. |
© 2022 by the authors. Licensee MDPI, Basel, Switzerland. This article is an open access article distributed under the terms and conditions of the Creative Commons Attribution (CC BY) license (https://creativecommons.org/licenses/by/4.0/).