Abstract
For seismic risk analysis, reliable predictions and estimations of earthquake damage and seismic behaviour of buildings are essential. A common method is the use of fragility curves. In this paper, fragility functions are developed based on various numerical damage criteria for five defined damage grades, from slight to destruction. The proposed new multiscale approach establishes a correlation between observed damage patterns due to foreign earthquakes and the seismic response of the building using thresholds for material-specific and global characteristics. This approach takes into account various possible damage patterns on different scales more comprehensively than the well-known approach of displacement criteria. Moreover, the approach is universal and adaptable for building classes as well as region-specific material and system characteristics. Several damage criteria with their defined limit values are assigned to the five proposed damage grades, whereby quantity and distribution of the exceeded criteria are relevant, since the first occurrence does not always lead to damage. With the new approach, damages that are not evident in the pushover curve in terms of strength degradation can be detected and taken into account for the damage thresholds. The derived displacement values associated with the damage levels are the basis for developing fragility functions. The results—damage criteria, pushover curves with damage grades, capacity curves as well as fragility functions and parameters—are presented for a four-storey reinforced concrete frame building. These results are discussed and validated with data from the literature. Comparisons to existing fragility functions in the literature show that our developed fragility functions are mostly located in the middle range, graphically as well as for the curve parameters. This specific example was chosen to present our multiscale approach, but for general building classes, numerous simulations with varying characteristics are essential and result in a higher standard deviation of the final fragility curves.
1. Introduction
In the case of an earthquake, casualties and economic loss are mainly related to the seismic behaviour of structures. Hence, reliable predictions and estimations of earthquake damage and seismic behaviour of buildings play an important role in seismic risk analysis. In addition, the classification of occurred damages is essential to effectively support rescue measures and to be able to assess the stability of structures [1,2,3].
Fragility functions are an important tool for modelling seismic risk and loss by describing the probability of exceeding a damage state level for a given structure and intensity measure. Fragility functions are covered in detail, for example, by Crowley et al. [4], D’Ayala et al. [5] and SYNER-G [6]. There are four main approaches for the development of fragility functions: empirical, expert opinion-based, analytical and hybrid [6]. Empirical fragility curves are derived based on collected damage data from post-earthquake surveys for different building typologies. Expert opinion-based fragility functions depend on the judgement and estimation of experts that are often expressed in terms of damage probability matrices and mean damage factor functions. Although the inclusion of real damage data and expert experience from past seismic events is only possible with the two approaches mentioned before, the analytical derivation of fragility curves is mostly used, if the computational capacity is not the limiting factor. Structures are modelled with varying material and geometric characteristics and analysed for a range of seismic intensities. A high similarity between the model and the real building depends on the modelling capabilities and is important to achieve reliable results [6]. The modelling and damage analysis of the structure is followed by a statistical evaluation to derive analytical fragility functions. The hybrid method combines two of the approaches explained.
For the development of fragility functions, the structure has to be numerically analysed concerning its earthquake load-bearing capacity first. For this performance assessment, non-linear methodologies such as the pushover or the dynamic time-history are often applied [5,7,8,9]. Moreover, damage thresholds are essential to define the limits of the engineering demand parameter (EDP) for the calculation of the probability of exceedance as part of the fragility functions. In the literature, thresholds for the damage grades of reinforced concrete (RC) buildings are mainly based on yielding and ultimate displacement of the bilinearization of the pushover curve [4,10]. With this approach, only damages that are evident in the pushover curve in terms of strength degradation can be detected, but the element scale is neglected. A multiscale approach for masonry buildings is applied by Lagomarsino and Cattari [11] as well as by Simões et al. [12], but is hardly available for reinforced concrete structures. Moreover, fragility functions are often derived from one specific building type of a region or country, and are not transferrable to other building classes or countries [6]. Additionally, the fragility curves often cover three to four damage states.
To cover the high variety of buildings, in most cases, buildings with similar characteristics in terms of seismic behaviour are summarised in building classes. In the GEM Building Taxonomy Version 2.0 [13], thirteen important attributes are included to define a building class. This building taxonomy was simplified for the GED4All Global Exposure Database for Multi-Hazard Risk Analysis [14] by selecting a lower number of attributes for the classification. This classification system was adapted for the ESRM20 to classify the vulnerability of European buildings [4,15].
In this paper, a new analytical multiscale approach for reinforced concrete buildings is proposed. The developed fragility functions for different building classes based on the new approach are used for the initial damage forecast in a research framework [16]. Resulting areas with potential high damage are the starting point for overview flights with unmanned aerial vehicles (UAVs). The recorded data are the basis for rescue measurements and the choice of buildings for detailed flights. The earthquake damages to the buildings, recorded in detail, are classified with automatic and crowdsourcing-based approaches. The classification is carried out with a developed damage catalogue that contains specific damage patterns for the materials reinforced concrete and masonry, as well as global damage characteristics. This damage catalogue for five damage grades—slight, moderate, heavy, extreme and destruction—was introduced by Kohns and Stempniewski [17]. For the development of fragility functions, here, the observed damage, included in the damage catalogue, is linked to the numerical seismic response of the building. Therefore, in this paper, several multiscale criteria are proposed to determine the location of the five damage grades on the numerically calculated response curve in non-linear static analyses. These criteria contain thresholds for material-specific and global characteristics to register various types of damage for reinforced concrete (RC) buildings based on the damage catalogue. Via frequency and spatial distribution, these damage criteria, with their defined limit values, are assigned to the five proposed damage grades. Interstorey drift (ISD) and spectral displacement values are derived from the relevant positions of the damage grades on the pushover curves. The curves and the damage thresholds are the basis for the explained procedure of developing fragility functions. The new approach takes into account various possible damage patterns on different scales more comprehensively than the well-known approach of displacement criteria based on yielding and ultimate displacement of the bilinearization of the deformation curve. Moreover, the approach can be applied to all building classes as well as region-specific material and system characteristics. For the definition of the five proposed damage grades, the quantity and the distribution of the damage criteria are important, since the first occurrence does not always lead to the damage grade. With this multiscale approach, damages that are not evident in the pushover curve in terms of strength degradation can be detected and taken into account for the damage thresholds.
The whole process—from the modelling of the building to the final fragility functions—is exemplarily carried out for a four-storey reinforced concrete frame building. Positions of the damage grades on the pushover curve and the resulting fragility functions are presented. The results are discussed and validated with data from the literature.
2. Approach for the Definition of Multiscale Criteria Defining Damage Grades on Pushover Curves
For the seismic performance assessment, two non-linear analysis types are usually applied: non-linear dynamic time-history analysis and non-linear static pushover analysis [7]. In contrast to the dynamic time-history analysis, the pushover analysis is a less computationally demanding procedure, which delivers fast but still adequate results. Due to this advantage, the pushover analysis was applied for the investigations in this study. The resulting pushover curve represents the global seismic behaviour through a relationship between the total base shear and the displacement of a control node. The choice of the position of the control node has a great influence on the results. It should be located at the top of the building and near the centre of mass to represent the displacement of the whole building. The pushover curve is obtained by subjecting the building model to permanent vertical loads and monotonically increasing lateral forces or displacements, distributed over the height of the building. The horizontal load pattern may follow a uniform, triangular or first-mode proportional shape over the height. According to EC8-1 [18], at least two different load patterns are required—a distribution proportional to mass regardless of elevation as well as a modal distribution.
For the further process of investigation, the task is to define the damage grades on the resulting pushover curve so that they fit the observed damage, the seismic behaviour and the earthquake engineering assessment. Information concerning the general locations and thresholds for damage states are described in the following and shown in the graph in Figure 1. Further information can be found in [12,19,20,21].

Figure 1.
General positions of the five damage grades on the pushover curve and associated global criteria.
For slight damage, no loss of load-bearing capacity results, and the damage grade is located in the middle range of the ascending branch. Moderate damage is characterised by yielding of the reinforcement and cracks in the concrete that result in a non-linear behaviour and, therefore, the damage grade’s position is in the area of stiffness reduction. The heavy damage state is located near the maximum shear force. The damage levels extreme and destruction are set on the descending branch as the load-bearing capacity decreases continuously with progressive damage.
For the determination of the position of the damage grades, different scales and types of criteria are essential.
Our derived approach defining various general numerical criteria that represent the observed damage patterns and mechanisms on different scales is presented here. Five damage grades based on the damage catalogue [17] are defined and investigated. For these, the new approach proposes universal criteria for RC structures that can be adapted to the material-, system- and region-specific characteristics of the investigated structures. Moreover, with multiscale criteria, an attempt is made to ensure that as many damage patterns as possible are covered. Therefore, material-specific and deformation criteria on the element scale as well as global criteria are applied. The latter, represented by the pushover curve, are based on the general locations as described before (Figure 1). The material-specific damage criteria relate to either concrete or steel reinforcement.
Table 1 presents the new material-specific damage criteria for determining the damage development in RC buildings based on strains and deformations. The required parameters are to be determined according to EN 1992-1-1 [22]. On the element scale, the criteria are based on the stress–strain relationships for concrete and steel that are included in papers by Paulay and Priestly [23] as well as Biskinis and Fardis [24]. For concrete, tension and compression behaviour are covered. With damage criterion (a), εct describes the positive concrete strains larger than the ratio between the tension strength fctm and the initial stiffness Ec of the concrete material. For concrete under compression (negative strains), thresholds are defined for spalling of the unconfined concrete cover εcsp (b) and cracks in the confined concrete core εc (c) [23]. The reinforcement is investigated at the two points yielding (d) and failure (e). For (e), εu is reduced to 3/8 of the elongation at peak load [24] to take into account the cyclic loading due to an earthquake. In addition to the strain-based criteria at the element scale, moment–curvature relationships are often applied to detect damage [19,23,24]. Hence, the curvature is used as a criterion at the point of cracking (f), with εc at cracking and x as the height of the compression zone [23] and at the point of yielding (g) based on [24]. Moreover, in Eurocode 8 Part 3 [25], thresholds for the chord rotation and shear capacity are given for the limit states Damage Limitation (DL), Significant Damage (SD) and Near Collapse (NC). For NC, the total chord rotation capacity includes the elastic and inelastic part of rotation at ultimate (cp. equation (A.1) [25]). For the SD limit state, the chord rotation capacity is assumed to be 75% of the ultimate chord rotation for NC. For the threshold of DL, the chord rotation at yielding is applied (cp. equation (A.10a) [25] for beams/columns and equation (A.11a) [25] for walls). The shear capacity is defined for the limit state of NC from expression (A.12) [25]. These outlined equations are used for chord rotation at yielding (h) and capacity (i) and shear strength (j).

Table 1.
Material-specific damage criteria and related thresholds for reinforced concrete buildings.
For each damage grade, several of the presented criteria are applied, whereas one criterion may be used for different damage grades. The respective damage criteria are assigned to the five damage grades using frequency and spatial distribution (Table 2). In the presented approach, only column elements are investigated concerning the quantity. Beams are considered secondary components, since column failure is usually more serious than beam failure [26]. The suggested values for the percentages of the affected columns for the different damage grades (Freq in Table 2) are based on quantitative ranges in [1,2] and the damage catalogue. For the distribution, a distinction must be made between floor level and the entire building.
Table 2.
Assignment of the damage criteria to the damage grades via frequency (Freq) and distribution.
For example, for the heavy damage grade, the criterion for the concrete cover strain (b) has to be reached in all columns on one floor. The floor for which the criterion is exceed first is not considered. The analogous procedure applies to the cracking of the cross-sectional concrete core (c). Here, the limit for the criterion is 10% of the columns involved in any floor, whereby the percentage relates to the columns of the associated floor. Heavy damage is also considered in the following cases: one column reaches failure of reinforcement (e), chord rotation capacity (i), or shear strength (j). The column can be located anywhere in the building.
In addition to the material-specific criteria, the global load-bearing behaviour is considered. These criteria are directly represented by the pushover curve. The global criteria are shown in the table in Figure 1. For the damage levels slight and moderate, the global criterion only becomes relevant if the material-specific damage criteria are exceeded with a lower displacement. Then, the total force reached can be higher than for the material-specific criterion only. For the other damage states, the global criteria are considered on an equal level with the material-specific criteria.
To sum it up, for each damage grade, four to five material-specific criteria and one global criterion are applied, and the position of the damage grade on the pushover curve is defined by the minimum displacement threshold obtained from the verification of the limits at the different scales. From the relevant positions of the damage grades on the pushover curves, interstorey drift (ISD) and spectral displacement values are derived, whereby possible different damage mechanisms are considered using various criteria and scales. These values are the basis for the process of developing fragility functions described in the next section.
3. Development of Fragility Functions
3.1. General Process
Fragility functions define the probability of exceeding (PoE) or reaching a damage state given a ground motion intensity measure (IM). For the development of these fragility functions, the pushover curves and the damage state thresholds, using ISD values or spectral displacements, described in Section 2, are the basis.
Detailed guidelines for the different possibilities of developing analytical seismic vulnerability functions are given in [5]. The most important steps in the process of deriving fragility functions, in general, are summarised as follows (Figure 2):
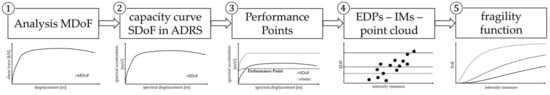
Figure 2.
Important steps in the general process of deriving fragility functions.
- (1)
- A multi-degree-of-freedom (MDoF) system is numerically analysed. The result of non-linear static analysis is a pushover curve, which gives the total base shear of the system as a function of its displacement;
- (2)
- The pushover curve is converted into a capacity curve that expresses the relationship between the acceleration of an equivalent non-linear single-degree-of-freedom (SDoF) system and its displacement. For this, two steps are necessary: (a) the transformation from MDoF to SDoF and (b) the transformation from force–displacement into acceleration–displacement response spectra (ADRS) format. Details and formulas can be found in [27];
- (3)
- To estimate the demand, different ground motion records are selected whereby type and number of records are important to receive informative fragility functions. The records are the basis to derive the inelastic response spectrum in the ADRS format. Both the idealised capacity curve and the inelastic demand spectrum in the ADRS format are shown in one diagram. Graphically, the seismic demand, known as performance point, is defined by the intersection of both curves. For the numerical calculation of the displacement demand, various methods are available in the literature, e.g., the capacity spectrum method [28], N2-method [29] and displacement-based approach [30];
- (4)
- The previous step has to be repeated for multiple records to determine many performance points representing the engineering demand parameters (EDP) for different IMs, defining the relationship between structural response and ground shaking intensity;
- (5)
- The resulting cloud of EDP–IM points is used to determine the EDP and its dispersion for each damage state threshold. Two approaches for the calculation are mentioned here: the generalised linear model and least squares regression. As a statistical model, a lognormal cumulative distribution between EDPs and damage states is assumed to derive the fragility functions.
3.2. Specification of the Theoretical Process and Related Influencing Parameters
The general theoretical process can be realised in different ways, and various commercial software is available. One option is the open-source platform Vulnerability Modellers Toolkit (VMTK) [31] for the derivation of fragility functions. In the following section, the most important influencing parameters are explained.
The selection of appropriate ground motion records is one of the main sources of uncertainty in structural vulnerability assessment. If universally applicable fragility functions for a building class for a large region are desired, many ground motion records are needed to cover the full range of the intensity measure level and to reach all damage grades. A small and unsuitable number of records may result in wrong estimations. Additionally, the choice of the intensity measures is relevant, while the peak ground acceleration (PGA) is the traditional unit. For further information about the advantages and disadvantages of different measures of ground motion intensity, refer to [32].
The capacity of the investigated structure is defined through a bilinear, trilinear or quadrilinear idealised curve in the ADRS format. For this, the pushover curves of the MDoF system are converted into curves for the SDoF system in the ADRS format using Formulas (1) to (3) according to [27,33].
For the first-mode shape, the transformation factor Γ1 is given by
where Φ1 is the modal vector of the first natural mode, M is the diagonal mass matrix and r is the influence vector. The second part is the simplified summation form with the masses mj and related components of the modal vector Φ1,j due to the diagonal structure of the mass matrix.
The mass of the related equivalent SDoF system m1* is
With Γ1 and m1, every point on the force (Fb)–displacement (xpushover) curve from pushover analysis can be transformed with Φ1,pushover for the control node into the spectral acceleration (Sa)–spectral displacement (Sd) format.
The capacity curves, especially the first part, should be well-represented by the idealisation, since low damage grades are strongly influenced. The post–peak behaviour has a lower influence representing high damage grades. E.g., an underestimation in shear for low damage grades may lead to a higher vulnerability than expected.
For the non-linear dynamic analysis of the SDoF, a cyclic strength degradation on the basis of an energy approach can be applied (for further information, refer to [31]). Besides the degradation approach, a mass-proportional Rayleigh damping is considered. The output of the structural analyses is a distribution of EDPs vs. IM levels. Mainly, degradation and damping influence the structural response. If the analysis is calculated without degradation, the stiffness and strength of the system stay the same during the whole analysis, which leads to a different fragility function than one made by taking into account energy dissipation through hysteresis by using degradation. The damping value should not be chosen unrealistically high, as higher damping tends to lead to lower fragility.
The cloud of EDP–IM points is the basis for the derivation of fragility functions with the cloud analysis approach proposed by Jalayer et al. [34] that applies a three-parameter fragility model whose model parameters are the median and the standard deviation from regression in the logarithmic space. For the regression, two approaches are available: (1) all data points are used equally for a simple linear regression and (2) a censored regression. In the latter, displacements higher than a threshold are treated differently because they are expected to be only possible due to numerical analysis convergences for levels of displacement that are incompatible with structural stability. The influence of the censored regression on the fragility function depends on the value of the censoring factor in comparison to the threshold for the highest damage grade and the demand selected. Moreover, the building-to-building variability can be chosen freely. This value is added to the dispersion of the record-to-record variability through the square root sum of squares. Another option is to add the dispersion due to building-to-building variability to the standard deviation of the final developed fragility function. The building-to-building variability changes the shape of the fragility, and it has to be considered if this aspect was already included in the capacity curves by taking a group of curves for one building class. An increasing dispersion leads to a more flat final fragility function. The damage model plays an important role in defining spectral displacement thresholds for the damage states. The damage thresholds in terms of displacement have a great influence on the final fragility functions because lower limits result in higher fragility for the same intensity measure level. The resulting fragility functions are defined using cumulative lognormal functions including values for IM and probability of exceedance for each defined damage grade. The considered choice of all influencing parameters is important to achieve meaningful fragility functions.
4. Example of a Four-Storey Reinforced Concrete Frame Building
In this section, the derivation of fragility functions for the five damage grades is exemplarily shown for a reinforced concrete frame structure. The determination of the pushover curves and the displacement limits for the damage grades is carried out with the software SeismoStruct 2022 [35] for static and dynamic non-linear analysis of framed structures. The subsequent process up to the final fragility curves is implemented with VMTK [31]. Before the analysis in SeismoStruct, the building was modelled linear-elastically in RSTAB [36] based on the normative material laws. The verifications for both limit states, ULS and SLS, were performed and the required reinforcement was determined. One sample building was chosen here to show the new approach with multiscale damage criteria.
4.1. Modelling and Simulation
A general regular four-storey reinforced concrete (RC) frame building is investigated. The four floors are each 2.5 m in height and the floor plan is 16 m × 12 m. The building consists of ten separated frames, five on each of the axes A–A to E–E and 1–1 to 5–5. Masonry infill walls are not explicitly modelled but are considered as an additional load on the beams. Figure 3 shows the plan view, the 3D model and elevation views of the investigated RC building in SeismoStruct [35].

Figure 3.
Plan view (top left), 3D model (top right), elevation view A-A (bottom left) and elevation view 1-1 (bottom right) of the investigated reinforced concrete (RC) frame building.
For the columns in all storeys, a section of 300 mm × 300 mm, with a longitudinal reinforcement of 4 Φ 20 mm in the corners and 4 Φ 12 mm at the sides, is defined. The transverse reinforcement consists of 10 mm bars with a spacing of 200 mm and two stirrup legs each along width and height. The beam section is 300 mm wide and 500 mm high with a longitudinal reinforcement of 4 Φ 20 mm at the top, 2 Φ 20 mm at the bottom and 2 Φ 12 mm at the sides. The transverse reinforcement for the beam is the same as for the column. The positions of the lap joints are in the respective pressure zones. The sections are shown in Figure 4.
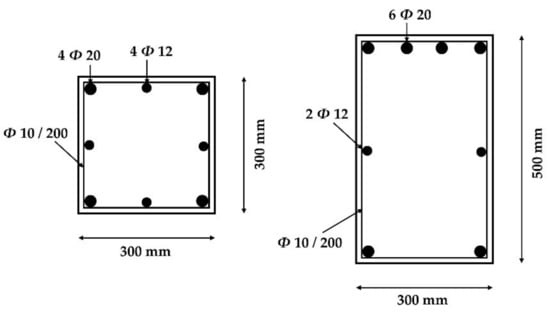
Figure 4.
Sections and reinforcement of columns and beams.
For both sections, the confinement factors are considered in the analyses on the basis of the concrete material and the reinforcement. The columns, as well as the beams, are modelled in a simplified way as inelastic plastic-hinge force-based frame elements (infrmFBPH) that concentrate the inelasticity at the two ends of the element within a fixed length of the element. As concrete material, the strength class C30/37 is applied and the material parameters for the non-linear concrete model proposed by Mander et al. [37] are defined. With the Menegotto–Pinto steel model, a B500B steel is specified for the reinforcement. Floor loading, such as permanent loading of the 0.15 m thick floors, the floor finishing as well as the live loads, is distributed to the beams since the floors are assumed to be spanning in two directions. For the permanent load of the floor finishing, 2.0 kN/m2 is taken into account. For live loads, 2.0 kN/m2 is expected, whereas only 30% is considered for the seismic load combination according to Eurocode 8 [18]. In addition, the infill weight for the 0.13 m thick masonry infill walls of 1.44 kN/m2 for the first to the third floor is calculated and applied as additional weight to the corresponding beams. The applied loads to the beams are specific for both axes (A–E or 1–5), the floor number (1–3 or 4) and the position of the frame (external and internal) due to the different loads and the respective loaded areas. Self-weights of columns and beams are automatically computed in SeismoStruct and the total loading of floors (self-weight and floor finishing) as well as infills is considered as additional mass for the beam sections in the element classes that result in eight different beam types.
The pushover analysis is conducted for the two directions x and y. Due to the symmetry of the building, there is no difference between the positive and the negative orientation for x and y, respectively. Two different lateral load patterns are investigated, a uniform and a modal distribution. For the modal distribution, an eigenvalue analysis is run before the pushover analysis to determine the load pattern for the modal form with the highest effective modal mass percentage for each direction. Specific horizontal loads for each node are defined as incremental loads in the relevant direction, as shown in Figure 3, top right. In total, there are four analyses conducted, each up to a displacement of the control node of 0.25 m in 100 steps. As control node, the node on the top floor in the centre is chosen.
4.2. Definition of Damage Criteria and Damage Grades
The material-specific damage criteria are defined in the Pre-Processor in SeismoStruct [35]. Here, only the column elements are selected for the monitoring of the performance criteria as the beams are considered secondary components, as stated before.
Table 3 shows the specific limit values for the damage criteria for the RC frame building based on the definitions of Table 1. SeismoStruct automatically calculates the criteria (h) to (j) on the basis of the formulas given in Table 1 for each step.
Table 3.
Material-specific damage criteria and limit values for the investigated RC building.
Because the focus is on the new approach, only the results with mean values (see previous section) are presented here for clarity. Investigations with higher and lower material parameters were also carried out.
After the simulation, the defined criteria can be analysed. As already stated in Section 2, for each damage grade, various criteria are considered and the assignment of the damage criteria to the damage grades is shown in Table 2. Table 4 shows the steps in which the respective criterion for the different analyses is exceeded. In the first step, the permanent loads are applied. Then, the horizontal loads are increased in each step due to equally increasing displacement, where 101 is the last step (0.25 m). In addition to the material-specific criteria, the global criteria in Figure 1 have to be taken into account for each damage grade and are included in Table 4 as “global”.
Table 4.
Steps (out of 101) for all analyses in which the damage criteria are exceeded.
The decisive criterion occurs with the smallest step—having regard to the special features of some global criteria—and, thus, with the lowest displacement for the related damage grade. The positions of the damage grades of all analyses were determined on the basis of the defined criteria using a set of Python scripts. Figure 5 shows the pushover curves with the derived damage grades for four representative analyses—x-direction with uniform horizontal load pattern, x-direction with modal horizontal load pattern, y-direction with uniform horizontal load pattern, and y-direction with modal horizontal load pattern. The different directions have little influence, whereas the influence of the load patterns is significant. Therefore, EC8 [18] postulates investigating different lateral load distributions to consider the most unfavourable effects.

Figure 5.
Pushover curves of the RC building for four analyses (x/y, uniform/modal).
In the following, the damage grades for the x-direction analysis with uniform load distribution are exemplarily described on the basis of Table 4 and Figure 5, and the decisive damage criteria are shown in different colours in Figure 6. The slight damage grade is located at the ascending branch of the curve and the decisive criterion is the yielding reinforcing steel (d) that is reached in 30% of the columns on the first floor in step 17 (cp. Figure 6A). The global criterion is not relevant here, although it occurs in step 10. The second damage grade moderate shows the beginning of the non-linear behaviour and for the investigated analysis, the criterion yielding reinforcing steel (d) in all columns on the first floor defines the position on the curve as it is reached in step 21 (cp. Figure 6B). Damage grade heavy is characterised by reaching the maximum force in step 35. The global load drop of 5% occurs in step 47 before the material-specific criteria and is thus decisive for the damage state extreme. In addition, for the last damage grade destruction, in step 60, in 30% of the columns on the first floor, the reinforcement (e) fails. In the same step, the capacity of chord rotation is reached in 50% of the columns on the first floor. These two criteria define the position on the descending part of the curve (cp. Figure 6C).

Figure 6.
Decisive damage criteria for analysis in x-direction with uniform load distribution for the damage grades slight (A), moderate (B), destruction (C) and the last step (D) with horizontal displacements.
Hence, the influences of both material and global behaviour are shown; as for the various damage grades, different criteria are decisive. The overall evaluation of the criteria shows the exceedance of the thresholds initially on the first floor for all analyses that fit the soft-storey behaviour, which is shown exemplarily at the end of the pushover analysis in Figure 6D. In Figure 6, the horizontal displacements in the corresponding levels and steps are shown.
4.3. Fragility Functions
The fragility functions are developed with VMTK (cp. Section 3.2 [31]) using our pushover curves and derived damage grades (cp. Section 4.2). As ground motion records, over 2000 records of the Engineering Strong Motion Database (ESM) ([38]) for Europe are selected as input, and peak ground acceleration (PGA) is chosen as the intensity measure (IM). The pushover curves of the MDoF system simulated with SeismoStruct [35] are transformed into the SDoF system curves in the ADRS format by applying Equations (1)–(3). Furthermore, an approximation was done using four linear sections for each curve (cp. Figure 7).
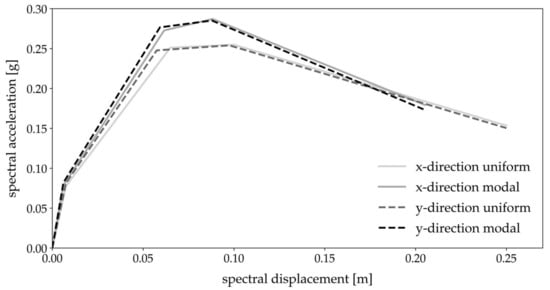
Figure 7.
Approximations of the four capacity curves in the spectral acceleration–spectral displacement format.
For the calculation of the structural response, the degradation approach takes into account the decreasing strength and stiffness of reinforced concrete due to energy dissipation under cycling loading (cp. Section 3.2). Moreover, a damping ratio of 5% is defined, which is the common assumption for reinforced concrete in literature, e.g., in [4]. As EDP, the maximum displacement is selected. Censored regression is applied with the suggested censoring factor of 1.5. For the building-to-building variability, a value of 0.3, as recommended in [31], is used. The derived displacement values for the damage grades of the previous section are converted to the damage model, which defines the spectral displacement thresholds for the damage states. The minimum values of the analyses are shown in Table 5 in the first row.
Table 5.
Spectral displacement thresholds for the fragility module in VMTK and curve parameters for the cumulative lognormal distributions according to the five damage grades.
The output of VMTK is discrete values for PGA and probability of exceedance for each defined damage grade. These values are the basis by which to determine curve parameters, mean and standard deviation for the continuous cumulative lognormal distribution, using the method of least square minimizing the sum of squares of the residuals (data points–function values). In Figure 8, the resulting fragility functions for the derived damage grades are exemplarily presented for the chosen RC building model.
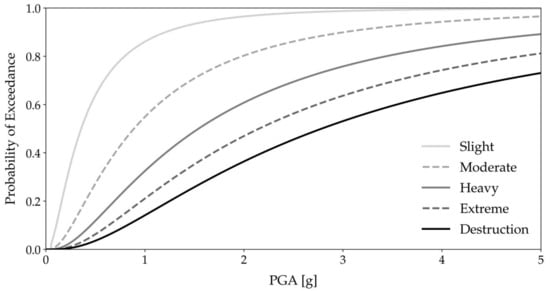
Figure 8.
Fragility functions for five damage grades for the RC frame building.
Table 5 contains the related curve parameters, mean and standard deviation for the cumulative lognormal distribution for the derived damage grades.
4.4. Validation and Discussion of Derived Fragility Functions
In the first step, the damage thresholds are compared to approaches from the literature: HAZUS [20] and FEMA 356 [21]. HAZUS [20] suggests ISD and spectral displacement values for four limit states: Slight, Moderate, Extensive and Complete Damage. FEMA 356 [21] proposes three damage performance levels: Immediate Occupancy (IO), Life Safety (LS) and Collapse Prevention (CP) and related drift values. For the comparison, the different damage scales are related to each other [7]. For HAZUS, the building class C1M (concrete moment frames mid-rise), and within FEMA, the concrete frames, are chosen for the comparison. Table 6 includes the comparison of ISD thresholds of our study, HAZUS and FEMA.
Table 6.
Comparison of own derived interstorey-drift values (second column) to approaches from the literature.
The comparison shows that our derived mean values are, for the low damage grades, in between the range of values proposed by HAZUS (which is, in general, more conservative) and FEMA. For the two highest damage grades, the derived values are higher than the thresholds of HAZUS and FEMA. This may be because the definition of damage states differs and a direct comparison is not possible. Our defined damage grade destruction includes the total collapse of the entire building and, thus, a greater extent of damage than CP. The values for the damage grade extensive (HAZUS) and the performance level LS (FEMA) fit better to our own values of heavy than extreme.
For the comparison of the spectral displacements, it has to be considered that for buildings with a soft-storey effect, the deformation is concentrated in one storey and, therefore, the global displacement may be smaller than the displacement in the affected storey. If this is taken into account, the spectral displacement values of the investigated building are similar to thresholds in HAZUS, but HAZUS values are a little more conservative except for the highest damage grade.
In the next step, the resulting fragility functions are validated. An important point is that the fragility functions for the different damage grades do not intersect each other. Hence, the probability of exceeding a given damage state should be higher than the probability of exceeding the subsequent higher damage state. For our example calculation, this rule is fulfilled (cp. Figure 8). Comparisons to existing fragility functions, such as those in the SYNER-G report D3.1 for RC buildings [6] or in the Technical Report of the European Seismic Risk Model [4], show that our developed fragility functions are mostly located in the middle range, graphically as well as for the curve parameters. In Figure 9, a graphical comparison of our derived fragility functions (solid lines) to the functions developed by Rota et al. in 2008 [6] for the building class RC4 (reinforced concrete, no seismic design, ≥4 storeys) (dotted lines) and the building class CR-LFM-CDM-0-H4 of the ESRM20 [4] (dashed lines) is shown. The definition of the damage grades is not the same, but they are assigned in the best possible way. It is visible that for all damage grades for the same PGA, the probability of exceedance (PoE) of our derived functions is smaller than for the curves of Rota et al. Compared to the ESRM20 functions, our derived fragility functions are more conservative (higher PoE) for the first three damage grades, but not for the last two damage states for higher PGA. Additionally, due to the varying standard deviation, the shapes of the curves are different. The comparison shows that the existing fragility functions in the literature, in general, vary strongly. The differences can be explained due to the different analysis methodologies as well as damage thresholds. Moreover, the influence of the parameters described in Section 3.2 on the final curves has to be considered.

Figure 9.
Comparison of four derived fragility functions to existing fragility functions in [4,6].
It has to be taken into consideration that this specific example was chosen to present the determination of the damage grades with our own multiscale criteria approach. To develop fragility functions for general building classes, numerous simulations for varying material characteristics, reinforcement ratios and arrangements, cross-sectional dimensions as well as different directions are necessary. This explains why the standard deviation of the presented example is smaller than those of a similar building class of ESRM20 [4], which is based on a great number of analyses for many variations.
5. Conclusions and Outlook
This paper presents a new multiscale approach for earthquake damage criteria using non-linear static analysis of RC buildings. Material-specific as well as global criteria are essential for investigating the seismic behaviour at different scales, linking it to observed damages of previous earthquakes and detecting damages that are not evident in the pushover curve. The results of the pushover analysis—the overall distribution and the damage grade thresholds—are the basis for the development of fragility functions. In contrast to previous approaches, which are only based on drifts, the new approach includes various possible damage patterns in the damage grade limit values. Lognormally distributed fragility functions were developed by applying the Vulnerability Modellers Toolkit by Martins et al. [31]. The whole procedure is demonstrated for a four-storey RC frame building to show the application of the new approach. The results of four simulations are validated and verified in comparison to existing approaches (e.g., [4,6]). The comparisons for the displacement values and the final fragility curves show good agreement. The new approach applies to all classes of reinforced concrete buildings and can be adapted to specifications of different regions and construction types as well as material properties. This makes the approach universally valid and usable for further investigations.
For deriving general fragility curves for building classes, numerous simulations with varying material characteristics, reinforcement and dimensions are fundamental to represent the variability. In addition, regional characteristics have to be considered to represent the fragility correctly. Moreover, analysis methodology and previously presented modelling parameters have to be taken into account since they influence the resulting fragility functions.
In the future, detailed fragility functions for various building classes will be derived. With aid of these fragility functions, the assessment of buildings on the basis of average expected loss for a particular region and earthquakes will be possible. In addition, further investigations will be conducted for masonry buildings as well as the combination of RC and masonry. The resulting fragility functions will be part of the initial damage forecast that is developed in the research project LOKI [16].
Author Contributions
Conceptualization, J.K., L.S. and A.S.; methodology, J.K.; software, J.K.; validation, J.K. and A.S.; formal analysis, J.K. and A.S.; investigation, J.K.; data curation, J.K.; writing—original draft preparation, J.K.; writing—review and editing, J.K., L.S. and A.S.; visualization, J.K. and A.S.; supervision, L.S. and A.S.; project administration, J.K. and L.S.; funding acquisition, L.S. All authors have read and agreed to the published version of the manuscript.
Funding
This work was core funded by the Federal Ministry of Education and Research (BMBF), Germany, in the framework of the project LOKI (FKZ: 03G0890E). The financial support is greatly appreciated by the authors.
Institutional Review Board Statement
Not applicable.
Informed Consent Statement
Not applicable.
Data Availability Statement
The authors declare that all data supporting the findings of this study are within the article.
Acknowledgments
We acknowledge support by the KIT-Publication Fund of the Karlsruhe Institute of Technology.
Conflicts of Interest
The authors declare no conflict of interest.
References
- Anagnostopoulos, S.A.; Moretti, M. Post-earthquake emergency assessment of building damage, safety and usability—Part 1: Technical issues. Soil Dyn. Earthq. Eng. 2008, 28, 223–232. [Google Scholar] [CrossRef]
- Grünthal, G. European Macroseismic Scale 1998: EMS-98, 2nd ed.; Centre Europèen de Géodynamique et de Séismologie: Luxembourg, 1998; ISBN 2879770084. [Google Scholar]
- Baggio, C.; Bernadini, A.; Colozza, R.; Corazza, L.; della Bella, M.; Di Pasquale, G.; Dolce, M.; Goretti, A.; Martinelli, A.; Orsini, G.; et al. Field Manual for Post-Earthquake Damage and Safety Assessment and Short Term Countermeasures (AeDES). Available online: https://publications.jrc.ec.europa.eu/repository/bitstream/JRC37914/7914%20-%20EUR22868EN.pdf (accessed on 24 July 2022).
- Crowley, H.; Dabbeek, J.; Despotaki, V.; Rodrigues, D.; Martins, L.; Silva, V.; Romão, X.; Pereira, N.; Weatherill, G.; Danciu, L. European Seismic Risk Model (ESRM20): EFEHR Technical Report 002 V1.0.0; EUCENTRE Foundation: Pavia, Italy, 2021; pp. 1–84. [Google Scholar] [CrossRef]
- D’Ayala, D.; Meslem, A.; Vamvatsikos, D.; Porter, K.; Rossetto, T.; Silva, V. Guidelines for Analytical Vulnerability Assessment—Low/Mid-Rise Buildings: Vulnerability Global Component Project; GEM Foundation: Pavia, Italy, 2015. [Google Scholar] [CrossRef]
- SYNER-G. Systemic Seismic Vulnerability and Risk Analysis for Buildings, Lifeline Networks and Infrastructure Safety Gain: D3.1—Fragility Functions for Common RC Building Types in Europe. Available online: http://www.vce.at/SYNER-G/pdf/deliverables/D3.01_Syner-G_RC_final.pdf (accessed on 24 July 2022).
- Marques, M.; Amorin, E.; Martins, L.; Araújo, M.; Delgado, R. Study on the definition of analytical fragility functions for concrete buildings. In COMPDYN 2013: 4th ECCOMAS Thematic Conference on Computational Methods in Structural Dynamics and Earthquake Engineering, Kos Island, Greece, 12–14 June 2013; Papadrakakis, M., Ed.; Institute of Structural Analysis and Antiseismic Research, School of Civil Engineering Athens (NTUA): Athens, Greece, 2013; pp. 2532–2548. ISBN 978-960-99994-2-7. [Google Scholar]
- Carvalho, G.; Bento, R.; Bhatt, C. Nonlinear static and dynamic analyses of reinforced concrete buildings—Comparison of different modelling approaches. Earthq. Struct. 2013, 4, 451–470. [Google Scholar] [CrossRef]
- Martins, L. Earthquake Damage and Loss Assessment of Reinforced Concrete Buildings. Ph.D. Thesis, Faculty of Engineering of the University of Porto, Porto, Portugal, 2018. [Google Scholar]
- Martins, L.; Silva, V. Development of a fragility and vulnerability model for global seismic risk analyses. Bull. Earthq. Eng. 2021, 19, 6719–6745. [Google Scholar] [CrossRef]
- Lagomarsino, S.; Cattari, S. Seismic Performance of Historical Masonry Structures through Pushover and Nonlinear Dynamic Analyses. In Perspectives on European Earthquake Engineering and Seismology; Ansal, A., Ed.; Springer International Publishing: Cham, Switzerland, 2015; pp. 265–292. ISBN 978-3-319-16963-7. [Google Scholar]
- Simões, A.G.; Bento, R.; Lagomarsino, S.; Cattari, S.; Lourenço, P.B. Fragility Functions for Tall URM Buildings around Early 20th Century in Lisbon. Part 1: Methodology and Application at Building Level. Int. J. Archit. Herit. 2021, 15, 349–372. [Google Scholar] [CrossRef]
- Brzev, S.; Scawthorn, C.; Charleson, A.W.; Allen, L.; Greene, M.; Jaiswal, K.; Silva, V. GEM Building Taxonomy Version 2.0: GEM Technical Report 2013-02 V1.0.0. Available online: https://storage.globalquakemodel.org/resources/publications/technical-reports/gem-building-taxonomy-report/ (accessed on 24 July 2022).
- Silva, V.; Henshaw, P.; Huyck, C.; O’Hara, M. GED4ALL—Global Exposure Database for Multi-Hazard Risk Analysis: D5—Final Report, GEM Technical Report 2018-05. Available online: https://www.gfdrr.org/sites/default/files/publication/Exposure%20data%20schema_final%20report.pdf (accessed on 24 July 2022).
- Crowley, H.; Silva, V.; Martins, L.; Romão, X.; Pereira, N. Open Models and Software for Assessing the Vulnerability of the European Building Stock. In COMPDYN 2021: 8th ECCOMAS Thematic Conference on Computational Methods in Structural Dynamics and Earthquake Engineering, Athens, Greece, 28–30 June 2021; Institute of Structural Analysis and Antiseismic Research, School of Civil Engineering Athens (NTUA): Athens, Greece, 2021; pp. 2678–2688. [Google Scholar] [CrossRef]
- Kohns, J.; Zahs, V.; Ullah, T.; Schorlemmer, D.; Nievas, C.I.; Glock, K.; Meyer, F.; Mey, H.; Stempniewski, L.; Herfort, B.; et al. Innovative methods for earthquake damage detection and classification using airborne observation of critical infrastructures (project LOKI). In Proceedings of the European Geosciences Union General Assembly (EGU 2021), Online, 19–30 April 2021. [Google Scholar] [CrossRef]
- Kohns, J.; Stempniewski, L. Classification of earthquake-induced building damage using innovative methods. In IABSE Congress Ghent 2021: Structural Engineering for Future Societal Needs, Congress Proceedings; Snijder, H.H., De Pauw, B., van Alphen, S., Mengeot, P., Eds.; IABSE: Zurich, Switzerland, 2021; pp. 1366–1374. ISBN 978-3-85748-176-5. [Google Scholar]
- EN 1998-1:2004; Eurocode 8: Design of Structures for Earthquake Resistance—Part 1: General Rules, Seismic Actions and Rules for Buildings: English Version. European Committee for Standardisation: Brussels, Belgium, 2004.
- Lang, K. Seismic Vulnerability of Existing Buildings. 2002. Available online: https://doi.org/10.3929/ETHZ-A-004333389 (accessed on 24 July 2022).
- Federal Emergency Management Agency. HAZUS Earthquake Model Technical Manual: Hazus 4.2 SP3. Available online: https://www.fema.gov/sites/default/files/2020-10/fema_hazus_earthquake_technical_manual_4-2.pdf (accessed on 24 July 2022).
- Federal Emergency Management Agency. Prestandard and Commentary for the Seismic Rehabilitation of Buildings; FEMA 356: Washington, DC, USA, 2000. [Google Scholar]
- EN 1992-1-1:2004; Eurocode 2: Design of Concrete Structures—Part 1-1: General Rules and Rules for Buildings: English Version. European Committee for Standardisation: Brussels, Belgium, 2004.
- Paulay, T.; Priestley, M.J.N. Seismic Design of Reinforced Concrete and Masonry Buildings; John Wiley and Sons: New York, NY, USA, 1992; ISBN 0-471-54915-0. [Google Scholar]
- Biskinis, D.; Fardis, M.N. Deformations of Concrete Members at Yielding and Ultimate under Monotonic or Cyclic Loading (Including Repaired and Retrofitted Members); Report No. SEE 2009-01; Department of Civil Engineering, University of Patras: Patras, Greece, 2009. [Google Scholar]
- EN 1998-3:2005; Eurocode 8: Design of Structures for Earthquake Resistance—Part 3: Assessment and Retrofitting of Buildings: English Version. European Committee for Standardisation: Brussels, Belgium, 2005.
- Romão, X.; Delgado, R.; Costa, A. Probabilistic Performance Analysis of Existing Buildings under Earthquake Loading. J. Earthq. Eng. 2014, 18, 1241–1265. [Google Scholar] [CrossRef]
- Chopra, A.K. Dynamics of Structures: Theory and Applications to Earthquake Engineering, 4th ed.; Prentice Hall: Upper Saddle River, NJ, USA, 2012; ISBN 13: 978-0-13-285803-8. [Google Scholar]
- Freeman, S.A. The Capacity Spectrum Method as a Tool for Seismic Design. In Proceedings of the 11th European Conference on Earthquake Engineering, Paris, France, 6–11 September 1998. [Google Scholar]
- Fajfar, P. Capacity spectrum method based on inelastic demand spectra. Earthq. Eng. Struct. Dyn. 1999, 28, 979–993. [Google Scholar] [CrossRef]
- Calvi, G.M. A displacement-based approach for vulnerability evaluation of classes of buildings. J. Earthq. Eng. 1999, 3, 411–438. [Google Scholar] [CrossRef]
- Martins, L.; Silva, V.; Crowley, H.; Cavalieri, F. Vulnerability modellers toolkit, an open-source platform for vulnerability analysis. Bull. Earthq. Eng. 2021, 19, 5691–5709. [Google Scholar] [CrossRef]
- Rossetto, T.; Ioannou, I.; Grant, D.N. Existing Empirical Fragility and Vulnerability Functions: Compendium and Guide for Selection; GEM Technical Report 2015-1; GEM Foundation: Pavia, Italy, 2015. [Google Scholar] [CrossRef]
- Norda, H. Beitrag zum Statischen Nichtlinearen Erdbebennachweis von Unbewehrten Mauerwerksbauten unter Berücksichtigung einer und Höherer Modalformen. Ph.D. Thesis, Fakultät für Bauingenieur- und Vermessungswesen, Lehrstuhl für Baustatik und Baudynamik, Aachen, Germany, 2013. [Google Scholar]
- Jalayer, F.; Risi, R.D.; Manfredi, G. Bayesian Cloud Analysis: Efficient structural fragility assessment using linear regression. Bull. Earthq. Eng. 2015, 13, 1183–1203. [Google Scholar] [CrossRef]
- Seismosoft. SeismoStruct 2022—A Computer Program for Static and Dynamic Nonlinear Analysis of Framed Structures. Available online: https://seismosoft.com/ (accessed on 24 July 2022).
- Dlubal. RSTAB 8; Dlubal Software GmbH 2016: Tiefenbach, Germany, 2022. [Google Scholar]
- Mander, J.B.; Priestley, M.J.N.; Park, R. Theoretical Stress-Strain Model for Confined Concrete. J. Struct. Eng. 1988, 114, 1804–1826. [Google Scholar] [CrossRef]
- Luzi, L.; Puglia, R.; Russo, E.; ORFEUS Working Group 5. Engineering Strong Motion Database (ESM); Version 1.0; Istituto Nazionale di Geofisica e Vulcanologia, Observatories & Research Facilities for European Seismology: Rome, Italy, 2015. [Google Scholar] [CrossRef]
Publisher’s Note: MDPI stays neutral with regard to jurisdictional claims in published maps and institutional affiliations. |
© 2022 by the authors. Licensee MDPI, Basel, Switzerland. This article is an open access article distributed under the terms and conditions of the Creative Commons Attribution (CC BY) license (https://creativecommons.org/licenses/by/4.0/).