
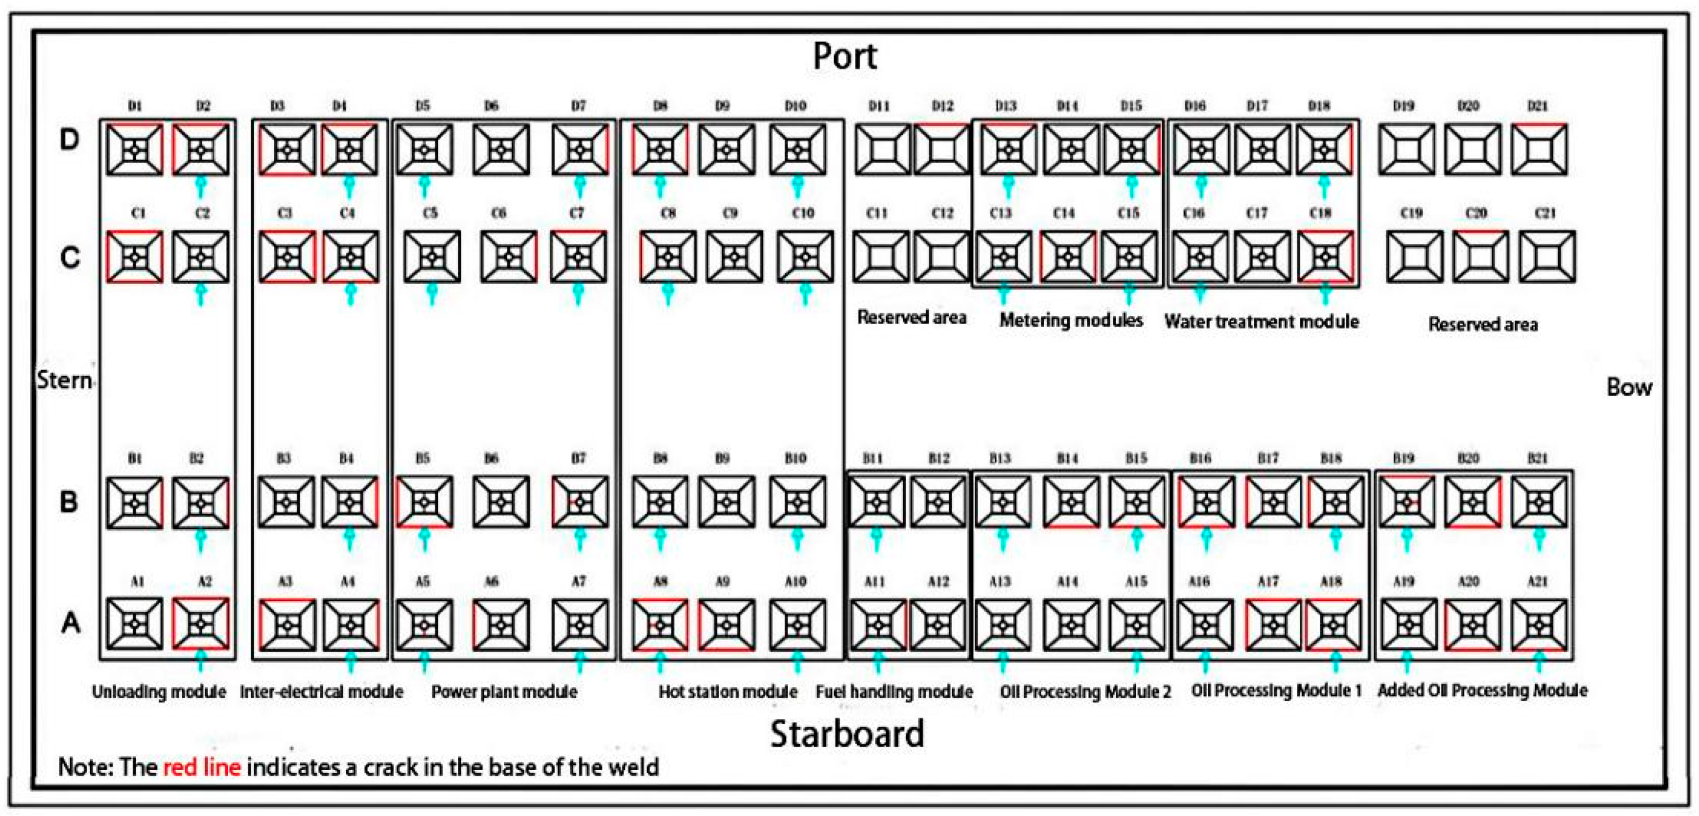
Image-Based Crack Detection Method for FPSO Module Support


Abstract
:1. Introduction
2. Related Work
3. Methods
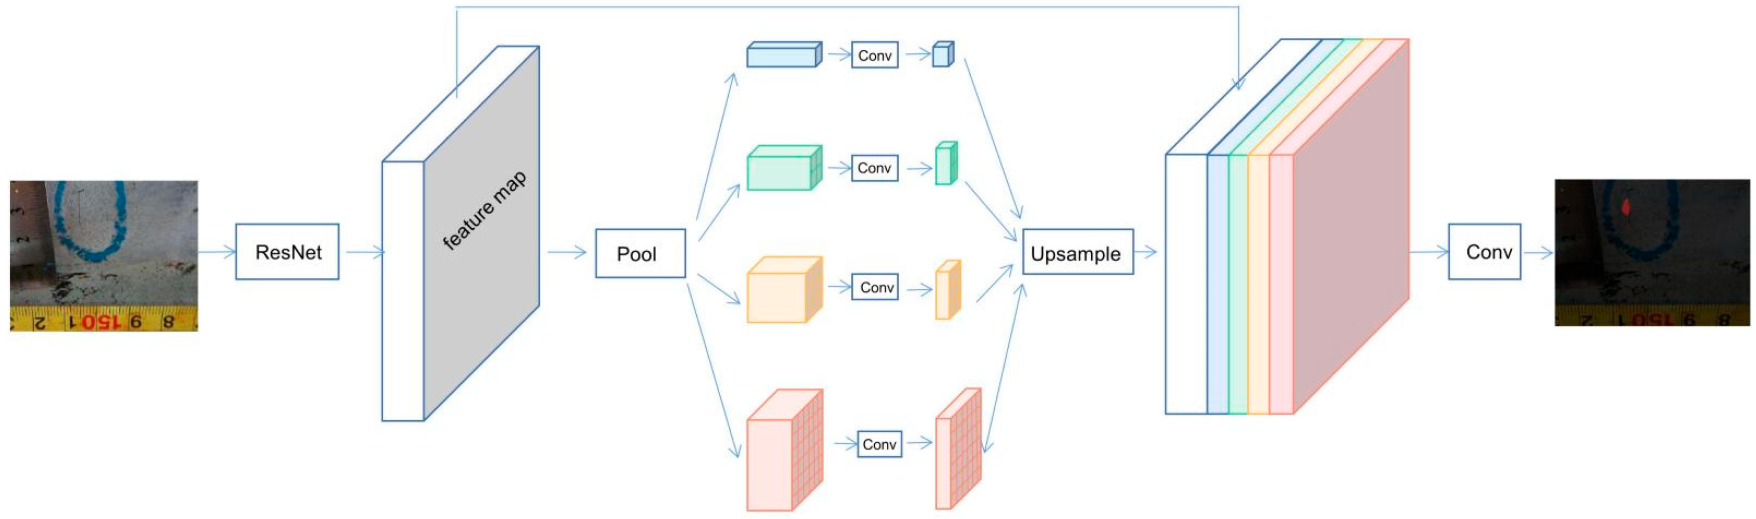
3.1. Baseline PSPNet Model
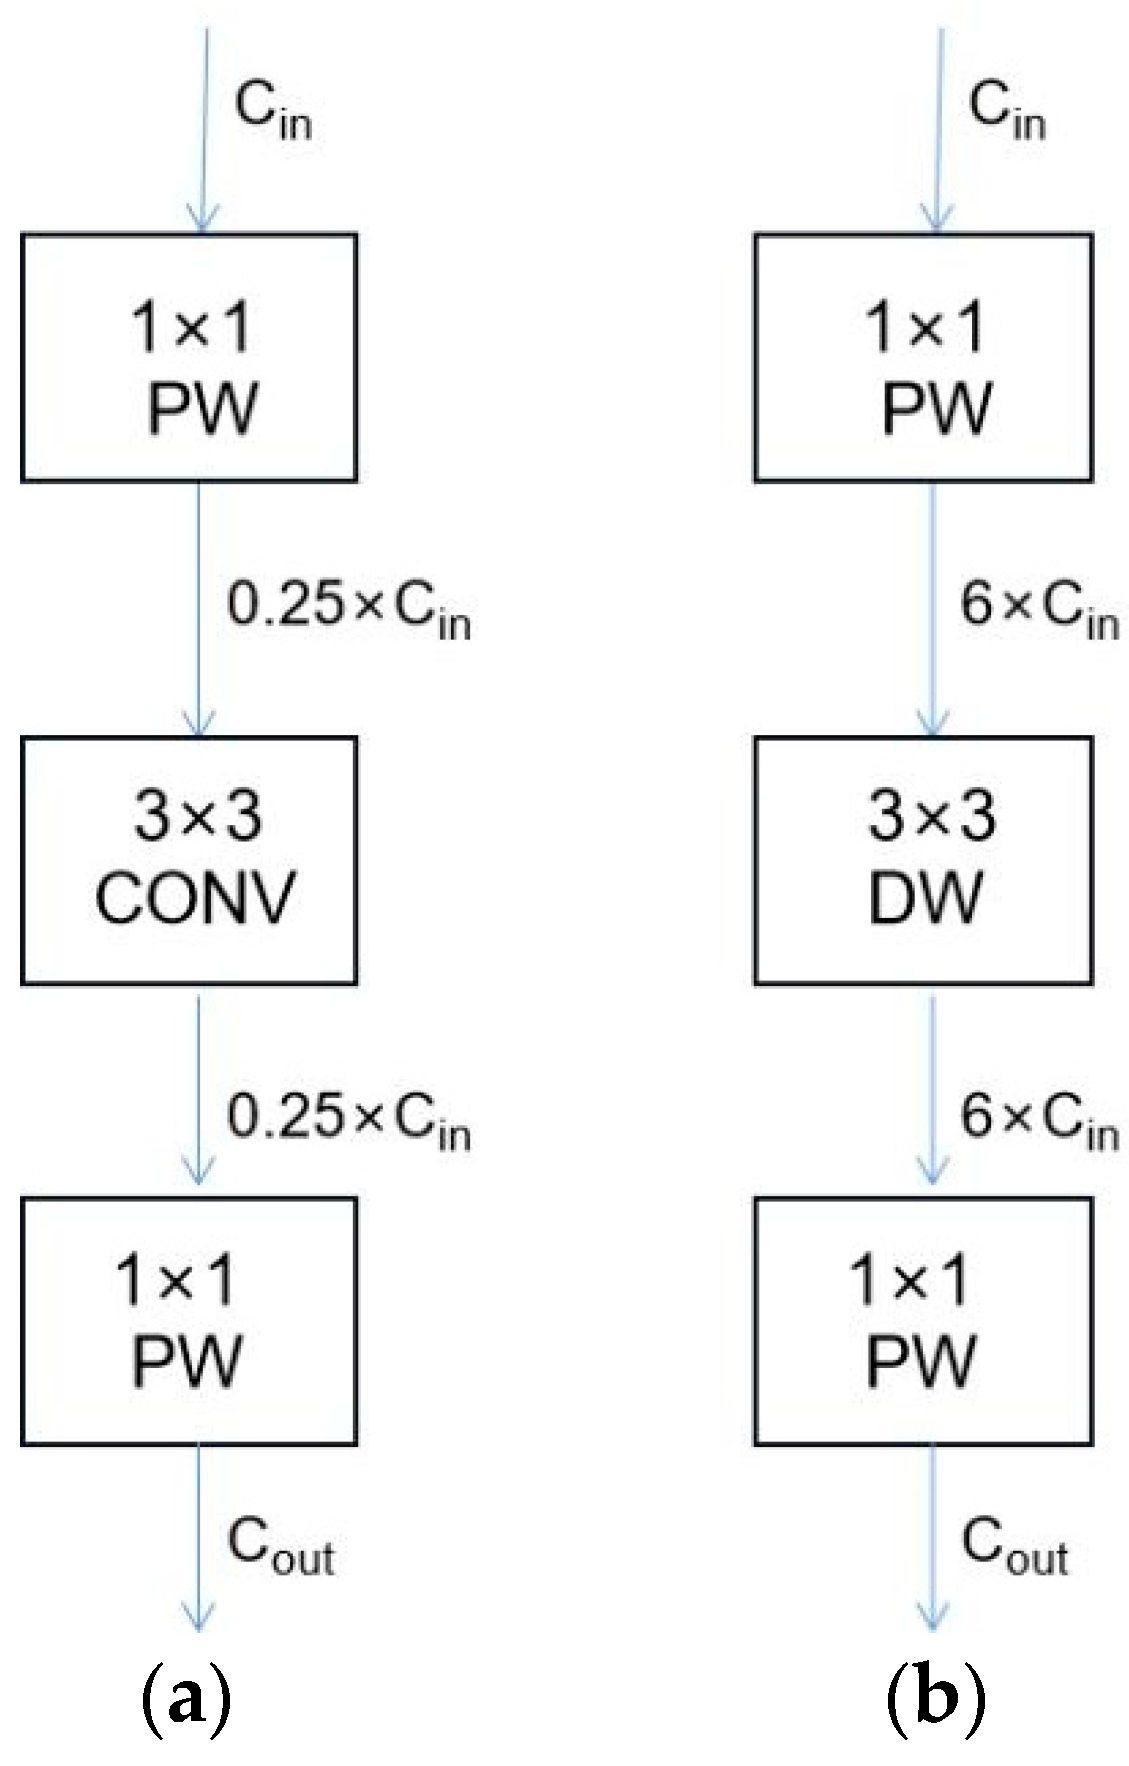
3.2. Comparison of MobileNet and ResNet Structures
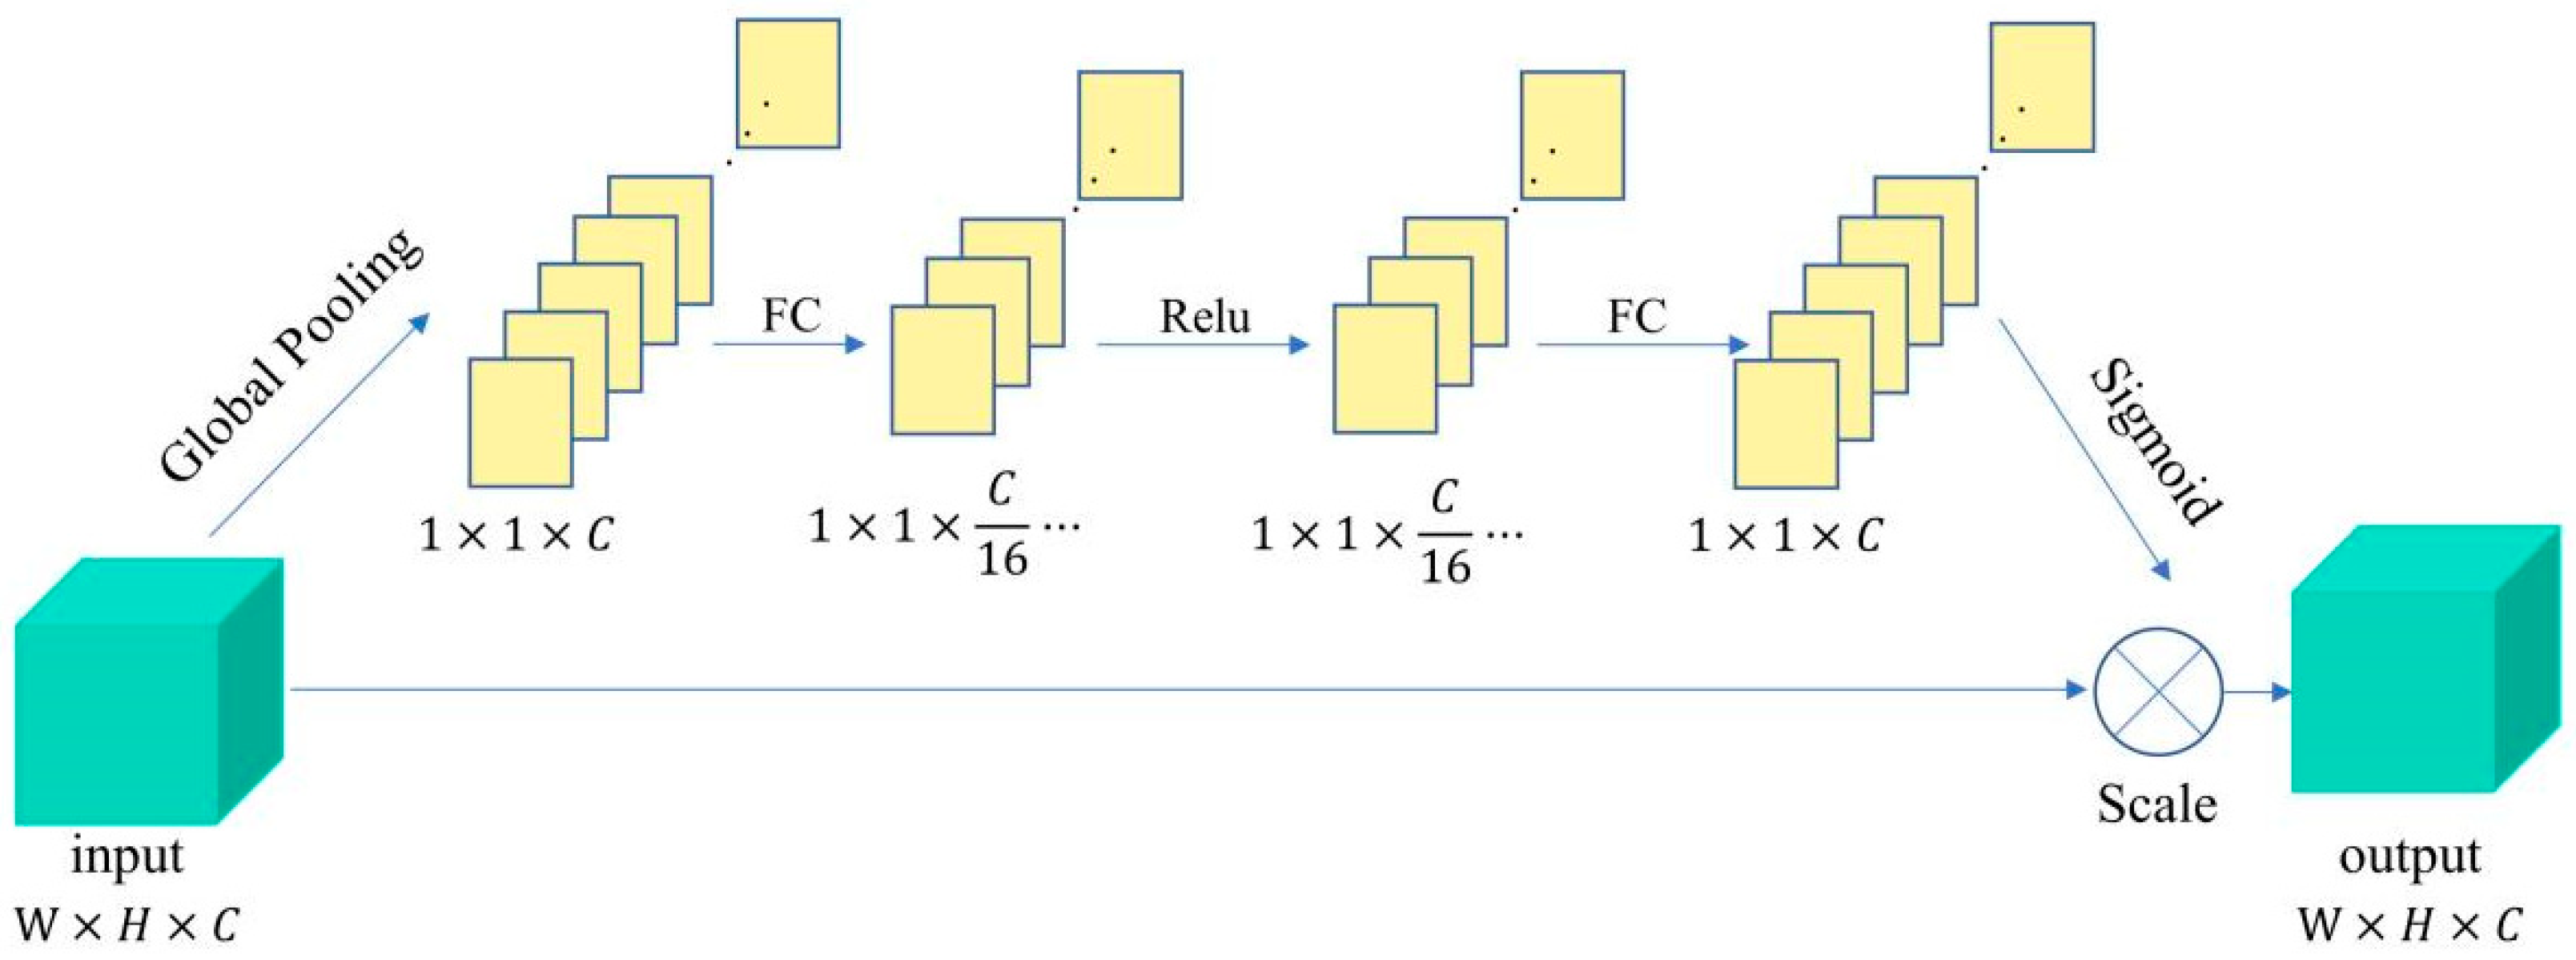
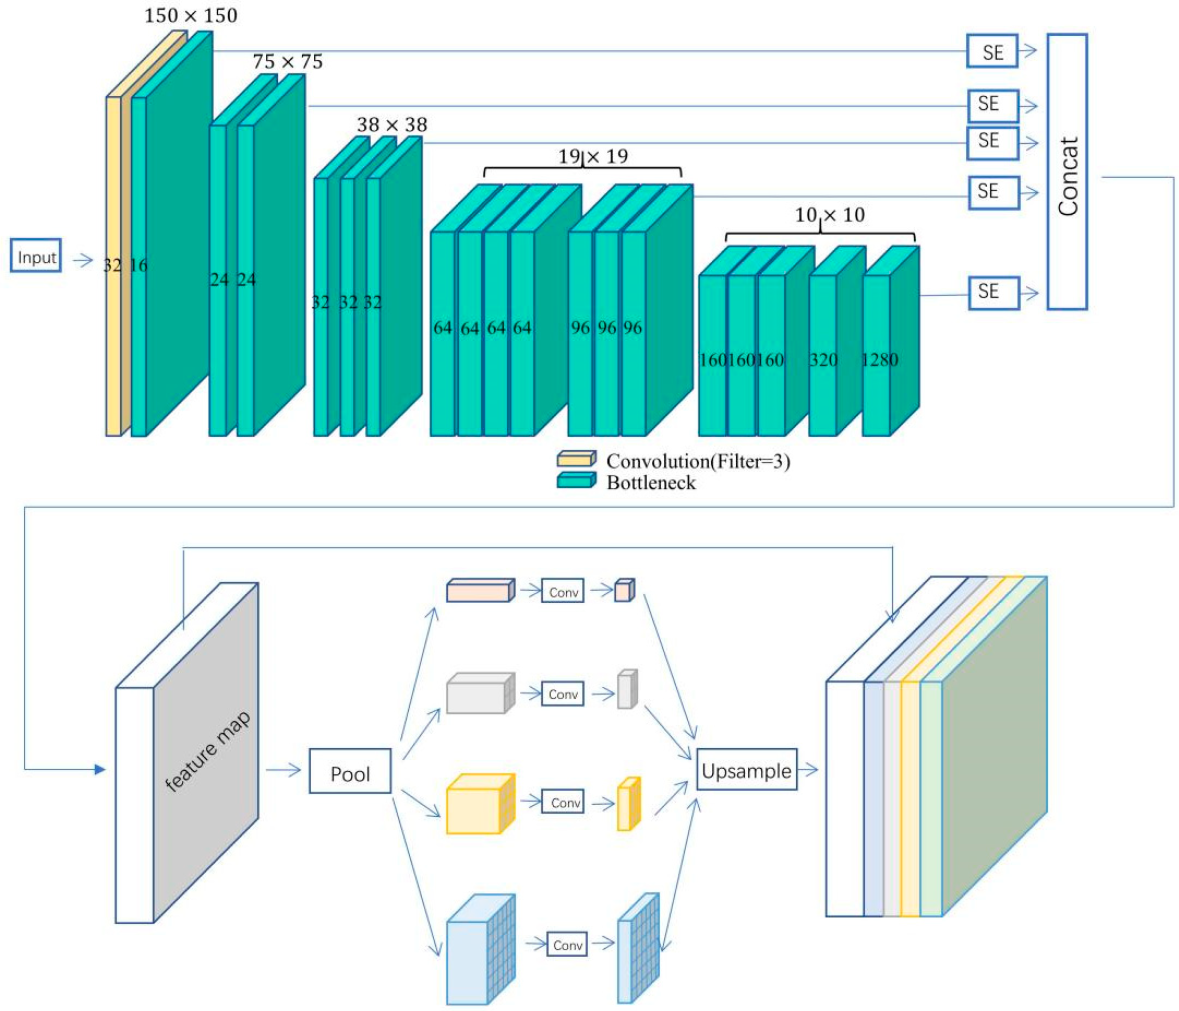
3.3. Improved PSPNet Model
4. Data Preparation
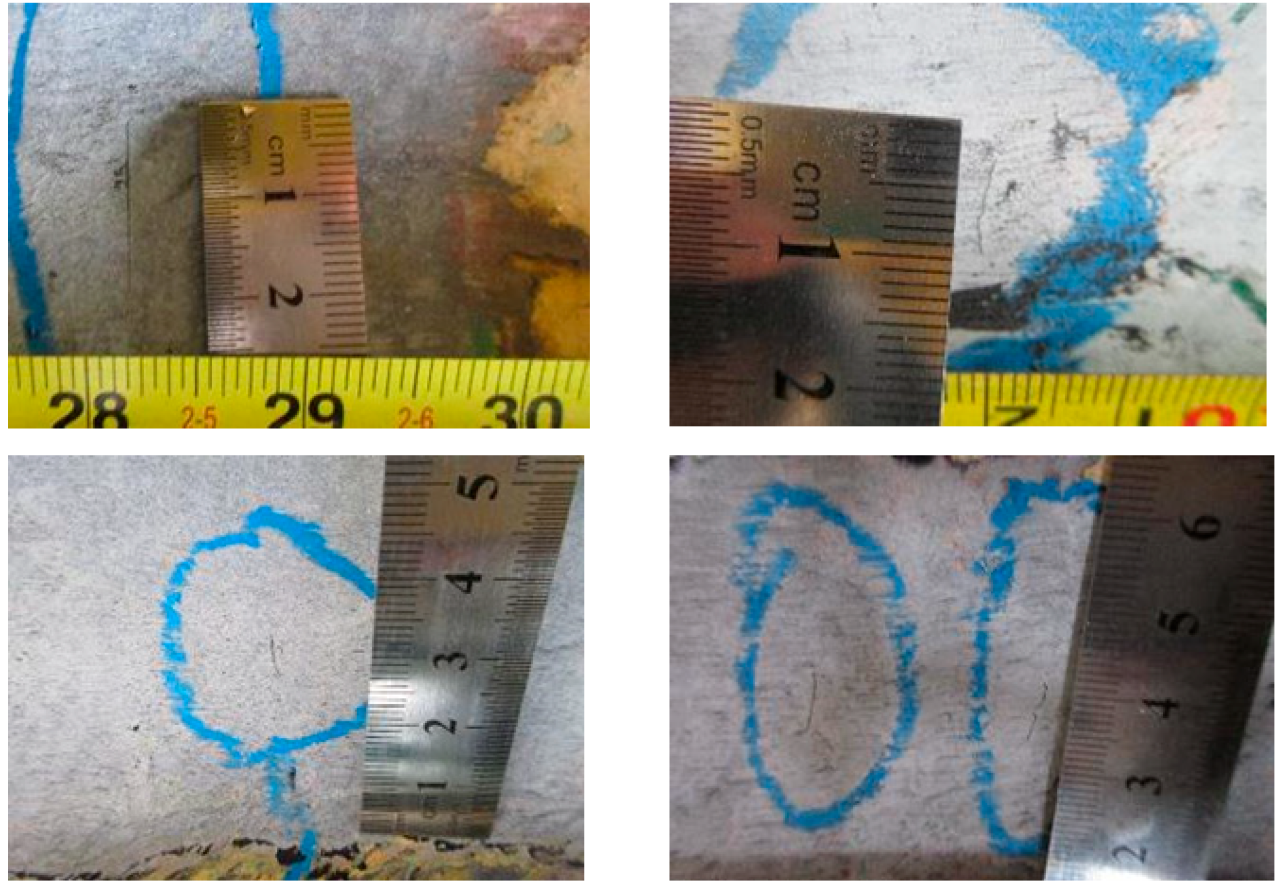
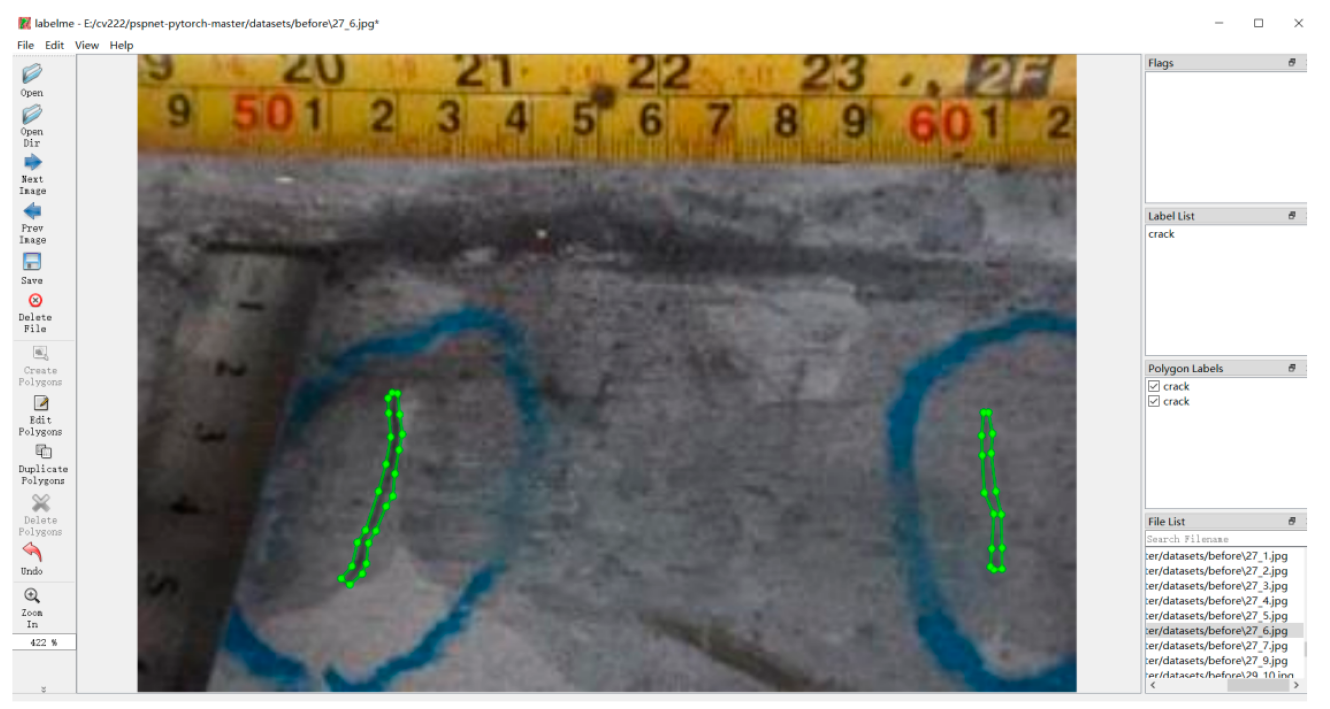
4.1. Datasets Build
4.2. Data Enhancement
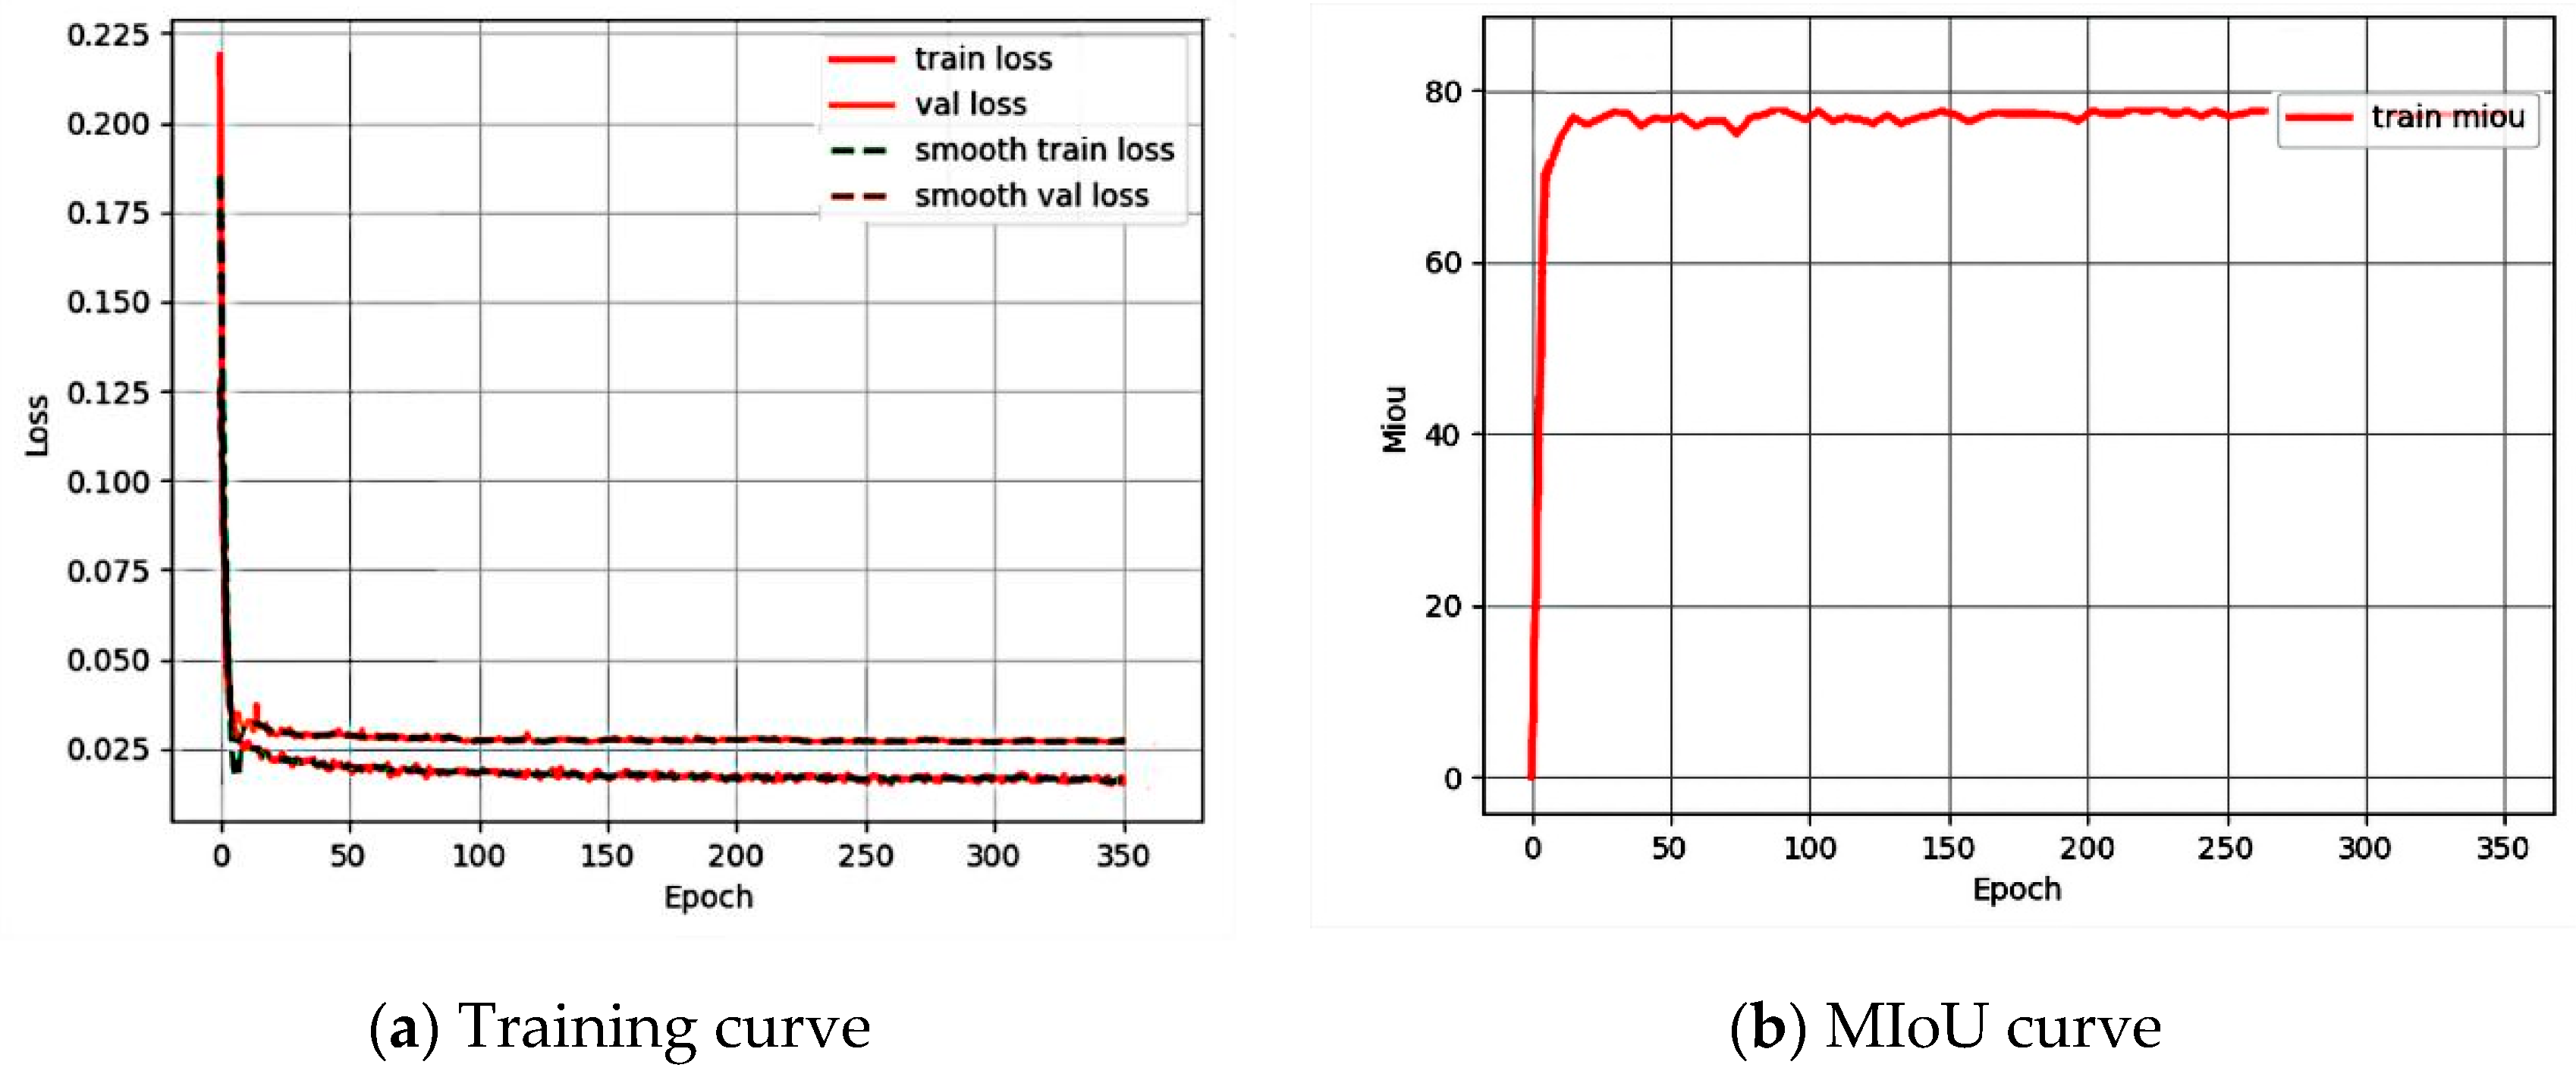
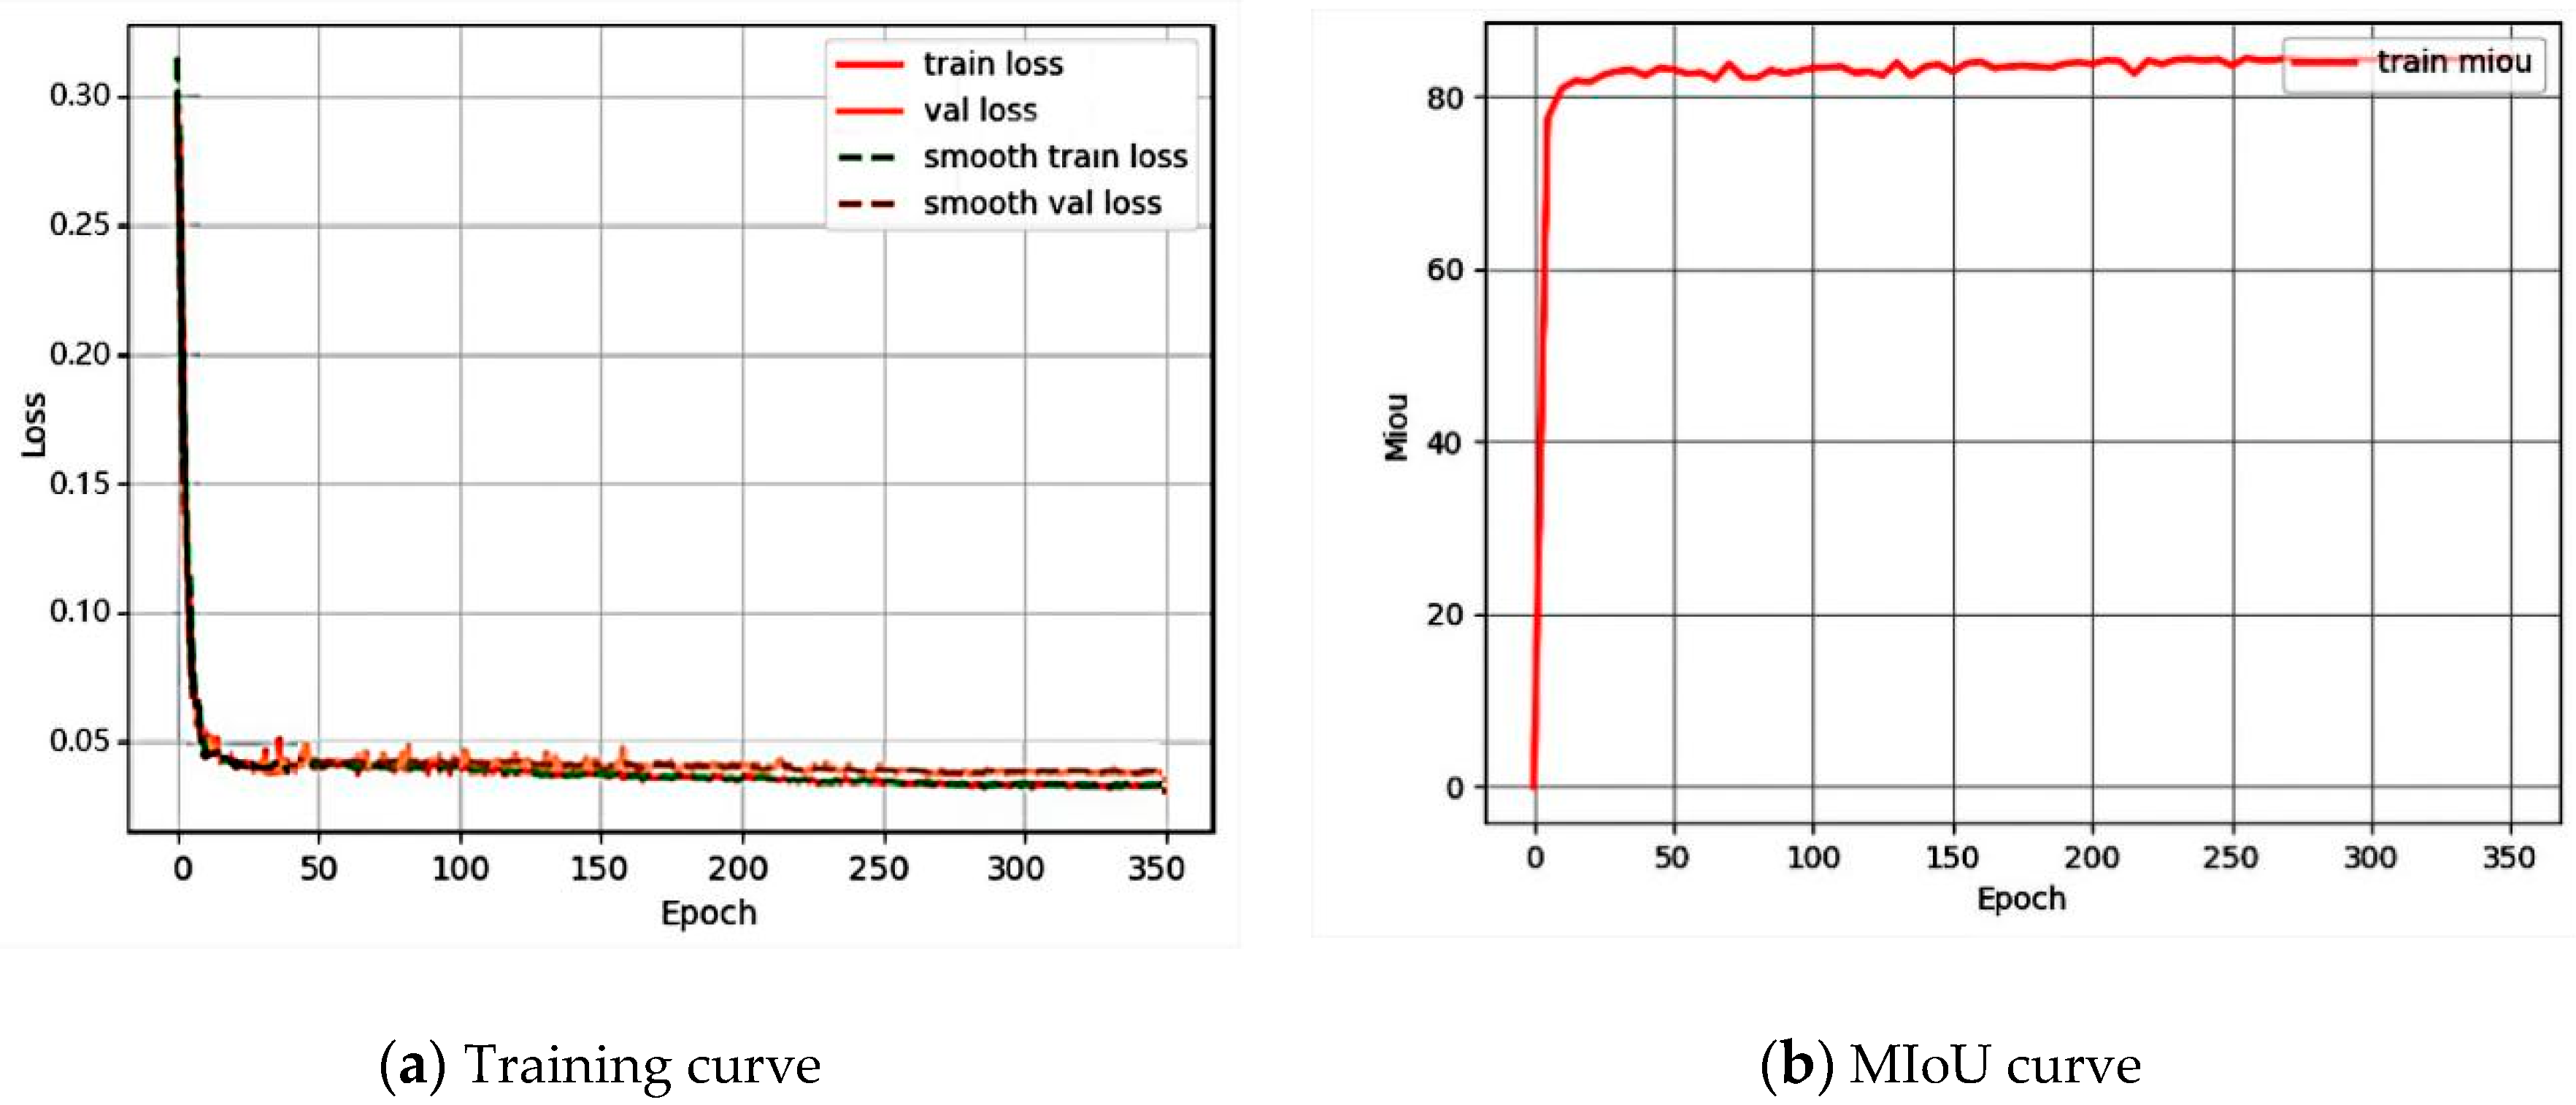
5. Training
5.1. Loss Function
5.2. Metrics
5.3. Experimental Conditions
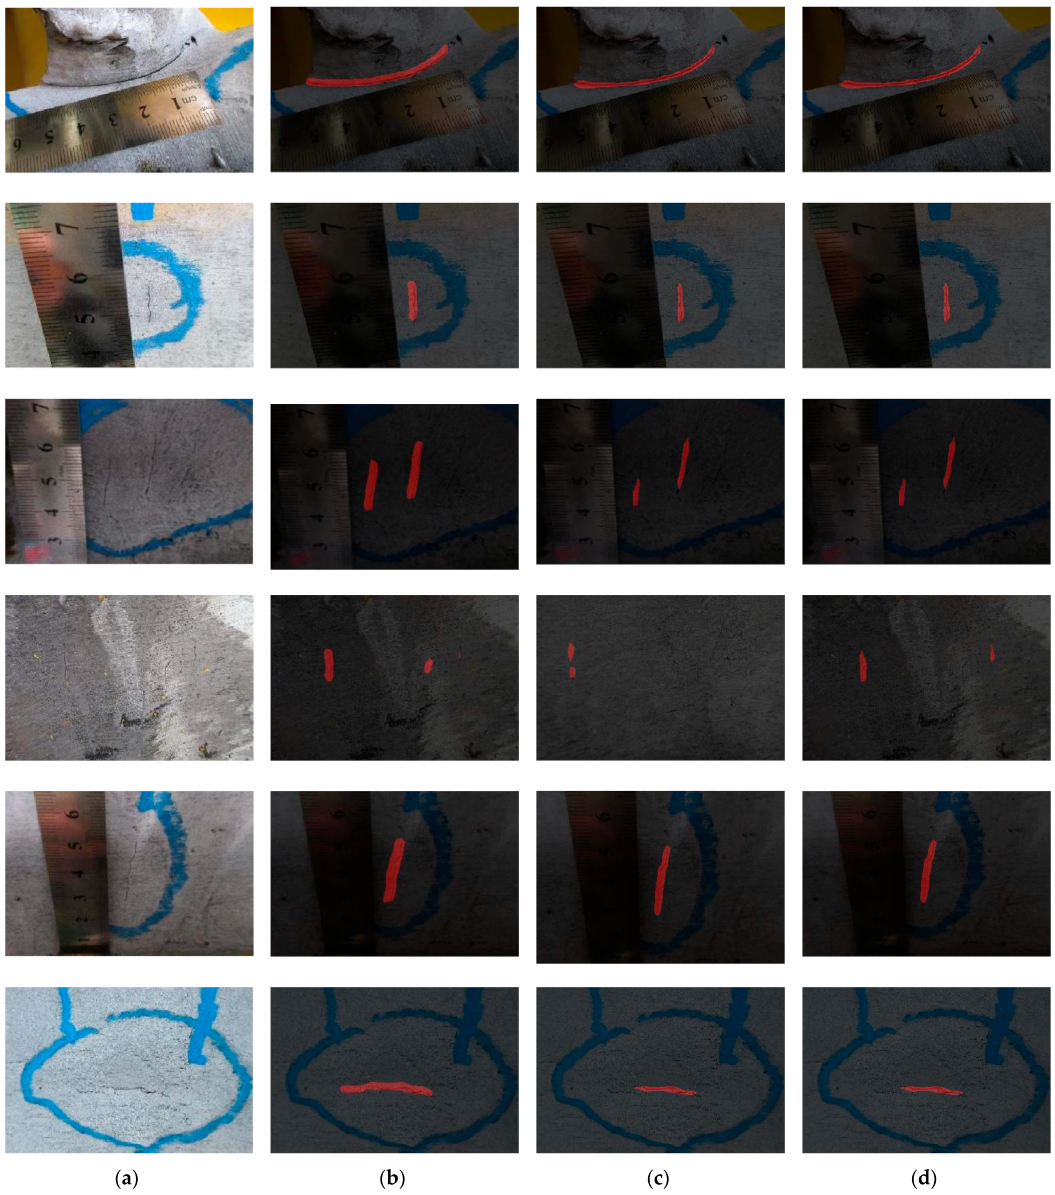
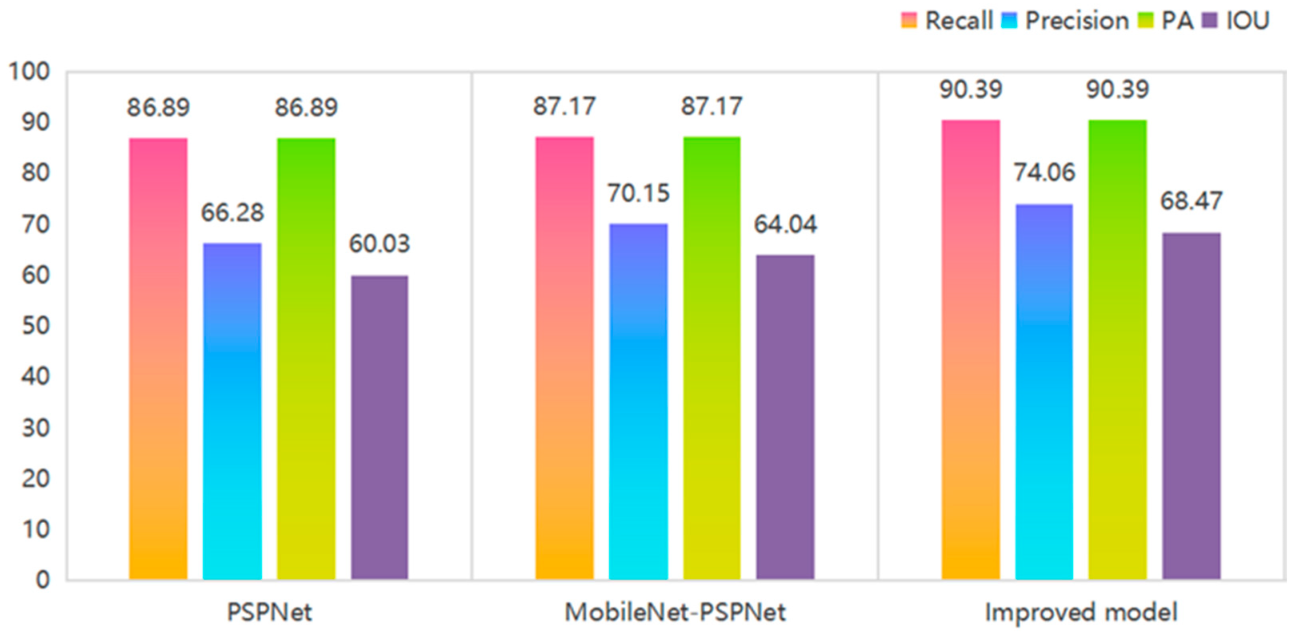
6. Experimental Results and Analysis
7. Conclusions
Author Contributions
Funding
Institutional Review Board Statement
Informed Consent Statement
Data Availability Statement
Conflicts of Interest
References
- Yuan, G. Research on Fatigue Characteristics and Antifatigue Design of FPSO Topside Module; Tianjin University: Tianjin, China, 2018. [Google Scholar] [CrossRef]
- Ye, X.-W.; Jin, T.; Chen, P.-Y. Structural crack detection using deep learning–based fully convolutional networks. Adv. Struct. Eng. 2019, 22, 3412–3419. [Google Scholar] [CrossRef]
- Cheng, H.D.; Shi, X.J.; Glazier, C. Real-time image thresholding based on sample space reduction and interpolation approach. J.Comput. Civ. Eng. 2003, 17, 264–272. [Google Scholar] [CrossRef]
- Qiang, S.; Guoying, L.; Jingqi, M.; Hongmei, Z. An Edge-Detection Method Based on Adaptive Canny Algorithm and Iterative Segmentation Threshold. In Proceedings of the 2nd International Conference on Control Science and Systems Engineering (ICCSSE), Singapore, 27–29 July 2016. [Google Scholar]
- Krizhevsky, A.; Sutskever, I.; Hinton, G.E. ImageNet classification with deep convolutional neural networks. In Proceedings of the 25th International Conference on Neural Information Processing Systems, Lake Tahoe, NV, USA; 2012; Volume 1, pp. 1097–1105. [Google Scholar]
- Farooq, M.; Zheng, H.; Nagabhushana, A.; Roy, S.; Burkett, S.; Barkey, M.; Kotru, S.; Sazonov, E. Damage Detection and Identification in Smart Structures using SVM and ANN. In Proceedings of the Conference on Smart Sensor Phenomena, Technology, Networks, and Systems Integration, San Diego, CA, USA, 12–14 March 2012. [Google Scholar]
- Girshick, R.; Donahue, J.; Darrell, T.; Malik, J. Rich Feature Hierarchies for Accurate Object Detection and Semantic Segmentation. In Proceedings of the 2014 IEEE Conference on Computer Vision and Pattern Recognition, Columbus, OH, USA, 23–28 June 2014; pp. 580–587. [Google Scholar]
- Cui, X.; Wang, Q.; Dai, J.; Xue, Y.; Duan, Y. Intelligent crack detection based on attention mechanism in convolution neural network. Adv. Struct. Eng. 2021, 24, 1859–1868. [Google Scholar] [CrossRef]
- Simonyan, K.; Zisserman, A. Very deep convolutional networks for large-scale image recognition. In Proceedings of the 3rd International Conference on Learning Representations, ICLR 2015 Conference Track Proceedings (Vienna: ICLR), San Diego, CA, USA, 7–9 May 2015. [Google Scholar]
- Joseph, R.; Santosh, D.; Ross, G.; Ali, F. Learning Deep Features for Discriminative Localization. In Proceedings of the IEEE Computer Society Conference on Computer Vision and Pattern Recognition, Las Vegas, NV, USA, 27–30 December 2016; pp. 779–788. [Google Scholar]
- He, K.; Zhang, X.; Ren, S.; Sun, J. Deep residual learning for image recognition. In Proceedings of the IEEE Computer Society Conference on Computer Vision and Pattern Recognition, Las Vegas, NV, USA, 27–30 June 2016; IEEE: Las Vegas, NV, USA, 2016. [Google Scholar] [CrossRef] [Green Version]
- Huang, G.; Liu, Z.; Van Der Maaten, L.; Weinberger, K.Q. Densely connected convolutional networks. In Proceedings of the 30th IEEE Conference on Computer Vision and Pattern Recognition, CVPR, Honolulu, HI, USA, 22–25 July 2017; IEEE: Honolulu, HI, USA, 2017. [Google Scholar] [CrossRef] [Green Version]
- Vaswani, A.; Shazeer, N.; Parmar, N.; Uszkoreit, J.; Jones, L.; Gomez, A.N. Attention Is All You Need. arXiv 2017. [Google Scholar] [CrossRef]
- Chorowski, J.; Bahdanau, D.; Serdyuk, D. Attention-based models for speech recognition. In Proceedings of the 28th International Conference on Neural Information Processing Systems, Montreal, QB, Canada, 7–12 December 2015; Volume 1, pp. 577–585. [Google Scholar]
- Hamishebahar, Y.; Guan, H.; So, S.; Jo, J. A Comprehensive Review of Deep Learning-Based Crack Detection Approaches. Appl. Sci. 2022, 12, 1374. [Google Scholar] [CrossRef]
- Zheng, X.; Zhang, S.; Li, X.; Li, G.; Li, X. Lightweight Bridge Crack Detection Method Based on SegNet and Bottleneck Depth-Separable Convolution With Residuals. IEEE Access 2021, 9, 161649–161668. [Google Scholar] [CrossRef]
- Kang, D.H.; Cha, Y.-J. Efficient Attention-Based Deep Encoder and Decoder for Automatic Crack Segmentation. Struct. Health Monit. 2021. [Google Scholar] [CrossRef]
- Li, Y.; Zhao, W.; Zhang, X.; Zhou, Q. A Two-Stage Crack Detection Method for Concrete Bridges Using Convolutional Neural Networks. IEICE Trans. Inf. Syst. 2018, 101, 3249–3252. [Google Scholar] [CrossRef] [Green Version]
- Yang, Q.N.; Ji, X.D. Automatic Pixel-Level Crack Detection for Civil Infrastructure Using Unet plus and Deep Transfer Learning. IEEE Sens. J. 2021, 21, 19165–19175. [Google Scholar] [CrossRef]
- Fan, Z.; Lin, H.; Li, C.; Su, J.; Bruno, S.; Loprencipe, G. Use of Parallel ResNet for High-Performance Pavement Crack Detection and Measurement. Sustainability 2022, 14, 1825. [Google Scholar] [CrossRef]
- Chen, Y.-L.; Chiang, Y.; Chiu, P.-H.; Huang, I.-C.; Xiao, Y.-B.; Chang, S.-W.; Huang, C.-W. High-Dimensional Phase Space Reconstruction with a Convolutional Neural Network for Structural Health Monitoring. Sensors 2021, 21, 3514. [Google Scholar] [CrossRef] [PubMed]
- Pathak, N. Bridge Health Monitoring Using CNN. In Proceedings of the 2020 International Conference on Convergence to Digital World—Quo Vadis (ICCDW), Mumbai, India, 18–20 February 2020; pp. 1–4. [Google Scholar] [CrossRef]
- Yinghao, Z.; Zeyu, W. Subset Simulation with Adaptable Intermediate Failure Probability for Robust Reliability Analysis: An Unsupervised Learning-Based Approach. Struct. Multidiscip. Optim. 2022, 65, 1–22. [Google Scholar]
- Zou, Y.; Zhao, L.; Qin, S.; Pan, M.; Li, Z. Ship target detection and identification based on SSD_MobilenetV2. In Proceedings of the 2020 IEEE 5th Information Technology and Mechatronics Engineering Conference, Chongqing, China, 12–14 June 2020. [Google Scholar]
- Shore, J.; Johnson, R. Axiomatic derivation of the principle of maximum entropy and the principle of minimum cross-entropy. Inf. Theory IEEE Trans. 1980, 26, 26–37. [Google Scholar] [CrossRef] [Green Version]
- Wei, H.; Peng, P. The segmentation of retinal layer and fluid in SD-OCT images using mutex dice loss based fully convolutional networks. IEEE Access 2020, 8, 60929–60939. [Google Scholar] [CrossRef]
- Kingma, D.P.; Ba, J. Adam: A method for stochastic optimization. 2014. Available online: https://arxiv.org/abs/1412.6980 (accessed on 12 May 2022).


| Category | Predicted | ||
|---|---|---|---|
| Positive | Negative | ||
| Real | Positive | TP | FN |
| Negative | FP | TN | |
| Memory | 32 GB |
| GPU | GeForce RTX 2080 Ti |
| OS | Ubuntu 18.04 |
| Python | 3.6.8 |
| CUDA | 10.1 |
| Pytorch | 1.7.1 |
| Model | Recall | Precision | PA | IOU | |
|---|---|---|---|---|---|
| PSPNet | Background | 97.85 | 99.03 | 97.85 | 97.47 |
| crack | 86.89 | 66.28 | 86.89 | 60.03 | |
| MobileNet-PSPNet | Background | 98.19 | 98.83 | 98.19 | 97.91 |
| crack | 87.17 | 70.15 | 87.17 | 64.04 | |
| Improved model | Background | 98.58 | 99.52 | 98.58 | 98.29 |
| crack | 90.39 | 74.06 | 90.39 | 68.47 |
| Model | MioU | mPA | Accuracy |
|---|---|---|---|
| FCN | 62.64 | 78.51 | 89.75 |
| SegNet | 71.94 | 83.67 | 93.32 |
| DeepLabv3 | 79.11 | 91.08 | 97.96 |
| Unet | 75.29 | 88.21 | 86.14 |
| PSPNet | 78.75 | 92.37 | 97.87 |
| MobileNet-PSPNet | 80.98 | 92.68 | 98.01 |
| Improved model | 83.38 | 94.49 | 98.74 |
| Model | No. of Parameters |
|---|---|
| PSPNet | 46,706,626 |
| MobileNet-PSPNet | 2,375,874 |
| Improved model | 2,388,058 |
Publisher’s Note: MDPI stays neutral with regard to jurisdictional claims in published maps and institutional affiliations. |
© 2022 by the authors. Licensee MDPI, Basel, Switzerland. This article is an open access article distributed under the terms and conditions of the Creative Commons Attribution (CC BY) license (https://creativecommons.org/licenses/by/4.0/).
Share and Cite
Su, X.; Jia, Z.; Ma, G.; Qu, C.; Dai, T.; Ren, L. Image-Based Crack Detection Method for FPSO Module Support. Buildings 2022, 12, 1147. https://doi.org/10.3390/buildings12081147
Su X, Jia Z, Ma G, Qu C, Dai T, Ren L. Image-Based Crack Detection Method for FPSO Module Support. Buildings. 2022; 12(8):1147. https://doi.org/10.3390/buildings12081147
Chicago/Turabian StyleSu, Xin, Ziguang Jia, Guangda Ma, Chunxu Qu, Tongtong Dai, and Liang Ren. 2022. "Image-Based Crack Detection Method for FPSO Module Support" Buildings 12, no. 8: 1147. https://doi.org/10.3390/buildings12081147
APA StyleSu, X., Jia, Z., Ma, G., Qu, C., Dai, T., & Ren, L. (2022). Image-Based Crack Detection Method for FPSO Module Support. Buildings, 12(8), 1147. https://doi.org/10.3390/buildings12081147