Article

Evaluation of Axial Compression Slenderness Limits of High and Ultra-High-Strength Steel Circular Hollow Sections

1
Civil Engineering Department, Faculty of Engineering Mataria, Helwan University, Cairo 11718, Egypt
2
Structural Engineering and Construction Management Department, Future University in Egypt, New Cairo 11835, Egypt
*
Author to whom correspondence should be addressed.
Buildings 2022, 12(8), 1093; https://doi.org/10.3390/buildings12081093
Submission received: 11 May 2022 / Revised: 28 June 2022 / Accepted: 30 June 2022 / Published: 26 July 2022
(This article belongs to the Section Building Structures)

Abstract

:
Despite significant advances in metallurgy and the potential to create high and ultra-high-strength steel, all international specifications for steel design provide little information about the limits of slenderness for high-strength steel sections (HSSs) and don’t provide anything about the design of ultra-high-strength steel sections (UHSSs). The current international steel codes such as AISC 360-16 and EC3 can be applied only to steel grades up to S690 and S460, respectively, according to their limitations. These approaches for normal-strength steel are used for HSSs and UHSSs without extensive studies to determine their accuracy in these cases. Therefore, it is one of the main objectives of this study. The behavior of high and ultra-high-strength steel circular hollow sections under axial compression load is studied in this research. Sixteen nonlinear finite element (FE) models were generated to replicate stub column tests that were experimentally tested by others in previous research. Hence, a parametric study was conducted using forty FE models developed to investigate the local buckling behavior under various slenderness ratios comprehensively. The developed models covered slenderness ratios ranging from 20 to 1226 and steel grades S460 and S1100 with yield stress equal to 460 MPa and 1152 MPa, respectively. The FE results were combined with 105 previously collected experimental results to assess the applicability of existing codified design methodologies in the Euro code and the North American codes of cold-formed circular hollow sections (CHSs). Based on the results of this study, new cross-section slenderness limits and new design equations for more efficient simple designs were presented for circular hollow sections of HSSs and UHSSs and compared with the results of experimental tests and FE models.

1. Introduction

Since the early 1800s, circular hollow sections (CHSs) have been used in construction as columns, beams, tension members, and truss elements [1]. They have gained designers’ preference due to their appealing aesthetics and advantages over open sections. Furthermore, the CHS profiles have stronger torsional resistance, biaxial bending resistance, reduced wind load drag, the capability to be filled with concrete to produce composite sections, and lower maintenance costs due to fewer exterior regions being exposed to corrosive conditions [1]. Because thin-walled structural components make up the majority of CHS, local buckling—whether it occurs before or after material yielding—becomes a critical design factor.
Current design regulations include cross-section categorization, which classifies circular hollow sections (CHSs) into distinct categories depending on their local buckling sensitivity. The European Committee for Standardization (EN 1993-1-1) [2] and the British Standards Institution (BS 5950-1) [3] evaluate four cross-section classes for structural steelwork, BS 5950-1 [3] and EN 1999-1-1 [4,5] for stainless steel and aluminum, respectively. Class 1 cross-sections can reach and maintain their full plastic moment capacity (Mpl) while maintaining sufficient rotational capacity for plastic design. Class 2 cross-sections can achieve their maximum plastic moment capacity even with limited rotating ability. The AISC 360-16 [6] and AS 4100 [7] steel rules, however, do not have a comparable European Class 2 cross-section categorization. Local buckling prevents Class 3 cross-sections from reaching their plastic moment capacity, and as a result, their ability to bend is only restricted to their elastic moment capacity (Mel). In Class 4 cross-sections, also referred to as slender sections, local buckling takes place prior to reaching the elastic moment capacity. The four classes’ moment–rotation capacities and idealized bending stress distributions are depicted in Figure 1. It is demonstrated how to discriminate between non-slender cross-sections (Classes 1, 2, and 3) that can reach yield load without any local buckling and those that fail before reaching yield load as a result of local buckling (i.e., Class 4).
HSS–CHS columns have been studied in many kinds of research to explore more effective design techniques [8,9,10]. Martin D. O’Shea [11] studied the local buckling of thin circular steel sections; 39 CHS stub columns with yield loads ranging from 210 to 363 MPa were investigated.
Under axial and uniaxial loads with yield stresses of 445 MPa. Chung et al. [12] studied the ultimate strengths of square CFST slender beam–columns with thin walls of high strength. Lan hui Guo et al. [13] examined the behavior of thin-walled CHS stub columns exposed to axial compression with yield stresses of 190 MPa. Wang Hui et al. [14] scrutinized the axial compression stability of HSS–CHS with yield stresses of 690 MPa. Xiao-Ling Zhao [15] investigated the sectional capacity of ultra-high-strength steel CHSs. These specimen yield stresses were up to 1350 MPa. Jiao and Zhao [16] investigated the limit of the slenderness of ultra-high-strength CHSs using 8 CHS stub columns in an experiment. Jia-Lin Ma et al. [17] recently investigated how HSS–CHSs behave in stub columns. Twenty-five samples were examined considering yield stresses ranging from 700 to 1100 MPa. Despite the rapid development in metallurgy and the ability to obtain types of steel with high and ultra-high-strength, all international specifications for steel design gave little information about the limits of slenderness and the design of HSSs and didn’t give anything about UHSSs, especially CHSs. Therefore, the main objects of this research are to investigate the behavior of high and ultra-high-strength steel circular hollow sections (HS–CHS and UHSS–CHS), evaluate the slenderness restrictions in different current codes, assess the current formulae of EC3 and AISC for the design of HSS–CHS, and suggest design equations that can be used to accurately slenderness for HS–-CHSs and UHSS–CHSs.
These objectives were achieved by using forty FE models executed with ANSYS. The verification of their accuracy was done by using the results of the experimental tests carried out in previous researches. A total of 105 CHS stub columns covering a variety of cross-section slenderness ratios were used, as described in the literature review.

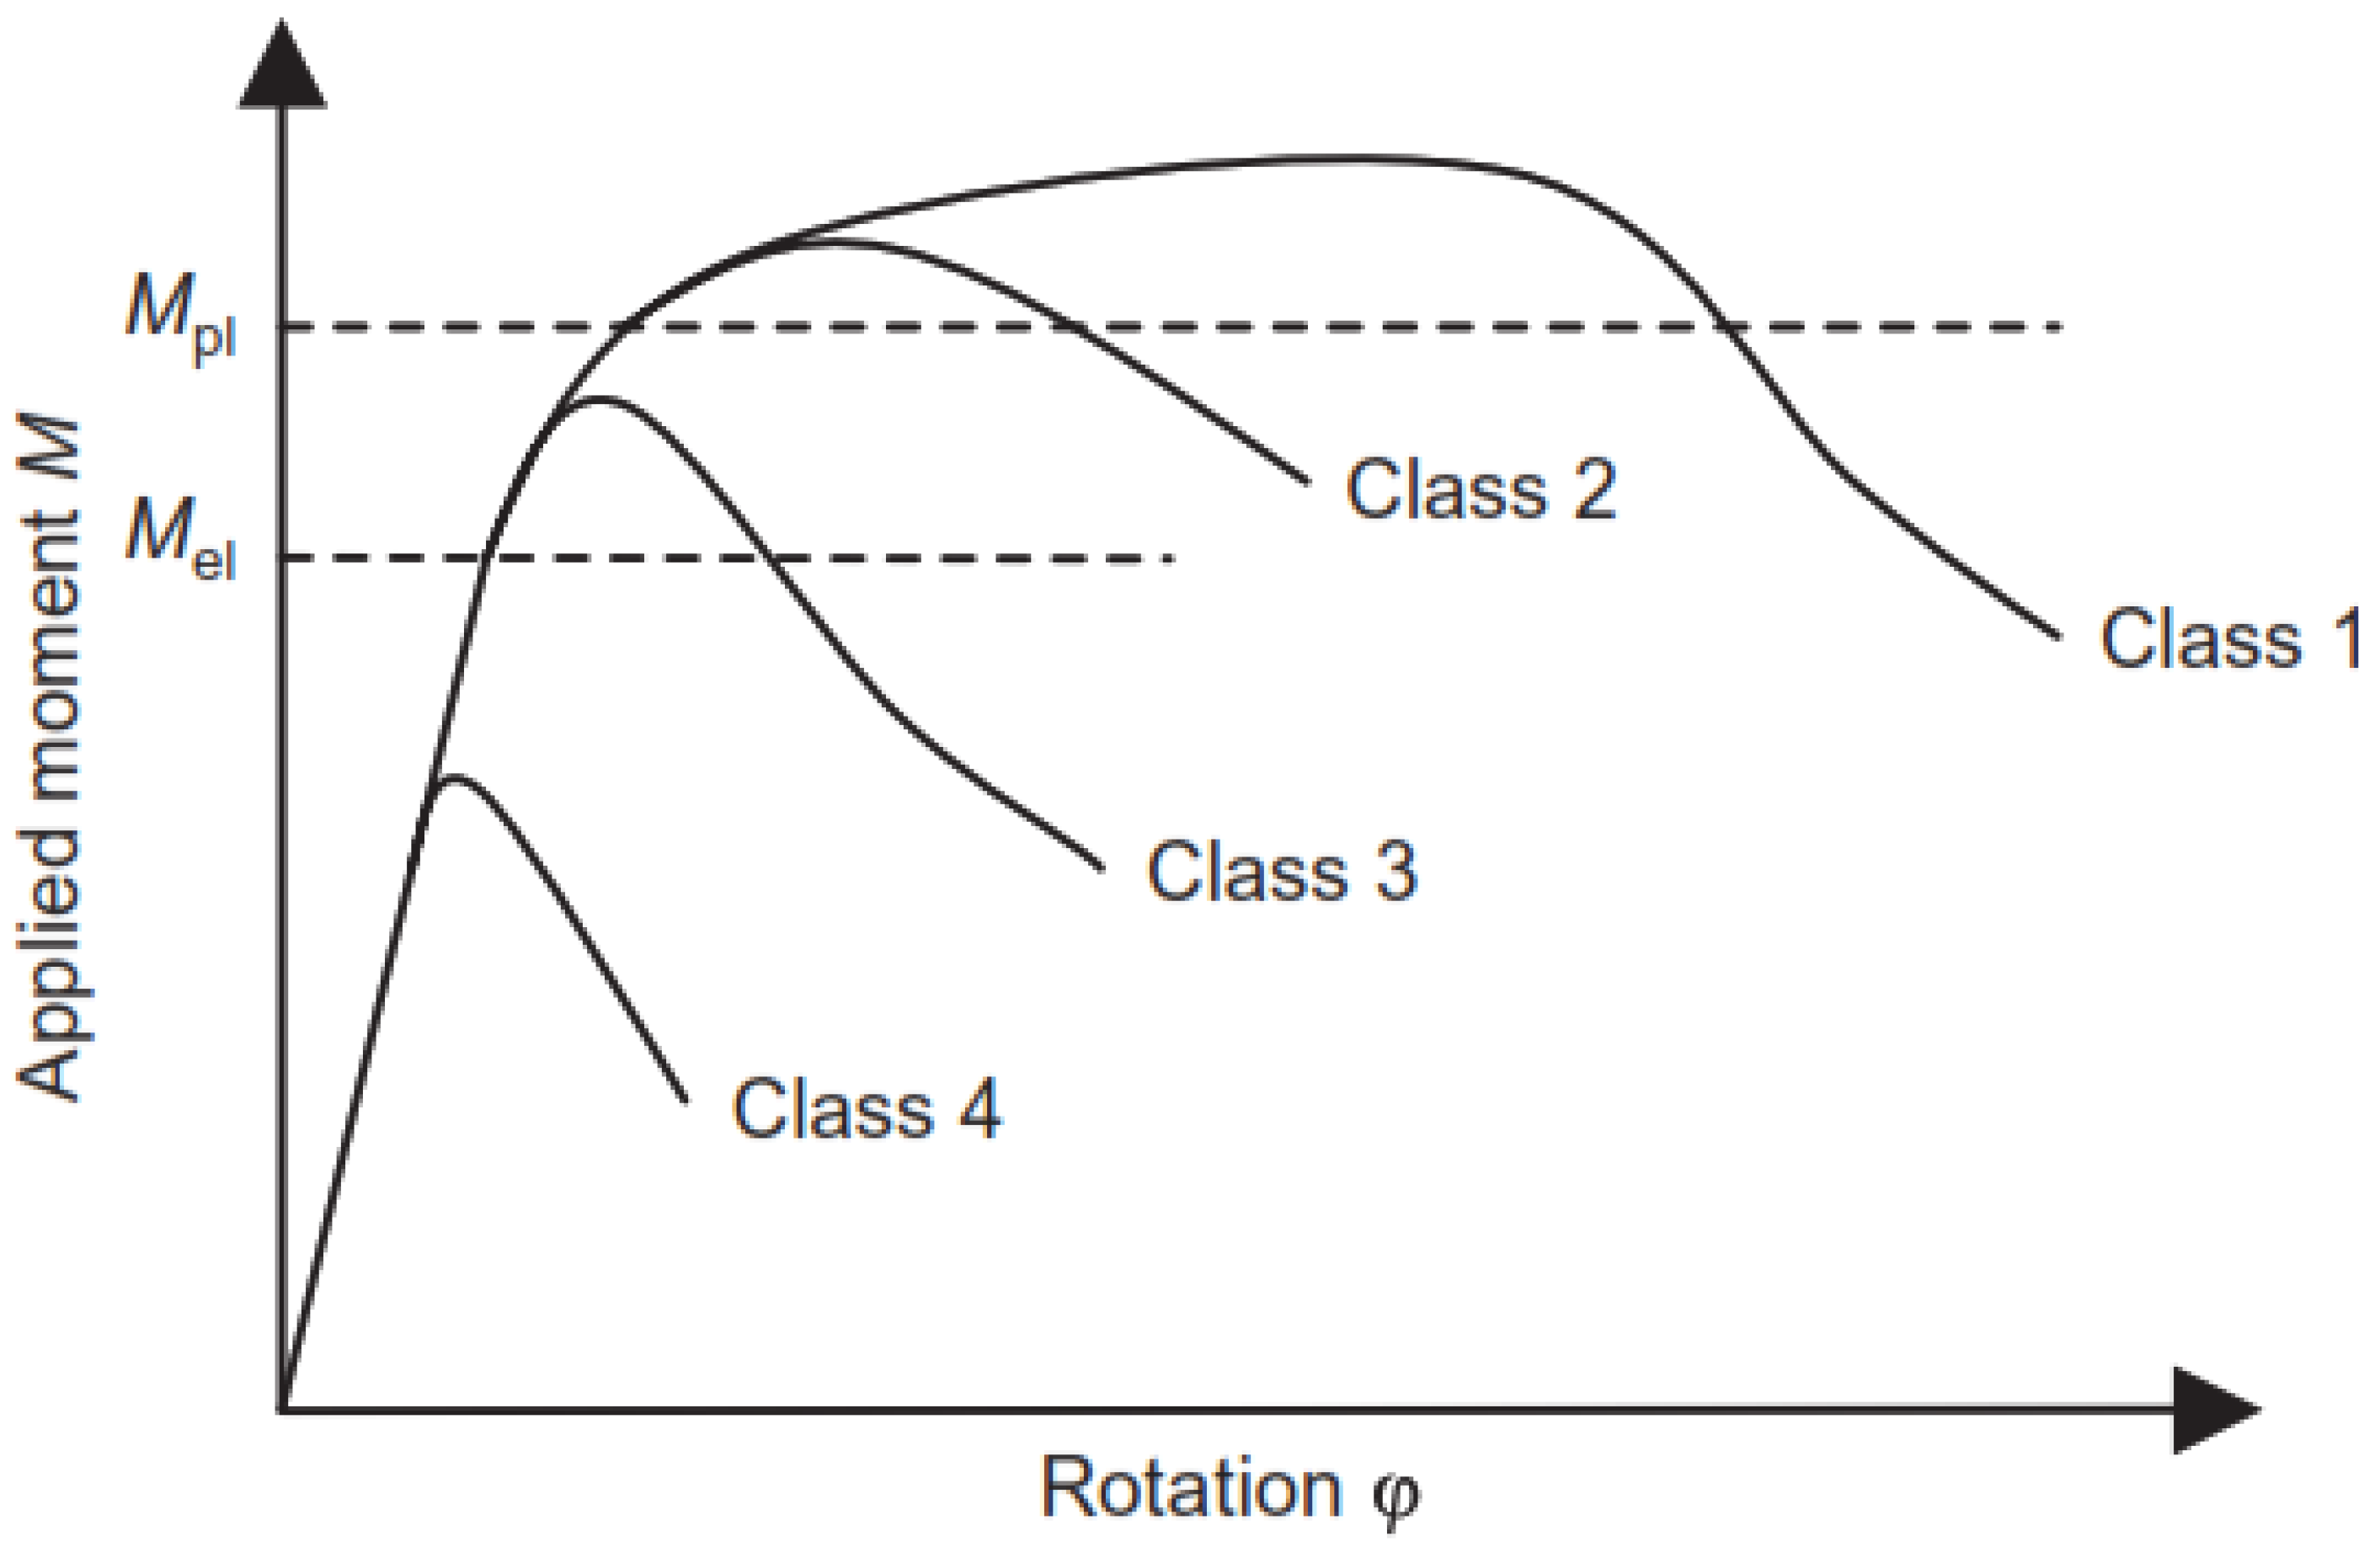
2. Background on Existing Carbon Steel Cross-Section Design Methods and Slenderness Restrictions

Cross-section classification is the most widely used method for detecting local buckling in metallic sections and determining the required structural design strength. It is assumed that the yield stress ƒy is equal to 0.2% of the proof stress. In terms of the properties of the materials, a series of width-to-thickness ratios (b/t) is employed in EN 1993-1-3 [18], which employs the EN 1993-1-1 approach for carbon steel hot rolled cross-section categorization. The type of edge support (internal or external), as well as the type of applied stress, are also specified. The classification of the total cross-section is based on the thinnest constituent element, disregarding the advantages of element interaction. Experiments at the cross-section level are frequently used to identify slenderness limitations. Gardner [19], based on a wide experimental database, found that the current classification limitations are excessively conservative and might be improved in many cases, as demonstrated by O’Shea, Gardner, and Zhao [11,19,20]. Aside from the issue of slenderness constraints in categorization, there’s also the issue of the limitations of applying present code design standards to ultra-high-strength steel (UHSS), because supplementary requirements in the current Euro code EN 1993-1-12 [21] enable the use of steel with grades up to S700. EN 1993-1-3 is related to a cold-formed CHS provided as EN 10219-1 [22], which in cold-formed steel standards should be referred to as EN 1993-1-1. According to American Specification AISC 360-16, high-strength steel with yield strengths of up to 690 MPa for plates [23] and 485 MPa for hollow structural sections [24] is acceptable. North American Specification AISI-S100-12 [25], which complies with ASTM requirements for high-strength steel, permits the use of high-strength steel with a yield strength of up to 450 MPa. Therefore, the requirements of these standards cannot be immediately applied to the development of UHS tubes (with yield stress greater than 1000 MPa).
The nominal compression strength of the cross-sections of Classes 1–3 is specified by EN 1993-1-1 and is calculated from Equation (1). EN 1993-1-6, which is applicable for CHS members Class 4, uses shell buckling theory to calculate the axial compressive strength of shell elements. Therefore, the nominal resistance of shells in compression can be determined using Equation (2). According to ANSI/AISC 360-16 and AI-SI-S100-12, respectively, Equations (3) and (4) can be used to determine the nominal compressive strength of cross-sections subjected to local buckling or yielding.
N E C 3 - 1 - 1 = f y A     for   D t ( 90 ε 2 )   ( E N 1993 - 1 - 1 )
N E C 3 - 1 - 6 = x f y A     for   D t ( 90 ε 2 )   ( E N 1993 - 1 - 6 )
where ε = ( 235 f y E 210 ) 0.5 ,
N A I S C =   ( 2 3 + 0.038 E f y D t ) A   f o r   0.11 E f y D t 0.45 E f y   f y A   f o r   D t 0.11 E f y     ( A N S I / A I S C 360 - 16 )
N A I S I =   ( 2 3 + 0.037 E f y D t ) A   f o r   0.112 E f y D t 0.441 E f y   f y A   f o r   D t 0.112 E f y     ( A I S I - S 100 - 12 )
where f y (MPa) is the steel yield stress, E (GPa) is the modulus of elasticity of steel, A is the gross area of cross-section, λ S = ( D t f y 235 ) 0.5 is the slenderness of plate element, x is the factor of buckling reduction found by the shell’s relative slenderness.
When the previous Euro code and American Specification equations were used for high-strength steel (S460) and very-high steel (S1100), the slenderness limit can be calculated as follows:
D t ( 90 ε 2 ) = 90 ( 235 f y E 210 ) 0.5
D t 90 ( 235 460 210 210 ) 0.5 = 46 for high-strength steel (S460), and also D t 90 ( 235 1152 207 210 ) 0.5 = 18 for ultra-high-strength steel (S1100).
Therefore, one of the main goals of this research is to check the accuracy of using the previous Euro code and American Specification equations to determine the slenderness limits for S460 and S1100 by using finite element analysis.

3. Finite Element Modeling

The proficient finite element program ANSYS [26] is used to do advanced nonlinear computations. The study takes into account the geometry and material nonlinear analysis with imperfections (GMNIA) [27]. Geometric nonlinearity refers to the nonlinearities in the structure due to the changing geometry as it deflects. The geometrical imperfection was studied in many previous types of research. Paolo Foraboschi [28,29] presented an in-depth study for non-linear geometrical analysis. Geometric nonlinearity is calculated in ANSYS using the Newton–Raphson technique by activating the large deformation command in the analysis option. The finite nonlinear shell element 181, which has four nodes where there are six degrees of freedom for each node, is used in the modeling. In order to observe local buckling of the cross-section, models subjected to axial compression were first employed; in such cases, the length of the specimens was set to be equal to 3 times the maximum cross-sectional dimension in order to prevent global buckling. In addition, two cap plates, one at the top and one at the bottom, with a thickness of 80 mm were used to receive loads and restraints. The FE model details are described in the following subsections.

3.1. Properties of Material

Material properties of specimens are defined as shown in Figure 2 by a true stress–strain curve for UHSS-S1100 and HSS–S460 with yield stress equal to 1115 and 460 MPa, respectively. The elastic modulus is taken equal to 207 MPa for S1100 and 201 MPa for S460. Poisson’s ratio is considered equal to 0.3.
A true stress–strain curve was adopted, in which the initial linear region represents Young’s modulus E, which ends up at a point of yield stress ( f y ,   ε y ), where f y is the yield stress and ε y is the corresponding elastic strain, ε y = E / f y . The strain hardening region is defined by a number of points of stress and strain that form a curve using a series of calculations presented by Young. B is based on the value of f y , f u and ε u [30,31].

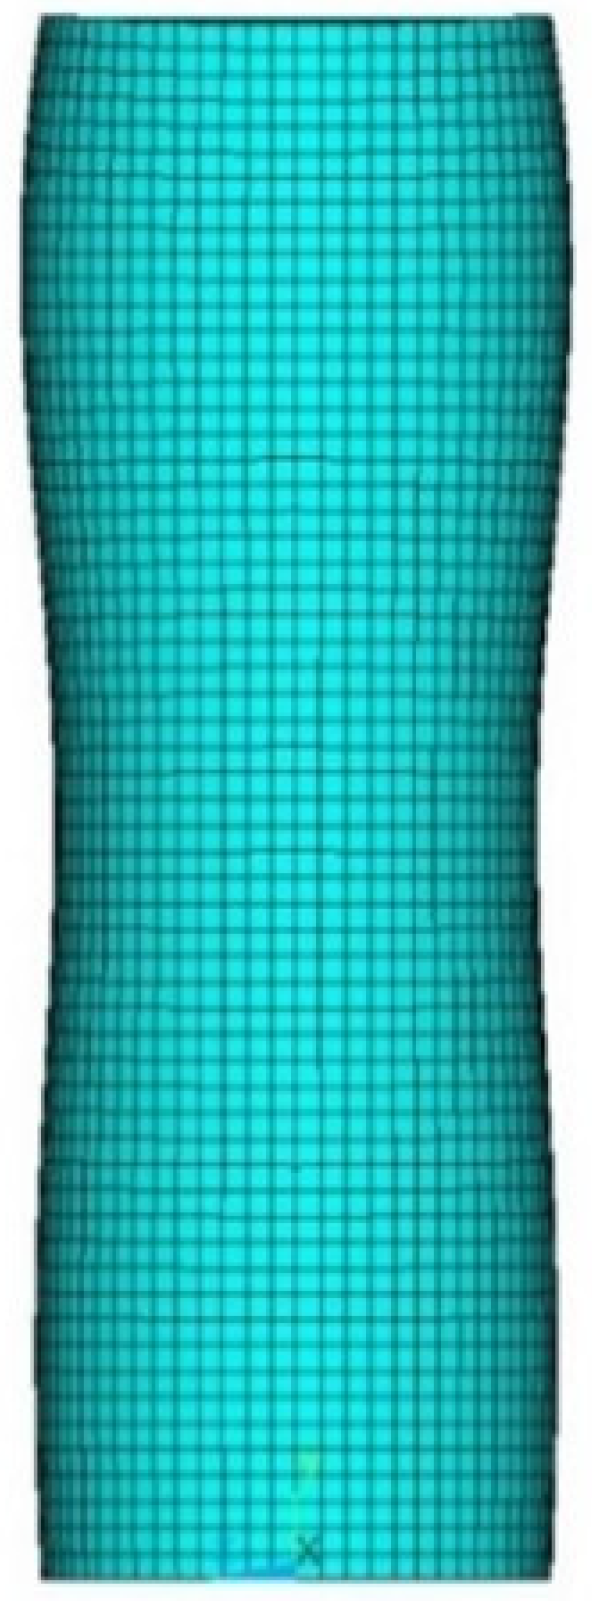
3.2. Mesh Refinement

A net comparison was carried out between four different types of mesh densities for CHS stub columns with meshing ranging from fine (D/40 and D/20) to coarse (D/10 and D/5) to choose the suitable mesh size. It is found that the coarse meshes of a mesh size of D/5 and D/10 do not produce results that are acceptable, being as much as 8% and 13% lower than those of D/40 and D/20 mesh, respectively. For this reason, these meshes have not been taken into consideration. For denser meshes (D/40 and D/20), satisfactory results and minimal discrepancies are seen across all sections. As a result, the mesh size of D/20 was chosen since it produces good results with little computing work.

3.3. Conditions of Loading and Supports

It was considered that there are two thick plates with a thickness of 80 mm for each, connected at the base and top of the specimen. The transitional movement in the plane in the X and Z axes direction is restricted to the points on the quadrant of the base and the top plates, as well as the center point of the base plate (A) in addition to its vertical movement being restricted in the Y-axis’s direction. Pure compression loading is carried out gradually at the center of the top plate (B) until the collapse as shown in Figure 3.

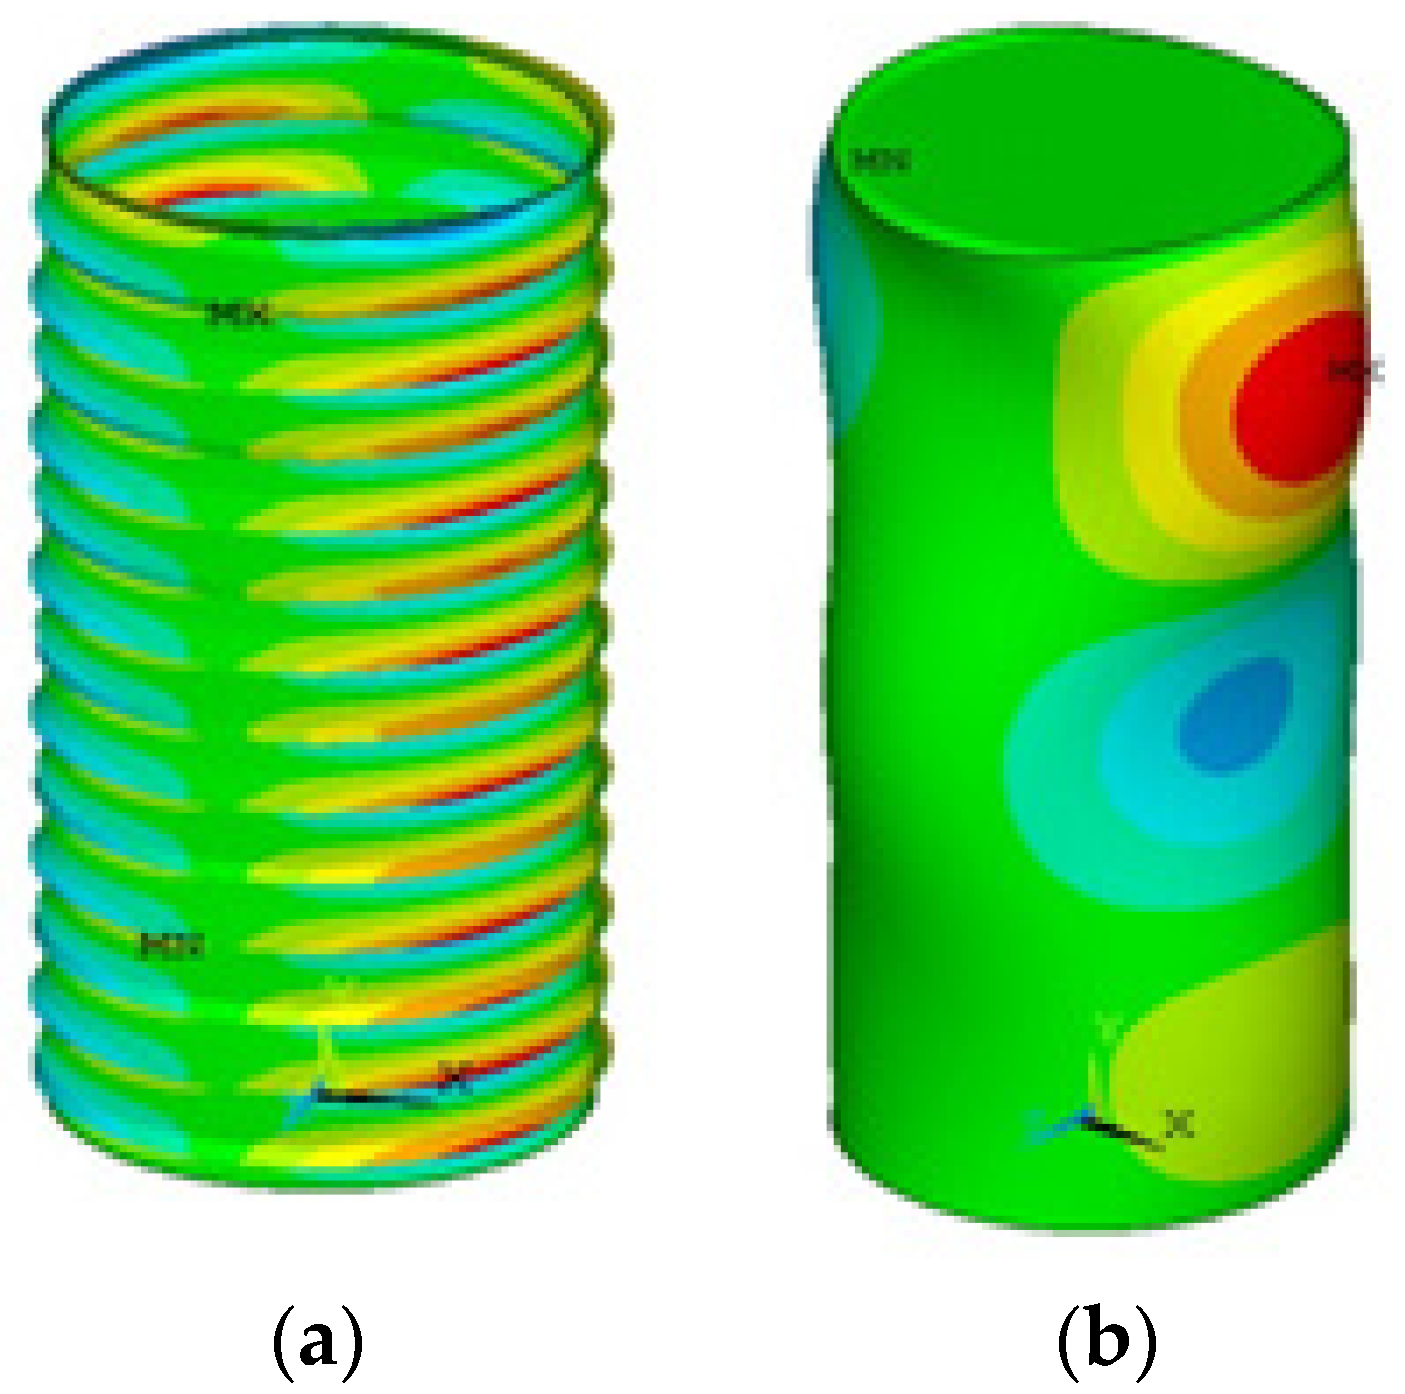
3.4. Geometrical Imperfections

In order to examine how local starting imperfections affect member resistance, several shapes of initial local geometric defects were studied. Through a buckling analysis of deferent modes of forms, local defect shapes were generated by appropriately modifying the node coordinates of the studied section. Two-mode shapes were examined to select the most appropriate mode based on the ultimate resistance and the expected failure modes in comparison with experimental tests as shown in Figure 4. In comparison with experimental mode shapes, case studies reveal that chequerboard mode may forecast the structural behavior of sections with reasonable accuracy and provide adequate failure modes. Thus, a number of FE models were performed on CHS. According to the conclusion of previous research [32], the specimens’ lengths were considered to be three times their diameter to cancel the effect of global buckling. The considered steel grade is S460, and the loading is axial compression. The considered models are summarized in Table 1.
Where type I is axisymmetric mode and type II is chequerboard mode. Equation (5) can be used to compute the amplitude value Δ ω for each type of defined shape.
Δ ω = 1 Q r t t
It is shown that the amplitude value Δ ω depends on the value of the fabrication quality parameter ( Q ) which was taken equal to 40 based on previous research [32], which concluded that most of the measured geometric imperfections of cold-formed CHSs do not exceed the value that comes from Q = 40 .
The adopted local imperfection is type 2, which represents the most reasonable and realistic mode of imperfection as shown in Figure 5. It is consistent with the previously-mentioned conclusions, the X. Meng [33] assumptions, and is represented by the most reasonable and realistic mode of imperfection.

3.5. Residual Stresses
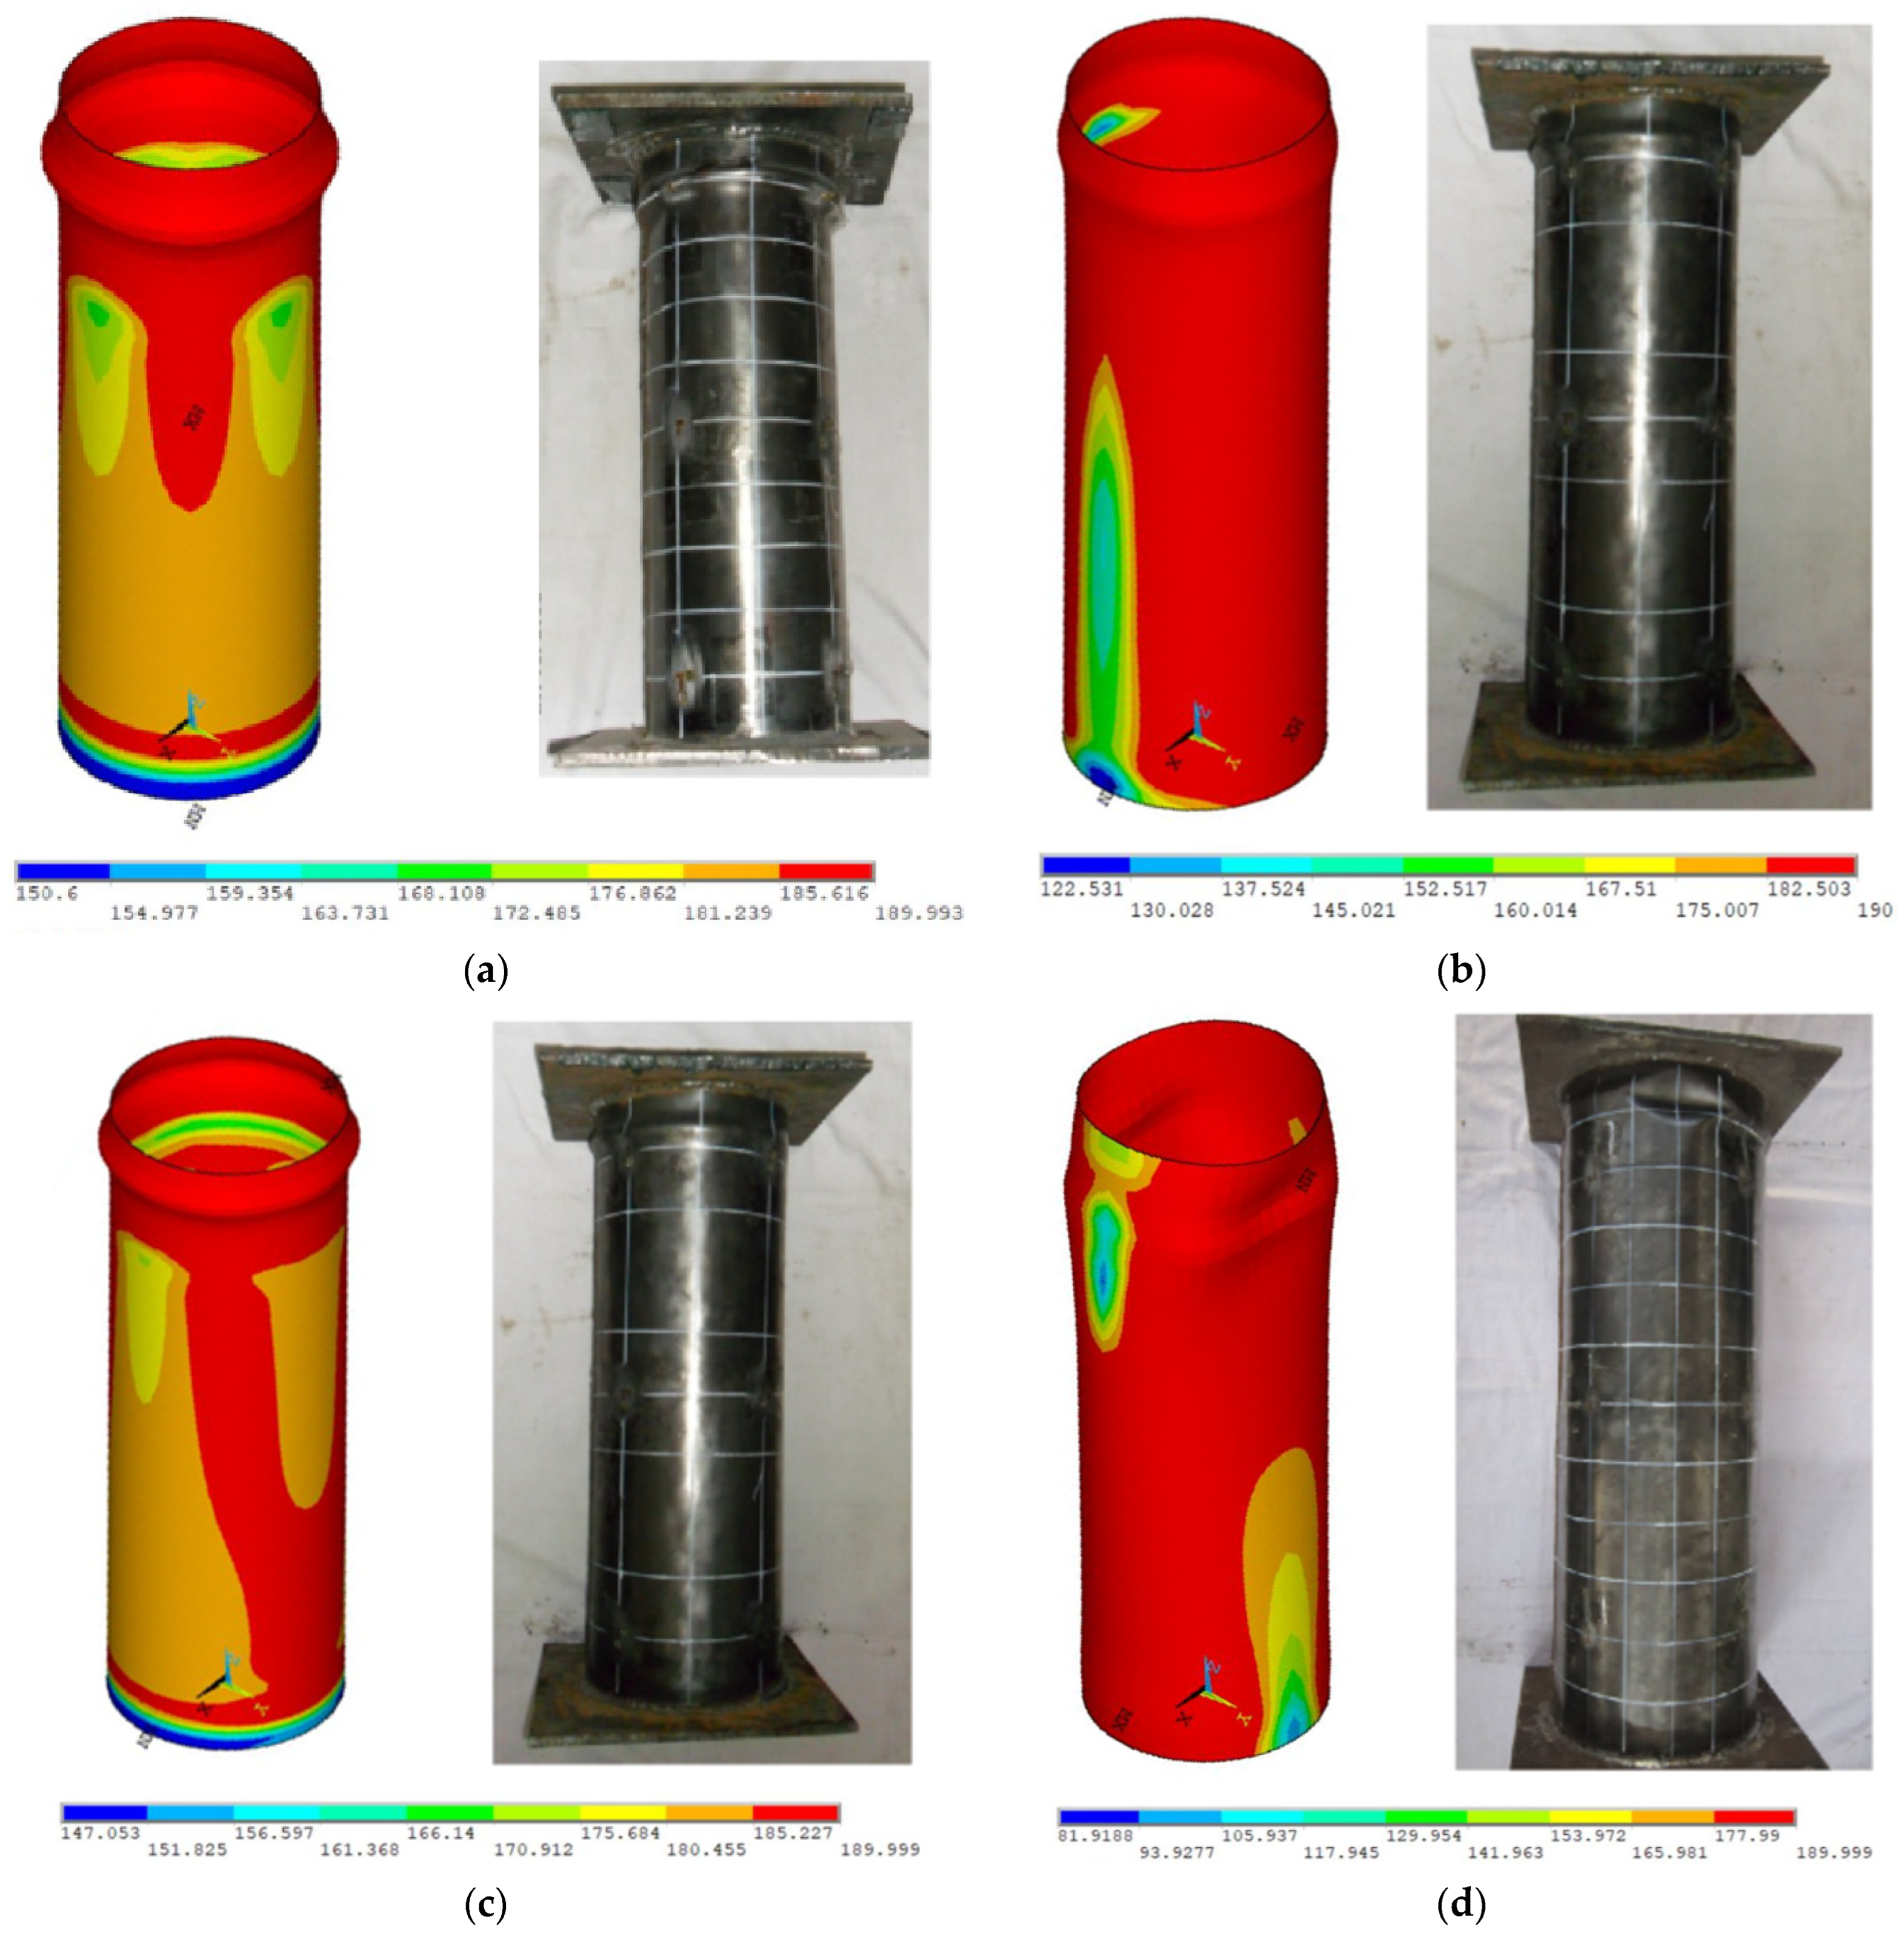
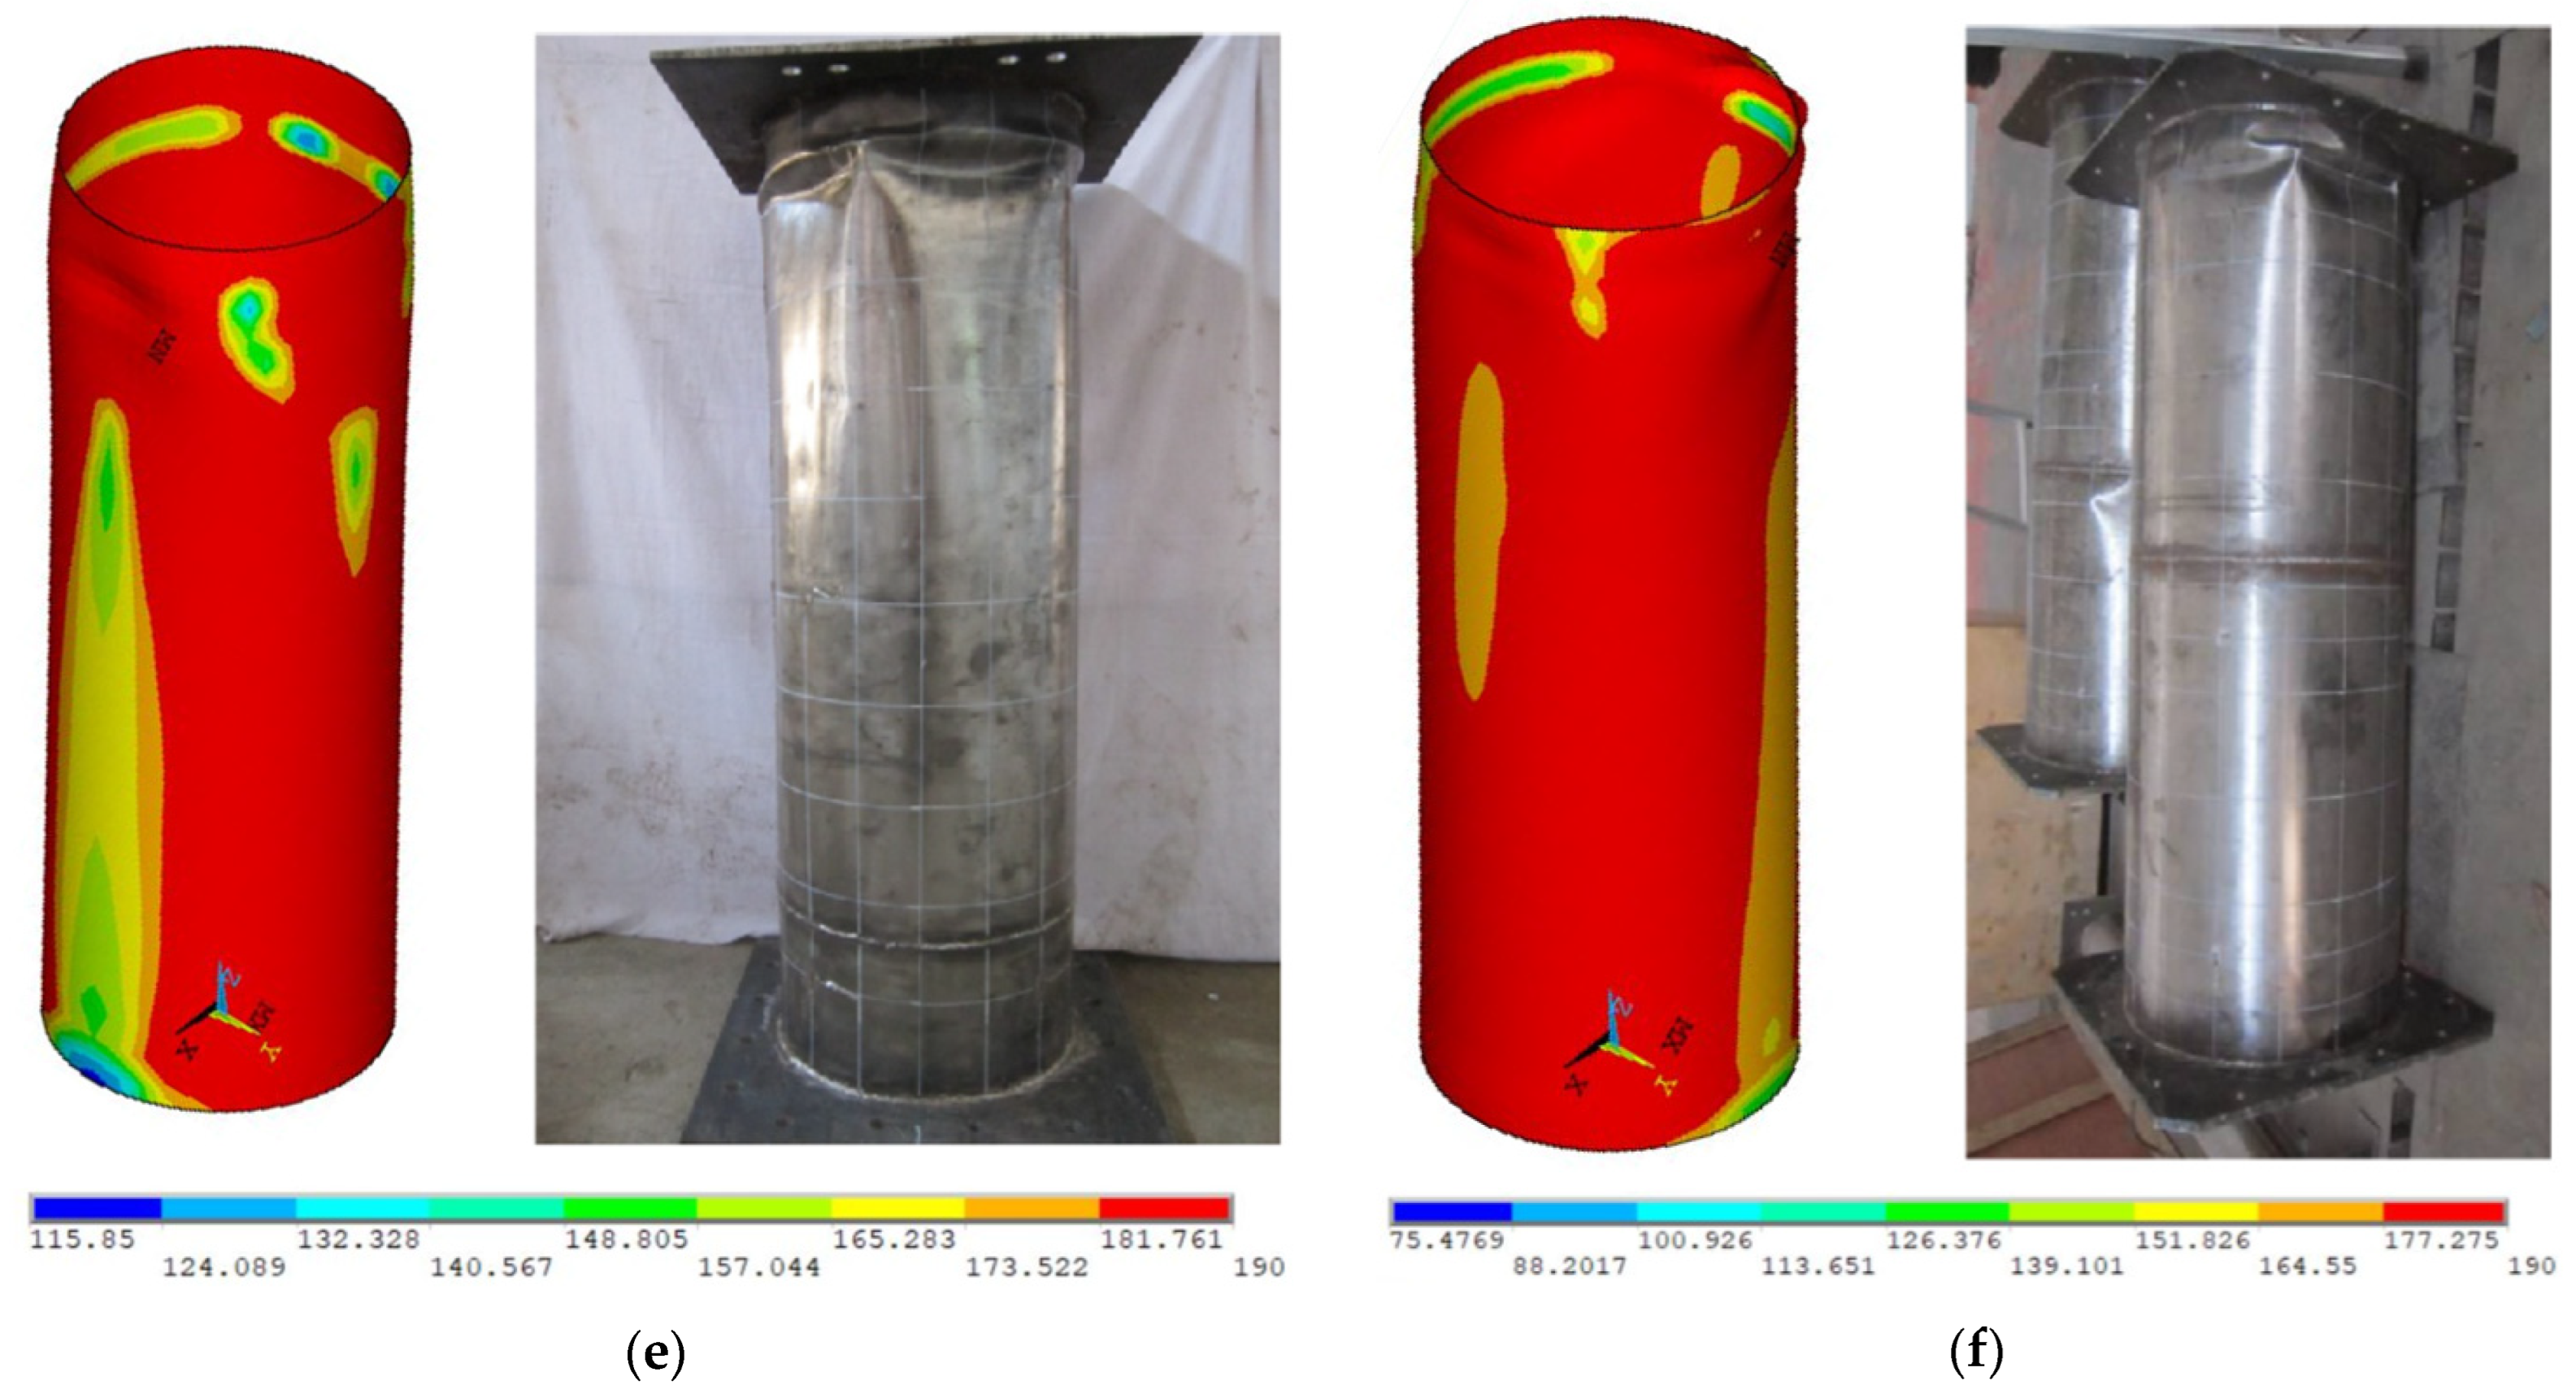
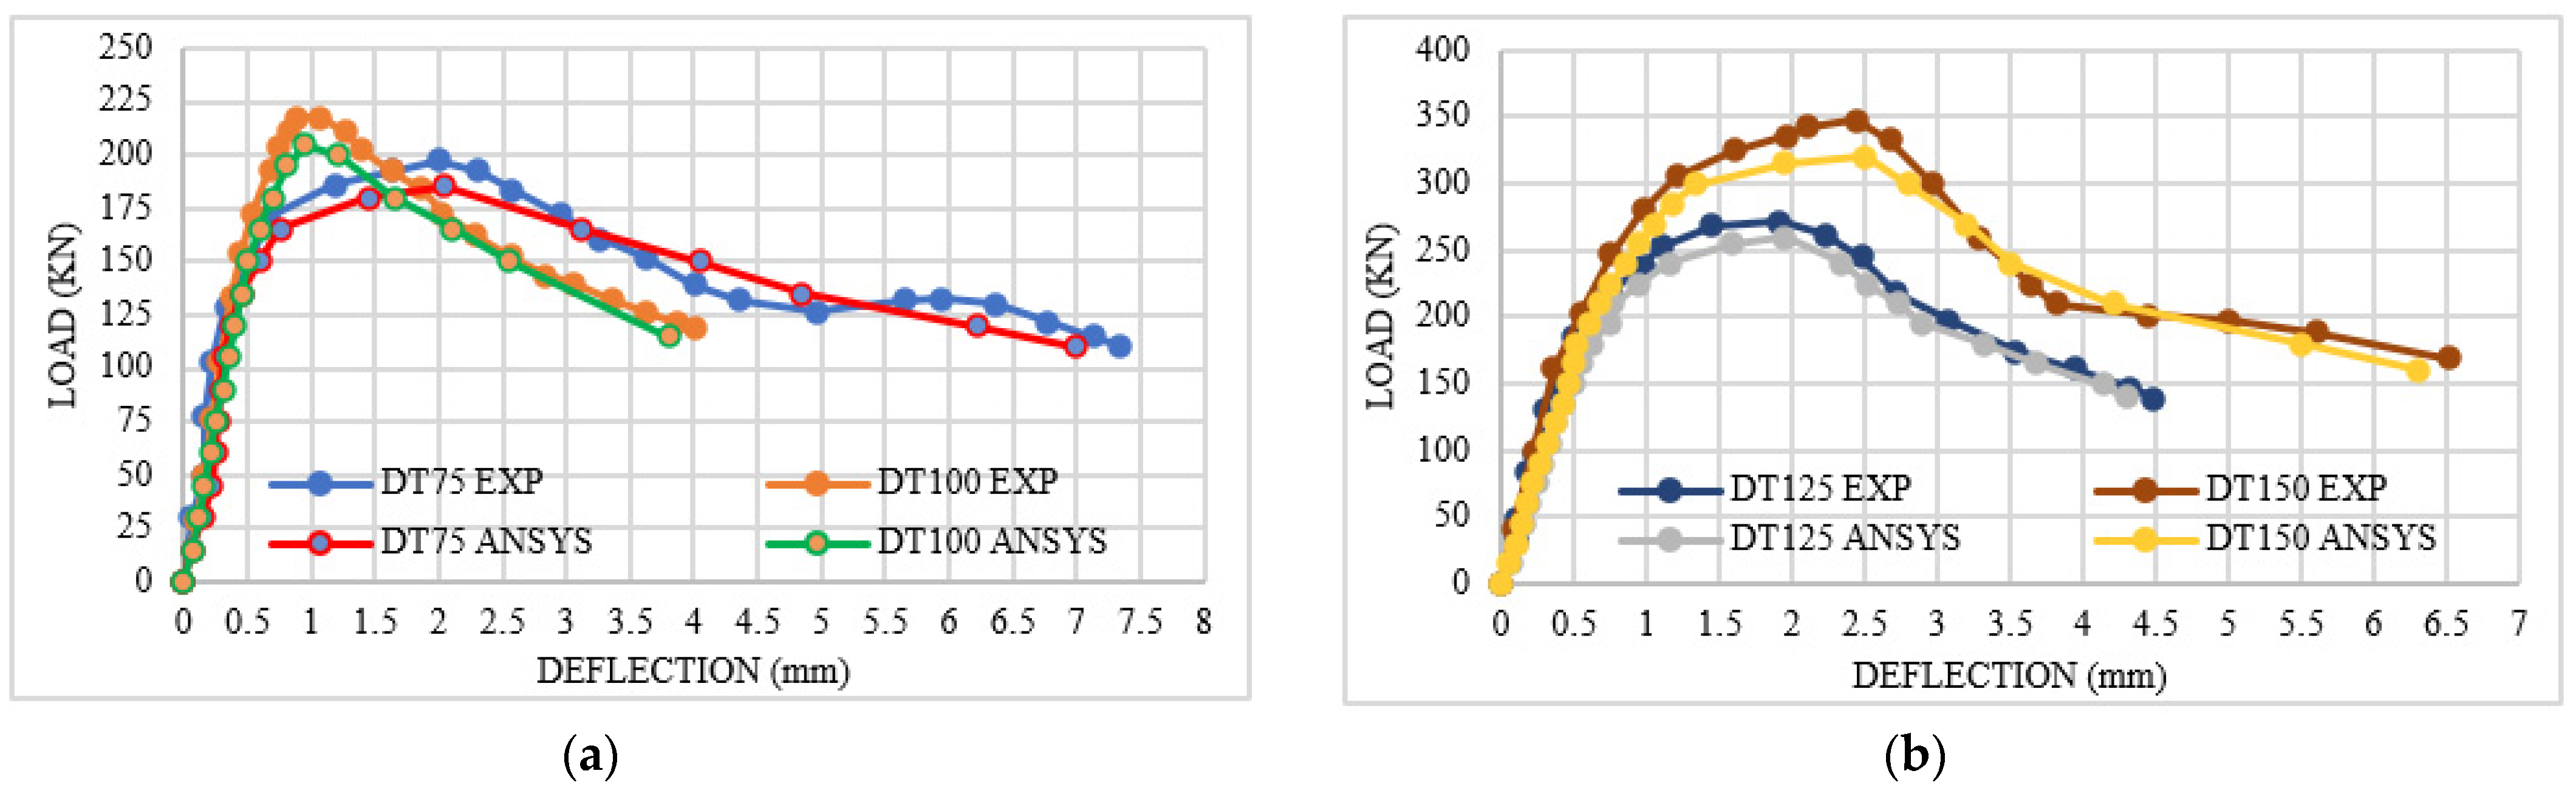
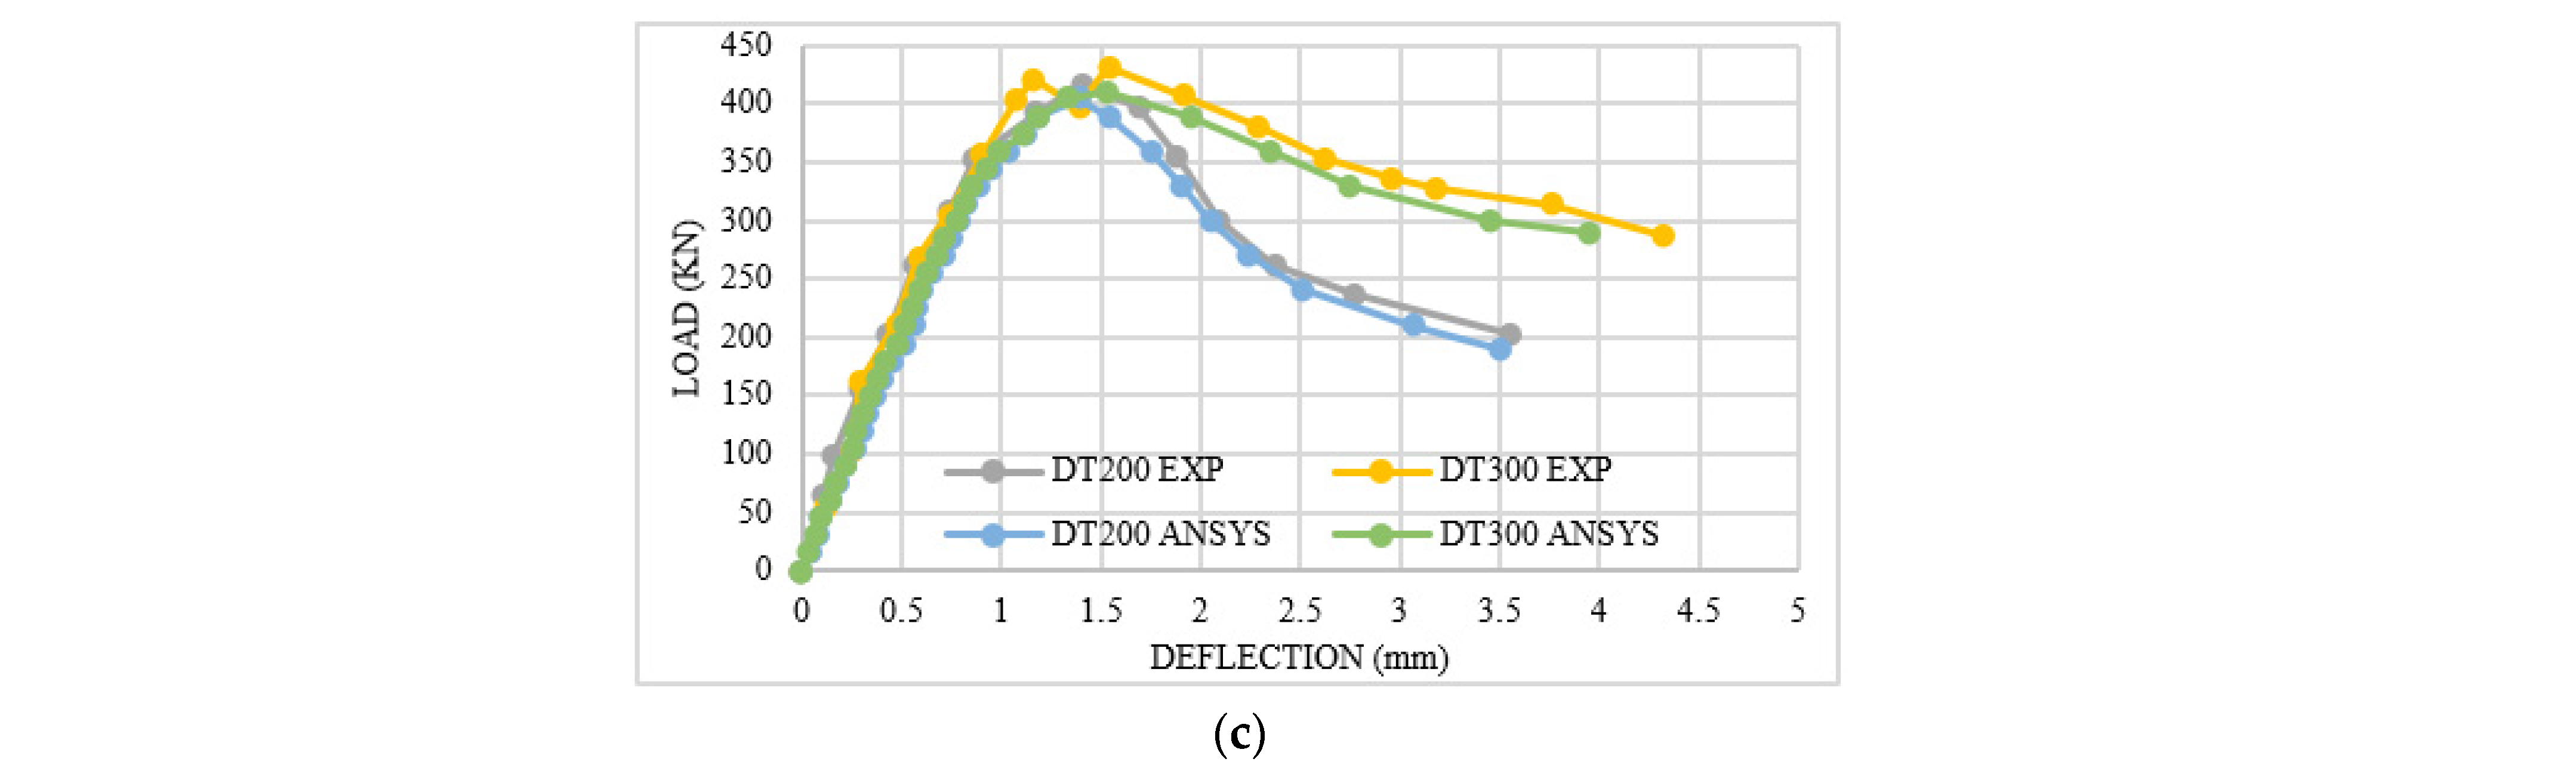
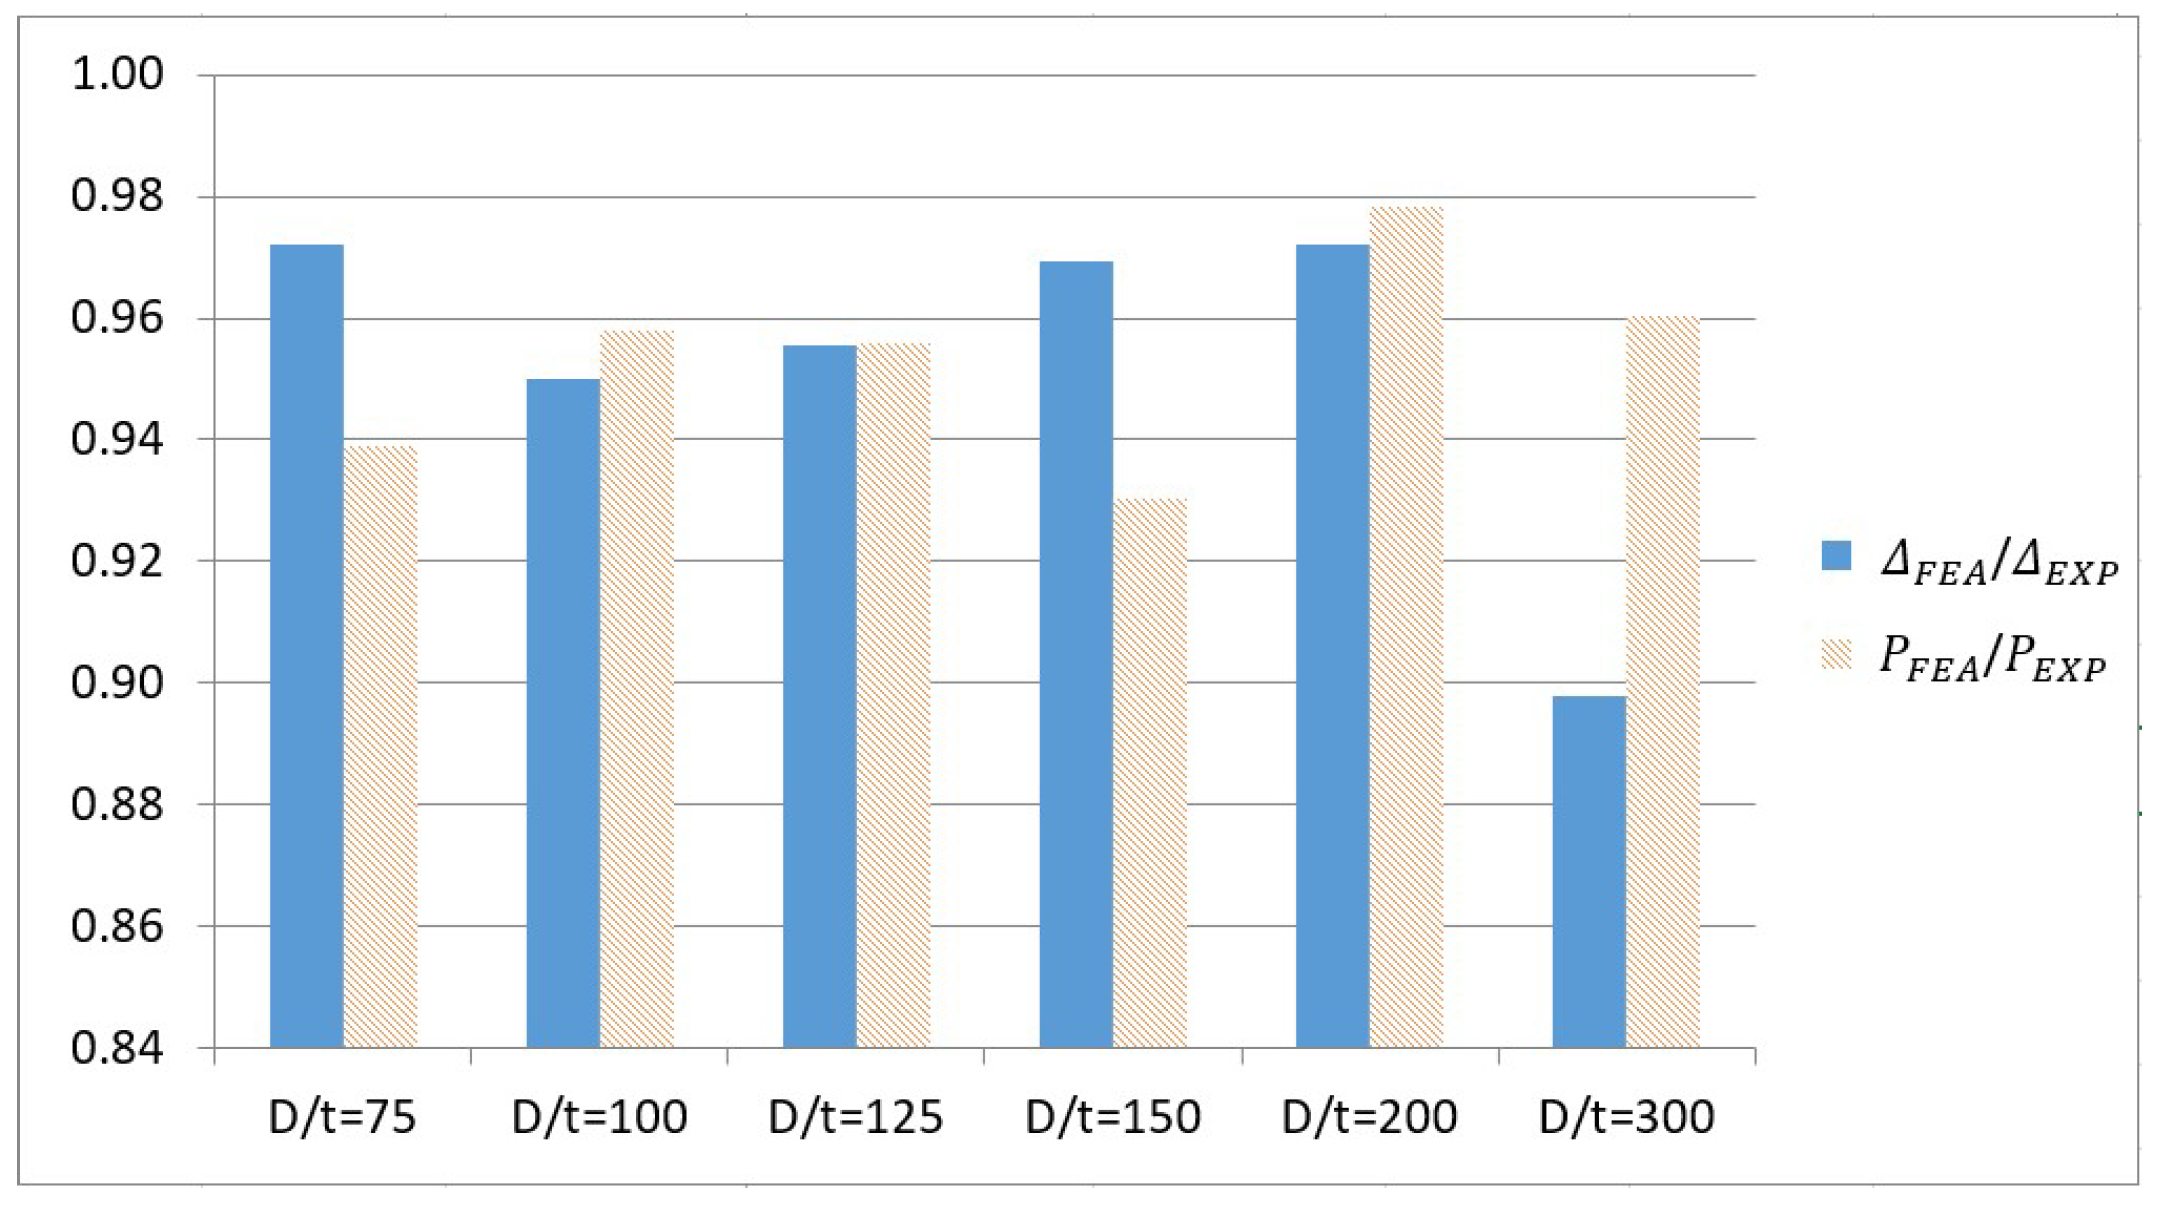
Based on recommendations from previous research [34], the residual stresses which can occur in cold-formed elements due to various stages of manufacturing are included in the stress–strain relationships determined from the tensile coupon test. Therefore, it isn’t considered in the FE analysis.

3.6. Validation

In order to confirm the validity of the proposed FE models, their results are compared with those of experimental tests performed by Lanhui Guo [13] that cover a wide range of D / t ratios as shown in Table 2. To replicate the failure mode and load-carrying capability of circular hollow section CHSs, which are conducted through an experimental investigation by Lanhui, a finite element model utilizing ANSYS software was conducted. The results of the analytical study were evaluated by comparing them with the results of experimental tests in terms of the collapsed form, P-∆ curves, and the ratio between the values of the maximum load capacity as well as the maximum vertical deflection. Figure 6 shows the comparison between the shape of failure mode occurring for different specimens which were tested experimentally by Lanhui Guo and corresponding models by ANSYS. It is analytically and experimentally clear to a large extent the similarity between the shapes of failure of the specimens.
Figure 7 shows a comparison of the load-deflection curves determined from the ANSYS models and Lanhui Guo’s experimental tests. It is demonstrated that the values of failure loads obtained from the ANSYS models and those obtained from experimental tests agree well. Figure 8 compares the maximum load capacity and maximum vertical deflection for several specimens with D / t = 75 to 300 according to the results of ANSYS models and experimental tests. With an accuracy average percentage of 95% for load-carrying capacity and deflection, the analytical models have demonstrated a high degree of agreement with the experimental data in both load-carrying capacity and failure modes of the specimens.
The difference between the experimental and analytical results can be returned to the imperfections, handling, accuracy of the equipment used, and erection of the experimentally tested columns.

4. Parametric Study

To investigate the behavior of a CHS under an axial compression load, a total of 40 finite element models were created as detailed in Table 3. The parametric study was based on determining the maximum axial compression load-carrying capacity of HSSs, UHSSs, and slender and non-slender CHSs, as well as evaluating the design approaches in AISC 360-16 and EC3. In addition, it attempted to specify a slenderness limit at which local buckling occurs. The results were presented and discussed to assess the effect of each parameter. Two parameters were taken into account, and they were studied in order to determine the effect of each one separately. Therefore, 40 models with a twenty value of diameter to thickness ratio ( D / t ) ranging from 10 to 250 and two values of yield stresses of 460 MPa and 1100 MPa were considered in this study. The length-to-diameter ratio was assumed to equal 3 for all studied stub columns to rule out the effect of global buckling as concluded in much previous research, such as that of Lanhui [13]. The geometric imperfection was taken into account based on EC3 code with fabrication quality parameters equal to 40 for all models.
Each model from the studied models was named to give information about its group and dimensions, for example, LC1-102-10-460. Where the first letter (LC1) refers to the name of the group, the first number (102) refers to the diameter (D) value in mm, the second number (10) refers to the thickness (t) value in mm, and the last number (460) refers to the yield stress value in MPa.

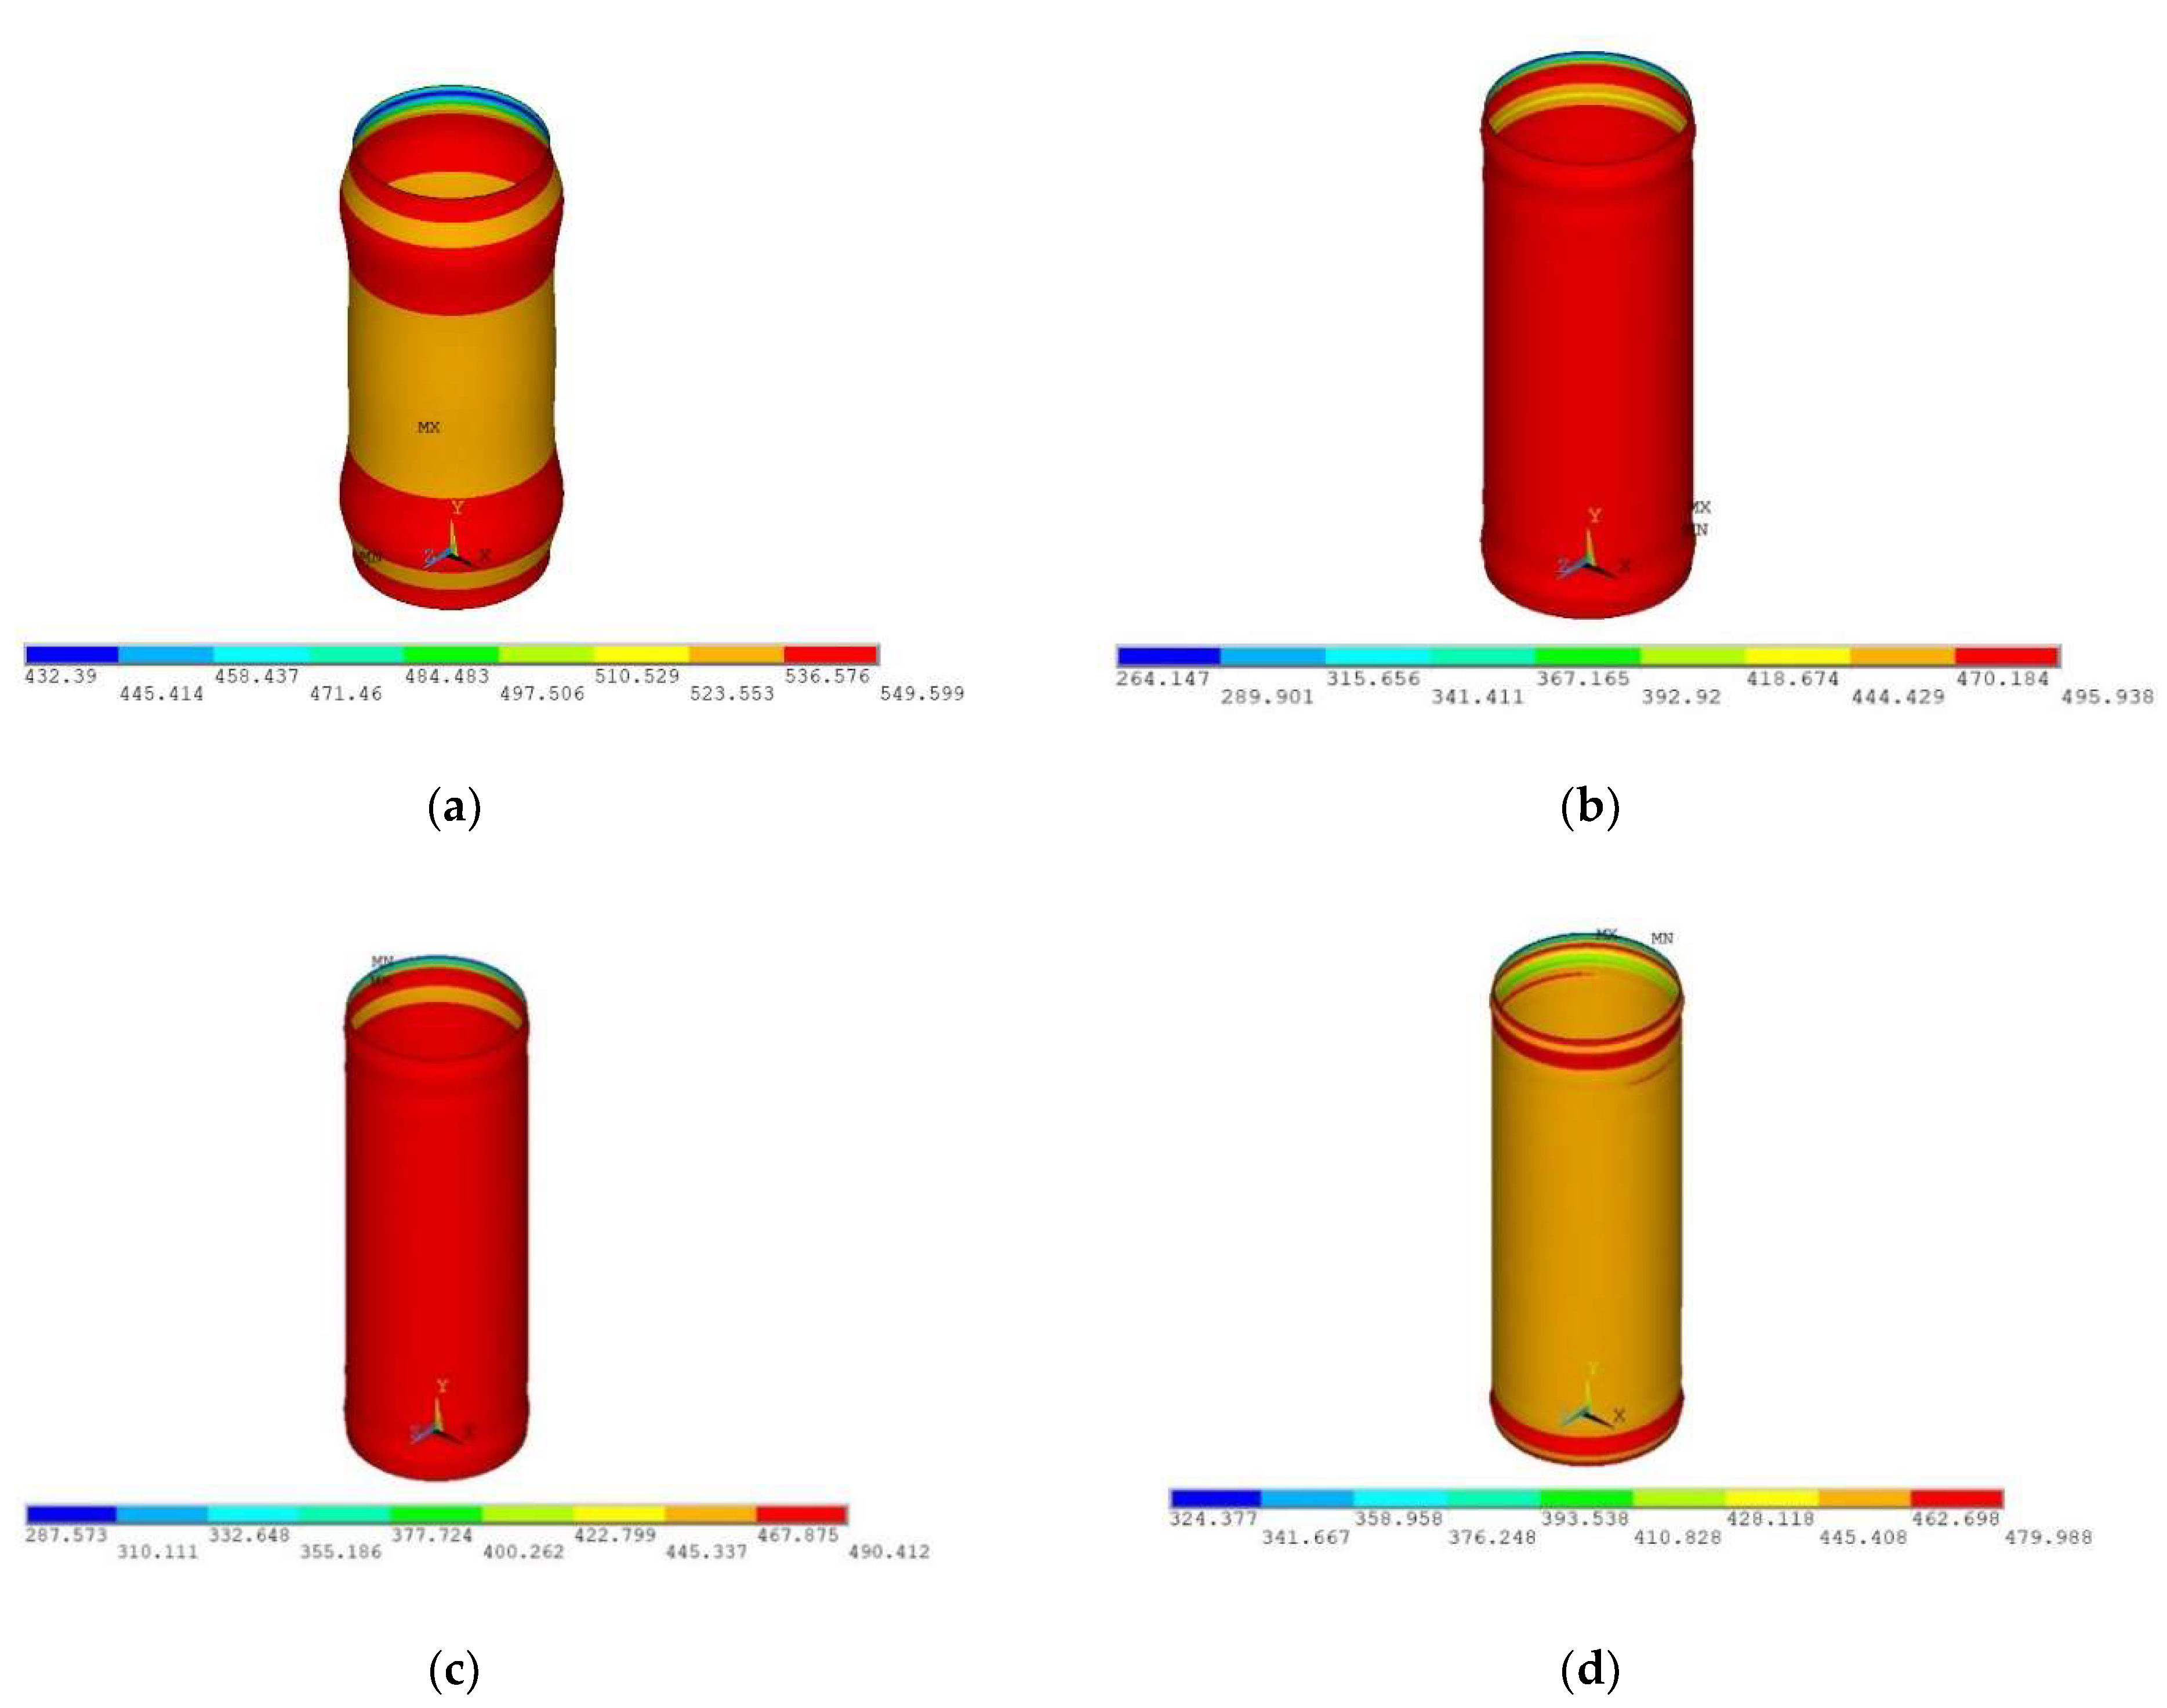
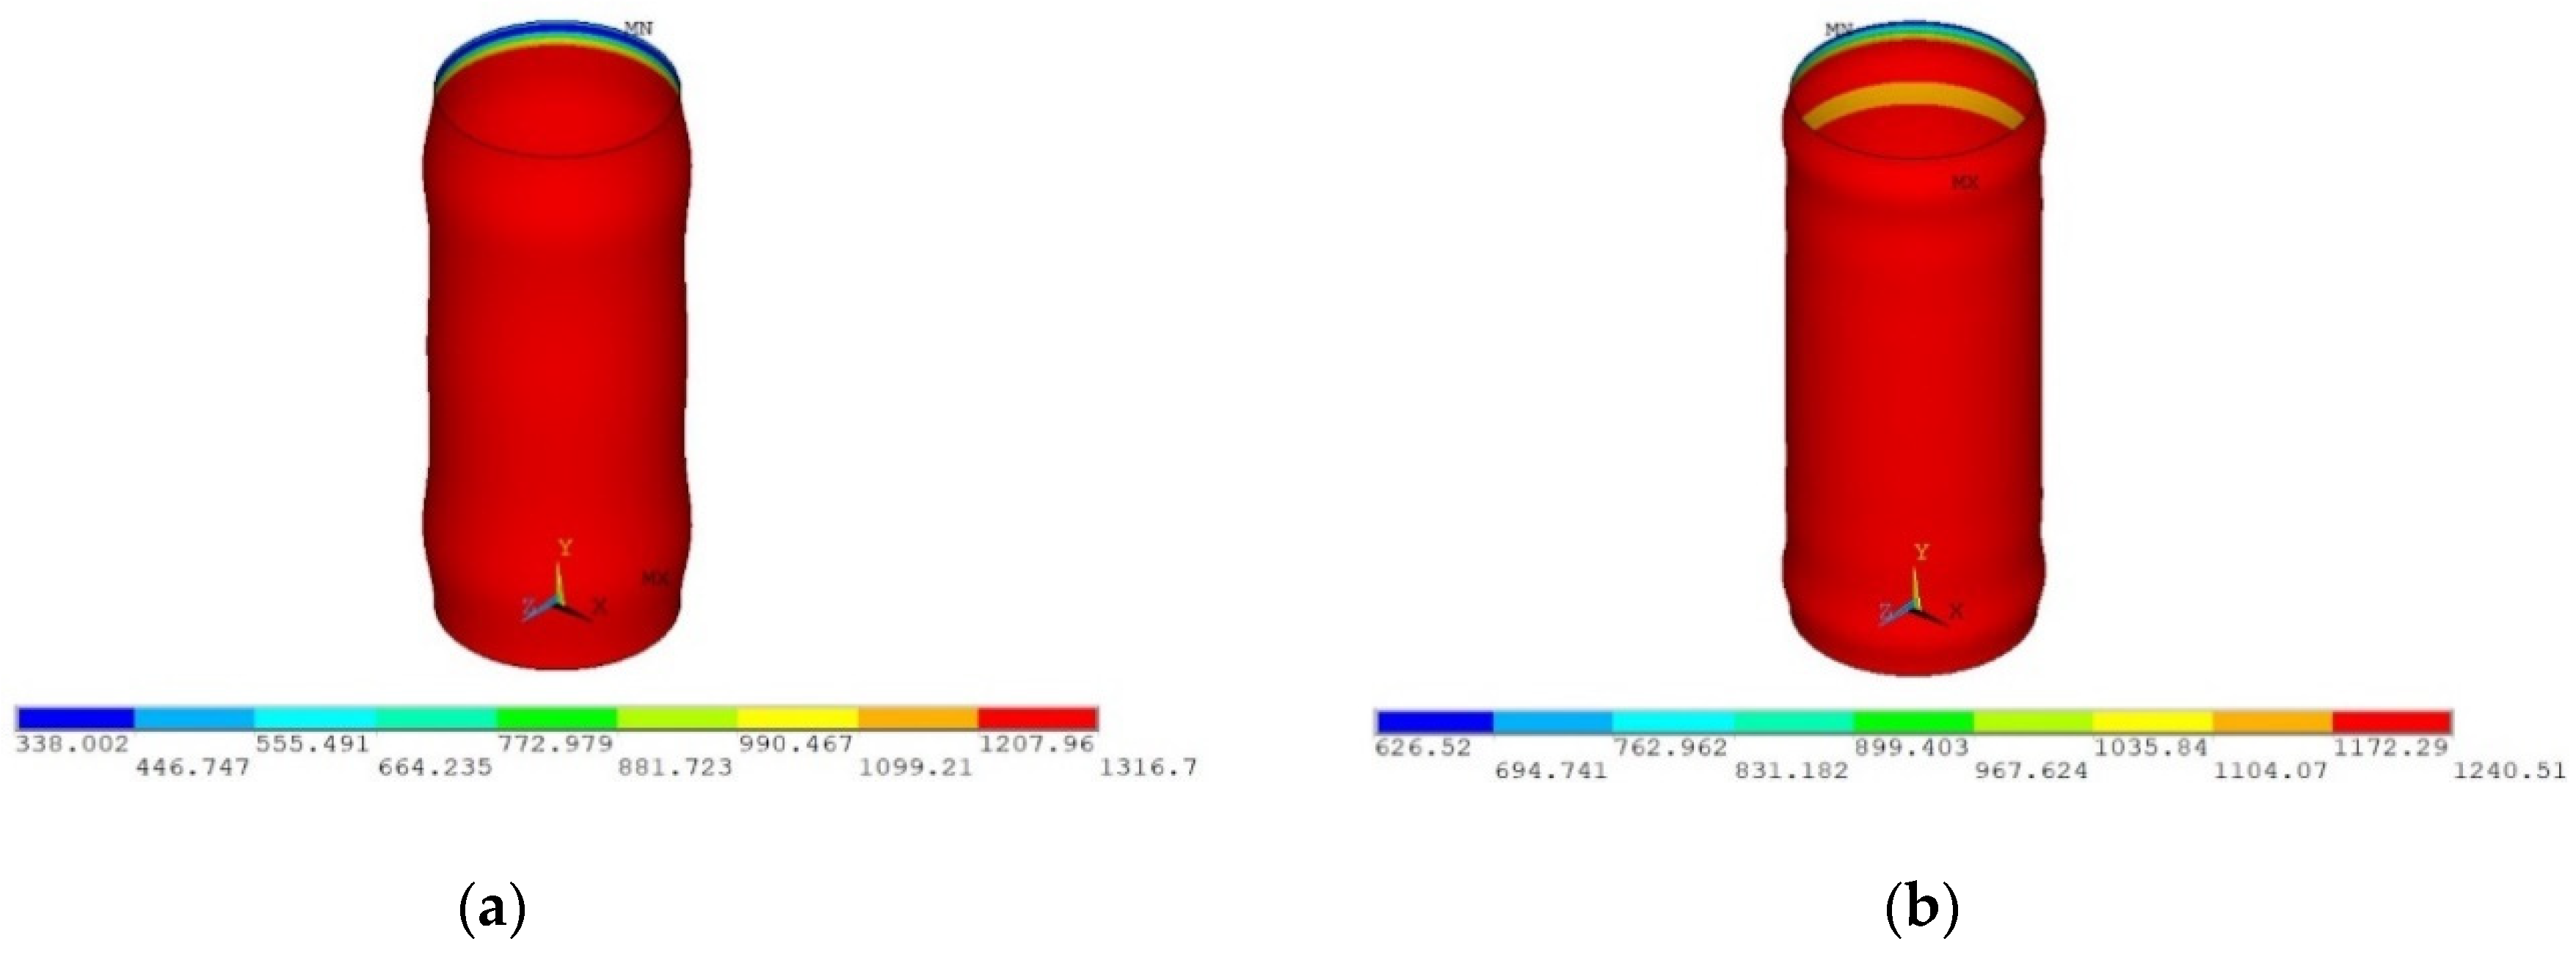
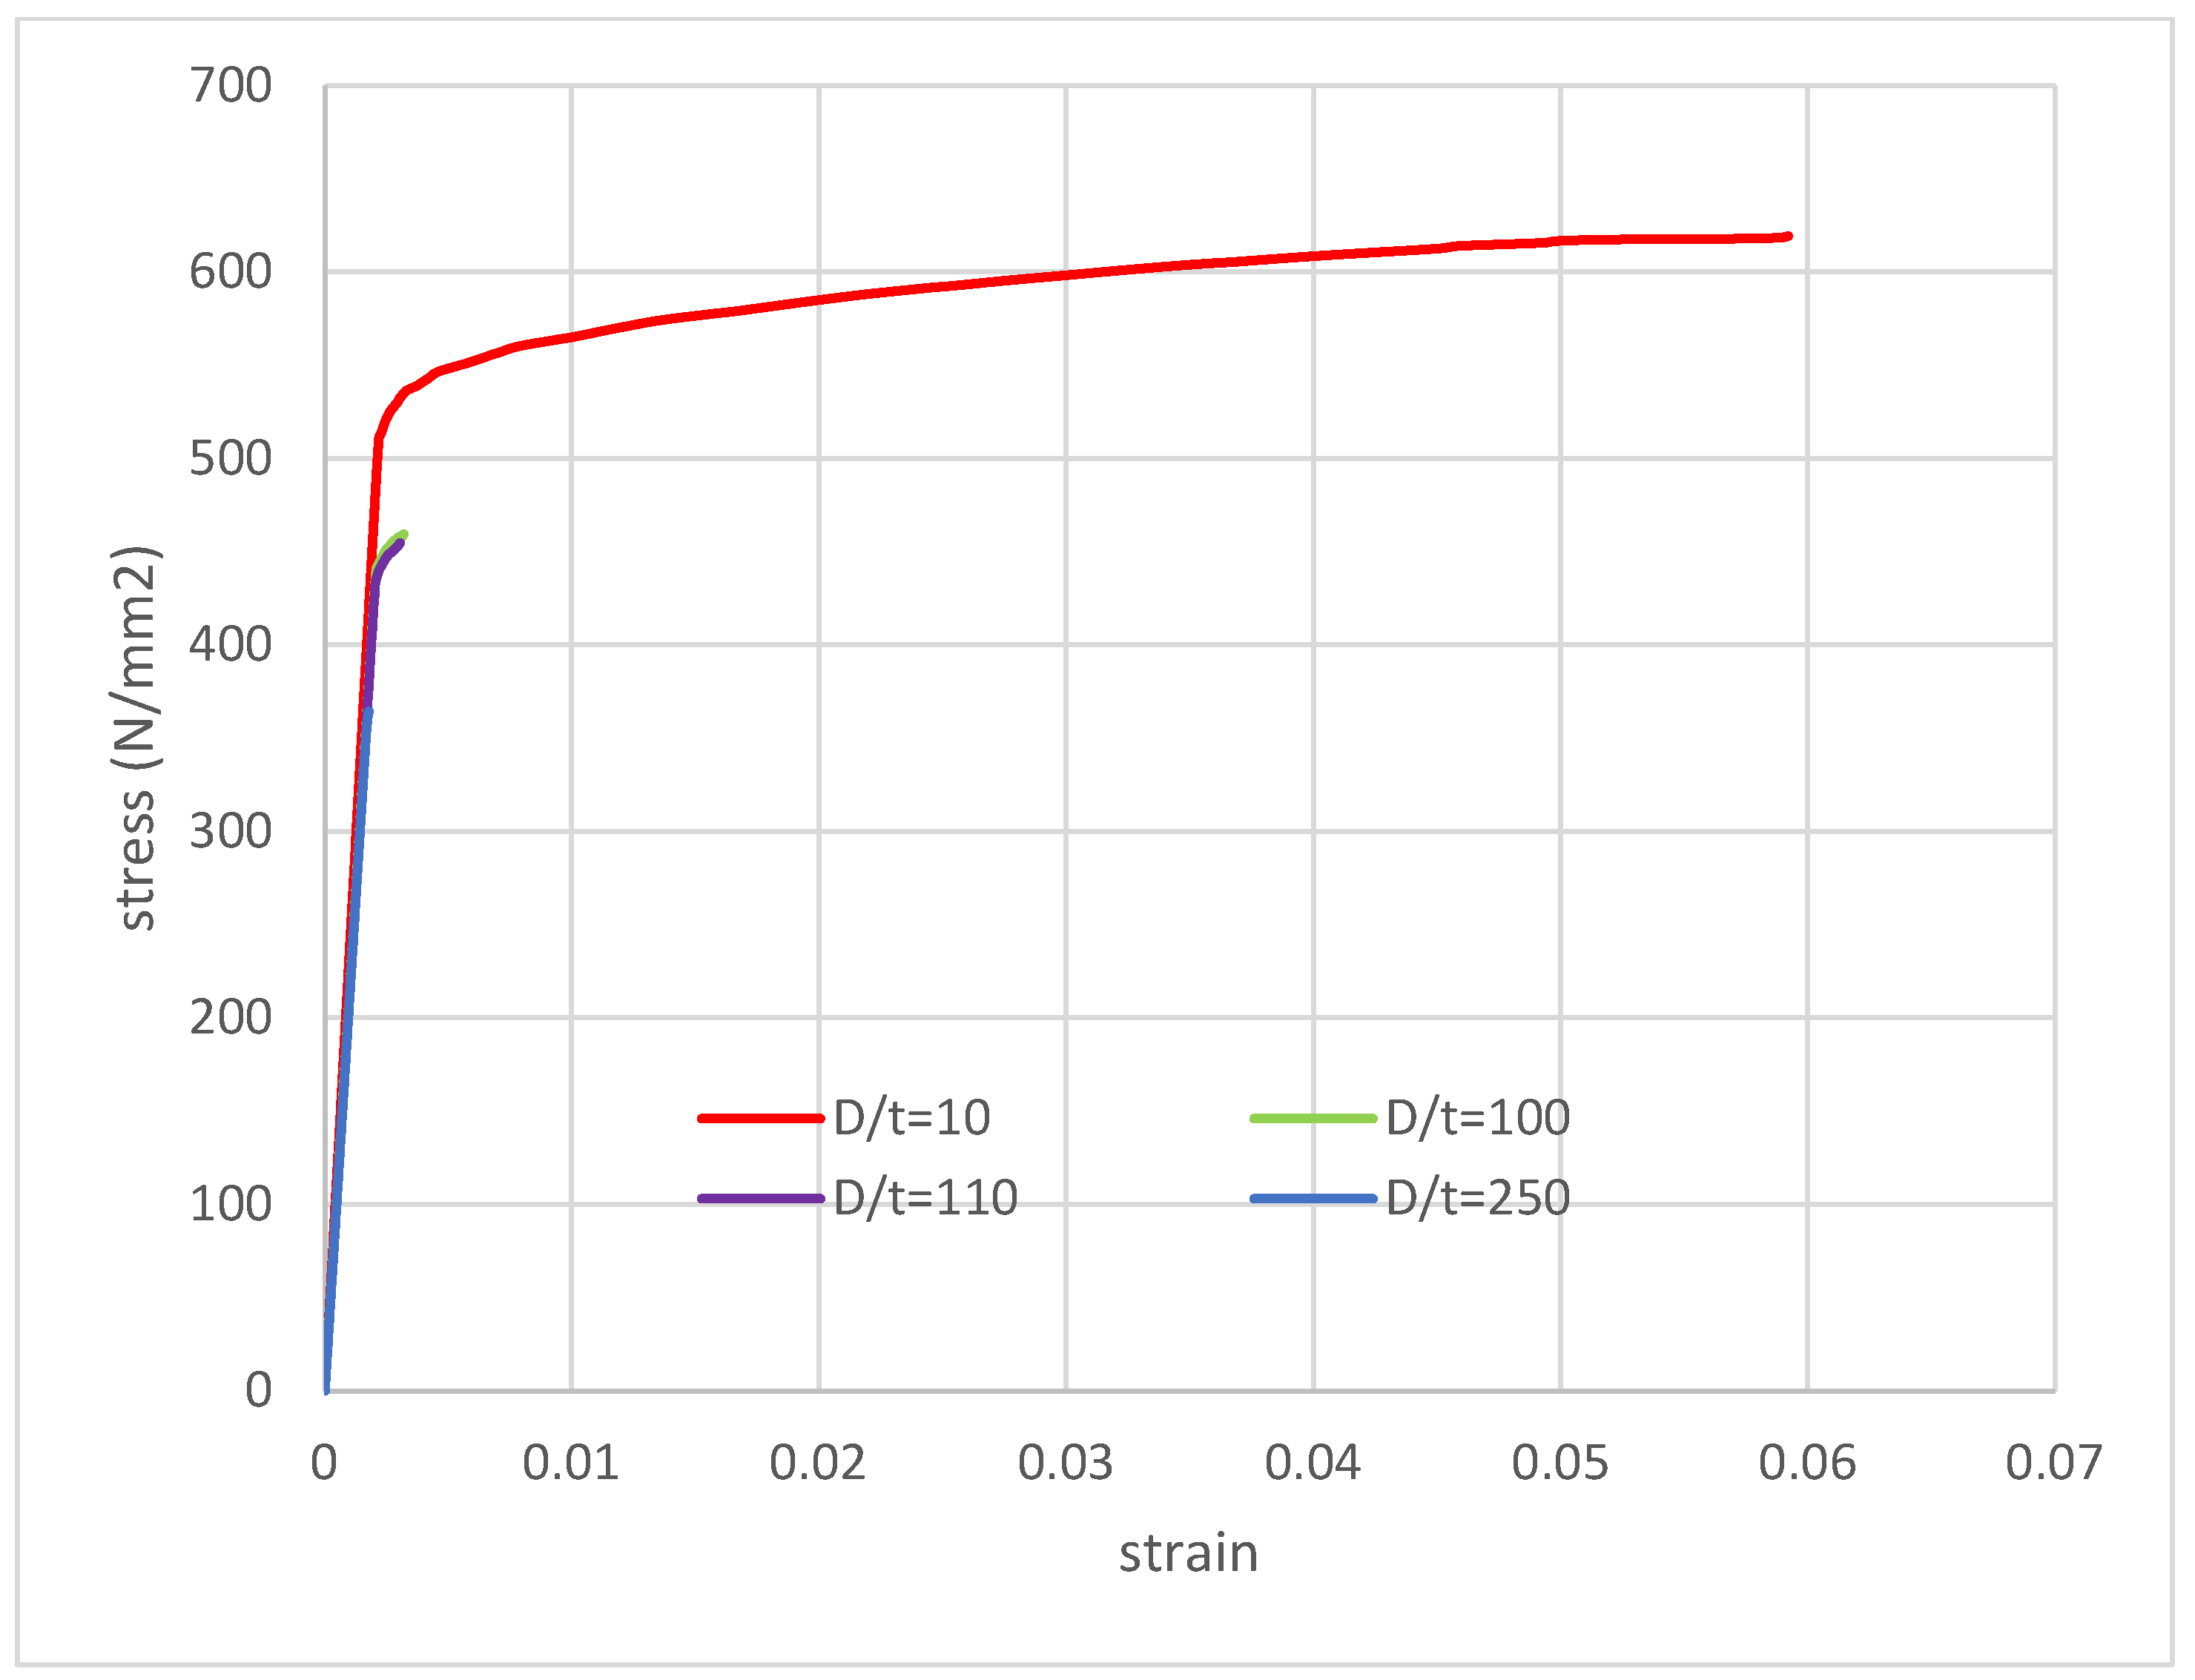
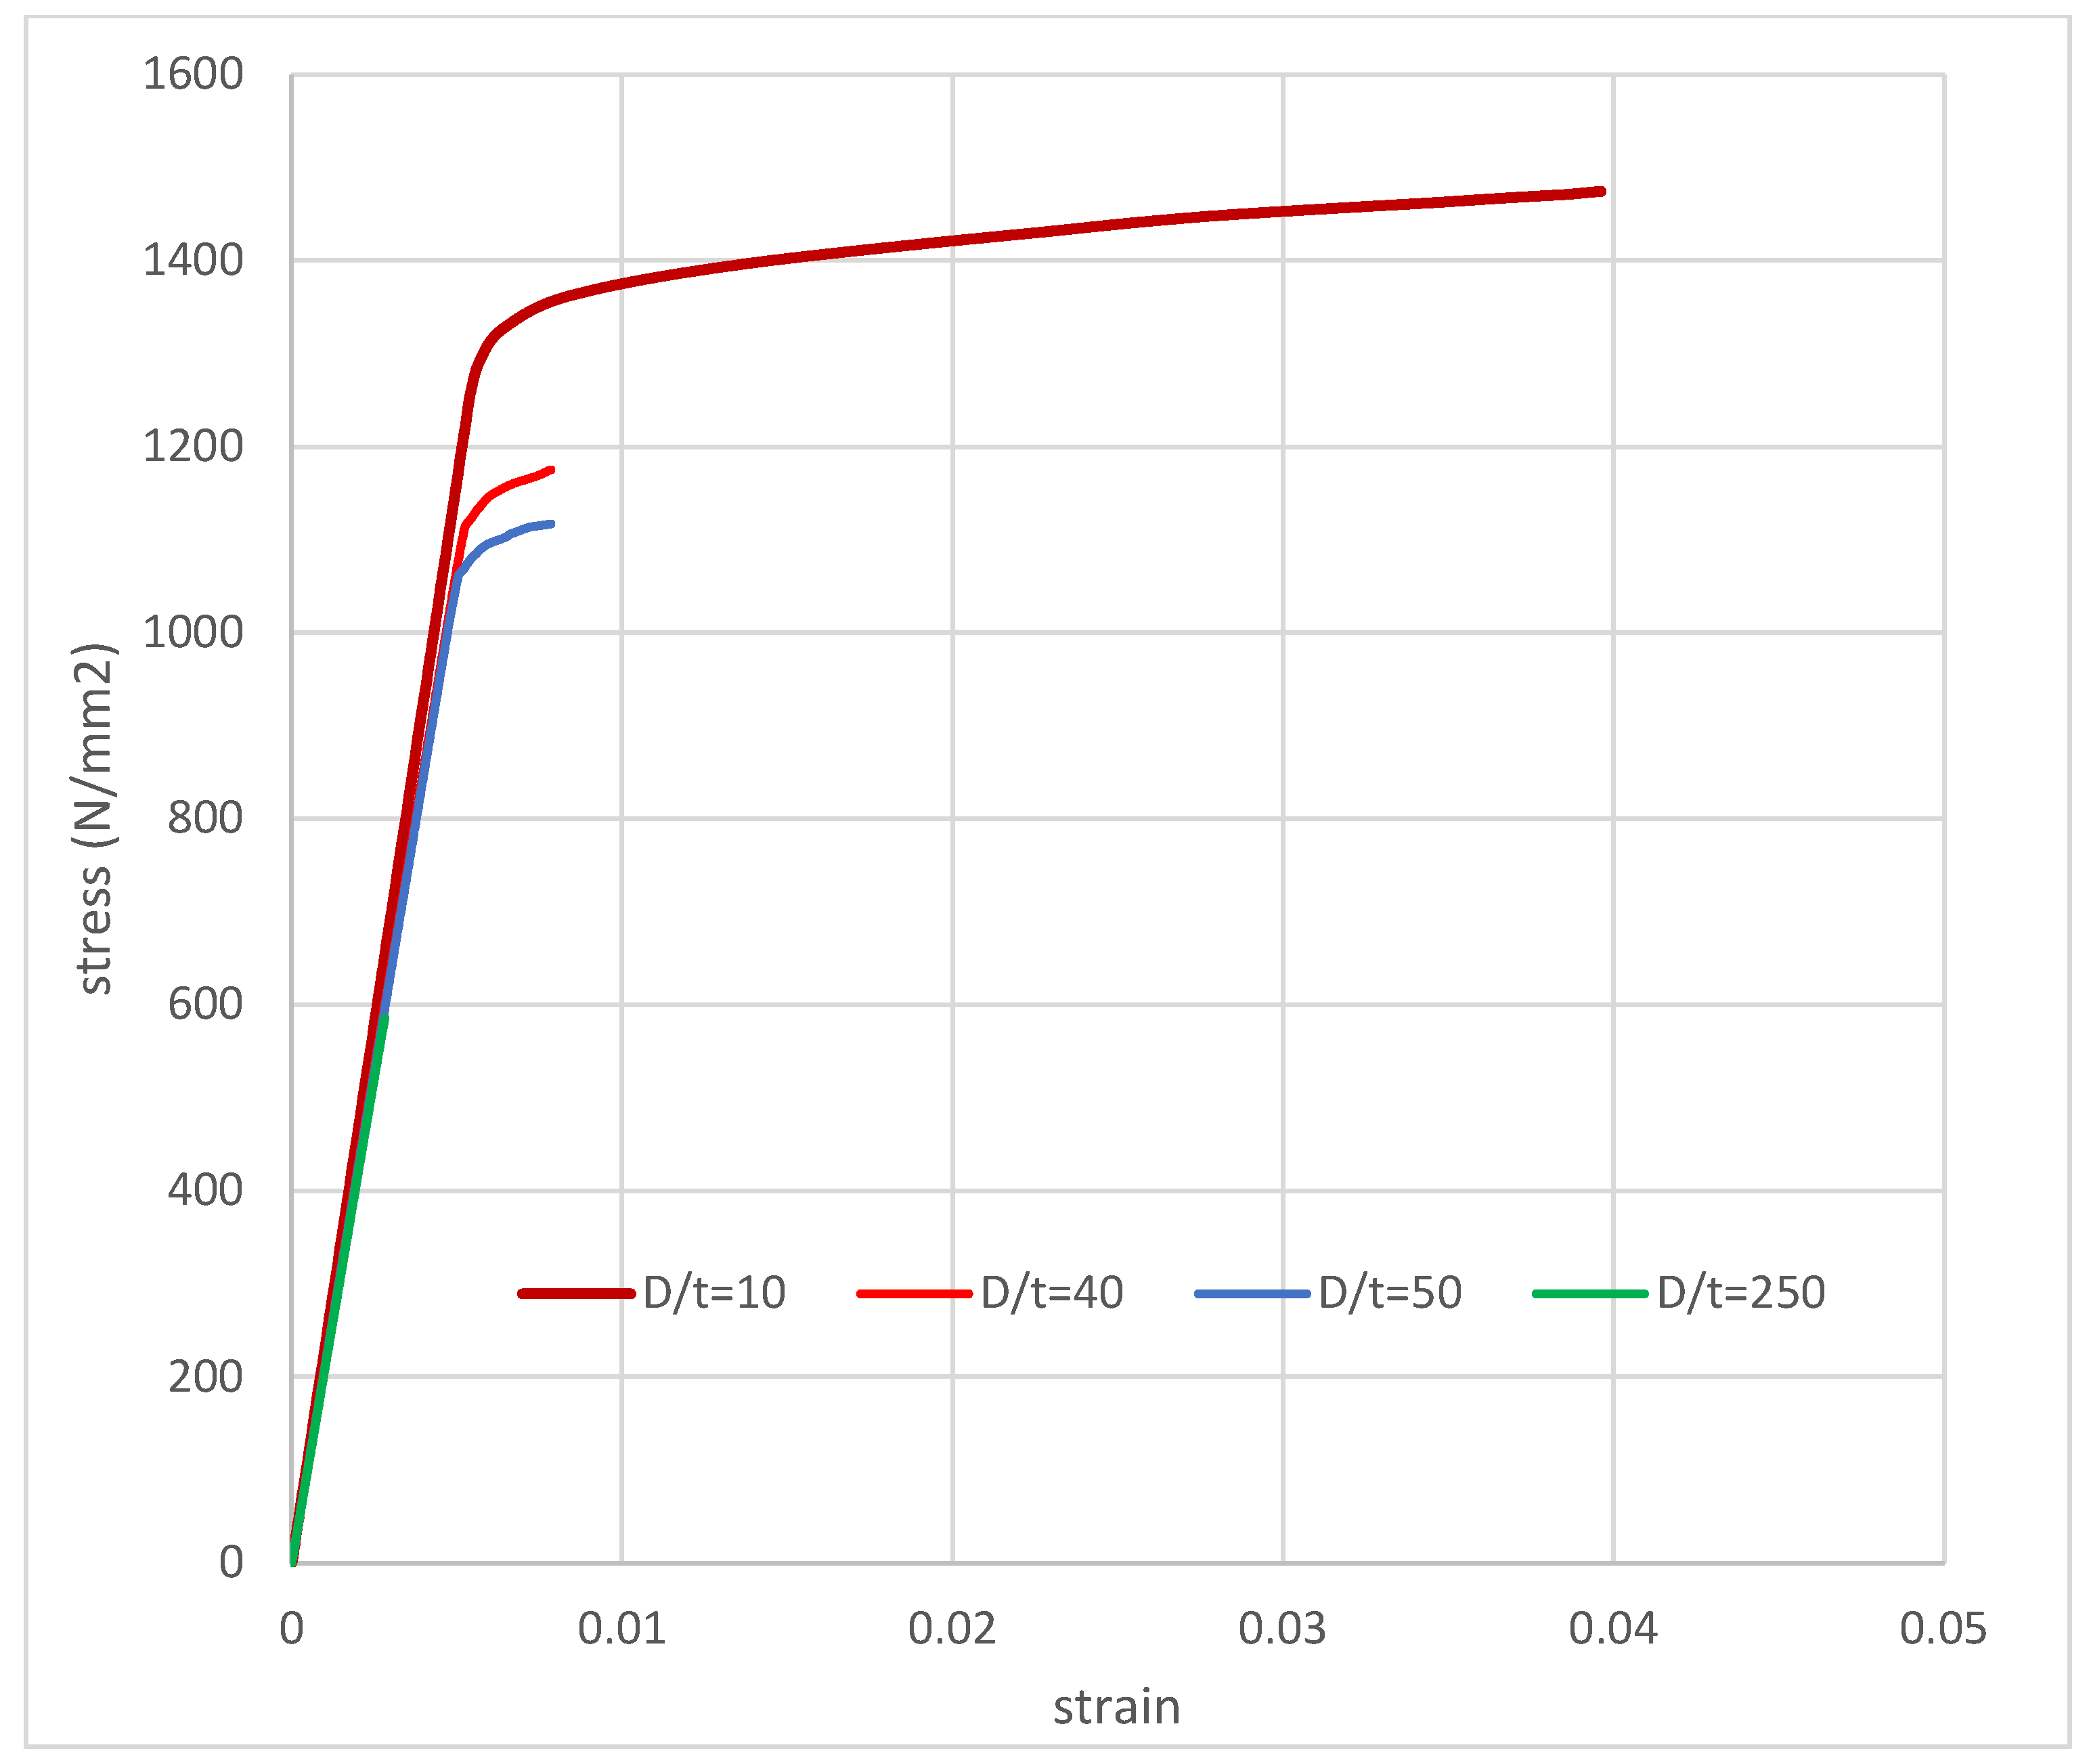
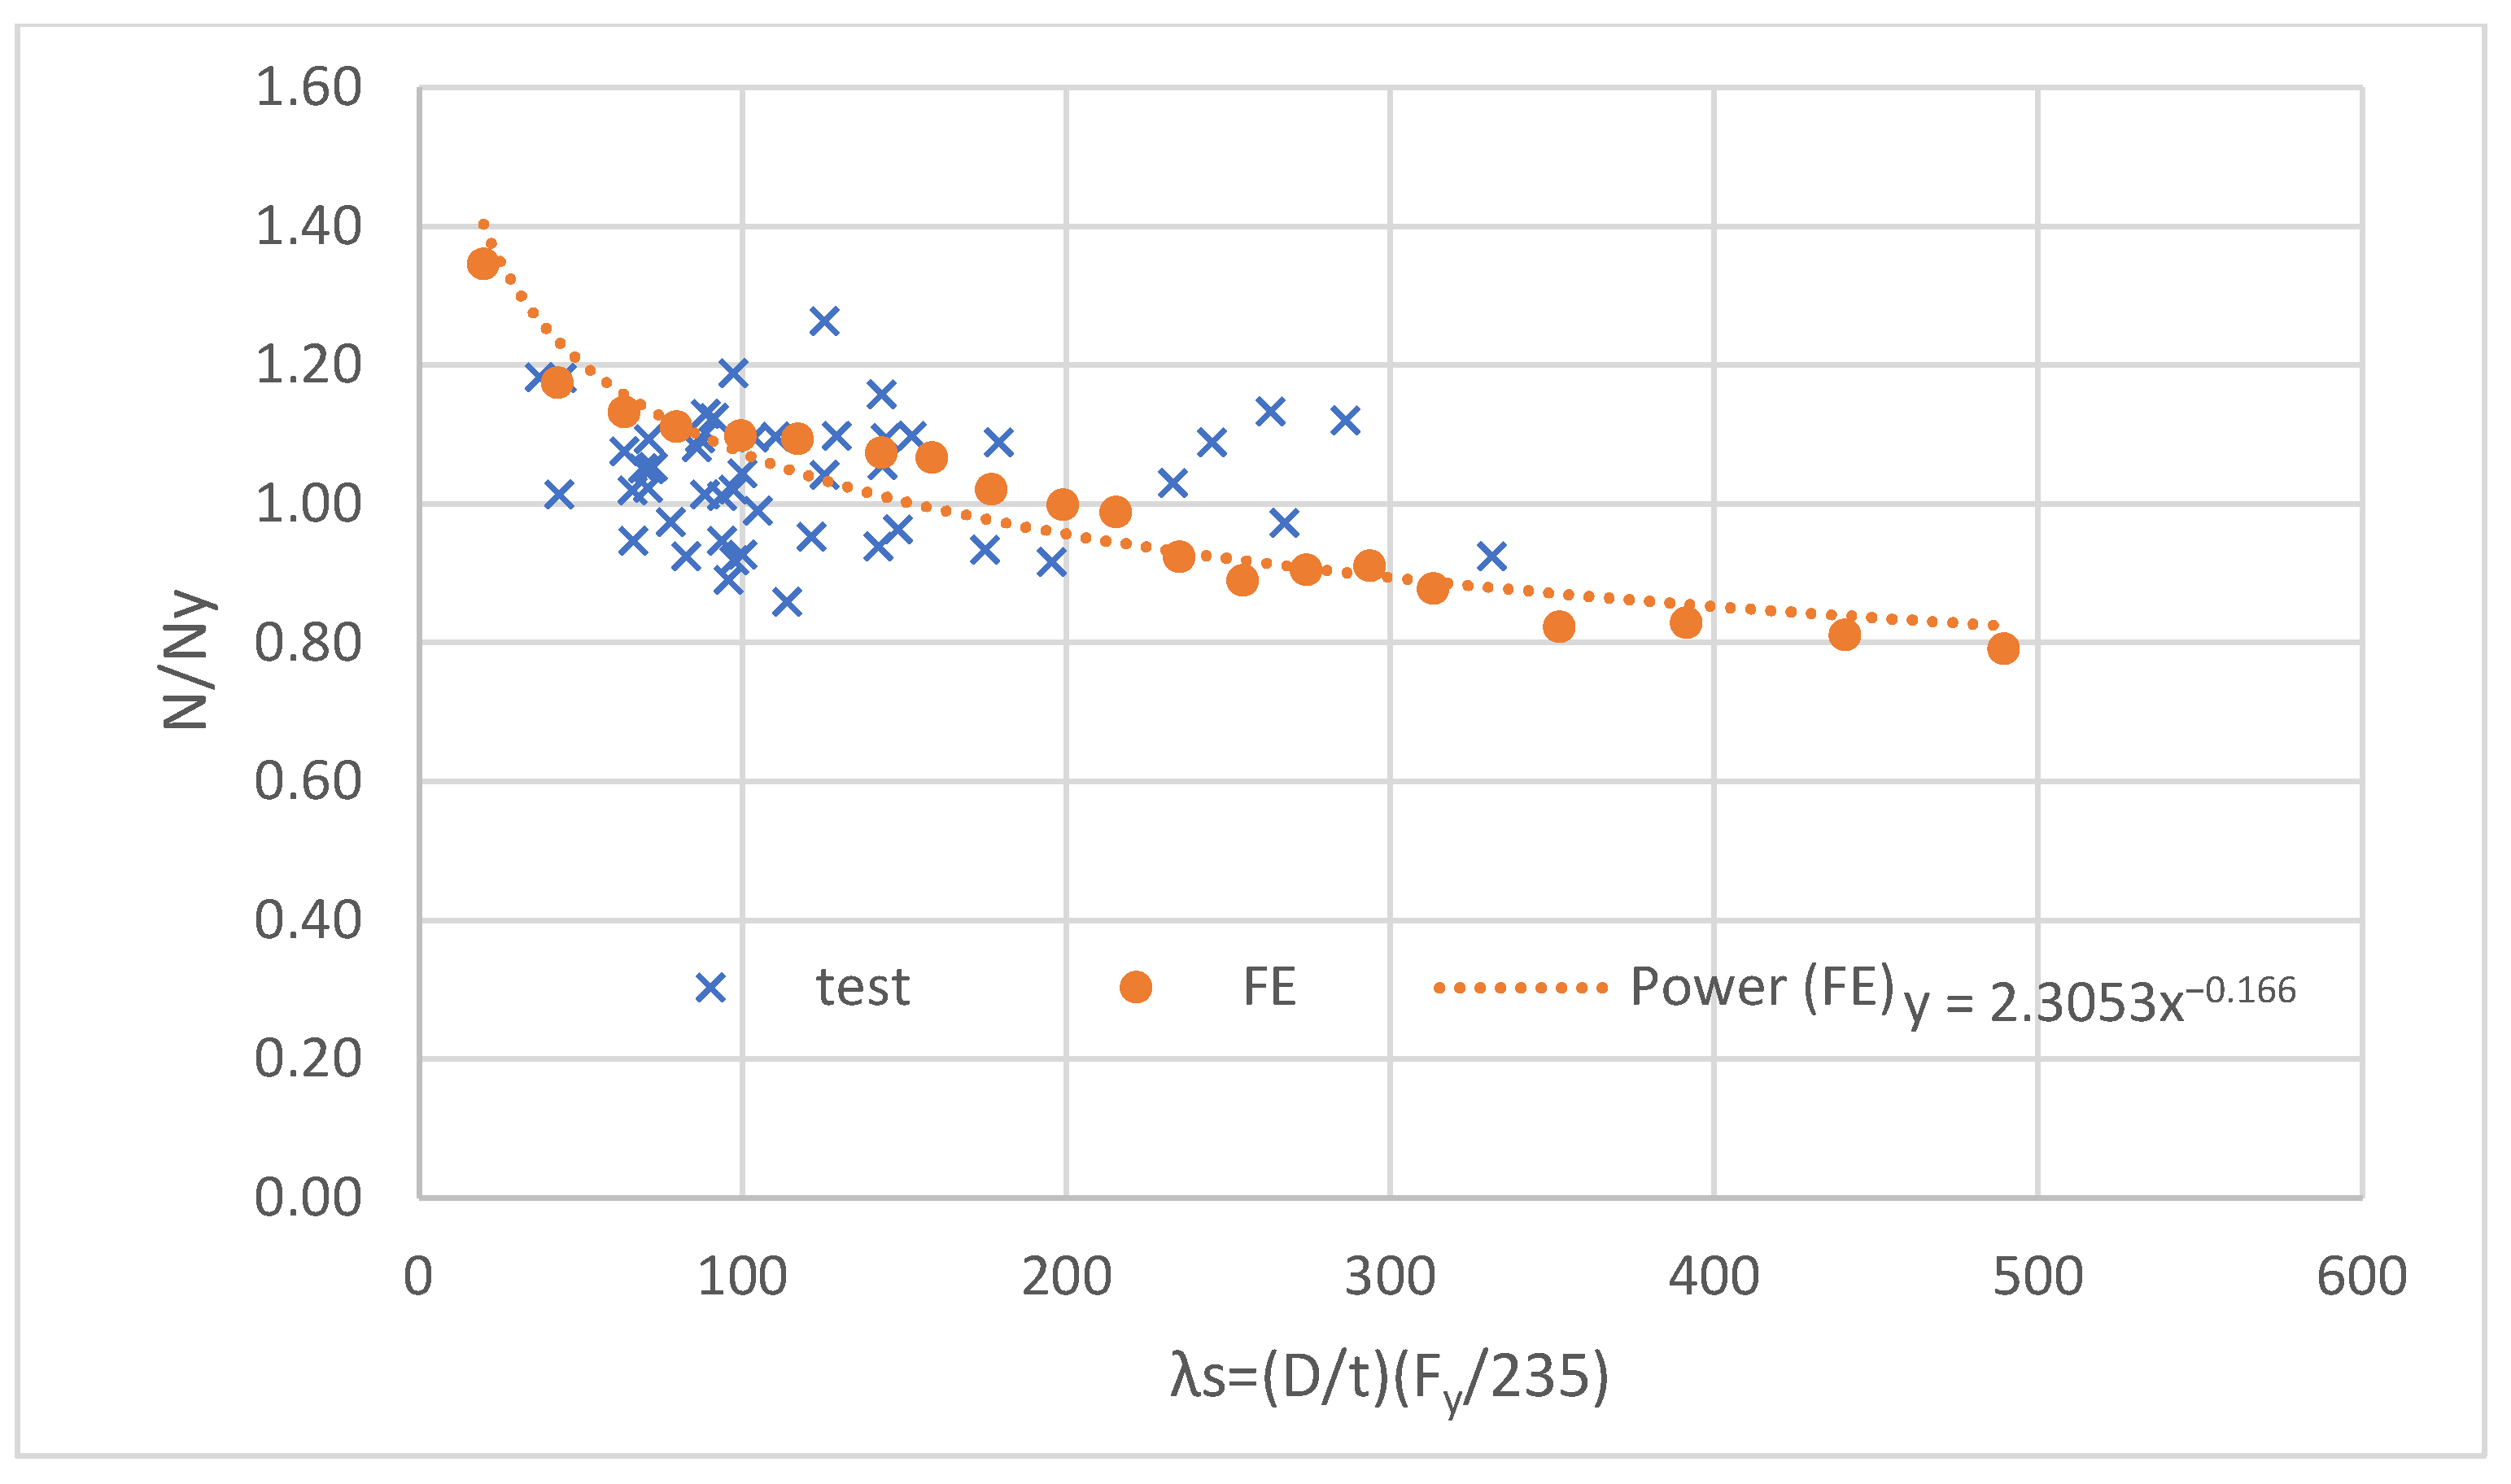
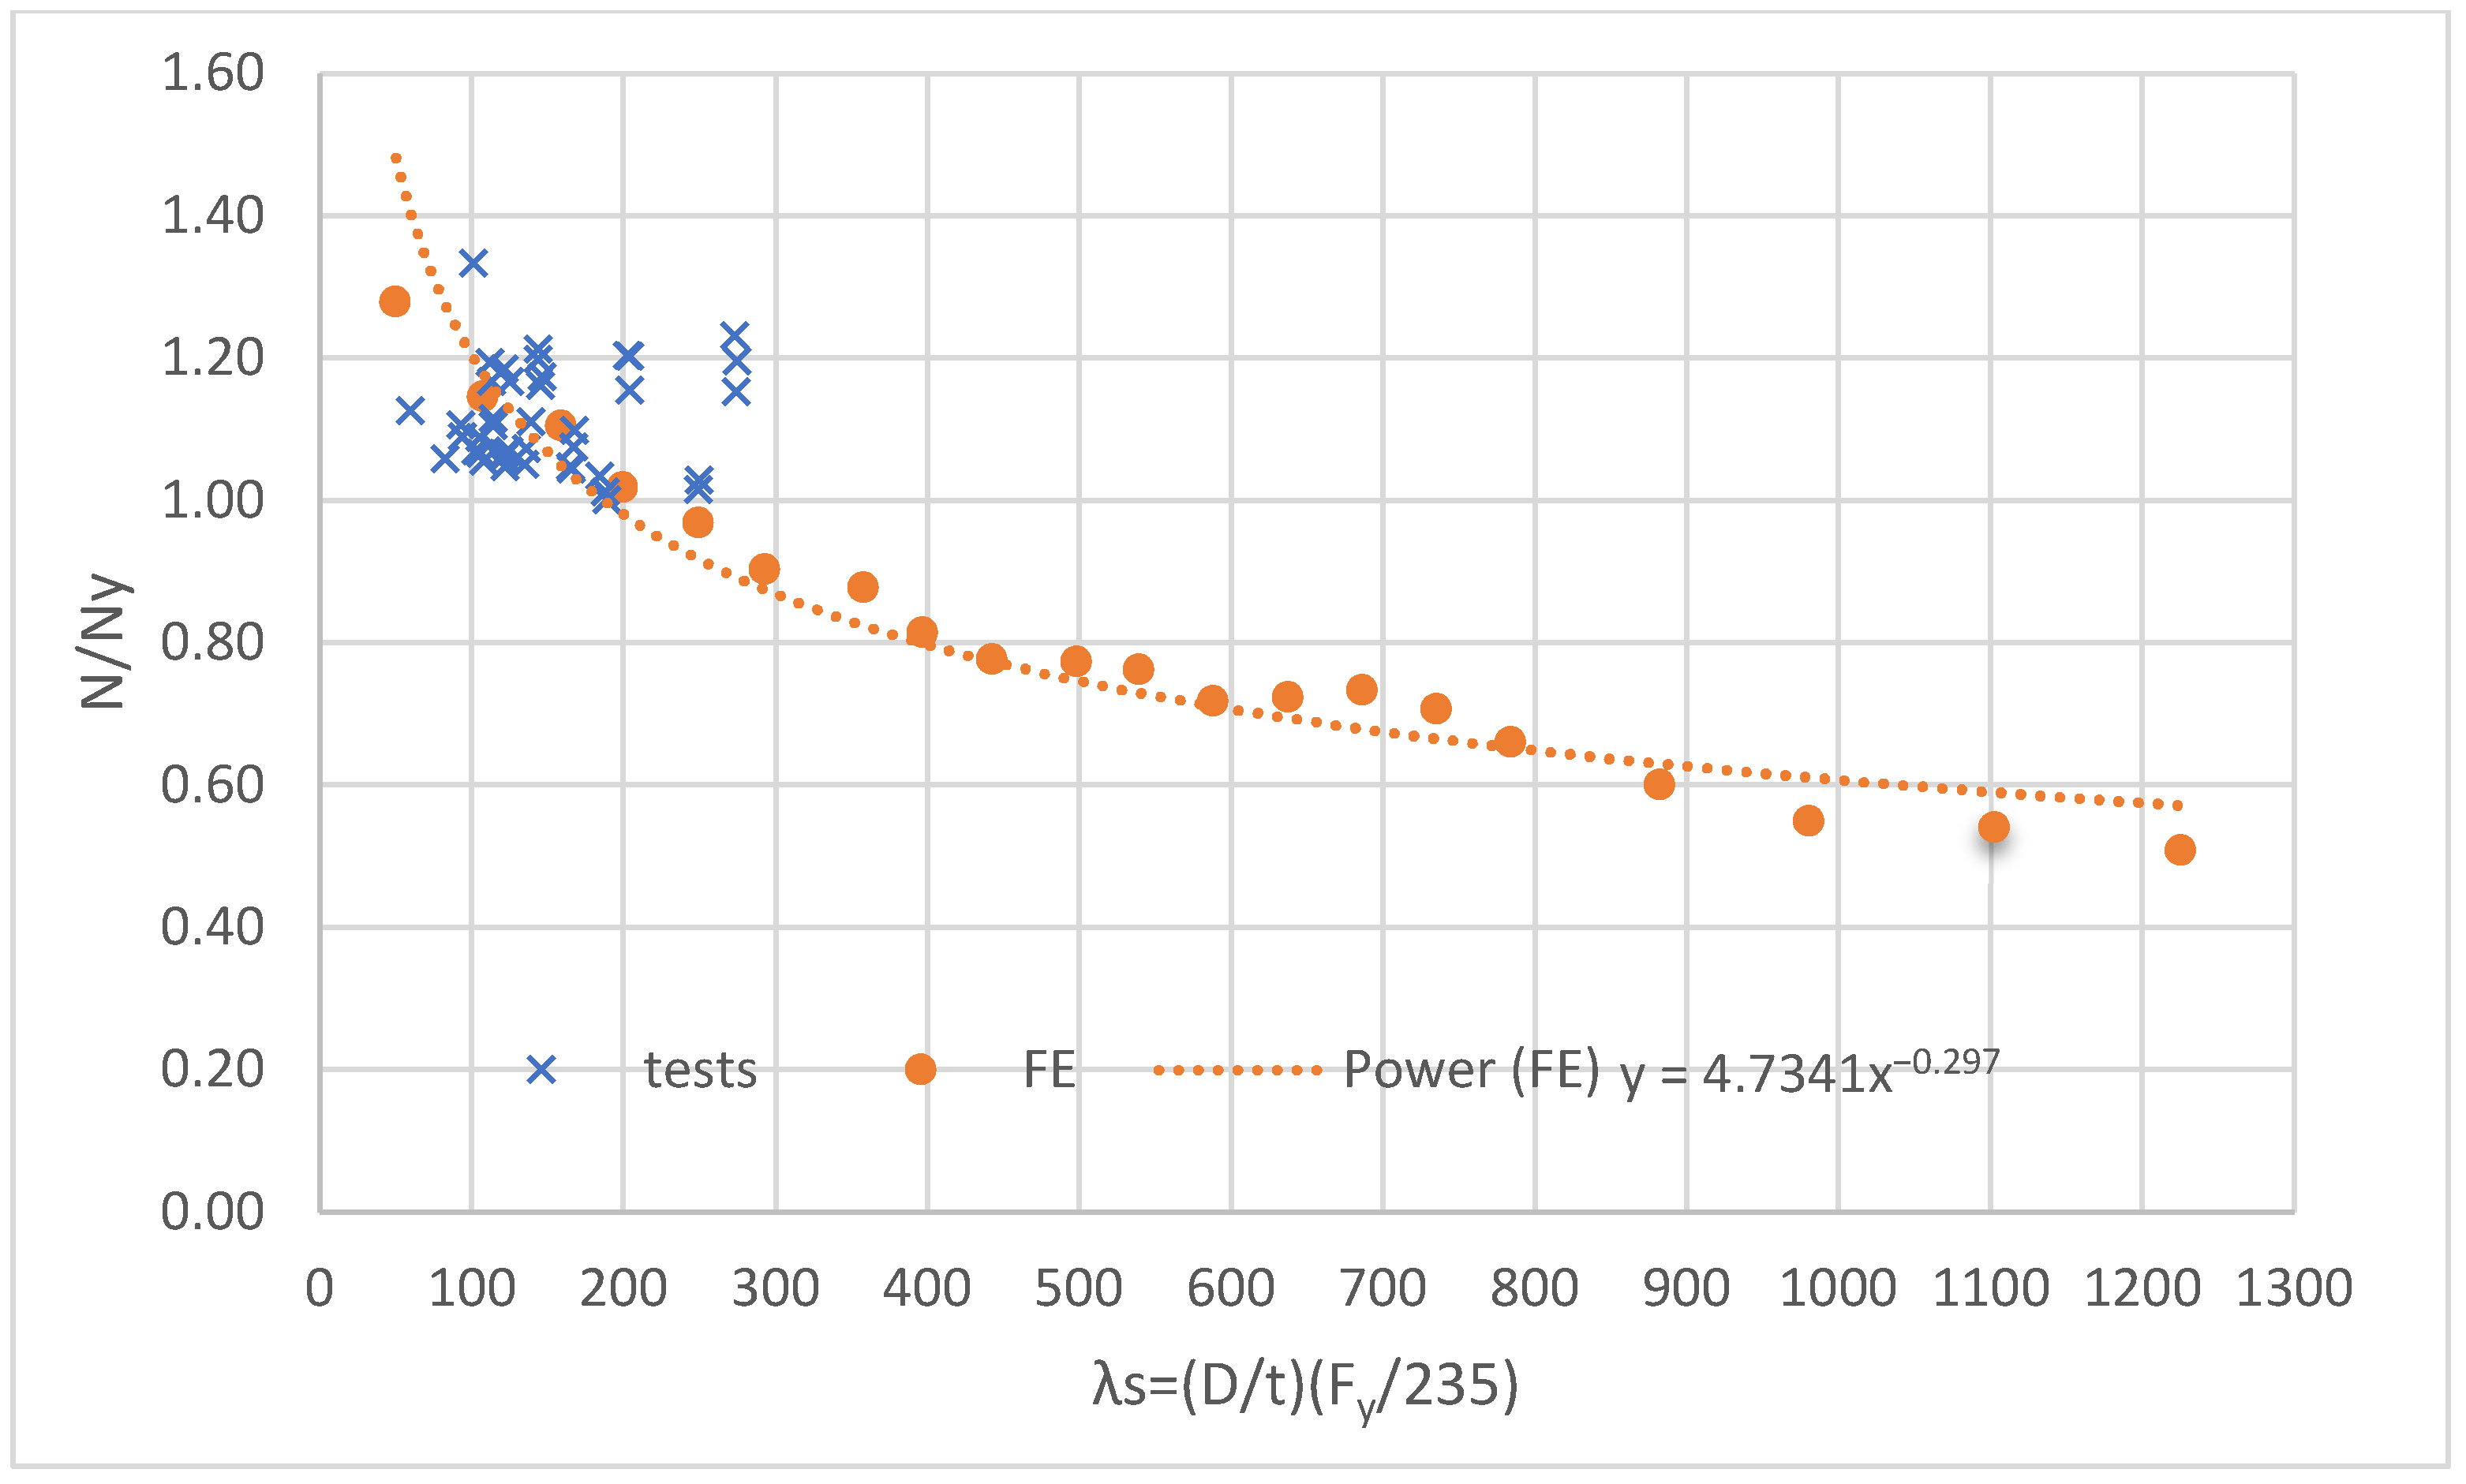
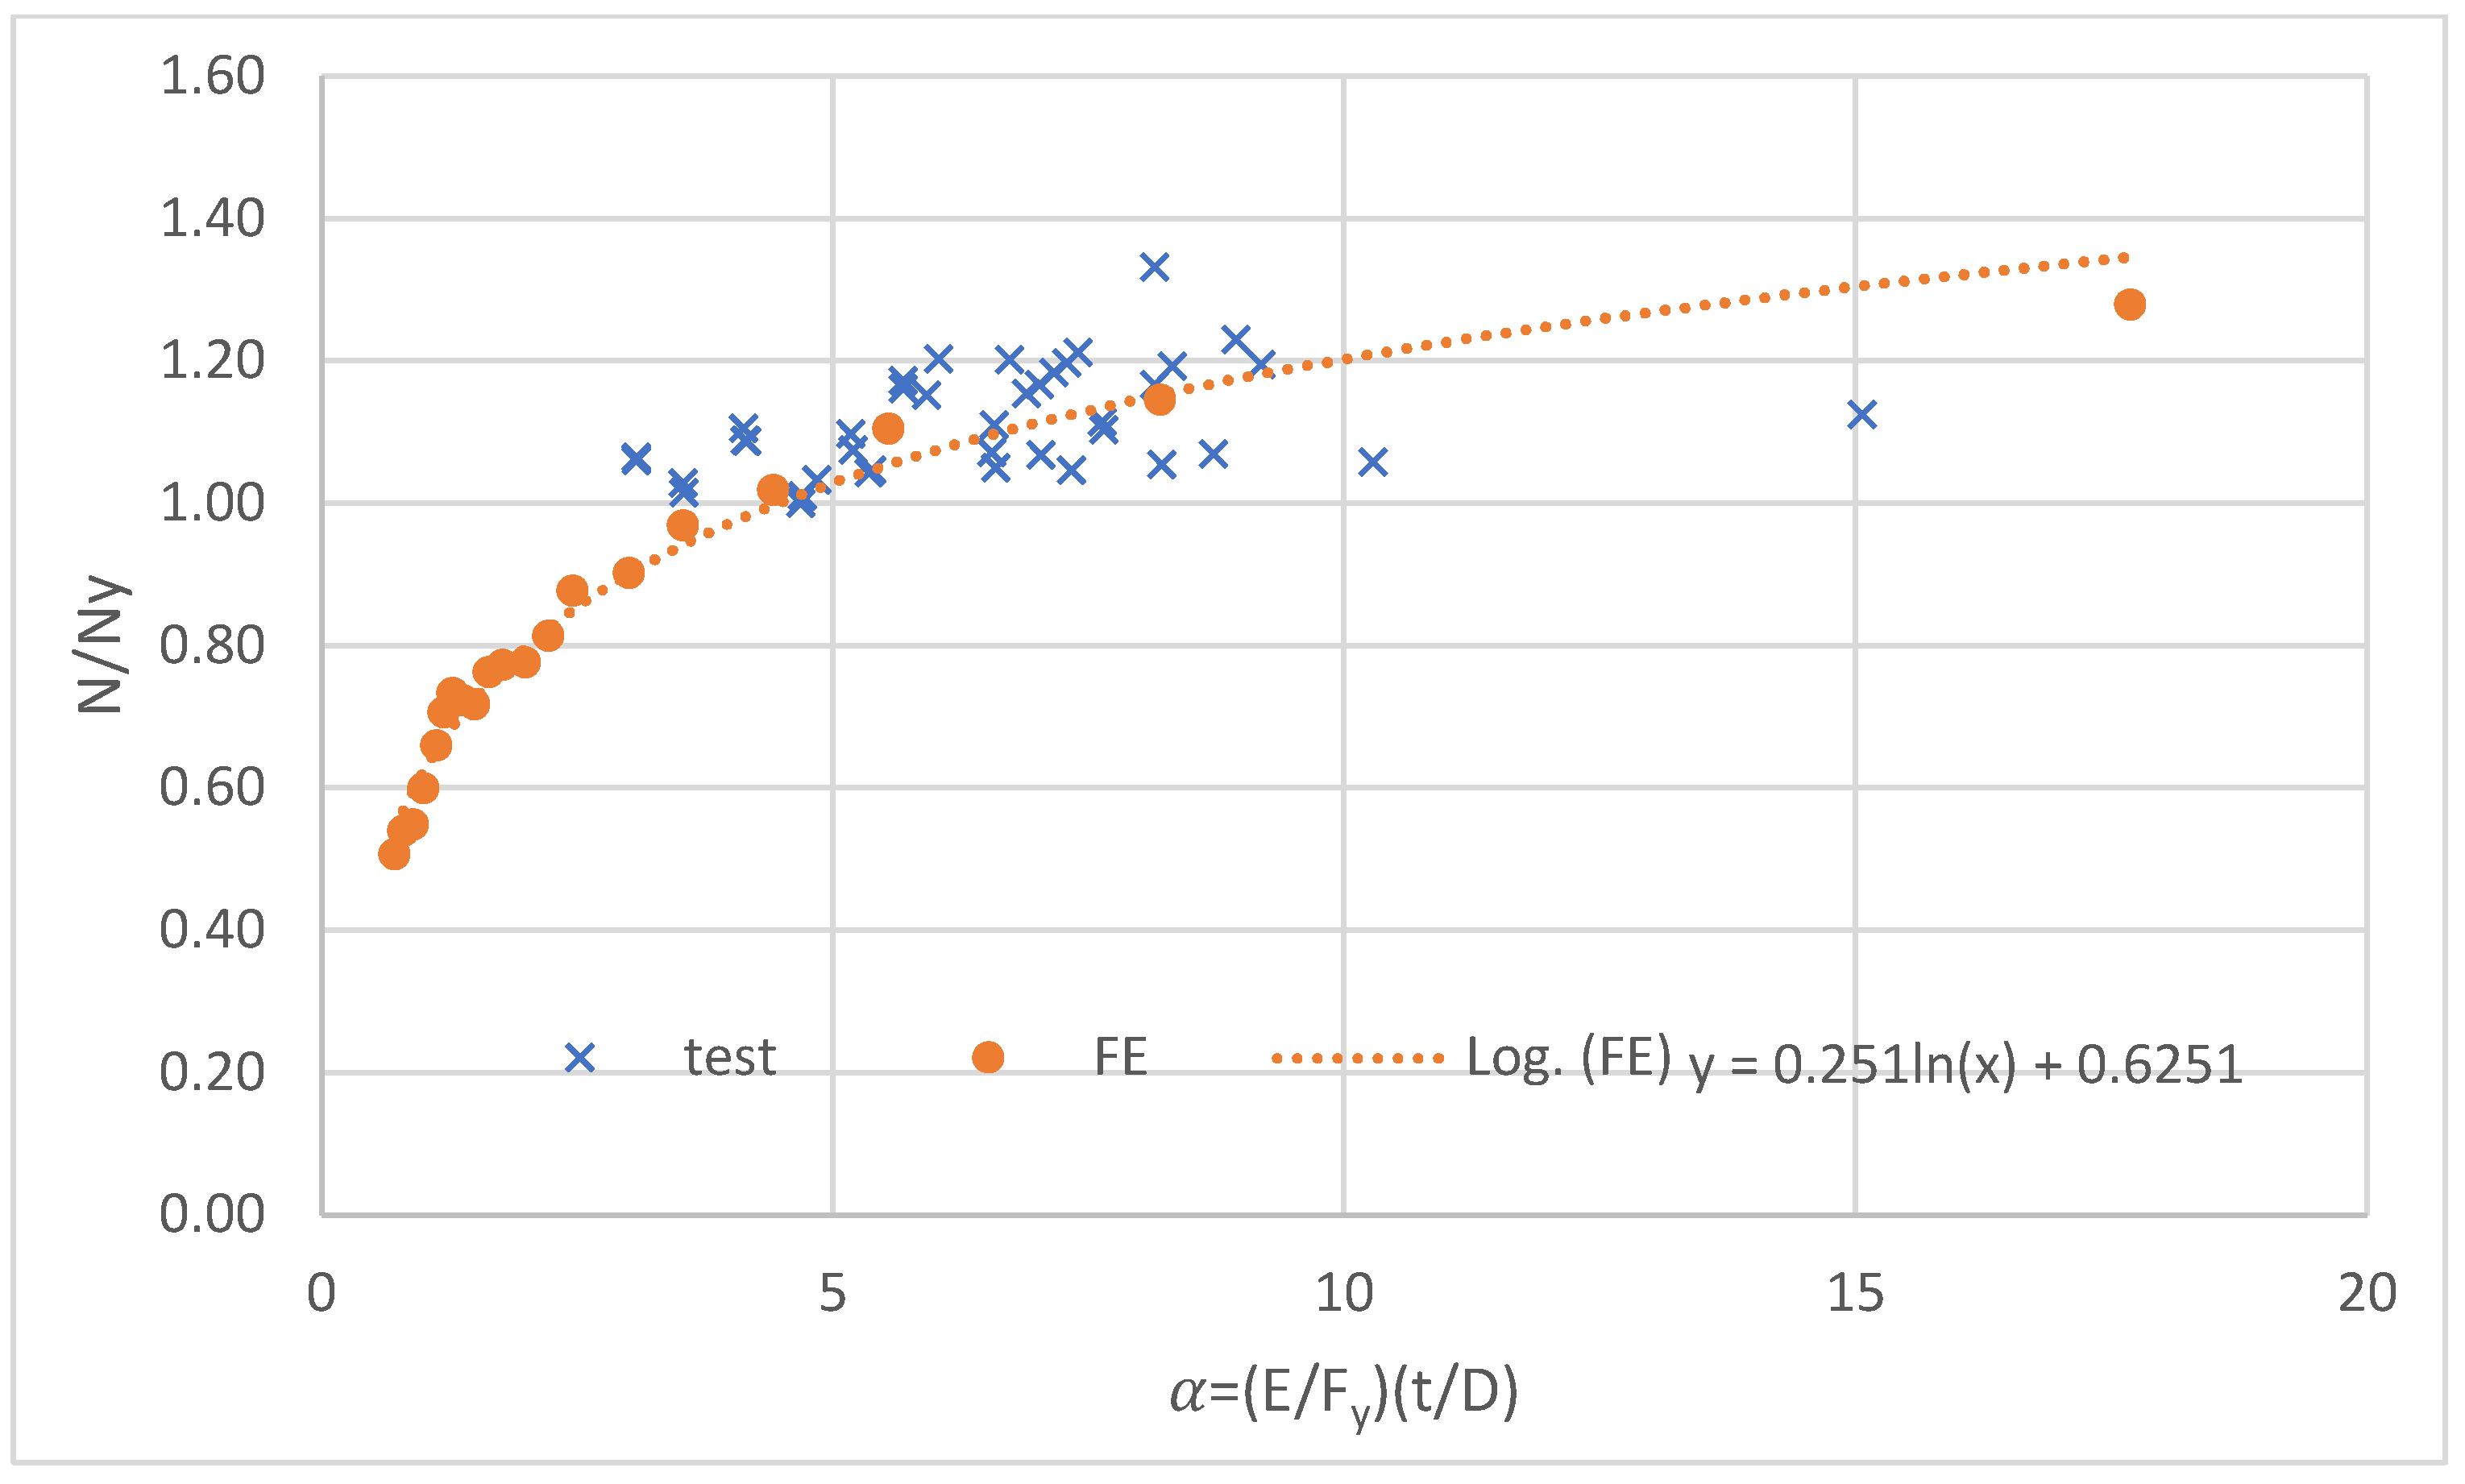
4.1. Finite Element Results and Discussion

Figure 9 and Figure 10 show stress distributions through the tube length and various specimen failure modes using a D / t ratio ranging between 10 to 250 HSS-S460 and UHSS-S1100, respectively. In general, it was observed that the position of failure for most of the specimens is located approximately at D / 4 away from the two ends. However, for specimens that have slender sections with D / t > 200 , it failed overall through its length.
It was observed that the tube’s outward deformation resembled an elephant’s foot buckle, with two prominent outward circumferential buckles occurring at the tube’s ends. The smooth outward deformation was the typical failure mode of tubes with D / t 100 for HSS-S460 and D / t 30 for UHSS-S1100, respectively, as shown in Figure 10 and Figure 11. This shape of buckling developed into a plastic mechanism. This failure is classified as a yield failure. The reason for this shape of deformation is that at this range of D / t , the specimens are in the hardening stage when they reach their peak load.
Figure 11 and Figure 12 show the relation between stress–vertical strain curves of different specimens with D / t ratios ranging between 10 to 250 for HSS-S460 and UHSS-S1100, respectively. It is shown that the value of maximum stresses can exceed the yield value and reach the value of its ultimate stress for specimen tubes with D / t 100 for HSS-S460 and D / t 30 for UHSS-S1100, respectively. Therefore, according to the outcomes of this numerical analysis, it is concluded that specimens with D / t up to 100 or 30 for HSS-S460 or UHSS-S1100, respectively, behave as non-slender sections. This is completely different from what is inferred from slenderness limits according to Euro Code and American Specification AISC as detailed in the previous subtitle, where the section is classified as a non-slender section when D / t is up to 46 or 18 for HSS-S460 or UHSS-S1100, respectively. Figure 12 shows that the vertical strain of specimens from high-strength steel (S460) HSS-S460 ranged from 5.93% to 0.6 % for D / t = 10 to D / t = 100 , respectively, whereas it is equal to 3.96% and 0.75% for D / t = 10 and 30, respectively, for specimens from very high-strength steel (S1100), i.e., when D / t increases the ductility decreases.
For specimen tubes with D / t 110 for HSS-S460 and D / t 40 for UHSS-S1100, respectively, it is found that the outward deformations were like an elephant’s foot buckle that occurred at the two ends as the previous specimens but with little shape. In addition, there are sharp deformations occurring along the length of each tube typical of the failure mode of slender tubes due to local buckling behavior as shown in Figure 9 and Figure 10, respectively. All these types of specimens in this range of D / t were not able to reach their yield stress as shown in Figure 12 and Figure 13 because they failed in the elastic stage due to local buckling. It is concluded that these specimens behave as slender tubes.

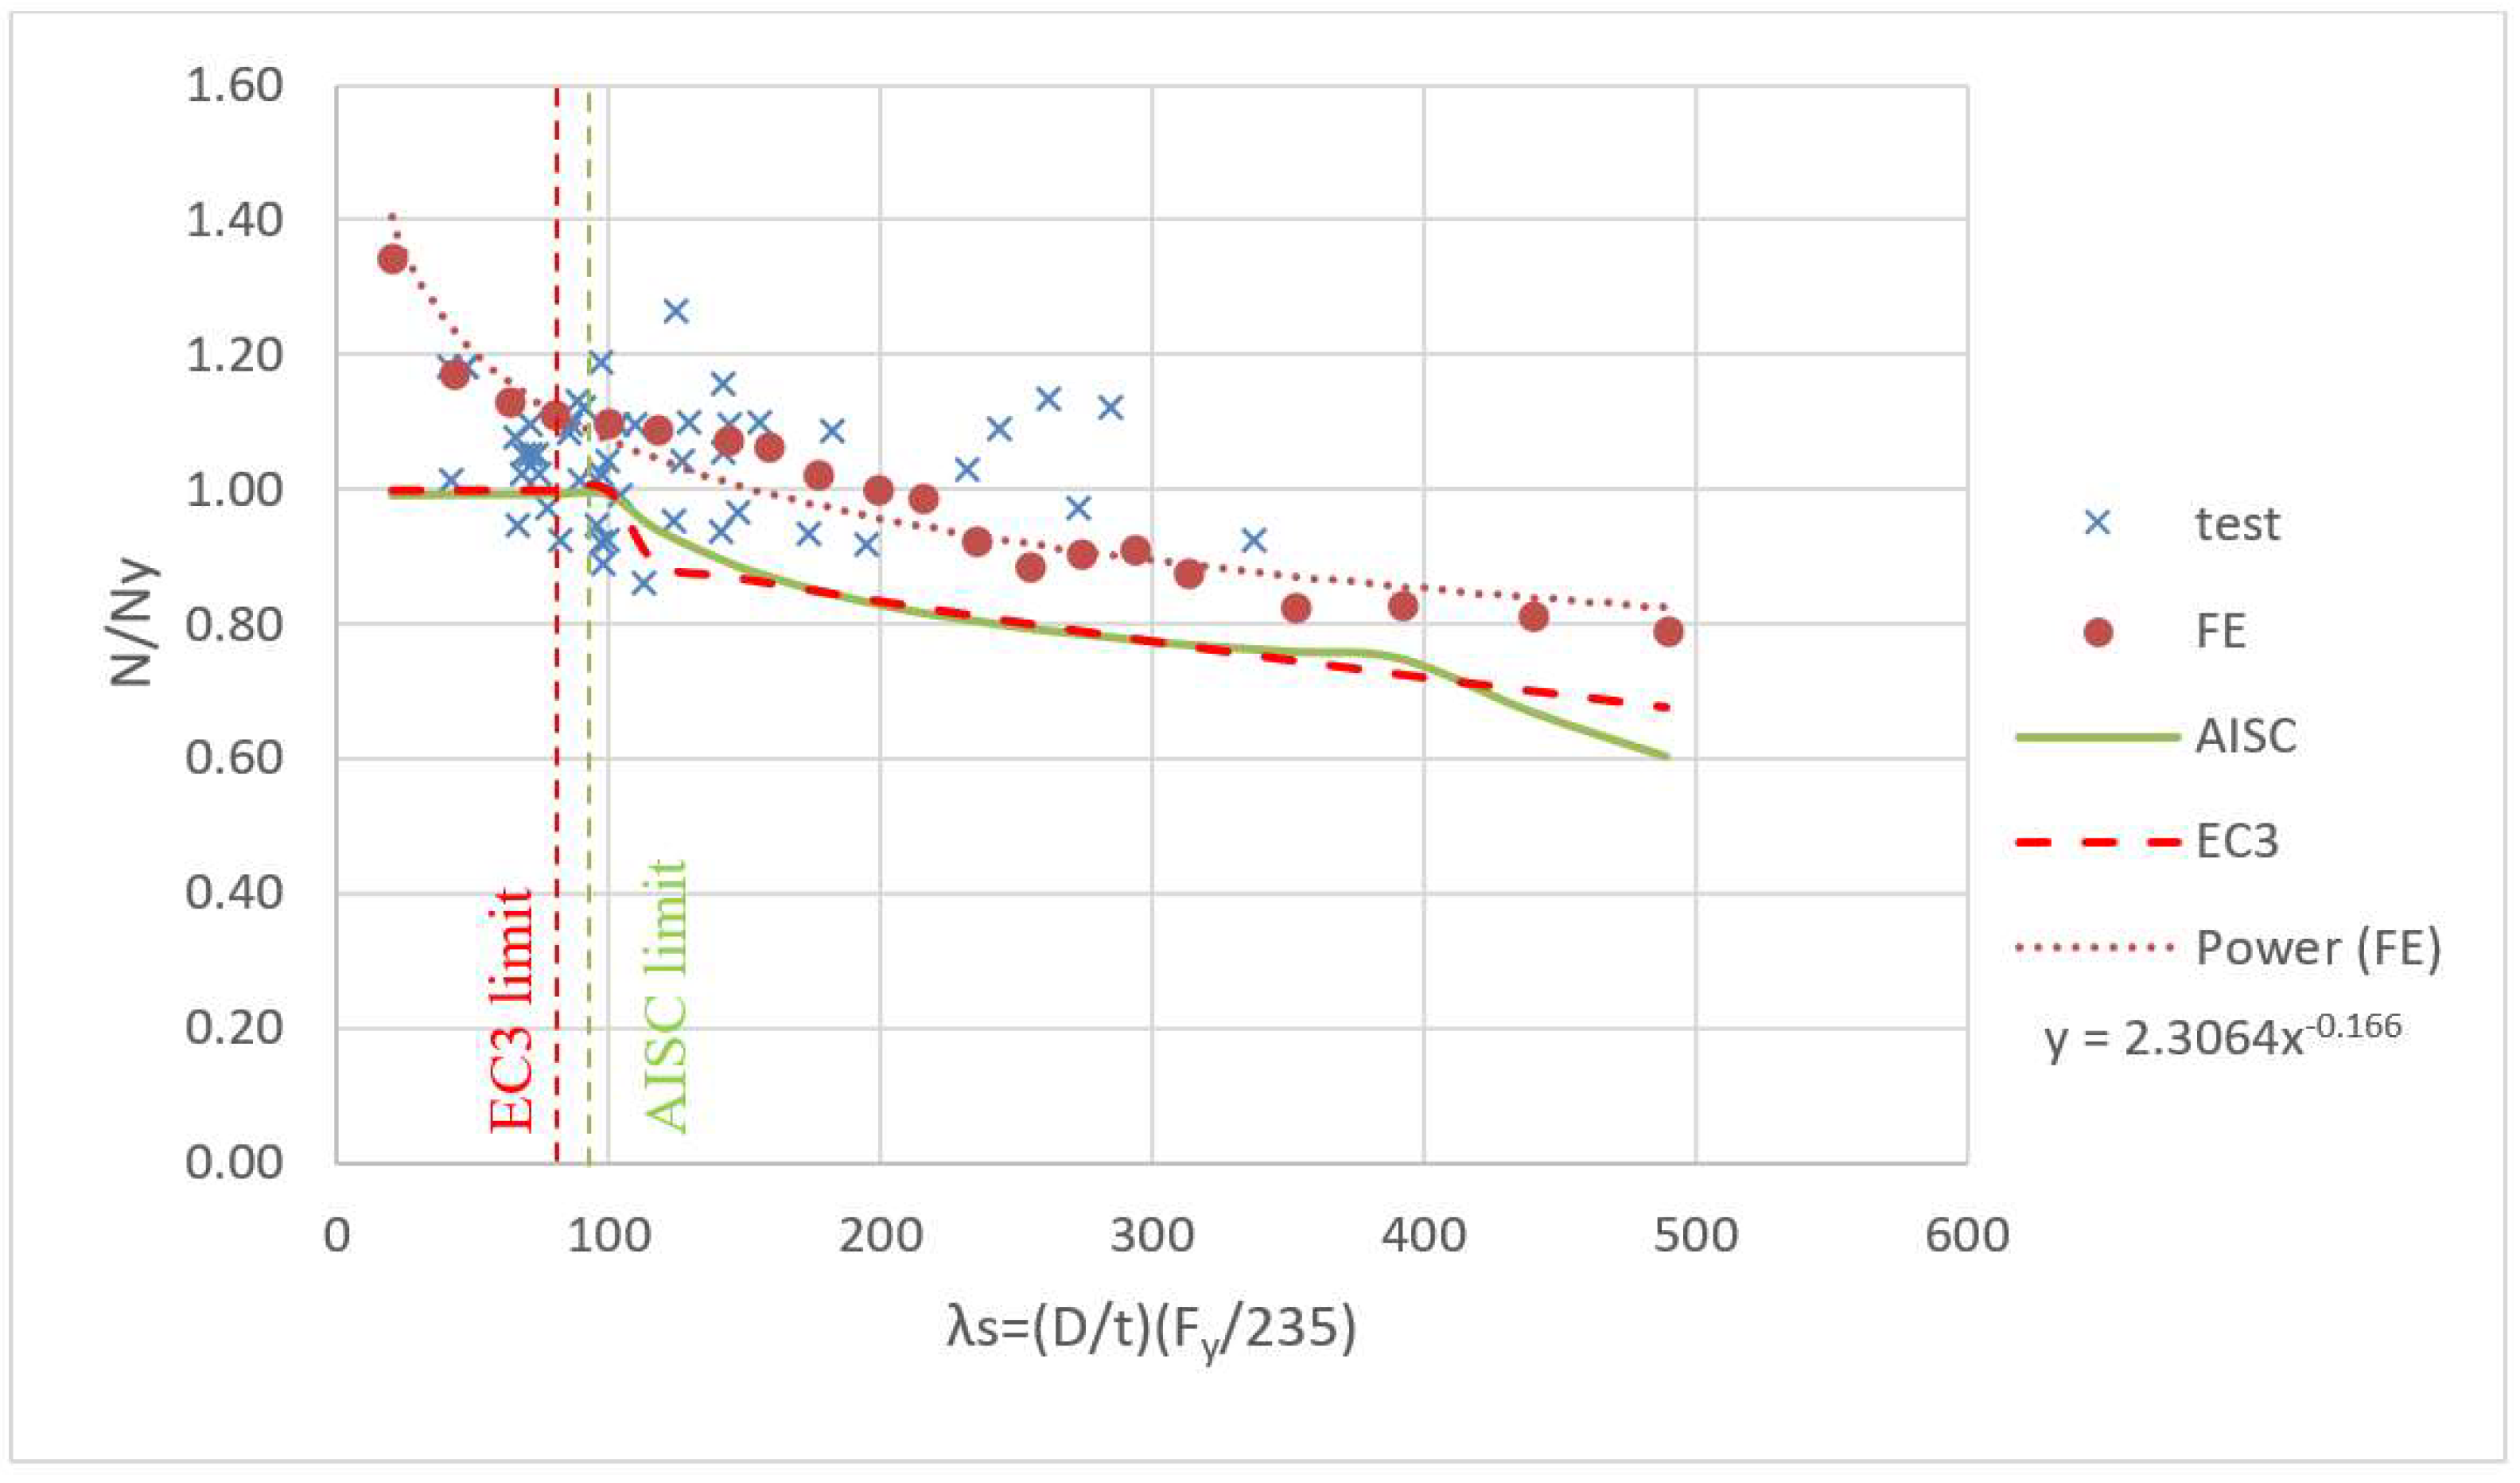
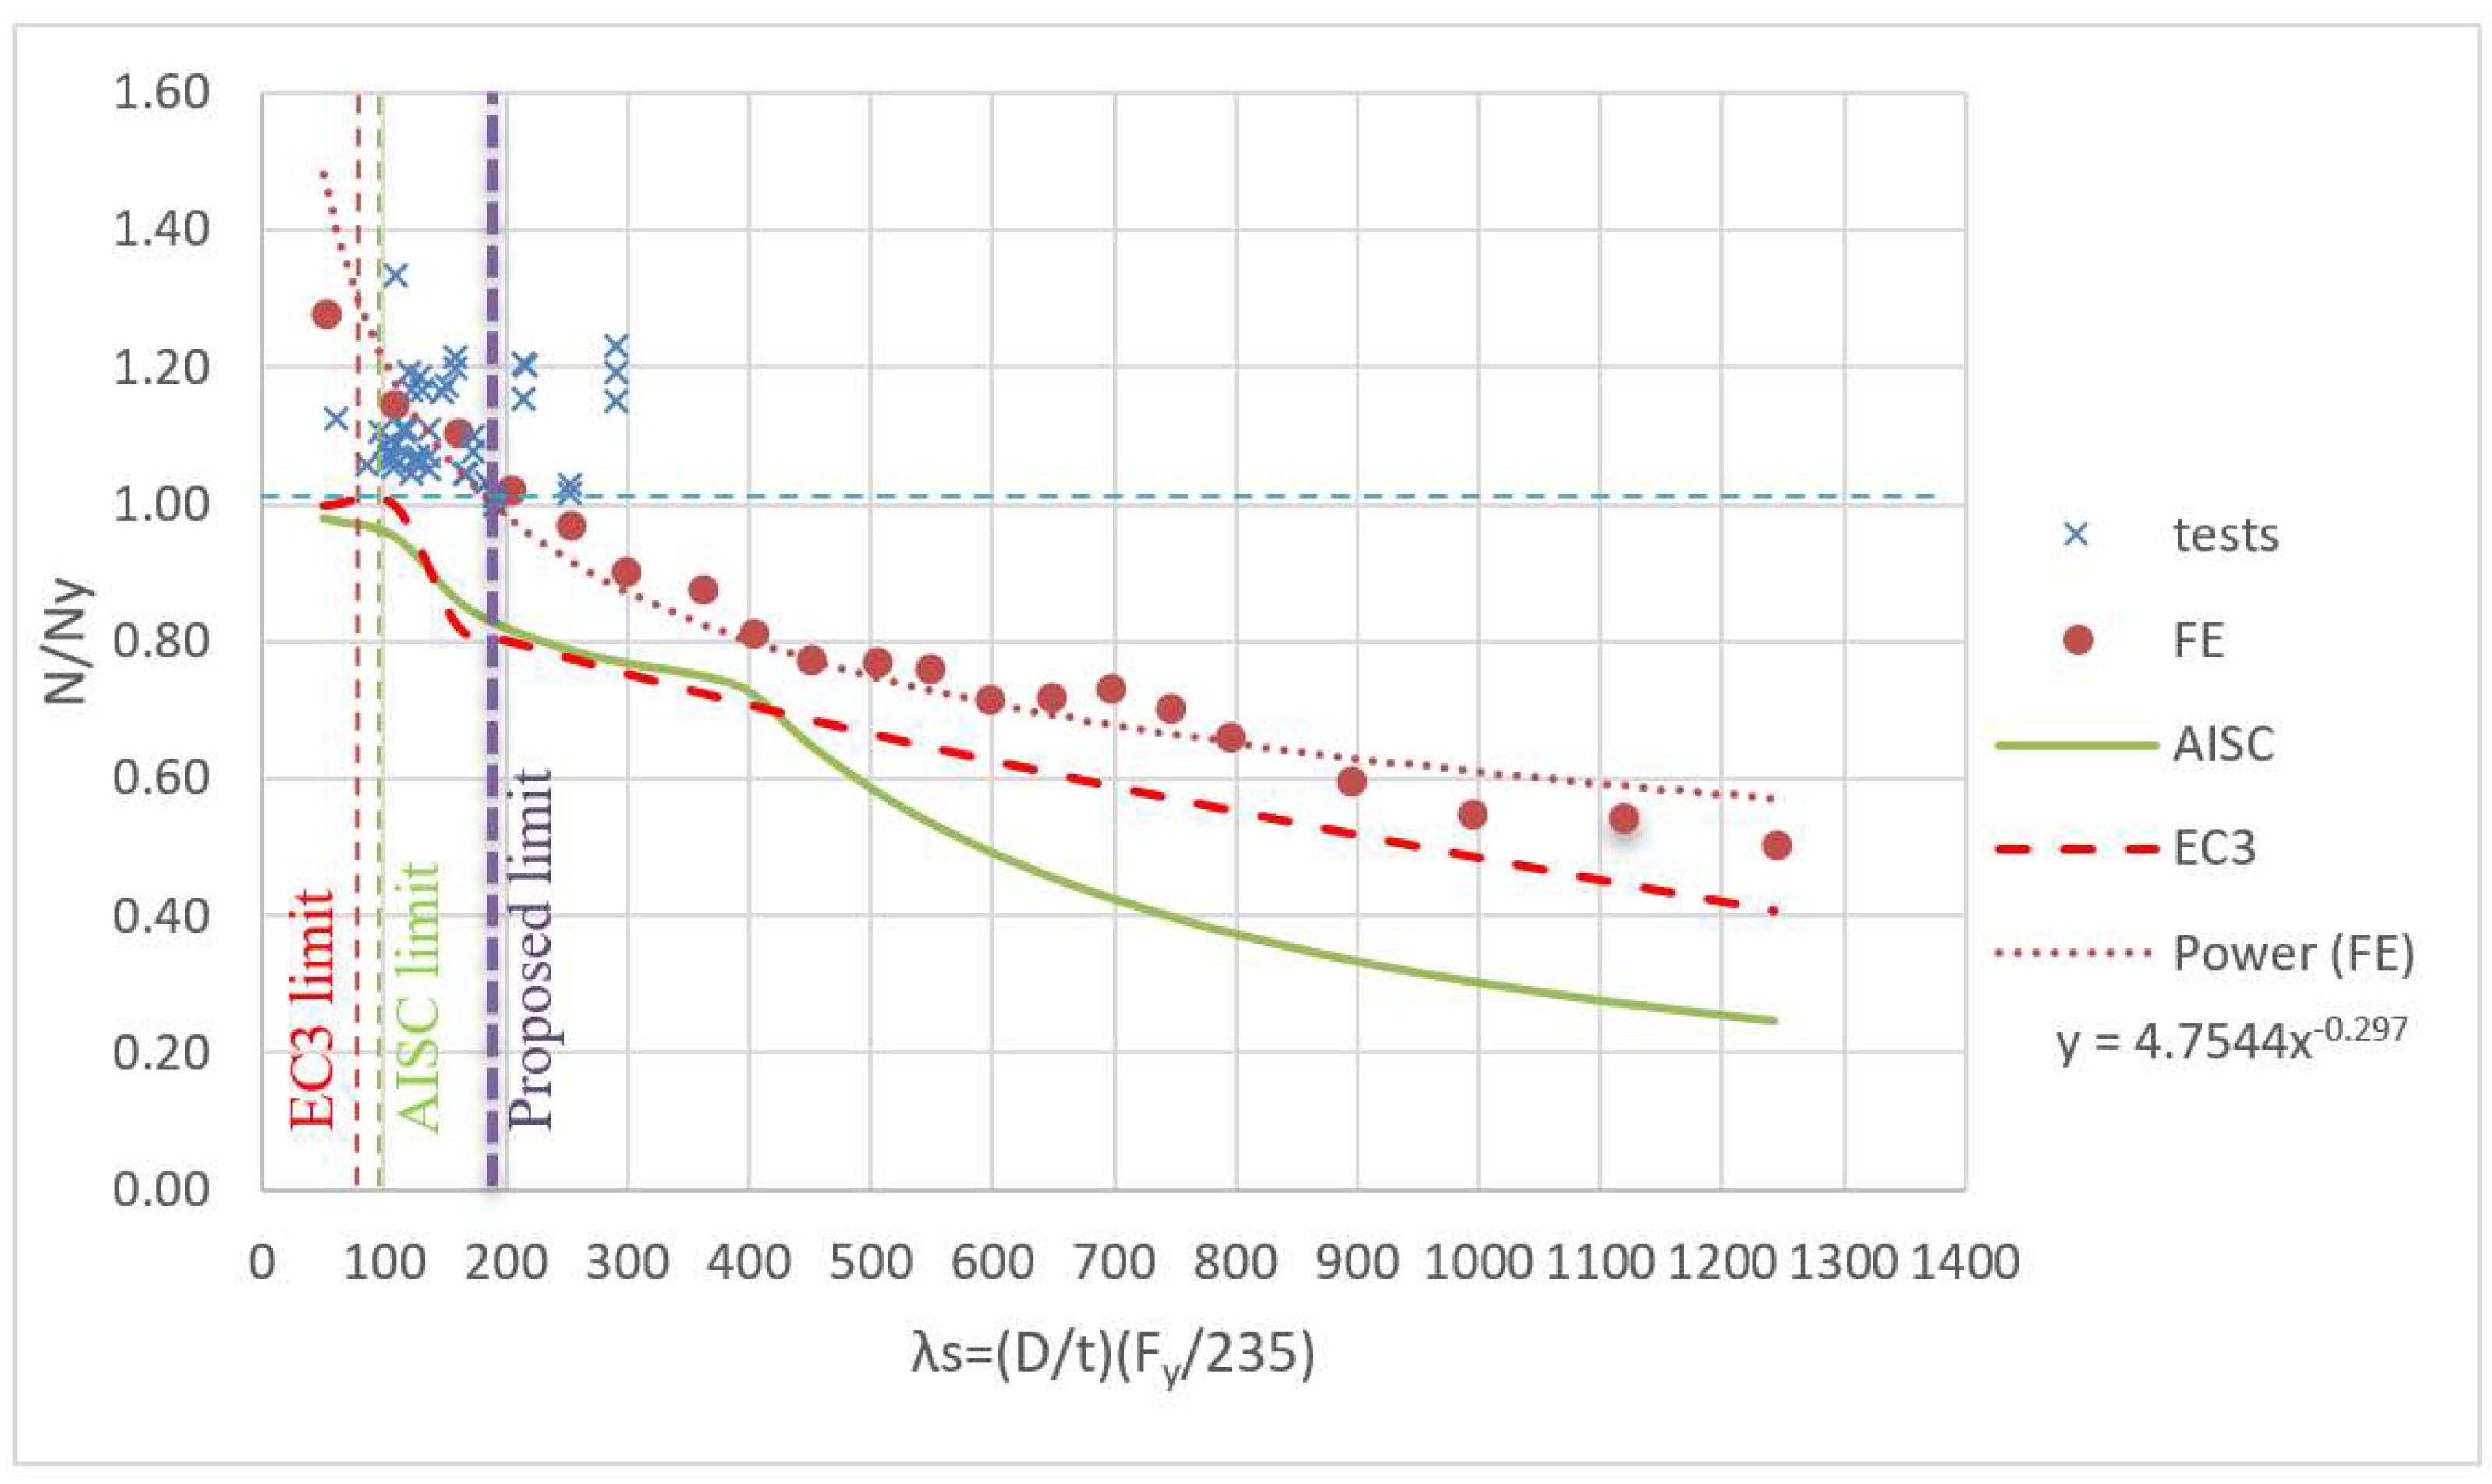
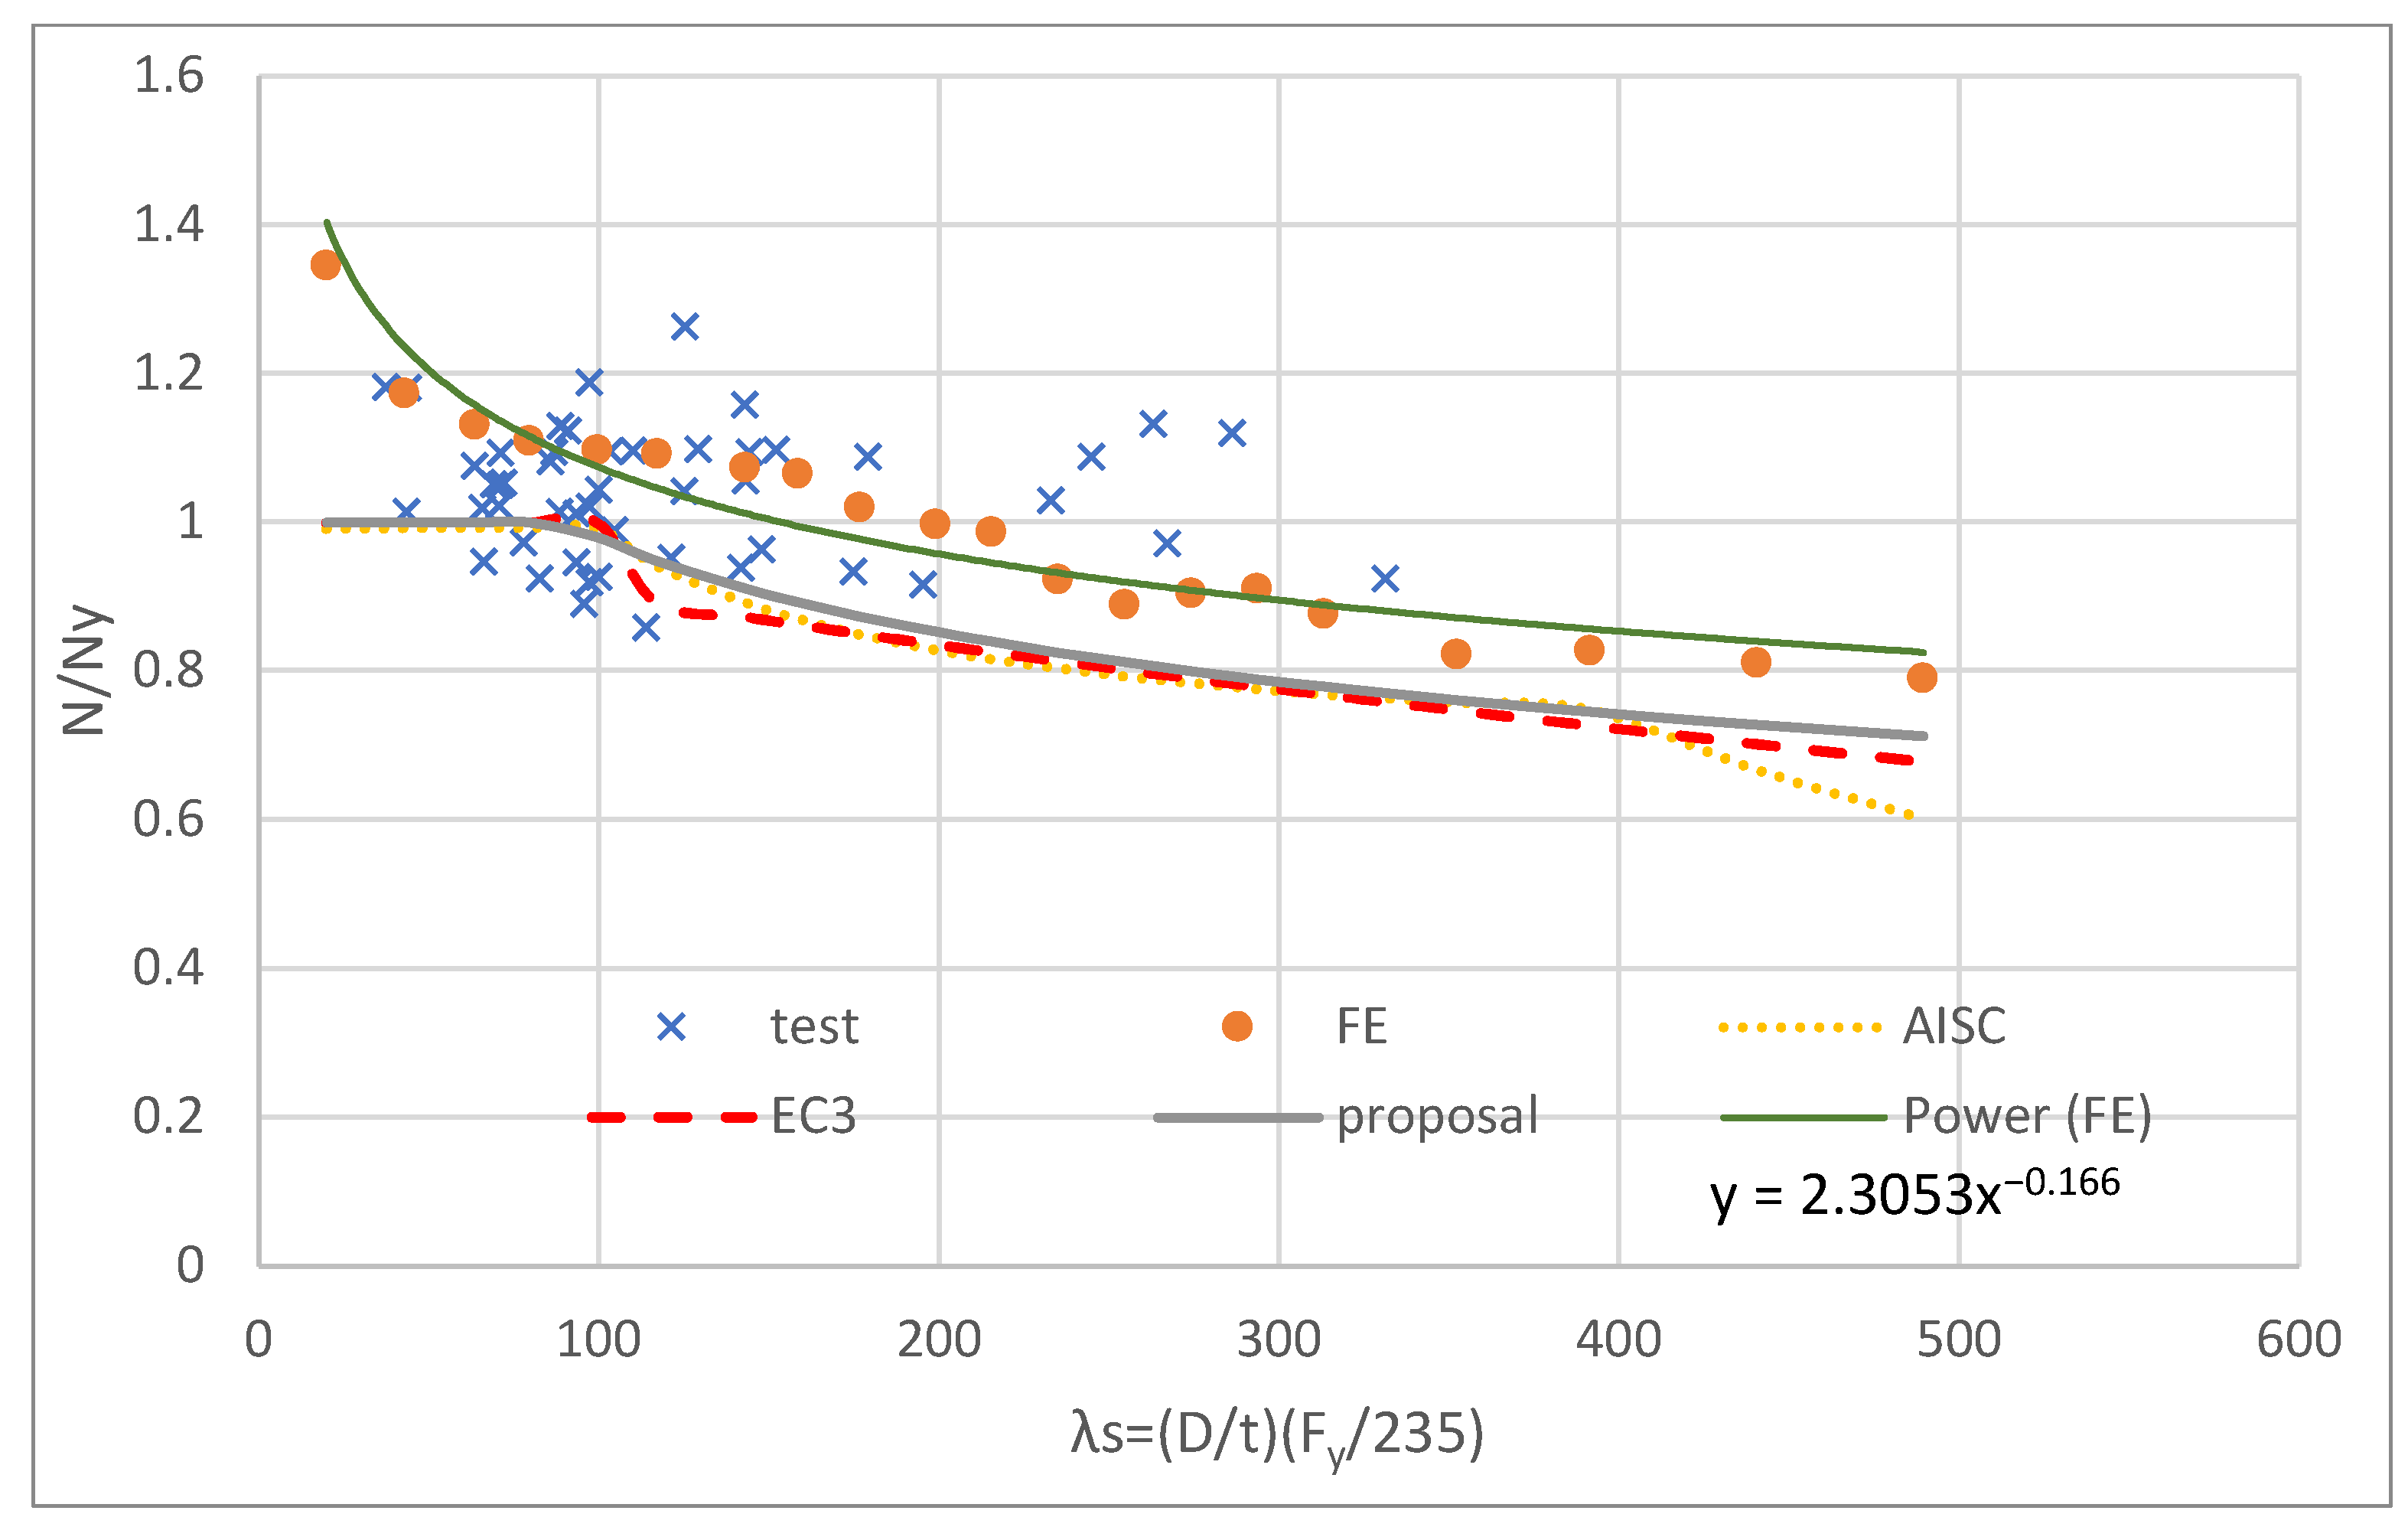
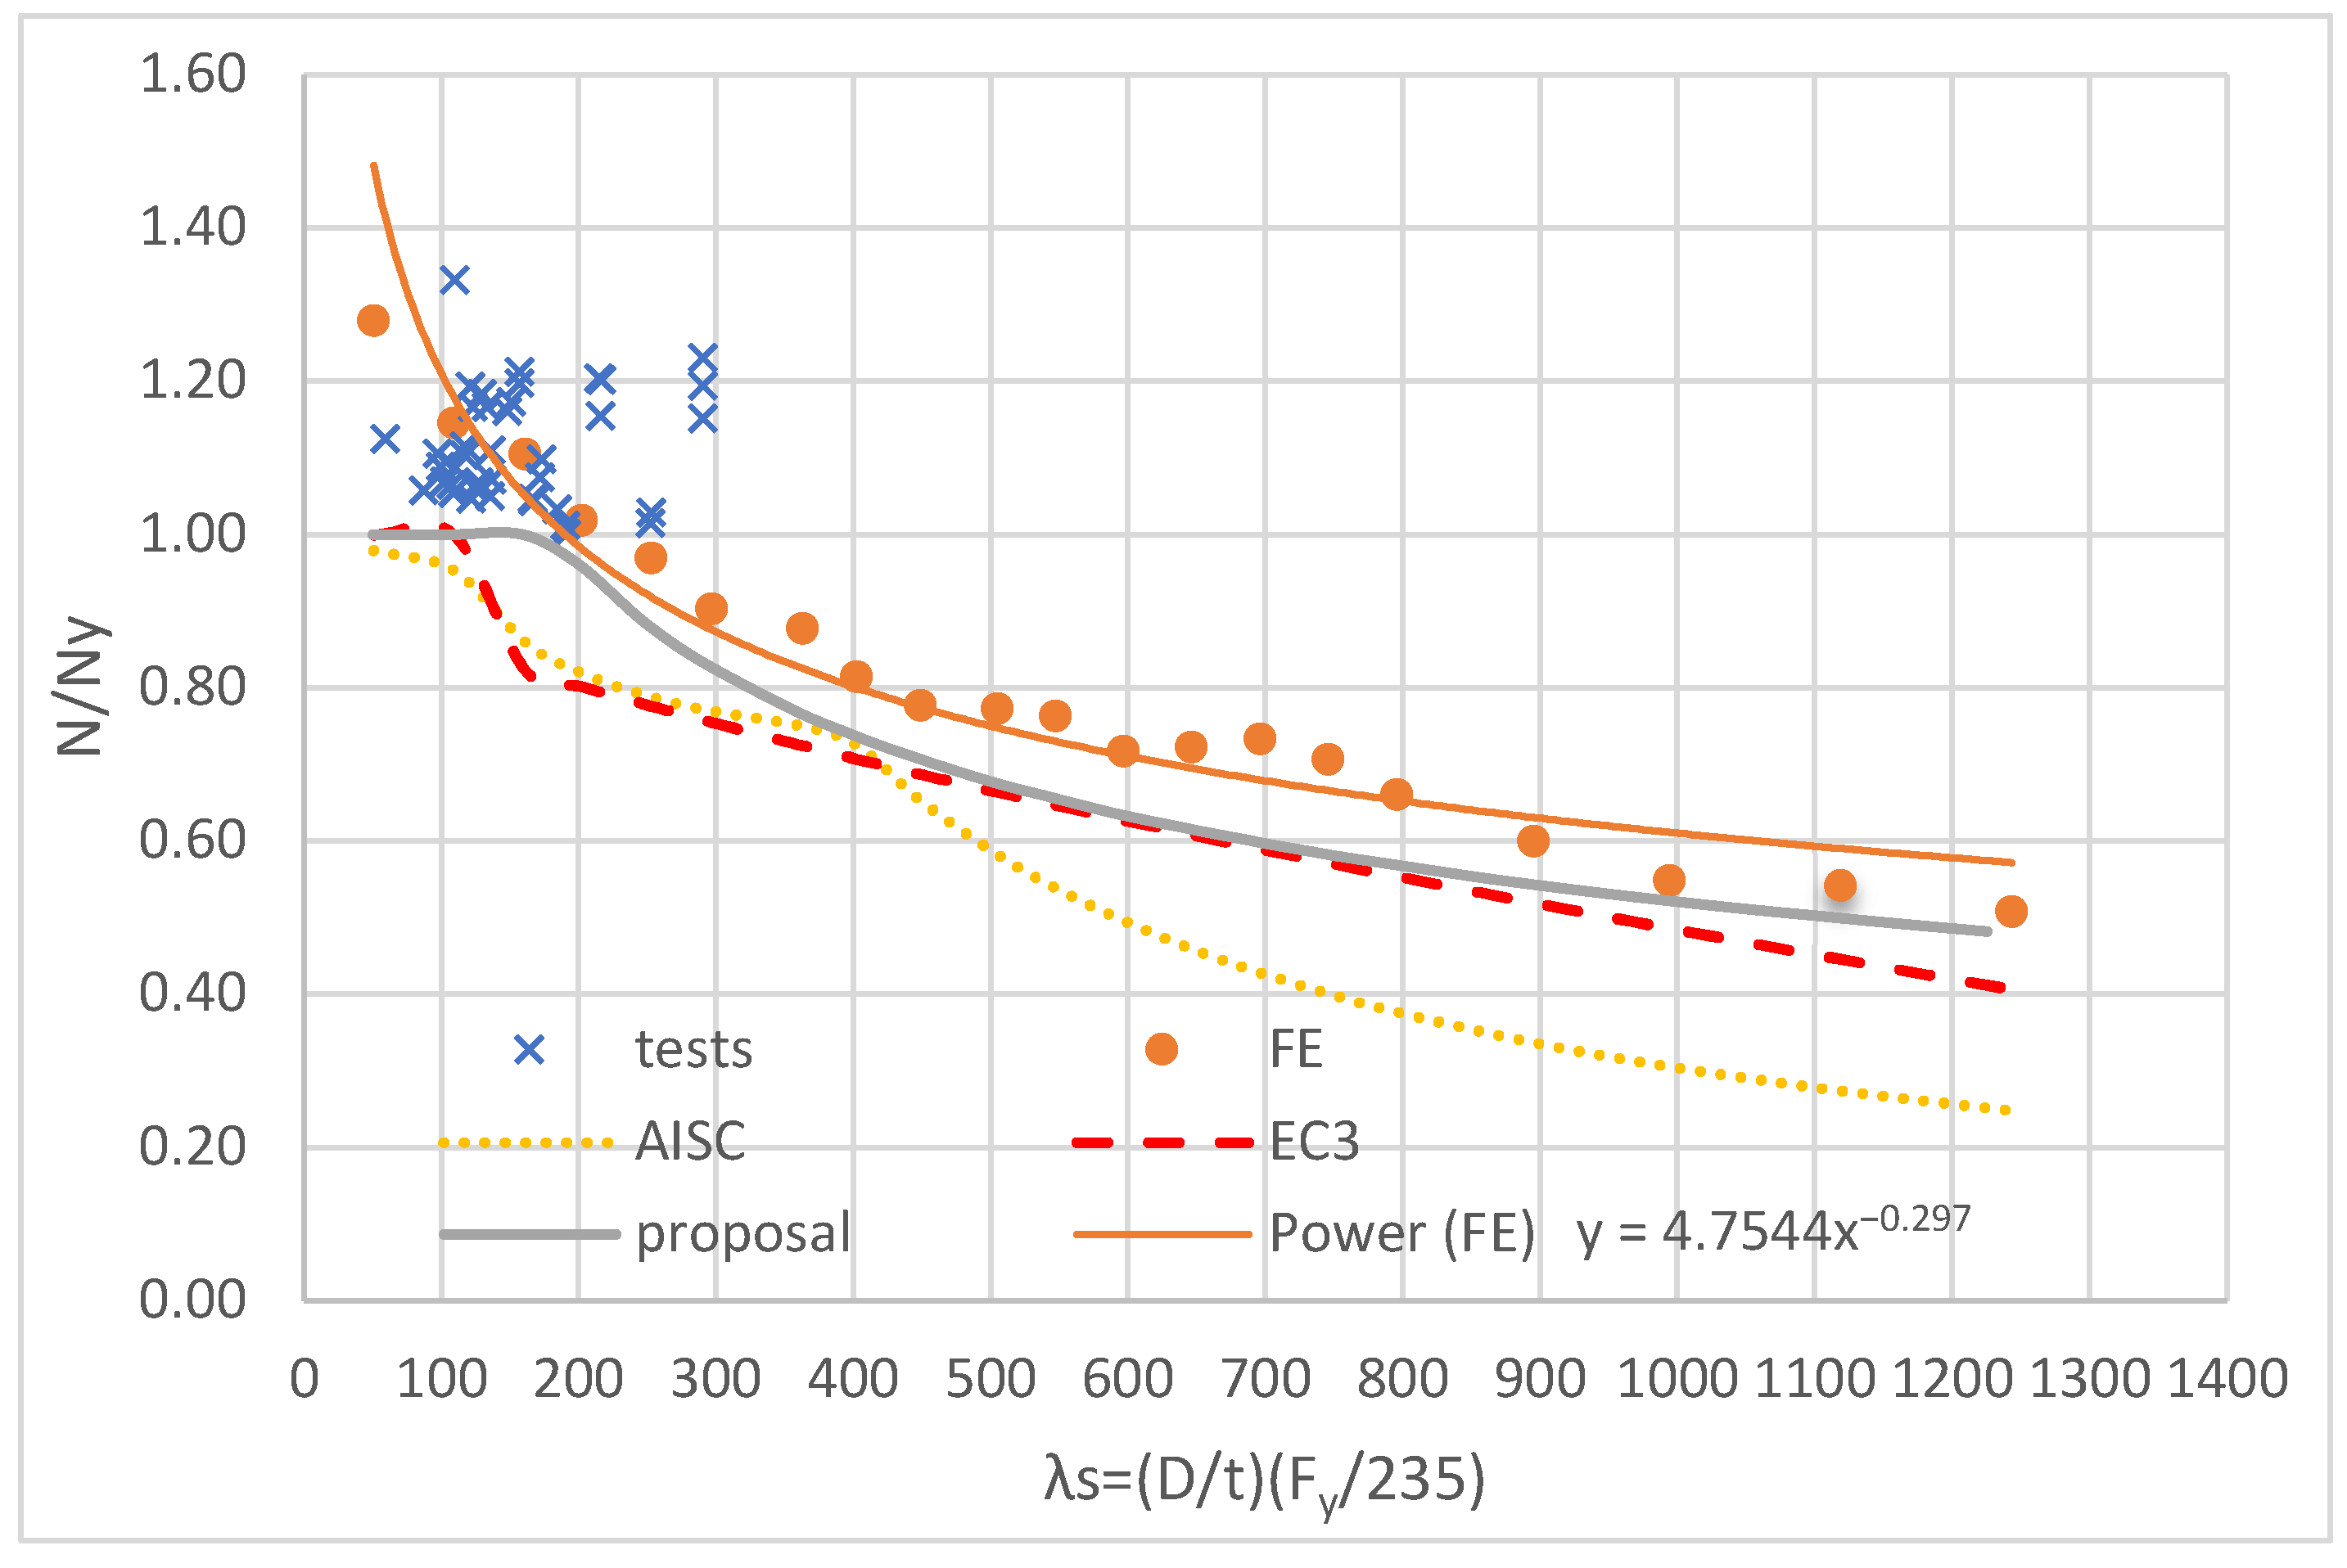
4.2. Evaluation of Current Slenderness Limit and Design Methods

The results of the authors’ finite element models and the experimental tests on 105 CHS stub columns, that had an increasing range of overall cross-section slenderness, were utilized to evaluate the present slenderness limit and design procedures for HSS–CHSs and UHSS–CHSs. Table 4 gives statistics for some information that was collected from previous research, such as the range of yield stress ( f y ) obtained from coupon tests, the overall cross-section slenderness ( λ S ), and the number of tests carried out for each research. It is observed that the value of the overall cross-section slenderness ( λ S ) ranged between 37 to 286 ( 37 λ S 286 ) for CHSs. Although a wide range of steel grades with f y ranging from 357 to 1405 MPa was used in the previous experimental studies, the majority of CHS stub columns were made from HSS with f y higher than 450 MPa as shown in Table 4. It is observed that the experimental tests on CHS stub columns using UHSS remain limited.
Because one of the most important and clear differences in whether the CHS column is classified as slender or not is whether the collapse occurred before or after the yield, therefore many of the previous researchers used the ratio ( N / N y ), where N represents the maximum axial compression load capacity. At the same time, ( N y = A f y ) denotes the cross-section yield load, which is dependent on yield stress ( f y ) and the cross-section area ( A ).
When the value of ( N / N y ) 1 , it indicates the requirements of the zone of Classes 1–3 for non-slender sections where the failure of a column doesn’t occur due to local buckling, while the value of ( N / N y ) < 1 . It indicates a slender section where local buckling prevents the yield load from being achieved, and it denotes a Class 4.
The classification of the slenderness of a section according to Euro Code EC3 and American Specification AISC 360-16 is dependent on section slenderness ( λ S ) and buckling parameter ( α ), respectively; therefore, the relation between ( N / N y ) ratios, section slenderness ( λ S ), and buckling parameter ( α ) are plotted as shown in Figure 13 and Figure 14, respectively, for HSS-S460 and Figure 15 and Figure 16, respectively, and for UHSS-S1100 by using results of the listed previous experimental tests and results of FE models by the authors. The curve fitting technique is used to require the mathematical equation of relations.
Figure 13 shows that all high-strength steel (HSS-S460) specimens that were studied numerically by authors, or almost specimens tested experimentally by others, can be classified as non-slender sections because they have normalized axial compression ( N / N y ) 1 despite the values of section slenderness ( λ S ) up to 150, whereas few specimens tested experimentally support the limits of specifications EC3 or AISC 360-16, which equal 90 and 98.3, respectively. Wherefore, it needs an accurate experimental study to determine the accurate limits.
Figure 14 shows that the values of section slenderness ( λ S ) are up to 180 for all ultra-high-strength steel (UHSS-S1100) specimens that were studied numerically by authors or experimentally by others; this indicates that the use of EC3 or AISC 360-16 limits for HSSs to check the slenderness of UHSSs gives conservative results. Therefore, there is a need to derive new modified limits for the section slenderness to suit steel with high and ultra-high-strength steel.
Figure 14 and Figure 16 show the relation between the normalized axial compression ( N / N y ) and non-dimensional buckling parameter ( α ) for (HSS-S460) and (UHSS-S1100), respectively, according to the results of previous experimental tests and FE models by the authors. As illustrated in Figure 14 and Figure 16, curve fitting is utilized to obtain the equation for the relationship between normalized axial compression ( N / N y ) and buckling parameter ( α ) for (S460) and (S1100). These equations indicate the normalized axial compression ( N / N y ) < 1 when buckling parameters ( α < 4.5 ) and ( α < 5.5 ) for (HSS-S460) and (UHSS-S1100), respectively.
Figure 17 and Figure 18 show the relation between normalized axial compression ( N / N y ) and section slenderness ( λ S ) for (HSS-S460) and (UHSS-S1100), respectively, inferred from the results of previous experimental tests, FE models by authors, and finally, the results of design equations according to Euro Code EC3 and American Specification AISC 360-16. It is shown that the FE models have average results compared with the results of experimental tests. Many boundary parameters affect the accuracy of experimental tests but do not affect the FE models. This gives evidence of the accuracy of the results of the FE models in this study. The technique of curve fitting is used to require the equation of the relation between normalized axial compression ( N / N y ) and section slenderness ( λ S ) for (HSS-S460) and (UHSS-S1100), as shown in Figure 17 and Figure 18, respectively. These equations indicate that the normalized axial compression ( N / N y < 1 ) when the section slenderness ( λ S > 150 ) and ( λ S > 180 ) for (HSS-S460) and (UHSS-S1100), respectively. This conclusion is confirmed by the results of almost experimental tests for (S460) as shown in Figure 17 and all experimental tests for (UHSS-S1100) as shown in Figure 19, whereas the limit of the slenderness of EC3 was 90 and AISC 360-16 was 98.3. Therefore, the EC3 and AISC 360-16 limits need to be modified by more accurate experimental and numerical studies to determine new limits suitable for high-strength and high-strength steel behavior.
The British Standards Institution, BS 5950-1 [3], gave Equation (6) to check the efficiency of high-strength steel cross-sections. It is used here as a base to determine a new simple design method for the design of HSS and UHSS slender CHS, substituting the effective cross-section area, which can be calculated as detailed in Equations (7) and (8) as follows:
N E d N e f f , R d + M x ,   E d M e f f , x ,   R d + M y ,   E d M e f f , y ,   R d 1.0
where,
M e f f , y , R d = W e f f , y f y M e f f , x , R d = W e f f , x f y N e f f , R d = A e f f f y N c , R d = A f y
M x ,   E d and M y ,   E d are the bending moments about the major (x) axis and minor (y) axis, respectively. M e f f , x ,   R d and M e f f , y ,   R d are the elastic bending resistance about the major (x) axis and minor (y) axis, respectively, based on the effective section properties. N E d is the axial force. N e f f , R d and N c , R d are the design cross-section resistances under uniform compression based on the effective and gross section areas, respectively. W e f f , x and W e f f , y are the elastic first moments of inertia about the major (x) and minor (y) axes, respectively, based on the effective section properties. A e f f is the effective cross-section area.
New Equations (7) and (8) for determining the effective cross-section area of CHS for HSS-S460 and UHSS-S1100 have been created based on modifications to the equivalent formulas for CHS published in BS 5950-1 [3]. As a result, a new design method is proposed by combining interaction Equation (6) with the calculated effective cross-section area from Equations (7) or (8) depending on the type of steel.
A e f f = A × ( 90 D t 235 f y ) 0.2
A e f f = A × ( 180 D t 235 f y ) 0.4
Figure 19 and Figure 20 show the comparison between the results of the maximum axial normal force ( N ) carried by CHS, normalized by yield load ( N y ), and calculated by using the proposed design method and the corresponding results determined from previous experimental tests, finite element models, and the predicted values according to the rules of AISC 360-16 and EC3 against the cross-section slenderness parameter for HSS-S460 and UHSS-S1100, respectively.
It is observed that the results determined by using the rules of AISC 360-16 and EC3 standards are more conservative than that calculated by using the proposed method with small values for (HSS-S460). At the same time, it is higher for (UHSS-S1100), especially about λ S = 180 .
Because the AISC 360-16 specification for high-strength steel didn’t give any information about the design of sections with λ S > 400 , the use of its design rules for sections with λ S < 400 in this case gives more conservative results than that calculated by using the proposed method and EC3, especially for (UHSS-S1100).
It’s clear that the results of the newly proposed method are more consistent with those determined experimentally and numerically than the predicted values according to the rules of AISC 360-16 and EC3 standards for HSS-S460 and UHSS-S1100. Furthermore, it is more accurate and simpler in calculations than the rules of AISC and EC3.
A summary of the comparison between the ratio of the value of the maximum capacity axial compression load for different studied specimens, determined from the FE models and calculated by using the design rules of EN 1993-1-6, AISC 360-16, and the proposed design method, is reported in Table 5 and Table 6 for HSS-S460 and UHSS-S1100, respectively.
The results of the proposed design method are more accurate than those calculated according to AISC 360-16 and EC3.

5. Conclusions

From an analytical study on the limits of the slenderness of high and ultra-high-strength steel circular hollow sections, the following can be concluded:
(1)
The current limits of the slenderness of high-strength steel circular hollow sections are conservative according to the numerical study as well as most of the results of previous experimental tests.
(2)
The use of the current limits of the slenderness according to AISC 360-16 and EC3 in check of ultra-high-strength steel circular hollow sections is too conservative.
(3)
The proposed limits of the slenderness for ultra-high-strength steel circular hollow sections according to this numerical study is λ S = ( D / t ) · ( F y / 235 ) = 180 , which is in agreement with all results of the previous experimental tests.
(4)
New simple design equations were developed for slender circular hollow sections from both high and ultra-high-strength steel.
(5)
The results of the newly proposed method are more consistent with those that are determined experimentally and numerically than the predicted values according to the rules of AISC 360-16 and EC3 standards for high-strength steel and ultra-high-strength steel. Furthermore, it is more accurate and simpler in calculations than the rules of AISC and EC3.
(6)
The design of circular hollow sections by using the rules of AISC 360-16 and EC3 standards is more conservative than using the proposed method with small values for (S460), whereas it is higher for (S1100), especially about λ S = 180 .

Author Contributions

Data curation, S.G. and M.S.; Formal analysis, A.D.; Funding acquisition, A.D.; Investigation, S.G.; Methodology, K.Z.; Resources, M.S.; Software, K.Z.; Supervision, F.M.F.S.; Validation, S.G.; Writing—original draft, K.Z. and M.S.; Writing—review and editing, F.M.F.S. All authors have read and agreed to the published version of the manuscript.

Funding

This research received no external funding.

Institutional Review Board Statement

Not applicable.

Informed Consent Statement

Not applicable.

Data Availability Statement

Not applicable.

Conflicts of Interest

The authors declare no conflict of interest.

References

  1. Dutta, D. Structures with Hollow Sections; Wiley VCH: Weinheim, Germany, 2002. [Google Scholar]
  2. EN 1993-1-1:2005; Euro Code 3: Design of Steel Structures—Part 1-1: General Rules and Rules for Buildings. European Committee for Standardization (CEN): Brussels, Belgium, 2005.
  3. BS 5950-1:2000; Structural Use of Steelwork in Building—Part 1: Code of Practice for Design—Rolled and Welded Sections. British Standards Institution: London, UK, 2000.
  4. EN 1993-1-4:2006; Euro Code 3: Design of Steel Structures—Part 1-4: General Rules—Supplementary Rules for Stainless Steel. European Committee for Standardization (CEN): Brussels, Belgium, 2006.
  5. EN 1999-1-1:2007; Euro Code 9: Design of Aluminum Structures—Part 1-1: General Structural Rules. European Committee for Standardization (CEN): Brussels, Belgium, 2007.
  6. ANSI/AISC 360-16; Specification for Structural Steel Buildings. American Institute of Steel Construction: Chicago, IL, USA, 2016.
  7. AS 4100-1998; Steel Structures. Standards Australia: Sydney, Australia, 1998.
  8. Ashraf, M.; Gardner, L.; Nethercot, D.A. Resistance of stainless steel CHS columns based on cross-section deformation capacity. J. Constr. Steel Res. 2008, 64, 962–970. [Google Scholar] [CrossRef]
  9. Ren, Q.-X.; Han, L.-H.; Lam, D.; Hou, C. Experiments on special-shaped CFST stub columns under axial compression. J. Constr. Steel Res. 2014, 98, 123–133. [Google Scholar] [CrossRef]
  10. Ma, J.-L.; Chan, T.-M.; Young, B. Cold-formed high strength steel tubular beam-columns. Eng. Struct. 2021, 230, 111618. [Google Scholar] [CrossRef]
  11. O’Shea, M.D.; Bridge, R.Q. Local buckling of thin-walled circular steel sections with or without internal restraint. J. Constr. Steel Res. 1997, 41, 137–157. [Google Scholar] [CrossRef]
  12. Chung, J. High-strength concrete-filled square tube columns subjected to axial loading. In Proceedings of the Seventh East Asia-Pacific Conference on Structural Engineering & Construction, Kochi, Japan, 27–29 August 1999; Volume 2. [Google Scholar]
  13. Guo, L.; Liu, Y.; Jiao, H.; An, S. Behavior of thin-walled circular hollow section stub columns under axial compression. Int. J. Steel Struct. 2016, 16, 777–787. [Google Scholar] [CrossRef]
  14. Wang, H.; Guo, Y.; Bai, Y.; Zhang, B.; Sun, Q.; Xue, J. Experimental and numerical study on the stability capacity of Q690 high-strength circular steel tubes under axial compression. Int. J. Steel Struct. 2017, 17, 843–861. [Google Scholar] [CrossRef]
  15. Zhao, X.-L. Section capacity of very high strength (VHS) circular tubes under compression. Thin-Walled Struct. 2000, 37, 223–240. [Google Scholar] [CrossRef]
  16. Jiao, H.; Zhao, X.-L. Imperfection, residual stress and yield slenderness limit of very high strength (VHS) circular steel tubes. J. Constr. Steel Res. 2003, 59, 233–249. [Google Scholar] [CrossRef]
  17. Ma, J.-L.; Chan, T.-M.; Young, B. Experimental Investigation on Stub-Column Behavior of Cold-Formed High-Strength Steel Tubular Sections. J. Struct. Eng. 2016, 142, 04015174. [Google Scholar] [CrossRef]
  18. BS EN-1993-1-3; Eurocode 3—Design of Steel Structures—Part 1-3: General Rules—Supplementary Rules for Cold-Formed Members and Sheeting. British Standards Institution: London, UK, 2006.
  19. Gardner, L.; Nethercot, D.A. Numerical Modeling of Stainless Steel Structural Components—A Consistent Approach. J. Struct. Eng. 2004, 130, 1586–1601. [Google Scholar] [CrossRef]
  20. Elchalakani, M.; Zhao, X.-L.; Grzebieta, R. Tests on concrete filled double-skin (CHS outer and SHS inner) composite short columns under axial compression. Thin-Walled Struct. 2002, 40, 415–441. [Google Scholar] [CrossRef]
  21. BS EN-1993-1-12; Euro Code 3: Design of Steel Structures—Part 1-12: Additional Rules for the Extension of EN 1993 up to Steel Grades S 700. British Standards Institution: London, UK, 2007.
  22. BS EN10219-1; Cold Formed Welded Structural Hollow Sections of Non-Alloy and fine Grain Steels. Part 1—Technical Delivery Requirements. British Standards Institution: London, UK, 2006.
  23. A514/A514M—18e1; Standard Specification for High-Yield-Strength, Quenched, and Tempered Alloy Steel Plate, Suitable for Welding. American Society for Testing and Materials (ASTM): West Conshohocken, PA, USA, 2018.
  24. A1085/A1085M—15; Standard Specification for Cold-Formed Welded Carbon Steel Hollow Structural Sections (HSS). American Society for Testing and Materials (ASTM): West Conshohocken, PA, USA, 2015.
  25. AISI S100; North American Specification for the Design of Cold-Formed Steel Structural Members. American Iron and Steel Institute (AISI): Washington, DC, USA, 2016.
  26. ANSYS, Inc. Theory Reference for ANSYS and ANSYS Workbench Release 19.0; ANSYS, Inc.: Canonsburg, PA, USA, 2019. [Google Scholar]
  27. EN 1993-1-6:2007; Euro Code 3: Design of Steel Structures—Part 1-6: Strength and Stability of Shell Structures. European Committee for Standardization (CEN): Brussels, Belgium, 2007.
  28. Foraboschi, P. Predictive Formulation for the Ultimate Combinations of Axial Force and Bending Moment Attainable by Steel Members. Int. J. Steel Struct. 2020, 20, 705–724. [Google Scholar] [CrossRef]
  29. Foraboschi, P. Lateral load-carrying capacity of steel columns with fixed-roller end supports. J. Build. Eng. 2019, 26, 100879. [Google Scholar] [CrossRef]
  30. Ma, J.-L.; Chan, T.-M.; Young, B. Material properties and residual stresses of cold-formed high strength steel hollow sections. J. Constr. Steel Res. 2015, 109, 152–165. [Google Scholar] [CrossRef]
  31. Meng, X.; Gardner, L. Cross-sectional behavior of cold-formed high strength steel circular hollow sections. Thin-Walled Struct. 2020, 156, 106822. [Google Scholar] [CrossRef]
  32. Chen, J.; Chan, T.-M.; Varma, A.H. Stub Column Behavior of Cold-Formed High-Strength Steel Circular Hollow Sections under Compression. J. Struct. Eng. 2020, 146, 04020277. [Google Scholar] [CrossRef]
  33. Meng, X.; Gardner, L. Simulation and design of semi-compact elliptical hollow sections. Eng. Struct. 2020, 202, 109807. [Google Scholar] [CrossRef]
  34. Sakino, K.; Nakahara, H.; Morino, S.; Nishiyama, I. Behavior of Centrally Loaded Concrete-Filled Steel-Tube Short Columns. J. Struct. Eng. 2004, 130, 180–188. [Google Scholar] [CrossRef]
  35. Wei, S.; Mau, S.T.; Vipulanandan, C.; Mantrala, S.K. Performance of New Sandwich Tube under Axial Loading: Experiment. J. Struct. Eng. 1995, 121, 1806–1814. [Google Scholar] [CrossRef]
Figure 1. Moment–rotation responses of four cross-sectional behavioral classes.
Buildings 12 01093 g001
Figure 2. True stress–strain curve for HSS–S460 and UHSS-S1100.
Buildings 12 01093 g002
Figure 3. The used finite element model in a numerical study by authors, the assumed boundary conditions and loading condition. (a) The used finite element model in a numerical study by authors. (b) Assumed boundary conditions and loading condition.
Buildings 12 01093 g003
Figure 4. Imperfection shapes. (a) Type 1. (b) Type 2.
Buildings 12 01093 g004
Figure 5. Magnified view of local imperfections.
Buildings 12 01093 g005
Figure 6. Comparison between failure phenomena resulting from FEA by authors and the experimental tests by Lanhui Guo et al. (Reprinted from Ref. [13]) for specimens with D / t ranging from 75 to 300. (a) D / t = 75 . (b) D / t = 100 . (c) D / t = 125 . (d) D / t = 150 . (e) D / t = 200 . (f) D / t = 300 .
Buildings 12 01093 g006aBuildings 12 01093 g006b
Figure 7. Comparison between (P-∆) resulting from the FEA by authors and the experimental tests by Lanhui Guo et al. for specimens with D / t ranging from 75 to 300. (a) Specimens of D / t 75 and 100. (b) Specimens of D / t 125 and 150. (c) Specimens of D / t 200 and 300.
Buildings 12 01093 g007aBuildings 12 01093 g007b
Figure 8. Comparison between the results of FEA by authors and experimental tests by Lanhui Guo et al. for deflection and load capacity is for specimens with D / t ranging from 75 to 300.
Buildings 12 01093 g008
Figure 9. Stress through tube length and failure mode of D / t = 10 ,   100 , and D / t = 250 (LC1, S460). (a) D / t = 10 . (b) D / t = 100 . (c) D / t = 110 . (d) D / t = 250 .
Buildings 12 01093 g009
Figure 10. Stress through tube length and failure mode of D / t = 10 ,   40 ,   50 , and D / t = 250 (LC1, S1100). (a) D / t = 10 . (b) D / t = 40 . (c) D / t = 50 . (d) D / t = 250 .
Buildings 12 01093 g010aBuildings 12 01093 g010b
Figure 11. Stress strain curve of specimens of D / t = 10 ,   100 ,   110 and D / t = 250 (LC1, S460).
Buildings 12 01093 g011
Figure 12. Stress–strain curve of specimens of D / t = 10 ,   40 ,   50 and D / t = 250 (LC1, S1100).
Buildings 12 01093 g012
Figure 13. The relation between normalized axial compression and section slenderness of experimental results by others and FE by authors for HSS-S460.
Buildings 12 01093 g013
Figure 14. The relation between normalized axial compression and non-dimensional buckling parameter ( α ) of experimental results by others and FE by authors for HSS-S460.
Buildings 12 01093 g014
Figure 15. The relation between normalized axial compression and section slenderness of experimental results by others and FE by authors for UHSS-S1100.
Buildings 12 01093 g015
Figure 16. The relation between normalized axial compression and non-dimensional buckling parameter ( α ) of S1100 of experimental results by others and FE by the authors for UHSS-S1100.
Buildings 12 01093 g016
Figure 17. Comparison of normalized static axial load versus section slenderness between experimental results by others, FE by authors, and the predicted values of AISC and EC3 standards for HSS-S460.
Buildings 12 01093 g017
Figure 18. Comparison of normalized static axial load versus section slenderness between experimental results by others, FE by authors, and the predicted values of AISC and EC3 standards for UHSS-S1100.
Buildings 12 01093 g018
Figure 19. Comparison of normalized static axial load versus section slenderness between the proposed design equation, experimental results by others, FE by authors, and the predicted values of AISC and EC3 standards for HSS-S460.
Buildings 12 01093 g019
Figure 20. Comparison of normalized static axial load versus section slenderness between the proposed design equation, experimental results by others, FE by authors, and the predicted values of AISC and EC3 standards for UHSS-S1100.
Buildings 12 01093 g020
Table 1. The used specimen details in the parametric study to evaluate imperfection shape.
CROSS-SECTIONMESH SIZE
CHS_150 × 2type I
type II
CHS_200 × 2type I
type II
CHS_250 × 2type I
type II
CHS_300 × 2type I
type II
CHS_400 × 2type I
type II
Table 2. Geometric parameters of specimens were tested by Lanhui Guo et al. (Reprinted from Ref. [13]).
D
(mm)
t
(mm)
L
(mm)
D / t L / D Number of
Repeats
DT7515024507533
DT100150260010033
DT125200275012533
DT150200290015033
DT2002502120020032
DT3002502180030032
Table 3. Dimensions and properties of the studied CHS high and very high strength steel stub columns.
NoSymbolD (mm)t
(mm)
H
(mm)
D / t G · I E C 3 ( mm ) F y ( MPa ) F u ( MPa ) E s ( GPa ) D t f y 235
1LC1-102-10-460101.610.0304.8100.5646055021019.9
2LC1-219-10-460219.110.0657.3220.8346055021042.9
3LC1-324-10-460323.910.0971.7321.0146055021063.4
4LC1-406-10-460406.410.01219.2411.1346055021079.6
5LC1-508-10-46050810.01524511.2646055021099.4
6LC1-102-1.7-460101.61.70304.8600.23460550210117.0
7LC1-219-3-460219.13.00657.3730.45460550210143.0
8LC1-324-4-460323.94.00971.7810.64460550210158.5
9LC1-406-4.5-460406.44.501219.2900.76460550210176.8
10LC1-508-5-4605085.0015241020.89460550210198.9
11LC1-220-2-4602202.006601100.37460550210215.3
12LC1-240-2-4602402.007201200.39460550210234.9
13LC1-260-2-4602602.007801300.40460550210254.5
14LC1-280-2-4602802.008401400.42460550210274.0
15LC1-300-2-4603002.009001500.43460550210293.6
16LC1-320-2-4603202.009601600.45460550210313.2
17LC1-360-2-4603602.0010801800.47460550210352.3
18LC1-400-2-4604002.0012002000.50460550210391.5
19LC1-450-2-4604502.0013502250.53460550210440.4
20LC1-500-2-4605002.0015002500.56460550210489.4
21LC1-102-10-1100101.610.0304.8100.561152131720749.8
22LC1-219-10-1100219.110.0657.3220.8311521317207107.4
23LC1-324-10-1100323.910.0971.7321.0111521317207158.8
24LC1-406-10-1100406.410.01219.2411.1311521317207199.2
25LC1-508-10-110050810.01524511.2611521317207249.0
26LC1-102-1.7-1100101.61.70304.8600.2311521317207293.0
27LC1-219-3-1100219.13.00657.3730.4511521317207358.0
28LC1-324-4-1100323.94.00971.7810.6411521317207396.9
29LC1-406-4.5-1100406.44.501219.2900.7611521317207442.7
30LC1-508-5-11005085.0015241020.8911521317207498.1
31LC1-220-2-11002202.006601100.3711521317207539.2
32LC1-240-2-11002402.007201200.3911521317207588.3
33LC1-260-2-11002602.007801300.4011521317207637.3
34LC1-280-2-11002802.008401400.4211521317207686.3
35LC1-300-2-11003002.009001500.4311521317207735.3
36LC1-320-2-11003202.009601600.4511521317207784.3
37LC1-360-2-11003602.0010801800.4711521317207882.4
38LC1-400-2-11004002.0012002000.5011521317207980.4
39LC1-450-2-11004502.0013502250.53115213172071103.0
40LC1-500-2-11005002.0015002500.561152013172071225.5
Table 4. Statistics of previous experimental test data for 105 CHS stub columns.
References   f y     λ S   No. of Tests
Junbo Chen [32].474–97069–25016
Ma et al. [17].1014–1180101–1689
Ren et al. [9].389942
Sakino et al. [34].283–83561–1959
Elchalakani et al. [20]357–45437–968
Jiao and Zhao [16].433–139844–27410
Zhao [15].1341–140593–14712
Wei et al. [35].216–52469–28639
Total 105
Table 5. Comparison of proposed design method and code predictions with FE results of LC1-460.
No. of Specimens: 20NFE/NEC3NFE/NAISCNFE/Nproposed
Mean1.171.171.14
COV0.030.050.03
Table 6. Comparison of proposed design method and code predictions with FE results of LC1-1100.
No. of Specimens: 20NFE/NEC3NFE/NAISCNFE/Nproposed
Mean1.191.531.12
COV0.030.190.04
Publisher’s Note: MDPI stays neutral with regard to jurisdictional claims in published maps and institutional affiliations.

