
Full-Scale Interface Friction Testing of Geotextile-Based Flood Defence Structures


Abstract
:1. Introduction
- Permanent
- Temporary
- Demountable
2. Materials and Methods
Experimental Campaign, Procedure, and Apparatus
3. Results and Discussion
4. Conclusions
Author Contributions
Funding
Institutional Review Board Statement
Informed Consent Statement
Data Availability Statement
Acknowledgments
Conflicts of Interest
Appendix A


References
- Sayers, P.; Gersonius, B.; den Heijer, F.; Klerk, W.J.; Fröhle, P.; Jordan, P.; Ciocan, U.R.; Rijke, J.; Vonk, B.; Ashley, R. Towards adaptive asset management in flood risk management: A policy framework. Water Secur. 2021, 12, 100085. [Google Scholar] [CrossRef]
- Mori, S.; Pacetti, T.; Brandimarte, L.; Santolini, R.; Caporali, E. A methodology for assessing spatio-temporal dynamics of flood regulating services. Ecol. Indic. 2021, 129, 107963. [Google Scholar] [CrossRef]
- Aerts, J.C.J.H. A Review of Cost Estimates for Flood Adaptation. Water 2018, 10, 1646. [Google Scholar] [CrossRef] [Green Version]
- Yang, Q.; Zheng, X.; Jin, L.; Lei, X.; Shao, B.; Chen, Y. Research Progress of Urban Floods under Climate Change and Urbanization: A Scientometric Analysis. Buildings 2021, 11, 628. [Google Scholar] [CrossRef]
- Nofal, O.M.; van de Lindt, J.W.; Cutler, H.; Shields, M.; Crofton, K. Modeling the Impact of Building-Level Flood Mitigation Measures Made Possible by Early Flood Warnings on Community-Level Flood Loss Reduction. Buildings 2021, 11, 475. [Google Scholar] [CrossRef]
- Ogunyoye, F.; van Heereveld, M. Temporary and Demountable Flood Protection; Environment Agency: Bristol, UK, 2002.
- Tabari, H. Climate change impact on flood and extreme precipitation increases with water availability. Sci. Rep. 2020, 10, 13768. [Google Scholar] [CrossRef]
- Haer, T.; Husby, T.G.; Botzen, W.J.W.; Aerts, J.C.J.H. The safe development paradox: An agent-based model for flood risk under climate change in the European Union. Glob. Environ. Chang. 2020, 60, 102009. [Google Scholar] [CrossRef]
- Cramer, W.; Guiot, J.; Fader, M.; Garrabou, J.; Gattuso, J.-P.; Iglesias, A.; Lange, M.A.; Lionello, P.; Llasat, M.C.; Paz, S.; et al. Climate change and interconnected risks to sustainable development in the Mediterranean. Nat. Clim. Chang. 2018, 8, 972–980. [Google Scholar] [CrossRef] [Green Version]
- Zhang, K.; Douglas, B.C.; Leatherman, S.P. Global Warming and Coastal Erosion. Clim. Chang. 2004, 64, 41. [Google Scholar] [CrossRef]
- Krahn, T.; Blatz, J.; Alfaro, M.; Bathurst, R.J. Large-scale interface shear testing of sandbag dyke materials. Geosynth. Int. 2007, 14, 119–126. [Google Scholar] [CrossRef]
- Boon, M.J.J. Water Controlling Water: Emergency Flood Protections. Master’s Thesis, Delft University of Technology, Delft, The Netherlands, 2007. [Google Scholar]
- Saathoff, F.; Oumeraci, H.; Restall, S. Australian and German experiences on the use of geotextile containers. Geotext. Geomembr. 2007, 25, 251–263. [Google Scholar] [CrossRef]
- Oh, Y.I.; Shin, E.C. Using submerged geotextile tubes in the protection of the E. Korean shore. Coast. Eng. 2006, 53, 879–895. [Google Scholar] [CrossRef]
- Ogunyoye, F.; Stevens, R.; Underwood, S. Temporary and Demountable Flood Protection; Environment Agency: Bristol, UK, 2011; p. 282.
- Van der Wal, M. Bank Protection Structures along the Brahmaputra-Jamuna River, a Study of Flow Slides. Water 2020, 12, 2588. [Google Scholar] [CrossRef]
- Huang, W.-C.; Weng, M.-C.; Chen, R.-K. Levee failure mechanisms during the extreme rainfall event: A case study in Southern Taiwan. Nat. Hazards 2014, 70, 1287–1307. [Google Scholar] [CrossRef] [Green Version]
- Ogunyoye, F.; Stevens, R.; Underwood, S. Delevering Benefits through Evidence: Temporary and Demountable Flood Protection Guide; Environment Agency: Bristol, UK, 2011; ISBN 978-1-84911-225-3.
- Wu, S.-J.; Yang, J.-C.; Tung, Y.-K. Risk analysis for flood-control structure under consideration of uncertainties in design flood. Nat. Hazards 2011, 58, 117–140. [Google Scholar] [CrossRef]
- Gallien, T.W.; Sanders, B.F.; Flick, R.E. Urban coastal flood prediction: Integrating wave overtopping, flood defences and drainage. Coast. Eng. 2014, 91, 18–28. [Google Scholar] [CrossRef]
- Jongejan, R.B.; Diermanse, F.; Kanning, W.; Bottema, M. Reliability-based partial factors for flood defences. Reliab. Eng. Syst. Saf. 2020, 193, 106589. [Google Scholar] [CrossRef]
- Duncan, J.M.; Sleep, M.D. Evaluating reliability in geotechnical engineering. In Risk and Reliability in Geotechnical Engineering; CRC Press: Boca Raton, FL, USA, 2015; pp. 131–179. [Google Scholar]
- Krahn, T.J. Assessment of Sandbag Dike Performance. Master’s Thesis, University of Manitoba, Winnipeg, MB, Canada, 2005. [Google Scholar]
- Offman, R.; Blatz, J. Effects of temperature and moisture on large-scale interface shear testing of sandbag dikes. In Proceedings of the GeoEdmonton’08: 61st Canadian Geotechnical Conference, Calgary, AB, Canada, 21–24 September 2008. [Google Scholar]
- Harms, S. Evaluation of Large Sand-Filled Geotextile Containers as a Temporary Flood Protection Product. Master’s Thesis, University of Manitoba, Winnipeg, MB, Canada, 2014. [Google Scholar]
- Moragues, M.V.; Clavero, M.; Losada, M.Á. Wave Breaker Types on a Smooth and Impermeable 1:10 Slope. J. Mar. Sci. Eng. 2020, 8, 296. [Google Scholar] [CrossRef] [Green Version]
- Hoy, M.; Udomchai, A.; Yeanyong, C.; Horpibulsuk, S.; Arulrajah, A. Stability investigation of the flood protection structure at Nava Nakorn industrial estate, Thailand. Eng. Fail. Anal. 2022, 137, 106279. [Google Scholar] [CrossRef]
- Thawani, B.; Hazael, R.; Critchley, R. Numerical modelling study of a modified sandbag system for ballistic protection. J. Comput. Sci. 2021, 53, 101403. [Google Scholar] [CrossRef]


| Frictional Surface 1 | Frictional Bedding Surface 2 | Ref. |
|---|---|---|
| Woven polypropylene plastic (Bulk bag material) | Dry interior concrete: Smooth (steel floated) | A |
| Slightly damp exterior concrete: Tamped (wood floated)—parallel | B | |
| Slightly damp exterior concrete: Tamped (wood floated)—perpendicular | C | |
| Slightly damp macadam asphalt | D | |
| Mildly damp grass | E | |
| Damp unmade gravel road | F | |
| Dry polypropylene plastic | G |
| Ref. | Frictional Bedding Surface Description | Example Surface(s) |
|---|---|---|
| A | Smooth interior screed concrete finish with only rare visible delamination or imperfections. Surface asperities were of negligible-shallow depth (≈0–3 mm). | Cast cill beams of floodgates. |
| B & C | A hardwearing exterior concrete feature surface tamping was designed to provide grip to those moving items around the depot yard. The occasional fine aggregate/pea shingle particle was noticeable within the troughed tamping. Asperities present in minor pitting were generally shallow-intermediate depth (≈3–5 mm). | Floodgate’s cill beams, coastal or riverside promenades, and footpaths. |
| D | A bituminous-based surface with a densely packed skeleton of rolled angular aggregate chippings. There were signs of surface course wear, thus exposing the chippings. Minor surface fracturing was visible. Asperities were generally of shallow depth (≈0–3 mm). | Paved roads and paths within floodplains/next to watercourses and water bodies. |
| E | Grass of length generally <20 mm, with slightly patchy coverage and underlain with medium-firm topsoil. | Riverside grassed areas, flood banks, verges. |
| F | A rugged fine-particulate surface constructed from consolidated road planning. Some loose, mainly embedded sub-angular medium-coarse gravel was present. Asperities created from peaks and troughs of embedded gravel were generally of shallow-intermediate depth (≈3–10 mm). | Unmade roads, tracks, and paths within floodplains/next to watercourses and water bodies. |
| G | Non-woven thin synthetic tarpaulin with no punctures or tears. | Damp-proof membranes. |
| Ref. | Frictional Bedding Surface 2 | Single Bag (Unstacked) | Two Bags (Stacked) |
|---|---|---|---|
| A | Dry interior concrete: Smooth (steel floated) | X | - |
| B | Slightly damp exterior concrete: Tamped (wood floated)—parallel | X | X |
| C | Slightly damp exterior concrete: Tamped (wood floated)—perpendicular | X | - |
| D | Slightly damp macadam asphalt | X | - |
| E | Mildly damp grass | X | X |
| F | Damp unmade gravel road | X | - |
| G | Dry polypropylene plastic | X | X |
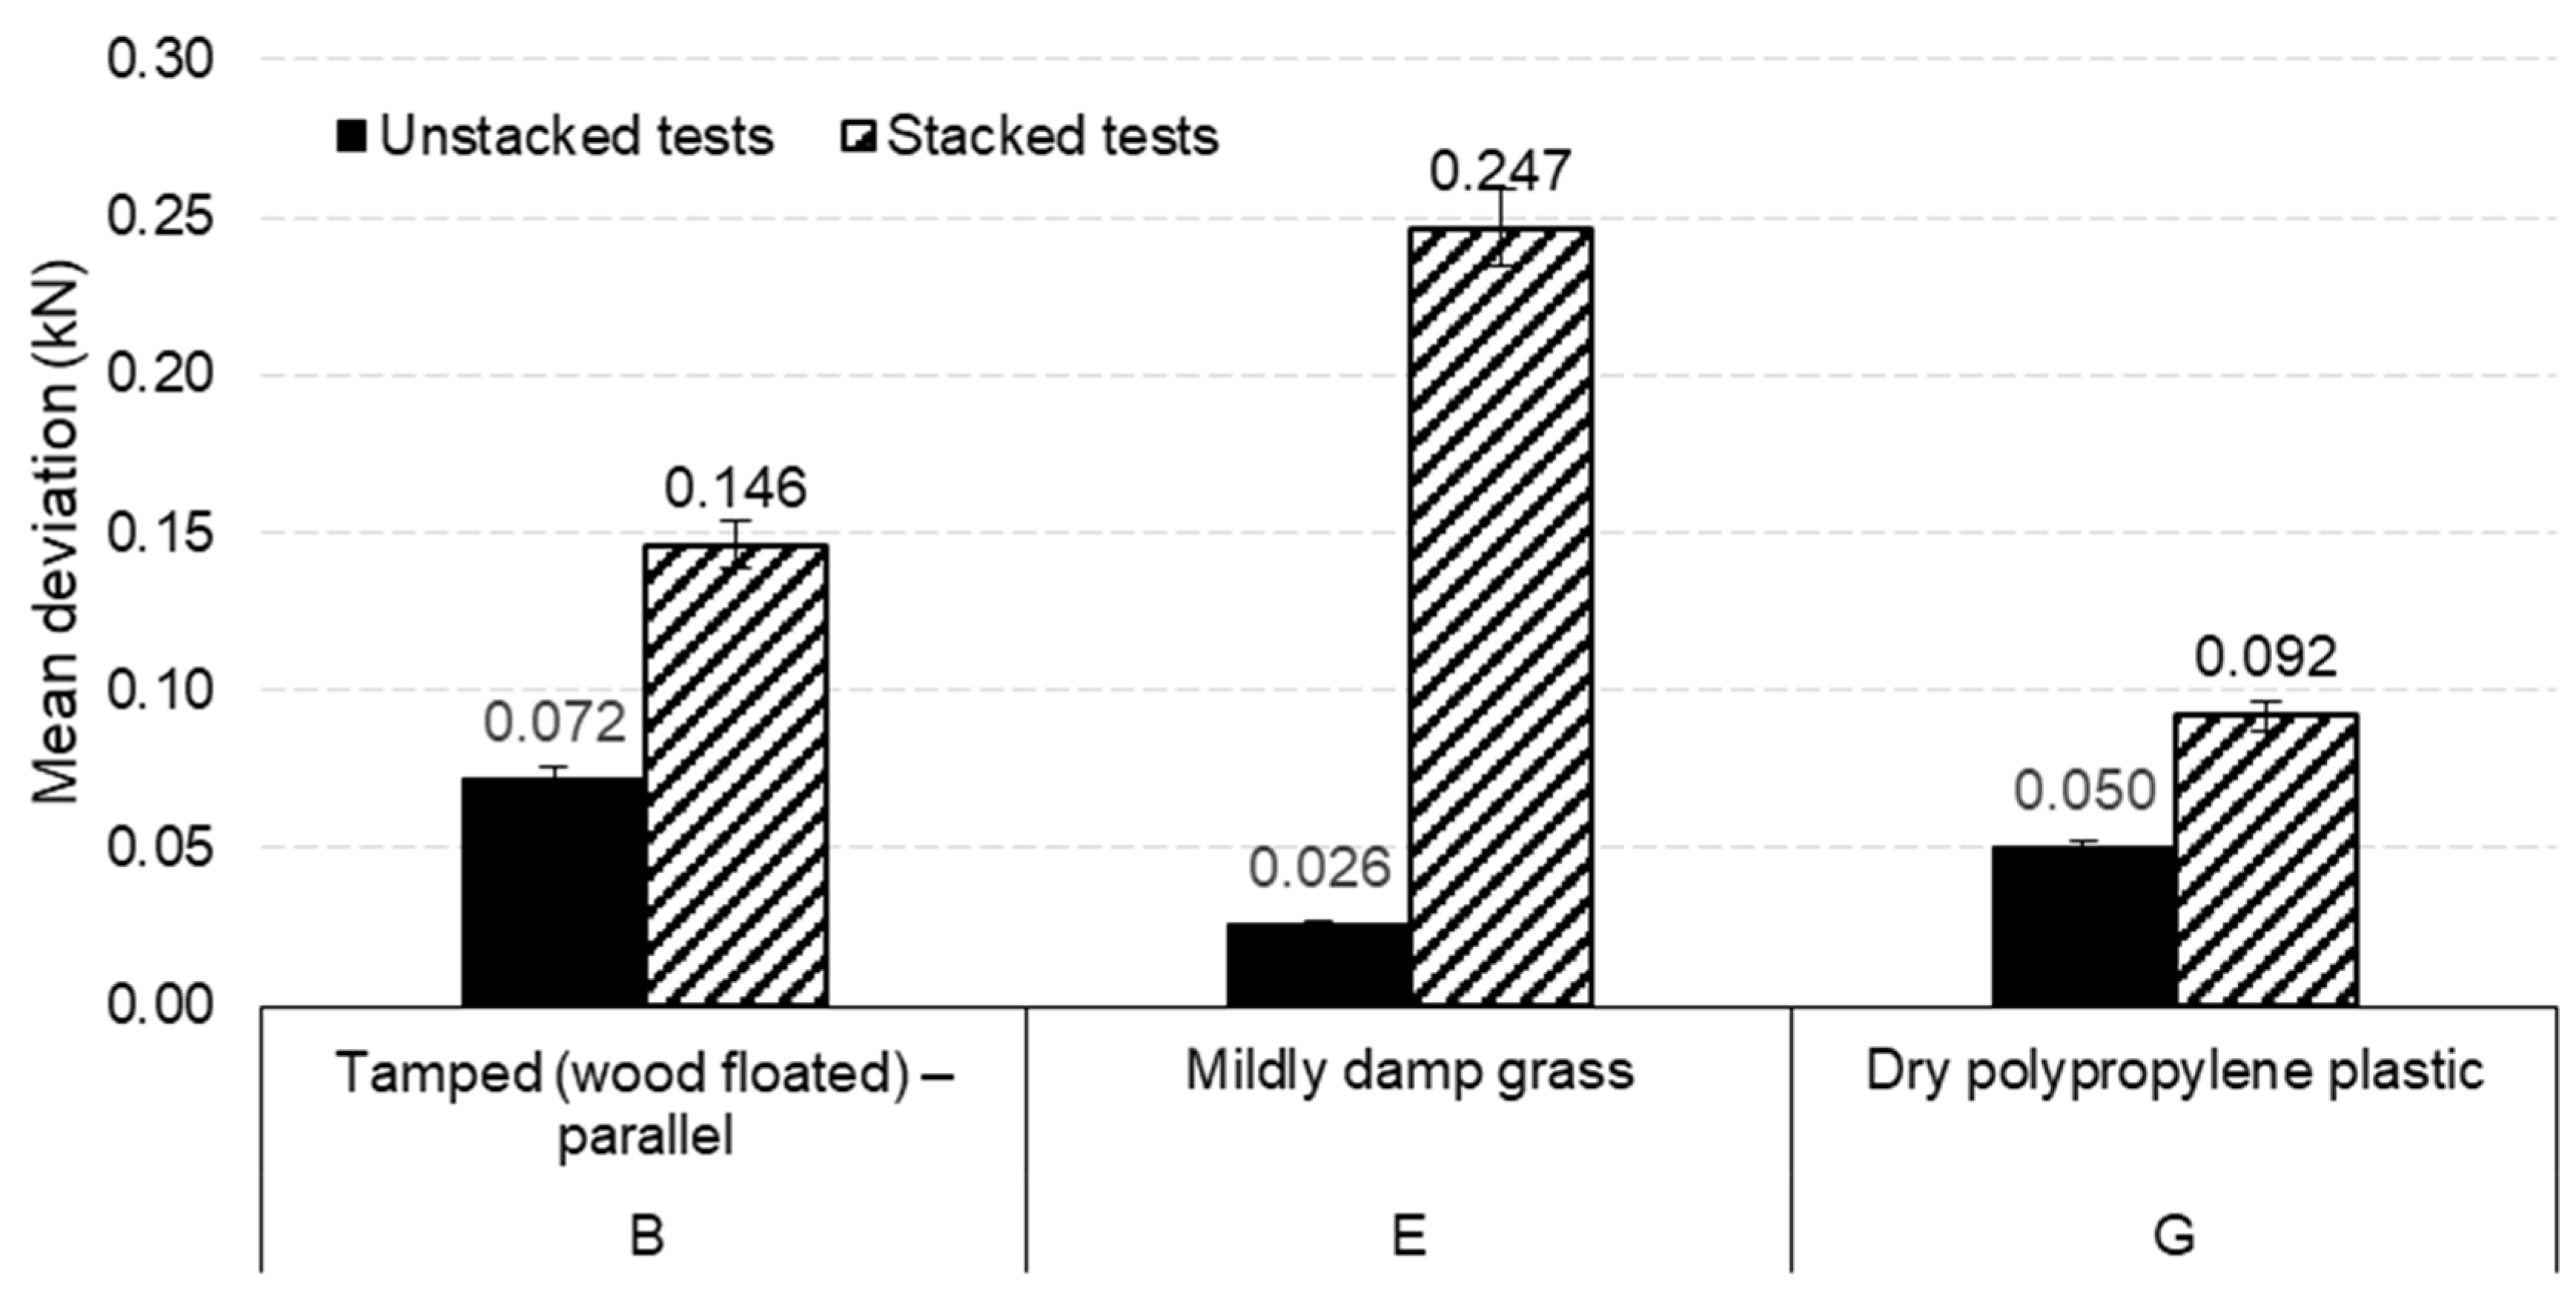
| Ref. | Frictional Bedding Surface 2 | No. of Readings Taken | Max Load Cell Reading Range (kN) | Mean Deviation (kN) |
|---|---|---|---|---|
| Unstacked tests | ||||
| A | Dry interior concrete: Smooth (steel floated) | 5 | 2.53–2.63 | 0.026 |
| B | Slightly damp exterior concrete: Tamped (wood floated)—parallel | 5 | 3.45–3.71 | 0.072 |
| C | Slightly damp exterior concrete: Tamped (wood floated)—perpendicular | 5 | 3.57–3.67 | 0.028 |
| D | Slightly damp macadam asphalt | 5 | 3.26–3.61 | 0.098 |
| E | Mildly damp grass | 5 | 4.28–4.36 | 0.026 |
| F | Damp unmade gravel road | 5 | 4.59–4.94 | 0.090 |
| G | Dry polypropylene plastic | 5 | 2.69–2.84 | 0.050 |
| Stacked tests | ||||
| B | Slightly damp exterior concrete: Tamped (wood floated)—parallel | 5 | 7.71–8.18 | 0.146 |
| E | Mildly damp grass | 5 | 7.75–8.61 | 0.247 |
| G | Dry polypropylene plastic | 5 | 5.02–5.40 | 0.092 |
| Ref. | Frictional Bedding Surface 2 | Calculated Static Friction Coefficient Range (µ) |
|---|---|---|
| Unstacked tests | ||
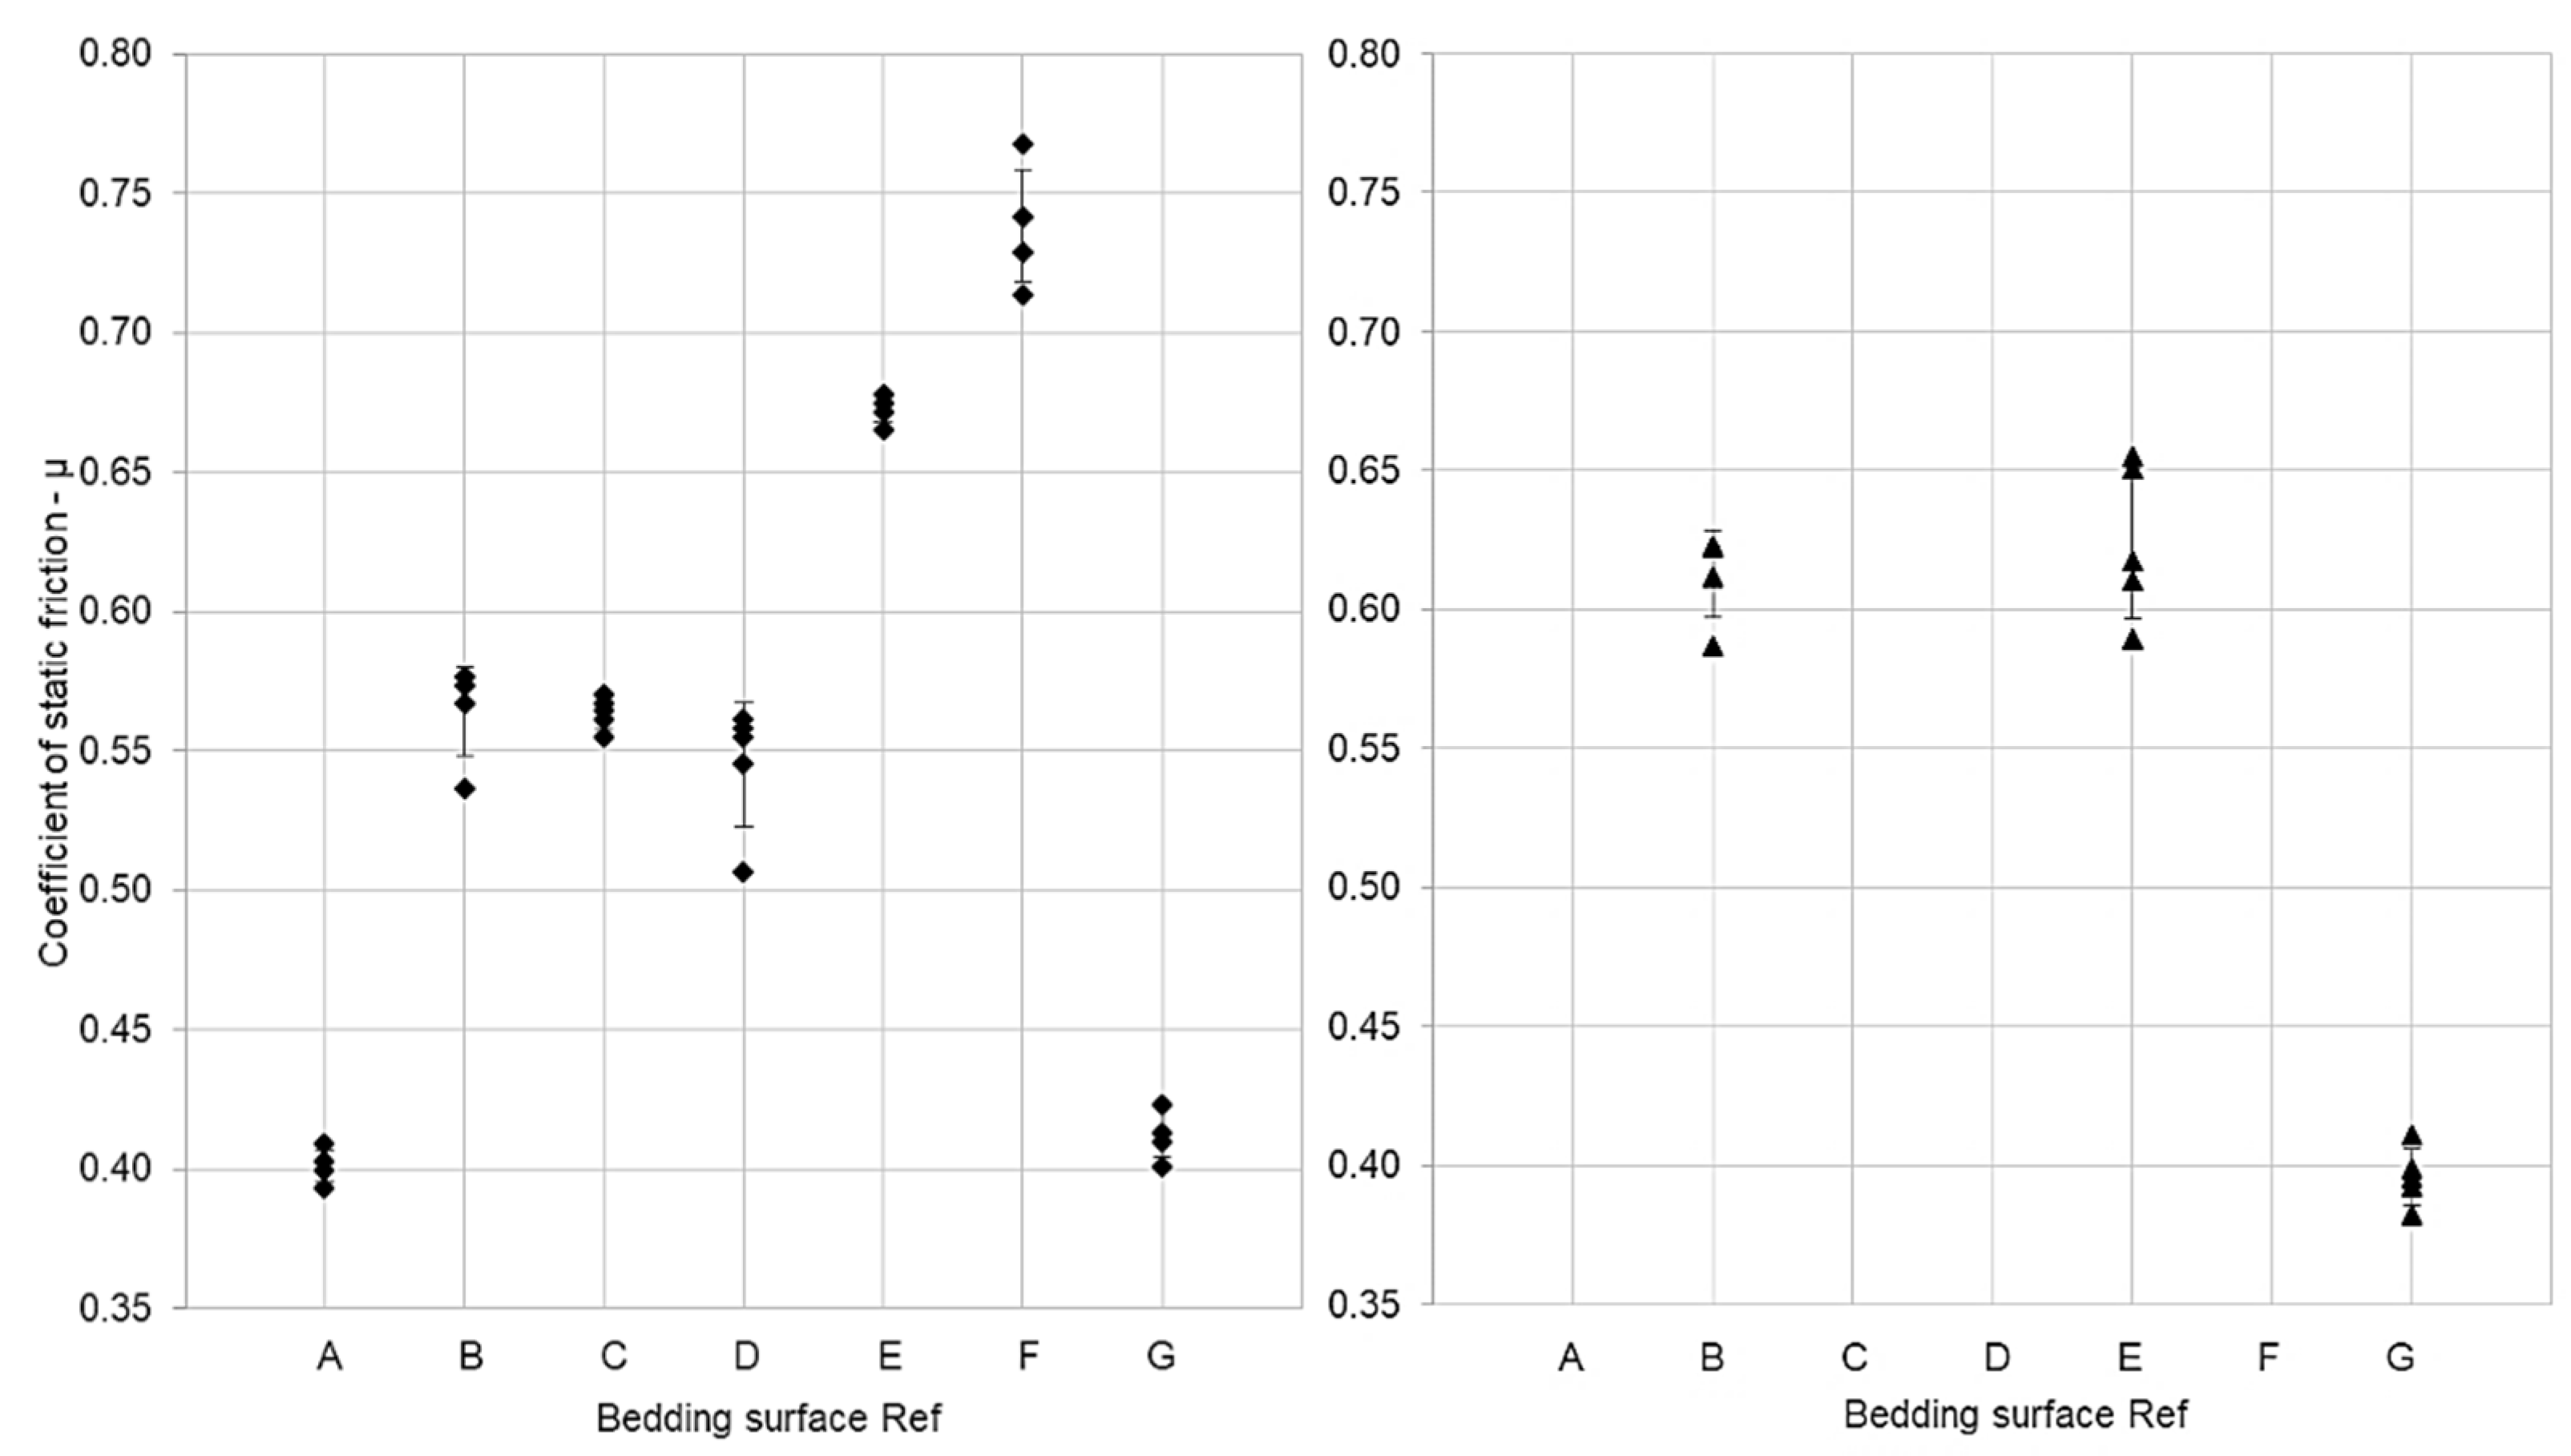
| A | Dry interior concrete: Smooth (steel floated) | 0.39–0.41 |
| B | Slightly damp exterior concrete: Tamped (wood floated)—parallel | 0.54–0.58 |
| C | Slightly damp exterior concrete: Tamped (wood floated)—perpendicular | 0.55–0.57 |
| D | Slightly damp macadam asphalt | 0.51–0.56 |
| E | Mildly damp grass | 0.67–0.68 |
| F | Damp unmade gravel road | 0.71–0.77 |
| G | Dry polypropylene plastic | 0.40–0.42 |
| Stacked tests | ||
| B | Slightly damp exterior concrete: Tamped (wood floated)—parallel | 0.59–0.62 |
| E | Mildly damp grass | 0.59–0.65 |
| G | Dry polypropylene plastic | 0.38–0.41 |
| Ref. | Calculated Static Friction Coefficient (µ) | Percentage Variance (%) | |
|---|---|---|---|
| Single Bag (Unstacked) | Two Bags (Stacked) | ||
| B | 0.56 | 0.61 | 8.2 |
| E | 0.67 | 0.62 | 7.5 |
| G | 0.41 | 0.40 | 2.4 |
| Ref. | Frictional Bedding Surface 2 | Friction Surface 1 |
|---|---|---|
| Woven Polypropylene Plastic (Bulk Bag Material) | ||
| A | Dry interior concrete: Smooth (steel floated) | 0.40 |
| B | Slightly damp exterior concrete: Tamped (wood floated)—parallel | 0.58 |
| C | Slightly damp exterior concrete: Tamped (wood floated)—perpendicular | 0.56 |
| D | Slightly damp macadam asphalt | 0.54 |
| E | Mildly damp grass | 0.64 |
| F | Damp unmade gravel road | 0.74 |
| G | Dry polypropylene plastic | 0.40 |
Publisher’s Note: MDPI stays neutral with regard to jurisdictional claims in published maps and institutional affiliations. |
© 2022 by the authors. Licensee MDPI, Basel, Switzerland. This article is an open access article distributed under the terms and conditions of the Creative Commons Attribution (CC BY) license (https://creativecommons.org/licenses/by/4.0/).
Share and Cite
Klipalo, E.; Besharat, M.; Kuriqi, A. Full-Scale Interface Friction Testing of Geotextile-Based Flood Defence Structures. Buildings 2022, 12, 990. https://doi.org/10.3390/buildings12070990
Klipalo E, Besharat M, Kuriqi A. Full-Scale Interface Friction Testing of Geotextile-Based Flood Defence Structures. Buildings. 2022; 12(7):990. https://doi.org/10.3390/buildings12070990
Chicago/Turabian StyleKlipalo, Emmett, Mohsen Besharat, and Alban Kuriqi. 2022. "Full-Scale Interface Friction Testing of Geotextile-Based Flood Defence Structures" Buildings 12, no. 7: 990. https://doi.org/10.3390/buildings12070990
APA StyleKlipalo, E., Besharat, M., & Kuriqi, A. (2022). Full-Scale Interface Friction Testing of Geotextile-Based Flood Defence Structures. Buildings, 12(7), 990. https://doi.org/10.3390/buildings12070990