Abstract
The vulnerability of bridges and the effectiveness of suitable mitigation techniques in regions exposed to different seismic scenarios, while lacking reliable fragility assessment studies for existing bridge inventory, need focused attention. Further, while several retrofit techniques were proposed for improving the seismic performance of existing bridges, the limitations of such approaches need further investigation. Thus, this study assesses the seismic vulnerability of a benchmark structure representing pre-seismic code multi-span bridges in an earthquake-prone region before and after the retrofit to mitigate earthquake-related losses. The numerical modeling approaches of the selected bridge and retrofit systems were verified using the results of previous experimental studies. Detailed three-dimensional fiber-based (3DFB) simulation models were then developed to assess the seismic response of the benchmark bridge under the effects of diverse earthquake records representing far-field and near-source seismic scenarios in both longitudinal and transverse directions. The obtained results from several inelastic pushover analyses (IPAs) and incremental dynamic analyses (IDAs) confirmed the vulnerability of the benchmark bridge and the pressing need for mitigation actions to reduce the expected seismic losses under different seismic scenarios. Higher damage probabilities were observed under the effects of far-source events and at lower intensities than their near-field counterparts. Based on the probabilistic assessment study, it is concluded that retrofitting the bridge with buckling restrained braces (BRBs) is an effective mitigation measure to increase the lateral strength and overcome the high curvature ductility (CD) demands observed in bents, particularly under the most critical seismic scenario. The study provides insight into the impacts of contemporary retrofit techniques on improving the seismic performance of substandard bridges and presents a range of fragility functions for the assessment and mitigation of earthquake risks.
1. Introduction
Bridges are vital infrastructure components required to be serviceable after earthquakes. Failing to satisfy such a condition could result in the shutdown of damaged bridges, possibly causing negative consequences on daily traffic. In addition, observations from previous earthquakes indicate that substandard bridges built using guidelines and provisions that do not meet current design standards may not withstand earthquake loads and could suffer extensive damage or even collapse under severe seismic events [1,2,3]. Therefore, the vulnerability of pre-seismic codes and substandard bridges in earthquake-prone regions should be carefully assessed, and retrofit techniques should be proposed to mitigate the expected losses due to the lack of adequate seismic provisions during construction. Earthquake risk management approaches can help since they can estimate regional losses under seismic hazards [2,4,5,6]. Possible mitigation approaches can also be suggested to reduce expected losses. Developing a risk management system for a region requires assessing the vulnerability of representative structures of the exposed inventories, including bridges.
Several analysis methods are used for the evaluation of the seismic response of existing bridges, including the capacity spectrum method (CSM), elastic response history analysis (ERHA), inelastic pushover analyses (IPA), inelastic response history analysis (IRHA), and incremental dynamic analysis (IDA) [7,8]. These analysis methods can be used with different representations of the assessed structure and its components. The applicability of the analysis method depends on the characteristics of the bridge and earthquake ground motions. For existing multi-span bridges, IRHA and IDA are the most realistic procedures for seismic performance assessment due to their ability to account for different vibration modes, gaps, bridge bearings, skewness, and abutments effects on the seismic response [9,10]. Methodologies for generating analytical fragility functions for highway bridges using IDA, considering the seismic performance of bridge components, such as columns and bearings, were proposed in the literature. The need for considering individual bridge components for generating the entire bridge system fragilities was also recommended in previous studies [11,12].
In addition to the approach for generating analytically-based fragility functions using IDA, the recent developments in machine learning techniques have enabled researchers to use the artificial neural network in seismic fragility assessment, providing fragility relationships for the risk assessment of bridges at urban or regional scales [13,14]. Rapid screening methods for classifying existing structures damage using advanced soft computing techniques, such as the artificial neural network, fuzzy logic, and machine learning have recently started to gain focused attention [15,16,17]. Recent studies have addressed evaluation approaches of existing bridges under earthquake loads, considering material degradation [18]. Recent studies have also conducted fragility analysis for the seismic performance assessment of complex structures, such as truss and cable-stayed bridges [19,20].
Seismic mitigation techniques, such as steel braces, can be placed in angled directions for retrofitting existing bridge bents. However, the yielding of steel braces could cause permanent deformations. Buckling could occur during the reversed cyclic loading, causing relatively early failure in bridge bents. To overcome the disadvantages of conventional steel braces in resisting high compression forces, buckling restrained braces (BRBs) can be designed to restrain buckling under large axial compressive loads. BRBs have relatively light weights, do not increase the mass and inertia forces of the bridge, and can be used as sacrificial elements to yield before detecting damage in other structural members. Therefore, previous experimental and analytical studies investigated the effectiveness of the BRB retrofit approach for the seismic upgrading of steel and concrete bridges with different structural systems [21,22,23]. It was concluded that the BRB retrofits reduced the probability of failure since they act as structural fuses that sustain demands and dissipate seismic energy through hysteretic behavior. However, the BRB members may experience large residual deformation under strong earthquakes. Therefore, self-centering (SC) BRBs with a flag-shaped hysteretic response and small residual deformation were proposed in previous studies to retrofit bridge bents [24,25,26,27]. However, it was indicated that SC BRBs might increase the peak response of the bridge, which is a limitation that needs further investigation.
A medium seismicity region, represented by the United Arab Emirates (UAE), exposed to various seismic scenarios, was selected as a case study. This area was previously considered a non-seismic region [28]. However, based on several recent seismic hazard studies, the UAE is currently regarded as a low-to-medium seismicity region [29,30,31,32,33]. It is also noteworthy that the design approach and criteria were updated in other regions, such as the U.S., after major earthquakes (e.g., Loma Prieta in 1989, [8]). Accordingly, bridges constructed in the UAE in the 1990s and before may be vulnerable to losses due to the possible lack of adequate seismic provisions at their construction times [34]. In addition, several probabilistic assessment studies were conducted in the UAE for different types of regular and irregular buildings with different structural systems, building heights, and construction dates [35,36,37]. The previous vulnerability assessment and seismic hazard studies in the UAE concluded that substandard and pre-code structures might be vulnerable to damage under the following seismic scenarios: (i) near-field events originating from local sources and (ii) far-field earthquakes generated from regional faults. However, there are no fragility assessment studies related to the bridge inventory in the UAE. This brief discussion highlights the pressing need to develop reliable fragility relationships for bridges, particularly substandard bridges and those constructed before adopting current seismic design standards and guidelines.
Moreover, although several previous studies were directed at the seismic retrofits of bridges in other regions, the effectiveness of suitable retrofit techniques for the bridge systems in this region has not been explored. Thus, this study focuses on the earthquake vulnerability assessment of a benchmark structure representing typical substandard multi-span bridges in the UAE before and after the retrofit with different BRB mitigation approaches. Based on the results of previous studies, the retrofit techniques adopted in the present study are as follows: (i) conventional BRBs, and (ii) self-centered BRBs. The study surveyed the existing bridges in a selected city in the study region to select a representative benchmark structure. Detailed three-dimensional fiber-based (3DFB) models were developed for the benchmark bridge. Numerical models of the selected retrofit systems were developed, verified using previous experimental studies, and then implemented in the 3DFB model of the benchmark bridge. Local and global seismic performance of the benchmark bridge were assessed before and after implementing the seismic mitigation techniques using IDA and earthquake records representing the study region’s seismicity. Finally, a wide range of fragility functions was derived for the benchmark bridge before and after retrofitting to be ready for implementation in a loss estimation system for the region.
2. Selection of Benchmark Bridge
The selected study area (Al-Ain City, UAE) represents a medium seismicity region exposed to two distinct seismic scenarios. A bridge database collected in this study using satellite imageries and several confirmatory site visits indicated that most of the bridges in the study area were reinforced concrete (RC) multi-span span bridges supported on different substructure systems, as shown in Figure 1. Thus, the benchmark bridge was selected based on the on-ground survey of the bridge inventory in the study. The selected bridge consists of two identical structures, each composed of five spans, as shown in Figure 2. The superstructure consists of a RC deck supported on RC girders. In the longitudinal direction of the bridge, four parallel girders are extended over 14 m across the bridge. The superstructure is supported on elastomeric bearings. The bridge has one expansion joint between adjacent spans to allow thermal movement, including the expansion joints at the abutments. Each expansion joint is 40 mm. The substructure consists of four bents; each comprises two columns with a circular cross-section and a cap beam, as shown in Figure 2. The distance between the bridge bents is 14 m.

Figure 1.
Substructural systems of reinforced concrete (RC) bridges.
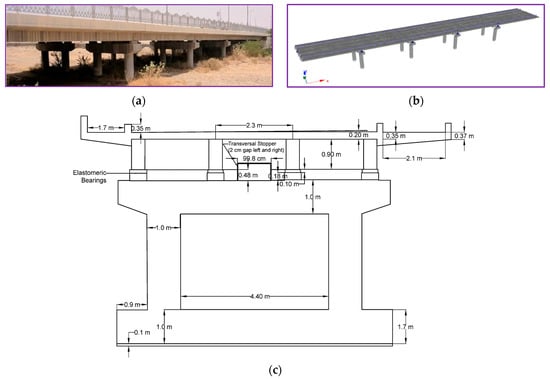
Figure 2.
Benchmark bridge: (a) general view, (b) three-dimensional fiber-based (3DFB) model, and (c) bridge bent cross-sectional view.
3. Verification of Numerical Modeling before and after Retrofit
In addition to the verifications previously made in other studies for the modeling approaches of the RC structures through shake table experiments [37,38], the idealization adopted in the current probabilistic assessment study for existing and retrofitted bridge bents was verified before implementing it at the bridge level. The verification process ensured that the utilized modeling approach realistically predicted the seismic performance of the existing and retrofitted bridge. A bridge substructure system was chosen for this verification to represent the existing RC multi-column bridge bents [39]. The multi-column bridge bent was tested using quasi-static cyclic loading by Bazaez and Dusicka [23]. The bent has three main elements: two columns and a cap beam. The tested pier has a height of 2845 mm, and the cap beam length is 3048 mm. Three specimens were tested under cyclic testing: (i) as-built bent, (ii) retrofitted specimen with BRB1 (sacrificial), and (iii) retrofitted specimen with BRB2 (non-sacrificial), which has a smaller cross-section than BRB1. A load cell was placed at the midspan of the cap beam to monitor the internal forces and enable calculating the axial force in the BRB during testing. A load of 364 kN was applied towards gravity on top of the columns. The column footing joint had dowels with a length of 635 mm that were considered in the numerical model developed for the bridge bent.
Modeling the bent was undertaken in the present study using the versatile fiber-based analysis platform SeismoStruct, as shown in Figure 3. This analysis platform can predict the structural behavior under static or dynamic loadings, considering geometric nonlinearities, and material inelasticity [40]. Several recent studies have verified the fiber-based modeling approach adopted by this analysis platform [37,38]. Each structural member was modeled using several inelastic displacement-based frame elements to increase the analysis accuracy. The unconfined and confined concrete and rebars of different cross-sections were idealized through the fiber modeling approach. The actual material properties were used for modeling the selected benchmark bridge. Concrete cross-sections were modeled using an average concrete compressive strength of 24.4 MPa through a uniaxial constant confinement concrete model. The steel yield strength of longitudinal and transverse reinforcement was 462 and 264 MPa, respectively. Reinforcing steel was modeled using the bilinear stress–strain steel model. This steel model includes kinematic strain hardening and has easily identifiable calibrating parameters [40]. The BRBs used to retrofit the test specimens consisted of a steel core and a surrounding mortar. These BRBs were modeled in the present study using trilinear asymmetric link elements. The axial load-elongation relationships of BRB1 and BRB2 are depicted in Figure 4 and Figure 5, respectively.
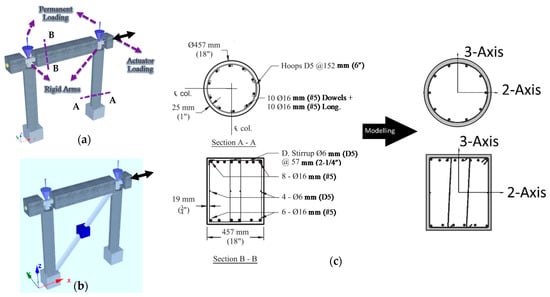
Figure 3.
Idealizing of bridge bent for the verification of modeling approaches: (a) fiber-based model of existing bridge bent test specimen, (b) fiber-based model of retrofitted bridge bent with buckling restrained brace (BRB), and (c) modeling of the pier and cap beam sections.
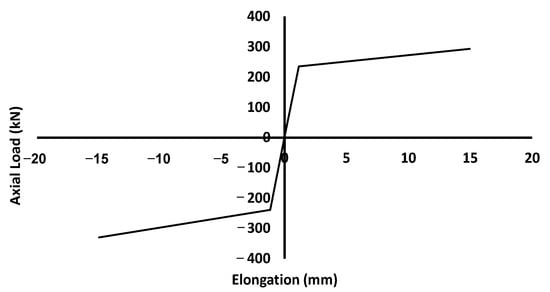
Figure 4.
Load deformation relationship adopted for modeling BRB1 based on previous test results [39].
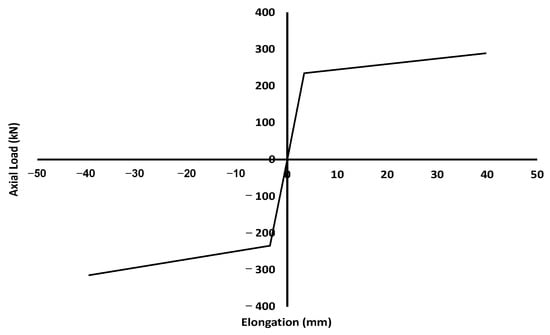
Figure 5.
Load deformation relationship adopted for modeling BRB2 based on previous test results [39].
The developed fiber-based numerical models of the multi-column bridge bent before and after the retrofit with BRBs are subjected to cyclic loadings to simulate the actuator loading and verify the adopted modeling approach using the previous experimental results. After applying the gravity loads of the superstructure to the bridge bent, it was subjected to a quasi-static cyclic loading. Then, the loading protocol displacement was applied at the mass locations to simulate the inertial forces generated by earthquake loading. Figure 6, Figure 7 and Figure 8 show the loading protocols used in the inelastic analysis of the bridge bent before and after the retrofit. The cyclic loading used for the as-built specimen was developed based on the study by Bazaez and Dusicka [41], in which statistical analyses were conducted to develop the loading protocols for each tested specimen, considering the number of inelastic cycles and cumulative inelastic demands. It is noteworthy that the loading protocol in the study by Bazaez and Dusicka [41] was presented as a displacement ductility versus the number of cycles. Therefore, the loading protocol was converted into a displacement history by considering the effective yield displacement, which varied for each tested bridge bent specimen. It is also worth noting that the as-built bridge bent’s loading protocol was significantly different from other bents since its fundamental period was 0.5 s and was expected to reach large top displacement demand. The main difference between the loading protocols of the bents retrofitted with BRB1 and BRB2 was the applied maximum displacement since they both have the same fundamental period of 0.2 s. The two loading protocols caused the two retrofitted bridge bents to vibrate with the same frequency but with different top displacements, as shown in Figure 7 and Figure 8.
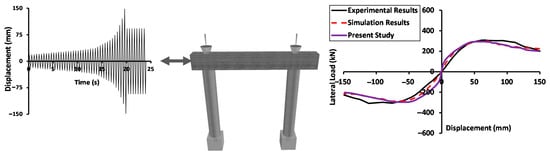
Figure 6.
Comparison of inelastic analysis results and previous experimental and analytical studies of as-built bridge bent: cyclic loading protocol used in the multi-column bridge bent inelastic analysis (left) and backbone curves (right).
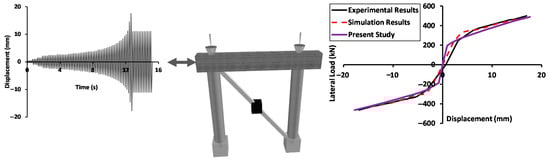
Figure 7.
Comparison of inelastic analysis results and previous experimental and analytical studies of bridge bent retrofitted with BRB1: cyclic loading protocol used in the multi-column bridge bent inelastic analysis (left) and backbone curves (right).
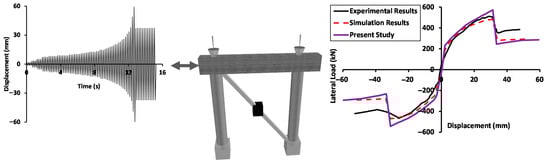
Figure 8.
Comparison of inelastic analysis results and previous experimental and analytical studies of bridge bent retrofitted with BRB2: cyclic loading protocol used in the multi-column bridge bent inelastic analysis (left) and backbone curves (right).
The results obtained from the inelastic analysis of the multi-column bridge bents are represented as a hysteretic force–displacement diagram. The backbone curves shown in Figure 6, Figure 7 and Figure 8 were obtained by plotting the maximum force–displacement response. The backbone curves were then compared with previous experimental and analytical studies [23]. The results are consistent with the large-scale experiments using quasi-static cyclic loading. It is noteworthy that the sudden drop in strength shown in Figure 8 for the bent retrofitted with BRB2 is due to the BRB fracture, which is effectively accounted for in the modeling approach adopted in the present study. Although Figure 8 shows that the current study’s backbone curve slightly underestimates the residual strength of the retrofitted bent with BRB2. The developed fiber-based numerical model shows close results to the previous analytical study. The presented results in Figure 6, Figure 7 and Figure 8 verify the adopted fiber-based modeling approaches for the as-built and retrofitted bridge bents and enable using them for the seismic performance assessment of the selected benchmark bridge, as subsequently discussed.
4. Three Dimensional Fiber-Based Modeling of Benchmark Bridge
The benchmark bridge was selected based on the bridge survey conducted in this study to represent the typical multi-span bridges built in the case study area. As previously highlighted, the UAE was previously classified by the design code as a non-seismic zone. Therefore, old structures designed and constructed in the early 2000s and before in the study area (Al-Ain City, UAE) were considered in this study as pre-seismic code structures (i.e., designed without considering earthquake loads). The UAE is currently considered a low-to-medium seismicity region exposed to various seismic scenarios. Hence, the pre-seismic code structures represented by the benchmark bridge may be vulnerable to damage when exposed to natural hazards influencing their serviceability or functionality.
An out-of-phase motion may occur for different segments of the benchmark bridge. To ensure that pounding or unseating at bridge gaps is effectively captured under the effects of different seismic scenarios, a 3DFB model of the whole multi-segment benchmark bridge was developed to account for the interactions between different parts. The modeling approach verified in this study for the bridge substructure and its retrofit options was adopted to idealize the benchmark bridge. Different structural members of the superstructure, including the main girders, cross-beams, and gaps, were considered in the 3D model to predict the benchmark bridge’s seismic response from various analyses, as shown in Figure 9. The numerical capabilities of the analysis platform used in this study are effective enough to consider the deck as an inelastic frame element by idealizing the deck girders and cross-beams using several inelastic displacement-based elements. This would improve the seismic response prediction of the bridge.
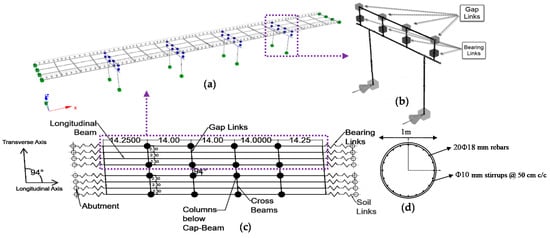
Figure 9.
Benchmark bridge model: (a) 3DFB model of the bridge, (b) fiber-based model of bridge bent, and (c) schematic top view of the whole bridge, which includes two identical structures, a (d) column cross-section, and reinforcement.
The abutments were modeled in the longitudinal direction of the bridge according to the simple hyperbolic force–displacement equation developed by Shamsabadi et al. [42]. The average soil stiffness for granular backfill, similar to that in the construction site of the investigated bridge, was used for modeling the passive stiffness (i.e., superstructure applies compression to abutment), while one-fifth of this stiffness was used for the active soil pressure. The stiffness was estimated considering the height of the abutment wall of 8.06 m. In the transverse direction, the bridge abutment’s stiffness was considered as one-half the stiffness of the nearest bent [43]. The pushover analysis was performed for a bridge bent to obtain the capacity curve, and the lateral stiffness was estimated using the elastoplastic idealization [44].
The properties and force–displacement relationships of the bridge gaps in the longitudinal and transverse directions are depicted in Figure 10. The longitudinal direction features a gap of 40 mm between bridge deck segments. In the transverse direction, the bridge has a stopper with a small gap of 20 cm in the positive (tension) and negative (compression) directions. Link elements were employed to account for the collision and slippage at the expansion joints and stoppers in the longitudinal and transverse directions, respectively. It is noteworthy that Mwafy et al. [45] investigated different modeling approaches for the stiffness at the expansion joints of a complex bridge. In a detailed modeling approach [46], the pounding was represented by a nonlinear spring (Hertz model) and the impact stiffness increased gradually with the penetration of pounding. The bridge seismic response using this detailed idealization was compared with a simplified linear spring model employing a maximum impact stiffness. It was concluded that the detailed gap model had a marginal effect on the bridge response. Therefore, the present study adopted the simplified approach to model the impact stiffness, as shown in Figure 10. In this modeling approach of the expansion joint and stopper, a positive relative displacement corresponds to an opening of the joint gap and a negative displacement corresponds to a closing of the gap. When the gap at the expansion joint or the stopper undergoes a relative movement in the negative direction (joint close) exceeding the gap width, the joint element begins resisting further opening (collisions). It is also noteworthy that other modeling approaches can be adopted, as recommended in previous studies [20]. The bridge bearings have lengths of 40 cm in the longitudinal direction and 25 cm in the transverse direction. The force–displacement relationships of the bearings were calculated considering a maximum deformation equal to half the bearing dimension in the longitudinal and transverse directions. The stiffness of the bridge bearings up to the maximum deformation was calculated based on the rubber shear modulus and bearing dimensions, as recommended in previous experimental studies [47,48].
Figure 10.
Gap properties: (a) expansion joint in the longitudinal direction and (b) stopper in the transverse direction.
5. Performance Assessment of As-Built Bridge
5.1. Dynamic Characteristics
The developed three-dimensional fiber-based model of the benchmark bridge was used to predict its dynamic characteristics. The Eigenvalue analysis was also used as an initial validation tool for the analytical models. The first three modes of vibration in the longitudinal direction had periods of 1.02, 0.99, and 0.96 s, respectively. The first three modes of vibration in the transverse direction had periods of 0.66, 0.35, and 0.21 s, respectively (Figure 11). The effective modal mass percentages of the first mode in the longitudinal and transverse directions of the bridge were 74.2% and 78.4%, respectively. The free vibration analysis results show that higher modes of vibration marginally contributed to the dynamic response of the benchmark bridge, which was dominated by its first mode. The results also show a substantial difference between the periods of vibrations in the two orthogonal directions of the bridge, reflecting the pressing need to assess their seismic response under the effects of different seismic scenarios.
Figure 11.
Modes of vibration of the bridge: (a–c) longitudinal direction and (d–f) transverse direction.
5.2. Bridge Lateral Capacity
The pushover analysis was conducted in each of the two orthogonal directions of the bridge, with two scenarios: the first was for one bent only, and the second scenario was for the entire bridge with all superstructure and substructure elements. It is noteworthy that the abutment translational restraints in the X and Y directions were released when performing the pushover analysis in the longitudinal and transverse directions, respectively. The longitudinal performance proved to be more ductile, while the transverse directions proved to have higher lateral strength due to the framing-action of the RC multi-column bents, as shown in Figure 12 and Figure 13.
Figure 12.
Pushover analysis results in the longitudinal (X) direction: (a) deformed shape and damage locations, and (b) capacity curves of the one bent and the whole bridge.
Figure 13.
Pushover analysis results in the transverse (Y) direction: (a) deformed shape and damage locations, and (b) capacity curves of the one bent and the whole bridge.
The damage locations in the longitudinal direction of the benchmark bridge are shown in Figure 12a, and the lateral capacity is depicted in Figure 12b. It is seen that the full-bridge lateral strength is almost four times the strength of one bent. The damage observed in the full-bridge model indicates yielding at a top bent displacement of 27 mm with a base shear of 1680 kN. Afterward, crushing in concrete occurs at the base of the bridge bents with a displacement of 128 mm at a base shear of 2342 kN.
The damage observed in the transverse direction of the bridge is more significant than in the other direction and indicates yielding at a top bent displacement of 11 mm with a base shear of 3608 kN, as seen in Figure 13. Afterward, concrete crushing is detected in the bridge bents at a top displacement of 63 mm and a base shear of 6084 kN. The lateral strength of the whole bridge is more than four times that of the single bent due to the framing-action of the bridge bents in the transverse direction. The analysis results show that plastic hinges form first at the bottom parts of the columns, followed by the upper segments. Afterward, yielding spread upwards until reaching half the height of the columns. The damage locations in the transverse direction of the bridge are shown in Figure 13a.
5.3. Assessment of Seismic Response
Dynamic time history analyses were conducted to provide insight into the seismic response of the bridge under the effect of earthquake records representing the seismicity of the study area [31]. This study considered fourteen input ground motions representing seven far-field and seven near-source earthquake records. These earthquakes were deemed suitable for the study area and were used in previous vulnerability assessment studies of structures [35,36,37,49]. The means of the selected input ground motions match the means of 40 earthquake records used in the previous seismic assessment studies for the study area. For each adopted seismic scenario, Figure 14 compares the response spectra of the 20 input ground motions previously used in seismic assessment studies and their mean, with the mean of the earthquake records selected for the present study. The presented comparison in Figure 14 confirms that the precise selection of earthquake records to represent each seismic scenario helped to reduce the number of analyses without compromising accuracy. The earthquake records representing the far-field seismic scenario were scaled to different intensities, starting from the design intensity (i.e., 0.16 g or 1× Design) up to 6.0× Design, with a step of 0.16 g. The near-field records were also scaled to different intensities, starting from 2.5× Design up to 15× Design, with a step of 2.5× Design. The scaling factors of the two seismic scenarios were selected to satisfy the adopted performance criteria for the seismic assessment of the benchmark bridge, as discussed hereafter.
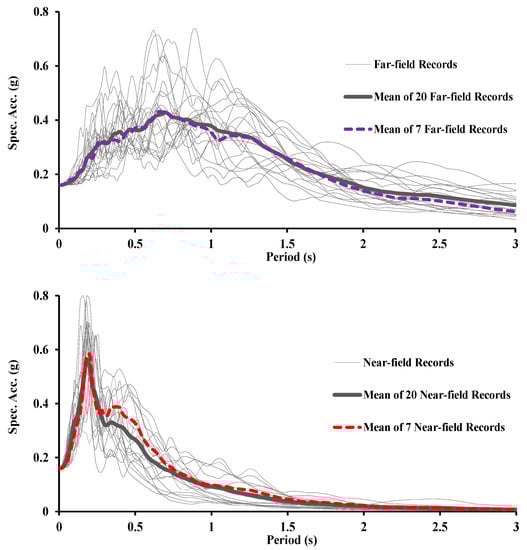
Figure 14.
Acceleration response spectra of the selected far-field earthquake record (top) and near-source ground motions (bottom) scaled to the design earthquake intensity.
Samples of time-history analysis results are shown in Figure 15 for the seismic energy transmitted per unit time (energy flux) and top displacement histories at selected points (J1 to J8) under the far-field earthquake Bucharest when applied to the bridge in the longitudinal and transverse directions. As previously emphasized from the free vibration analysis, Figure 15 shows that the period of vibrations in the longitudinal direction is longer than the transverse counterpart. It is seen that higher top displacements are detected at the top of the intermediate bents (i.e., J3–J6). The maximum top displacement in the longitudinal direction is observed at Point J3, which results in a top drift of 0.56%, considering a pier height of 5730 mm. This corresponds to a total seismic energy of 49%. Point J6 exhibits the highest top displacement in the transverse direction, resulting in a top drift of 0.085%, corresponding to a total seismic energy of 58%. It is shown that the amount of seismic energy needed to reach this minor drift in the transverse direction is higher than that observed in the longitudinal direction of the bridge. The results confirm the significant difference between the seismic response of the bridge in the two orthogonal directions. The longitudinal direction exhibits higher deformations than its transverse counterpart, as shown in the higher top drift observed in the former direction at lower seismic energy.
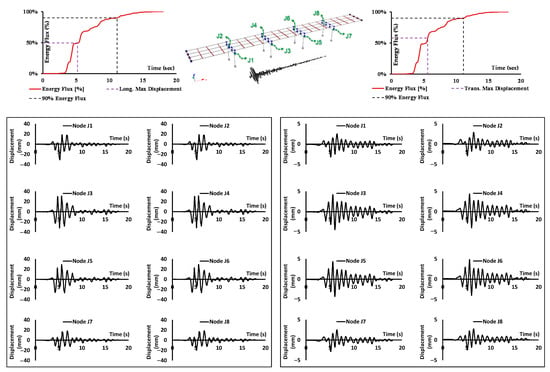
Figure 15.
Seismic energy and top displacement histories under the far-field earthquake Bucharest in the longitudinal (left) and transverse (right) directions—design intensity.
Samples of the deformation demands at the expansion joints and damage locations of the investigated bridge in the longitudinal direction under a far-field earthquake, represented by Loma Prieta, Emeryville, and the transverse direction when subjected to the near-field input ground motion Lazio Abr.-Cassino-Sant Elia are shown in Figure 16. Multiple pounding instances between bridge segments were observed in the longitudinal direction of the bridge when the expansion joints closed and reached their maximum widths of 40 mm (negative displacement), as depicted in Figure 10. However, unseating was not observed as the maximum positive displacement (gap opening) did not reach the threshold of 280 mm. In the transverse direction, the superstructure movement was controlled by a stopper with 20 mm gaps in both directions (i.e., compression and tension deformations, refer to Figure 10). The pounding was observed once the gaps reached a displacement of ±20 mm.
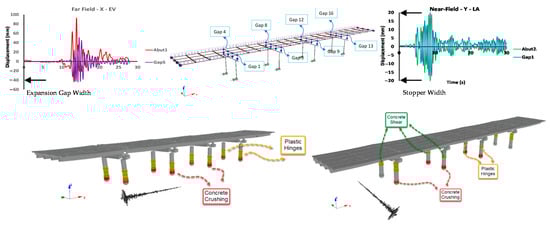
Figure 16.
Bridge damage locations under earthquakes in the longitudinal (left) and transverse (right) directions—design intensity.
The deformation demands observed in the transverse direction were lower than the longitudinal counterpart because of the frame action of the bridge multi-column bents and the stopper used in the former direction, as shown in the results presented in Figure 15. However, multiple poundings were observed due to the small gap width in the transverse direction, as shown in Figure 16. Moreover, in the longitudinal direction, plastic hinges were observed first and then followed by concrete crushing. The damage was mainly concentrated at the bottom of the bridge bents. In the transverse direction, steel yielding was observed at the bottom and top of the columns, followed by concrete crushing at the bottom of the bents. It is noteworthy that the leftmost column of the bent did not reach the same damage level as the rightmost column due to the skewness of the bridge bents (i.e., the angle between the centerline of the deck and the cab beam was 93°). Shear demands exceeded the shear supply calculated based on the conservative design provisions. The shear supply was calculated based on the bridge column cross-section and reinforcement using the shear strength model of the design code and compared with the shear demand during time history analysis, as discussed by Mwafy and Almorad [37]. The seismic demands and damage observed in the bridge under the effects of earthquake records representing far-field and near-source input ground motions when scaled to the design earthquake confirmed the major differences between the seismic responses of the bridge in the two orthogonal directions. As previously emphasized, the longitudinal direction exhibited higher deformations than its transverse counterpart. However, the bridge was stiffer in the transverse direction, and the selected seismic scenarios in this study, particularly the far-field earthquake records, amplified its predominant mode since its fundamental period (0.66 s) matched the high spectral amplifications (refer to Figure 11 and Figure 14). The presented sample’s time history analysis results reflect the pressing need to mitigate the expected damage to the benchmark bridge, particularly in the transverse direction.
6. Probabilistic Assessment of As-Built Bridge
The fragility curve plots the probability of the limit state exceedance versus the ground motion intensity and can account for different sources of uncertainty and variability concerning the capacity and demand. The fragility relationships are crucial for assessing monetary losses and retrofit decision-making. Fragility curves, seismic hazard maps, and inventory data can be integrated to help in formulating regional risk reduction policies [2,4,5]. The fragility curves can be derived using simple approaches, such as inelastic pushover analyses, or more realistic approaches, such as IDA. The IDA approach was adopted in this study because of its ability to account for several sources of uncertainty. For instance, the uncertainty in input ground motions and modeling approaches can be accounted for using IDA. Although the inelastic dynamic response simulation of multi-degree-of-freedom systems is computationally demanding, requiring many earthquake records and analyses to account for the input ground motion uncertainty, it is the most realistic approach for deriving fragility functions [35,36,50]. Hence, this method was adopted in the current study. Fragility curves can be derived using different ground motion intensity measures, such as peak ground acceleration (PGA), spectral acceleration (Sa), and spectral displacement (Sd). The PGA was adopted as the ground motion intensity for deriving vulnerability relationships in this study. Scaling the earthquake records using their PGAs was consistent with the code design approach and, hence, it was adopted by several previous studies [12,37,51].
In order to account for input ground motion uncertainty, fourteen earthquake ground motions were selected in the present study to represent two critical seismic scenarios in the study region, as previously discussed. The derivation of vulnerability relationships was undertaken using IDAs by subjecting the benchmark bridge to the selected input ground motions in the longitudinal and transverse directions. Each input ground motion was scaled to different intensity levels. PGA-scaling factors of 0.16 and 0.40 g were applied for far-field and near-field input ground motions, respectively. With the design earthquake considered as 0.16 g, the IDA started with 0.16 g (1.0× Design) and ended with 0.96 g (6.0× Design) for far-field earthquakes, while for the near-field earthquake, the analysis began with 0.40 g (2.5× Design) and ended with 2.40 g (15.0× Design). This scaling approach ensured that all performance limit states adopted in this study were satisfied, as discussed hereafter. The fragility relationship is a function of the bridge capacity against a predefined performance limit state, considering the uncertainty in capacity. This fragility curve would be a step function for a deterministic assessment scenario if uncertainties are neglected. The fragility functions are generated using the following expression [52]: , where is the probability of exceeding a predefined performance limit state (PLSi) given the intensity measure (IM) value, Φ is the standard normal cumulative distribution function, = ln (median of the damage measure ‘DM’ capacity for PLSi), = ln (calculated median demand, given the IM value from the regression analysis best-fit power law), and are demand, capacity, and modeling uncertainties, respectively. The is directly calculated when IDA is used to develop fragility curves using the standard error of the demand data. The capacity uncertainty due to material properties and other sources and modeling uncertainty parameters are 0.3 and 0.2, respectively [52].
The following steps are followed to generate the fragility functions and calculate the limit state exceedance probabilities:
- The performance limit states of the benchmark bridge and the ground motion intensity measure are defined.
- The seismic response of the benchmark bridge obtained from IDA using 14 input ground motions representing two seismic scenarios is used to perform nonlinear regression analyses.
- The demand, capacity, and modeling uncertainties are accounted for, as previously discussed.
- A lognormal cumulative distribution function is used to generate the fragility relationship.
- The limit state exceedance probabilities for each performance limit state are estimated from the fragility functions.
- For the probabilistic risk assessment of the bridge inventory represented by the benchmark structure using risk assessment platforms, the vulnerability curves can be derived by integrating the economic losses with the fragility functions. In this study, the vulnerability assessment of the benchmark bridge is represented by the fragility relationships only. Additional information regarding the seismic fragility analysis and the vulnerability assessment of structures are available elsewhere [2,36,53,54].
Furthermore, various performance limit states were adopted in previous studies for developing fragility curves of bridges and their components, including drift ratio, column curvature ductility (CD), bearing displacement (BD), and bearing shear strain [11,12,55]. It was shown from the presented time history analysis results that the benchmark bridge damage is mainly related to columns CD and BD. Therefore, the selected performance limit state criteria for the column CD were 1.29, 2.10, 3.52, and 5.24 for the slight (SL), moderate (MO), extensive (EX), and complete (CO) damage states, respectively. These values were adopted based on the recommendations by Nielson and DesRoches [11]. Moreover, the performance limit state criteria for BD were 40, 100, 200, and 280 mm for the SL, MO, EX, and CO damage states, respectively. These values were adopted based on previous studies that recommended defining the bearing performance based on its displacement [55]. The SL performance limit state was considered as half of the nearest gap width along the direction of the bearing. The MO performance limit state was half the EX performance limit state, calculated as half of the bearing width. Finally, the CO damage state was considered the unseating width of the bearing.
The benchmark bridge was assessed using the developed 3DFB numerical model and IDAs to predict the inelastic seismic response under the effects of different seismic scenarios. Several inelastic analyses were performed to assess the seismic performance of such bridges under different input ground motions and at various intensities. Figure 17 and Figure 18 show the statistical distributions obtained from IDAs employed to estimate the exceedance probabilities for each selected limit state at different input ground motion intensities. The results are shown for the following bridge components: (i) bent CD demands and (ii) bearing displacement demands. The presented regression analysis results are also shown for the adopted two seismic scenarios in the longitudinal and transverse directions of the bridge. The derived fragility relationships in the two orthogonal directions of the bridge under the considered two seismic scenarios are presented in Figure 19 and Figure 20.
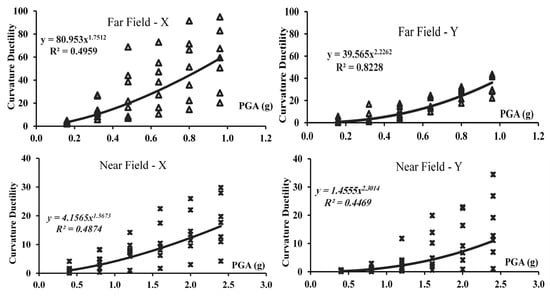
Figure 17.
Incremental dynamic analysis (IDA) results of bridge bent curvature ductility (CD) demands using far-field (top) and near-source (bottom) input ground motions in the longitudinal (left) and transverse (right) directions of the benchmark bridge along with the power law equations.
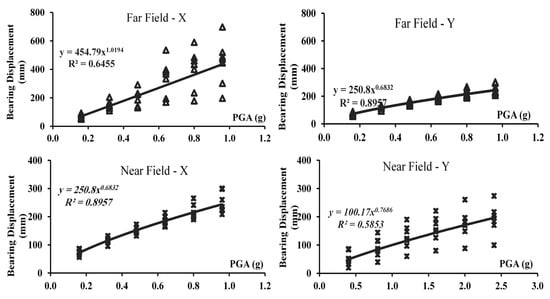
Figure 18.
IDA results of bridge bents bearing displacement (BD) demands using far-field (top) and near-source (bottom) input ground motions in the longitudinal (left) and transverse (right) directions of the benchmark bridge along with the power law equations.
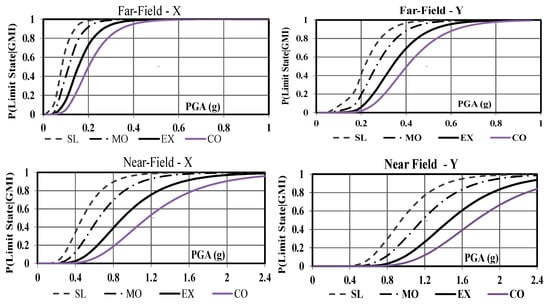
Figure 19.
Fragility curves of bridge bent CD demands using far-field (top) and near-source (bottom) input ground motions in the longitudinal (left) and transverse (right) directions of the benchmark bridge.
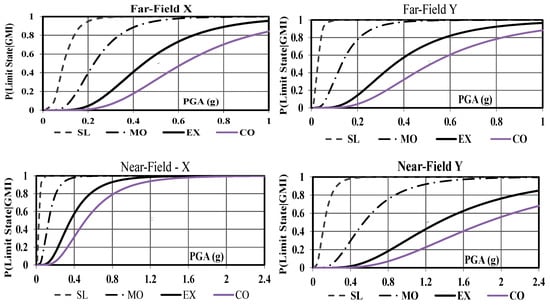
Figure 20.
Fragility curves of bridge BD demands using far-field (top) and near-source (bottom) input ground motions in the longitudinal (left) and transverse (right) directions of the benchmark bridge.
The probabilistic seismic performance assessment of the bridge bent CD demands indicates that higher limit state exceedance probabilities (LSEPs) were observed in the longitudinal (X) direction than the transverse (Y) counterpart. Moreover, higher LSEPs were observed under the effects of far-field events compared with their near-source ground motions. This reflects the higher vulnerability of the benchmark bridge under long period input ground motions compared with the other earthquake scenario. The multi-column bridge bents were also more vulnerable to deformation demands in the longitudinal direction than the transverse counterpart. Concerning the bridge BD, it is interesting to observe higher LSEPs in the Y-direction under the effects of far-field events compared with their far-source counterparts, particularly for the SL and MO performance limit states. Moreover, higher LSEPs were observed in the X-direction under the effects of near-field events compared with their far-source counterparts. This reflects the higher vulnerability of bridge bearings under the short-period seismic scenario. The observed vulnerability of the benchmark bridge confirms the pressing need to adopt mitigation techniques to reduce the expected seismic losses under the two seismic scenarios. The selected techniques and their impacts on the seismic performance of the benchmark bridge are discussed hereafter.
7. Assessment of the Lateral Capacity of Retrofitted Bridge
This paper discusses the seismic assessment of the retrofitted benchmark bridge in the transverse direction to demonstrate the effectiveness of suitable mitigation techniques in reducing the losses observed in this direction for the as-built structure. In addition to the two BRB retrofit techniques initially considered in this study based on the modeling verification discussed earlier, an additional contemporary retrofit technique was investigated. The considered self-centering buckling restrained brace (SC-BRB) behavior was chosen based on a previous experimental study on an RC double-column bridge pier [56]. The maximum slip displacement of SC-BRB was 26.6 mm, and the maximum force at slip was 692.7 kN. Figure 21 compares the SC-BRB hysteretic response from the adopted numerical modeling using the SCB link element and the previous experimental results [40].
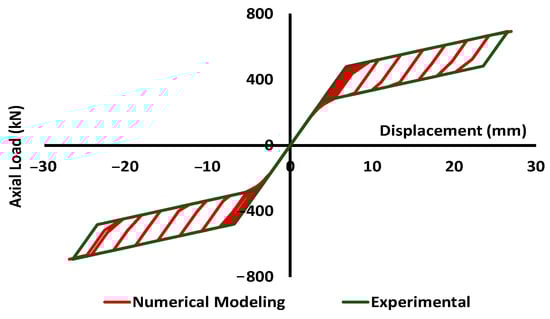
Figure 21.
Numerical modeling of SC-BRB versus the experimental response.
Pushover analysis results in the transverse direction of the as-built bridge show that the multi-column bent provides higher lateral strength in the transverse direction than the longitudinal counterpart, as shown in Figure 12 and Figure 13. It is seen in Figure 22 that the bridge retrofitted with BRB2 reached a maximum displacement of 67 mm (1.17% drift), while the structure retrofitted with BRB1 exhibited a top displacement of 104 mm (1.82% drift). The SC-BRB provides a comparable lateral capacity to that of BRB1. The observed limited ductility of the bridge retrofitted with BRB2 compared with BRB1 suggests focusing on the latter alternative in the seismic performance assessment, as discussed hereafter.
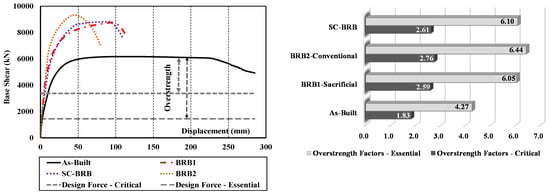
Figure 22.
Comparison of the lateral capacity (left) and overstrength (right) in the transverse direction of the as-built and retrofitted bridges using different techniques.
The overstrength factors associated with the as-built bridge and each retrofit technique are presented in Figure 22. The overstrength factors are presented based on the calculated seismic design forces in the case study area for two cases; namely, the bridge is considered an essential or critical structure [57]. It is noteworthy that the overstrength factors reported in the literature for as-built and retrofitted bridges are limited [58,59,60]. Ghee et al. [58] tested a set of 25 RC circular columns for bridge columns and assessed different parameters, such as the flexural ductility and axial load on the overstrength factor. The study indicated that the overstrength factors of bridge columns were in the range of 1.0 to 2.3. Kappos, Paraskeva, and Moschonas [59] studied seven bridges in a high seismicity region in Europe. It was found that these bridges had overstrength factors in the longitudinal direction in the range of 1.3 to 3.4. In the transverse direction, these bridges had overstrength factors of 1.2 to 5.8. It is shown in Figure 22 that the overstrength factors of the as-built benchmark bridge improved after retrofitting with different types of BRBs and were comparable to those reported in previous studies for entire bridges. Moreover, it is shown in Figure 22 that retrofitting the benchmark bridge using BRBs reduced the displacement ductility. However, it should be noted that the main objectives of these braces are to act as structural fuses, sustain high seismic demands, and dissipate seismic energy while keeping the structure almost within the elastic range. Controlling the damage in the benchmark bridge through this retrofit approach enables the rapid replacement of the sacrificial BRB elements [23].
8. Probabilistic Seismic Performance Assessment of Retrofit Techniques
As previously emphasized, this probabilistic assessment study focused on the seismic performance assessment of the retrofitted benchmark bridge in the transverse direction using different BRB systems to arrive at the best retrofit option. The alternatives considered were: (i) BRB (previously referred to as BRB1) and (ii) SC-BRB. Several time history analyses were performed to assess the seismic performances of the existing bridge and its retrofitted alternatives. Under the effects of the two considered seismic scenarios, it is seen that the BRB techniques are effective at reducing CD demands when compared with the as-built structure, as shown in Figure 23 and Figure 24. However, these retrofit alternatives increase BDs, mainly at high design intensities. These initial observations are discussed in more detail next.
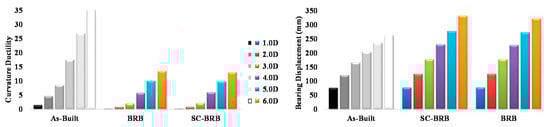
Figure 23.
Observed CD (left) and BD (right) demands under far-field earthquake records when scaled to different design intensities.
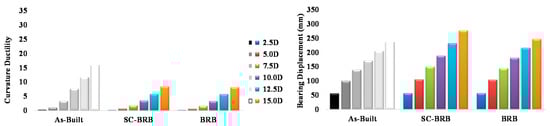
Figure 24.
Observed CD (left) and BD (right) demands under near-field earthquake records when scaled to different design intensities.
The fragility analysis results under far-field and near-field earthquake records also indicate a significant reduction in CD demands and LSEPs, particularly under the former seismic scenario, when the benchmark bridge is retrofitted with the BRB systems (Figure 25 and Figure 26). As for BDs, the BRB and SC-BRB retrofit approaches negligibly affect LSEPs due to the limited impacts of retrofitting bridge bents on the bearing damage under both far-field and near-field scenarios, particularly for the SL and MO performance limit states. For the EX and CO limit states, the bracing systems slightly increase the bearing displacement demands of the bridge (Figure 27 and Figure 28).
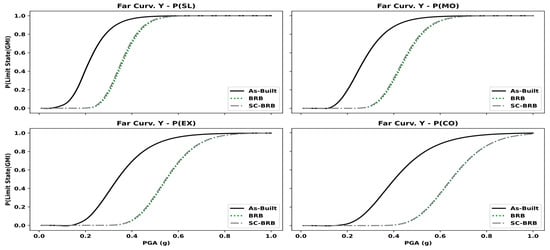
Figure 25.
Fragility curves of bridge bent CD demands under far-field records in the transverse direction (as-built vs. retrofitted bridges with different BRB techniques).
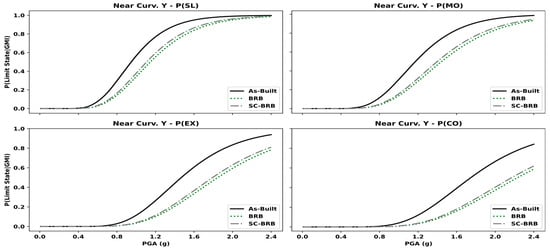
Figure 26.
Fragility curves of bridge bent CD demands under near-source records in the transverse direction (as-built vs. retrofitted bridges with different BRB techniques).
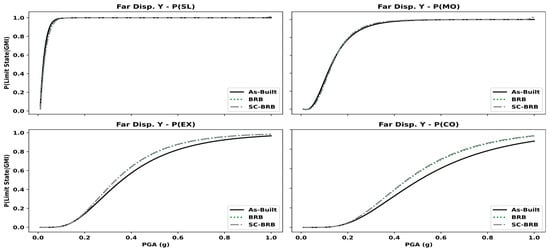
Figure 27.
Fragility curves of BD demands under far-field records in the transverse direction (as-built vs. retrofitted bridges with different BRB techniques).
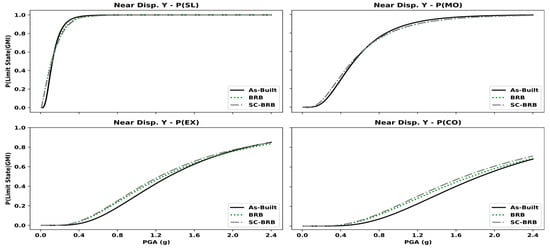
Figure 28.
Fragility curves of BD demands under near-source records in the transverse direction (as-built vs. retrofitted bridges with different BRB techniques).
As indicated in the assessment results of the as-built bridge, the lateral capacity and seismic performance in the transverse direction were significantly affected by CD demands (Figure 12, Figure 13, Figure 19 and Figure 20). The adopted retrofit techniques for the considered benchmark bridge in this direction were effective under both considered seismic scenarios, particularly the far-field earthquakes that highly impact civil engineering structures in the UAE [37,49].
Figure 29 and Figure 30 show additional comparisons between the CD and BD LSEPs or the probability of damage for the retrofit approaches investigated in the transverse direction of the benchmark bridge. At twice and 5.0 times the design earthquake intensity (2D and 5D for far-field and near-source earthquakes, respectively), it is observed in Figure 29 that the BRB retrofit techniques were effective at reducing CD LSEPs. Figure 30 also shows that the impact of these retrofit alternatives on BD LSEPs was marginal. The derived fragility curves and presented LSEPs confirm that both considered BRB retrofit alternatives are effective mitigation measures because they resulted in significant reductions in CD demands. While these retrofit alternatives proved to have minor impacts on BDs, particularly for SL and MO performance limit states, additional retrofit alternatives are recommended to be combined with BRBs to control both the CD and BD demands of pre-seismic code multi-span simply supported bridges.
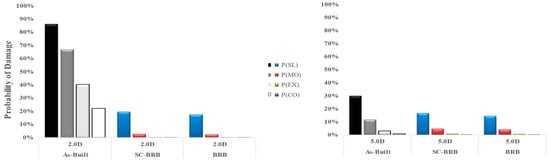
Figure 29.
Limit state exceedance probabilities (LSEPs) of CD demands under far-field (left, at 2D) and near-source (right, at 5D) earthquake records.
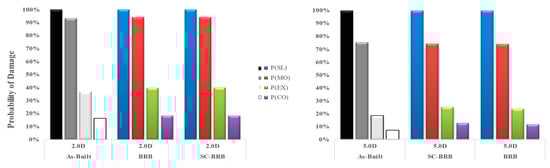
Figure 30.
LSEPs of BD demands under far-field (left, at 2D) and near-source (right, at 5D) earthquake records.
9. Summary and Conclusions
This probabilistic assessment study focused on assessing the seismic vulnerability of a pre-seismic code multi-span simply supported bridge in a medium seismicity area exposed to two different seismic scenarios. The existing bridges in the study area were surveyed using satellite images and site visits, and a typical benchmark structure was selected based on its construction date and possible vulnerability. The adopted bridge numerical modeling approach was verified using a two-column bent tested in a previous experimental study before and after the retrofit. Detailed 3DFB numerical models of a whole benchmark structure were developed, considering the verified modeling approaches. Different BRB and SC-BRB retrofit alternatives were implemented in the 3DFB models to assess the seismic performances of the bridge under diverse earthquake records representing the seismicity of the study area. Finally, a range of fragility functions was developed for the benchmark bridge before and after retrofitting using IDA under different seismic scenarios. The conclusions drawn from this study are as follows:
- The developed fiber-based models of the existing bridge bent before and after the retrofit with BRBs provided a similar response to previous experimental studies and enabled using this modeling approach for idealizing the as-built benchmark bridge and the retrofitted structure with mitigation approaches.
- The pushover analysis results provided insights into the local damage in the bents in the two orthogonal directions of the as-built bridge, which was more significant in the transverse direction than in the longitudinal counterpart. In the former direction, plastic hinges were detected at the bottom critical regions of columns, followed by the upper critical segments. Afterward, yielding spread upwards to half the piers height. The lateral strength and overstrength factors calculated using IPA were improved after retrofitting the as-built bridge with different BRBs and were comparable to those reported in previous studies for entire bridges.
- The derived fragility curves for the as-built benchmark bridge indicated higher CD LSEPs in bridge bents under far-field events compared to their near-source ground motions. High BD LSEPs were also detected in the transverse direction under far-field events and in the longitudinal direction under near-source ground motions, particularly for the SL and MO performance limit states. The observed vulnerability of the benchmark bridge reflected the pressing need for mitigation techniques to reduce the expected seismic losses under different seismic scenarios.
- The adopted BRB and SC-BRB retrofit alternatives for the benchmark bridge were effective mitigation measures in reducing CD demands and LSEPs under both considered seismic scenarios, particularly the far-field earthquakes that have a high impact on civil engineering structures in the study area. While these retrofit alternatives proved to have minor impacts on BDs, additional retrofit alternatives are recommended to be combined with the adopted mitigation measures in this study to control both the CD and BD demands of pre-seismic code multi-span simply supported bridges.
It should be pointed out that while a detailed methodology was adopted in this study to verify numerical modeling approaches and develop detailed 3DFB models to assess as-built and retrofitted multi-span bridges using fragility functions under different seismic scenarios, the drawn conclusions were based on the probabilistic assessment results of the reference structure and selected retrofit alternatives. However, the applicability of the proposed methodologies for other substandard multi-span bridges in similar seismicity regions may be claimed. Additional vulnerability assessment studies covering pre-seismic code bridges with different structural systems and mitigation measures are needed, particularly for essential and critical structures in the study region.
Author Contributions
Conceptualization, A.M.; methodology, H.G. and A.M.; software, H.G. and A.M.; validation, H.G. and A.M.; formal analysis, H.G. and A.M.; investigation, H.G. and A.M.; resources, H.G. and A.M.; data curation, H.G. and A.M.; writing—original draft preparation, H.G. and A.M.; writing—review and editing, A.M.; visualization, H.G. and A.M.; supervision, A.M.; project administration, A.M.; funding acquisition, A.M. All authors have read and agreed to the published version of the manuscript.
Funding
This research work was financially supported by the United Arab Emirates University under research grants nos. 31N320 and 31N394.
Institutional Review Board Statement
Not applicable.
Informed Consent Statement
Not applicable.
Data Availability Statement
The data used to support the findings of this study are available upon request.
Acknowledgments
The support provided by United Arab Emirates University is gratefully acknowledged.
Conflicts of Interest
The authors declare no conflict of interest.
Abbreviations
| 3DFB | three-dimensional fiber-based |
| BD | bearing displacement |
| BRBs | buckling restrained braces |
| BRB1 | sacrificial buckling restrained brace |
| BRB1 | non-sacrificial buckling restrained brace |
| CD | curvature ductility |
| CO | complete limit state performance level/limit state |
| CSM | capacity spectrum method |
| DM | damage measure |
| ERHA | elastic response history analysis |
| EX | extensive performance level/limit state |
| IDAs | incremental dynamic analyses |
| IM | intensity measure |
| IPAs | inelastic pushover analyses |
| IRHA | inelastic response history analysis |
| LSEPs | limit state exceedance probabilities |
| MO | moderate performance level/limit state |
| PGA | peak ground acceleration |
| RC | reinforced concrete |
| SC-BRBs | self-centering buckling restrained braces |
| SL | slight performance level/limit state |
References
- Elnashai, A.S.; Mwafy, A.M. Seismic response and design. In ICE Manual of Bridge Engineering, 3rd ed.; Parke, G., Hewson, N., Eds.; Thomas Telford Ltd., Institution of Civil Engineers: London, UK, 2022. [Google Scholar]
- Elnashai, A.S.; Di Sarno, L. Fundamentals of Earthquake Engineering: From Source to Fragility, 2nd ed.; John Wiley & Sons, Ltd: West Sussex, UK, 2015; p. 347. [Google Scholar]
- Elnashai, A.S.; Gencturk, B.; Kwon, O.-S.; Al-Qadi, I.L.; Hashash, Y.; Roesler, J.R.; Kim, S.J.; Jeong, S.-H.; Dukes, J.; Valdivia, A. The Maule (Chile) Earthquake of February 27, 2010: Consequence Assessment and Case Studies; MAE Center Report No. 10-04; Mid-America Earthquake Center, University of Illinois at Urbana-Champaign: Urbana, IL, USA, 2010. [Google Scholar]
- Mwafy, A.M. Earthquake Risk Management Systems and Their Applications for Building Seismic-Resilient Communities. In Resilient Structures and Infrastructure; Springer: Berlin/Heidelberg, Germany, 2019; pp. 129–157. [Google Scholar]
- Hashash, Y.M.; Mwafy, A.; Elnashai, A.S.; Hajjar, J.F. Development of a multi-disciplinary graduate course on consequence-based earthquake risk management. Int. J. Contin. Eng. Educ. Life Long Learn. 2012, 22, 127–147. [Google Scholar] [CrossRef]
- Kircher, C.A.; Whitman, R.V.; Holmes, W.T. HAZUS earthquake loss estimation methods. Nat. Hazards Rev. 2006, 7, 45–59. [Google Scholar] [CrossRef]
- Kwon, O.-S.; Mwafy, A.M.; Elnashai, A.S. Analytical Assessment of Seismic Performance Evaluation Procedures for Bridges. In Proceedings of the ACI Fall 2008 Convention, St. Louis, MO, USA, 2–6 November 2008; ACI Special Publication: St. Louis, MO, USA, 2010; pp. 45–61. [Google Scholar]
- FHWA. Seismic Retrofitting Manual for Highway Structures: Part 1—Bridges; Report No. FHWA-HRT-06-032; U.S. Department of Transportation: Washington, DC, USA, 2006. [Google Scholar]
- Movaghati, S.; Abdelnaby, A.E. Advancements in fragility analysis using numerical calibration methods for a horizontally curved RC bridge. Eng. Struct. 2016, 125, 236–243. [Google Scholar] [CrossRef]
- Kwon, O.-S.; Jeong, S.-H. Seismic displacement demands on skewed bridge decks supported on elastomeric bearings. J. Earthq. Eng. 2013, 17, 998–1022. [Google Scholar] [CrossRef]
- Nielson, B.G.; DesRoches, R. Seismic fragility methodology for highway bridges. In Proceedings of the Structures Congress 2006: Structural Engineering and Public Safety, St. Louis, MO, USA, 18–21 May 2006; pp. 1–9. [Google Scholar]
- Muntasir Billah, A.H.M.; Alam, M.S. Seismic fragility assessment of highway bridges: A state-of-the-art review. Struct. Infrastruct. Eng. 2015, 11, 804–832. [Google Scholar] [CrossRef]
- Mangalathu, S.; Heo, G.; Jeon, J.-S. Artificial neural network based multi-dimensional fragility development of skewed concrete bridge classes. Eng. Struct. 2018, 162, 166–176. [Google Scholar] [CrossRef]
- Xie, Y.; Ebad Sichani, M.; Padgett, J.E.; DesRoches, R. The promise of implementing machine learning in earthquake engineering: A state-of-the-art review. Earthq. Spectra 2020, 36, 1769–1801. [Google Scholar] [CrossRef]
- Harirchian, E.; Hosseini, S.E.A.; Jadhav, K.; Kumari, V.; Rasulzade, S.; Işık, E.; Wasif, M.; Lahmer, T. A review on application of soft computing techniques for the rapid visual safety evaluation and damage classification of existing buildings. J. Build. Eng. 2021, 43, 102536. [Google Scholar] [CrossRef]
- Valentijn, T.; Margutti, J.; van den Homberg, M.; Laaksonen, J. Multi-hazard and spatial transferability of a cnn for automated building damage assessment. Remote Sens. 2020, 12, 2839. [Google Scholar] [CrossRef]
- Harirchian, E.; Lahmer, T. Improved rapid assessment of earthquake hazard safety of structures via artificial neural networks. IOP Conf. Ser. Mater. Sci. Eng. 2020, 897, 012014. [Google Scholar] [CrossRef]
- Crespi, P.; Zucca, M.; Valente, M. On the collapse evaluation of existing RC bridges exposed to corrosion under horizontal loads. Eng. Fail. Anal. 2020, 116, 104727. [Google Scholar] [CrossRef]
- Wei, B.; Hu, Z.; He, X.; Jiang, L. Evaluation of optimal ground motion intensity measures and seismic fragility analysis of a multi-pylon cable-stayed bridge with super-high piers in Mountainous Areas. Soil Dyn. Earthq. Eng. 2020, 129, 105945. [Google Scholar] [CrossRef]
- Zhao, Y.; Hu, H.; Bai, L.; Tang, M.; Chen, H.; Su, D. Fragility analyses of bridge structures using the logarithmic piecewise function-based probabilistic seismic demand model. Sustainability 2021, 13, 7814. [Google Scholar] [CrossRef]
- Carden, L.P.; Itani, A.M.; Buckle, I.G. Seismic performance of steel girder bridges with ductile cross frames using buckling-restrained braces. J. Struct. Eng. 2006, 132, 338–345. [Google Scholar] [CrossRef]
- Wang, Y.; Ibarra, L.; Pantelides, C. Collapse capacity of reinforced concrete skewed bridges retrofitted with buckling-restrained braces. Eng. Struct. 2019, 184, 99–114. [Google Scholar] [CrossRef]
- Bazaez, R.; Dusicka, P. Performance assessment of multi-column RC bridge bents seismically retrofitted with buckling-restrained braces. Bull. Earthq. Eng. 2018, 16, 2135–2160. [Google Scholar] [CrossRef]
- Chou, C.-C.; Tsai, W.-J.; Chung, P.-T. Development and validation tests of a dual-core self-centering sandwiched buckling-restrained brace (SC-SBRB) for seismic resistance. Eng. Struct. 2016, 121, 30–41. [Google Scholar] [CrossRef]
- Wang, H.; Nie, X.; Pan, P. Development of a self-centering buckling restrained brace using cross-anchored pre-stressed steel strands. J. Constr. Steel Res. 2017, 138, 621–632. [Google Scholar] [CrossRef]
- Dong, H.; Du, X.; Han, Q.; Hao, H.; Bi, K.; Wang, X. Performance of an innovative self-centering buckling restrained brace for mitigating seismic responses of bridge structures with double-column piers. Eng. Struct. 2017, 148, 47–62. [Google Scholar] [CrossRef]
- Xiang, N.; Alam, M.S. Displacement-based seismic design of bridge bents retrofitted with various bracing devices and their seismic fragility assessment under near-fault and far-field ground motions. Soil Dyn. Earthq. Eng. 2019, 119, 75–90. [Google Scholar] [CrossRef]
- ICBO. Uniform Building Code, 1997 Edition; ICBO: Lansing, MI, USA, 1997. [Google Scholar]
- Shama, A.A. Site specific probabilistic seismic hazard analysis at Dubai Creek on the west coast of UAE. Earthq. Eng. Eng. Vib. 2011, 10, 143–152. [Google Scholar] [CrossRef]
- Abdalla, J.A.; Al-Homoud, A.S. Seismic hazard assessment of United Arab Emirates and its surroundings. J. Earthq. Eng. 2004, 8, 817–837. [Google Scholar] [CrossRef]
- Mwafy, A.M.; Elnashai, A.S.; Sigbjörnsson, R.; Salama, A. Significance of severe distant and moderate close earthquakes on design and behavior of tall buildings. Struct. Des. Tall Spec. Build. 2006, 15, 391–416. [Google Scholar] [CrossRef]
- Yagoub, M.; Al Yammahi, A.A. Spatial distribution of natural hazards and their proximity to heritage sites: Case of the United Arab Emirates. Int. J. Disaster Risk Reduct. 2022, 71, 102827. [Google Scholar] [CrossRef]
- Sawires, R.; Peláez, J.A.; AlHamaydeh, M.; Henares, J. A state-of-the-art seismic source model for the United Arab Emirates. J. Asian Earth Sci. 2019, 186, 104063. [Google Scholar] [CrossRef]
- Anzlin, A.; Fischinger, M.; Isakovic, T. Cyclic response of I-shaped bridge columns with substandard transverse reinforcement. Eng. Struct. 2015, 99, 642–652. [Google Scholar] [CrossRef]
- Mwafy, A.M.; Khalifa, S. Effect of vertical structural irregularity on seismic design of tall buildings. Struct. Des. Tall Spec. Build. 2017, 26, e1399. [Google Scholar] [CrossRef]
- Alwaeli, W.; Mwafy, A.M.; Pilakoutas, K.; Guadagnini, M. Rigorous versus less-demanding fragility relations for RC high-rise buildings. Bull. Earthq. Eng. 2020, 18, 5885–5918. [Google Scholar] [CrossRef]
- Mwafy, A.M.; AlMorad, B. Verification of performance criteria using shake table testing for the vulnerability assessment of reinforced concrete buildings. Struct. Des. Tall Spec. Build. 2019, 28, e1601. [Google Scholar] [CrossRef]
- Alwaeli, W.; Mwafy, A.M.; Pilakoutas, K.; Guadagnini, M. Multi-level nonlinear modeling verification scheme of RC high-rise wall buildings. Bull. Earthq. Eng. 2017, 15, 2035–2053. [Google Scholar] [CrossRef]
- Bazaez, R.; Dusicka, P. Cyclic behavior of reinforced concrete bridge bent retrofitted with buckling restrained braces. Eng. Struct. 2016, 119, 34–48. [Google Scholar] [CrossRef]
- Seismosoft SeismoStruct 2022—A Computer Program for Static and Dynamic Nonlinear Analysis of Framed Structures. 2022. Available online: https://seismosoft.com/ (accessed on 1 July 2022).
- Bazaez, R.; Dusicka, P. Cyclic loading for RC bridge columns considering subduction megathrust earthquakes. J. Bridge Eng. 2016, 21, 04016009. [Google Scholar] [CrossRef]
- Shamsabadi, A.; Rollins, K.M.; Kapuskar, M. Nonlinear soil-abutment-bridge structure interaction for seismic performance-based design. J. Geotech. Geoenviron. Eng. 2007, 133, 707–720. [Google Scholar] [CrossRef]
- Caltrans. Seismic Design Criteria; State of California, Department of Transportation: Sacramento, CA, USA, 2019. [Google Scholar]
- Park, R. Evaluation of ductility of structures and structural assemblages from laboratory testing. Bull. N. Z. Soc. Earthq. Eng. 1989, 22, 155–166. [Google Scholar] [CrossRef]
- Mwafy, A.M.; Kwon, O.-S.; Elnashai, A.S. Seismic assessment of an existing non-seismically designed major bridge-abutment-foundation system. Eng. Struct. 2010, 32, 2192–2209. [Google Scholar] [CrossRef]
- Muthukumar, S.; DesRoches, R. A Hertz contact model with non-linear damping for pounding simulation. Earthq. Eng. Struct. Dyn. 2006, 35, 811–828. [Google Scholar] [CrossRef]
- Buckle, I.; Nagarajaiah, S.; Ferrell, K. Stability of elastomeric isolation bearings: Experimental study. J. Struct. Eng. 2002, 128, 3–11. [Google Scholar] [CrossRef]
- Priestley, M.J.N.; Seible, F.; Calvi, G.M. Seismic Design and Retrofit of Bridges; John Wiley & Sons: New York, NY, USA, 1996. [Google Scholar]
- Alwaeli, W.; Mwafy, A.M.; Pilakoutas, K.; Guadagnini, M. A methodology for defining seismic scenario-structure-based limit state criteria for RC high-rise wall buildings using net drift. Earthq. Eng. Struct. Dyn. 2017, 46, 1325–1344. [Google Scholar] [CrossRef]
- Kabir, M.R.; Billah, A.M.; Alam, M.S. Seismic fragility assessment of a multi-span RC bridge in Bangladesh considering near-fault, far-field and long duration ground motions. Structures 2019, 19, 333–348. [Google Scholar] [CrossRef]
- Kwon, O.-S.; Elnashai, A.S. The effect of material and ground motion uncertainty on the seismic vulnerability curves of RC structure. Eng. Struct. 2006, 28, 289–303. [Google Scholar] [CrossRef]
- Wen, Y.; Ellingwood, B.R.; Bracci, J.M. Vulnerability Function Framework for Consequence-Based Engineering; MAE Center Project DS-4 Report; University of Illinois at Urbana-Champaign: Urbana, IL, USA, 2004. [Google Scholar]
- Wen, Y.K.; Ellingwood, B.R. The role of fragility assessment in consequence-based engineering. Earthq. Spectra 2005, 21, 861–877. [Google Scholar] [CrossRef]
- Mwafy, A.M.; Elkholy, S. Performance assessment and prioritization of mitigation approaches for pre-seismic code structures. Adv. Struct. Eng. 2017, 20, 917–939. [Google Scholar] [CrossRef]
- Wu, W.; Li, L.; Shao, X. Seismic assessment of medium-span concrete cable-stayed bridges using the component and system fragility functions. J. Bridge Eng. 2016, 21, 04016027. [Google Scholar] [CrossRef]
- Dong, H.; Du, X.; Han, Q.; Bi, K.; Hao, H. Hysteretic performance of RC double-column bridge piers with self-centering buckling-restrained braces. Bull. Earthq. Eng. 2019, 17, 3255–3281. [Google Scholar] [CrossRef]
- FHWA. LRFD Seismic Analysis and Design of Bridges: Reference Manual; FHWA-NHI-15-004; Federal Highway Administration: Washington, DC, USA, 2014. [Google Scholar]
- Ghee, A.B.; Priestley, M.N.; Paulay, T. Seismic shear strength of circular reinforced concrete columns. Struct. J. 1989, 86, 45–59. [Google Scholar]
- Kappos, A.J.; Paraskeva, T.S.; Moschonas, I.F. Response modification factors for concrete bridges in Europe. J. Bridge Eng. 2013, 18, 1328–1335. [Google Scholar] [CrossRef][Green Version]
- Sánchez, A.R.; Arêde, A.; Jara, J.M.; Delgado, P. Overstrength factors of RC bridges supported on single and multi-column RC piers in Mexico. Earthq. Eng. Struct. Dyn. 2021, 50, 3695–3712. [Google Scholar] [CrossRef]


Publisher’s Note: MDPI stays neutral with regard to jurisdictional claims in published maps and institutional affiliations. |
© 2022 by the authors. Licensee MDPI, Basel, Switzerland. This article is an open access article distributed under the terms and conditions of the Creative Commons Attribution (CC BY) license (https://creativecommons.org/licenses/by/4.0/).