Article

Exploring Value Generation in Target Value Design Applying a Value Analysis Model

1
School of Civil Construction, Faculty of Engineering, Pontificia Universidad Católica de Chile, Santiago 7810000, Chile
2
School of Engineering, Pontificia Universidad Católica de Chile, Santiago 7810000, Chile
*
Author to whom correspondence should be addressed.
Buildings 2022, 12(7), 922; https://doi.org/10.3390/buildings12070922
Submission received: 9 May 2022 / Revised: 13 June 2022 / Accepted: 22 June 2022 / Published: 29 June 2022
(This article belongs to the Special Issue Advances in Project and Design Management in the Construction Sector)

Abstract

:
Target value design (TVD) is a management approach that applies target costing in the design and construction industry. TVD enables a project environment with favorable characteristics to generate value. However, because the TVD’s primary assessment is cost, target cost can be met without necessarily achieving the project’s full value. This research applies the action research approach to implement TVD in a housing project and explores the value generation of the project using a value analysis model (VAM) to study the balance between cost and value fulfillment in the product and design process. According to the results, even though the target cost was achieved, the desired value of the project was not achieved during the project design. However, there is a tendency to increase value over time to a greater extent in the product and not so much in the process. The main contributions of this study are the possibility of comparing cost and value, identifying the emphasis of product over process and cost over value throughout the TVD project. This study enhances the literature on project value generation and maximization, offering new knowledge for a better understanding of how to conduct a value analysis in combination with costing in TVD projects.

1. Introduction

Target value design (TVD) is the application of target costing to project delivery in the architecture, engineering, and construction (AEC) industry [1]. TVD starts with project definition and financing and then focuses on the target design process, i.e., what the client wants to achieve, their targets and the conditions that must be met for that target to be realized [2]. TVD is a management approach that aims to achieve a pre-established cost target through design iteration [3].
TVD radically differs from the traditional design method. First, TVD has a different way of setting prices and costs: a target cost (TC) is defined based on an established price and the profit margin [3]. Second, TVD turns the current design practice upside down because the designers have to (1) design based on a detailed estimate; (2) design for what is constructible; (3) work together to define the issues and produce decisions; and then design to those decisions. Finally, in TVD, solution sets are kept throughout the design process; work is carried out in pairs or a larger face-to-face group [4,5].
The TVD approach enables a project environment with favorable characteristics for generating value, including an emphasis on design activities, making the customer an essential participant in the process, and enhancing the customer–supplier relationship through collaborative approaches [4,5]. However, the primary measurement performed in TVD is not focused on value but TC [6,7]. Some authors argue that there is an emphasis on cost over value [8,9] or identify these as interchangeable terms [10]. The ideal approach is not to use value instead of cost, but to use and analyze value in addition to cost.
In TVD, systematic cost reduction exists: identifying concrete actions and incentives and continuously estimating the proposed changes to achieve the TC. Likewise, TVD seeks to maintain the value requested by the client, controlling the project’s scope or primary objective [11,12,13] or some measurable conditions such as metrics and capacities [9,14,15]. However, there is no evidence for measuring subjective satisfaction conditions or the systematic reduction in value losses to achieve the target value.
Furthermore, documented TVD projects generally highlight the achieved cost or schedule savings [16,17,18]; the other requirements, benefits, and value objectives are not visibly measured or documented or are minimally described [8,11]. This situation may be due to the lack (thus far) of accurate and rigorous value estimation methods [19]. These methods should focus on the capture, flow, and traceability of customer requirements throughout the project [8] and use metrics and indicators to measure value [20].
Considering this knowledge gap, this study explores the generation and losses of value within a TVD project in design stage by applying a recently developed value analysis model (VAM) [20]. For this purpose, the authors used the action research (AR) approach to implement the TVD within a pilot project in a housing development and construction company to fulfill research interests and solve the company’s practical problems. This problem-solving interest is related to constant cost overruns in projects that do not obtain the desired margin or profit. The research interest is related to studying the trade-off between cost and value fulfillment in a TVD project.
This study addresses the following research question: How is target value fulfillment in the TVD project environment? The authors explore this research question by answering the following three operational questions: (1) How is the value of customer satisfaction conditions measured in the process and product of a TVD project? (2) How can value losses be identified and quantified within the design process? and (3) How is target value fulfillment compared to TC fulfillment in the TVD project environment? In this way, this research will contribute to (1) the possibility of analysis value in TVD projects providing evidence of the measurement of satisfaction conditions and value attributes; (2) the visualization of the evolution of the value of a project, identifying the value generated and lost within the design product and process; (3) the possibility of being able to compare cost and value, making comparisons between the fulfillment (or not) of the value expected by the customers and the fulfillment (or not) of the target cost; and (4) to show explicit evidence of the emphasis on cost over value and product over process in TVD projects.

2. Background

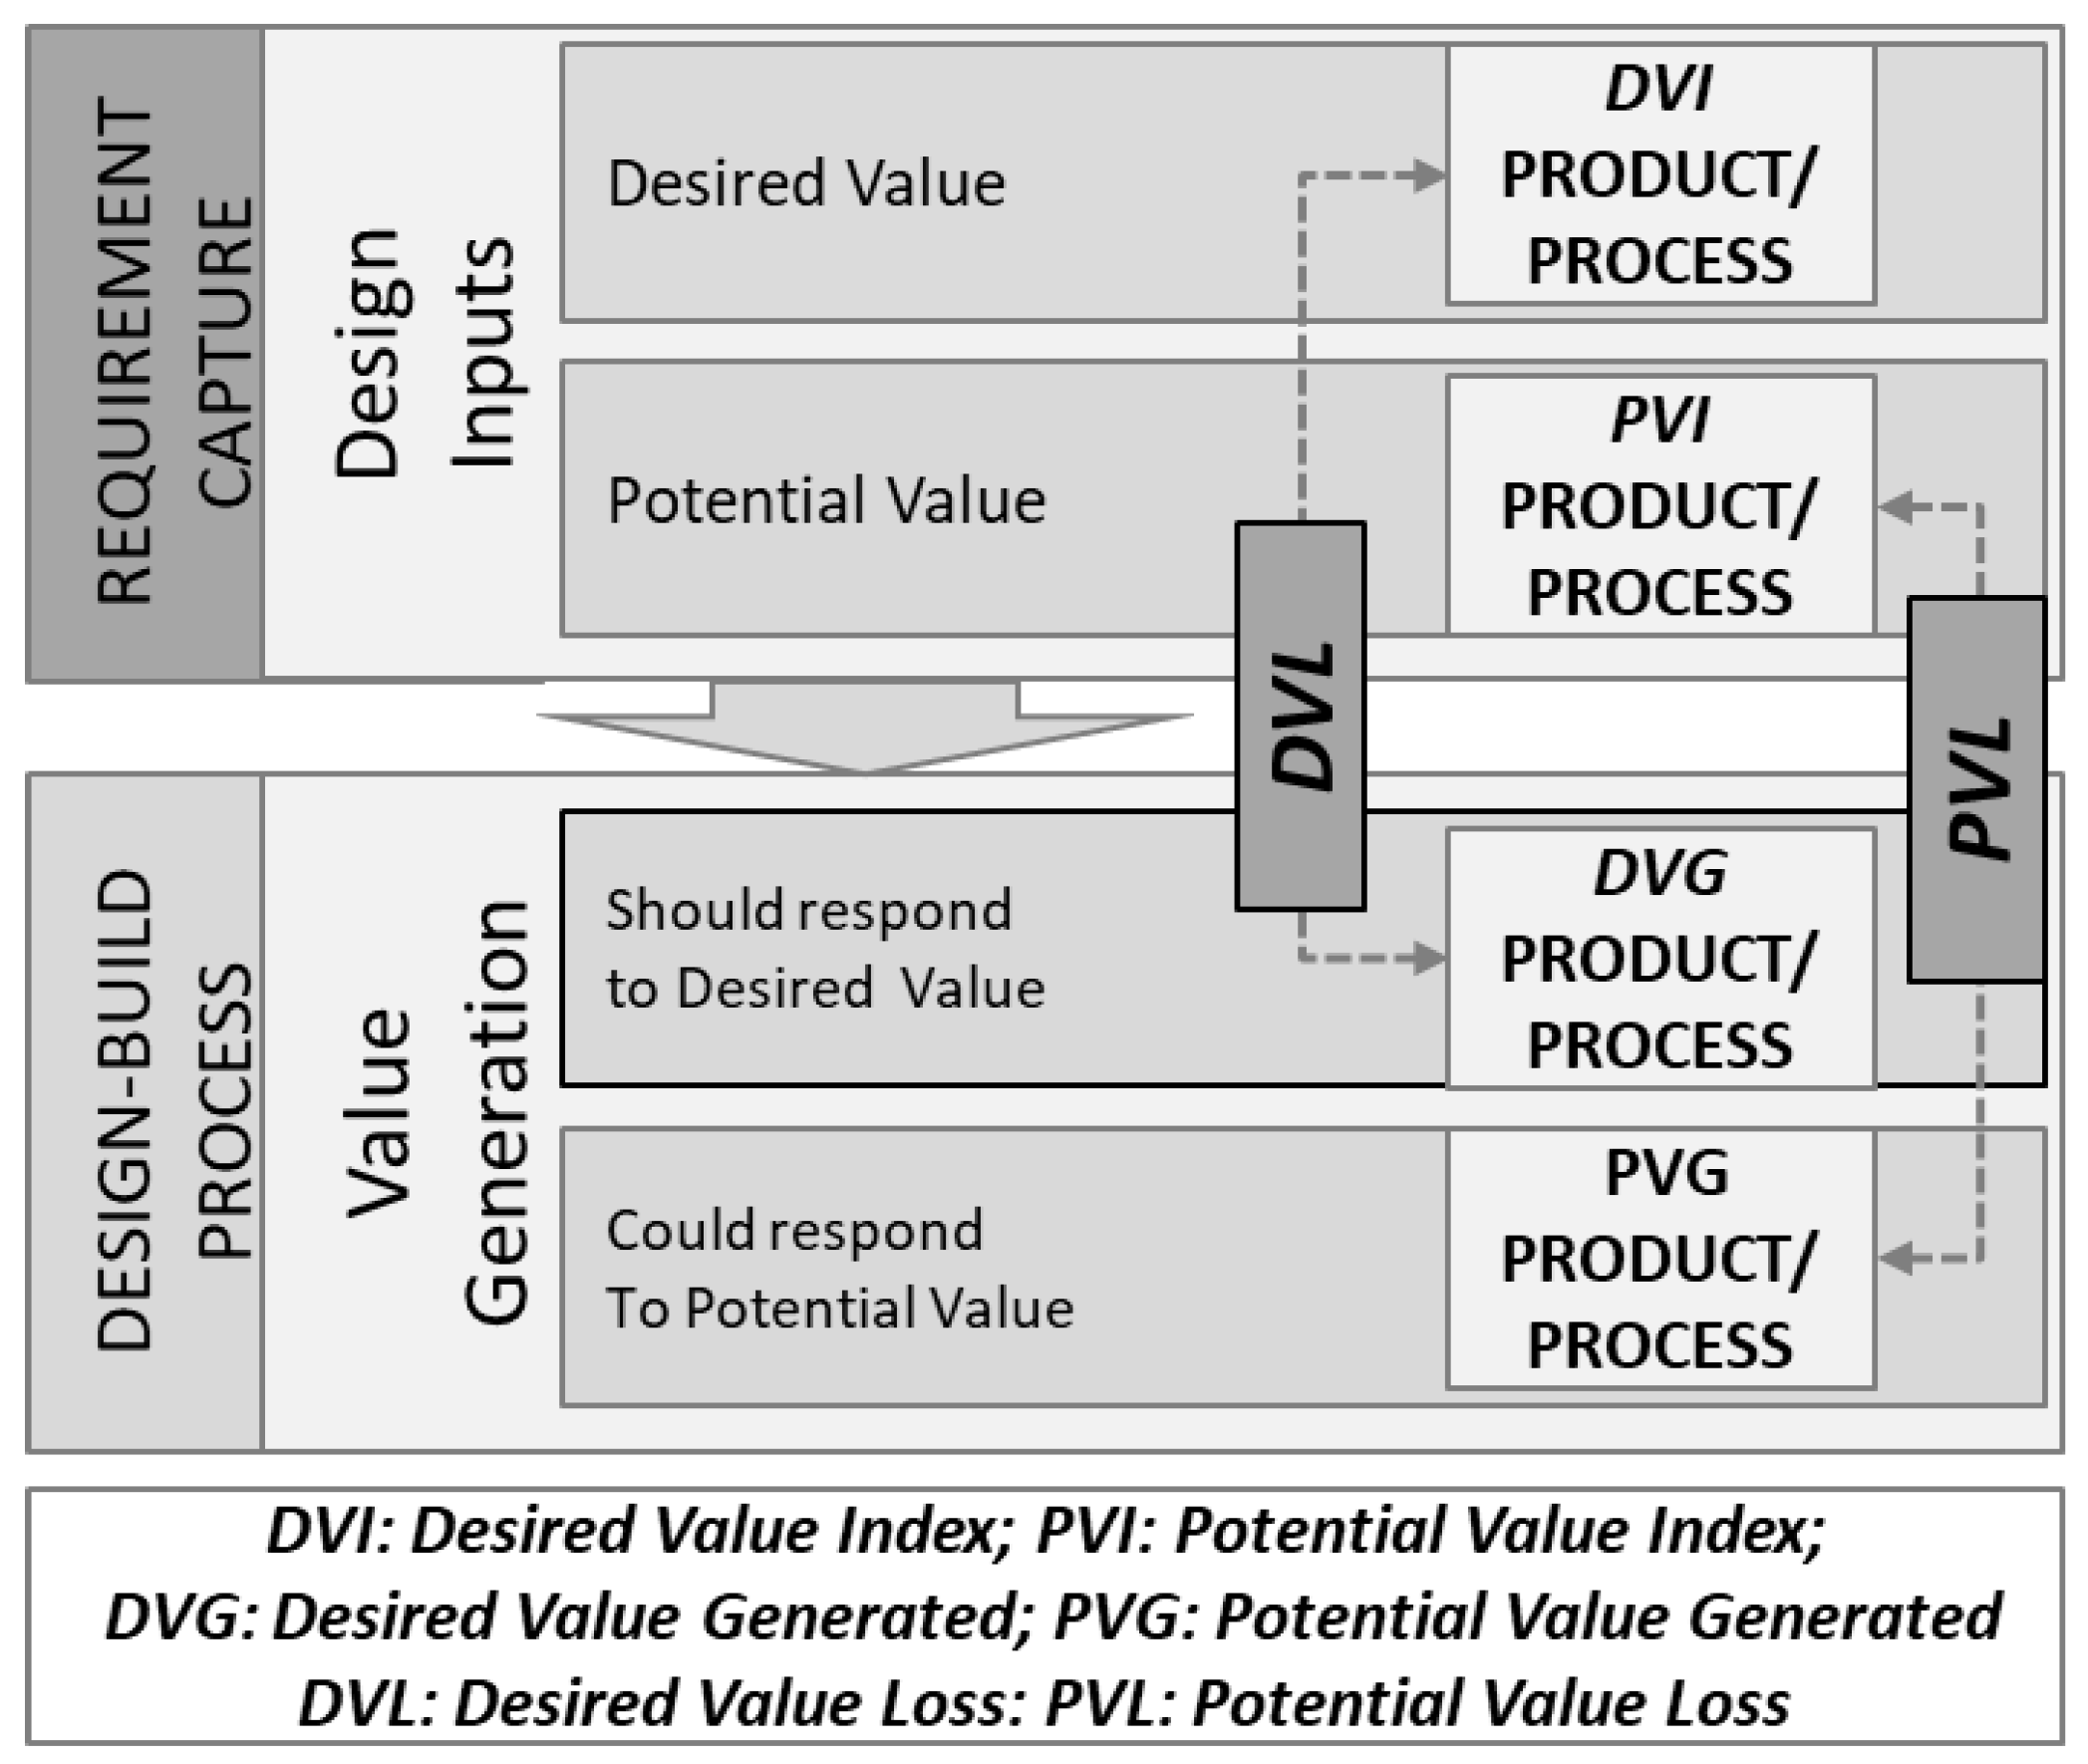
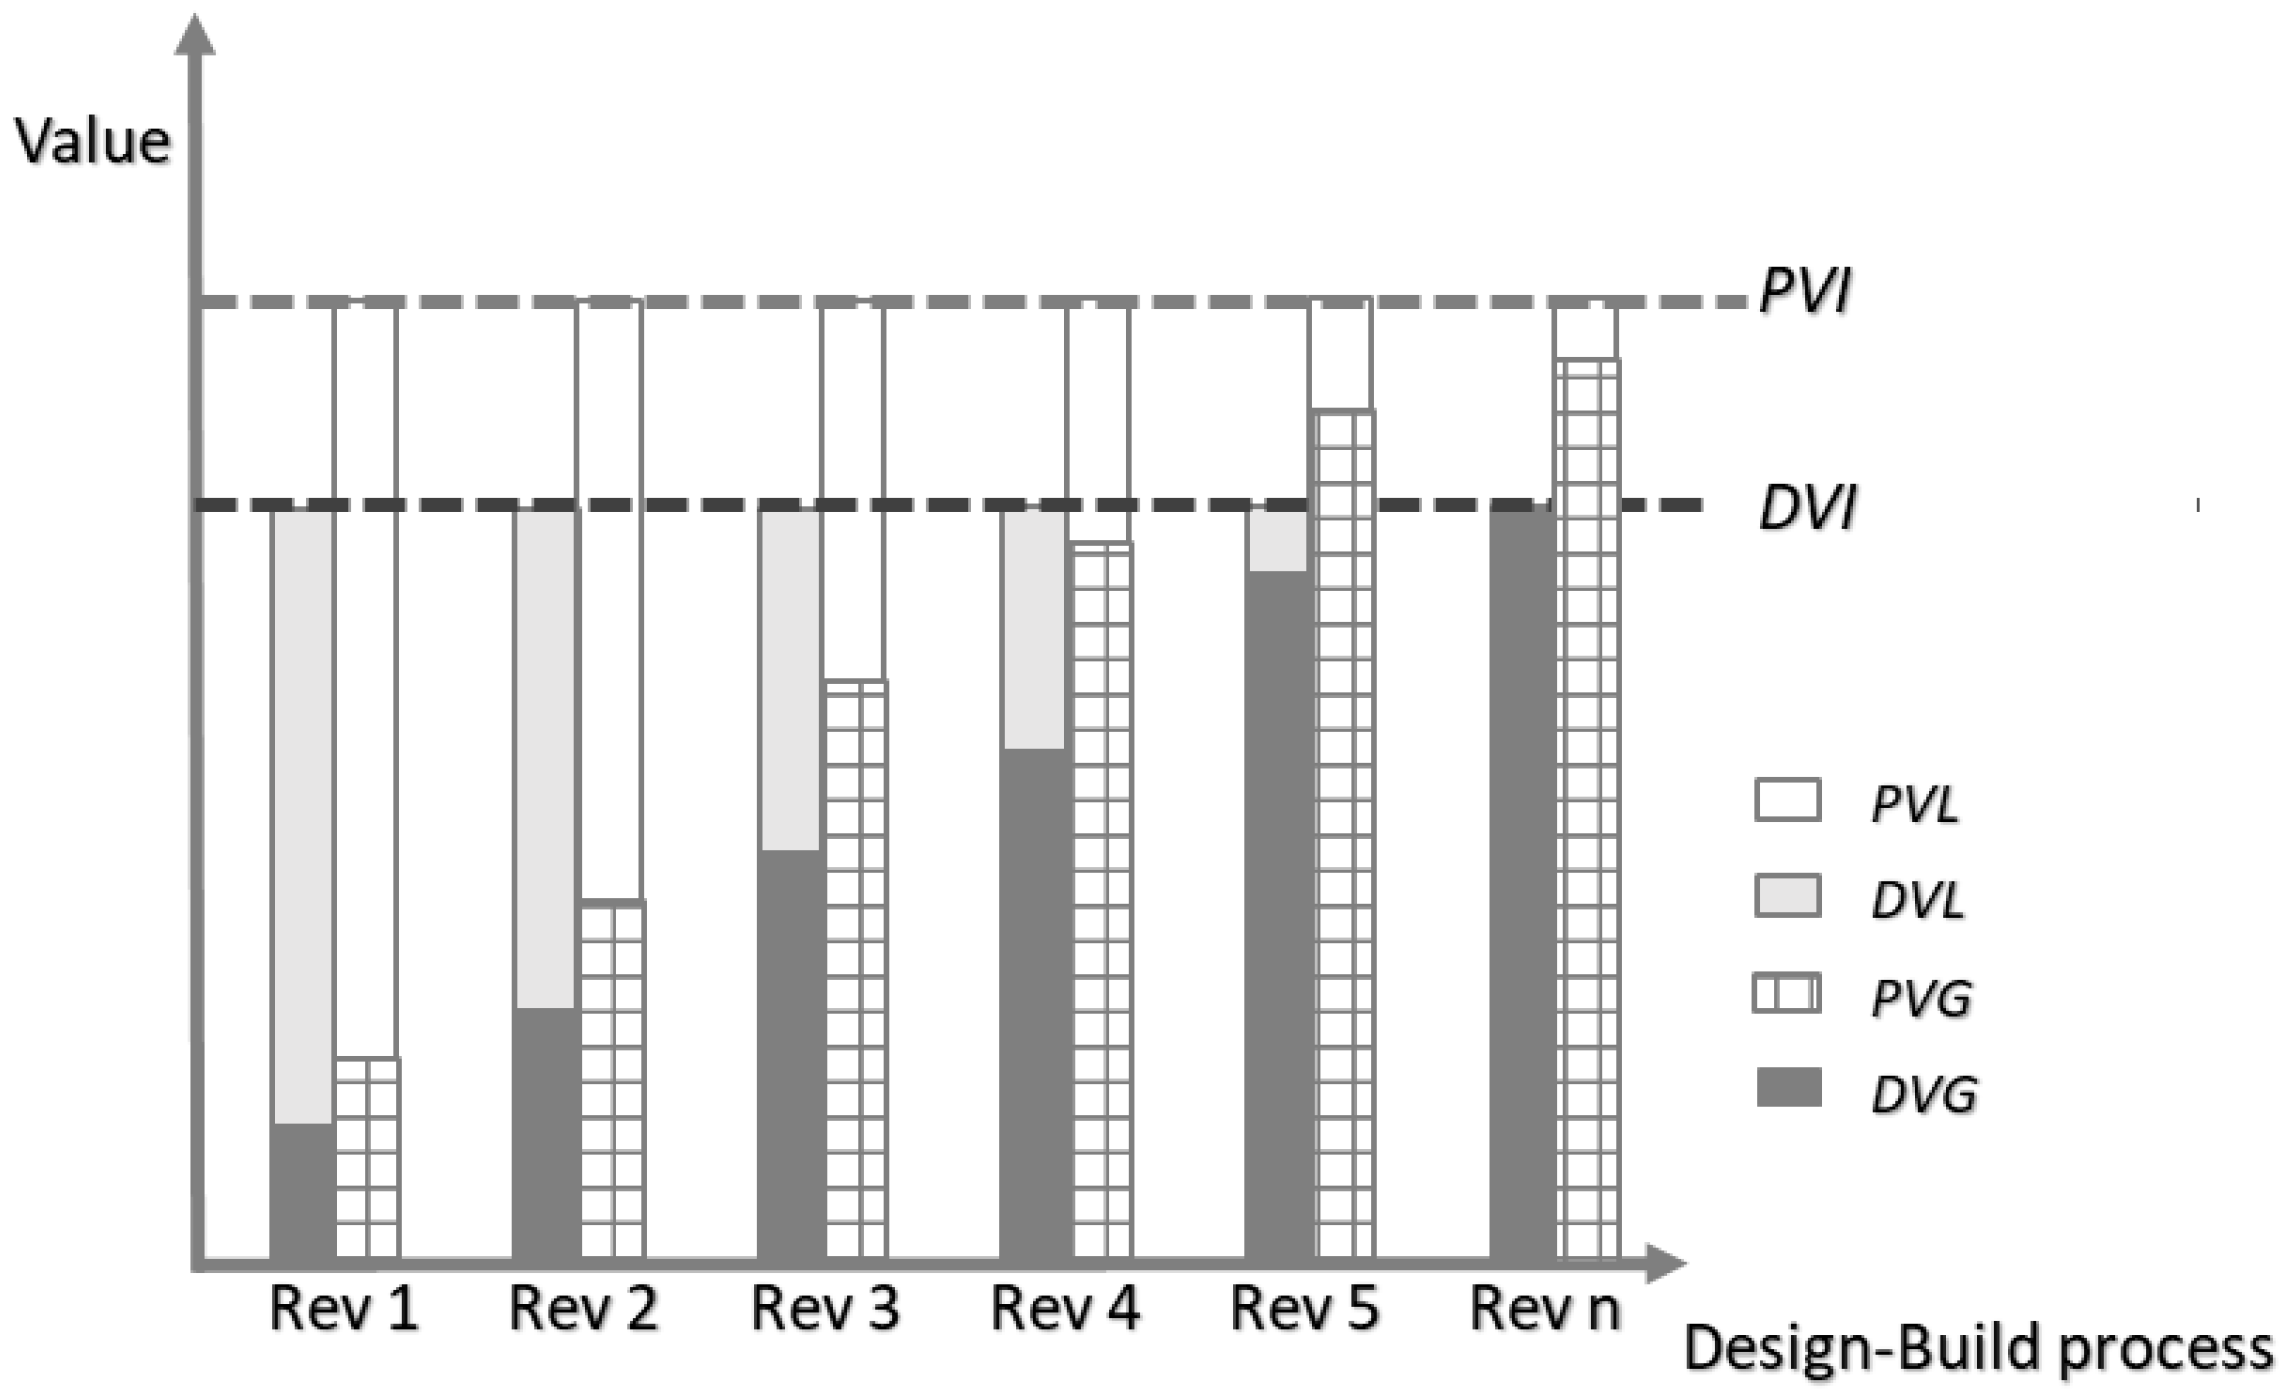
2.1. Generation and Loss of Value

Several authors define value as the relationship between the satisfaction of needs and the use of required resources [21,22] or as a balance between giving and receiving [23]. Other authors understand value as cost and prices or associate it with monetary terms [10,24]. From the perspective of lean management, value is differentiated from cost or its reduction [25], and it is defined from the customers’ view in relation to addressing the concerns of obtaining the desired product and achieving their objectives [26,27,28,29]. On the other hand, value may change over time [30] as customer expectations change [31,32,33] and the context shifts; as a result, value assessments made at various periods could be different [34]. In the context of this study, value is defined as the satisfaction of various customers’ requirements, taking into consideration each customer’s unique vision, its dynamic throughout time, and the required resources for its creation.
For example, value attributes may be aesthetics or functionality, which are not associated with costs, prices or monetary terms, but with requirements or needs. These attributes may be essential for some customers or indifferent and opposite for others.
It is common to find terms such as adding, aggregating, maximizing, or generating value in the literature. They refer mainly to the balance between the number of needs satisfied with the resources used to do so [35]. Value can be enhanced by increasing the satisfaction of needs, even if the used resources increase, as long as the needs are satisfied more than the increased use of resources [36].
The process of generating value has been discussed from many points of view, and many methods associated with value define, analyze, and maximize it in different ways. In general, value generation is related to achieving cost, schedule or constructability [37,38] and the pursuit of the satisfaction of customers’ needs [39,40,41]. The satisfaction of needs is achieved through consideration of the following factors: (1) requirements capture [42,43], (2) requirements flow [33,44], (3) verification that the requirements are met [5,15] and (4) value measurement through metrics [20,45].
According to [46], value generation is a process where customer value is created by meeting customer requirements and eliminating value losses. The value loss is the portion of value not provided, even if it is potentially possible. This concept of value loss is a way of measuring value in relative terms, i.e., the value achieved in relation to the best possible value.

2.2. Target Value Design (TVD)

TVD is a management practice that aims to make customer requirements drivers of design in the interest of delivering value [4]. TVD is an adaptation of target costing to deliver projects in the AEC industry [1]. After a failed implementation attempt [47], it was first successfully applied in this industry in 2002 [48], and this could be considered the first explicit practice representing lean thinking in design [22]. TVD is used to structure and manage construction projects’ definition and design phases to deliver clients value within their satisfaction conditions [49]. These satisfaction conditions are typically cost and time. However, it may include other conditions of value [2] such as quality, productivity, sustainability, durability, aesthetics/appearance, operation and maintenance requirements, flexibility, adaptability, repeatability, safety and environmental aspects, as well as potential benefits, such as problem and claims management agreements or conflict resolution [49,50,51].
TVD has a different way of pricing and costing. Traditionally, the price to bid is defined based on the cost and the established margin. The traditional design process initially establishes the client’s requirements to generate a design and subsequently evaluate aspects of cost, time, quality, constructability and other criteria [52]. This order does not guarantee that the client is willing to pay the cost of executing the fully designed project [53]. In general, this cost exceeds what is expected [54], becoming a design–estimate–rework cycle [27,44]
Using TVD, the opposite is carried out. A TC is defined based on an established price and profit margin [17]. Subsequently, the process design begins based on objectives, i.e., what the client wants and the conditions that must be met for that value to be realized [49]. This process is mainly achieved by “costing” the design in such a way as to achieve the TC with iteration, improvement, and collaboration strategies [3]. TVD addresses cost as an input to the design process instead of its output, as in traditional design [17].
Cross-functional teams within TVD attempt to reduce cost by producing a design with creativity and ingenuity to try to achieve the target cost [55]. TVD uses value engineering as it was originally conceived; cost adjustments are continuously and systematically applied by a fully integrated project delivery team [53]. In construction, value engineering is most often used as an after-the-fact review of a previously produced design rather than as a means to generate and select design alternatives that meet or exceed target costs [48]. In general cost reduction measures are often introduced so late in the design process that they result in diminished functionality, which has given value engineering a dubious reputation in the industry [53]. TVD, however, benefits from these methods but goes beyond value engineering by establishing and directing projects toward project-wide objectives [55].
Nevertheless, TVD requires a paradigm shift that overcomes barriers such as the fragmentation of the AEC industry, the lack of integration of the builder in the early stages of the project, and the lack of a more digital communication based on emerging technologies such as BIM throughout the project life cycle, among others [56,57]. On the other hand, the implementation of TVD requires transparent communication of sensitive information, the creation of a collaborative environment and the active involvement of the owner [11]. In addition, TVD can lead to a longer design process, aspects that not all companies are willing to adopt.

2.2.1. Target Costing

Target costing is a tool for cost management and a strategic approach to new product development, aiming to reduce costs, ensuring quality, reliability, and other attributes that will add value to customers [58]. Target costing is a useful construction management technique that improved project performance by evaluating construction component alternatives that meet the desired cost [59]. One of fundamental principles of target costing is that it uses cost to input the project development process rather than an output [17]. First, the market price is established; based on this, the allowable cost (AC) is determined, which is the maximum amount that the client is willing and able to spend for the asset [60]. The TC is then set and finally broken down to the component level to simplify the design task since it is easier to optimize the project by optimizing its components [44].

2.2.2. TVD Practices and Tools

The design phase aims to produce a design that provides a product with the functionality and capabilities desired by the customer within its constraints. This goal orientation involves using different lean management methods such as set-based design, choosing by advantages, and A3 reports. It also includes other methods developed previously or outside of lean management, such as value engineering, design thinking, BIM, and nD models [11,48,61].
There are many practices and tools associated with TVD in the literature. The researchers conducted a literature review of real projects (not academic workshops) where TVD has been incorporated, and Table 1 summarizes these. A tool is a structured technique or instrument that facilitates the implementation of principles, while a management practice refers to concrete actions associated with increasing productivity [62,63,64]. Table 1 includes the first documented project practices that are used and recommended [47,48]; the fundamental practices listed by [27]; and updated, added, and recommended practices and tools that were associated with the TVD, lean design, and lean management by other authors [4,5,9,11,15,16,17,55,60,61,65,66,67,68,69,70,71,72,73,74,75,76,77,78,79,80].

2.2.3. TVD Measurement

The primary measurement performed in the TVD refers to TC fulfillment; there is no evidence for measuring satisfaction conditions or the systematic reduction in value losses to achieve the target value. For that reason, several authors argue that the TVD focuses on cost over value [8,9].
Based on these insights, Table 2 summarizes the benefits of cost, schedule, and value characteristics in real projects of the AEC industry where TVD is implemented and whether these benefits have been measured (explicit benefit) or not measured (implicit benefit). There is extensive evidence of cost as an explicit benefit and little evidence of schedule benefits; although, most of this evidence is explicit.
There is documentation of implicit and explicit value benefits. Explicit value benefits are observed in specific satisfaction conditions, such as the reduction in space, design drafting times, energy savings, or metrics related to particular aspects, such as safety, quality, sustainability, and constructive factors. Concerning more generalized value attributes (including several types of satisfaction conditions), two measures were evidenced: the degree of importance of value attributes based on percentages of 4 possible answers (very low, low, high, and very high importance) [81] and the value perceived by stakeholder groups on a Likert scale (from 1 to 5) [5].
The implicit benefits are described in terms of improved functionality, quality, performance, and buildability requirements. An effort is observed to show that there are perceived benefits of value but with measurement limitations in the TVD projects. The way to show value within TVD is through multiple measurements of attributes such as safety, quality, environmental impact and cost-effectiveness, in which several indicators are used for each objective set [55] and not with a single indicator showing the whole value achieved.

2.3. Value Analysis Model (VAM)

VAM is an analysis and measurement value model, recently developed by [20], based on the classification of attractive quality theory [84]. This model captures customers’ or stakeholders’ requirements in design and construction processes and transforms them into two target value indices: the desired value index and potential value index (DVI and PVI). The desired value index consists only of the customer’s expectations, whereas the potential value refers to the best possible value that can be obtained. Figure 1 shows a graphical overview of the VAM.
Value generation is subsequently measured, resulting in two new indices: desired value generated and potential value generated (DVG and PVG). Finally, a comparison is made between the target value indices and the generated value indices, numerically and graphically showing the value losses (DVL and PVL) that correspond to the differences between the two types of indices. The value-generated indices must be identical to the target value indices for there to be no value losses.
The generated value indices can be calculated throughout the design and construction processes, considering as many revisions as established by the project evaluation team. In this way, the project’s value evolution can be measured both in the process and product in different time scenarios (Figure 2).
Table 3 summarizes TVD and VAM acronyms used and their meaning to facilitate reading.

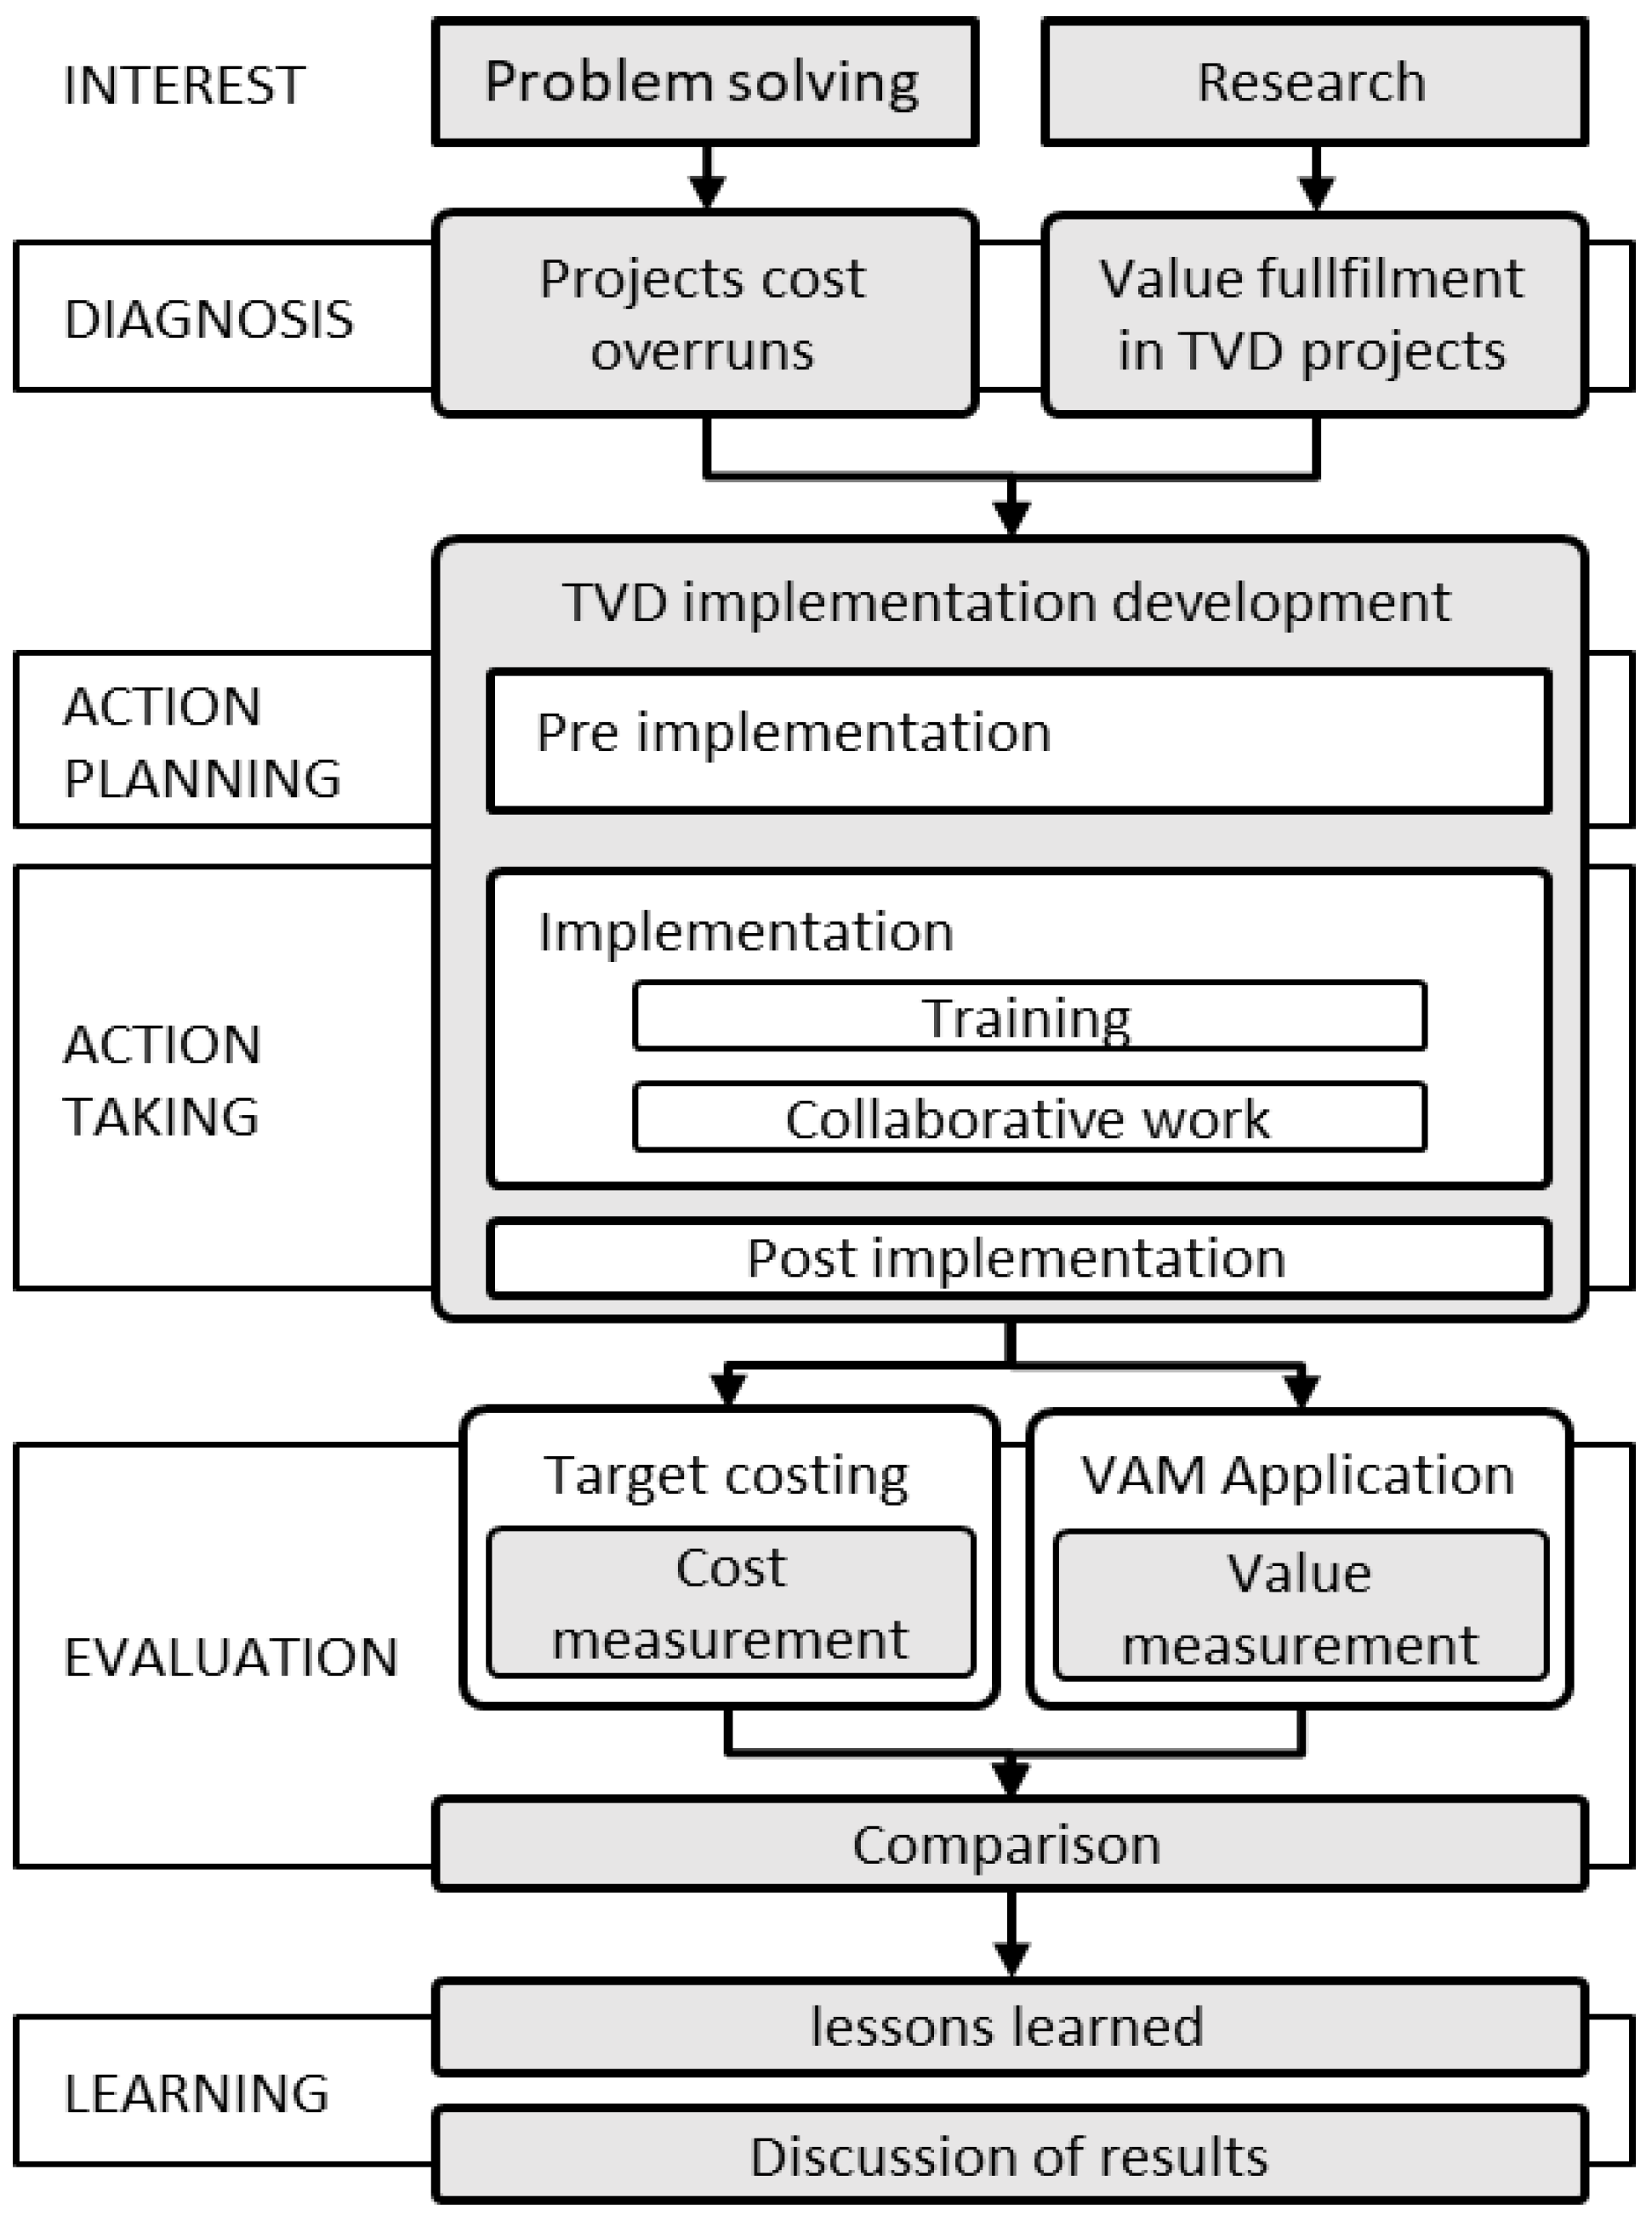
3. Research Approach

This research applied the action research (AR) approach. Lewin [85] is credited with establishing AR, which he depicted as a spiral of learning phases that included planning action, taking action, assessing progress, and changing the plan depending on what was learned. It is research that leads to social action. Many researchers have used the AR method to study dynamic changes, improvements, and implementations of novel methodologies in organizations and processes [61,86,87] because (1) it is based on real conditions and not on theoretical models or simulations, and (2) it is based on collaboration between researchers and stakeholders in the business context [88]. The AR approach was chosen for this study because of the high level of engagement required by the company’s researchers to create and implement the TVD in the project.
According to Azhar et al. [89] AR is an applied or proactive research approach that explores real-life problems vital to the industry and fundamental research. AR aims to increase the understanding of an immediate problem by performing two simultaneous actions: expanding scientific knowledge and solving practical problems. Furthermore, Mckay and Marshall [90] conceptualize AR as two intertwined cycles of interest: problem-solving interests and other research interests.
AR has a five-phase process studied in a research environment within a client infrastructure or system. These phases are: (1) Diagnosis, which corresponds to the identification of the primary problem(s); (2) action planning, which establishes the target for change and the approach to change; (3) action taking, which implements the planned action(s), where the researchers and specialists collaboratively get involved in client organization, causing specific changes to be made; (4) evaluation, where the results are evaluated once the actions have been completed; and (5) learning. While the phase of learning is undertaken last, it is usually a continuous process [89].
According to Mckay and Marshall [90], after identifying a real-world problem, a data and information gathering activity follows its nature and context, thus beginning the first interest cycle. Therefore, in collaboration with the participants in the process, the action researcher plans a problem-solving strategy and proceeds to implement a series of actions. These actions are monitored and evaluated regarding their impact on the perceived problem situation. When stakeholders are deemed to have achieved satisfactory results in the problem context, the researcher either withdraws from the situation or modifies the action plan and makes additional changes in the problem context.
In the second interest cycle, the researchers identify research questions by reviewing relevant literature and designing a research project. These actions are monitored and evaluated based on the research interests and the intervention’s effect on the research questions. If the research questions can be satisfactorily resolved, the researcher exits the organizational setting. If not, the researcher will modify the plans and designs to seek further explanations [90].
Figure 3 presents the research approach based on the five-phase process proposed by Azhar et al. [89] related to two interconnected interest cycles of Mckay and Marshall [90]. The client system used in this research is a pilot project in a real estate and construction company (Company “S”) located in Santiago de Chile, whose main activity is the integral execution of high-rise residential buildings.
In the diagnosis phase, two interests were identified: (1) constant cost overruns in the projects that do not allow the desired margin or profit to be obtained (problem-solving interest) and (2) the need to measure the fulfillment (or not) of the value expected by the customer (research interest).
In the action planning phase, the authors developed the manner in which TVD would be implemented. Three stages were determined: pre-implementation, implementation and post-implementation. The pre-implementation is part of the action planning phase. In this phase, the pilot project was selected, the data collection plan was made, and the most appropriate TVD tools were chosen considering the organization’s context and characteristics.
In the action-taking phase, the implementation and post-implementation stages of the TVD were considered. TVD implementation was gradually performed with training workshops, and the TVD practices and tools were incorporated immediately or at different times in collaborative work [20]. In the evaluation phase, cost measurement was controlled by target costing. Value measurement was performed in three longitudinal reviews by the application of VAM. Subsequently, the results could be compared. VAM was chosen because it depicts, in very similar terms, the target costing with the measurement and evolution of value, which makes their comparison feasible. VAM provides measurements with a common language for all value attributes via indexes that make it possible to compare cost and value; this has not been possible before with other value analysis methods.
The learning phase is considered a continuous process of learned lessons that are captured from the action planning, action-taking, and evaluation phases.

3.1. Phase 1: Diagnosis

As explained in the methodology approach, in the diagnostic phase, the authors identified two interests: practical and research.
Historically, the margin achieved in the projects carried out by the company “S” was much lower than desired. The existence of multiple parameters that affect the selling prices of the properties [91], the high competitiveness within the real estate market [92], and the constant cost deviations between estimation and execution [93] make the market price a factor in the viability of the projects. Cost overrun percentages of the company “S” projects range from 1% to 7%, which are subtracted from the already decreased profit to adapt to market prices. The causes of these cost overruns are generally design changes during execution, errors or omissions in deliverables, late consideration of industrialization or standardization aspects, and post-sale incidents. As market competition in the real estate sector becomes more intense, a lower-cost framework is fundamental for a company’s survival [76]. For this reason, cost reduction is a competitive advantage often pursued by residential real estate companies. In this case, TVD implementation is highly recommended since, in this design method, a TC is established to consider a target (market) price and the desired margin. Based on this TC, concrete actions are established to reduce costs (without reducing the value) and reach the TC, and therefore the desired margin. Although this methodology cannot ensure that the target cost is met or that there are no cost overruns in all cases [47,94], most projects that used TVD were completed on time, within budget, and delivered buildings that the owners considered fit for purpose [55,95]. In addition, the existence of principles associated with collaboration and team integration increases the certainty of performance and improves decision-making processes and project risk management [96].
Parallel to solving the practical problem described above, this study addresses a research problem related to fulfilling the target value in the TVD project environment. Therefore, the authors explore (1) the measurement of the value of customer satisfaction conditions, (2) the identification and quantification of value losses in the project process and product, and (3) the comparison between target value fulfilment and TC fulfilment in the context of the TVD project.

3.2. Phase 2: Action Planning

The authors designed the TVD implementation in three stages: pre-implementation, implementation, and post-implementation. Additionally, the authors selected the pilot project and the people who participated in the process, designed the data collection instruments, defined the type of information to collect, and selected TVD tools.

TVD Pre-Implementation

  • Pilot project selection
This paper analyzed a housing design project in Chile to evaluate both cost and value evolution in the design and construction process. This project was selected due to its scope, user profiles, and level of design progress, in addition to the researcher’s access to the involved stakeholders. The researchers selected a pilot project in the preliminary design stage from the company’s portfolio of housing projects to enable a more effective TVD implementation. The project consists of two residential buildings of eleven floors each for a total of 235 housing units, a supermarket, and a shopping center to cover the needs of the lower–middle income socioeconomic demographic. When the intervention started, the project was in the preliminary design stage. On the other hand, the organization was open to implementing the TVD changes in their projects.
  • Participants selection
The authors planned with the company that the people to participate in this process would be twenty professionals from the different technical areas of the company, who represented three clients (the owner, the designers and the builders). The owner was the real estate company that requested the project’s design and construction; it i represented by a director who is part of its management. The designers were represented by architecture and engineering professionals. The builders consisted of the project manager and cost staff. The project’s progress (preliminary design) did not make it possible to incorporate end users. These twenty professionals were the direct source of the information necessary to observe the evolution of cost and value.
  • Preliminary considerations
The authors scheduled preliminary meetings to establish the action training plan, and set the project’s AC and TC. Additionally, the authors formed four participant clusters (called committees): cross-functional teams of four to eight people. The committees were divided according to systems within the project: (1) structure and urban development, which includes the foundations, slabs on grade, superstructure, roofing, exterior walls, and urban development; (2) Mechanical, Electrical and Plumbing (MEP), including Heating Ventilation Air Conditioned (HVAC), and conveying systems; (3) finishes; and (4) logistics. These committees attended weekly work meetings. Additionally, the authors established workshops on TVD practices and tools, general meetings on action proposals with all committees in attendance, and meetings to review compliance with the teams’ agreements.
It was determined that three sub-management areas of real estate management and five sub-management areas of construction management would make up the group of professionals participating in the program. Within real estate management were the project, architecture and engineering, and sales sub-management; within construction management were the project and construction administration, delivery and after-sales, quality, costs and procurement, and logistics sub-management.
  • Data collection planning
Data collection was planned through interviews, surveys, and work meetings. The interviews were associated with collecting the attributes necessary to analyze the value for the consulted clients from the three points of view (owner, designer and builder). The surveys were of two types: an initial survey to classify the value attributes, and thus to calculate the initial indices, DVI and PVI, and a second survey to carry out the reviews of the value generated. Three revisions (Rev) were made to the value generated (DVG and PVG), value fulfillment percentage (DVFP and PVFP), and value losses (DVL and PVL). Rev. 0 represents the initial value before the TVD implementation, Rev. 1 is the value while incorporating some TVD practices and tools, and Rev. 2 is the value after the TVD implementation program.
The work meetings were diverse; their objectives varied from determining the types of costs to be studied (IC, AC, and TC), identifying concrete actions to incorporate to achieve the target costs, and validating information from the interviews and surveys performed. Table 4 presents data collected for both cost and value measurements. Before the TVD implementation, information on the cost evolution was collected regarding the IC, AC, and TC.
  • TVD practices and tools selection
Based on the literature review shown in Table 1 and according to the company context and the needs of the project, key tools were selected to be used in this TVD implementation. The authors considered it essential to use the fundamental practices of [27] as a basis for implementation. Additionally, other practices and tools identified in Table 1 associated with lean management and lean design, which are recommended by several authors to facilitate and collaborate with the implementation of TVD, were incorporated. Appendix C shows which practices and tools were incorporated in the action plan or through the training plan. One of the lean practices, the last planner system, is already incorporated into the company’s projects in construction stages, so it does not appear in Appendix C.
  • Cost measurement in pre-implementation
At a meeting of senior management, the AC, IC and TC were calculated as follows: after establishing the market price according to the competitiveness parameters of the sector and the characteristics of the project, the AC was calculated, responding to the minimum profit that could be obtained for the project to be feasible (See Equation (1)). Then, the TC was established according to the project’s ideal or desired profit margin (See Equation (2)). The IC corresponds to the preliminary cost estimate of the preliminary design. This IC may not be considered very accurate, as it is very preliminary, but as the design progresses and each iteration of the design is costed, the cost should be more reliable:
A C = M P m p
T C = M P i p
MP: market price, mp: minimum profit, ip: ideal profit.
The TC was established according to the market price and the desired margin. Since the margin historically achieved in the projects carried out by the company was much lower than the desired margin, the AC was established according to the market price and the intermediate margin between the desired and historical margin. The researchers were present at the meeting to guide the managers in determining these costs.
  • Value measurement in pre-implementation
Regarding the value measurement, the researchers initially determined satisfaction conditions, value attributes, weighting factor (W) and the desired and potential value indices (DVI and PVI). These indices represent what was expected by the client and the highest possible value that could be delivered.
The authors collected information regarding value attributes within the conditions of product satisfaction and the design and construction process. The value attributes were collected in a survey within one of the preliminary meetings in which the group of participants was asked the following questions: (1) Describe different value attributes that you consider essential to the following customers: user, owner, designers, builders, and reviewers; (2) If you had to prioritize one customer over another, what would be the order and percentage of importance to you?
The answers to these questions were complemented through interviews with the owner and some professionals who could not attend preliminary meetings. According to the literature review [2,51,97], satisfaction conditions and their relationship with the collected value attributes were established.
The product’s satisfaction conditions are home comfort, finance and investment, performance, image, innovation and technology, and health and sustainability. The process satisfaction conditions are information flow and communications, time and costs, tools and technology, constructability, integration, corporative environment, and deliverables. Appendix A and Appendix B show the value attributes and their relationship with the conditions of satisfaction. In addition, these Appendixes show the ideal values (%Ideal) for each attribute and their results for revisions 0, 1 and 2 in percentage values (%R0, %R1 and %R2).
The group identified the customers present in the process and gave them a percentage weight according to their importance. This consideration is a weighting factor (W) per customer, corresponding to the average of all the responses received. It is essential to clarify that the group of professionals ruled out the reviewers for the value assessment, and the end-user could not be consulted due to the preliminary state of the project. Therefore, the customers identified were owners, designers, and builders.
For the DVI and PVI calculation, the authors classified the list of value attributes according to the types proposed by [84]: must-be (M), one-dimensional (O), reverse (R), attractive (A), and indifferent (I), using a two-dimensional survey. The survey’s first question was functional: How do you feel if the proposed attribute is provided? The second question was dysfunctional: How do you feel if the proposed attribute is not provided? Each question (either functional or dysfunctional) had five response options: Like, Must be, Neutral, Live with, and Dislike. Based on both responses, the ranking of the attributes was achieved. Subsequently, according to this classification, each of them was multiplied by a value established in the VAM [20], which is presented in Table 5. To calculate the DVI, only what the client expects was considered (marked with asterisks in Table 5). The DVI is the sum of the products of the number of attribute types and their valuation (expected presence or absence) divided by the total attributes. On the other hand, the PVI is the sum of the DVI with the percentage of “A” attributes. Based on these calculations, the authors established the DVI and PVI of each client in the process and the product.
The dynamic needs of customers [32] and the evolving nature of the attributes of Kano’s model [31] could cause DVI and PVI to vary over time. For the purposes of this research, DVI and PVI were considered fixed from the beginning of the research since changes in product preferences in the AEC industry are assumed to be slower than for products in other manufacturing industries with more volatile markets [32] due to the longer life cycle duration of AEC projects. Likewise, the classification of the attributes for calculating DVI and PVI was validated in a focus group where the correct identification of each attribute per participant was verified. Regarding the evolutions of the value generated, these changes should reflect the incorporation of actions from the implementation of the TVD and are not related to changes in preferences or the clients’ needs.
  • Value Review 0
The authors made three revisions to measure the value: Revision 0, which coincides with TVD pre-implementation; Revision 1, in TVD implementation; and Revision 2, performed after approximately six months of TVD implementation. In each revision, the DVGs and PVGs were calculated and compared with the initially calculated DVI and PVI, resulting in value fulfillment percentages (DVFPn and PVFPn) and value losses (DVLn and PVLn). Value losses are the gap between PVI and PVG and DVI and DVG.
To calculate the value generated, the authors applied a survey with the list of attributes to quantify each attribute’s level of presence and absence. The survey questions were worded as follows: “Regarding the list of attributes of the design process shown below, what percentage do you perceive to have been fulfilled in the project? If you are not aware of the item, please answer ‘I have no information’”. DVG and PVG are calculated from each attribute type (see Table 5) and the level of presence and absence of each attribute, as shown in Equations (3) and (4):
D V G = ( M a   ×   1 )   +   ( O p   ×   1 )   +   ( O a   ×   1 )   +   ( R p   ×   1 )   +   ( R a   ×   1 ) M   +   O   +   R   +   A   +   I
P V G = ( M a   ×   1 )   +   ( O p   ×   1 )   +   ( O a   ×   1 )   +   ( R p   ×   1 )   +   ( R a   ×   1 )   +   ( A p   ×   1 ) M   +   O   +   R   +   A   +   I
M: must-be, O: one-dimensional, R: reverse, A: attractive, I: indifferent, p: level of presence, and a: level of absence.

3.3. Phase 3: Action Taking

The authors incorporated TVD into the company through a research alliance between industry and academia. The program was called “on the path to TVD” and was implemented by adapting it to the country’s cultural context, the company, and the selected project, focusing on training action; this means implementing the practices and tools, since professionals were trained in a period of 10 months. These professionals were from the Real Estate Management and Construction Management department of the company “S”. The implementation would therefore extend from the preliminary design to the detailed design and start of documentation.

3.3.1. TVD Implementation

The TVD implementation comprised two sections that were conducted simultaneously: training plan, and collaborative work.
  • Training
The authors implemented training workshops based on the TVD practices and tools. The first workshop introduced the TVD, which included basic concepts, the nine fundamental practices of [27], and other complementary practices of other authors. Six additional workshops were planned to be delivered in two-hour sessions with approximately 20 professionals from the company. The workshops’ topics were as follows: constructability, choosing by advantages (CBA), A3 thinking, innovation and continuous improvement, integrated project delivery (IPD), and building information modeling (BIM). The authors also introduced other concepts regarding the practices and tools of TVD to complement the primary topics. For example, target customer, industrialization, the importance of advantages, nD models, virtual design and construction, collaboration levels, root cause analysis, 5 W + 2 H, relational contracts, BIM coordination, kaizen events, and design thinking. Appendix C contains the practices and tools, as shown in Table 1, incorporated through the company’s action and training plan.
  • Collaborative work
The authors implemented the action plan gradually through big group meetings (similar to the Big Room in the company) and cluster work through committee meetings. The practices and tools were tested and incorporated into the project as they were learned in the workshops. Each cluster was responsible for a part of the gap between the TC and the IC proportional to its area budget (sub-targets). Based on the Pareto analysis, the committee’s budget was ordered according to the items or macro-items by costs, from highest to lowest, to establish concrete actions to systematically achieve the TC. The researchers brainstormed to establish possible actions and their priorities. The CBA decision-making method was beneficial in cluster discussions to select which actions should be incorporated and choose the most significant advantages among various alternatives.
Likewise, the researchers established “rules” for the committee and big group meetings, in which an atmosphere of trust, open communication, and participation should remain. The group established and analyzed problems to be addressed or desired situations to be reached from the points of view of different clients, and subsequently, they proposed actions. These actions were reviewed to see if they impacted other activities or actions of other committees. For the suggested actions, cost/time/benefit metrics were requested whenever possible.
All clusters or a representative of the cluster were present in the large group meetings. These meetings had different purposes: (1) review of the proposed actions by cluster and if they were related to other clusters; (2) review of the difficulties of implementing TVD practices and tools both in the project and in the company; (3) feedback meetings (plus/delta) to direct the efforts toward the best for the project; and a (4) kaizen-event-style meeting, to innovate and explore through design thinking and PDCA.
As the TVD practices and tools were implemented (see Appendix C), and the clusters’ actions were documented and estimated to achieve the TC. TC achievement, the implementation challenges of the TVD practices, tools in the company and the project, and what was learned based on plus/delta activities were documented in the post-implementation program.

3.3.2. TVD Post-Implementation

The authors analyzed the target cost’s fulfillment after implementing the “on the road to TVD” program, as explained in the Results section. Additionally, the authors identified difficulties and the overall benefits of the implementation program through a plus/delta activity and established future actions for the company. Phase 5 (learning) introduces these items.

3.4. Phase 4: Evaluation

This phase shows the results obtained from the measurements and evolution of cost and value, respectively, throughout the project.

3.4.1. Cost Measurement

The authors designed two types of TVD update formats based on two examples presented by [48]. The first recorded the date, description of the proposal, and estimated cost of proposals generated in the committee meetings. The second corresponded to monthly follow-ups, where the actions proposed by the committee, descriptions, estimated cost, and cost since the last change were recorded. These formats contributed to elaborating the project’s cost evolution charts.
  • Preliminary Cost Indexes
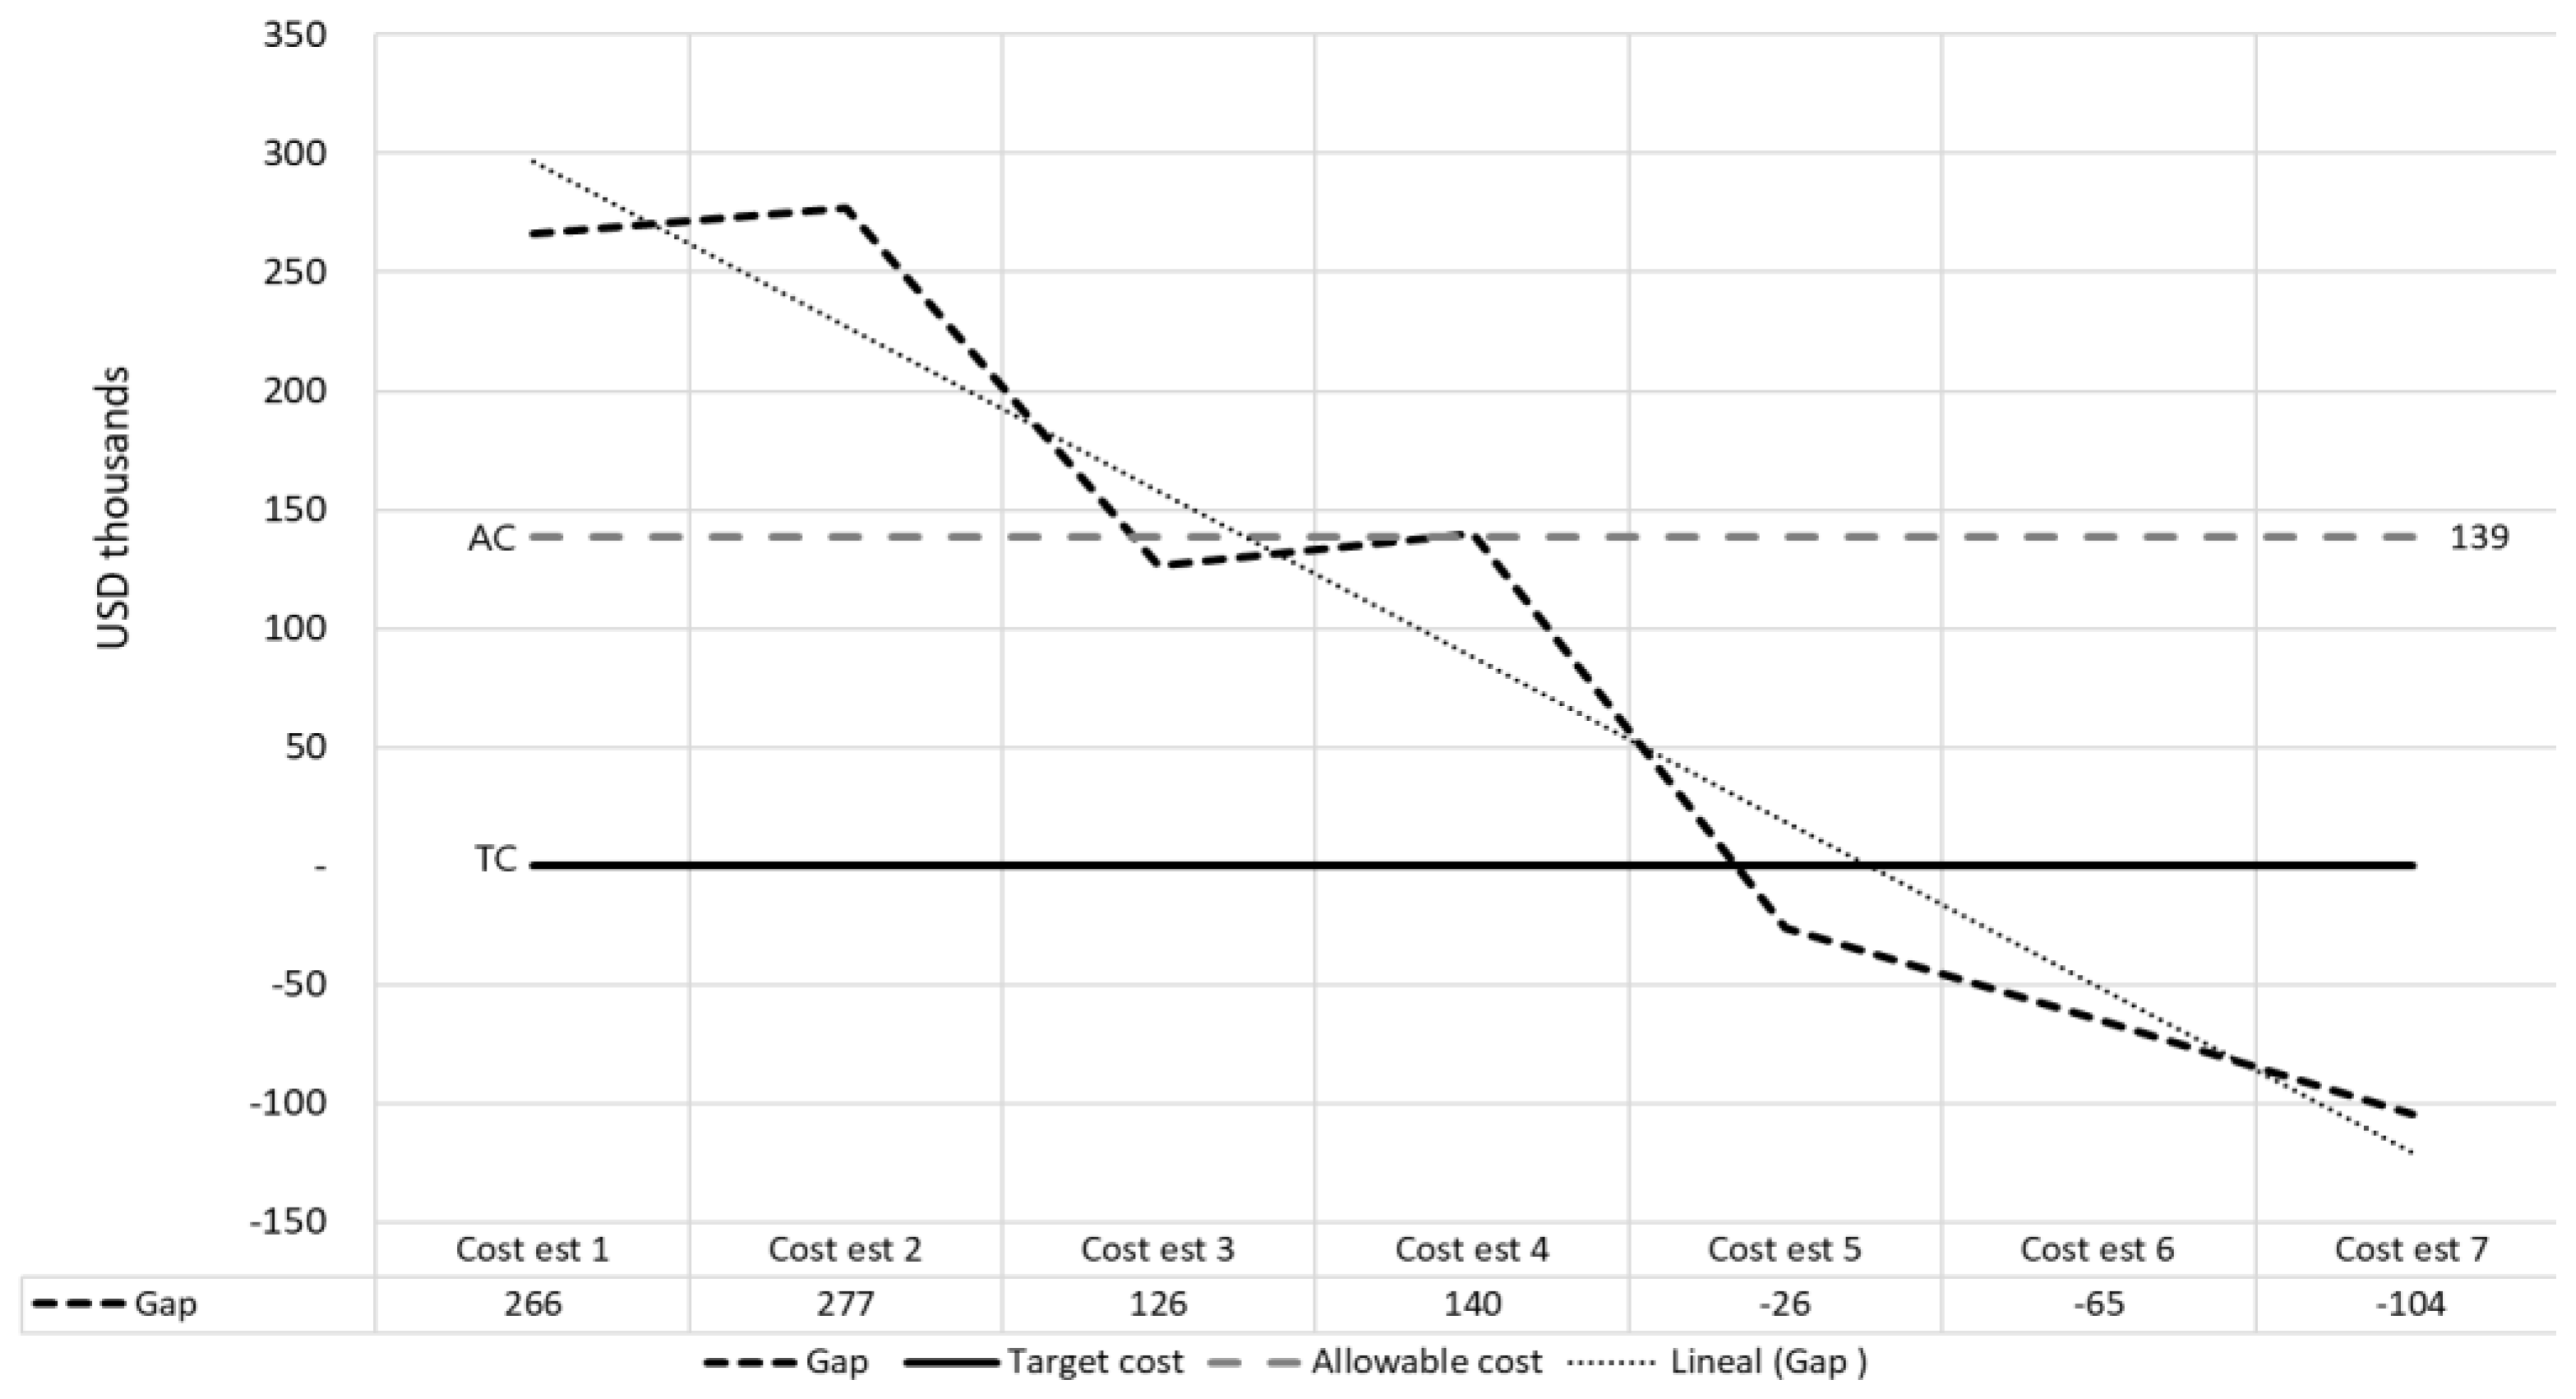
After having calculated the TC, AC and IC, gaps were determined, which would be worked by subtargets in each committee. The gap between TC and IC was proportionally distributed among the four committees to the committee’s participation in the total project budget. Table 6 illustrates this gap distribution (subtargets) in thousands of U.S. dollars, the reduction amounts achieved (in thousands of U.S. dollars), and the achieved gap percentages per committee. The results show that two committees could not achieve the corresponding subtarget (finishes and logistics), but the other two committees achieved a much higher percentage than expected (more than 200%). The project achieved the TC and an additional 39% reduction. It is essential to highlight that success was achieved jointly by the four committees, which complemented each other’s requested actions and incorporated them between committees.
  • Cost Evolution
Figure 4 shows the cost evolution throughout the project. This chart was constructed based on the gap between the estimated cost and the TC. Figure 4 depicts seven cost estimates corresponding to the project committees’ actions until the TC goal is reached and exceeded. From the fifth estimate onwards, the committees achieved the TC but kept implementing actions to achieve even more savings, saving an additional USD 104,000 in costs.
The cost estimations did not respond in time to the proposed actions because they were centrally made by the cost department. It would be desirable to continuously and quickly incorporate cost estimates of the proposed actions. Given the delays in this estimation, the cost department made the costs of all project items visible to each committee, so that the committee could make the relevant calculations. This action significantly contributed to accelerating the cost estimates.

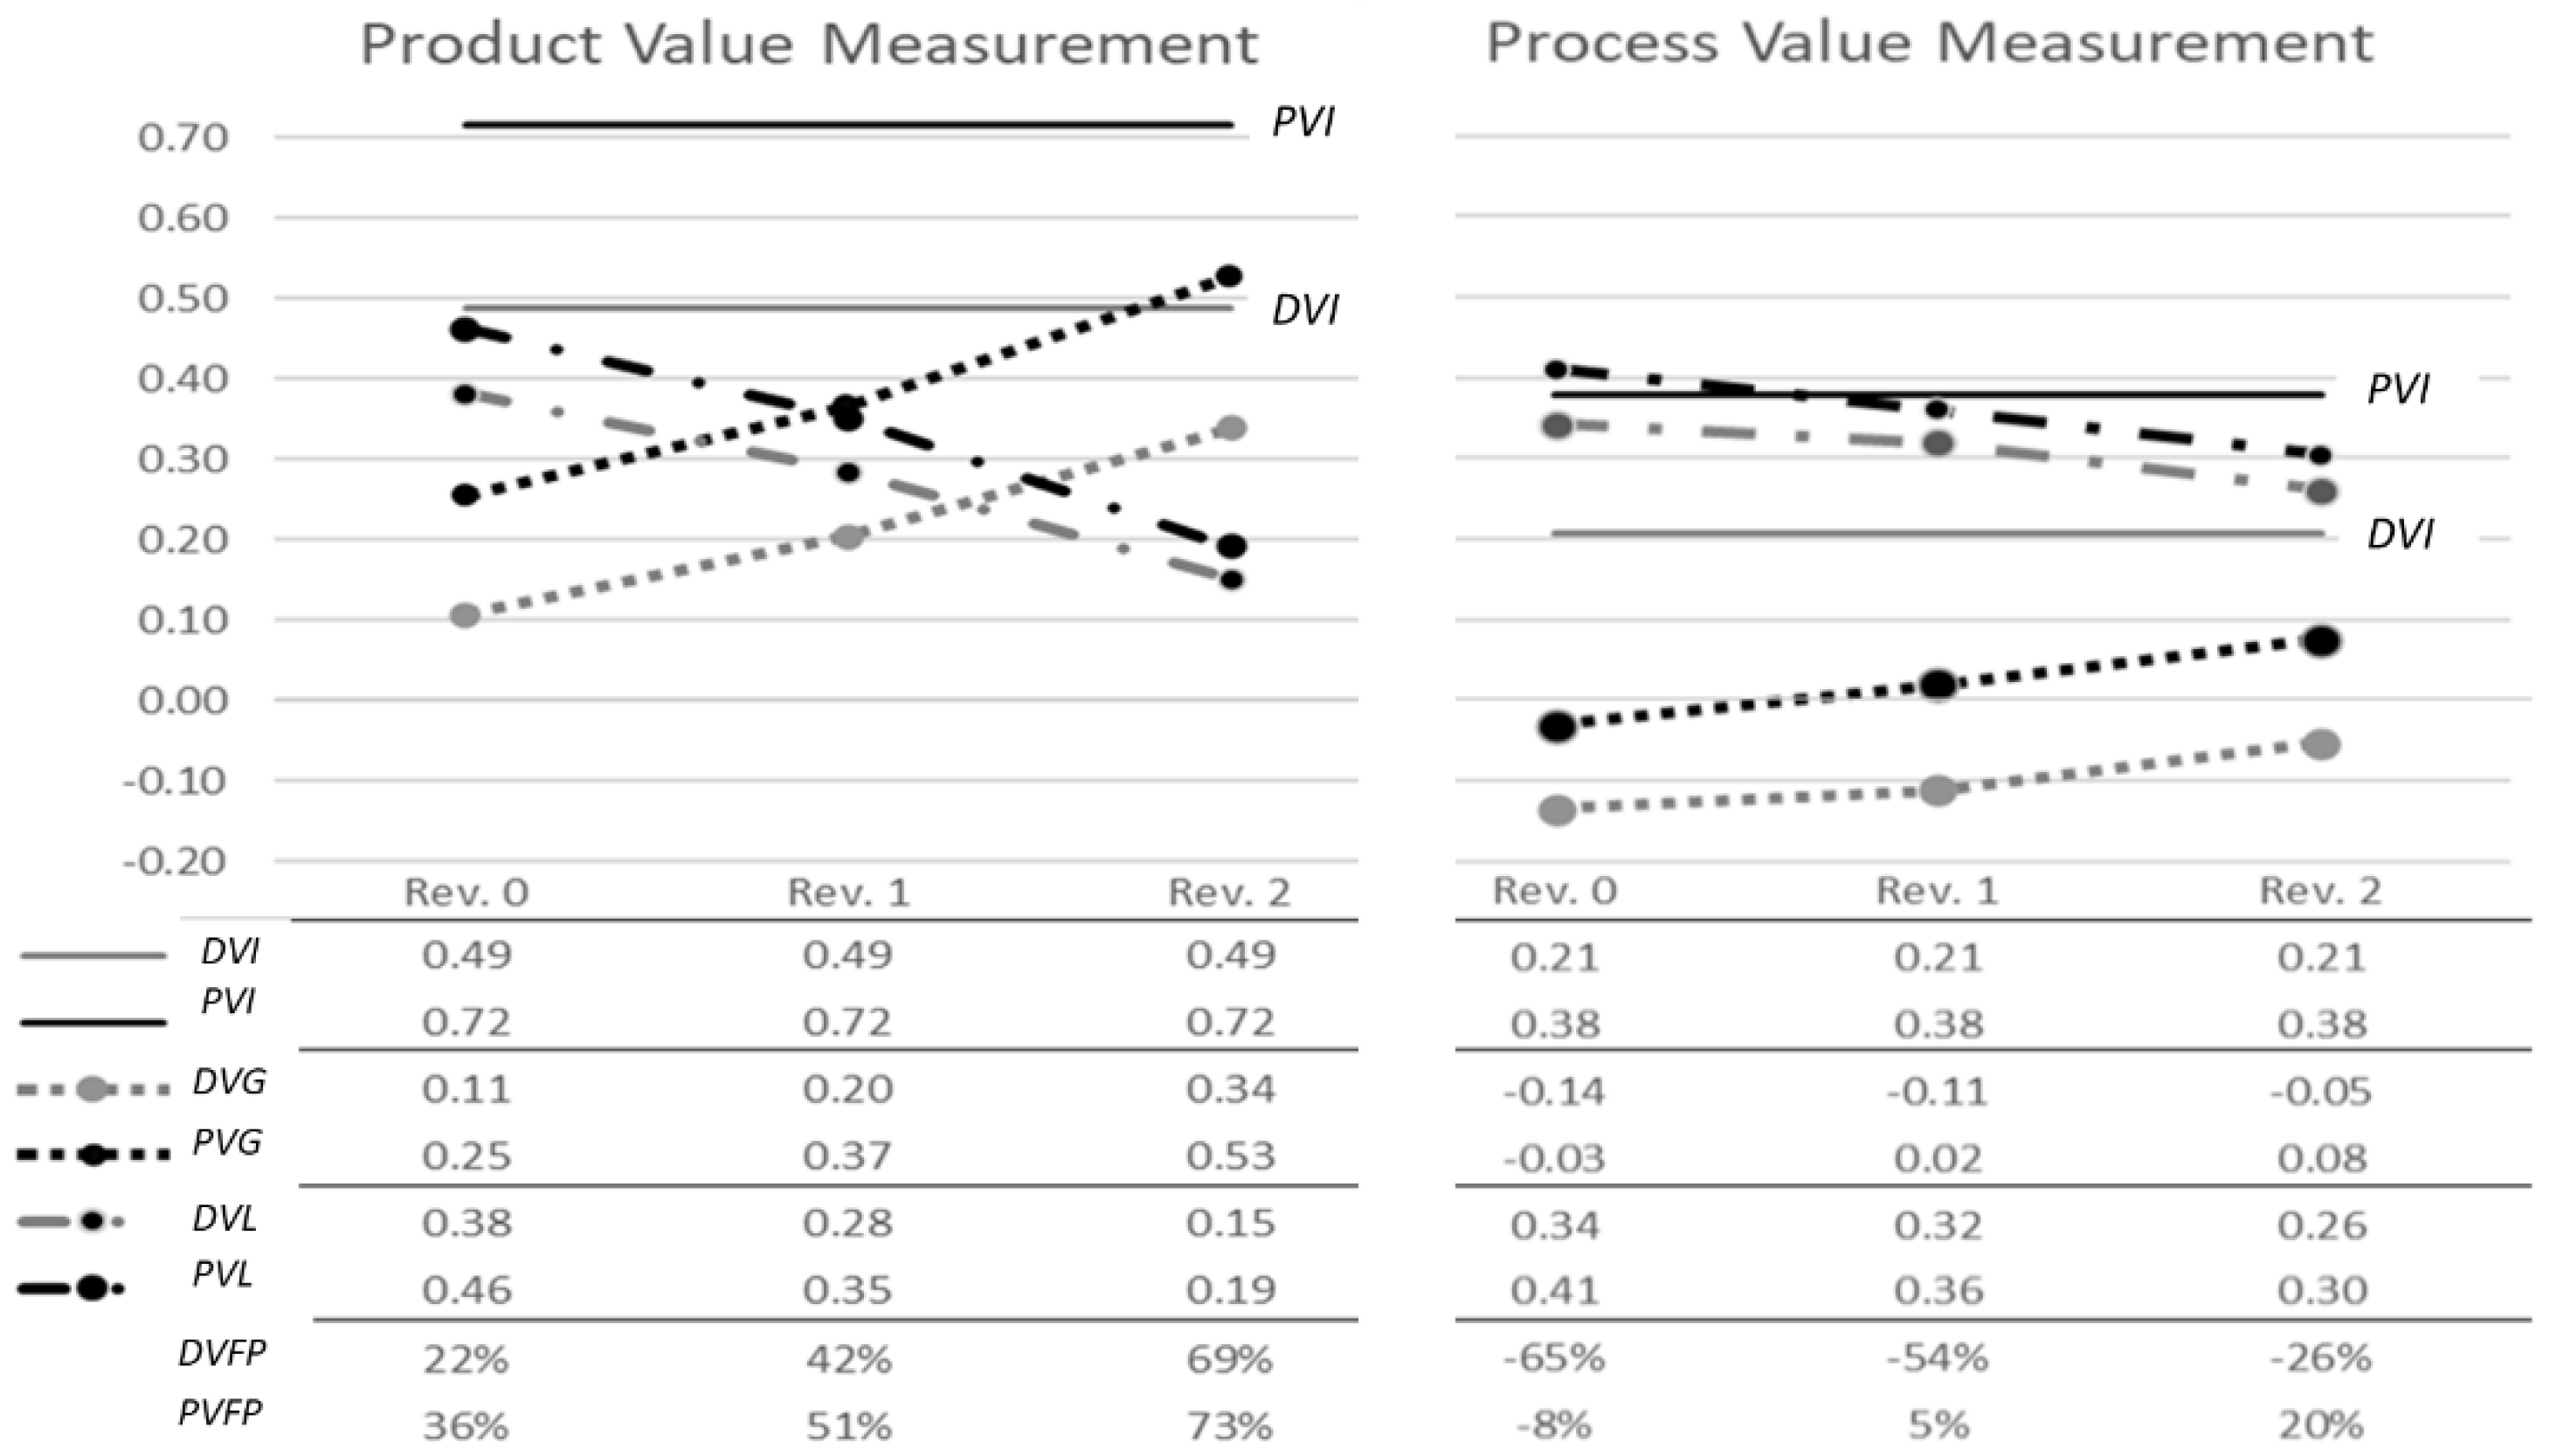
3.4.2. Value Measurement

This subsection shows the results of preliminar indexes and the three value reviews of both the process and the project’s design product.
  • Preliminary Value Indexes
As explained in the TVD pre-implementation, W per customer, DVI and PVI were calculated. Table 7 shows these indexes per customer. The total DVI and PVI of the project is the sum of the products between the indices and W.
  • Value Evolution
Figure 5 shows the value evolution, where the value increases (dotted lines) and value losses (dashed and dotted lines) decrease as the project progresses. However, neither case (product or process) achieved the desired or potential value. In the product, the reduction in value losses is higher than in the process. This difference between product and process may be because it is generally designed with consideration of the final product and not necessarily the process, even though one of the practices of the TVD is the integration of the product and the process, i.e., the ability to use product–process–cost models [4].
The value generated in the process is low, reaching negative numbers. In the VAM, negative values represent (1) the non-incorporation of essential or “M” attributes; (2) the low fulfillment of “O” attributes; (3) the incorporation of “R” or contrary attributes to what is desired by customers; or (4) the combination of all the above possibilities. Incorporating M attributes alone avoids customer dissatisfaction, bringing the value to an initial zero level. The absence of “O” attributes or the presence of “R” attributes reduces the product or process value and can reach negative numbers.
The last two rows show the desired and potential value fulfillment percentage in each revision (DVFP and PVFP). If the trend of adding value in the project is maintained, the product could reach DVFP and PVFP above 90%, minimizing value losses to percentages of less than 10%, these numbers being very acceptable. However, the process would still not reach tolerable values since the DVG would still have negative terms, and the PVFP could reach a percentage close to 30%.

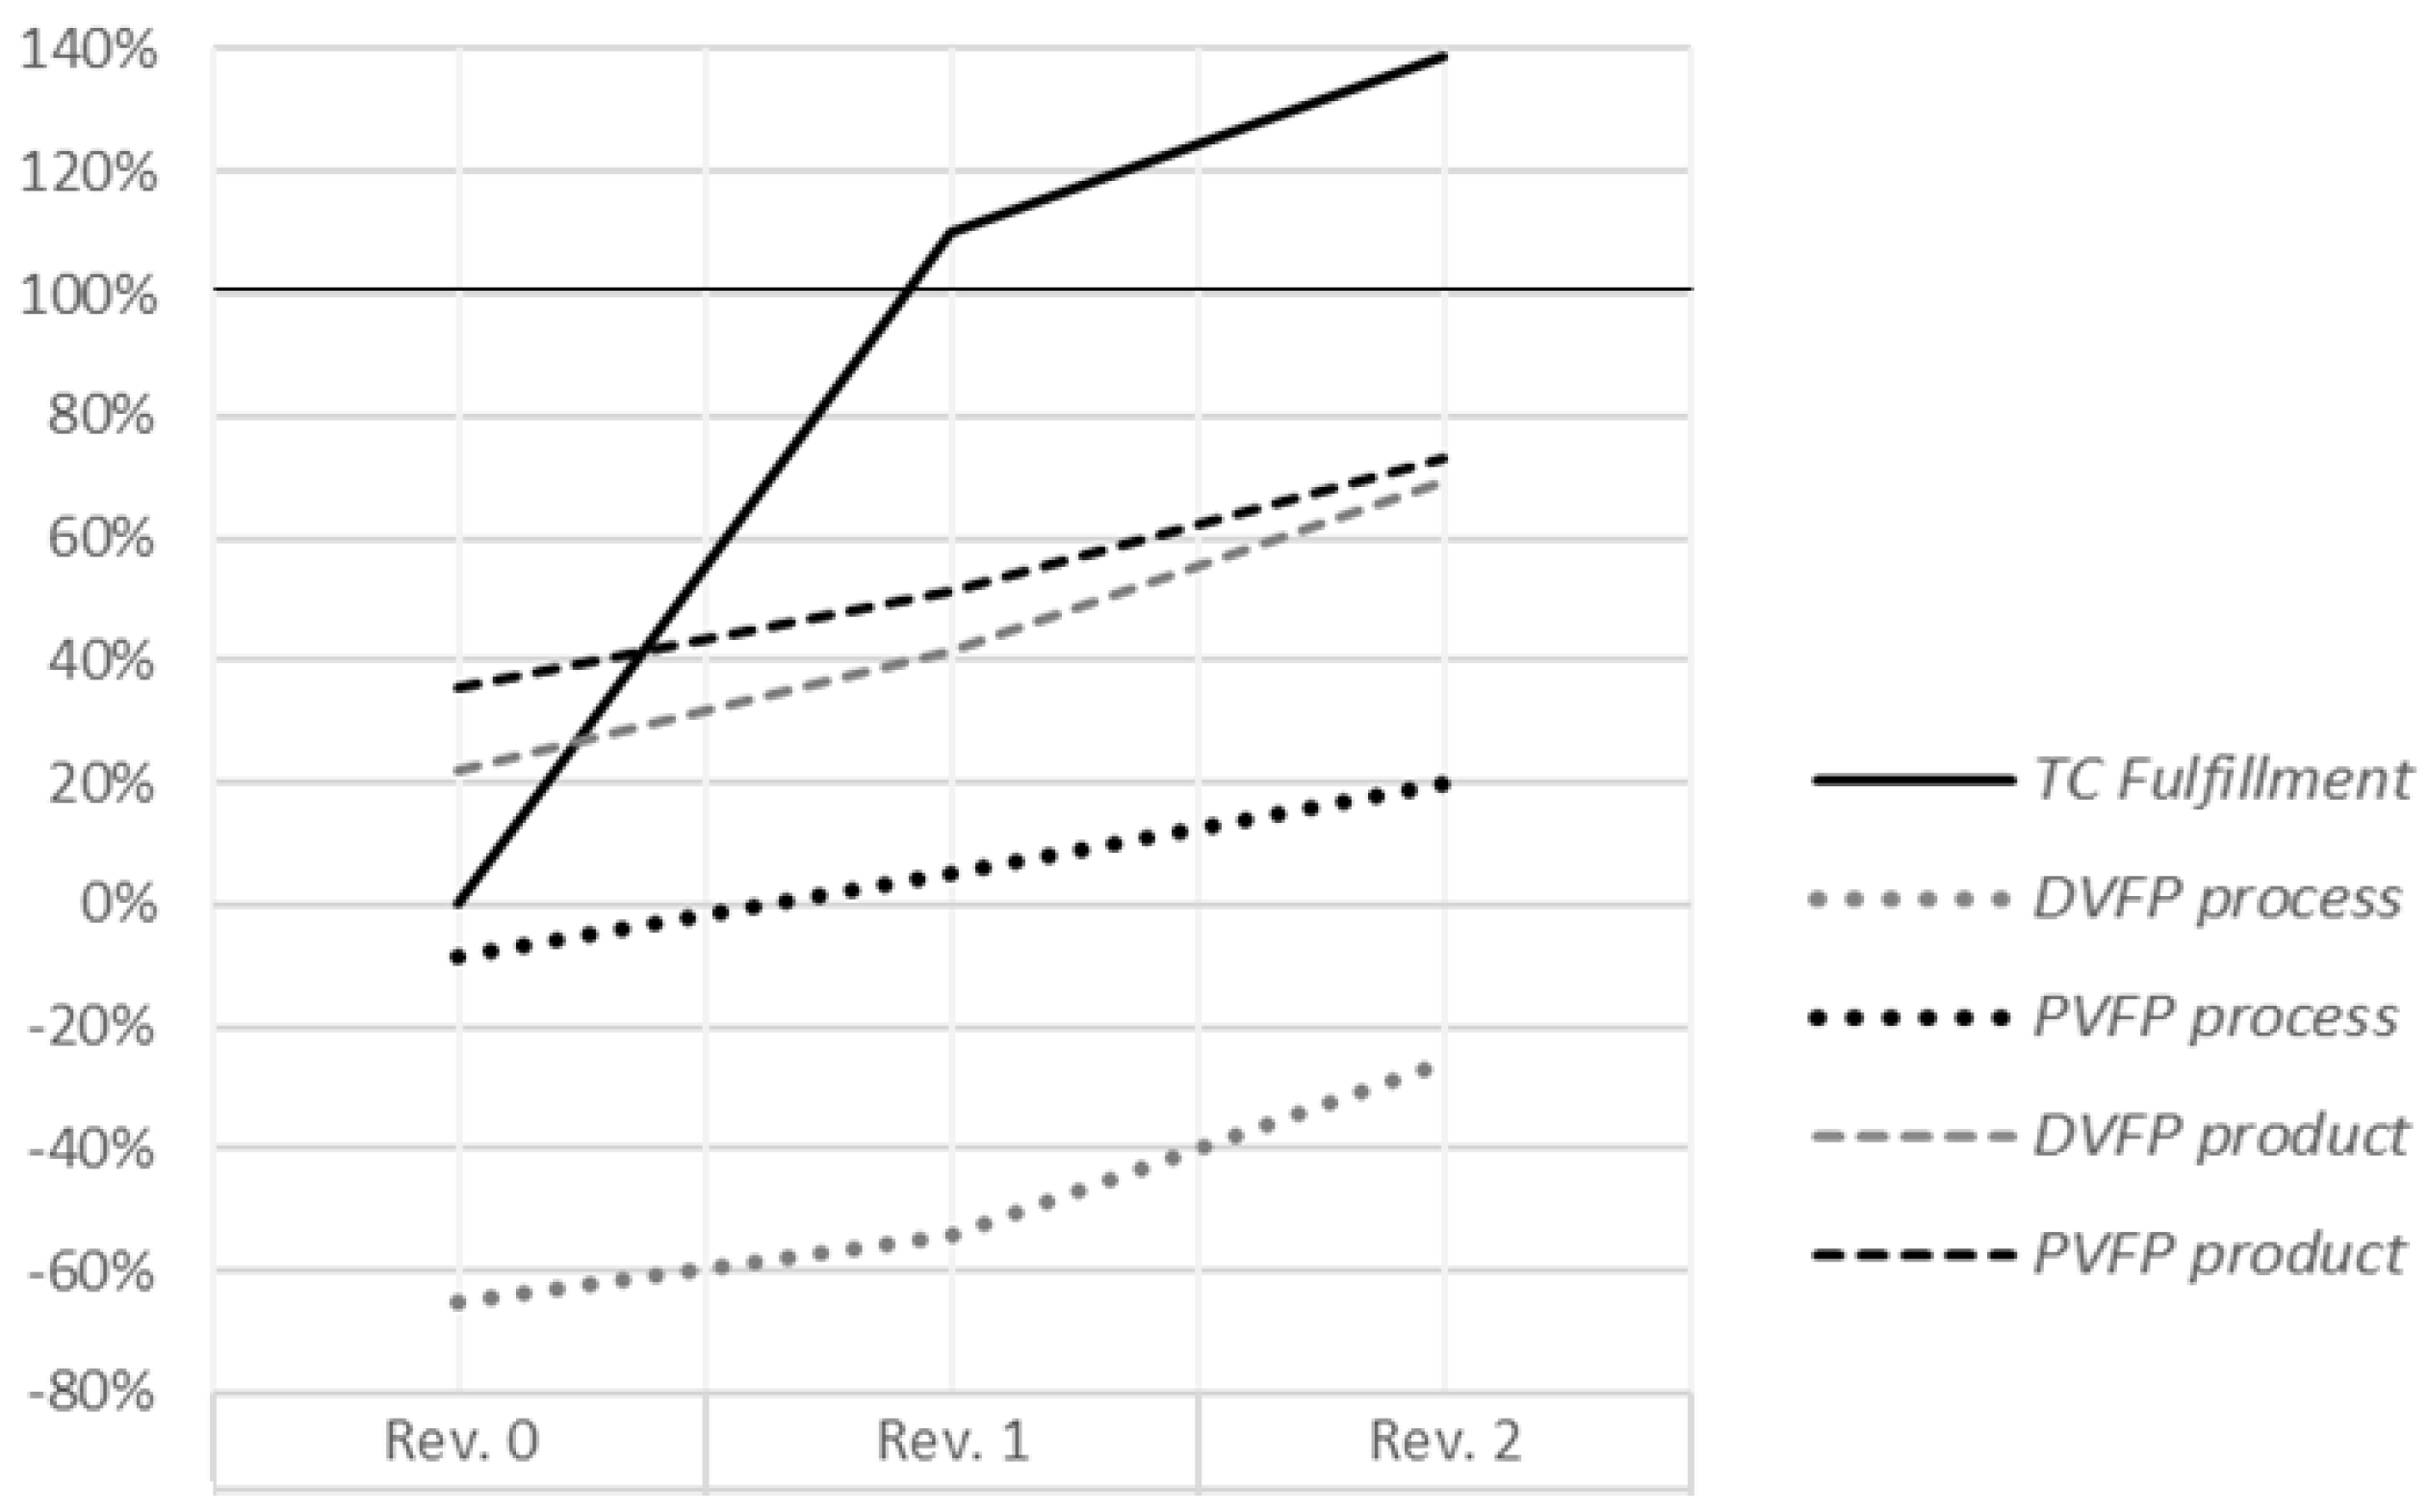
3.4.3. Comparison between Value and Cost Evolution

This subsection shows the differences between the evolution of value and costs in three reviews. Figure 6 presents the three revisions made in the value measurement related to the cost evolution. Rev. 0 of value coincides with the IC of the project, Rev. 1 coincides with the fifth cost estimate (see Figure 4), and Rev. 2 of value was performed approximately eight months after the end of the TVD implementation program and is assumed to be the same as the last cost measurement made on the project. The results show how TC is achieved and value increases as the project progresses. However, the fulfillment of the TC is higher than the value. In revisions 1 and 2, even though the TC was already met and exceeded, this is not the value case. Both the desired and potential values are not fully satisfied in either the process or the product. Nevertheless, the value does not decrease while the TC is achieved, but it is feasible that it could increase even if costs decrease. It is imperative to highlight that by using target costing, systematic actions were carried out to achieve the TC, but not the value, so this could be one reason why the DVI or PVI were not reached.

3.5. Phase 5: Learning

To collect the learning obtained in the TVD implementation program, the authors used the plus/delta tool, where the participants expressed positive and improvable aspects of the process. This tool was used in different intermediate sessions and at the end of the implementation. The main ‘participants’ opinions are the following:
The TVD was considered a useful methodology for collaborative development. The use of CBA and creating committees for collaborative work were very positive. Likewise, transparency in communication and information and the better management of costs are appreciated. The cost department made the costs associated with all project items visible to each committee in order to make the relevant estimates. This action significantly contributed to the continuous and rapid cost estimate.
Regarding the difficulties, it was considered that there was staff turnover since it was estimated that there were 4 to 5 additional hours of work in these ten months, so planning must be improved. In addition, the committee’s composition should be improved to optimize the participants’ time. On the other hand, the updating costs process should be adjusted since it was not carried out correctly, especially at the beginning.
According to the participants, the most difficult TVD practices to implement were designing for the client’s budget and target value, working in a Big Room, and collaborative planning. However, alternatives were proposed to counteract these difficulties, such as generating a data bank of m2/quality of finishes and utility installations, creating a new budget model with a classification of areas, resources and current capacities, and implementing and training BIM to improve early budgeting. The following proposals emerged regarding the Big Room: Big Virtual Room, use of Last Planner System® from the design stage to decrease latency times in requests and responses, and more efficient coordination meetings of specialties. Concerning collaborative planning, the authors propose the use of ICE (Integrated Concurrent Engineering) sessions [98] supported by BIM and not by departments or headquarters, with a common objective of company “S”, as well as establishing a moderator to manage times.
As a lesson learned regarding the unfulfillment of the desired and potential value of the project, it is believed that the committees did not consciously seek concrete actions to achieve the target value, as was the case for the target cost.

4. Discussion

This section discusses the accomplishment of the target value (desired and potential customer value) and the comparison between target value and target cost fulfillment.
According to the results, the project’s desired and potential value was not achieved. The percentage of value fulfillment was very low and, in some opportunities, negative. The committees did not consciously seek concrete actions to achieve the target value, as was the case for the cost. However, the value increased throughout the revisions made to the project. This increase may respond to the fact that the TVD methodology incorporates practices and tools that benefit the design process, which had not been explicitly measured until now. For example, the value increased in the product in different aspects such as energy efficiency, functionality, compliance with the regulations, and the community’s quality of life. On the other hand, in the design process, the value increased by incorporating technologies for specialty coordination, the response time to requests for information, and the sharing cost information among the professionals involved in the project.
The increase in value generation was higher for the product than for the process. This difference may be explained because the AEC industry normally focuses on the design of the product rather than the design process. In addition, it is expected that the value attributes of the product will be incorporated as the design process progresses and iterates better solutions. Meanwhile, the process’s satisfaction conditions are more difficult to modify than the product’s satisfaction conditions because there are ways of working in the company’s culture, such as information and communication management, time and cost, tools and technologies, and corporate environment, which are the attributes of constructability, integration, and deliverables. TVD recommends integrating the product and the process using product–process–cost models [4], referring to the fact that as the product is being designed, the way it will be executed or produced in the construction phase is also designed [99].
The results show the emphasis on cost over value within the company’s TVD implementation process, which was already described by some authors [8,9]. The company focused on reducing the gap between the initial cost and the TC through concrete actions required throughout the meetings and workshops. These actions were the result of reviews of budget items in order of the highest to lowest cost impact. Therefore, the proposals focused on cost reduction and, subsequently, on time, productivity, or value benefits.
However, even though the value was not the main reason for making decisions on whether to implement the actions, the professionals observed whether the proposed changes could impact the project’s value. For example, the replacement of elevators with higher capacity cabins resulted in a reduction in their number without affecting the traffic study. This study, by regulation, must meet the vertical mobility needs of users in a given time and space. Therefore, a monetary reduction was achieved, while maintaining the value for the client. This behavior coincides with what was stated by [13], who affirm that TVD projects seek to preserve the value requested by the client, controlling the scope or main objective of the project and pursuing some measurable conditions such as capabilities and metrics [9,15].
Documented TVD projects often highlight the cost or time savings achieved [2,15,16,17,18], and value benefits are not measured or are described in a limited way [8,15]. This situation is due to the lack (thus far) of accurate and rigorous value estimation methods [2,99] that focus on customer requirements [8]. This paper attempts to fill this knowledge gap by incorporating a literature review of actual TVD projects that have documented the costs, schedule, and value benefits.
The authors noted that costs are very explicitly documented. The literature shows total cost measurements, comparative costs with other non-TVD projects, cost per square foot, and project life cycle costs [15,48,53,76]. The benefits of time have been predominantly documented, mostly by comparing times with other projects without TVD or stating that the established time was met [2,18]. Regarding value, it was observed that, although there are measurements regarding specific aspects related to the project’s main objective or scopes, such as energy savings [66] or considerable space reduction [15], most of the benefits are implicitly shown. These aspects are related to functionality, durability, buildability [47], quality [9,76], privacy, flexibility, acoustics and lighting, aesthetics [18,29], sustainability [11], and design improvements and innovations [77].
Although meeting the TC in TVD projects does not decrease the value and is aimed at to maintain it, in this project, the desired and potential value was not achieved even though the TC was reached. When the TC was reached, the committees continued working to achieve more savings, but not with the value. The committees managed actions to reduce the cost, but no actions were proposed to achieve the target value. The project professionals visualized the cost through the design process, but they were very late to visualize that the value attributes were not being achieved or did not have good presence percentages in the project. The authors recommend searching for the optimization of the presence of the value attributes, starting with those of the highest level of importance according to the order M > O/R > A > I, to obtain a value maximization plan within the TVD.
The ideal approach is not to use value instead of cost, but to use and analyze value in addition to the cost. For example, in the literature, there is a decision-making method known as choosing by advantages (CBA), which differentiates between cost and the comparative advantages of the alternatives to be chosen [100,101] (analogy of separating cost and value). However, CBA uses both analyses for decision making in a straightforward conceptual framework. In the same way, both aspects could be analyzed in projects. Additionally, the framework of applying TVD developed by [4] suggests a question after evaluating the cost: Should value be added? Therefore, the aim is not to use one instead of the other, but to use both. In this paper, it is recommended that they are simultaneously used and not one before the other.
From these differences between cost and value, and value in process and value in product, the following questions may arise: Why is cost over value more easily achieved? Are cost and value set on a realistic basis? The TVD implementation within the company “S” resulted from observations from the literature and experiences in real projects in other countries, where a clear emphasis on achieving the cost was perceived. It is possible that, when trying to copy this scheme, less importance was given to the achievement of value.
On the other hand, why is product value more successful than process value? Are product value attributes more achievable than product value attributes? Process-related attributes reflect each company’s particular way of producing, its protocols, barriers, and obstacles to implementing changes and improvements. Additionally, the context, the city or country where it is located, and social, economic, cultural, and political aspects influence the projects’ processes and management. Some authors [96,102] suggest a change in the project’s organizational structure towards a more established model of collaboration and integration of the project team. However, communication, contextual, cultural and coordination barriers and obstacles must be overcome to achieve better performance, cost, innovation, and value results [7]. These improvements require gradual changes that cannot be achieved in the short term.

5. Conclusions

This paper explores the generation and losses of value within the design process of a TVD project through metrics, applying the recently developed VAM [20]. For this reason, first, the authors developed a way to implement TVD within a project chosen inside a company accustomed to use traditional design and construction models. This implementation responds to a literature review of real projects that have successfully used TVD. Second, two main measurements were established, the target cost metric and the target value metric. The target cost metric is the original measurement present in TVD projects; however, this research included a novel value metric through a recently developed value analysis model, which is an important theoretical and practical contribution of this study.
According to the results obtained, the target cost was achieved with the TVD implementation format addressed. Therefore, this would be the first successful experience of a documented TVD project in Chile, considering as main measurement the achievement of the target cost. However, regarding the target value, it was not reached.
Zooming in on the performed value analysis, even when the desired or potential value was not achieved in the process or the product, there is a tendency towards an increase in value as the project progresses. In comparison, the value generation is higher in the product than in the process. The value generated in the process is very low (in fact, negative); this means that the most important attributes (M and O) are not met, or opposite characteristics (R) are present that decrease the value, resulting in significant value losses. In addition, it can be seen that even though the desired or potential value is not reached, the target cost is not only achieved but exceeded.
The VAM measures how value has been generated in the process and in the design product by establishing indices that measure the different conditions of satisfaction proposed and required by multiple customers. Therefore, it is possible to provide explicit (quantifiable) information on the desired value, the maximum possible value (potential value), the value generated in the product and the process, and the value losses as the gap between what was expected and achieved. TVD benefits that were initially visualized in an assumed or implicit way (not measured, only reported) (see Table 2) can be transformed into explicit benefits (measured and traceable) through (1) the quantification of value expectations by calculating initial value indices (DVI and PVI), (2) the measurement of value generated (DVG and PVG) from customer perceptions, and (3) value losses resulting from the difference between the above indices. These measurements can allow the inclusion of value-related parameters in traditional project performance measures (time, cost, and productivity). VAM provides measurement with a common language for all value attributes. This last idea is important due to the high subjectivity present in the value attributes and the variety of measurements that can include different satisfaction conditions, such as quality, safety, comfort, among others.
It is also possible to visualize the evolution of the generated value of a project and the decrease (or increase) in value losses over time. This condition makes it possible to review whether the value is increasing or decreasing and whether this is due to incorporating actions, practices, or tools in the project’s development. Value losses (value not provided) are identifiable from the design phase, allowing measures to be taken to minimize them in order to maximize value as early as possible.
In addition, VAM measurements make it possible to compare cost and value, which has not been possible before. The model illustrates in very similar terms the target costing with the measurement and evolution of value, which makes their comparison feasible: the TC with the potential value; the AC with the desired value, which are the objectives to be achieved; and the percentage of fulfillment of target value or TC, respectively.
This research provides evidence of the current emphasis on cost versus value. This knowledge may contribute to focusing on value attributes and balancing the cost–value relationship within projects. This research also shows that cost minimization can be achieved without detriment to the value of TVD projects.
Similarly, a value analysis model (VAM) has a practical value for the project that can be transferred to future projects. VAM is useful for optimizing products and processes, as aspects for continuous process improvement are quickly identified on a stage-by-stage and project-by-project basis. VAM encourages constant feedback and can provide superior value delivery. It allows for the determination of parameters that add value for different stakeholders, thus informing designers where to direct resources and efforts to improve vital rather than trivial variables. In the practical implementation of VAM, the design team can consider the requirements of builders, owners, end-users, and other clients to maximize value. Having a tool to assess and measure value generation while designing and costing is advantageous for teams applying or trying to apply TVD efficiently.
Additionally, VAM is a helpful model that provides explicit information, which may be necessary for design–build projects involving many stakeholders or clients. VAM can help reach agreements to establish value in a project by showing the different perspectives of clients and directing them toward a similar prioritization path that seeks the best possible value.
On the other hand, VAM allows researchers to conduct systematic studies searching for the value generated by applying innovative design and construction methods, different project delivery models, or value reviews under specific project satisfaction conditions, such as sustainability and safety attributes. In summary, VAM could be considered a value estimation method that focuses on the capturing, flow, and traceability of customer requirements throughout the project, using metrics and indicators to measure different value conditions.
In summary, the main theoretical contributions of this study are: (1) the possibility of measuring value in TVD projects; (2) the visualization of the evolution of the value of a project, and the decrease (or increase) in value losses over time; (3) the possibility of being able to compare cost and value; and (4) showing explicit evidence for the emphasis on cost over value and product over process in TVD projects. On the other hand, the main practical contribution is providing a tool to assess and measure value generation, while designing and costing within TVD projects.
Simultaneously estimating the cost and value generated in a revision at a project milestone, and comparing them to cost and value targets, can show measurable and traceable cost gaps or value losses. This identification of cost and value gaps makes it possible for teams to develop proposed actions to reduce them. This last insight may prove advantageous for teams applying or attempting to apply the TVD methodology efficiently.

Limitations and Future Research

This paper was based on the experience of one housing project in the design stage. Therefore, the results should not be interpreted as universal to all types of building projects at all stages of their life cycle. The contributions presented in this document are also limited to this domain. On the other hand, it was not possible to incorporate the opinion of the end users into the study because the project was in the preliminary design phase.
It is essential to highlight that systematic actions have been taken to achieve the TC using target costing. The authors consider the use of an analogous methodology with value interesting, a “target valuing” that allows concrete actions to be incorporated to achieve the desired and potential value. In VAM, a gap is obtained between the expected value and the value generated, known as value loss. Knowing this gap and why it occurs, actions can be identified to minimize it, and thus achieve the target value and the allowable value (potential and desired value).
Future research and publications are expected to incorporate the end user and other possible stakeholders in the analysis of value attributes, both in the design process and in the construction process.

Author Contributions

Conceptualization, Z.G.; Formal analysis, Z.G.; Investigation, Z.G.; Methodology, Z.G., C.M., L.F.A. and H.M.; Supervision, C.M. and L.F.A.; Writing—original draft, Z.G.; Writing—review and editing, C.M., L.F.A. and H.M. All authors have read and agreed to the published version of the manuscript.

Funding

This research was funded by CONICYT grant number PCHA/National Doctorate/2016-21160571 for the postgraduate studies of Z.G., by FONDECYT (1210769). and by Programa de Inserción Académica (2017) of Pontificia Universidad Católica de Chile.

Institutional Review Board Statement

The study was conducted in accordance with the Declaration of Helsinki, and approved by the Ethics Committee of Pontificia Universidad Catolica de Chile (protocol code 180515004 and date of approval: 27 November 2018).

Informed Consent Statement

Informed consent was obtained from all subjects involved in the study.

Data Availability Statement

Data used in project analysis are available from the corresponding author by request.

Acknowledgments

The authors wish to thank the organization for participating in this study.

Conflicts of Interest

The authors declare no conflict of interest.

Appendix A

Table A1. Process conditions of satisfaction.
Conditions of Satisfaction (CoS)Process AttributesOWDEBUPR%Ideal%R0%R1%R2
Information flow/communications Low response time to information requestsOAMM100%63%69%88%
Low response time to requests for modificationsOOMM100%53%61%67%
Clarity in requests for information and solutionsMMMM100%66%67%83%
Clarity in the background and requirements of the clientsMMOM100%64%78%83%
Formality in the documentation of failures, problems and modificationsMOMM100%68%72%83%
Important information visible and available to all involved in the designMMOM100%64%89%75%
Times and costs Commitment to meeting deadlinesMMMM100%59%45%83%
Knowledge of budget availability by all those involved in the designMMMM100%43%75%75%
Incorporate cost changes simultaneously with design modificationsROMM100%44%58%50%
Tools and technology Use of BIM-VDC technology between design and constructionAAAA0–10046%78%78%
Using BIM for specialty coordinationAAAA0–10054%90%90%
Technological means with adequate capacity (software, hardware and netware)MMMM100%63%65%75%
To manage several parallel design optionsMIIM100%46%72%42%
Constructability Inclusion of standardization within the processOIMM100%63%60%67%
Inclusion of industrialization within the processOAMM100%75%90%75%
Inclusion of innovation within the processOAAO100%75%73%67%
Integration Multidisciplinary contribution to decision-makingMOIM100%81%83%75%
Early integration of construction professionalsMMAM100%72%86%67%
Objectives aligned toward full optimizationMOIM100%64%68%75%
Multidisciplinary planning and collaborative designMOOM100%75%73%75%
Long-term relationship with suppliersMIIM100%79%67%75%
Shared risks and rewardsMMMM100%46%53%75%
Corporative environment Good communication and good working environmentMMOM100%84%63%92%
Low staff turnoverAIIA0–10064%78%67%
Deliverables Generate ready-to-build deliverables (buildable drawings)MMMM100%72%42%67%
Generate clear deliverables, no modifications in executionOAAO100%54%58%67%
Use of standard format for orderly informationAIAA0–10067%67%67%
Generate metric and quantity informationOMIM100%47%40%67%
Project with all necessary specifications and informationMMMM100%54%55%67%
Deliverable without inconsistencies between specialtiesMMMM100%64%63%67%
OW: owner; DE: designer; BU: builder; PR: priority.

Appendix B

Table A2. Product conditions of satisfaction.
Conditions of Satisfaction (CoS)Product AttributesOWDEBUPR%Ideal%R0%R1%R2
Home comfortFunctionalOOMM100%38%63%92%
Finance and investmentGood LocationOAAO100%63%63%92%
Low cost variabilityOIIO100%59%69%83%
Good cost/quality ratioOOOO100%57%88%83%
Good cost/square metersOIMM100%66%75%92%
Sellable/competitive designOOAO100%69%84%83%
Profitable productOAIO100%69%75%75%
To maintain its value over timeOOIO100%59%88%67%
PerformanceCompliant with regulationsOMOM100%53%72%100%
Meets the customer’s requirementsOAIO100%69%72%92%
Product stable during earthquakes and other eventsOMOM100%69%69%83%
Easy to buildOIOO100%84%81%92%
High percentage of repetitive elementsAOOO100%81%72%83%
Durable materialsOAMM100%84%84%83%
Materials available on the marketOAIO100%66%78%83%
Easy-to-install materialsOIAO100%91%75%75%
No reclaimsOOMM100%75%56%100%
ImageAestheticOMIM100%63%94%88%
Differentiating imageAAIA0–10053%75%75%
Innovation and technologyInnovativeAMOM100%81%66%75%
Presenting cutting-edge technologyAAIA0–10053%63%75%
Health and sustainabilityTo improve the quality of life of the communityOAMM100%46%75%92%
To improve the customer’s quality of lifeOAOO100%59%59%83%
Sustainable/energy efficientAMIM100%46%72%92%
OW: owner; DE: designer; BU: builder; PR: priority.

Appendix C

Table A3. TVD practices and tools learned and applied in the training-action plan (based on Table 1).
Training PlanAction PlanPracticesTools
TVD introduction workshopReview of difficulties in incorporating them into the company
Senior management meeting to determine target cost and allowable cost
Project cost visibility
Efforts to achieve the target cost
Committee creation and work (cluster work)
Difficult to implement Big Room in the company
All committee meetings (big group = Big Room meeting)
Auditing meetings
Challenging to incorporate set-based design
The target cost and the budget are broken down and tracked within clusters
Visibility of project objectives
Establishment of value attributes by clients
Establishment of satisfaction conditions
1–9. TVD Nine Foundational Practices
1. Engage deeply with the client to establish the target value.
7. Work in small and diverse groups
8. Work in a Big Room
9. Conduct retrospectives throughout the process
10. Cross-functional teams
15. Sub targets cost by teams
19. Projects are single-purpose networks of commitments
22. All team members understand the business case and stakeholder values
23. Set targets for values and conditions of satisfaction
33. Promote transparent communication
1. Target costing
6. Formal retrospectives
7. Plus and delta activity
8. Big group meetings and Short codesign sessions
13. Pareto analysis by committee
18. Set-based design
19. TVD update charts
Constructability workshopInclusion of industrialization, standardization, prefabrication
Design solutions are developed with cost, schedule, and constructability as design criteria
Constructability improvement proposals
Committee meetings
Workshop attendance
5. Concurrently design the product and the process in design sets
12. Balance designer and constructor (team members) interests
13. Early integration of designers and builders
17. Intentionally build relationships on projects
18. Optimize the whole project
21. Design solutions are developed with constructability as design criteria
3. Functional analysis/Value engineering
20. Standardization
CBA workshopCommittee meetings
Collaborative process
16. Best value instead of lowest first cost17. CBA decision-making
Innovation workshop and A3 thinking workshopPlus/delta activity
Design thinking + kaizen event
Lessons learned review
2. Lead the design effort for learning and innovation.
27.Continuity of staff to retain the knowledge
28. Capture of lessons learned,
29. Lean set of tools to eliminate process waste
35. Encourages the discussion of problems and solutions
36. Prioritizes continuous but durable improvements over time instead of more radical improvements
10. PDCA;
12. 5-Why™;
16. A3 report;
21. One-page improvement reports
25. Visual management tools
27. Prototyping
31. Design thinking
32. Kaizen event
IPD workshopBalance owners, users, designers and builders’ interests
Review of value attributes by customer
Aligning team member interests
Collaborative actions to achieve target cost
Continuous estimating
To expand the use of BIM
Committee meetings
Align project ends, means, and constraints.
Achievement search of subtarget cost aiming at the target cost fulfilment
Design solutions are developed with cost, schedule, and constructability as design criteria
The company uses Last planner system ® in building stages
Industry–academy alliance for research in linguistic action
3. Design to a detailed estimate.
4. Collaboratively plan and replan the project.
6. Design and detail in the sequence of the customer who will use it
11. Long term relationships with suppliers.
14. Early incorporation of main suppliers and contractors
17. Intentionally build relationships on projects
18. Optimize the whole project
Projects are single-purpose networks of commitments
4. Last Planner System®
8. Big group meetings and Short codesign sessions
19. TVD update charts
BIM workshopCollaborative actions to achieve target cost
Continuous estimating
To expand the use of BIM
Committee meetings
3. Design to a detailed estimate
4. Collaboratively plan and replan the project
2. nD model (3D, 4D…)
15. Building Information Model (BIM),
19. TVD update charts

References

  1. P2SL Project Production Systems Laboratory. Available online: http://p2sl.berkeley.edu/research/initiatives/target-value-design/ (accessed on 23 February 2022).
  2. Ballard, G. Target Value Design. In Proceedings of the International Design Conference, Dubrovnik, Croatia, 21–24 May 2012; pp. 11–22. [Google Scholar]
  3. Rybkowski, Z. The Application of Root Cause Analysis and Target Value Design to Evidence-Based Design in the Capital Planning of Healthcare Facilities. Ph.D. Thesis, University of California, Berkeley, CA, USA, 2009. [Google Scholar]
  4. Ballard, G. Target Value Design: Current Benchmark (1.0). Lean Constr. J. 2011, 79–84, ISSN 1555-1369. Available online: http://p2sl.berkeley.edu/wp-content/uploads/2016/03/Ballard-2011-Target-Value-Design-Current-Benchmark-1.0-LCJ_11_009.pdf (accessed on 6 May 2022).
  5. Nanda, U.; Rybkowski, Z.K.; Pati, S.; Nejati, A. A Value Analysis of Lean Processes in Target Value Design and Integrated Project Delivery: Stakeholder Perception. Health Environ. Res. Des. J. 2017, 10, 99–115. [Google Scholar] [CrossRef] [PubMed]
  6. Alvarez, M.-A.; Pellicer, E.; Soler-Severino, M. Target Value Design: A Different Way of Approaching the Constructive Process in Spain. J. Mod. Proj. Manag. 2018, 5, 1–17. [Google Scholar]
  7. Paik, J.; Miller, V.; Mollaoglu, S.; Aaron Sun, W. Interorganizational Projects: Reexamining Innovation Implementation via IPD Cases. J. Manag. Eng. 2017, 33, 04017017. [Google Scholar] [CrossRef]
  8. Miron, L.; Kaushik, A.; Koskela, L. Target Value Design: The Challenge of Value Generation. In Proceedings of the 23rd Annual Conference of the International Group for Lean Construction, Perth, Australia, 15 October 2015; pp. 815–825. [Google Scholar]
  9. Pennanen, A.; Ballard, G.; Haahtela, Y. Designing to Targets in a Target Costing Process. In Proceedings of the 18th Annual Conference of the International Group for Lean Construction, San Diego, CA, USA, 18–20 July 2012; Technion: Haifa, Israel, 2010; pp. 161–170. [Google Scholar]
  10. Fruchter, R.; Grey, F.; Badasyan, N.; Russell-Smith, S.; Castillo, F. Integrated Target Value Approach Engaging Project Teams in an Iterative Process of Exploration and Decision Making to Provide Clients with the Highest Value. In Proceedings of the 2015 International Workshop on Computing in Civil Engineering, Austin, TX, USA, 21–23 June 2015; pp. 313–321. [Google Scholar] [CrossRef]
  11. Silveira, S.S.; Da C. L. Alves, T. Target Value Design Inspired Practices to Deliver Sustainable Buildings. Buildings 2018, 8, 116. [Google Scholar] [CrossRef] [Green Version]
  12. Pöyhönen, P.; Sivunen, M.; Kajander, J.K. Developing a Project Delivery System for Construction Project—A Case Study. Procedia Eng. 2017, 196, 520–526. [Google Scholar] [CrossRef]
  13. Lee, H.W.; Ballard, G.; Tommelein, I.D. Developing a Target Value Design Protocol for Commercial Energy Retrofits—Part 1. In Proceedings of the Construction Research Congress, West Lafayette, IN, USA, 21–23 May 2012; pp. 1710–1719. [Google Scholar]
  14. Russell-Smith, S.V.; Lepech, M.D. Cradle-to-Gate Sustainable Target Value Design: Integrating Life Cycle Assessment and Construction Management for Buildings. J. Clean. Prod. 2015, 100, 107–115. [Google Scholar] [CrossRef]
  15. Zimina, D.; Ballard, G.; Pasquire, C. Target Value Design: Using Collaboration and a Lean Approach to Reduce Construction Cost. Constr. Manag. Econ. 2012, 30, 383–398. [Google Scholar] [CrossRef]
  16. Elghaish, F.; Abrishami, S.; Hosseini, M.R.; Abu-Samra, S. Revolutionising Cost Structure for Integrated Project Delivery: A BIM-Based Solution. Eng. Constr. Archit. Manag. 2020. [CrossRef]
  17. De Melo, R.S.S.; Do, D.; Tillmann, P.; Ballard, G.; Granja, A.D. Target Value Design in the Public Sector: Evidence from a Hospital Project in San Francisco, CA. Archit. Eng. Des. Manag. 2016, 12, 125–137. [Google Scholar] [CrossRef]
  18. Nanda, U.; Sipra, P.; Rybkowski, Z.; Ai, D.; Kalyanaraman, N.; Nejati, A. The Value Analysis of Lean Processes in Target Value Design and Integrated Project Delivery; Technical Report. CADRE/Texas A&M University: Aggieland, TX, USA, 2014; Available online: https://foundationhealthenvironmentsresearch.org/wp-content/uploads/2020/01/2013_Report_NandaPati.pdf (accessed on 6 May 2022).
  19. Zhang, L.; El-Gohary, N.M. Human-Centered Value Analysis: Building-Value Aggregation Based on Human Values and Building-System Integration. J. Constr. Eng. Manag. 2017, 143, 04017040. [Google Scholar] [CrossRef]
  20. Giménez, Z.; Mourgues, C.; Alarcón, L.; Mesa, H.; Pellicer, E. Value Analysis Model to Support the Building Design Process. Sustainability 2020, 12, 4224. [Google Scholar] [CrossRef]
  21. Kelly, J.; Male, S.; Graham, D. Value Management of Construction Projects, 2nd ed.; Blackwell Science, Inc.: Malden, MA, USA, 2014; ISBN 9781119007258. [Google Scholar]
  22. Novak, V. Managing Sustainability Value in Design: A Systems Approach in Environmental Design and Planning. Ph.D. Thesis, Faculty of the Virginia Polytechnic Institute and State University, Blacksburg, VI, USA, 2012. [Google Scholar]
  23. Bahadorestani, A.; Karlsen, J.T.; Farimani, N.M. Novel Approach to Satisfying Stakeholders in Megaprojects: Balancing Mutual Values. J. Manag. Eng. 2020, 36, 04019047. [Google Scholar] [CrossRef]
  24. Saxon, R. Be Valuable. In Report of Value Task Group; Constructing Excellence: London, UK, 2005. [Google Scholar]
  25. Salvatierra, J.; Pasquire, C.; Miron, L. Exploring Value Concept through the IGLC Community: Nineteen Years of Experience. In Proceedings of the 20th Annual Conference of the International Group for Lean Construction, San Diego, CA, USA, 18–20 July 2012. [Google Scholar]
  26. Womack, J.; Jones, D. Lean Thinking; Simon and Schuster: New York, NY, USA, 2012; ISBN 978-84-9875-199-4. Available online: www.planetadelibros.com (accessed on 1 May 2022).
  27. Macomber, H.; Howell, G.; Barberio, J. Target-Value Design: Nine Foundational Practices for Delivering Surprising Client Value; Lean Project Consulting, Inc.: Minneapolis, MN, USA, 2007; Available online: https://leanconstruction.org/uploads/wp/media/learning_laboratory/Target_Value_Design/Target%20Value%20Design%20%5bLPC%5d.pdf. (accessed on 1 May 2022).
  28. Bølviken, T.; Rooke, J.; Koskela, L. The Wastes of Production in Construction—A TFV Based Taxonomy. In Proceedings of the 22nd Annual Conference of the International Group for Lean Construction, Oslo, Norway, 25–27 June 2014; pp. 811–822. [Google Scholar]
  29. Rybkowski, Z.; Shepley, M.; Ballard, G. Target Value Design: Applications to Newborn Intensive Care Units. Health Environ. Res. Des. J. 2012, 5, 5–23. [Google Scholar] [CrossRef] [PubMed]
  30. Eskerod, P.; Ang, K. Stakeholder Value Constructs in Megaprojects: A Long-Term Assessment Case Study. Proj. Manag. J. 2017, 48, 60–75. [Google Scholar] [CrossRef]
  31. Borgianni, Y. Verifying Dynamic Kano’s Model to Support New Product/Service Development. J. Ind. Eng. Manag. 2018, 11, 569–587. [Google Scholar] [CrossRef]
  32. Chong, Y.T.; Chen, C. Customer Needs as Moving Targets of Product Development: A Review. Int. J. Adv. Manuf. Technol. 2010, 48, 395–406. [Google Scholar] [CrossRef]
  33. Bolar, A.; Tesfamariam, S.; Sadiq, R. Framework for Prioritizing Infrastructure User Expectations Using Quality Function Deployment (QFD). Int. J. Sustain. Built Environ. 2017, 6, 16–29. [Google Scholar] [CrossRef]
  34. Drevland, F.; Lohne, J.; Klakegg, O.J. Defining an Ill-Defined Concept-Nine Tenets on the Nature of Value. Lean Constr. J. 2018, 31–46. Available online: www.leanconstructionjournal.org (accessed on 1 June 2022).
  35. Zhang, Y.; Tzortzopoulos, P.; Kagioglou, M. Evidence-Based Design in Healthcare: A Lean Perspective with an Emphasis on Value Generation. In Proceedings of the 24th Annual Conference of the International Group for Lean Construction, Boston, MA, USA, 20–22 July 2016; pp. 53–62. [Google Scholar]
  36. AFNOR. French Standard NF EN 12973; Association Francaise de Normalisation: Paris, France, 2000; ISBN 2008012425. [Google Scholar]
  37. Rischmoller, L.; Alarcón, L.; Koskela, L. Improving Value Generation in the Design Process of Industrial Projects Using CAVT. J. Manag. Eng. 2006. [CrossRef]
  38. Tauriainen, M.; Marttinen, P.; Dave, B.; Koskela, L. The Effects of BIM and Lean Construction on Design Management Practices. Procedia Eng. 2016, 164, 567–574. [Google Scholar] [CrossRef]
  39. Gunby, M.; Damnjanovic, I.; Anderson, S.; Joyce, J.; Nuccio, J. Identifying, Communicating, and Responding to Project Value Interests. J. Manag. Eng. 2013, 29, 50–59. [Google Scholar] [CrossRef]
  40. Haddadi, A.; Johansen, A.; Andersen, B. A Conceptual Framework to Enhance Value Creation in Construction Projects. Procedia Comput. Sci. 2016, 100, 565–573. [Google Scholar] [CrossRef] [Green Version]
  41. Volkova, T.; Jākobsone, I. Design Thinking as a Business Tool to Ensure Continuous Value Generation. Intellect. Econ. 2016. [CrossRef] [Green Version]
  42. Kowaltowski, D.; Granja, A. The Concept of Desired Value as a Stimulus for Change in Social Housing in Brazil. Habitat Int. 2011, 35, 435–446. [Google Scholar] [CrossRef]
  43. Huang, J. Application of Kano Model in Requirements Analysis of Y Company’s Consulting Project. Am. J. Ind. Bus. Manag. 2017, 7, 910–918. [Google Scholar] [CrossRef] [Green Version]
  44. Díaz, H. Optimización Multidisciplinaria de Diseño Mediante El Uso de Herramientas PIDO y BIM Como Soporte a La Metodología Target Value Design En Proyectos de Vivienda. Ph.D. Thesis, Pontificia Universidad Catolica de Chile, Santiago, Chile, 2017. [Google Scholar]
  45. Lin, G.; Shen, Q. Measuring the Performance of Value Management Studies in Construction: Critical Review. J. Manag. Eng. 2007, 23, 2–9. [Google Scholar] [CrossRef]
  46. Koskela, L. An Exploration towards a Production Theory and Its Application to Construction. Ph.D. Thesis, Helsinki University of Technology, Espoo, Finland, 2000. [Google Scholar]
  47. Nicolini, D.; Tomkins, C.; Holti, R.; Oldman, A.; Smalley, M. Can Target Costing and Whole Life Costing Be Applied in the Construction Industry?: Evidence from Two Case Studies. Br. J. Manag. 2000, 11, 303–324. [Google Scholar] [CrossRef]
  48. Ballard, G.; Reiser, P. The St. Olaf College Fieldhouse Project: A Case Study in Designing to Target Cost. In Proceedings of the 12th Annual Conference of the International Group for Lean Construction, Helsingør, Denmark, 3–5 August 2004; pp. 1–9. [Google Scholar]
  49. Tommelein, I.; Ballard, G. Target Value Design. Introduction, Framework and Current Benchmark; UC Berkeley: Arlington, TX, USA, 2016; Volume 1.7, ISBN 978-0-692-68625-6. [Google Scholar]
  50. Palaneeswaran, E.; Kumaraswamy, M.; Xue Qing, Z. Focusing on Best Value from a Source Selection Perspective. Aust. J. Constr. Econ. Build. 2004, 4, 21–34. [Google Scholar]
  51. Wang, B. The Future of Manufacturing: A New Perspective. Engineering 2018, 4, 722–728. [Google Scholar] [CrossRef]
  52. Ballard, G. Rethinking Project Definition in Terms of Target Costing. In Proceedings of the 14th Annual Conference of the International Group for Lean Construction, Santiago, Chile, 25–27 July 2006; pp. 77–89. [Google Scholar]
  53. Ballard, G.; Rybkowski, Z. Overcoming the Hurdle of First Cost: Action Research in Target Costing. In Proceedings of the Construction Research Congress, Seattle, WA, USA, 5–7 April 2009; pp. 1038–1047. [Google Scholar]
  54. Love, P.E.D.; Ika, L.A. Making Sense of Hospital Project (Mis)Performance: Over Budget, Late, Time and Time Again—Why? And What Can Be Done about It? Engineering 2022, 12, 184–202. [Google Scholar] [CrossRef]
  55. Ballard, G. Target Value Delivery. In Lean Construction Core Concepts and New Frontiers; Tzortzopoulos, P., Kagioglou, M., Koskela, L., Eds.; Routledge: London, UK, 2020; pp. 149–161. [Google Scholar]
  56. AIA. Integrated Project Delivery: A Guide. Report. Version 1. The American Institute of Architects; California Council National: CA, USA, 2007; Available online: https://info.aia.org/siteobjects/files/ipd_guide_2007.pdf (accessed on 1 June 2022).
  57. Czmoch, I.; Pękala, A. Traditional Design versus BIM Based Design. Procedia Eng. 2014, 91, 210–215. [Google Scholar] [CrossRef]
  58. Jacomit, A.; Granja, A.; Picchi, F. Target Costing Research Analysis: Reflections for Construction Industry Implementation. In Proceedings of the 16th Annual Conference of the International Group for Lean Construction, Manchester, UK, 16–18 July 2008; pp. 601–612. [Google Scholar]
  59. Alwisy, A.; Bouferguene, A.; Al-Hussein, M. Framework for Target Cost Modelling in Construction Projects. Int. J. Constr. Manag. 2020, 20, 89–104. [Google Scholar] [CrossRef]
  60. Alves, T.D.C.; Lichtig, W.; Rybkowski, Z.K. Implementing Target Value Design: Tools and Techniques to Manage the Process. Health Environ. Res. Des. J. 2017, 10, 18–29. [Google Scholar] [CrossRef] [PubMed]
  61. Zhang, B.; Dong, N.; Rischmoller, L. Design Thinking in Action: A DPR Case Study to Develop a Sustainable Digital Solution for Labor Resource Management. In Proceedings of the 28th Annual Conference of the International Group for Lean Construction, Berkeley, CA, USA, 6–12 July 2020; pp. 25–36. [Google Scholar]
  62. Herrera, R.F.; Mourgues, C.; Alarcón, L.F.; Pellicer, E. Analyzing the Association between Lean Design Management Practices and BIM Uses in the Design of Construction Projects. J. Constr. Eng. Manag. 2021, 147, 04021010. [Google Scholar] [CrossRef]
  63. O’Connor, R.; Swain, B. Implementing Lean in Construction: Lean Tools and Techniques—An Introduction; Construction Industry Research and Information Association (CIRIA): London, UK, 2013. [Google Scholar]
  64. Bloom, N.; van Reenen, J. Measuring and Explaining Management Practices Acroos Firms and Countries. Q. J. Econ. 2007, 122, 1351–1408. [Google Scholar] [CrossRef]
  65. Macomber, H. Putting the Five Big Ideas to Work; Lean Project Consulting, Inc.: Minneapolis, MN, USA, 2010; Available online: https://www.cca-acc.com/wp-content/uploads/2021/08/Five-Big-Ideas.pdf (accessed on 1 June 2022).
  66. Lee, H. Application of Target Value Design to Energy Efficiency Investments. Ph.D. Thesis, University of California, Berkeley, CA, USA, 2012. [Google Scholar]
  67. Oliveros, B.; Granja, A.; Dionisio, S. An Initial Evaluation of a Method for Adopting Kaizen Events in the Construction. Rev. Ing. Construcción RIC 2018, 33, 173–182. [Google Scholar]
  68. Talebnia, G.; Baghiyan, F.; Baghiyan, Z.; Moussavi, F.; Abadi, N. Target Costing, the Linkages Between Target Costing and Value Engineering and Expected Profit and Kaizen. Int. J. Eng. Manag. 2017, 1, 11–15. [Google Scholar] [CrossRef]
  69. Jørgensen, B. Designing to Target Cost: One Approach to Design/Construction Integration. In Architectural Management: Designing Value; DTU/CIB; Anker Engelunds Vej 1 Building 101A 2800 Kgs: Lyngby, Denmark, 2005; pp. 311–319. ISBN 897877190-0. [Google Scholar]
  70. Marius, L.; Paulos, A.W.; Ola, L. Early Contractor Involvement in the Valdres Project Delivery Model. Procedia Comput. Sci. 2022, 196, 1028–1035. [Google Scholar] [CrossRef]
  71. Oliva, C.A.; Granja, A.D.; Bridi, M.E.; Soliman-Junior, J.; Ayo-Adejuyigbe, M.; Tzortzopoulos, P. Strengthening Target Value Design Benefits in the Real Estate Market through Living Labs. In Proceedings of the 29th Annual Conference of the International Group for Lean Construction, Lima, Peru, 14–17 July 2021; pp. 634–643. Available online: https://www.researchgate.net/profile/Ariovaldo-Granja/publication/353496813_Strengthening_Target_Value_Design_TVD_benefits_in_real_estate_market_through_living_labs/links/61009ad21e95fe241a918c80/Strengthening-Target-Value-Design-TVD-benefits-in-real-estate-market-through-living-labs.pdf (accessed on 1 June 2022).
  72. Engebø, A.; Torp, O.; Lædre, O. Development of Target Cost for a high-performance building. In Proceedings of the 29th Annual Conference of the International Group for Lean Construction, Lima, Peru, 14–17 July 2021; pp. 3–12. Available online: https://iglc.net/Papers/Details/1856 (accessed on 1 June 2022). [CrossRef]
  73. Gutiérrez Lazarte, F.M. Influence of Integrated Teams and Co-Location to Achieve the Target Cost in Building Projects. In Proceedings of the IGLC 28—28th Annual Conference of the International Group for Lean Construction 2020, Berkeley, CA, USA, 6–10 July 2020; The International Group for Lean Construction: Edmonton, Canada, 2020; pp. 709–720. [Google Scholar] [CrossRef]
  74. Musa, M.; Pasquire, C. Target Value Delivery in Bid Process. In Proceedings of the IGLC 28—28th Annual Conference of the International Group for Lean Construction 2020, Berkeley, CA, USA, 6–10 July 2020; The International Group for Lean Construction: Edmonton, Canada, 2020; pp. 697–708. [Google Scholar] [CrossRef]
  75. Meijon Morêda Neto, H.; Bastos Costa, D.; Coelho Ravazzano, T. Recommendations for Target Value Design Implementation for Real Estate Development in Brazil. Archit. Eng. Des. Manag. 2019, 15, 48–65. [Google Scholar] [CrossRef]
  76. Denerolle, S. The Application of Target Value Design to the Design Phase of 3 Hospital Projects; Technical Report; DPR Construction/University of California: Berkeley, CA, USA, 2013; Available online: http://p2sl.berkeley.edu/wp-content/uploads/2016/03/Denerolle-2011-Application-of-TVD-to-the-Design-Phase-of-3-Hospital-Projects.pdf (accessed on 1 June 2022).
  77. Laurent, J.; Leicht, R.M. Practices for Designing Cross-Functional Teams for Integrated Project Delivery. J. Constr. Eng. Manag. 2019, 145, 1–11. [Google Scholar] [CrossRef]
  78. Brioso, X. Integrating ISO 21500 Guidance on Project Management, Lean Construction and PMBOK. Procedia Eng. 2015, 123, 76–84. [Google Scholar] [CrossRef]
  79. Lichtig, W. Sutter Health Integrated Agreement for Lean Project Delivery between Owner, Architect & CM/GC. 2008. Available online: https://leanconstruction.org/uploads/wp/media/docs/lcj/V2_N1/LCJ_05_008.pdf (accessed on 1 June 2022).
  80. Alwisy, A.; Bouferguene, A.; Al-Hussein, M. Factor-Based Target Cost Modelling for Construction Projects. Can. J. Civ. Eng. 2018, 45, 393–406. [Google Scholar] [CrossRef]
  81. Robert, G.; Granja, A. Target and Kaizen Costing Implementation in Construction. In Proceedings of the 14th Annual Conference of the International Group for Lean Construction, Santiago, Chile, 3–7 July 2006; pp. 91–105. [Google Scholar]
  82. Forbes, L.H.; Ahmed, S.M. Modern Construction: Lean Project Delivery and Integrated Practices; CRC Press: Boca Raton, FL, USA, 2011; ISBN 978-1-4200-6312-7. [Google Scholar]
  83. Do, D.; Chen, C.; Ballard, G.; Tommelein, I.D. Target Value Design as a Method for Controlling Project Cost Overruns. In Proceedings of the 22th Conference of the International Group for Lean Construction (IGLC 2014), Oslo, Norway, 25–27 June 2014; Volume 1, pp. 171–181. [Google Scholar]
  84. Kano, N.; Seraku, N.; Takahashi, F.; Tsuji, S. Attractive Quality Vs. Must Be Quality. J. Jpn. Soc. Qual. Control 1984, 41, 39–48. [Google Scholar]
  85. Lewin, K. Action Research and Minority Problems. J. Soc. Issues 1946, 2, 34–46. [Google Scholar] [CrossRef]
  86. Lines, B.C.; Perrenoud, A.J.; Sullivan, K.T.; Kashiwag, D.T.; Pesek, A. Implementing Project Delivery Process Improvements: Identification of Resistance Types and Frequencies. J. Manag. Eng. 2017, 33, 04016031. [Google Scholar] [CrossRef]
  87. Jørgensen, F.; Boer, H.; Gertsen, F. Jump-Starting Continuous Improvement through Self-Assessment. Int. J. Oper. Prod. Manag. 2003, 23, 1260–1278. [Google Scholar] [CrossRef]
  88. Powell, W. Organizational Change Models. Futurics 2002, 26, 20–45. [Google Scholar]
  89. Azhar, S.; Ahmad, I.; Sein, M.K. Action Research as a Proactive Research Method for Construction Engineering and Management. J. Constr. Eng. Manag. 2010, 136, 87–98. [Google Scholar] [CrossRef]
  90. Mckay, J.; Marshall, P. The Dual Imperatives of Action Research. Inf. Technol. People 2001, 14, 46–59. [Google Scholar] [CrossRef] [Green Version]
  91. Kuru, M.; Erdem, O.; Calis, G. Sale Price Classification Models for Real Estate Appraisal. J. Constr. 2021, 20, 440–451. [Google Scholar] [CrossRef]
  92. De Melo, R.S.S.; Granja, A.D. Guidelines for Target Costing Adoption in the Development of Products for the Residential Real Estate Market. Ambiente Construído 2017, 17, 153–165. [Google Scholar] [CrossRef] [Green Version]
  93. Bustos, O. Factores Latentes En La Desviación de Presupuestos En Proyectos de Arquitectura. Un Análisis Empírico. Doctor Thesis, Universitat Politècnica de València, Valencia, Spain, 2015. [Google Scholar]
  94. Ballard, G.; Dilsworth, B.; Do, D.; Low, W.; Mobley, J.; Phillips, P.; Reed, D.; Sargent, Z.; Tillmann, P.; Wood, N. How to Make Shared Risk and Reward Sustainable. In Proceedings of the 23rd Annual Conference of the International Group for Lean Construction, Perth, Australia, 23 July 2015; pp. 257–266. [Google Scholar]
  95. Cheng, R. Motivation and Means: How and Why IPD and Lean Lead to Success; Research Report; Lean Construction Institute and Integrated Project Delivery Alliance: MI, USA, 2016; Available online: https://conservancy.umn.edu/handle/11299/198897 (accessed on 1 June 2022).
  96. Barutha, P.J.; Jeong, H.D.; Gransberg, D.D.; Touran, A. Evaluation of the Impact of Collaboration and Integration on Performance of Industrial Projects. J. Manag. Eng. 2021, 37. [Google Scholar] [CrossRef]
  97. Ruiz, J.; Granja, A.; Kowaltowski, D. Cost Reallocation in Social Housing Projects Considering the Desired Values of End-Users. Built Environ. Proj. Asset Manag. 2014, 4, 352–367. [Google Scholar] [CrossRef]
  98. Fischer, M.; Ashcraft, H.; Reed, D.; Khanzode, A. Integrated Project Delivery; Wiley: Hoboken, NJ, USA, 2017; ISBN 978-1-118-41538-2. [Google Scholar]
  99. Zhang, L.; El-Gohary, N.M. Discovering Stakeholder Values for Axiology-Based Sustainability-Oriented Value Analysis of Educational Building Projects. In Proceedings of the Construction Research Congress, Atlanta, GA, USA, 19–21 May 2014; pp. 623–632. [Google Scholar]
  100. Arroyo, P.; Tommelein, I.D.; Ballard, G. Selecting Globally Sustainable Materials: A Case Study Using Choosing by Advantages. J. Constr. Eng. Manag. 2016, 142, 1–10. [Google Scholar] [CrossRef]
  101. Kpamma, Z.E.; Adjei-kumi, T.; Ayarkwa, J. An Exploration of the Choosing by Advantages Decision System as a User Engagement Tool in Participatory Design. Archit. Eng. Des. Manag. 2016, 12, 51–66. [Google Scholar] [CrossRef]
  102. Mesa, H.A.; Molenaar, K.R.; Alarcón, L.F. Comparative Analysis between Integrated Project Delivery and Lean Project Delivery. Int. J. Proj. Manag. 2019, 37, 395–409. [Google Scholar] [CrossRef]
Figure 1. Graphical overview of the VAM [20].
Buildings 12 00922 g001
Figure 2. Value evolution [20].
Buildings 12 00922 g002
Figure 3. Research approach.
Buildings 12 00922 g003
Figure 4. Target costing chart. Cost evolution.
Buildings 12 00922 g004
Figure 5. Value evolution.
Buildings 12 00922 g005
Figure 6. Comparison between cost and value evolution.
Buildings 12 00922 g006
Table 1. TVD practices, updates, and related tools.
Practices Related to TVDTools Related to TVD Practices
1Engage deeply with the client to establish the target value [27]1Target costing [5,9,15,48,68,69]
2Lead the design effort for learning and innovation [27].2nD model (3D, 4D…) [16,48,60]
3Design of a detailed estimate [27,66].3Functional analysis/value engineering [15,48]
4Collaboratively plan and replan the project [15,27,70,71,72,73,74]4Last Planner System ® [5,11,15,17,48,60,75]
5Concurrently design the product and the process in design sets [27,48].5Integrated product/cost model [48]
6Design and detail in the sequence of the customer who will use it [15,27,48,55].6Formal retrospectives [27]
7Work in small and diverse groups [27].7Plus and delta activity [27]
8Work in a Big Room [27].8Short codesign sessions and Big Room meetings [5,15,27,73,75]
9Conduct retrospectives throughout the process [27].9Design–build contract [48]
10Cross-functional teams [17,48,74,76].10Plan Do Check Act (PDCA) [15,65]
11Long-term relationships with suppliers [48]115-minute meetings [65]
12Balance designer and constructor (team members) interests [48]125-Why™ [65]
13Early integration of designers and builders [48,55,70,72,77]13Pareto analysis [65]
14Early incorporation of main suppliers and contractors [15,48,76,78].14Relational contract [4,60,79].
15Sub targets cost by teams [48,66]15Building Information Model (BIM) [4,5,11,15,17,75,76]
16Best value instead of the lowest first cost [11,17,48,55,73,74]16A3 thinking [4]
17Intentionally build relationships on projects [65]17Choosing by advantages (CBA) decision making [4,15]
18Optimize the whole project [65]18Set-based design [4]
19Projects are single-purpose networks of commitments [65].19TVD update charts [66]
20Involve all key stakeholders in feasibility study [4].20Standardization [15,17,76,80]
21Design solutions are developed with cost, schedule, and constructability as design criteria [4].21One-page improvement reports [11,60]
22All team members understand the business case and stakeholder values [4]223P (production preparation process)/mockups [11,60]
23Set targets for values and conditions of satisfaction [66]23Virtual meetings [11,60]
24A cross-disciplinary “validation study” [66]24Charrette meeting [11,60]
25Aligned goals and share risks and rewards [4]25Visual management tools [11,60]
26Rapid estimating [66]26Value stream mapping [11,60]
27Continuity of staff to retain the knowledge [15],27Prototyping [11,60]
28Capture of lessons learned [11,15,60]28Gemba walks (site tours) [11,60]
29Lean set of tools to eliminate process waste [15]29Focus groups [11,60]
30“three musketeers” attitude. “All for one, one for all” thinking [15]30Innovation workbooks [11,60].
31Monetary and nonmonetary motivation [15]31Design thinking [61]
32Support continuous tracking of issues and indicators [11,60]32Kaizen/continuous improvement/ kaizen event [11,15,17,60,67,78]
33Promote transparent communication [11,60]
34Searching for and developing innovative solutions with the users [55,61,71,72,73]
35Encourages the discussion of problems and solutions [67]
36Prioritizes continuous but durable improvements over time instead of more radical improvements [67].
Table 2. Explicit and implicit benefits on TVD projects.
Focus or BenefitsMeasured (Explicit)Not Measured (Implicit)
Cost[2,14,15,16,17,18,29,48,53,55,59,66,76,80,81,82,83][9,11,47]
Schedule[2,14,18,48,55][11,76]
ValueImportance degree of value items [81];
reduction in design
document drafting time [82]; energy savings [66]; 30% space reduction [15]; safety and quality
metrics [18,55]; people metrics [55]; sustainable target values (STV) [14]; value perceived by
different groups of
stakeholders: 1 to 5 scale [5]; value ranking
analysis of key
construction factors [59,80].
Functionality, durability/maintainability, and buildability
requirements [47]; relocate the building from its initial location, quality of the
facility produced [48]; design
innovations, increased efficiency [53]; quality [9]; maximum long-term value for the customer, appropriate acoustics and lighting, flexibility, privacy for
families and staff interaction [29]
quality, performance [76]; benefits
perceived, aesthetics, lighting, larger helipad… [18]; significant value for the project [12] performance, sustainability, value [11]; improvements in the
design–build process [77].
Table 3. Acronyms summary.
AcronymMeaning
TVDTarget value design
ICInitial cost
TCTarget cost
ACAllowable cost
VAMValue analysis model
DVIDesired value index
DVGDesired value generated
DVLDesired value loss
DVFPDesired value fulfillment percentage
PVIPotential value index
PVGPotential value generated
PVLPotential value loss
PVFPPotential value fulfillment percentage
WWeighting factor
MMust-be attributes
OOne-dimensional attributes
RReverse attributes
AAttractive attributes
IIndifferent attributes
Table 4. Data collection for stages.
Cost MeasurementValue Measurement
TVD
Pre-implementation
-
IC
-
AC and TC.
-
Conditions of satisfaction and value attributes
-
Weighting factor (W) per customer
-
DVI-PVI
-
Rev. 0: DVG0 y PVG0
-
DVFP0 and PVFP0
-
DVL0 and PVL0
TVD
implementation
-
Actions to be incorporated to achieve TC
-
Continuous cost estimates
-
Learning plus/delta
-
Rev 1: DVG1 and PVG1
-
DVFP1 and PVFP1
-
DVL1 and PVL1
TVD
Post-implementation
-
Achievement of TC
-
Challenging to implement TVD practices and tolos
-
Learning plus/delta
-
Rev. 2: DVG2 and PVG2
-
DVFP2 and PVFP2
-
DVL2 and PVL2
Table 5. Attribute valuation VAM [20].
AttributesValue
PresentAbsent
M0 *−1
O+1 *−1
R−1+1 *
A+10 *
I00
* expected by customer.
Table 6. Gap distribution among the committees.
CommitteeParticipation in Total Budget (%)TC-IC Gap
(Thousands USD)
Cost Reduction Achieved
(Thousands USD)
Cost Reduction Achieved
(% of Gap)
Structure and urban development28.60%75.6165.72219%
Finishes38.80%102.527.2527%
MEP19.70%52.1150.56289%
Logistics13.00%34.325.2173%
Total100.00%265.64368.74139%
Table 7. DVI and PVI by customers and total project.
ProductProcess
CustomerTotal
Project
CustomerTotal
Project
OwnerDesignersBuildersOwnerDesignersBuilders
W41.6%27.6%30.8%100%41.6%27.6%30.8%100%
DVI0.790.250.290.490.270.200.130.21
PVI1.000.630.420.720.400.400.330.38
Publisher’s Note: MDPI stays neutral with regard to jurisdictional claims in published maps and institutional affiliations.

