
Numerical Assessment of Different Phase Change Materials as a Passive Strategy to Reduce Energy Consumption in Buildings under Tropical Climates


Abstract
:1. Introduction
1.1. PCM as Passive Strategies in Buildings
1.2. Performance Evaluation of PCMs and Criteria
1.2.1. Indoor Temperature
1.2.2. PCM Layer Location
1.2.3. Phase Changing Operation
1.2.4. PCM Layer Thickness
1.2.5. PCM Coupled to Other Passive Techniques
1.2.6. Energy Consumption and Cooling Load Reduction
1.2.7. Heating and Cooling Demand Depending on the Climate Type
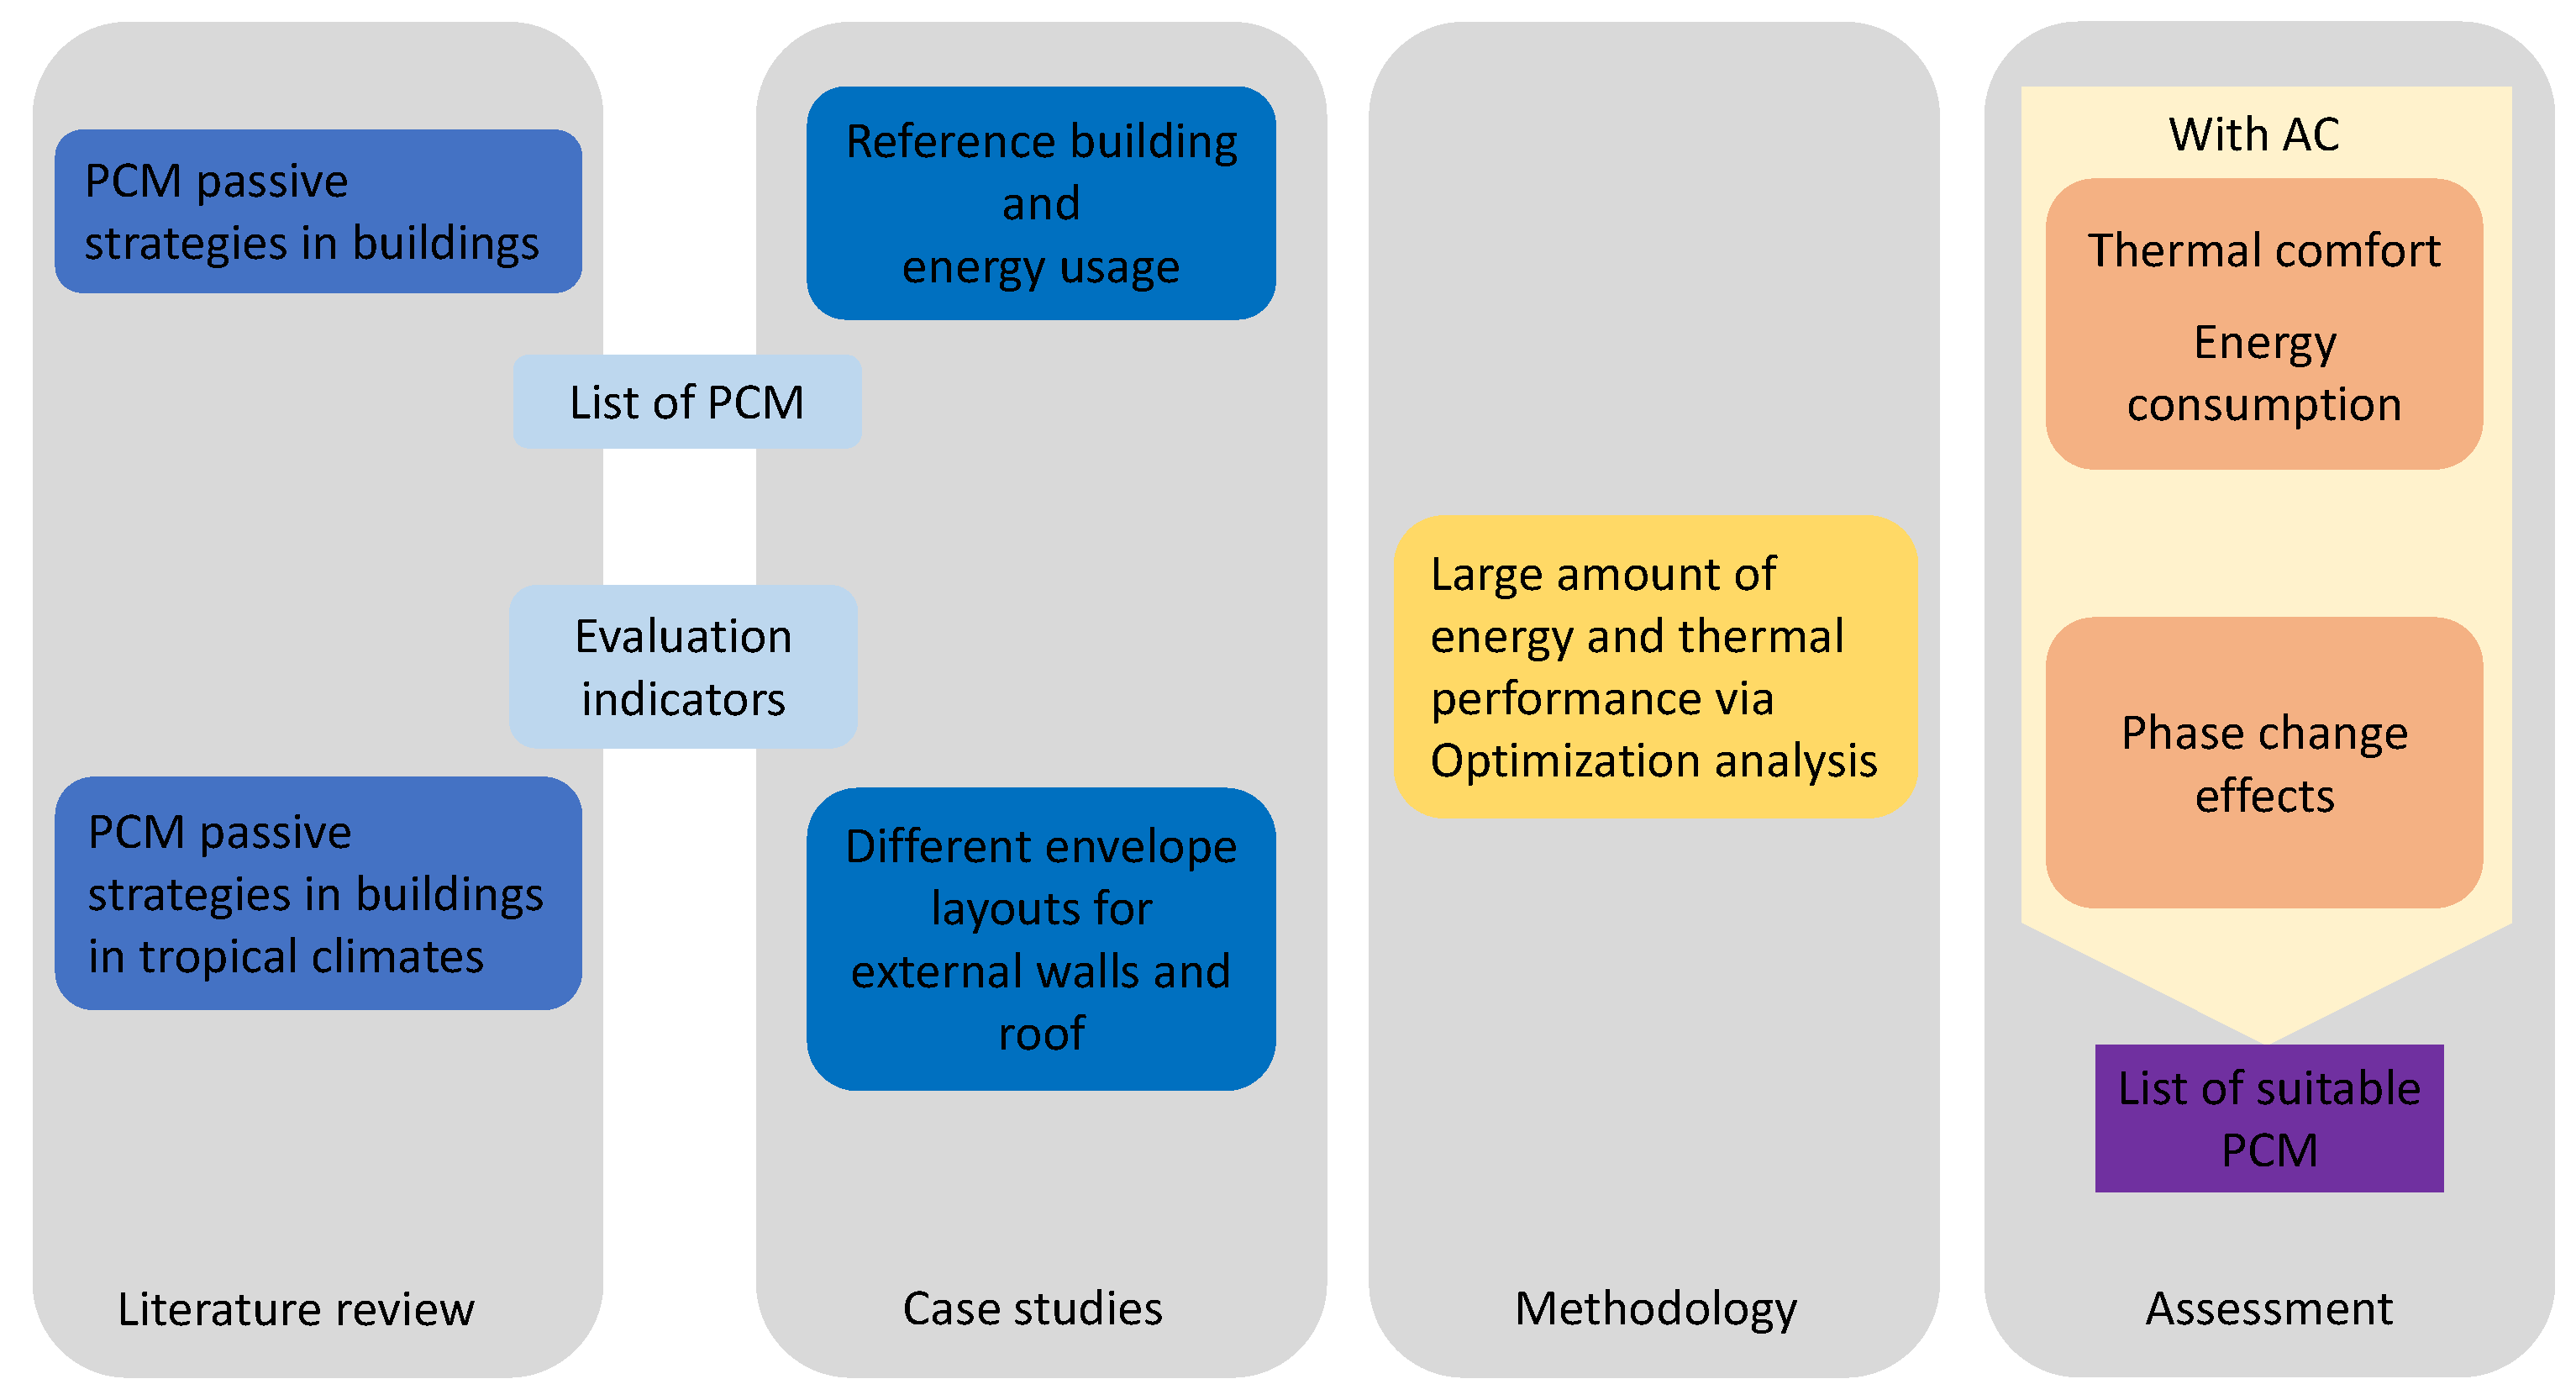
2. Methodology
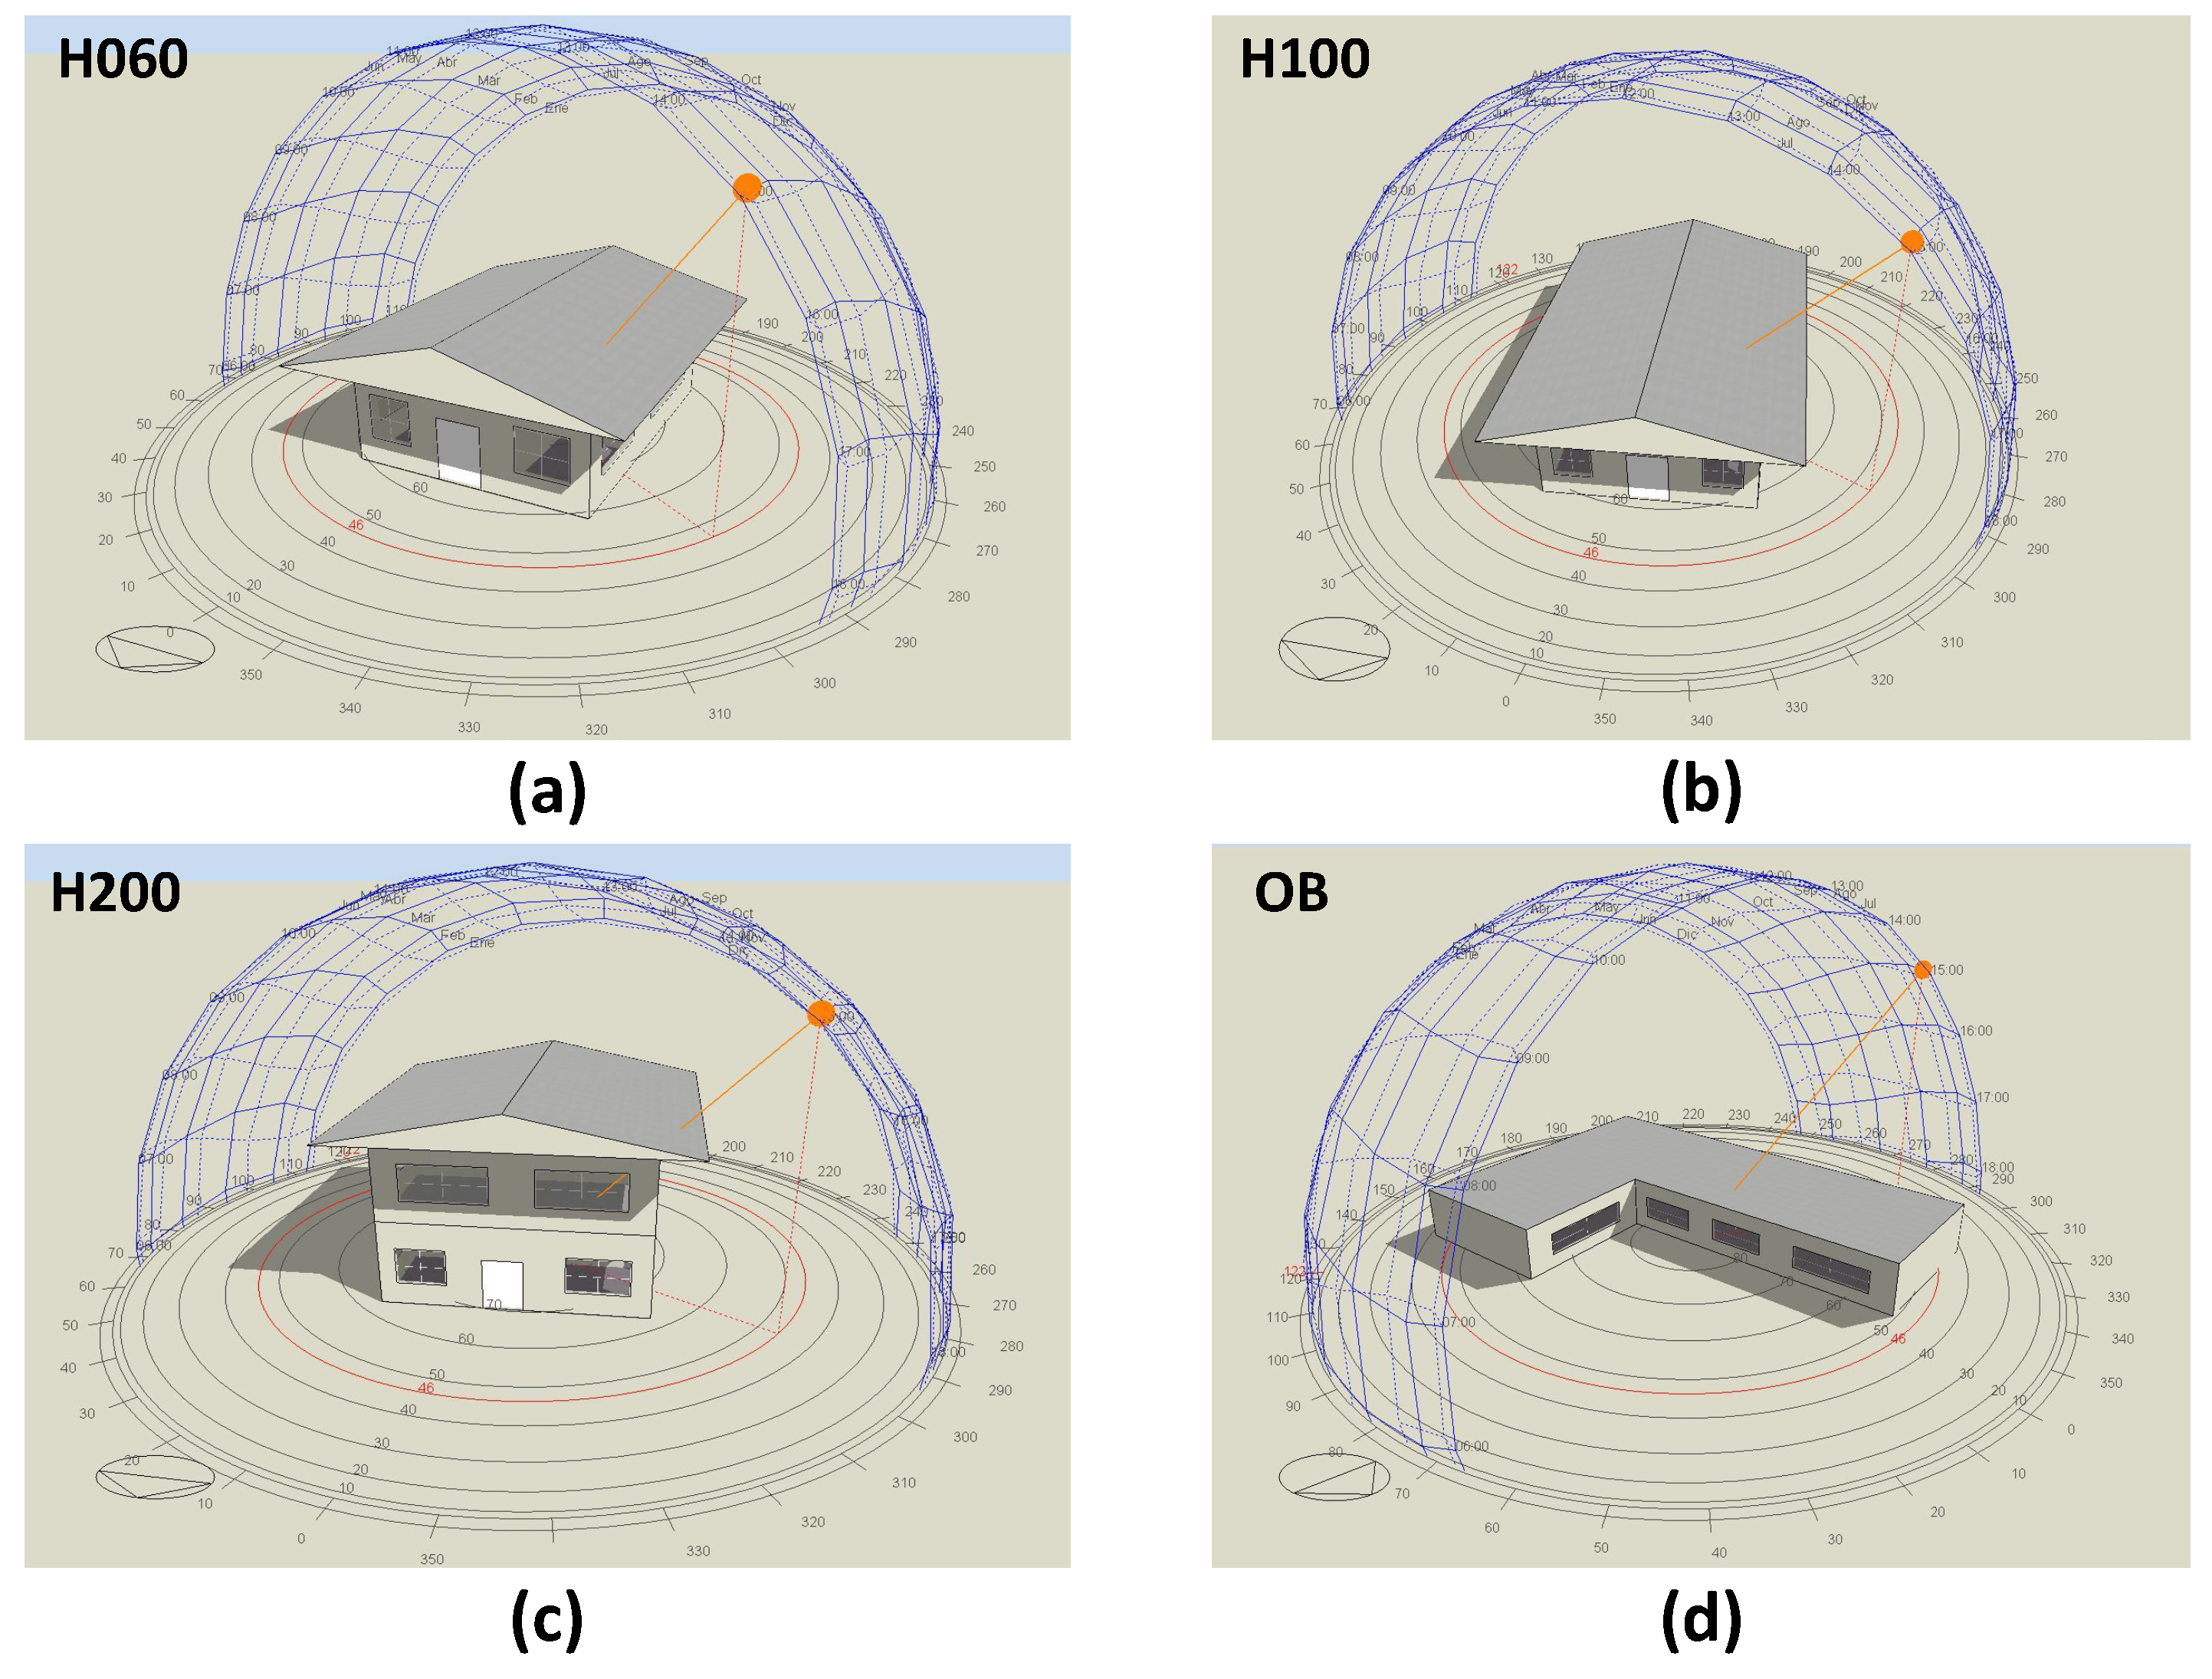
2.1. Buildings Descriptions and Energy Use
2.2. Evaluation of Different Building Envelope Layouts
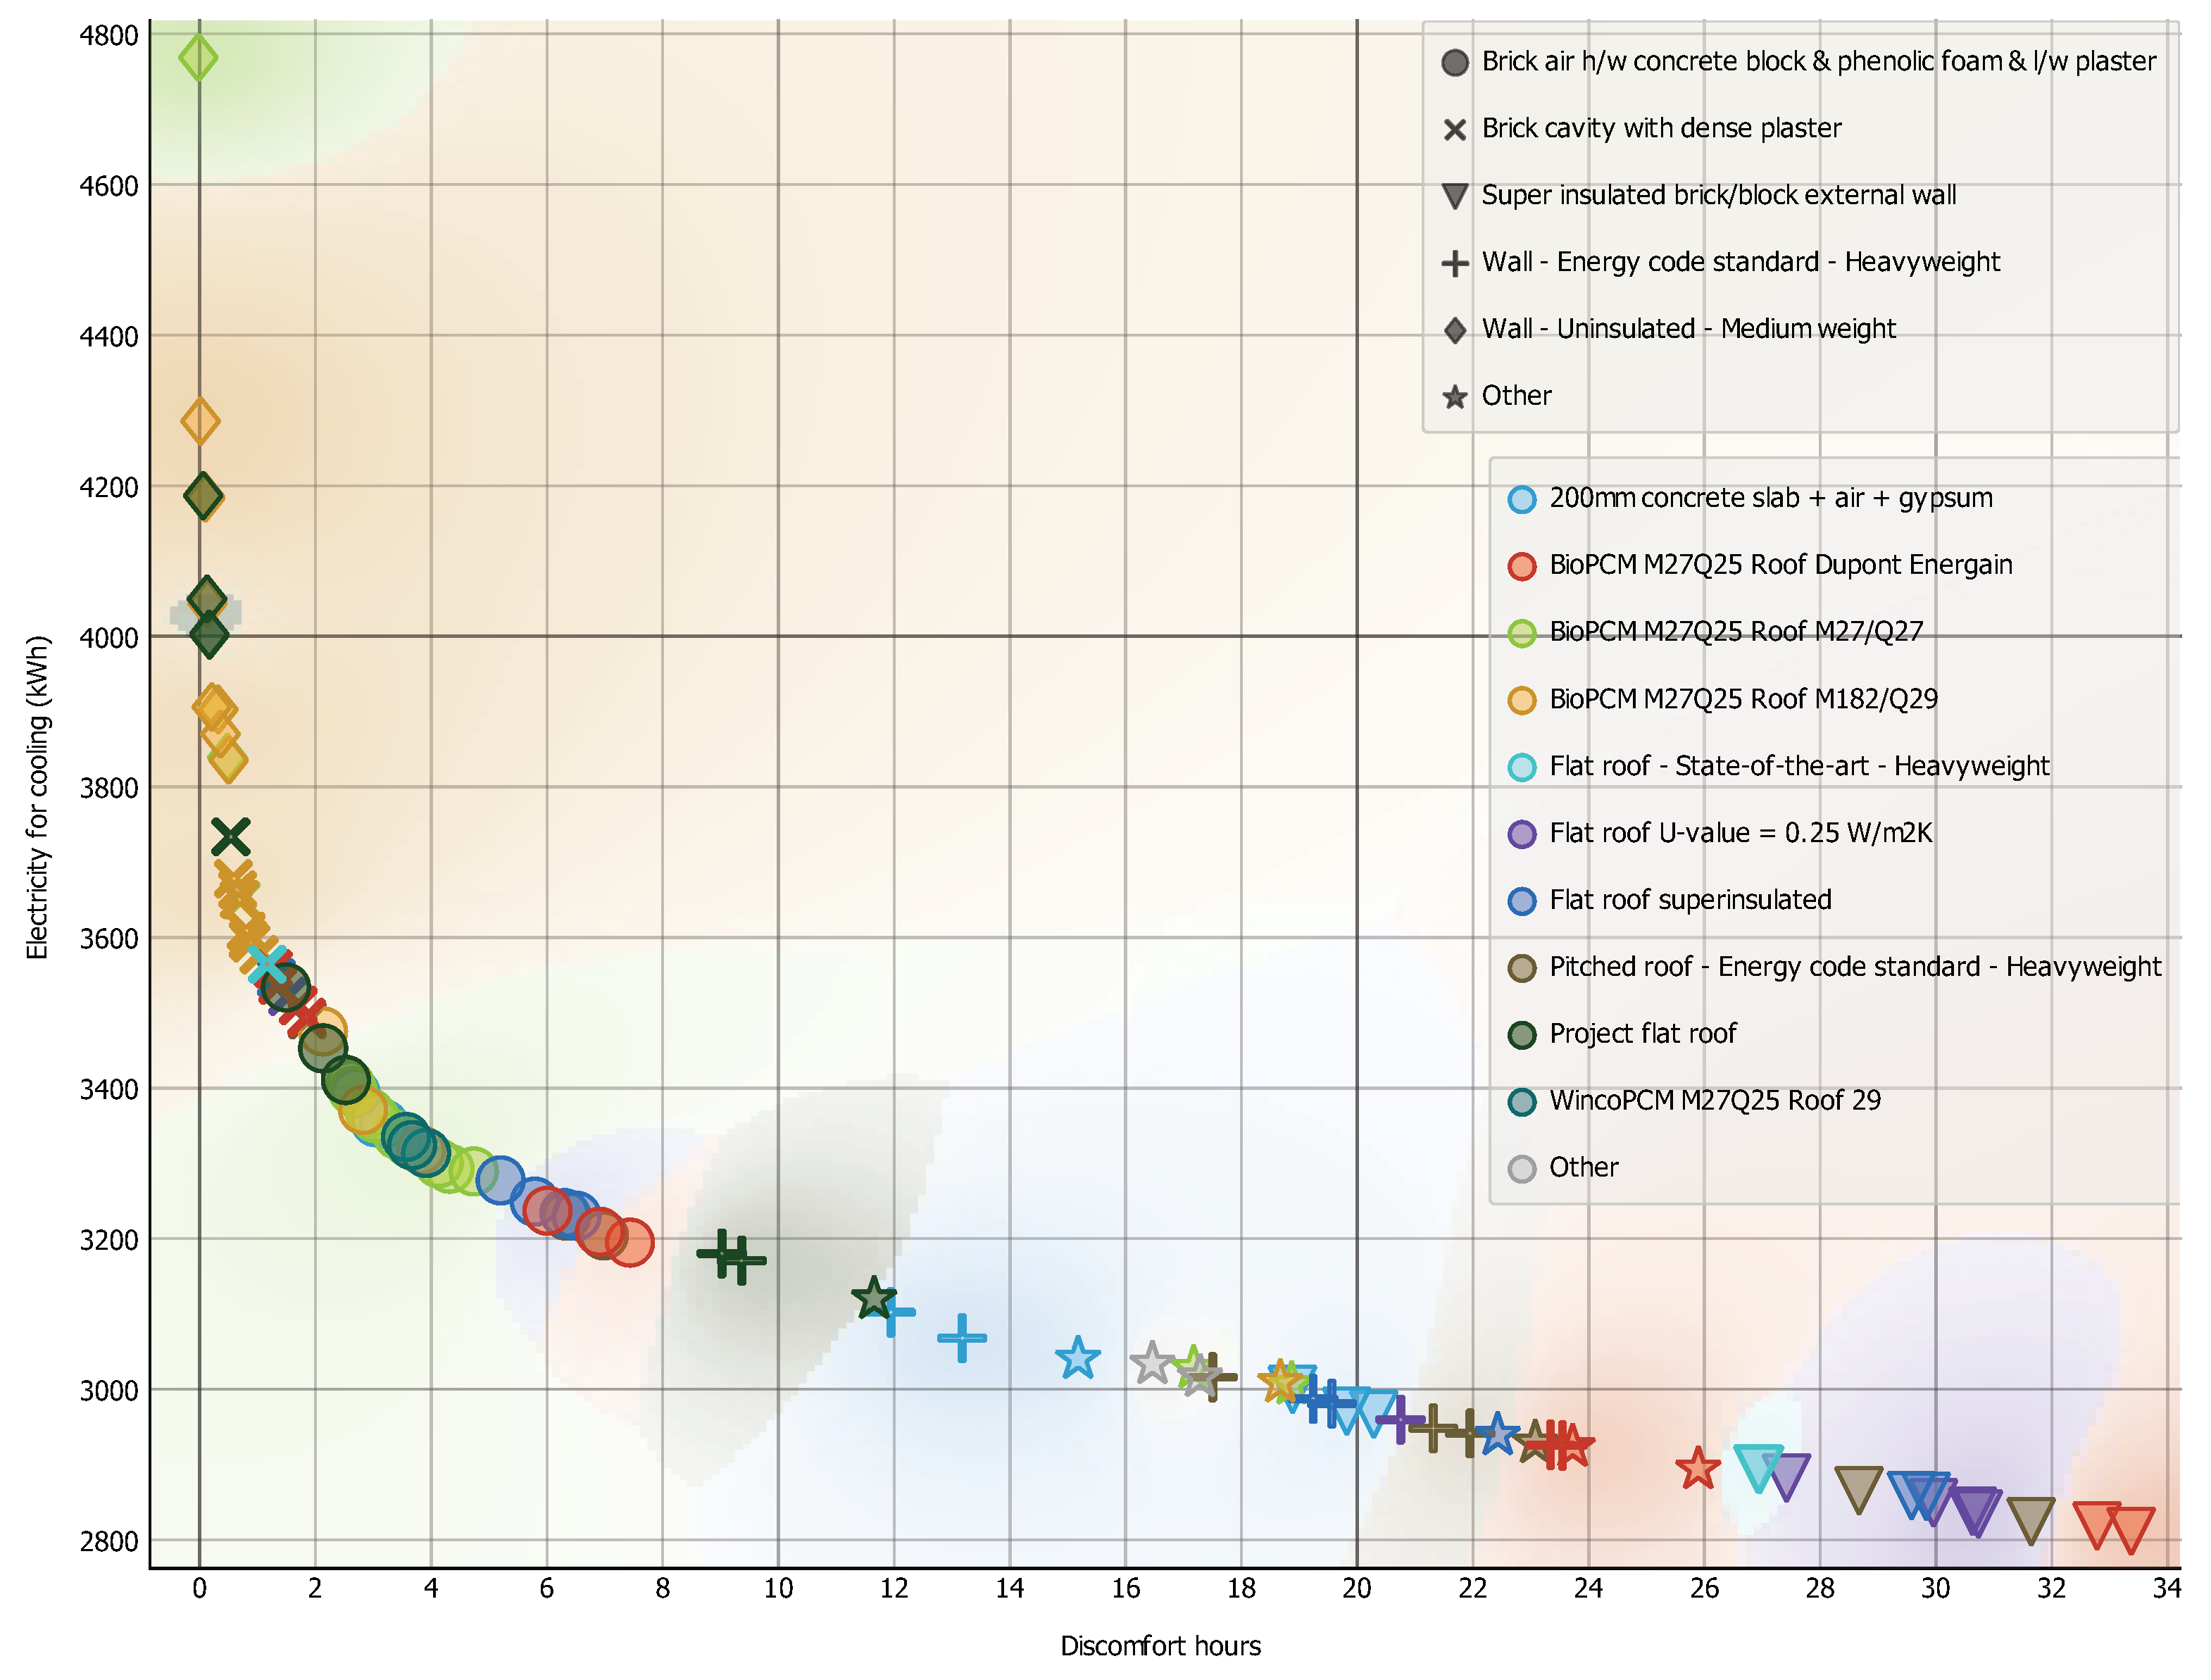
3. Results Analysis
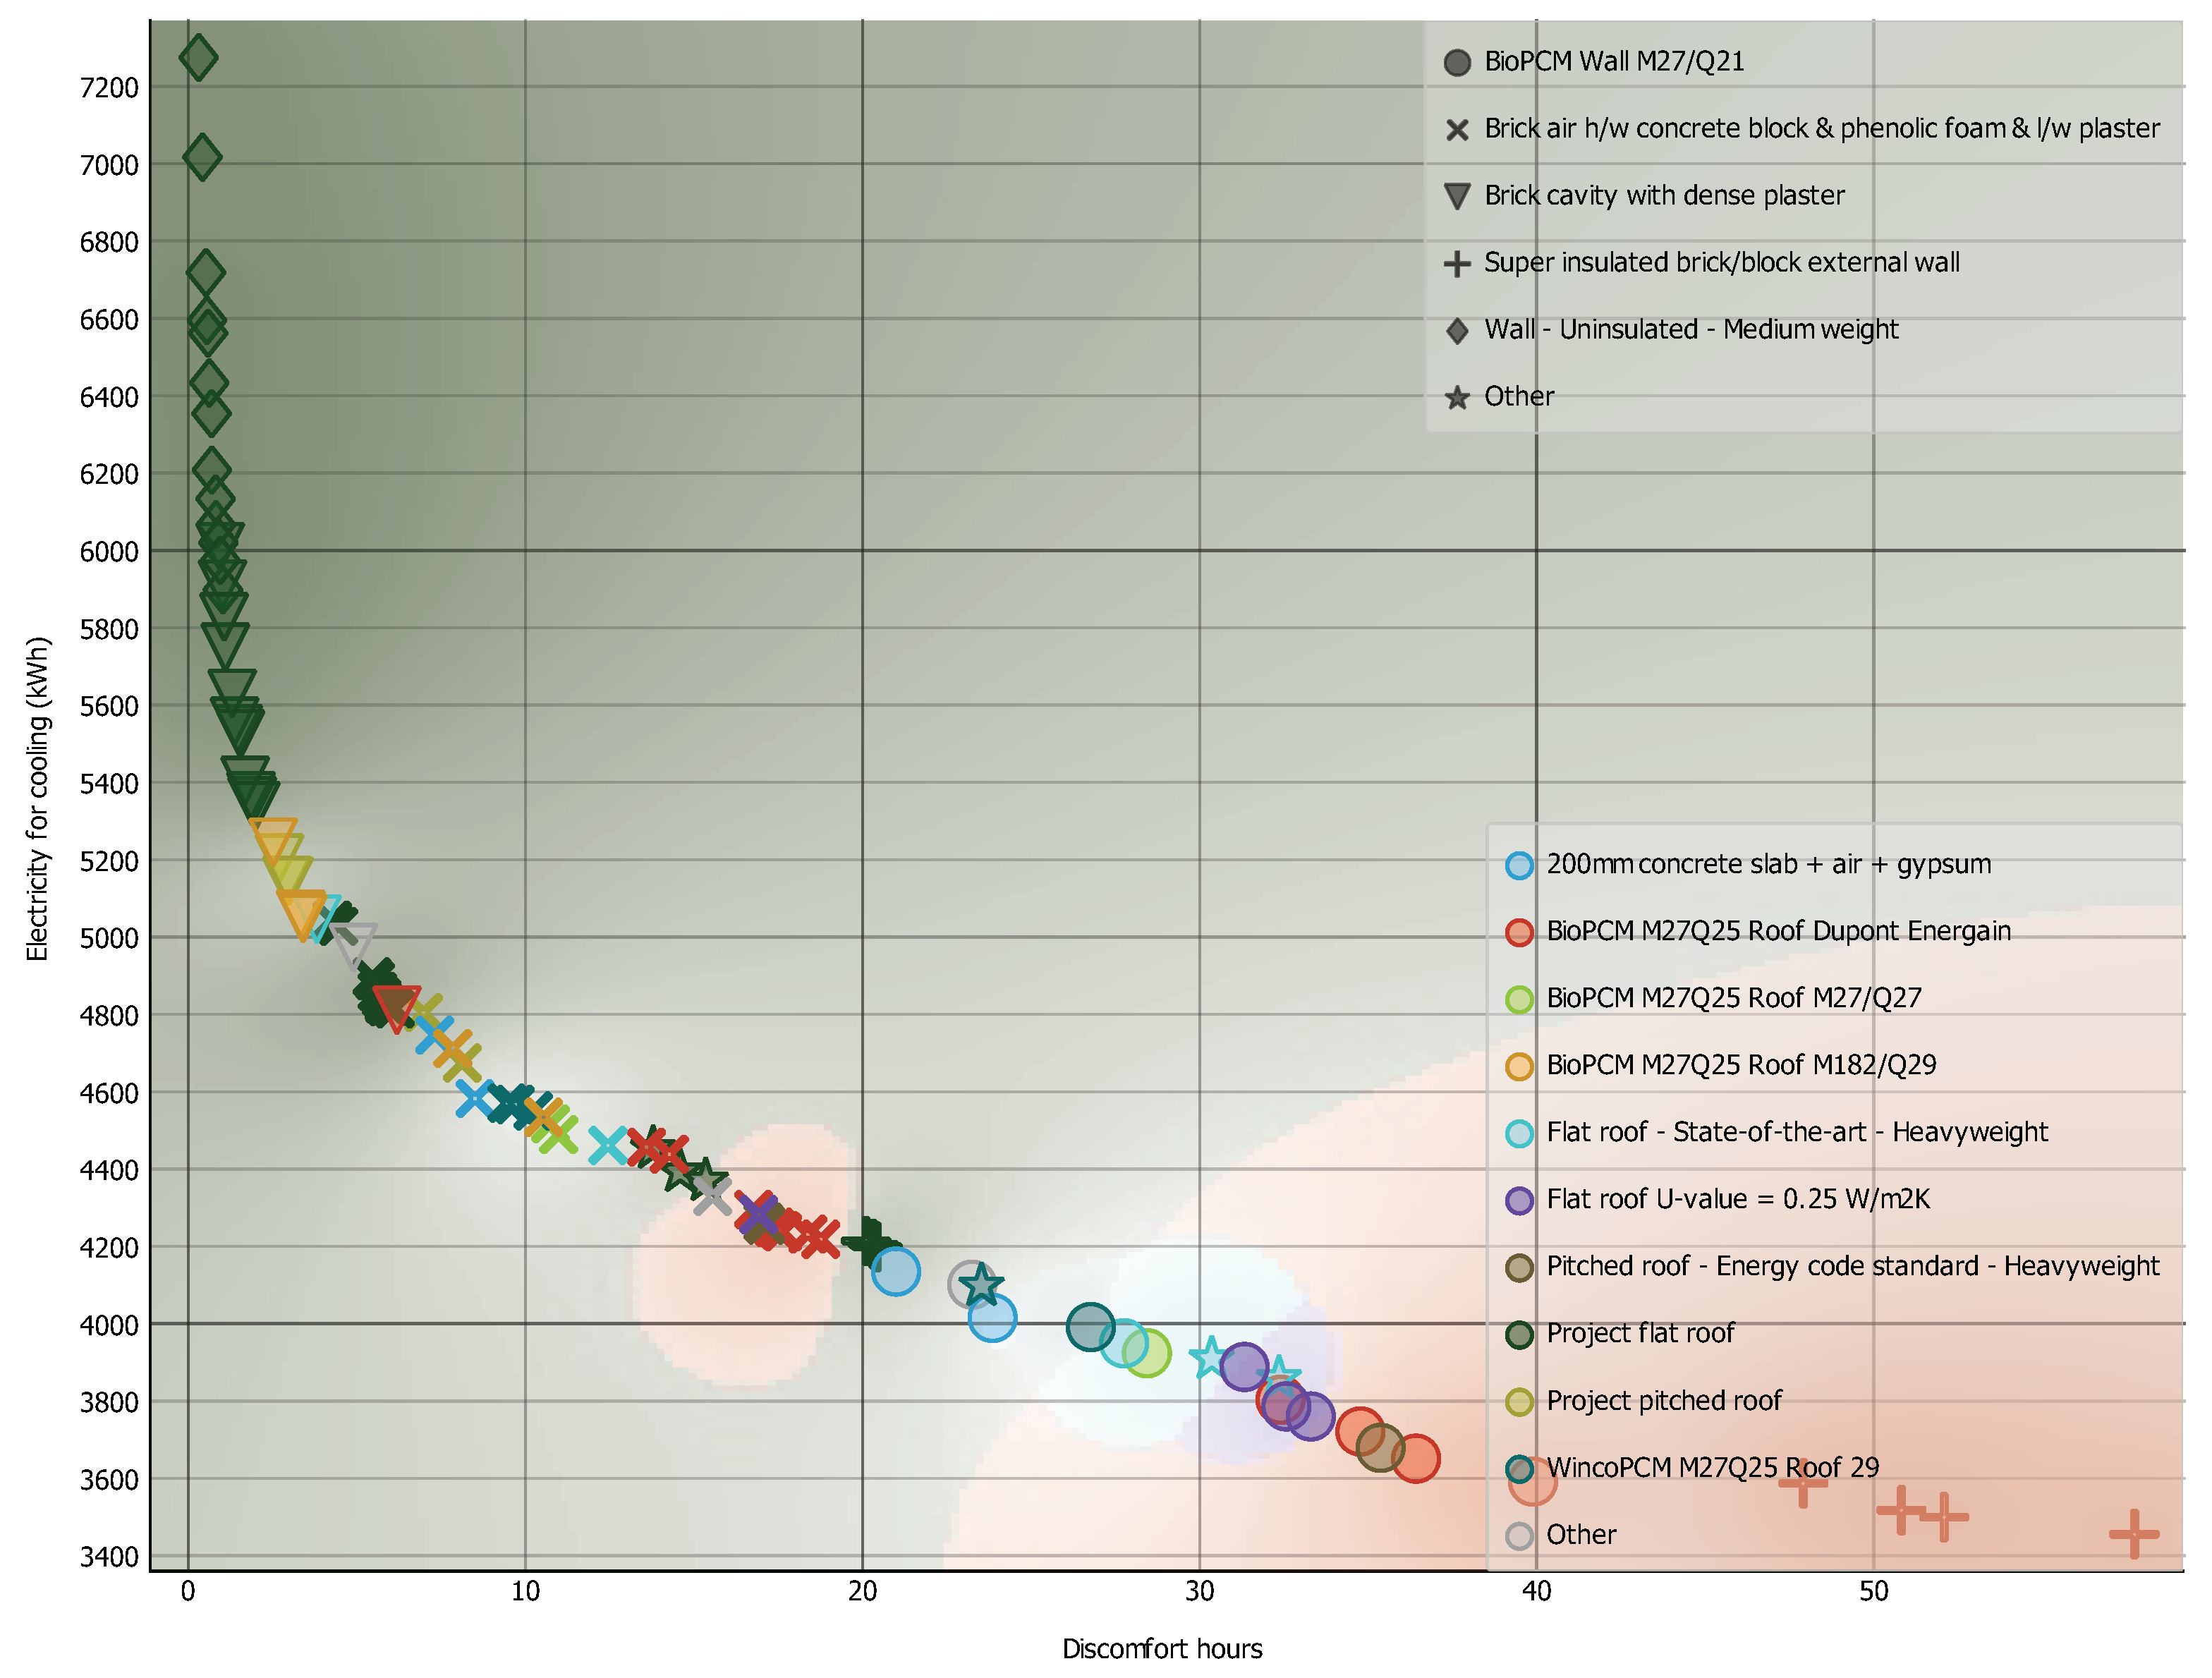
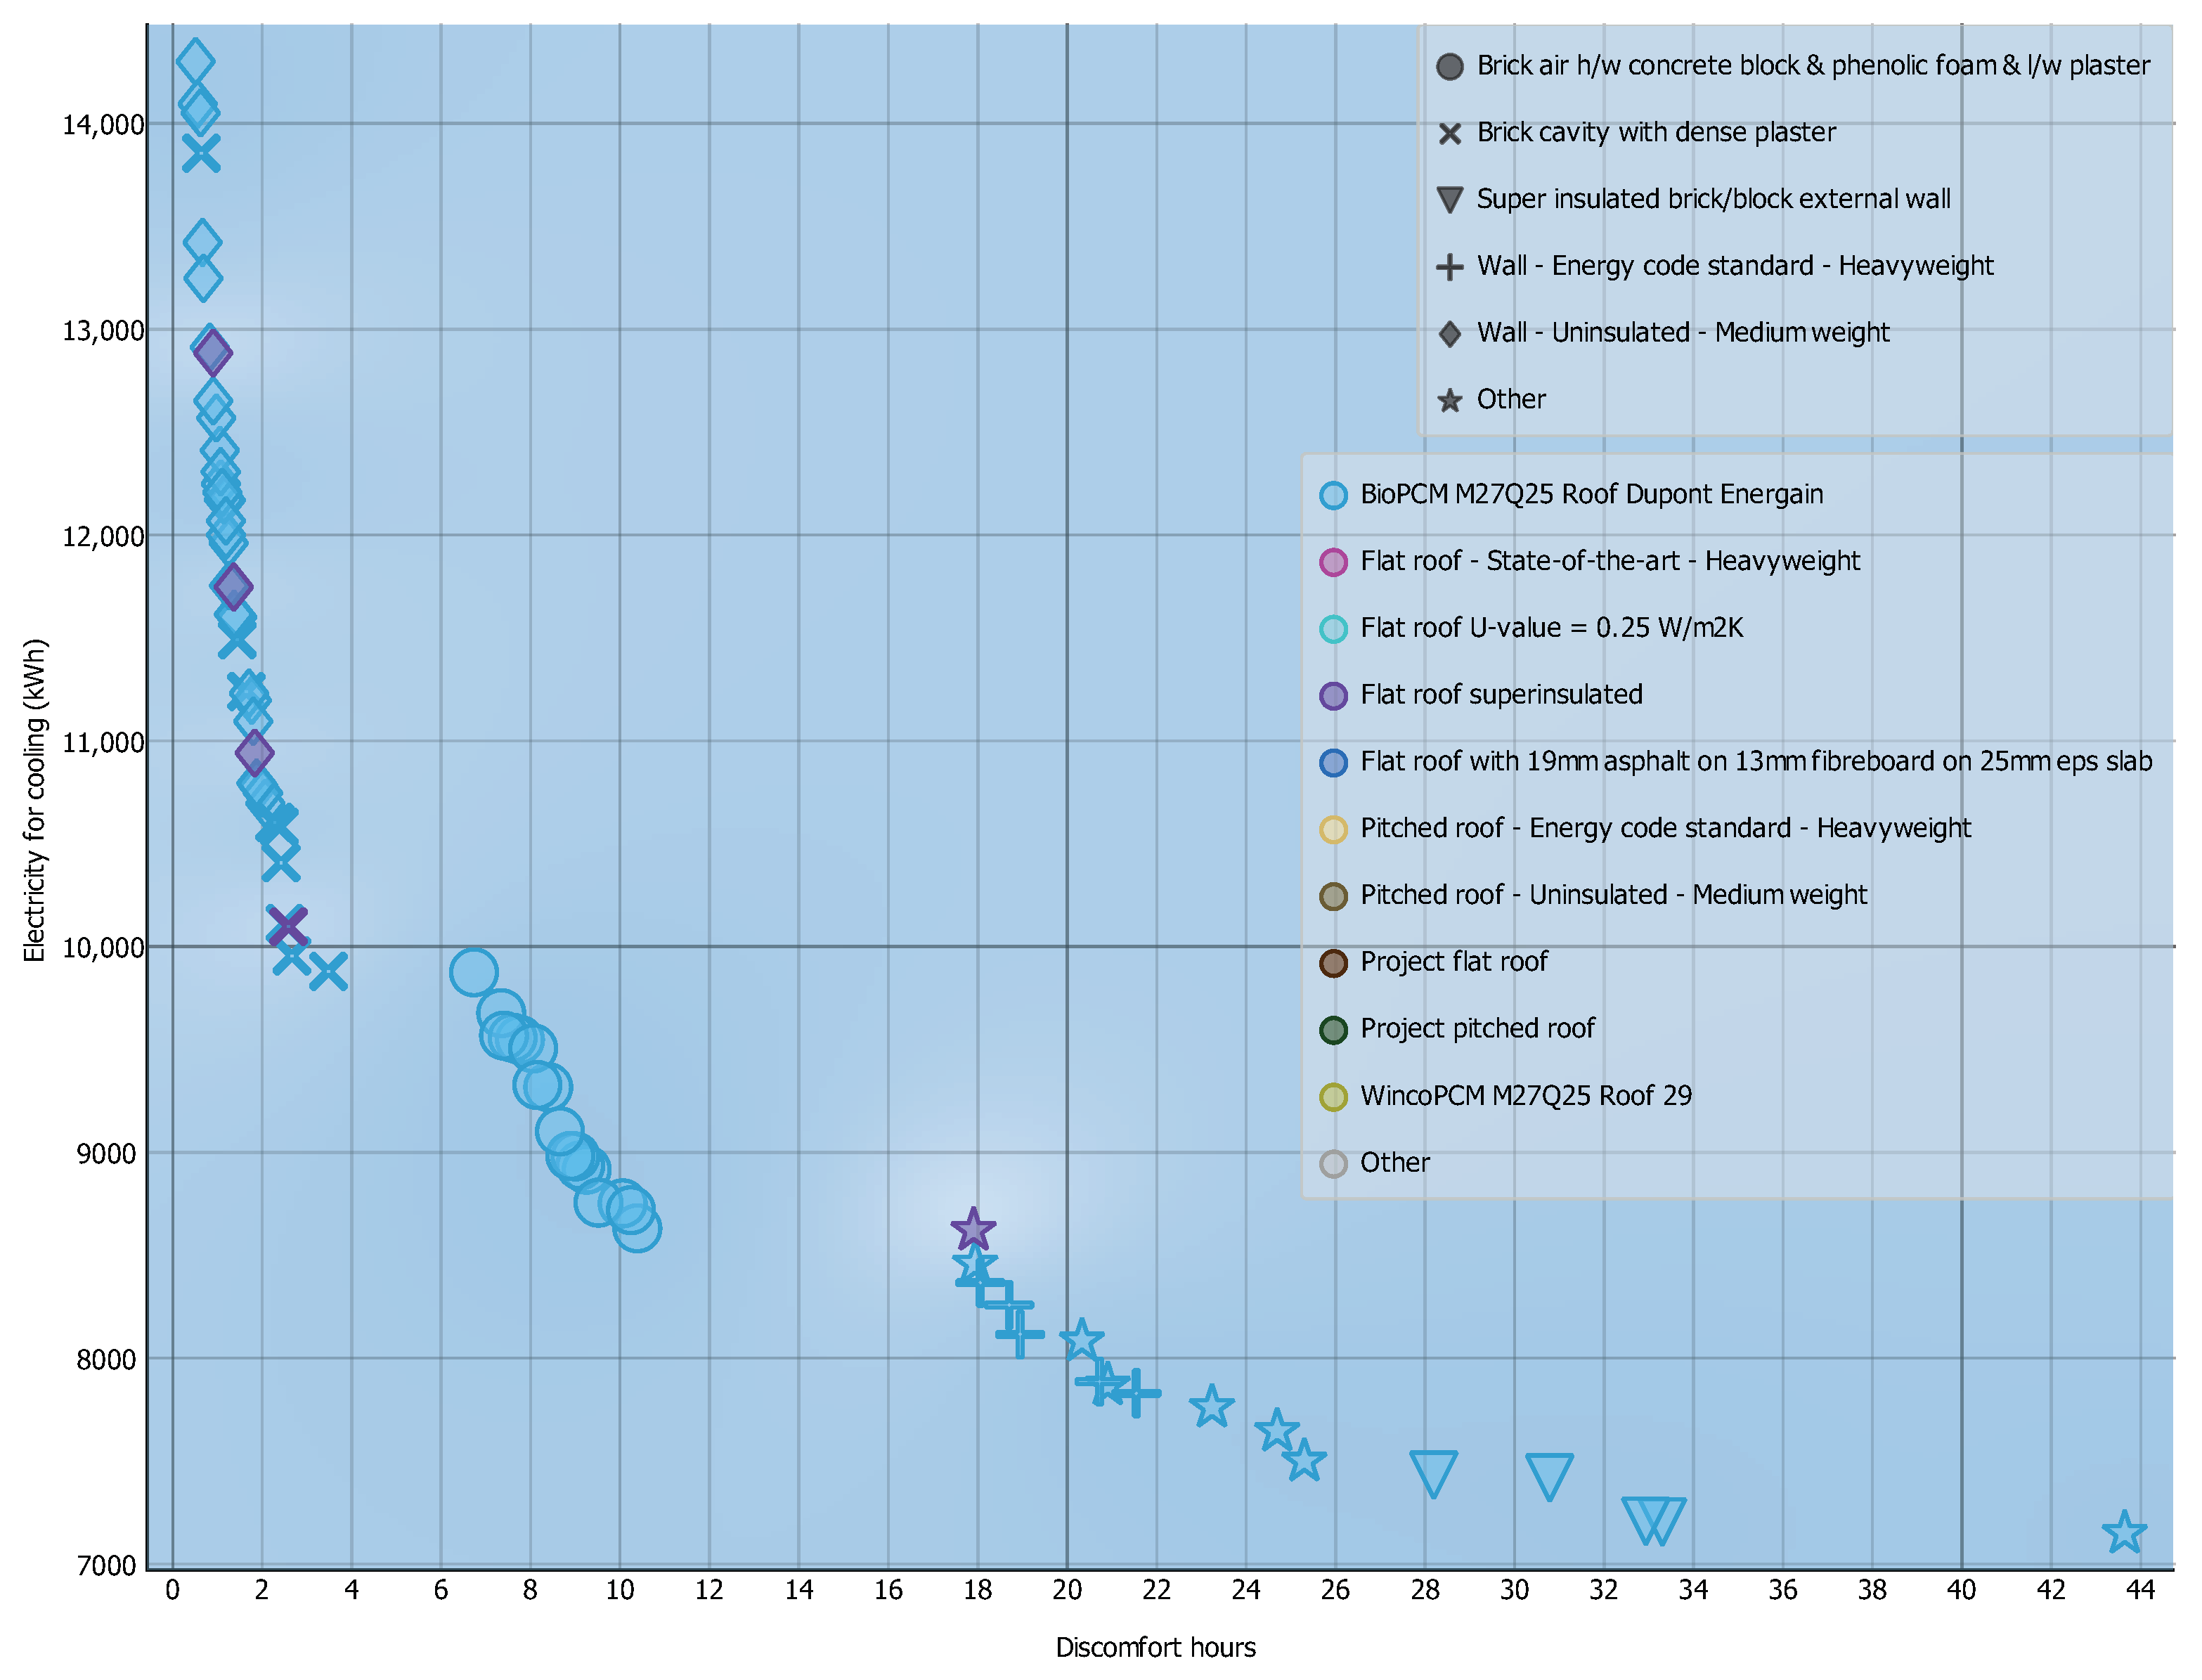
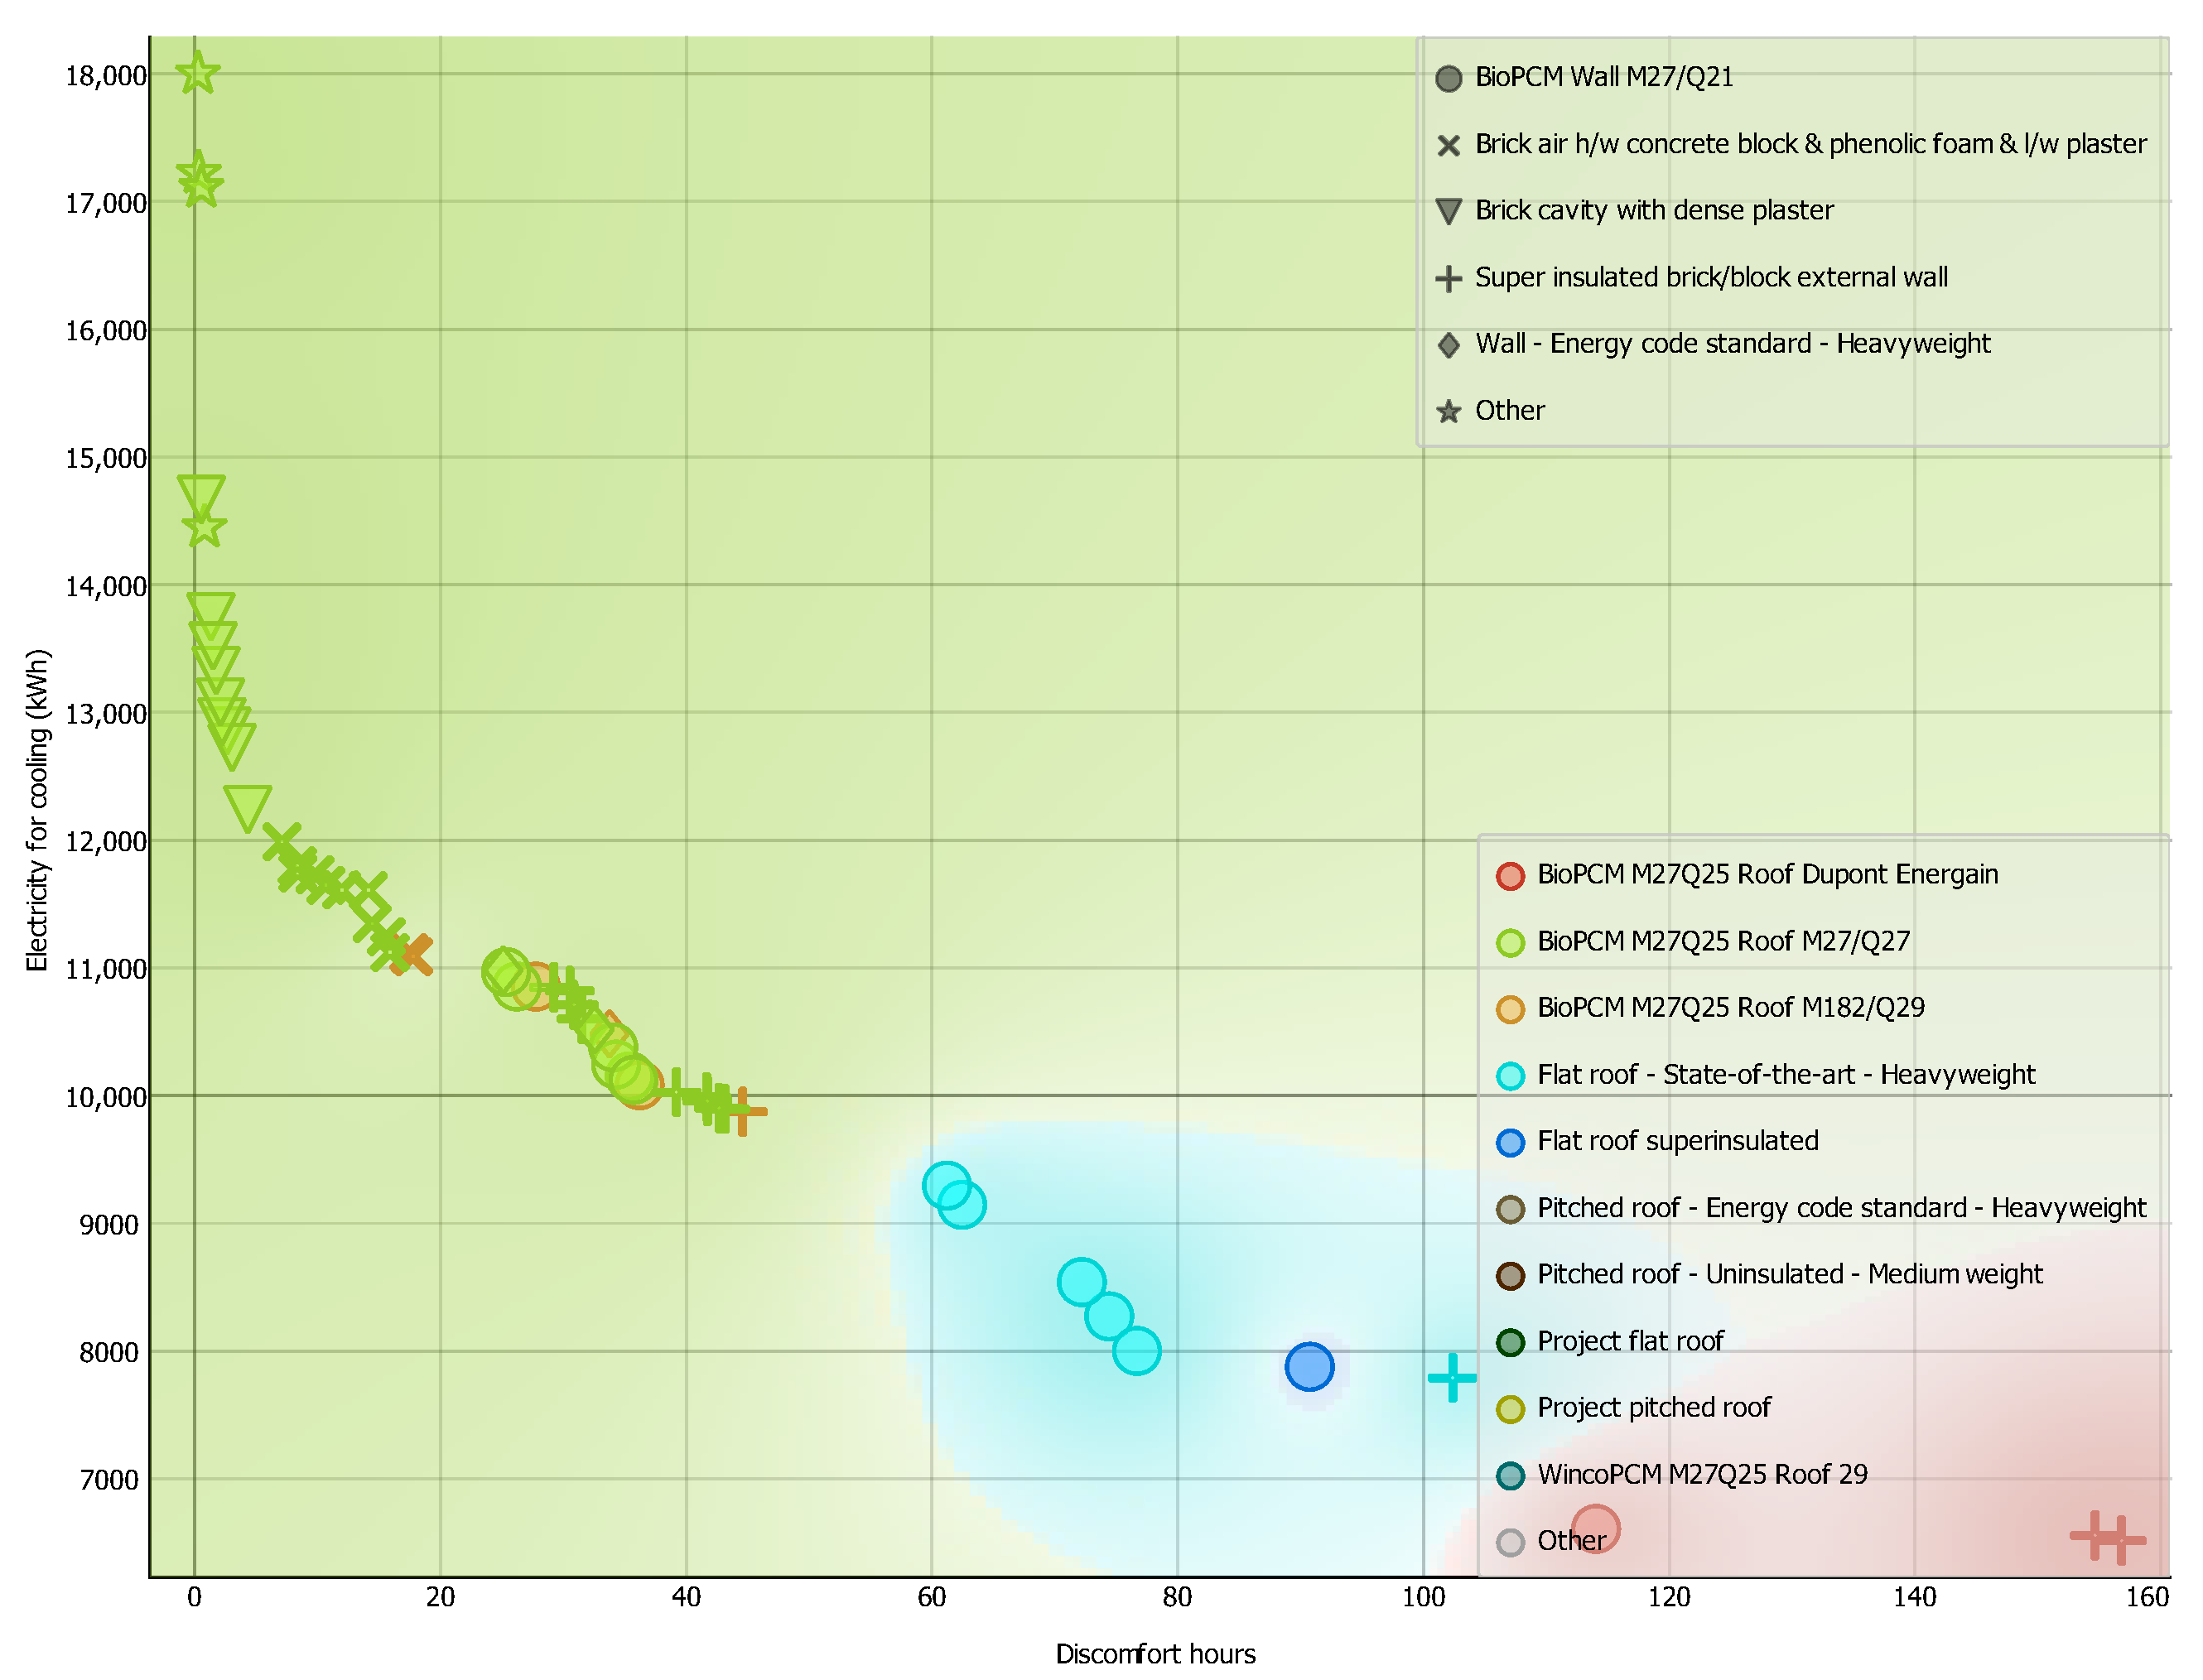
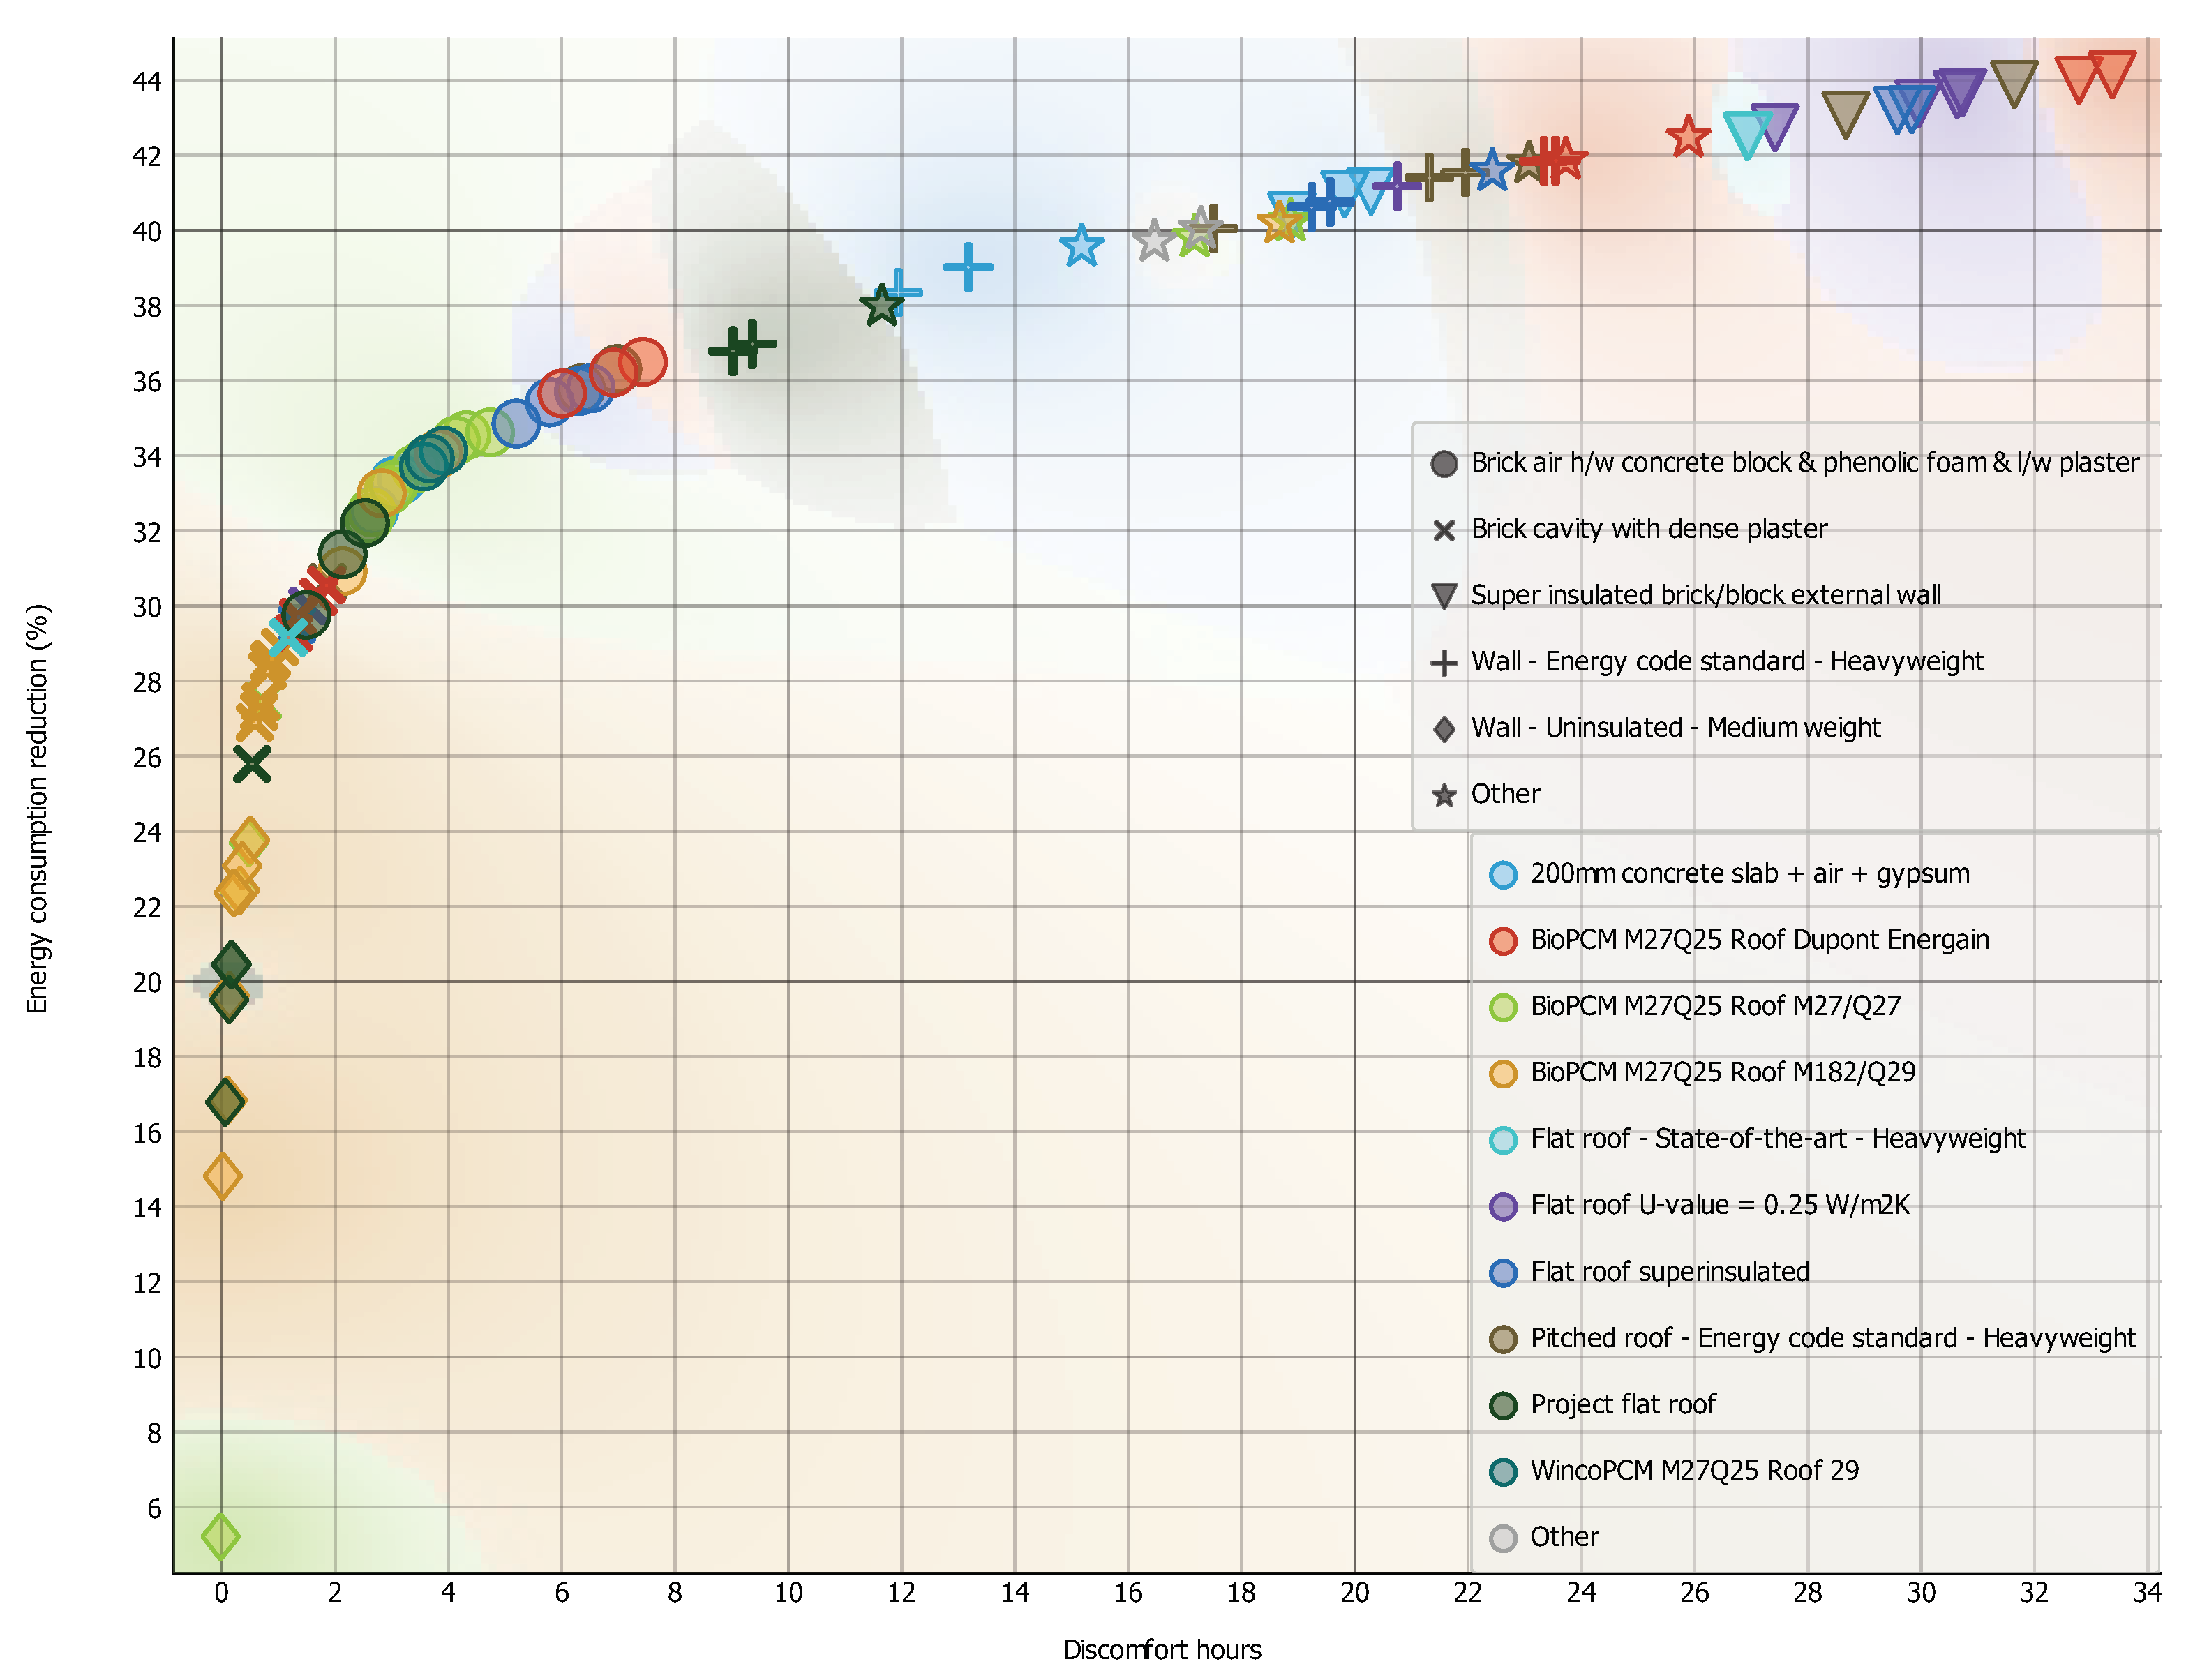
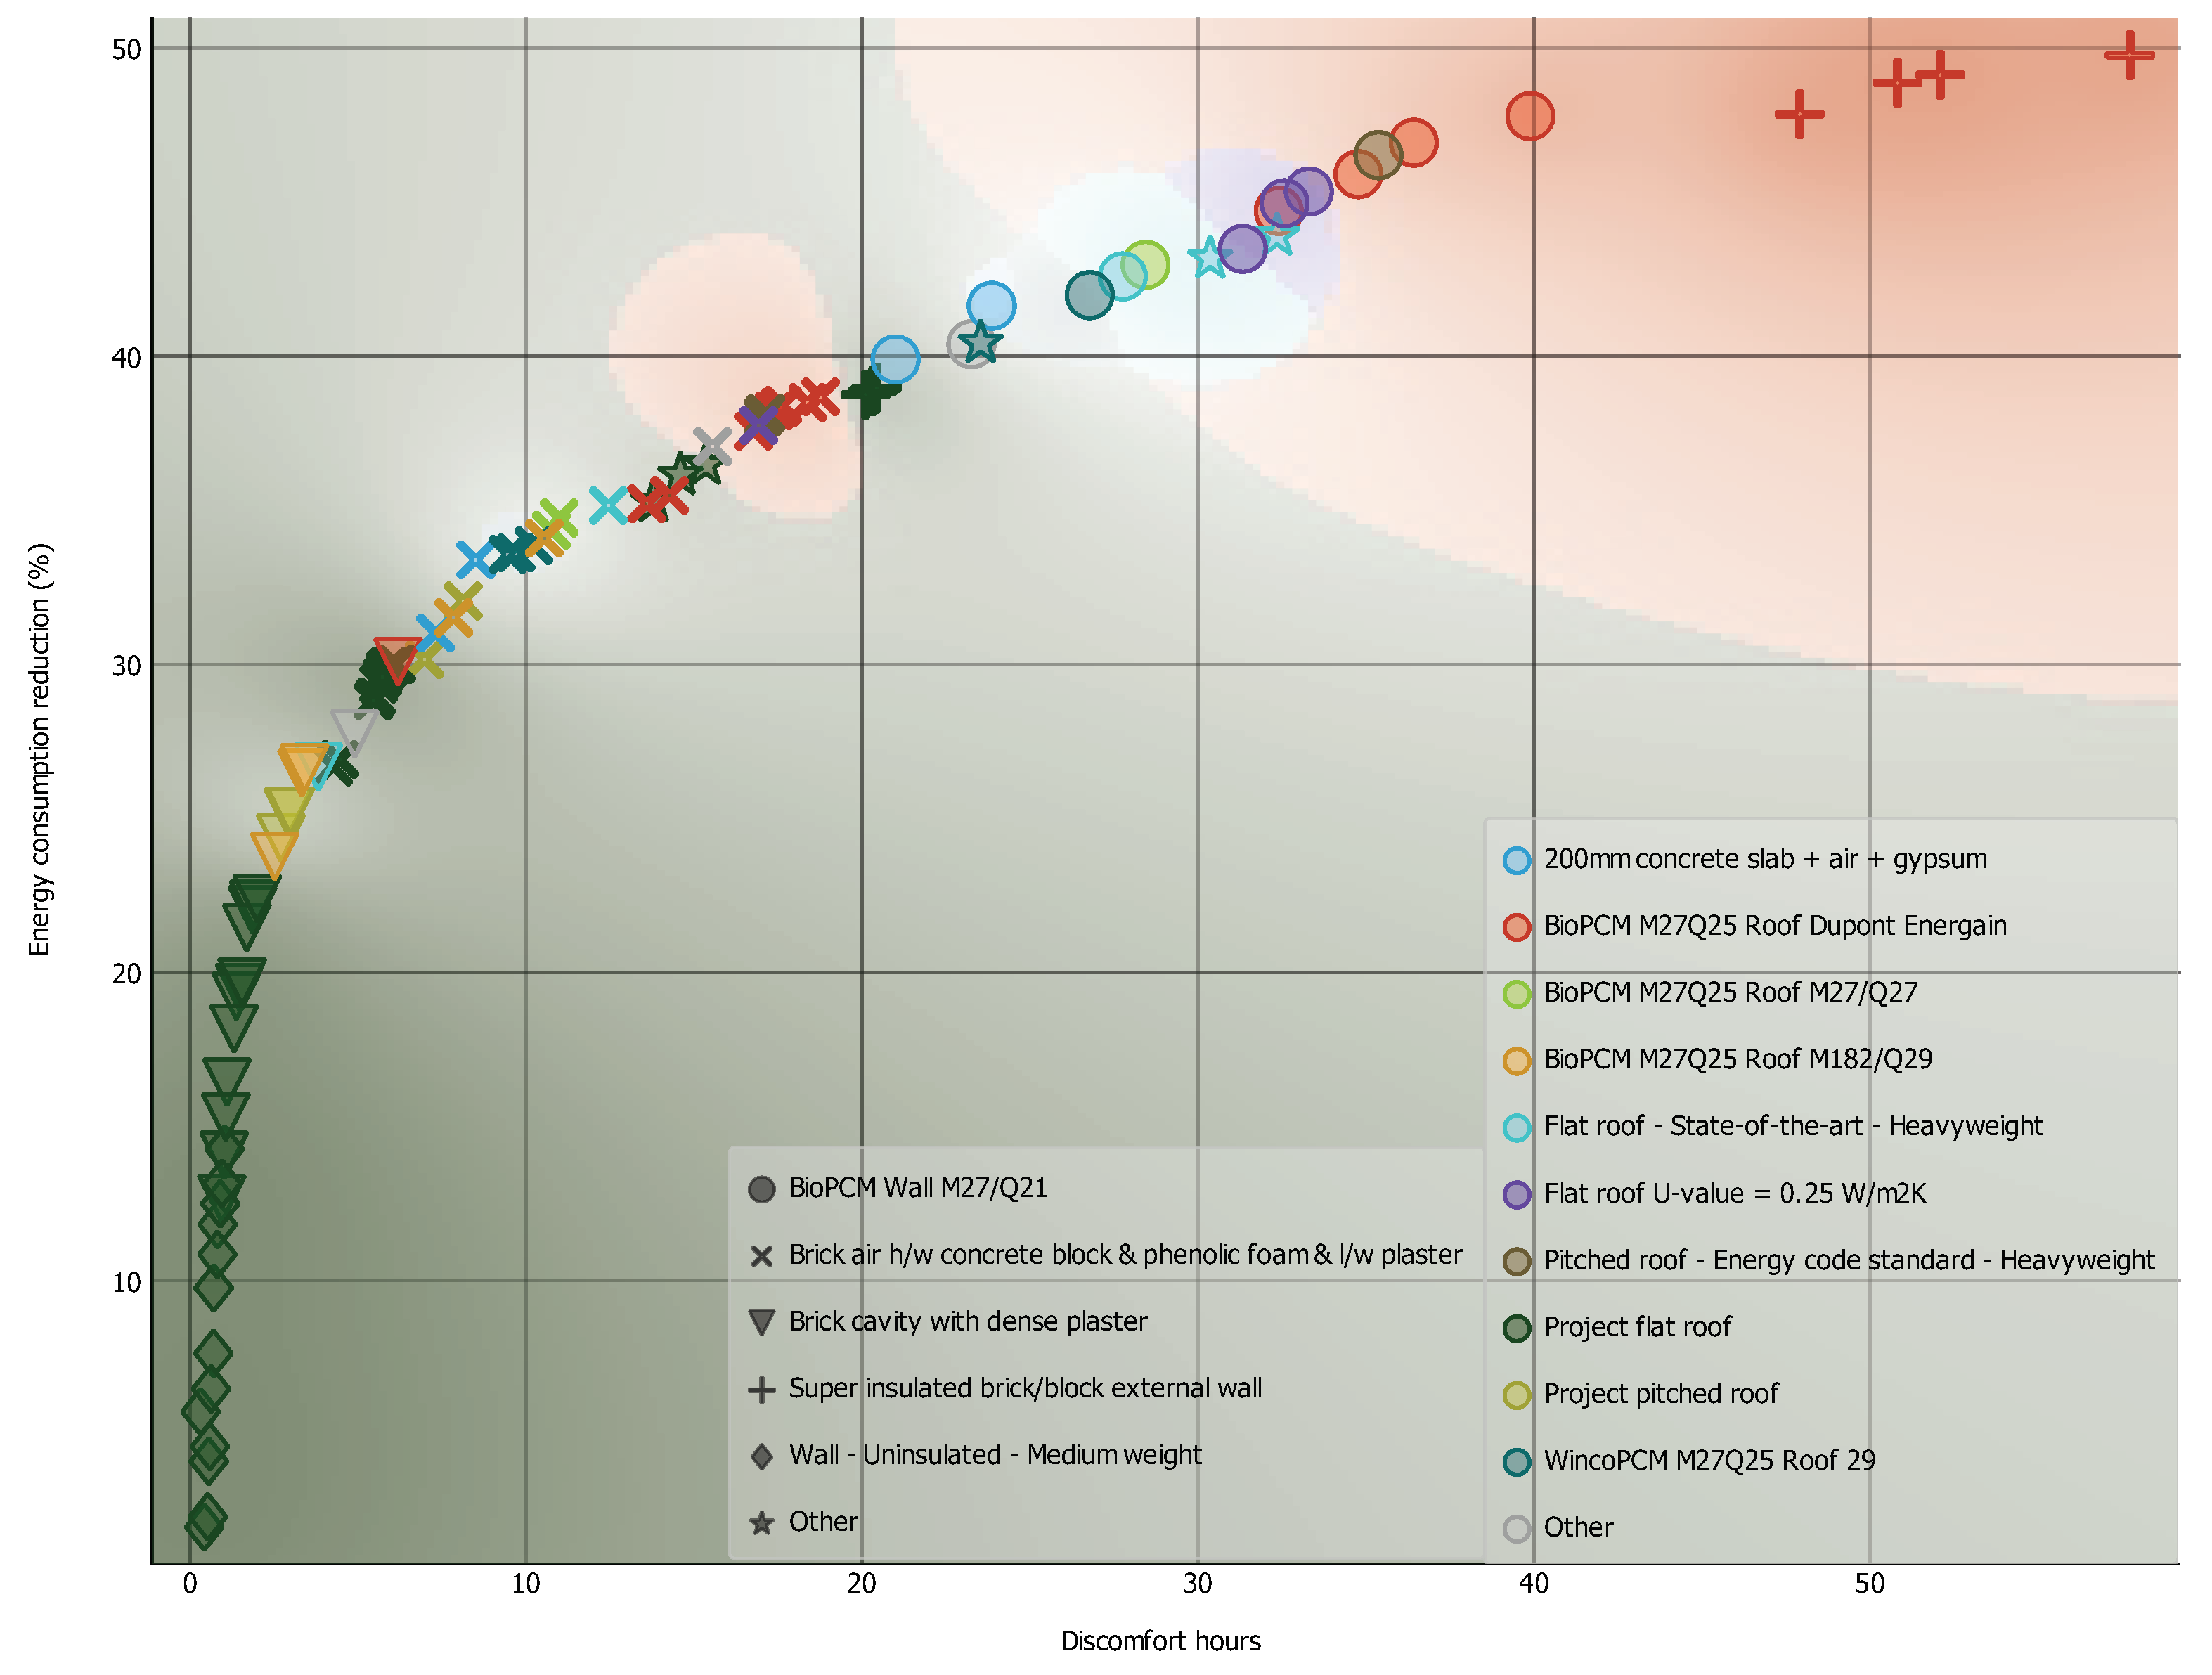
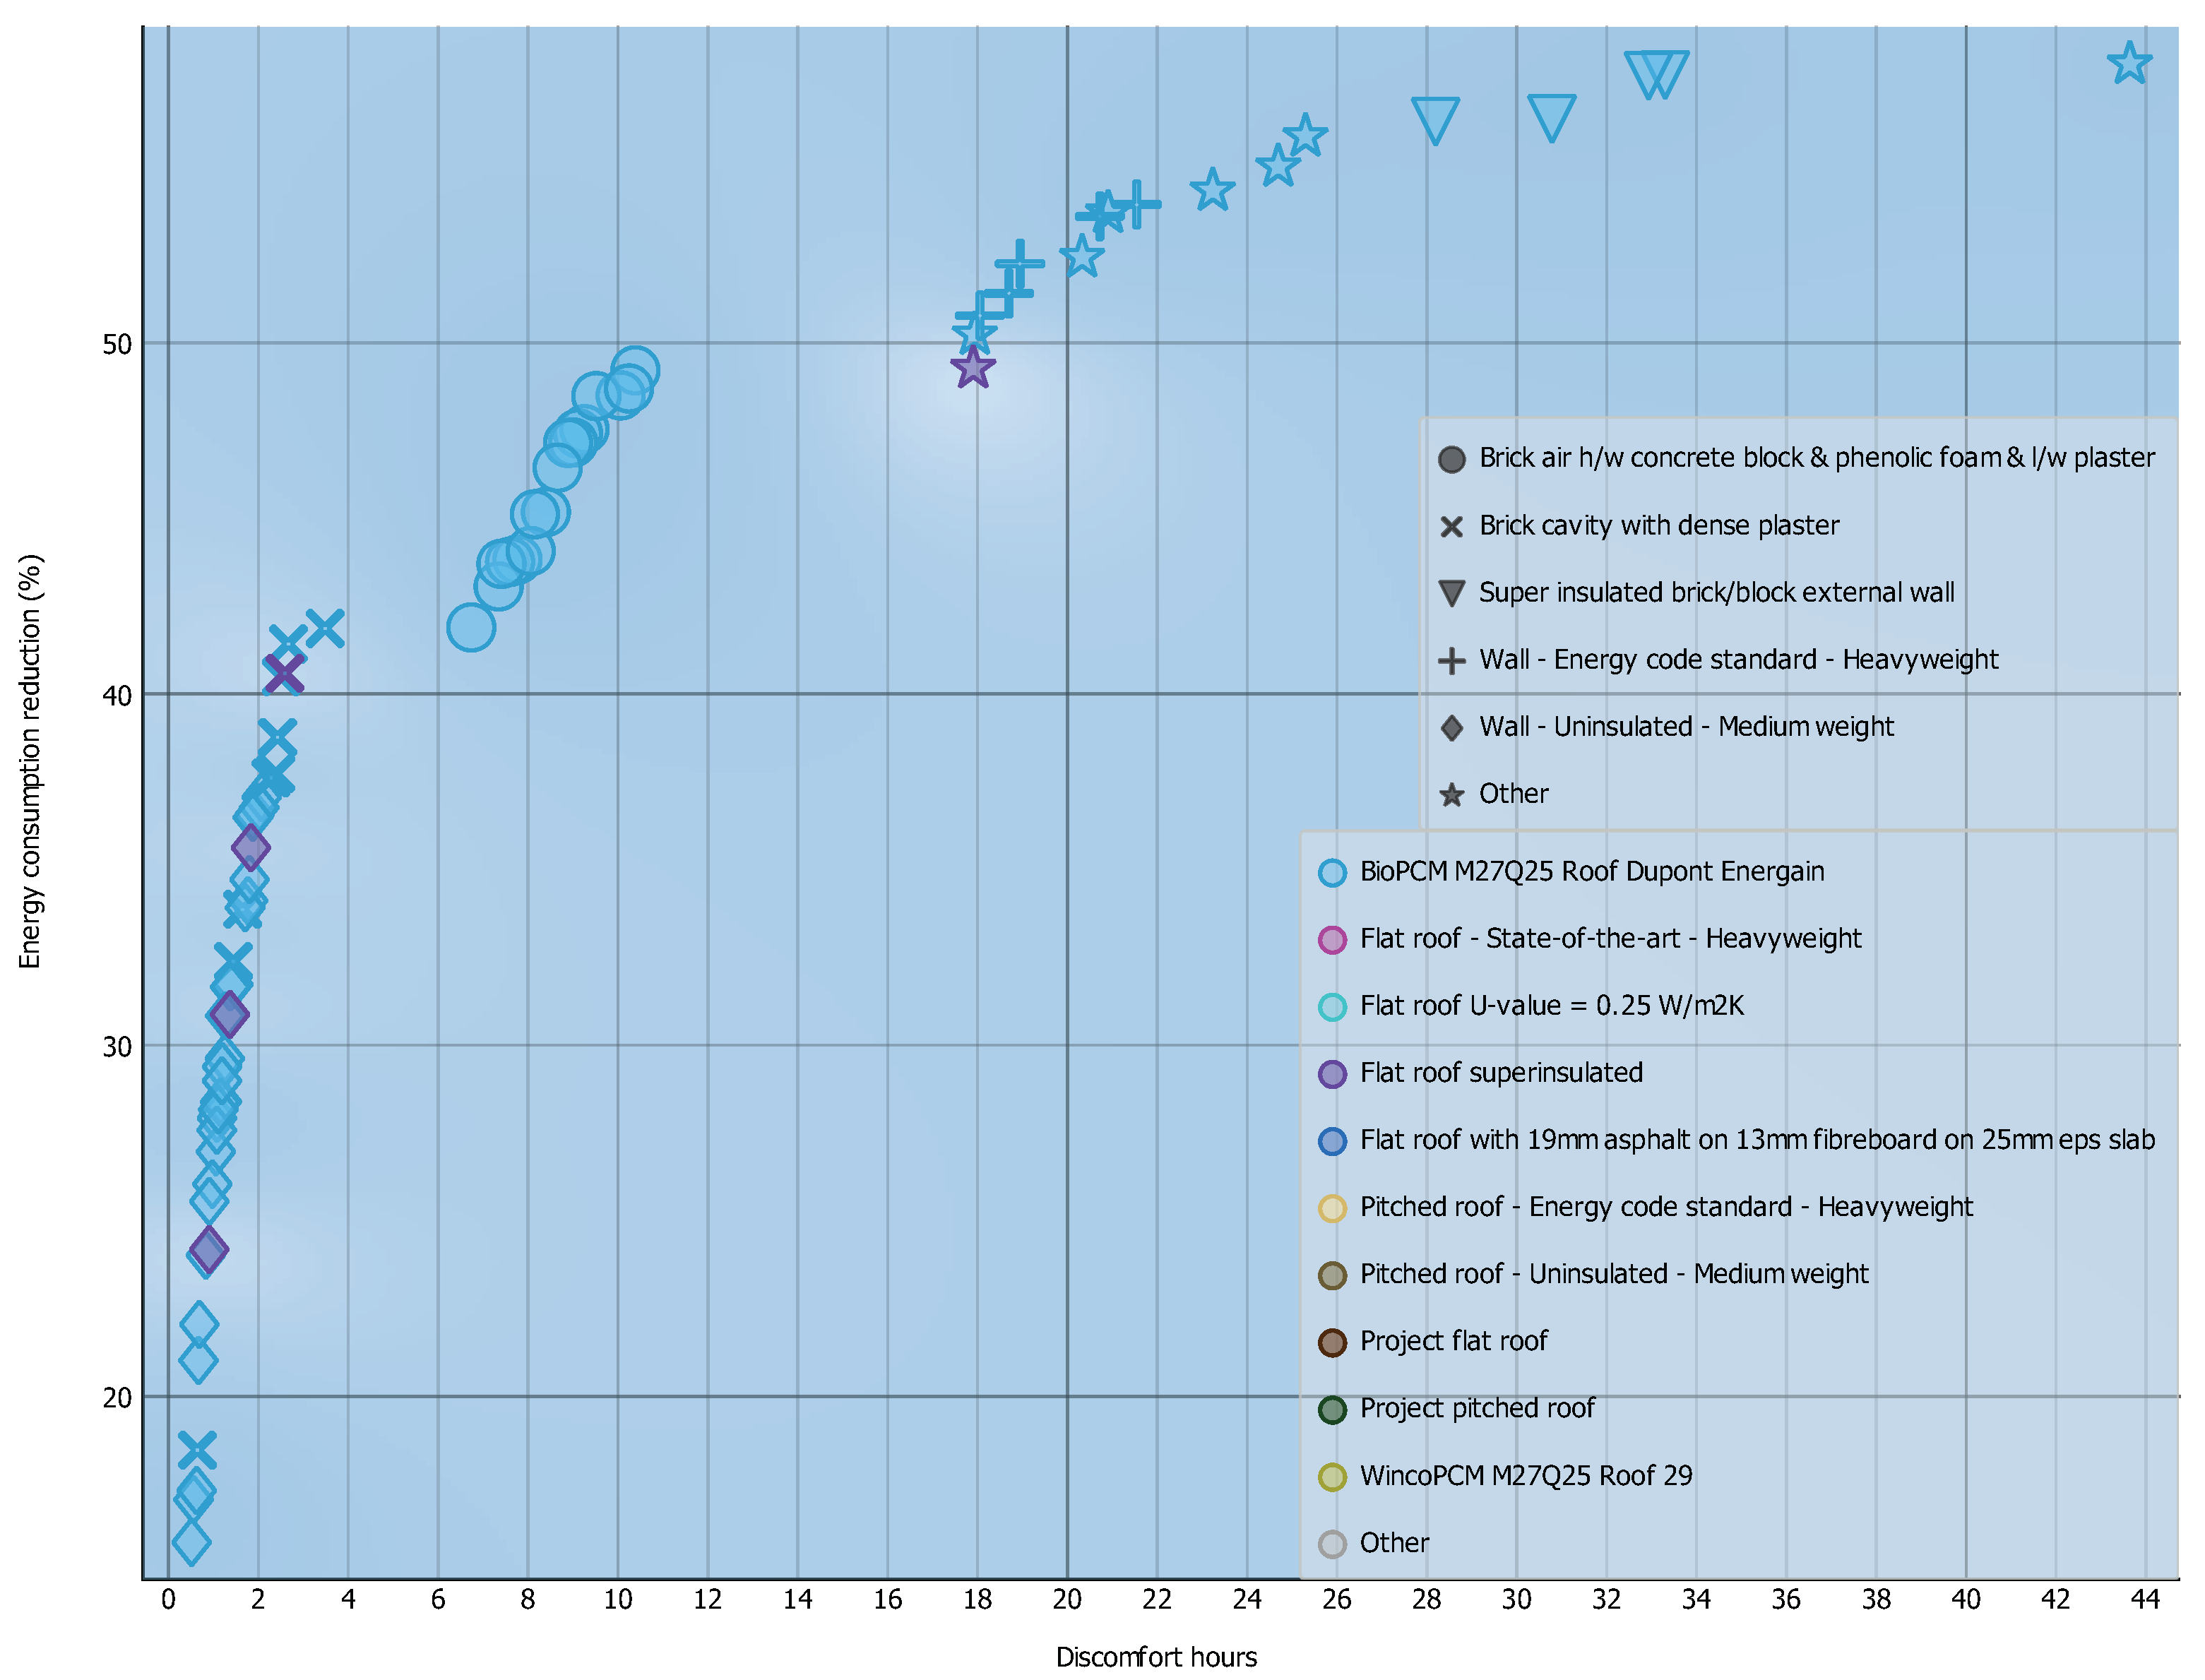
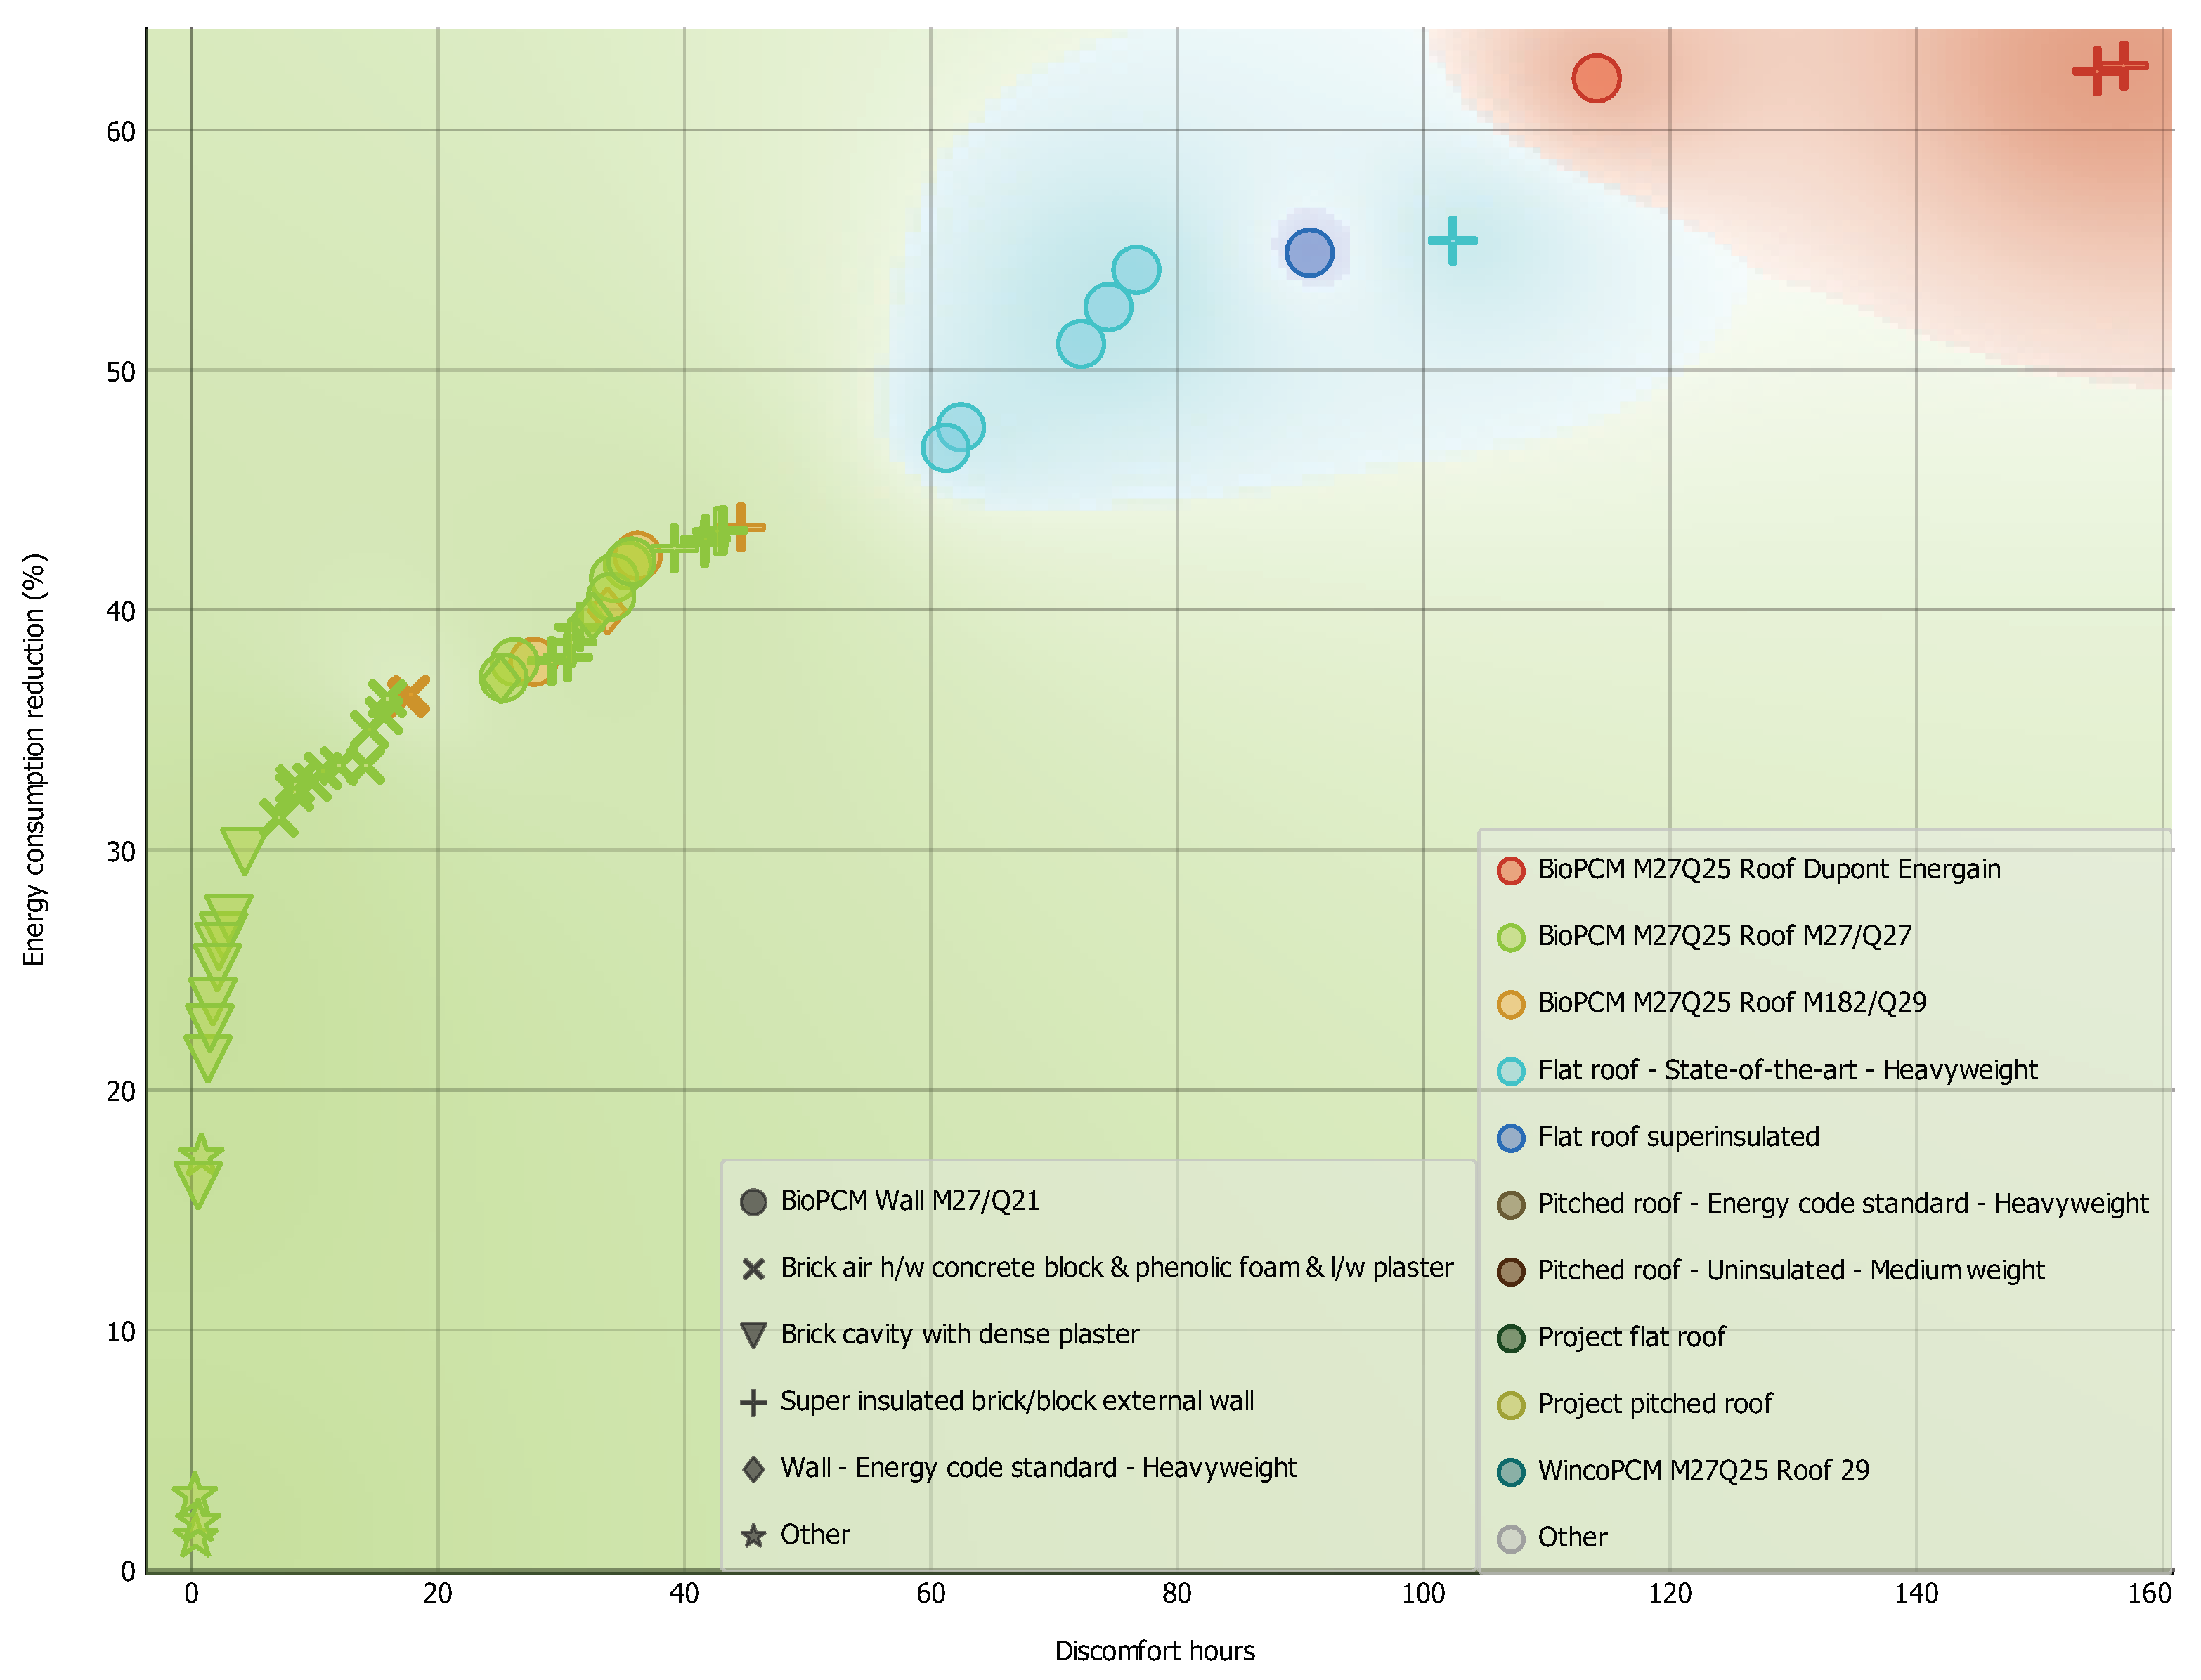
3.1. Performance of Different Envelope Layouts Tested
3.2. Energy Consumption for Cooling and Envelope Layouts
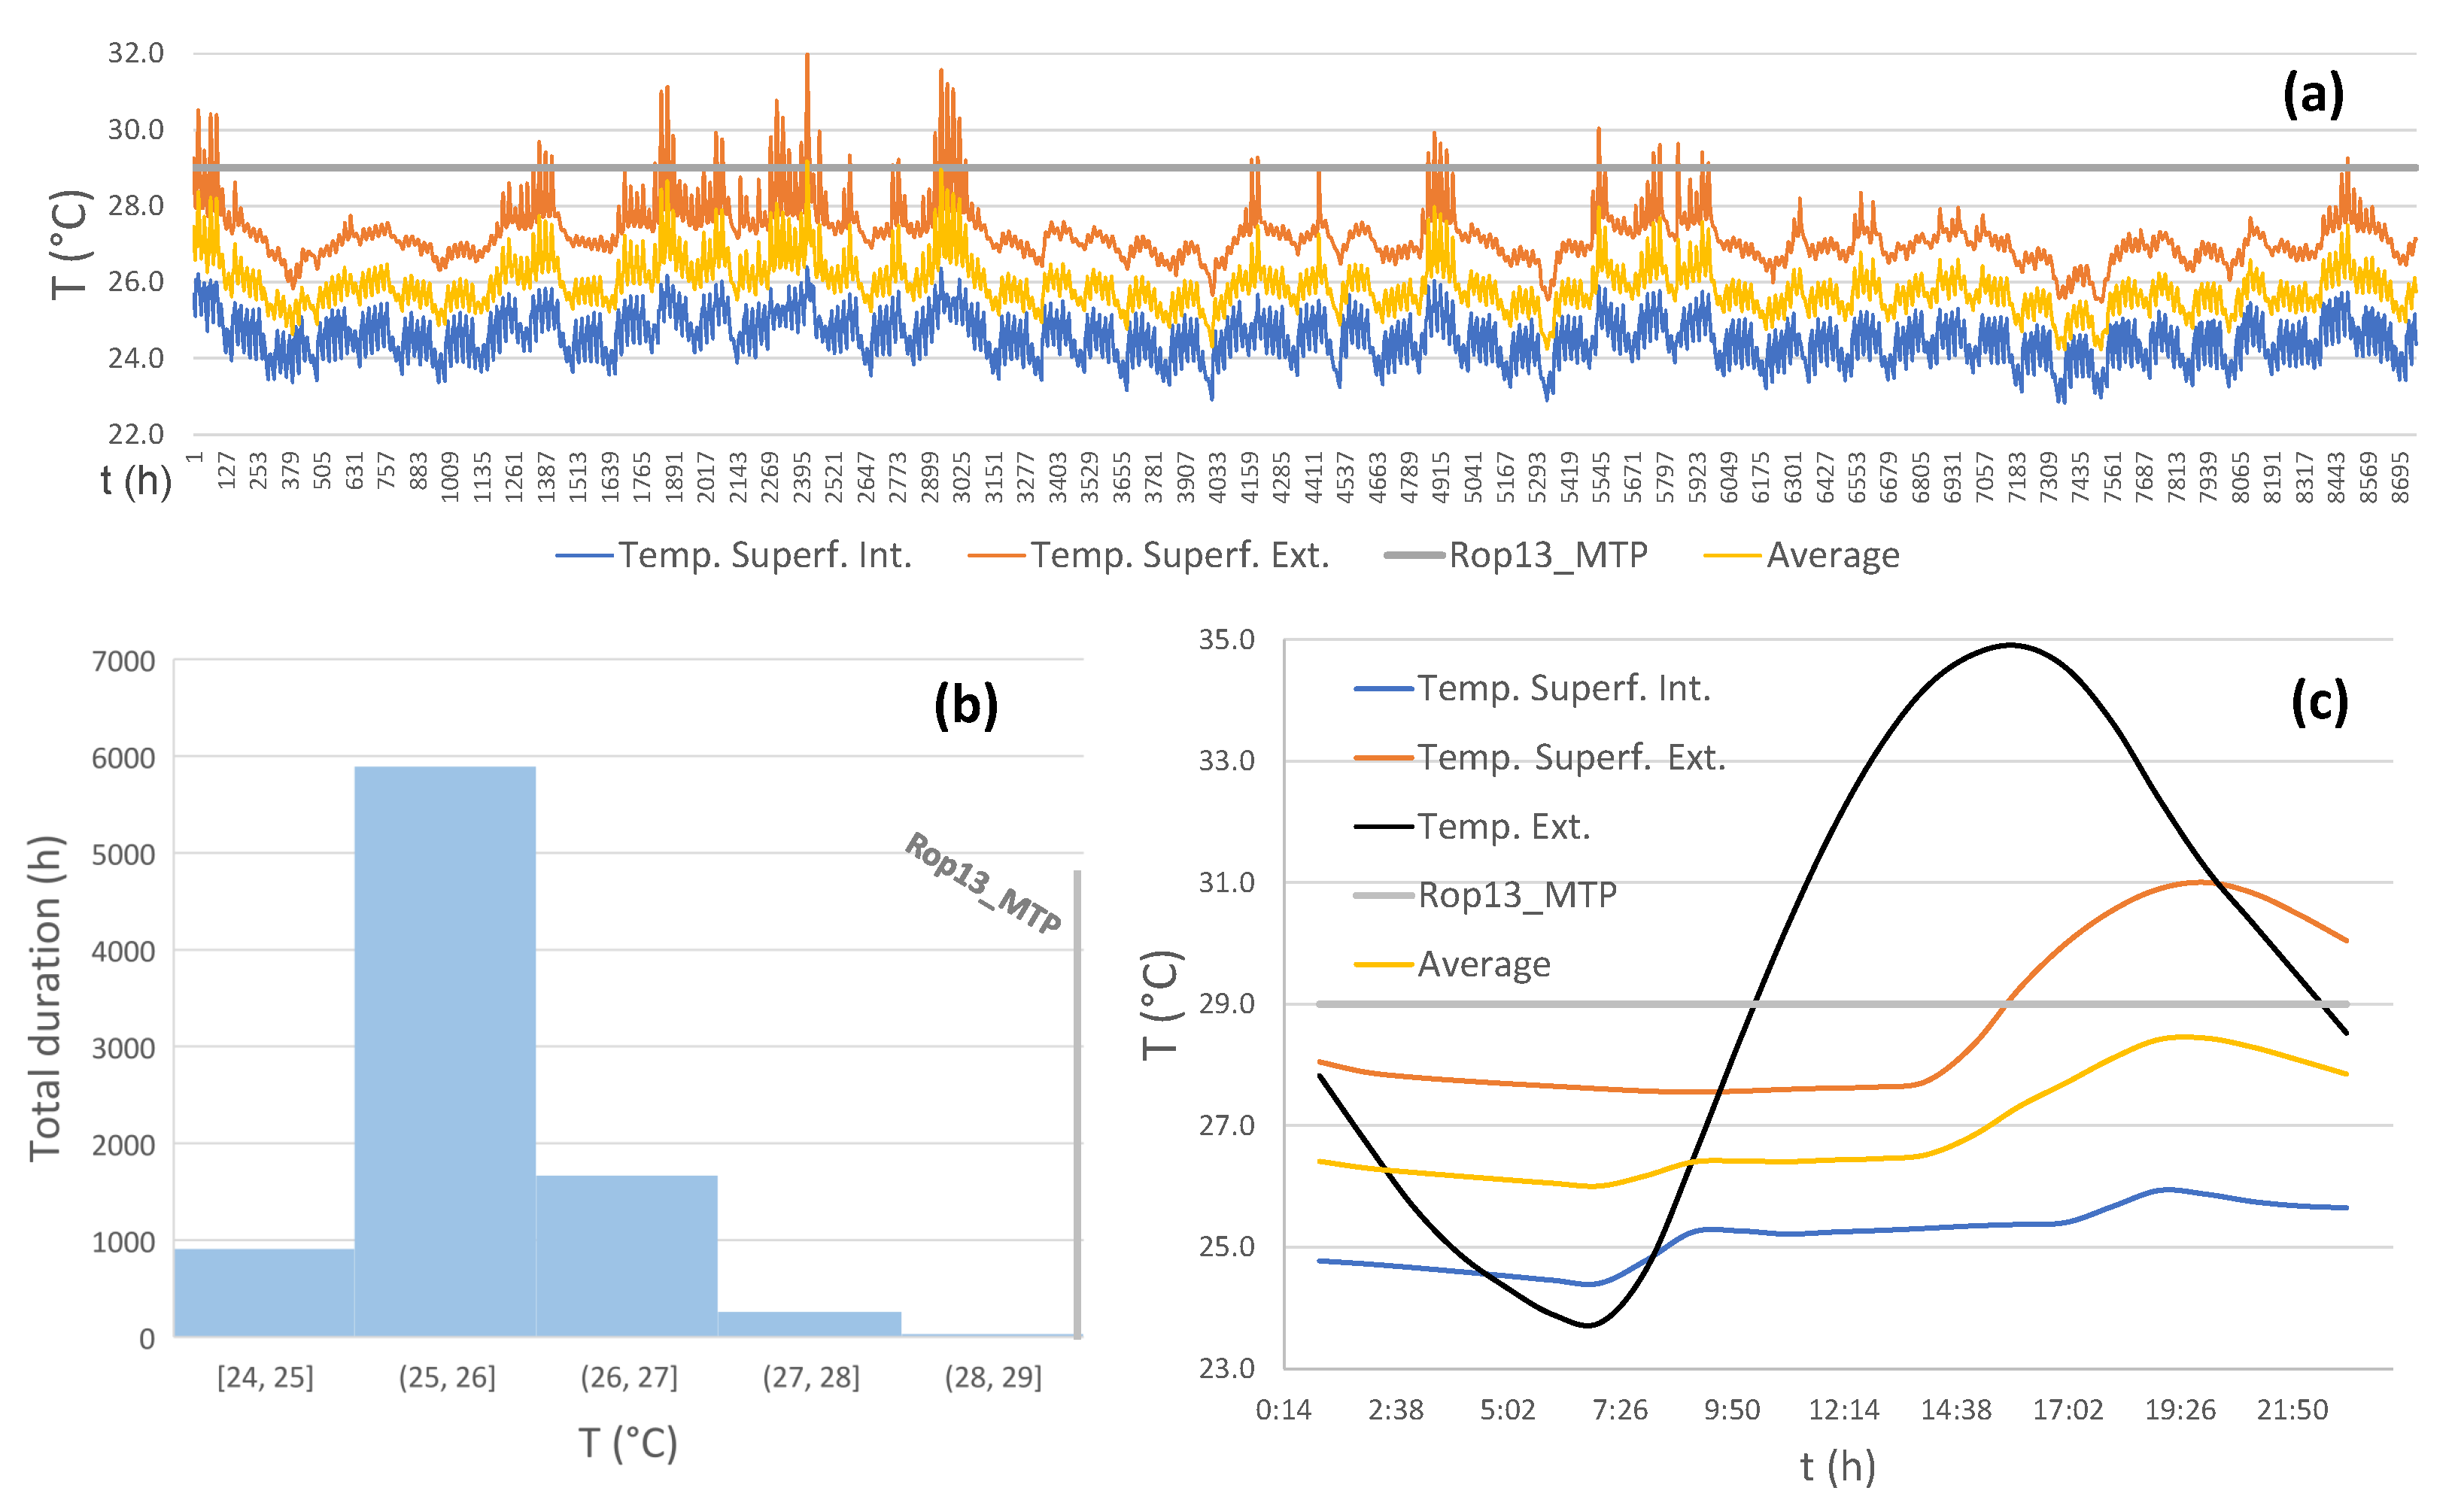
3.3. Phase Change Behavior Analysis
- In the case of H060 + Rop13 + Wop6 + Gop4 + 250 + 30%WWR (Figure 12):
- In the case of H200 + Rop12 + Wop5 + Gop4 + 220° + 30%WWR (Figure 13):
- In the case of OB + Rop14 + Wop15 + Gop4 + 325° + 30%WWR (Figure 14):
4. Discussion
4.1. Statistical Focus
4.2. PCM Layout
4.3. Phase Changing Operation
5. Conclusions
Author Contributions
Funding
Institutional Review Board Statement
Informed Consent Statement
Data Availability Statement
Acknowledgments
Conflicts of Interest
References
- International Renewable Energy Agency (IRENA). Global Renewables Outlook: Energy Transformation 2050; Technical Report; IRENA: Abu Dhabi, United Arab Emirates, 2020. [Google Scholar]
- United Nations Environment Programme. 2021 Global Status Report for Buildings and Construction: Towards a Zero-Emission, Efficient and Resilient Buildings and Construction Sector; Technical Report; United Nations: Nairobi, Kenya, 2021. [Google Scholar]
- Cui, Q. Office Building Energy Saving Potential in Singapore. Master’s Thesis, National University of Singapore, Singapore, 2006. [Google Scholar]
- Fajilla, G.; Chen Austin, M.; Mora, D.; De Simone, M. Assessment of probabilistic models to estimate the occupancy state in office buildings using indoor parameters and user-related variables. Energy Build. 2021, 246, 15. [Google Scholar] [CrossRef]
- Homod, R.Z.; Almusaed, A.; Almssad, A.; Jaafar, M.K.; Goodarzi, M.; Saharif, K.S. Effect of different building envelope materials on thermal comfort and air-conditioning energy savings: A case study in Basra city, Iraq. J. Energy Storage 2021, 34, 20. [Google Scholar] [CrossRef]
- Araúz, J.; Mora, D.; Chen Austin, M. Assessment of Different Envelope Configurations via Optimization Analysis and Thermal Performance Indicators: A Case Study in a Tropical Climate. Sustainability 2022, 13, 2013. [Google Scholar] [CrossRef]
- Laaouatni, A.; Martaj, N.; Bennacer, R.; El Omari, M.; El Ganaoui, M. Phase change materials for improving the building thermal inertia. Energy Procedia 2017, 139, 744–749. [Google Scholar] [CrossRef]
- Singh Rathore, P.K.; Shukla, S.K.; Gupta, N.K. Potential of microencapsulated PCM for energy savings in buildings: A critical review. Sustain. Cities Soc. 2020, 53, 101884. [Google Scholar] [CrossRef]
- DesignBuilder Software Ltd. About DesignBuilder. 2022. Available online: https://DesignBuilder.co.uk/about-us (accessed on 7 June 2022).
- Wu, S.; Yan, T.; Kuai, Z.; Pan, W. Thermal conductivity enhancement on phase change materials for thermal energy storage: A review. Energy Storage Mater. 2020, 25, 251–295. [Google Scholar] [CrossRef]
- Rathore, P.K.S.; Shukla, S.K. An experimental evaluation of thermal behavior of the building envelope using macroencapsulated PCM for energy savings. Renew. Energy 2020, 149, 1300–1313. [Google Scholar] [CrossRef]
- Hakim, I.I.; Putra, N.; Agustin, P.D. Measurement of PCM-concrete composites thermal properties for energy conservation in building material. AIP Conf. Proc. 2020, 2255, 0300661–0300667. [Google Scholar] [CrossRef]
- Cárdenas-Ramírez, C.; Gómez, M.A.; Jaramillo, F.; Cardona, A.F.; Fernández, A.G.; Cabeza, L.F. Experimental steady-state and transient thermal performance of materials for thermal energy storage in building applications: From powder SS-PCMs to SS-PCM-based acrylic plaster. Energy 2022, 250, 123768. [Google Scholar] [CrossRef]
- Rathore, P.K.S.; Shukla, S.K. Enhanced thermophysical properties of organic PCM through shape stabilization for thermal energy storage in buildings: A state of the art review. Energy Build. 2021, 236, 110799. [Google Scholar] [CrossRef]
- U.S. Department of Energy’s Building Techologies Office. EnergyPlus 9.6.0; U.S. Department of Energy’s Building Techologies Office: Washington, DC, USA, 2021.
- Sarri, A.; Bechki, D.; Bouguettaia, H.; Al-saadi, S.N. Effect of using PCMs and shading devices on the thermal performance of buildings in different Algerian climates. A simulation-based optimization. Sol. Energy 2021, 217, 375–389. [Google Scholar] [CrossRef]
- Jia, J.; Liu, B.; Ma, L.; Wang, H.; Li, D.; Wang, Y. Case Studies in Thermal Engineering Energy saving performance optimization and regional adaptability of prefabricated buildings with PCM in different climates. Case Stud. Therm. Eng. 2021, 26, 101164. [Google Scholar] [CrossRef]
- Sangwan, P.; Mehdizadeh-rad, H.; Wai, A.; Ng, M.; Atiq, M.; Rehman, U.; Nnachi, R.C. Performance Evaluation of Phase Change Materials to Reduce the Cooling Load of Buildings in a Tropical Climate. Renew. Energy 2022, 148, 3171. [Google Scholar] [CrossRef]
- Kameni, M.; Christophe, J.; Noelson, V.; Saadi, I.; Kenfack, H.; Andrianaharinjaka, A.z.F.R.; Foumouo, D.; Barahimo, J.; Reiter, S. Application of phase change materials, thermal insulation, and external shading for thermal comfort improvement and cooling energy demand reduction in an o ffi ce building under di ff erent coastal tropical climates. Sol. Energy 2020, 207, 458–470. [Google Scholar] [CrossRef]
- Bimaganbetova, M.; Memon, S.A.; Sheriyev, A. Performance evaluation of phase change materials suitable for cities representing the whole tropical savanna climate region. Renew. Energy 2020, 148, 402–416. [Google Scholar] [CrossRef]
- Berrocal, D.; Aranda, R.; Santamaría, S.; Vigil, A.; Chen Austin, M. El cambio de fase como estrategia pasiva: Evaluación del rendimiento térmico-energético en edificaciones en Panamá. I+D Tecnológico 2022, 177, 12. [Google Scholar] [CrossRef]
- Saxena, R.; Rakshit, D.; Kaushik, S.C. Experimental assessment of Phase Change Material ( PCM ) embedded bricks for passive conditioning in buildings. Renew. Energy 2020, 149, 587–599. [Google Scholar] [CrossRef]
- Yu, J.; Yang, Q.; Ye, H.; Luo, Y.; Huang, J. Thermal performance evaluation and optimal design of building roof with outer-layer shape-stabilized PCM. Renew. Energy 2020, 145, 2538–2549. [Google Scholar] [CrossRef]
- Bhamare, D.K.; Rathod, M.K.; Banerjee, J. Numerical model for evaluating thermal performance of residential building roof integrated with inclined phase change material (PCM) layer. J. Build. Eng. 2020, 28, 101018. [Google Scholar] [CrossRef]
- Imghoure, O.; Belouaggadia, N.; Ezzine, M.; Lbibb, R.; Younsi, Z. Performance evaluation of phase change materials for thermal comfort in a hot climate region. Appl. Therm. Eng. 2021, 186, 116509. [Google Scholar] [CrossRef]
- Kottek, M.; Grieser, J.; Beck, C.; Rudolf, B.; Rubel, F. World Map of the Köppen-Geiger climate classification updated. Meteorol. Zeitschrif 2006, 15, 259–263. [Google Scholar] [CrossRef]
- Hasan, M.; Alam, S.; Ahmed, D.H. Effect of phase change material on the heat transfer rate of different building materials. AIP Conf. Proc. 2017, 1919, 20029. [Google Scholar] [CrossRef] [Green Version]
- De León, L.; Student, E.; Cedeño, M.; Mora, D.; Chen Austin, M. Towards a Definition for Zero Energy Districts in Panama: A Numerical Assessment of Passive and Active Strategies. In Proceedings of the 9th LACCEI International Multi-Conference for Engineering, Education, and Technology: “Prospective and trends in technology and skills for sustainable social development”, “Leveraging emerging technologies to construct the future”, Virtual Edition, 9–10 December 2021. [Google Scholar] [CrossRef]
- Zhang, Y.; Jankovic, L. JEA, An Interactive Optimisation Engine for Building Energy Performance Simulation. In Proceedings of the 15th IBPSA Conference, San Francisco, CA, USA, 7–9 August 2017; p. 2232. [Google Scholar] [CrossRef]
- U.S. Deparment of Energy. EnergyPlus-Engineering Reference. Available online: https://doi.org/https://energyplus.net/assets/nrel_custom/pdfs/pdfs_v22.1.0/EngineeringReference.pdf (accessed on 20 June 2022).


| Building | Floor Area (m2) | WWR (%) | Orientation () | U-Value (W/m2K) | Occupancy Density (p/m2) | ||||
|---|---|---|---|---|---|---|---|---|---|
| External Walls | Internal Partitions | Floor | Roof | Windows | |||||
| H060 | 60 | 30 | 180 | 3.859 | 2.618 | 3.487 | 7.071 | 5.778 | 0.111 |
| H100 | 100 | ||||||||
| H200 | 200 | ||||||||
| OB | 375 | 1.486 | 1.96 | 0.05 | |||||
| Energy Usage | Profiles | Value | |
|---|---|---|---|
| Houses | Office Building | ||
| Occupancy | 8:00–19:00 | Density | |
| Natural ventilation | 20:00–7:00 | Calculated | |
| Infiltration (ach/h) | 24/7 | 0.7 | |
| Lightning (W/m2-100 lux) | 19:00–0:00 | 3.3 | |
| Air conditioning (Splits) | 8:00–19:00 | COP = 3.0 | |
| Household equipment (W/m2) | 24/7 | 11.77 | |
| Month Critical Day | Tmax (°C) Hour | Tmin (°C) Hour | HRmax (%) Hour | HRmin (%) Hour | Wind Speed (m/s) | Wind Direction () |
|---|---|---|---|---|---|---|
| 3 January | 35 15:00 | 23.9 6:00 | 94 5:00 | 44 15:00 | 0.43 | 126 |
| 20 February | 34.6 15:00 | 22.2 6:00 | 93 6:00 | 40 15:00 | 2.77 | 85.77 |
| 17 March | 35.6 15:00 | 24.9 6:00 | 73 6:00 | 36 16:00 | 2.3 | 49 |
| 11 April | 35.3 15:00 | 24.8 6:00 | 82 24:00 | 44 16:00 | 1.75 | 87 |
| 20 May | 34.8 15:00 | 24.5 6:00 | 90 6:00 | 53 16:00 | 0.87 | 83.3 |
| 23 June | 32.8 15:00 | 23.4 6:00 | 94 6:00 | 58 15:00 | 0.45 | 108.25 |
| 21 July | 35.5 16:00 | 24.3 6:00 | 97 4:00 | 49 16:00 | 0.3 | 89.3 |
| 19 August | 34.7 15:00 | 24.1 6:00 | 95 5:00 | 52 15:00 | 3.9 | 188 |
| 1 September | 32.5 15:00 | 23 6:00 | 98 24:00 | 60 15:00 | 2.1 | 83 |
| 20 October | 32.5 15:00 | 23 6:00 | 96 6:00 | 62 14:00 | 2.33 | 90.67 |
| 11 November | 32.9 15:00 | 23.7 6:00 | 94 5:00 | 61 13:00 | 2.55 | 80 |
| 16 December | 34.3 15:00 | 24.6 6:00 | 94 7:00 | 50 16:00 | 4.2 | 34.5 |
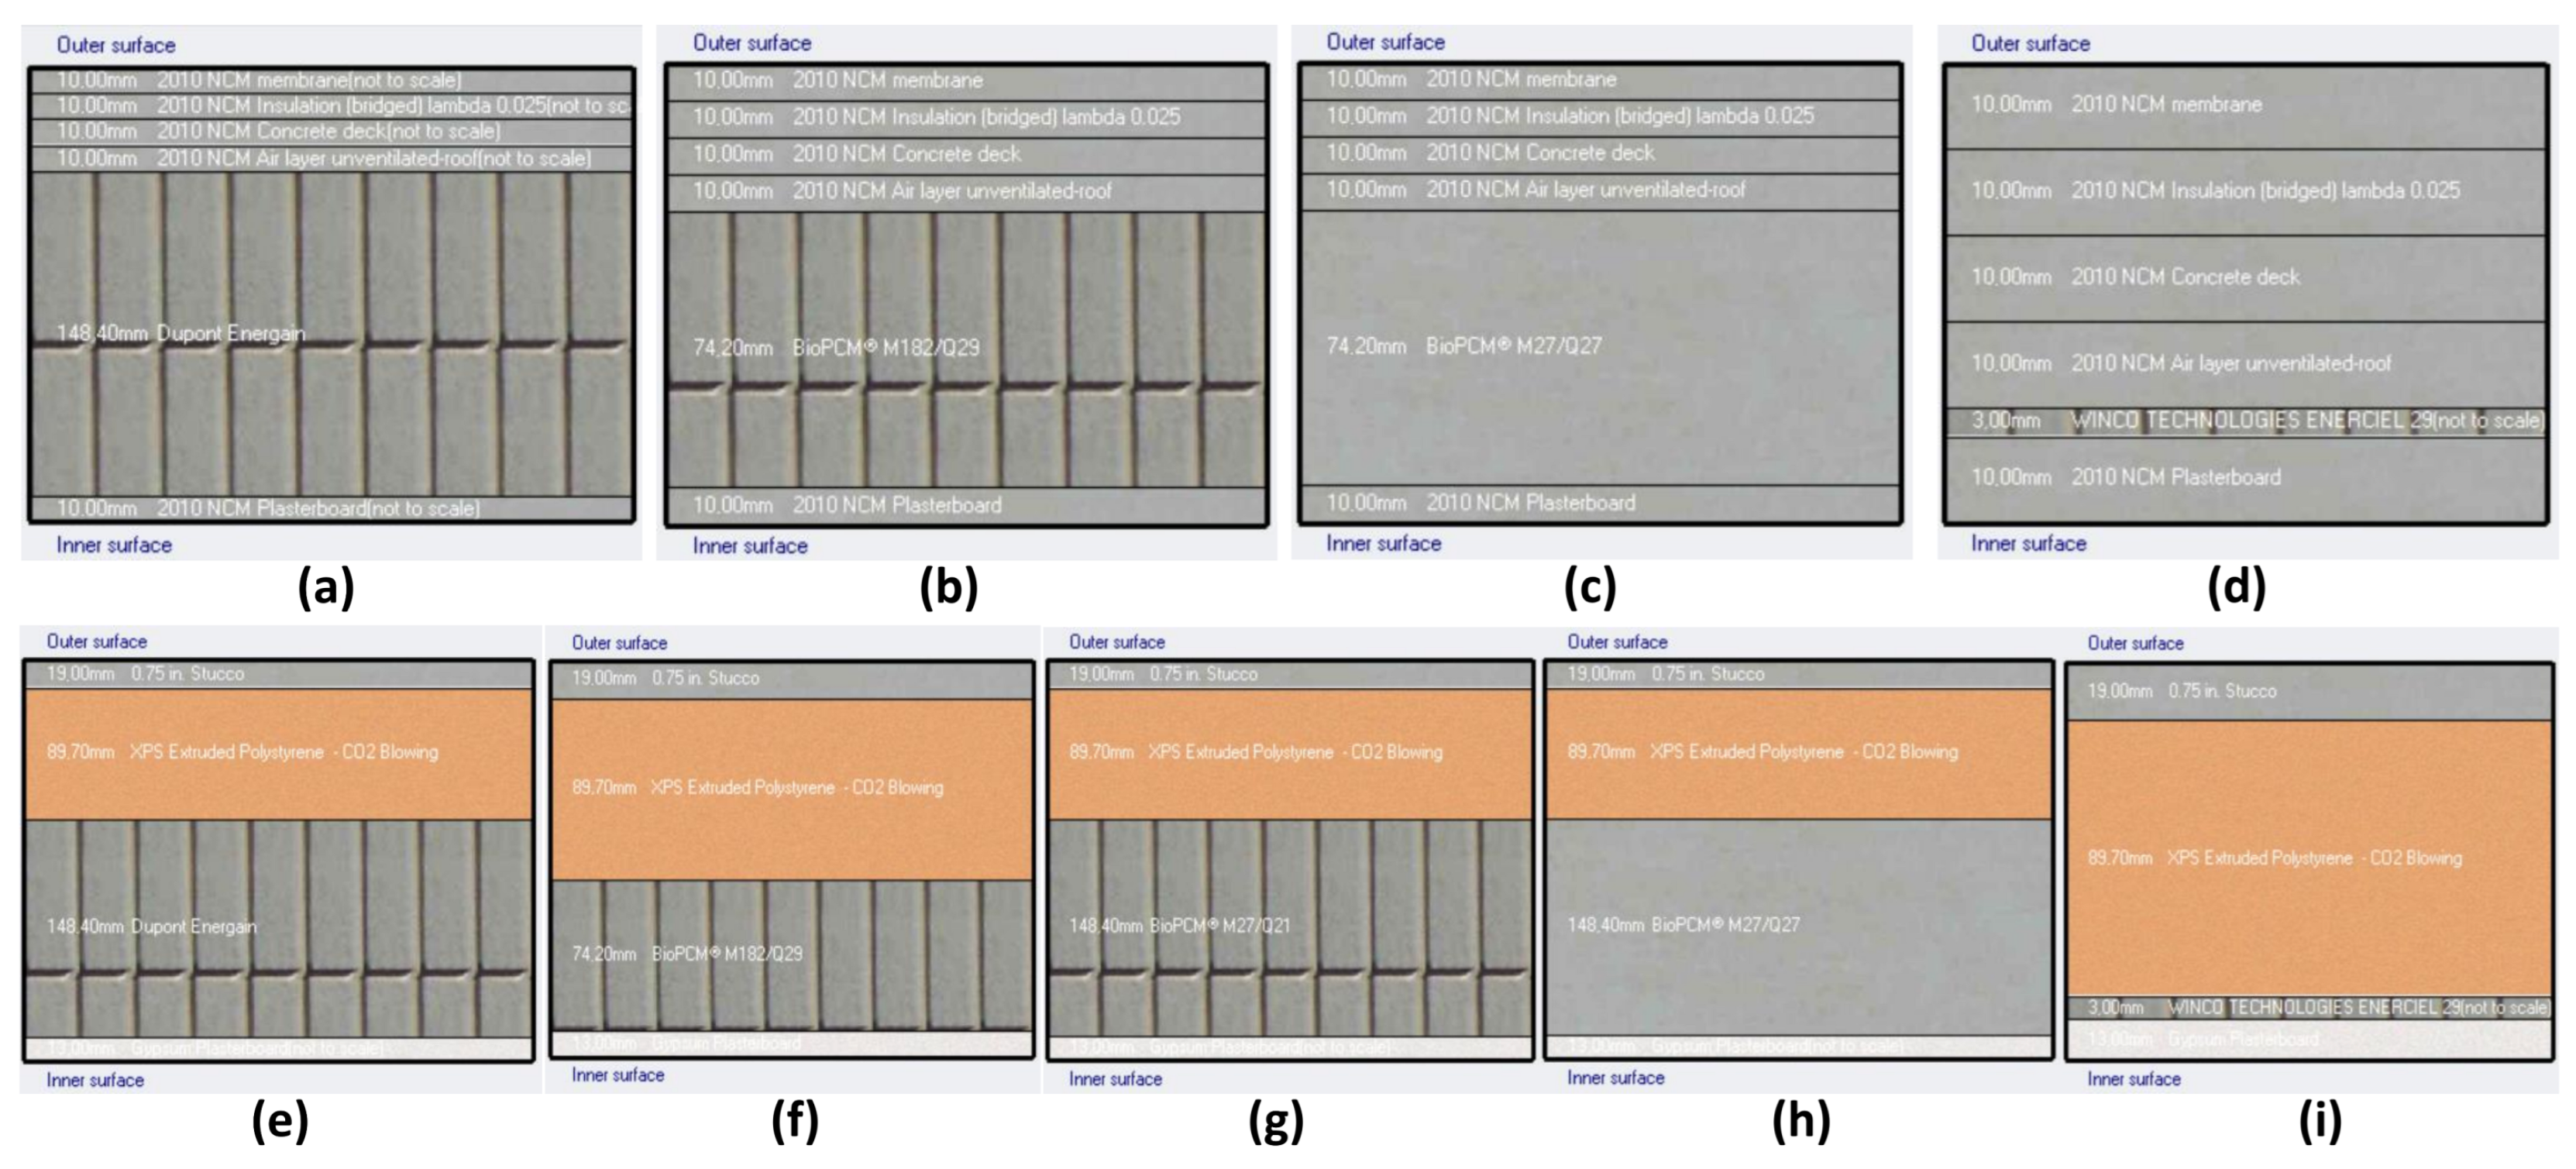
| Component | Proposed Options as in DB | e (m) | U (W/m2-K) | Justification | Nomenclature |
|---|---|---|---|---|---|
| Roof | Original roof | 0.005 | 7.143 | Reference building | RRB |
| 25 mm Stone Chippings, 19 mm Asphalt, 40 mm Roof Screed | 0.084 | 3.439 | Available layout in local market | Rop1 | |
| 19 mm Asphalt, on 13 mm fiberboard on 25 mm eps slab | 0.057 | 0.991 | Rop2 | ||
| Flat roof 0.25 | 0.154 | 0.252 | Rop3 | ||
| Pitched roof Energy code standard—Heavyweight | 0.212 | 0.211 | Rop4 | ||
| State-of-the-art—Heavyweight | 0.18 | 0.486 | Rop5 | ||
| 0.5 metal zinc, 75 mm EPS (Not in DB) | 0.076 | 0.496 | Rop6 | ||
| Superinsulated | 0.364 | 0.258 | Rop7 | ||
| Pitched roof Uninsulated Medium weight | 0.05 | 2.93 | Rop8 | ||
| 200 mm concrete slab + air + gypsum | 0.72 | 1.486 | Rop9 | ||
| Clay tiles (25 mm) on airgap (20 mm) on roofing felt 5 mm | 0.05 | 2.93 | Rop10 | ||
| Uninsulated heavyweight | 0.132 | 1.546 | Rop11 | ||
| BioPCM M27Q25 Roof Dupont Energain | 0.198 | 0.113 | From literature | Rop12 | |
| BioPCM Roof M182/Q29 | 0.124 | 0.991 | Rop13 | ||
| BioPCM Roof M27/Q27 | 0.124 | 0.991 | Rop14 | ||
| WincoPCM Roof 29 | 0.053 | 1.519 | Rop15 | ||
| PCM-based roof layouts in inverse position | − | − | Rop16–Rop19 | ||
| Walls | Original walls | 0.120 | 3.859 | Reference building | WRB |
| State-of-the-art—Heavyweight | 0.293 | 0.350 | Available layout in local market | Wop1 | |
| Super insulated brick/block | 0.425 | 0.156 | Wop2 | ||
| Lightweight superinsulated | 0.102 | 0.375 | Wop3 | ||
| Energy code standard—Heavyweight in DB | 0.263 | 0.500 | Wop4 | ||
| Uninsulated medium weight | 0.213 | 2.071 | Wop5 | ||
| Brick air m/w concrete block & phenolic foam & l/w plas | 0.268 | 0.825 | Wop6 | ||
| Brick air uf insulation l/w concrete block & l/w plaster | 0.268 | 0.596 | Wop7 | ||
| Lightweight concrete block air gap & plasterboard | 0.236 | 0.708 | Wop8 | ||
| Brick cavity with dense plaster | 0.268 | 1.562 | Wop9 | ||
| Brick air l/w concrete block & l/w plaster | 0.273 | 1.562 | Wop10 | ||
| BioPCM Wall Dupont Energain | 0.27 | 0.09 | From literature | Wop11 | |
| BioPCM Wall M182/Q29 | 0.196 | 0.308 | Wop12 | ||
| BioPCM Wall M27/Q27 | 0.270 | 0.277 | Wop13 | ||
| WincoPCM Wall 29 | 0.125 | 0.345 | Wop14 | ||
| BioPCM Wall M27/Q21 | 0.270 | 0.277 | Wop15 | ||
| PCM-based wall layouts in inverse position | − | − | Wop16 –Wop19 | ||
| Windows (glazing) | Original windows (Sgl Clr 6 mm as in DB) | 6.121 | Reference building | GRB | |
| Dbl Clr 4 mm/16 mm Air | 2.715 | Gop2 | |||
| Dbl Clr 6 mm/12 mm Air | 2.685 | Gop3 | |||
| Sgl Bronze 6 mm | 6.121 | Gop6 | |||
| Dbl Solar Grey 6 mm/12 mm Air | 3.157 | Gop7 | |||
| Dbl Clr 4 mm/12 mm Air | 2.725 | Gop8 |
| Roof Construction | External Wall Construction | Total | |||||
|---|---|---|---|---|---|---|---|
| Wop6 | Wop10 | Wop2 | Wop4 | Wop1 | Wop5 | ||
| Rop9 | 3 | 0 | 3 | 2 | 1 | 0 | 9 |
| Rop12 | 3 | 4 | 2 | 2 | 2 | 0 | 13 |
| Rop14 | 9 | 1 | 0 | 0 | 2 | 3 | 15 |
| Rop13 | 3 | 7 | 0 | 0 | 1 | 8 | 19 |
| Rop5 | 0 | 1 | 2 | 0 | 0 | 0 | 3 |
| Rop3 | 0 | 1 | 4 | 1 | 0 | 0 | 6 |
| Rop7 | 4 | 1 | 2 | 2 | 1 | 0 | 10 |
| Rop4 | 2 | 1 | 2 | 3 | 1 | 0 | 9 |
| RRB | 3 | 1 | 0 | 2 | 3 | 4 | 13 |
| Rop15 | 3 | 0 | 0 | 0 | 0 | 0 | 3 |
| Total | 30 | 17 | 15 | 12 | 11 | 15 | 100 |
| Roof Construction | External Wall Construction | Total | ||||||
|---|---|---|---|---|---|---|---|---|
| Wop15 | Wop6 | Wop10 | Wop2 | Wop4 | Wop1 | Wop5 | ||
| Rop9 | 2 | 2 | 0 | 0 | 0 | 0 | 0 | 4 |
| Rop12 | 4 | 8 | 1 | 4 | 0 | 0 | 0 | 17 |
| Rop14 | 1 | 2 | 0 | 0 | 0 | 0 | 0 | 3 |
| Rop13 | 0 | 2 | 3 | 0 | 0 | 0 | 0 | 5 |
| Rop1 | 1 | 0 | 0 | 0 | 0 | 0 | 0 | 1 |
| Rop5 | 1 | 1 | 1 | 0 | 1 | 1 | 0 | 5 |
| Rop3 | 3 | 1 | 0 | 0 | 0 | 0 | 0 | 4 |
| Rop7 | 0 | 1 | 1 | 0 | 0 | 0 | 0 | 2 |
| Rop4 | 1 | 2 | 0 | 0 | 0 | 0 | 0 | 3 |
| RRB | 0 | 14 | 15 | 4 | 3 | 0 | 13 | 49 |
| Rop15 | 1 | 3 | 0 | 0 | 1 | 0 | 0 | 5 |
| Total | 14 | 36 | 21 | 8 | 5 | 1 | 13 | 98 |
| Roof Construction | External Wall Construction | Total | ||||||||
|---|---|---|---|---|---|---|---|---|---|---|
| Wop11 | Wop15 | Wop6 | Wop7 | Wop9 | Wop2 | Wop4 | Wop1 | Wop5 | ||
| Rop12 | 1 | 3 | 17 | 1 | 9 | 4 | 5 | 2 | 27 | 69 |
| Rop7 | 0 | 1 | 0 | 0 | 1 | 0 | 0 | 0 | 3 | 5 |
| Total | 1 | 4 | 17 | 1 | 10 | 4 | 5 | 2 | 30 | 74 |
| Roof Construction | External Wall Construction | Total | ||||||
|---|---|---|---|---|---|---|---|---|
| Wop15 | Wop6 | Wop9 | WRB | Wop2 | Wop4 | Wop5 | ||
| Rop12 | 1 | 0 | 0 | 0 | 2 | 0 | 0 | 3 |
| Rop14 | 6 | 10 | 9 | 3 | 9 | 3 | 1 | 41 |
| Rop13 | 2 | 3 | 0 | 0 | 1 | 1 | 0 | 7 |
| Rop5 | 5 | 0 | 0 | 0 | 1 | 0 | 0 | 6 |
| Rop7 | 1 | 0 | 0 | 0 | 0 | 0 | 0 | 1 |
| Total | 15 | 13 | 9 | 3 | 13 | 4 | 1 | 58 |
Publisher’s Note: MDPI stays neutral with regard to jurisdictional claims in published maps and institutional affiliations. |
© 2022 by the authors. Licensee MDPI, Basel, Switzerland. This article is an open access article distributed under the terms and conditions of the Creative Commons Attribution (CC BY) license (https://creativecommons.org/licenses/by/4.0/).
Share and Cite
Chen Austin, M.; Araúz, J.; Mora, D. Numerical Assessment of Different Phase Change Materials as a Passive Strategy to Reduce Energy Consumption in Buildings under Tropical Climates. Buildings 2022, 12, 906. https://doi.org/10.3390/buildings12070906
Chen Austin M, Araúz J, Mora D. Numerical Assessment of Different Phase Change Materials as a Passive Strategy to Reduce Energy Consumption in Buildings under Tropical Climates. Buildings. 2022; 12(7):906. https://doi.org/10.3390/buildings12070906
Chicago/Turabian StyleChen Austin, Miguel, Jesús Araúz, and Dafni Mora. 2022. "Numerical Assessment of Different Phase Change Materials as a Passive Strategy to Reduce Energy Consumption in Buildings under Tropical Climates" Buildings 12, no. 7: 906. https://doi.org/10.3390/buildings12070906
APA StyleChen Austin, M., Araúz, J., & Mora, D. (2022). Numerical Assessment of Different Phase Change Materials as a Passive Strategy to Reduce Energy Consumption in Buildings under Tropical Climates. Buildings, 12(7), 906. https://doi.org/10.3390/buildings12070906