
Risk Assessment and Prevention Strategy of Virus Infection in the Context of University Resumption


Abstract
:
1. Introduction
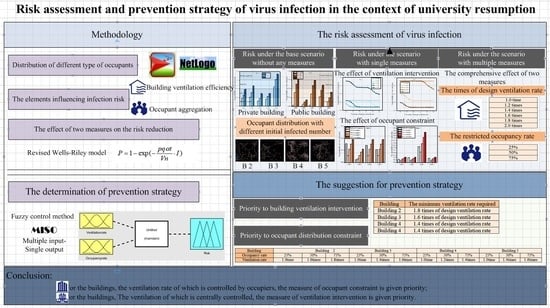
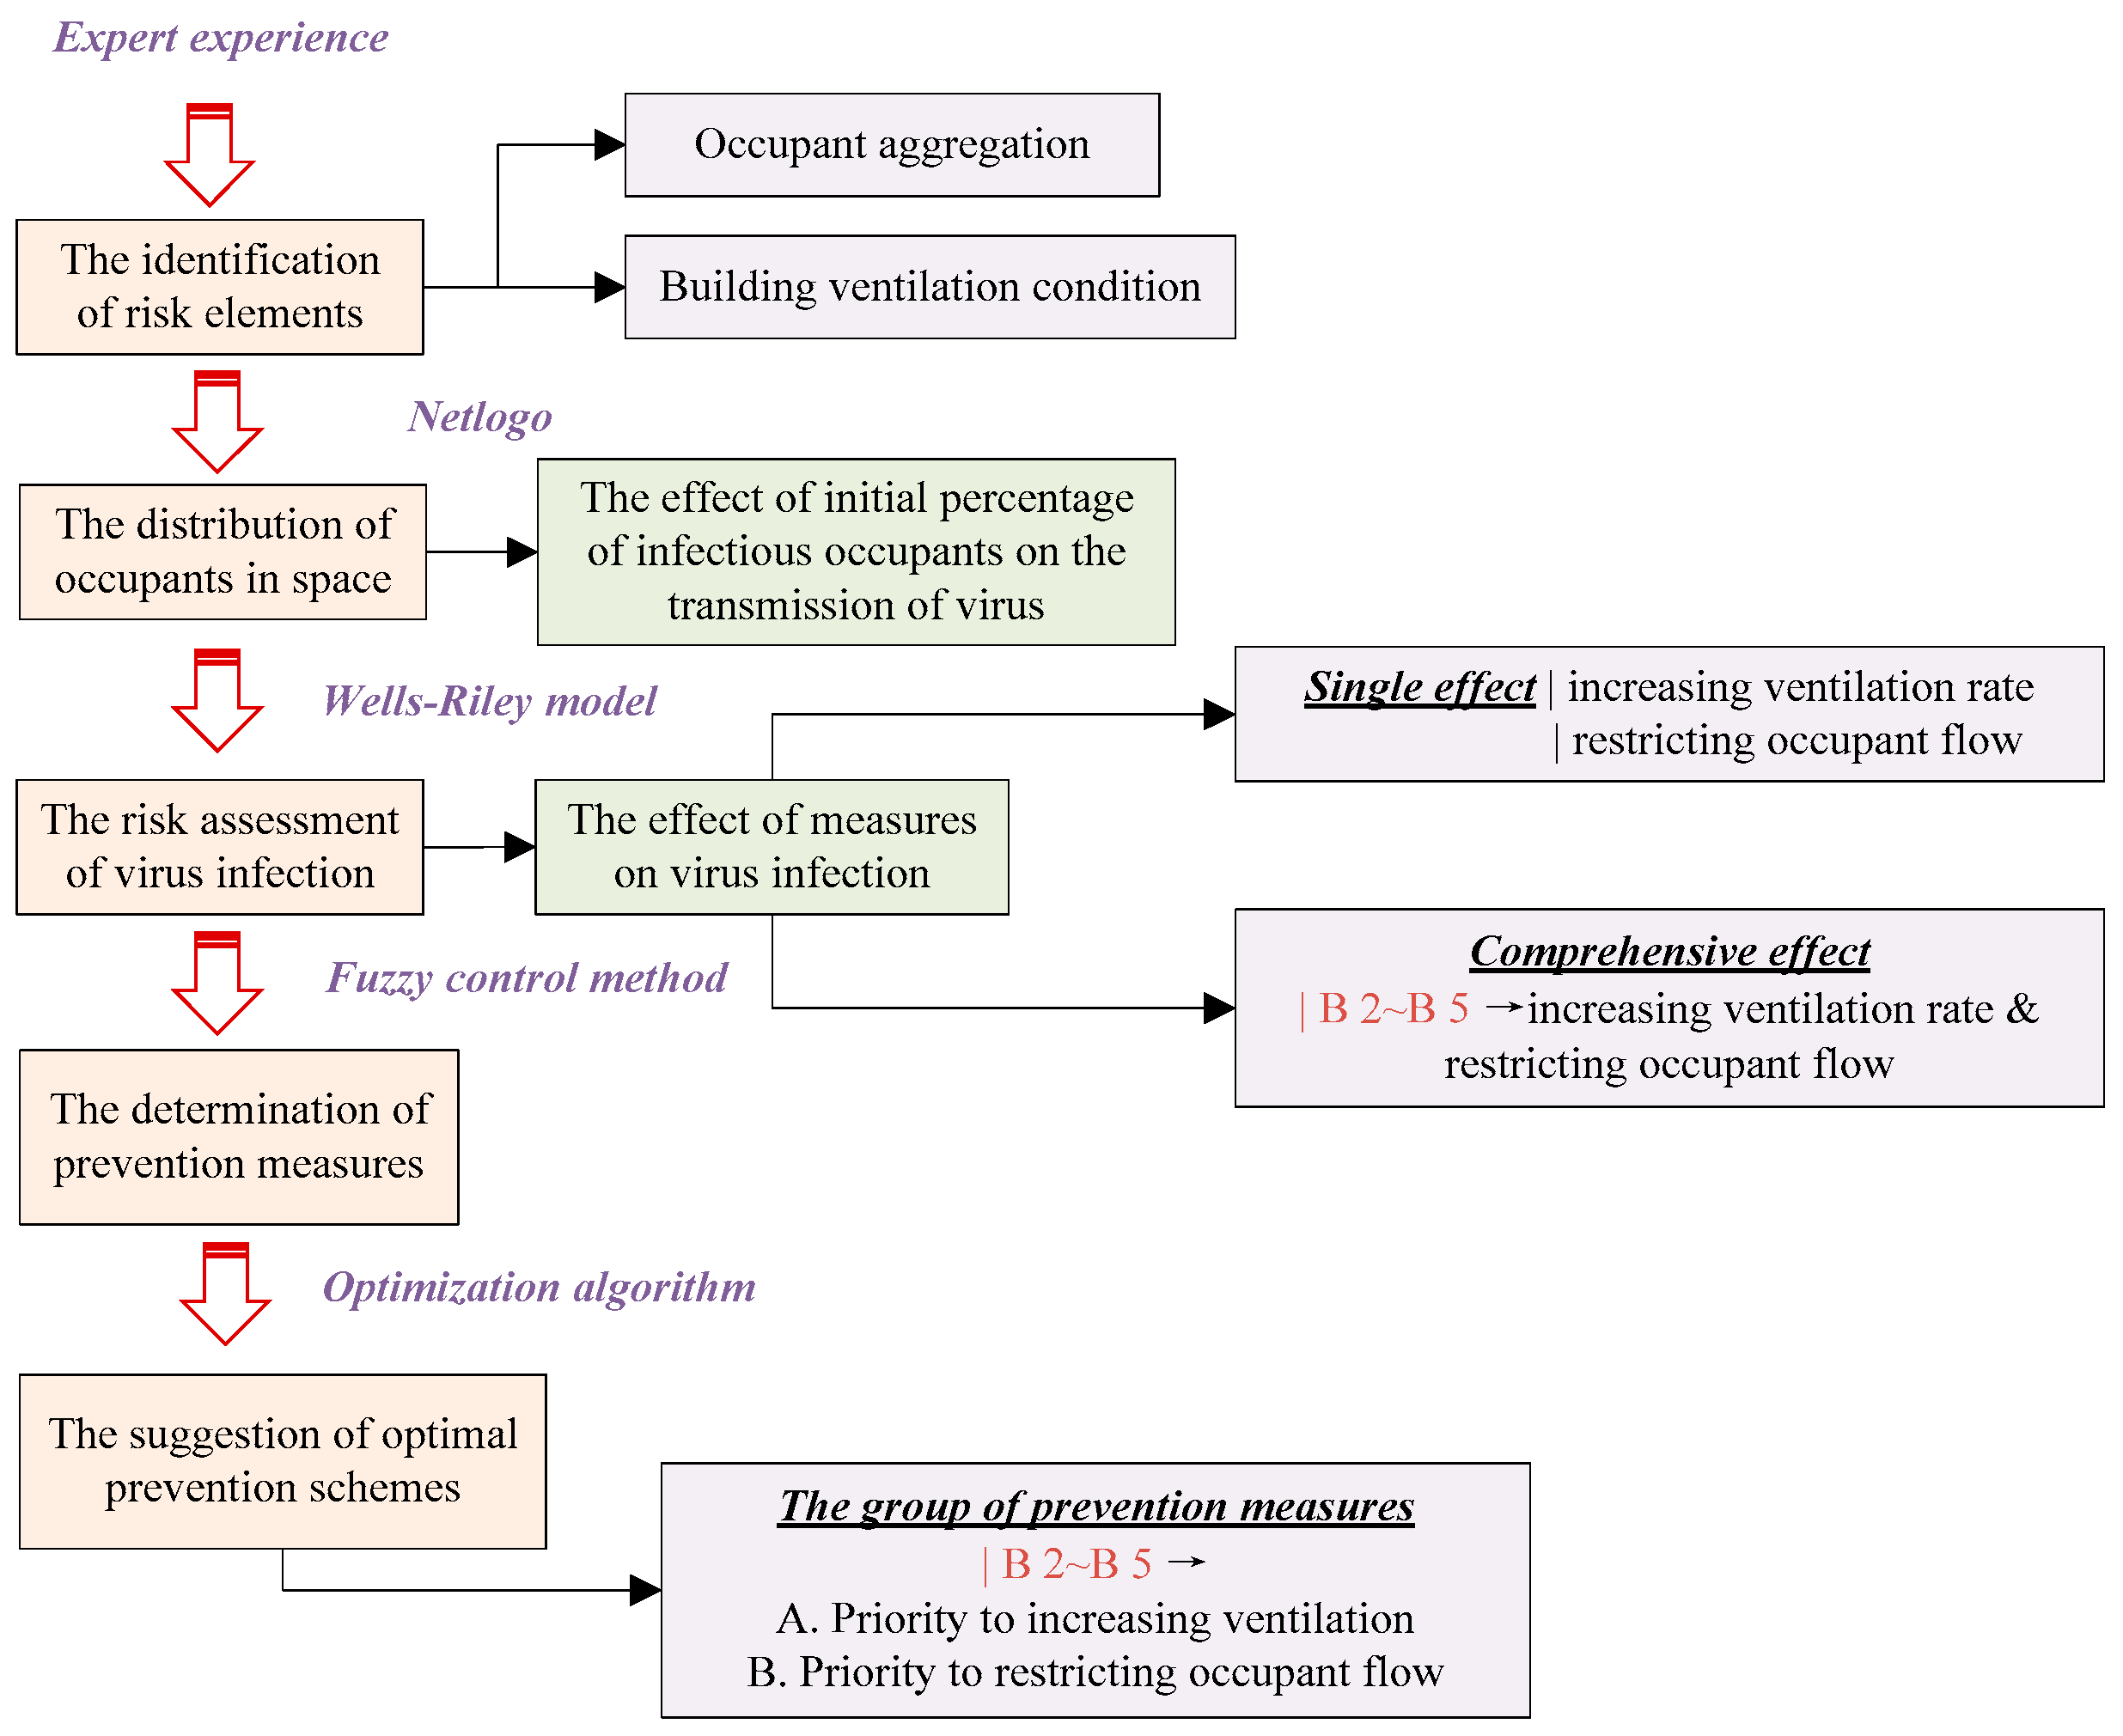
2. Methodology
2.1. The Identification of Risk Elements
- (1)
- Suppose the probability of being infected anywhere in the targeted buildings is equal;
- (2)
- Suppose the occupants are evenly distributed in the buildings to make the contact probability of each individual the same;
- (3)
- Ignore the inhomogeneity of ventilation in the buildings;
- (4)
- Ignore the number of pathogens removed through leakage, filtration, sedimentation, and mortality from the buildings.
2.2. Distribution of Occupants in Space
2.3. Risk Assessment of Virus Infection
2.4. Determination of Prevention Measures
- (1)
- Input 1: M = {0, 25% occupancy, 50% occupancy, 75% occupancy, 100% occupancy};
- (2)
- Input 2: N = {1.0 time of design ventilation rate, 1.2 times of design ventilation rate, 1.4 times of design ventilation rate, 1.6 times of design ventilation rate, 1.8 times of design ventilation rate, 2.0 times of design ventilation rate};
- (3)
- Output: R = {Extremely low, Low, Medium, High, Extremely high}
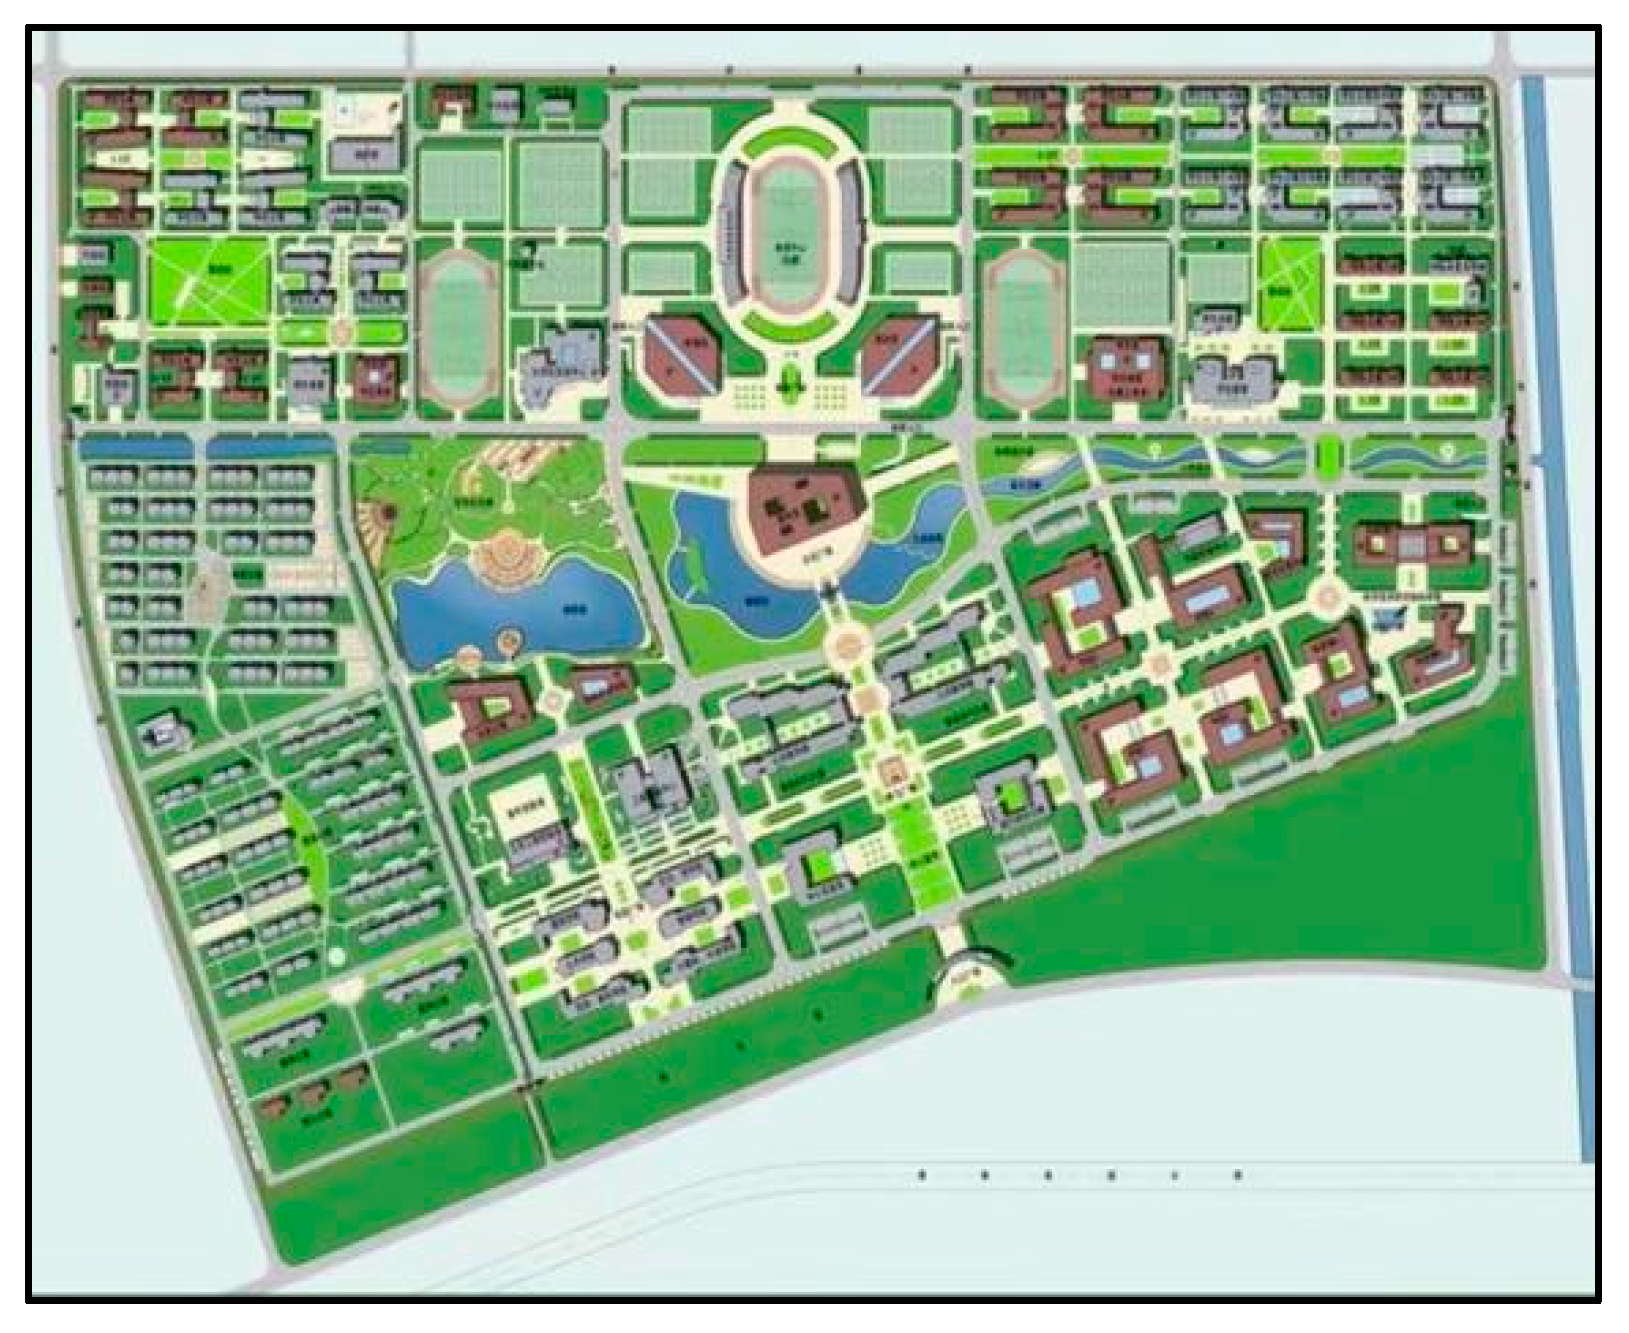
3. Case Study
3.1. Selection of Case Buildings
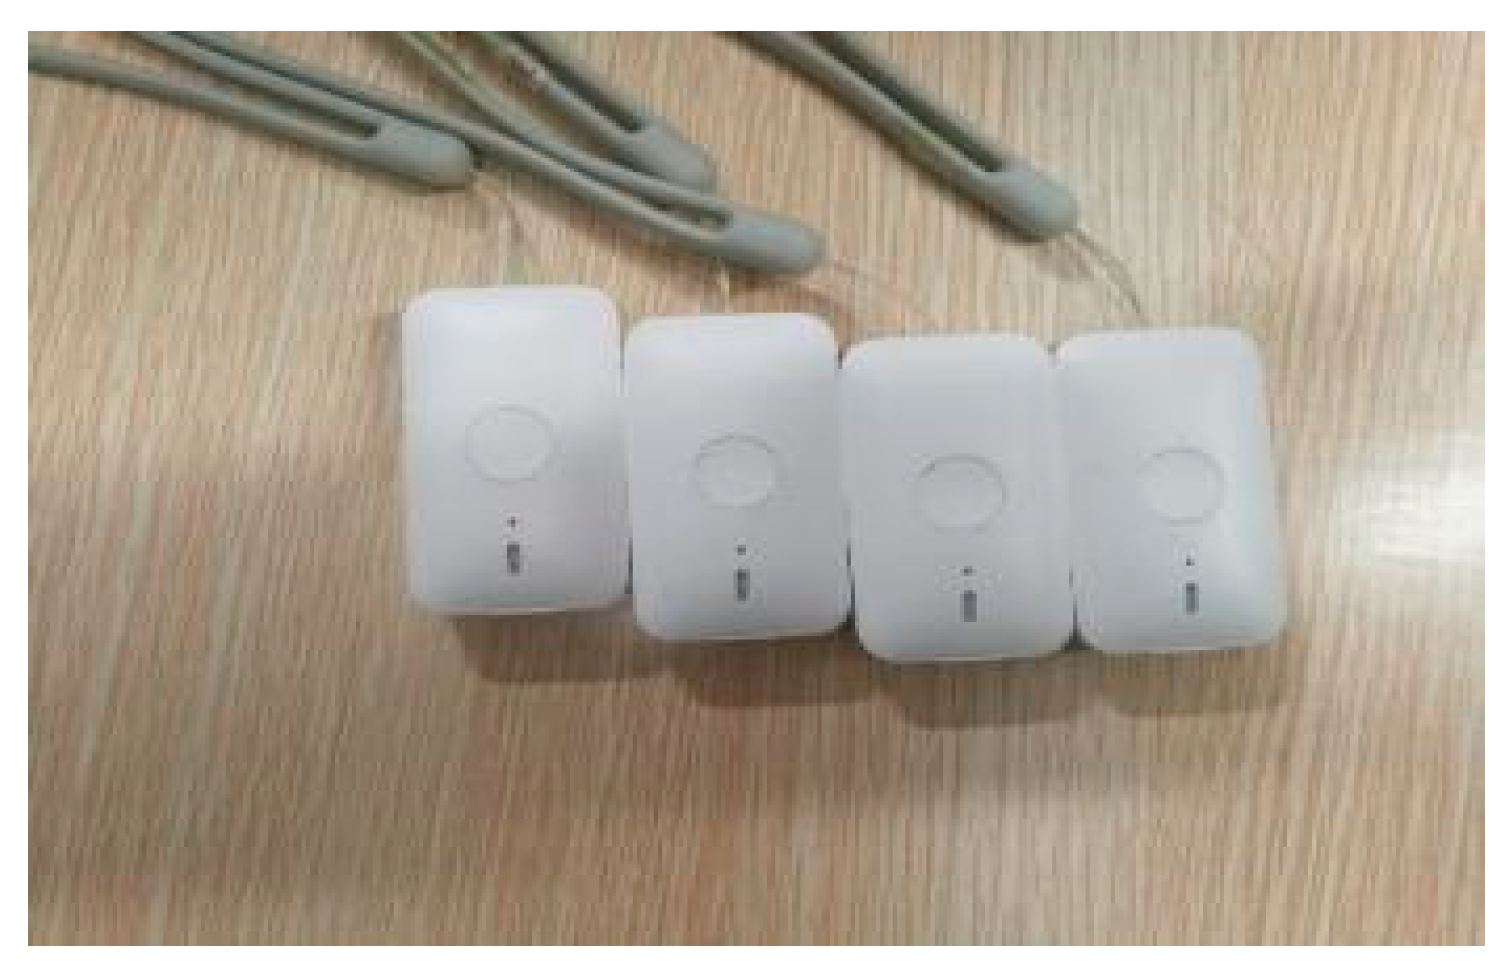
3.2. Selection of Objects
3.3. Definition of Typical Events
4. Risk Assessment of Virus Infection
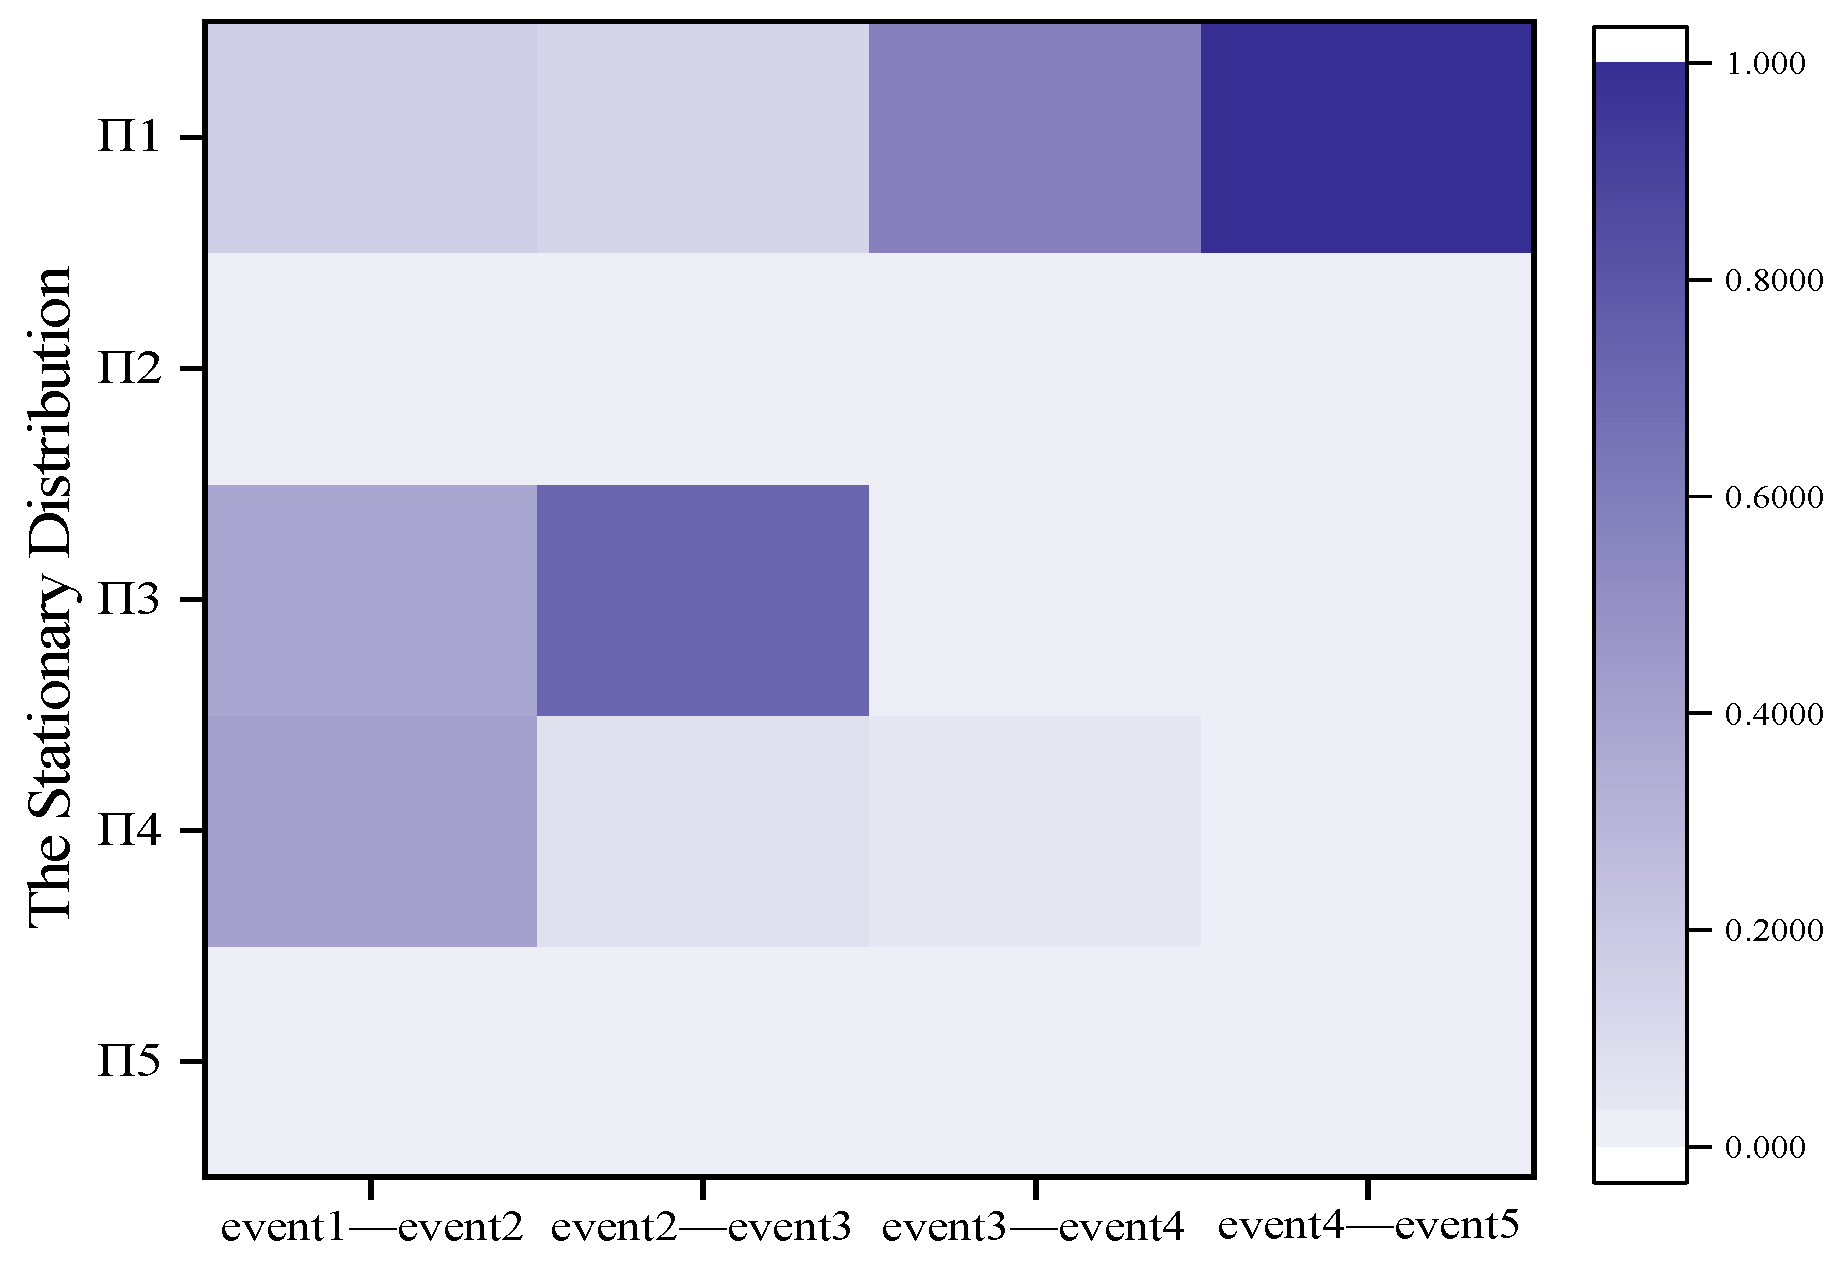
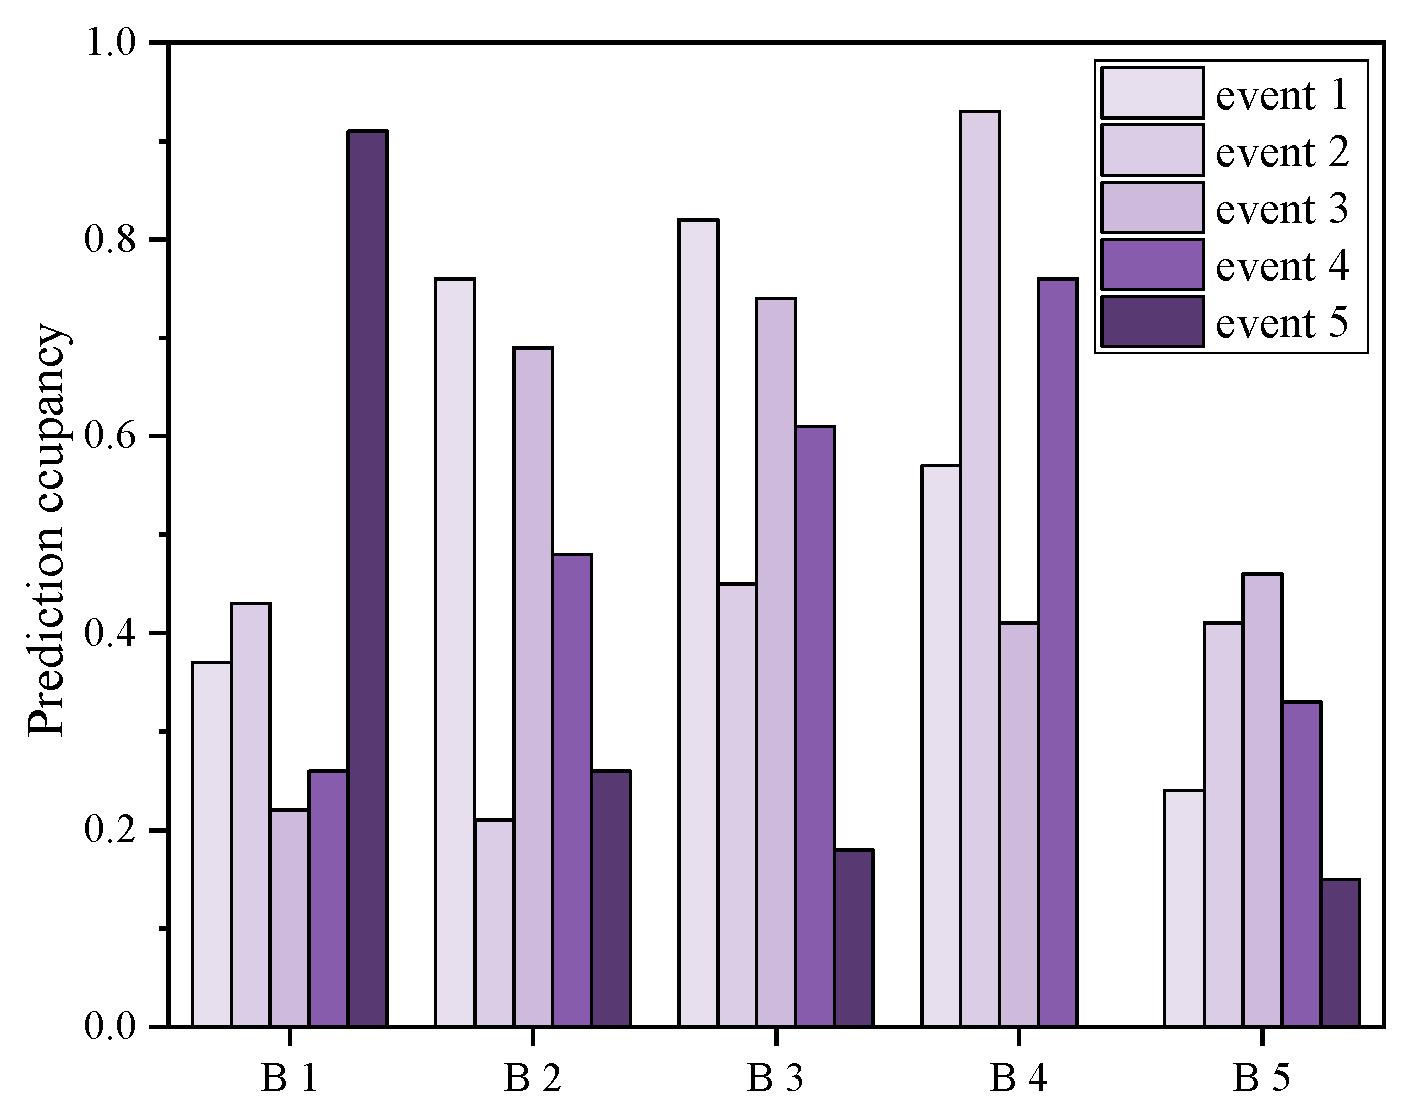
4.1. Prediction Results of Occupant Aggregation Degree
4.2. Risk Assessment of Virus Infection under Different Scenarios
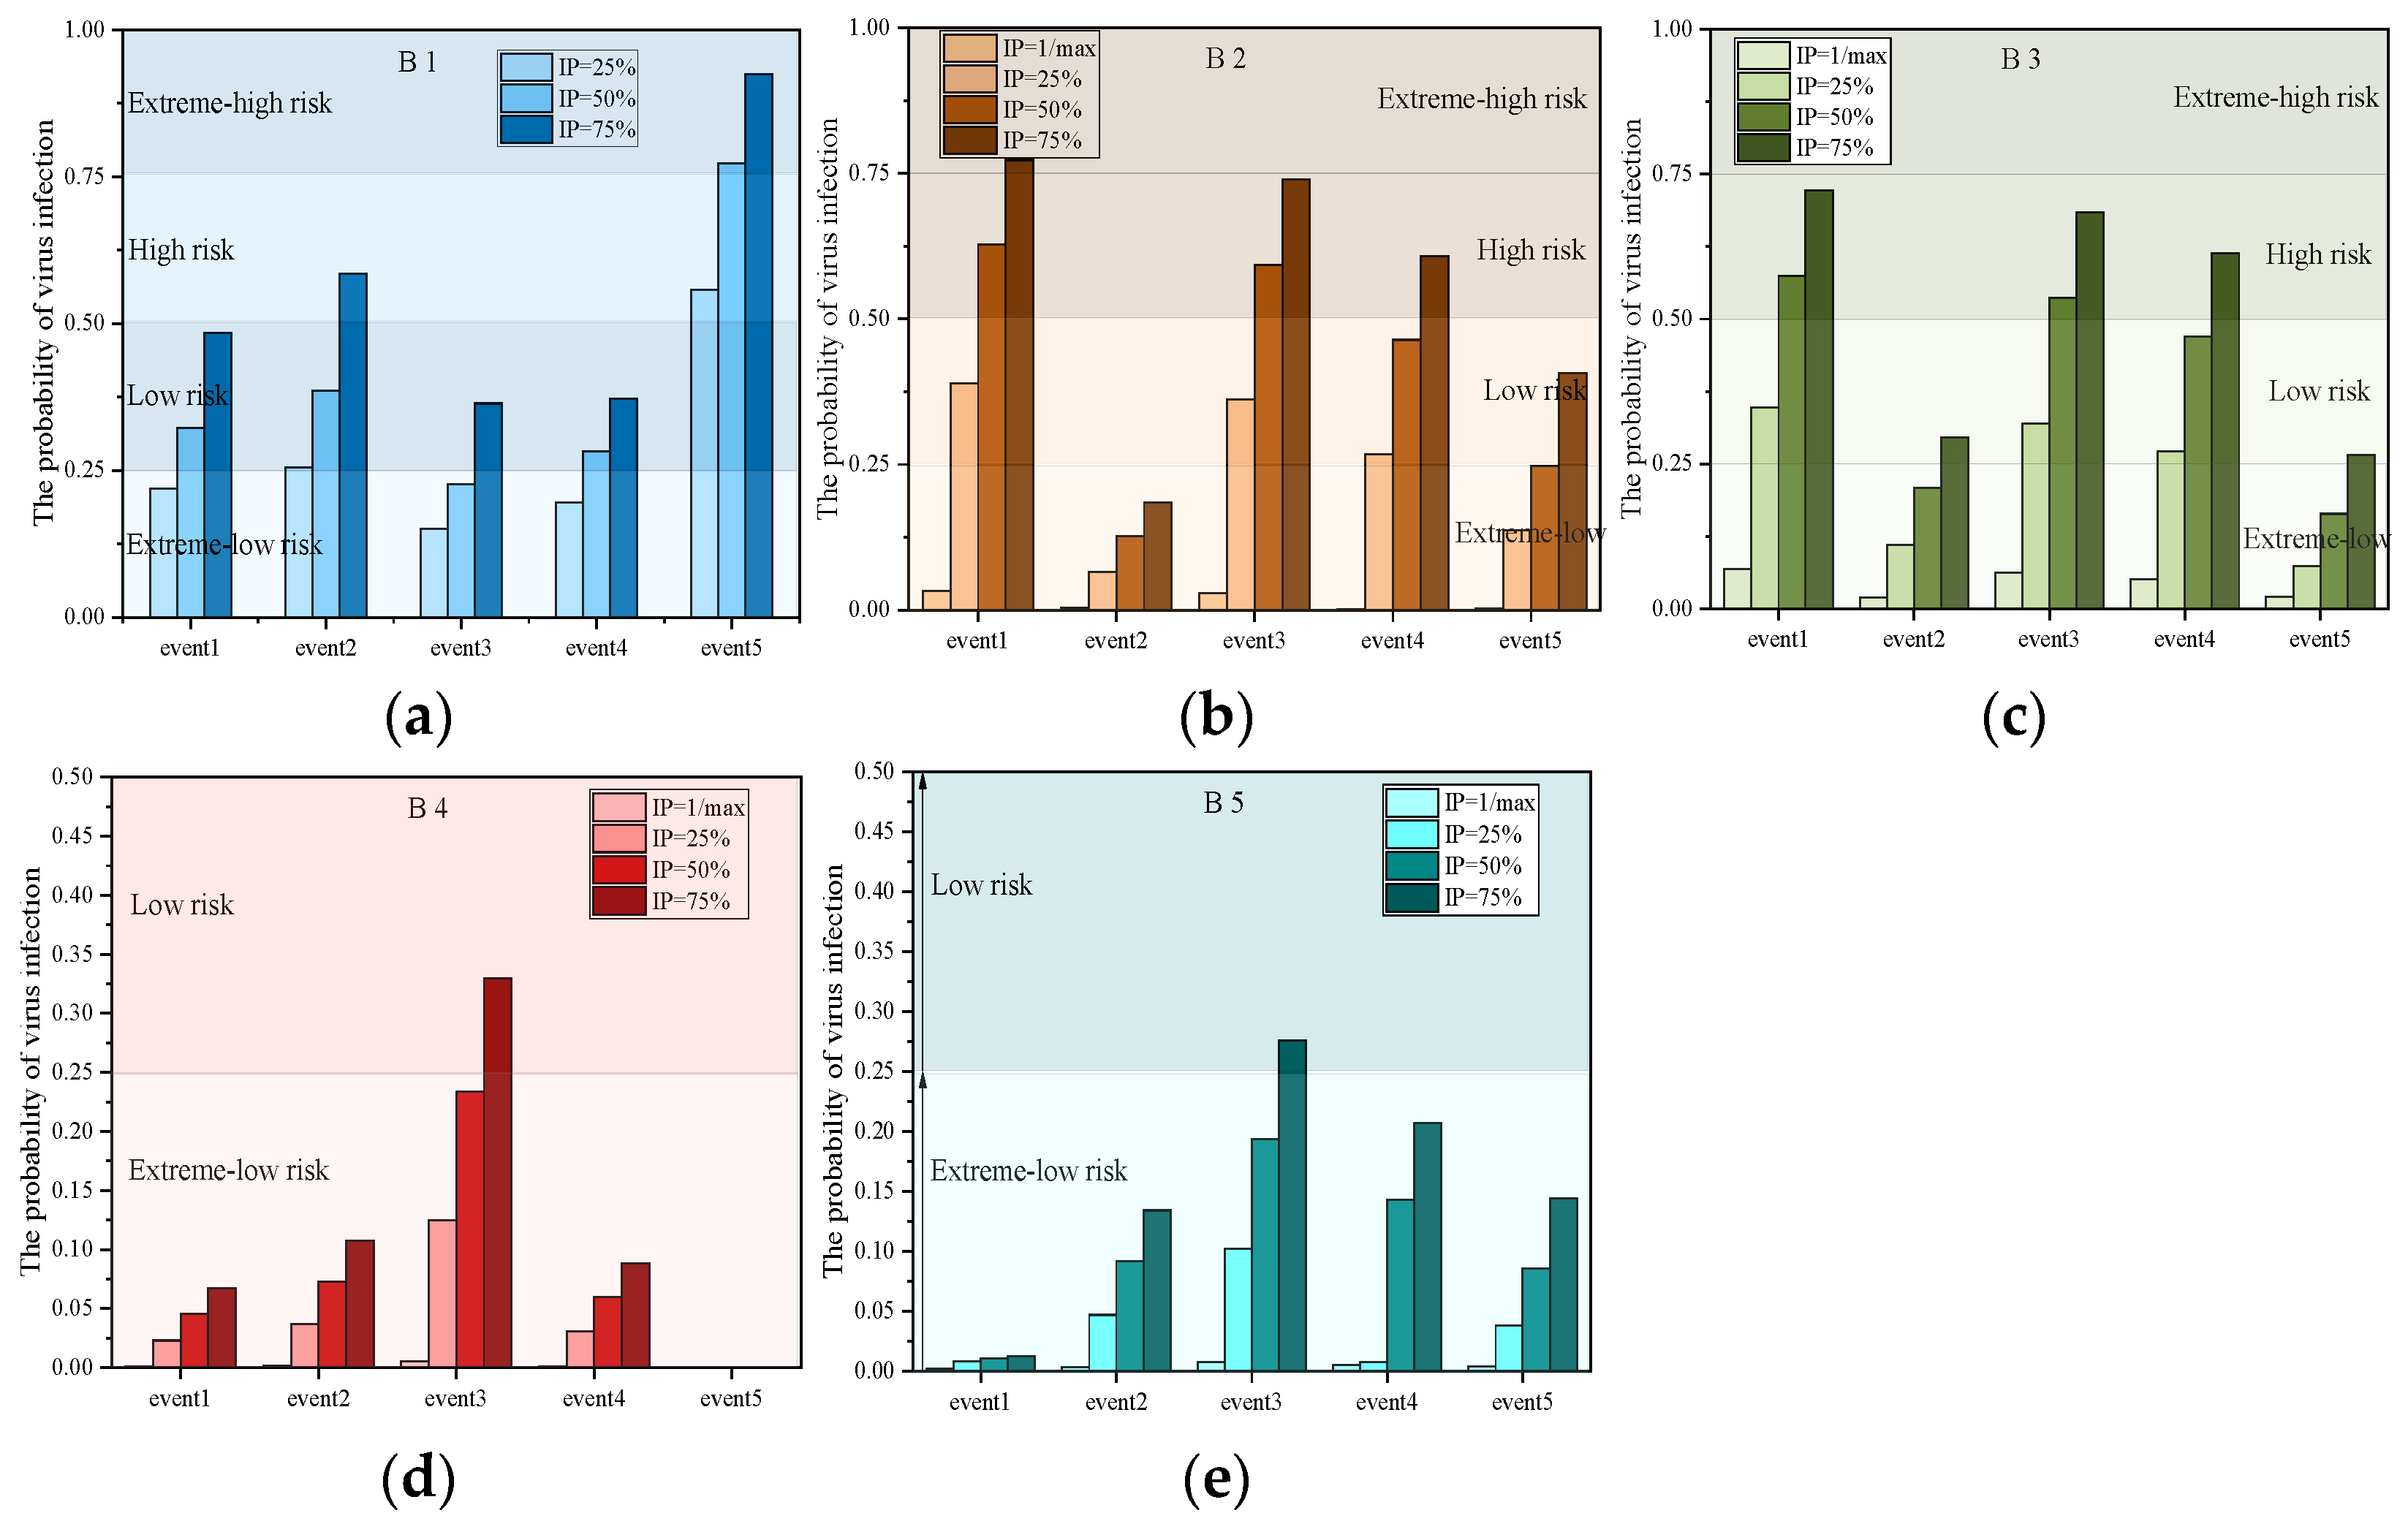
4.2.1. Probability of Virus Infection under the Base Scenario without Any Measures
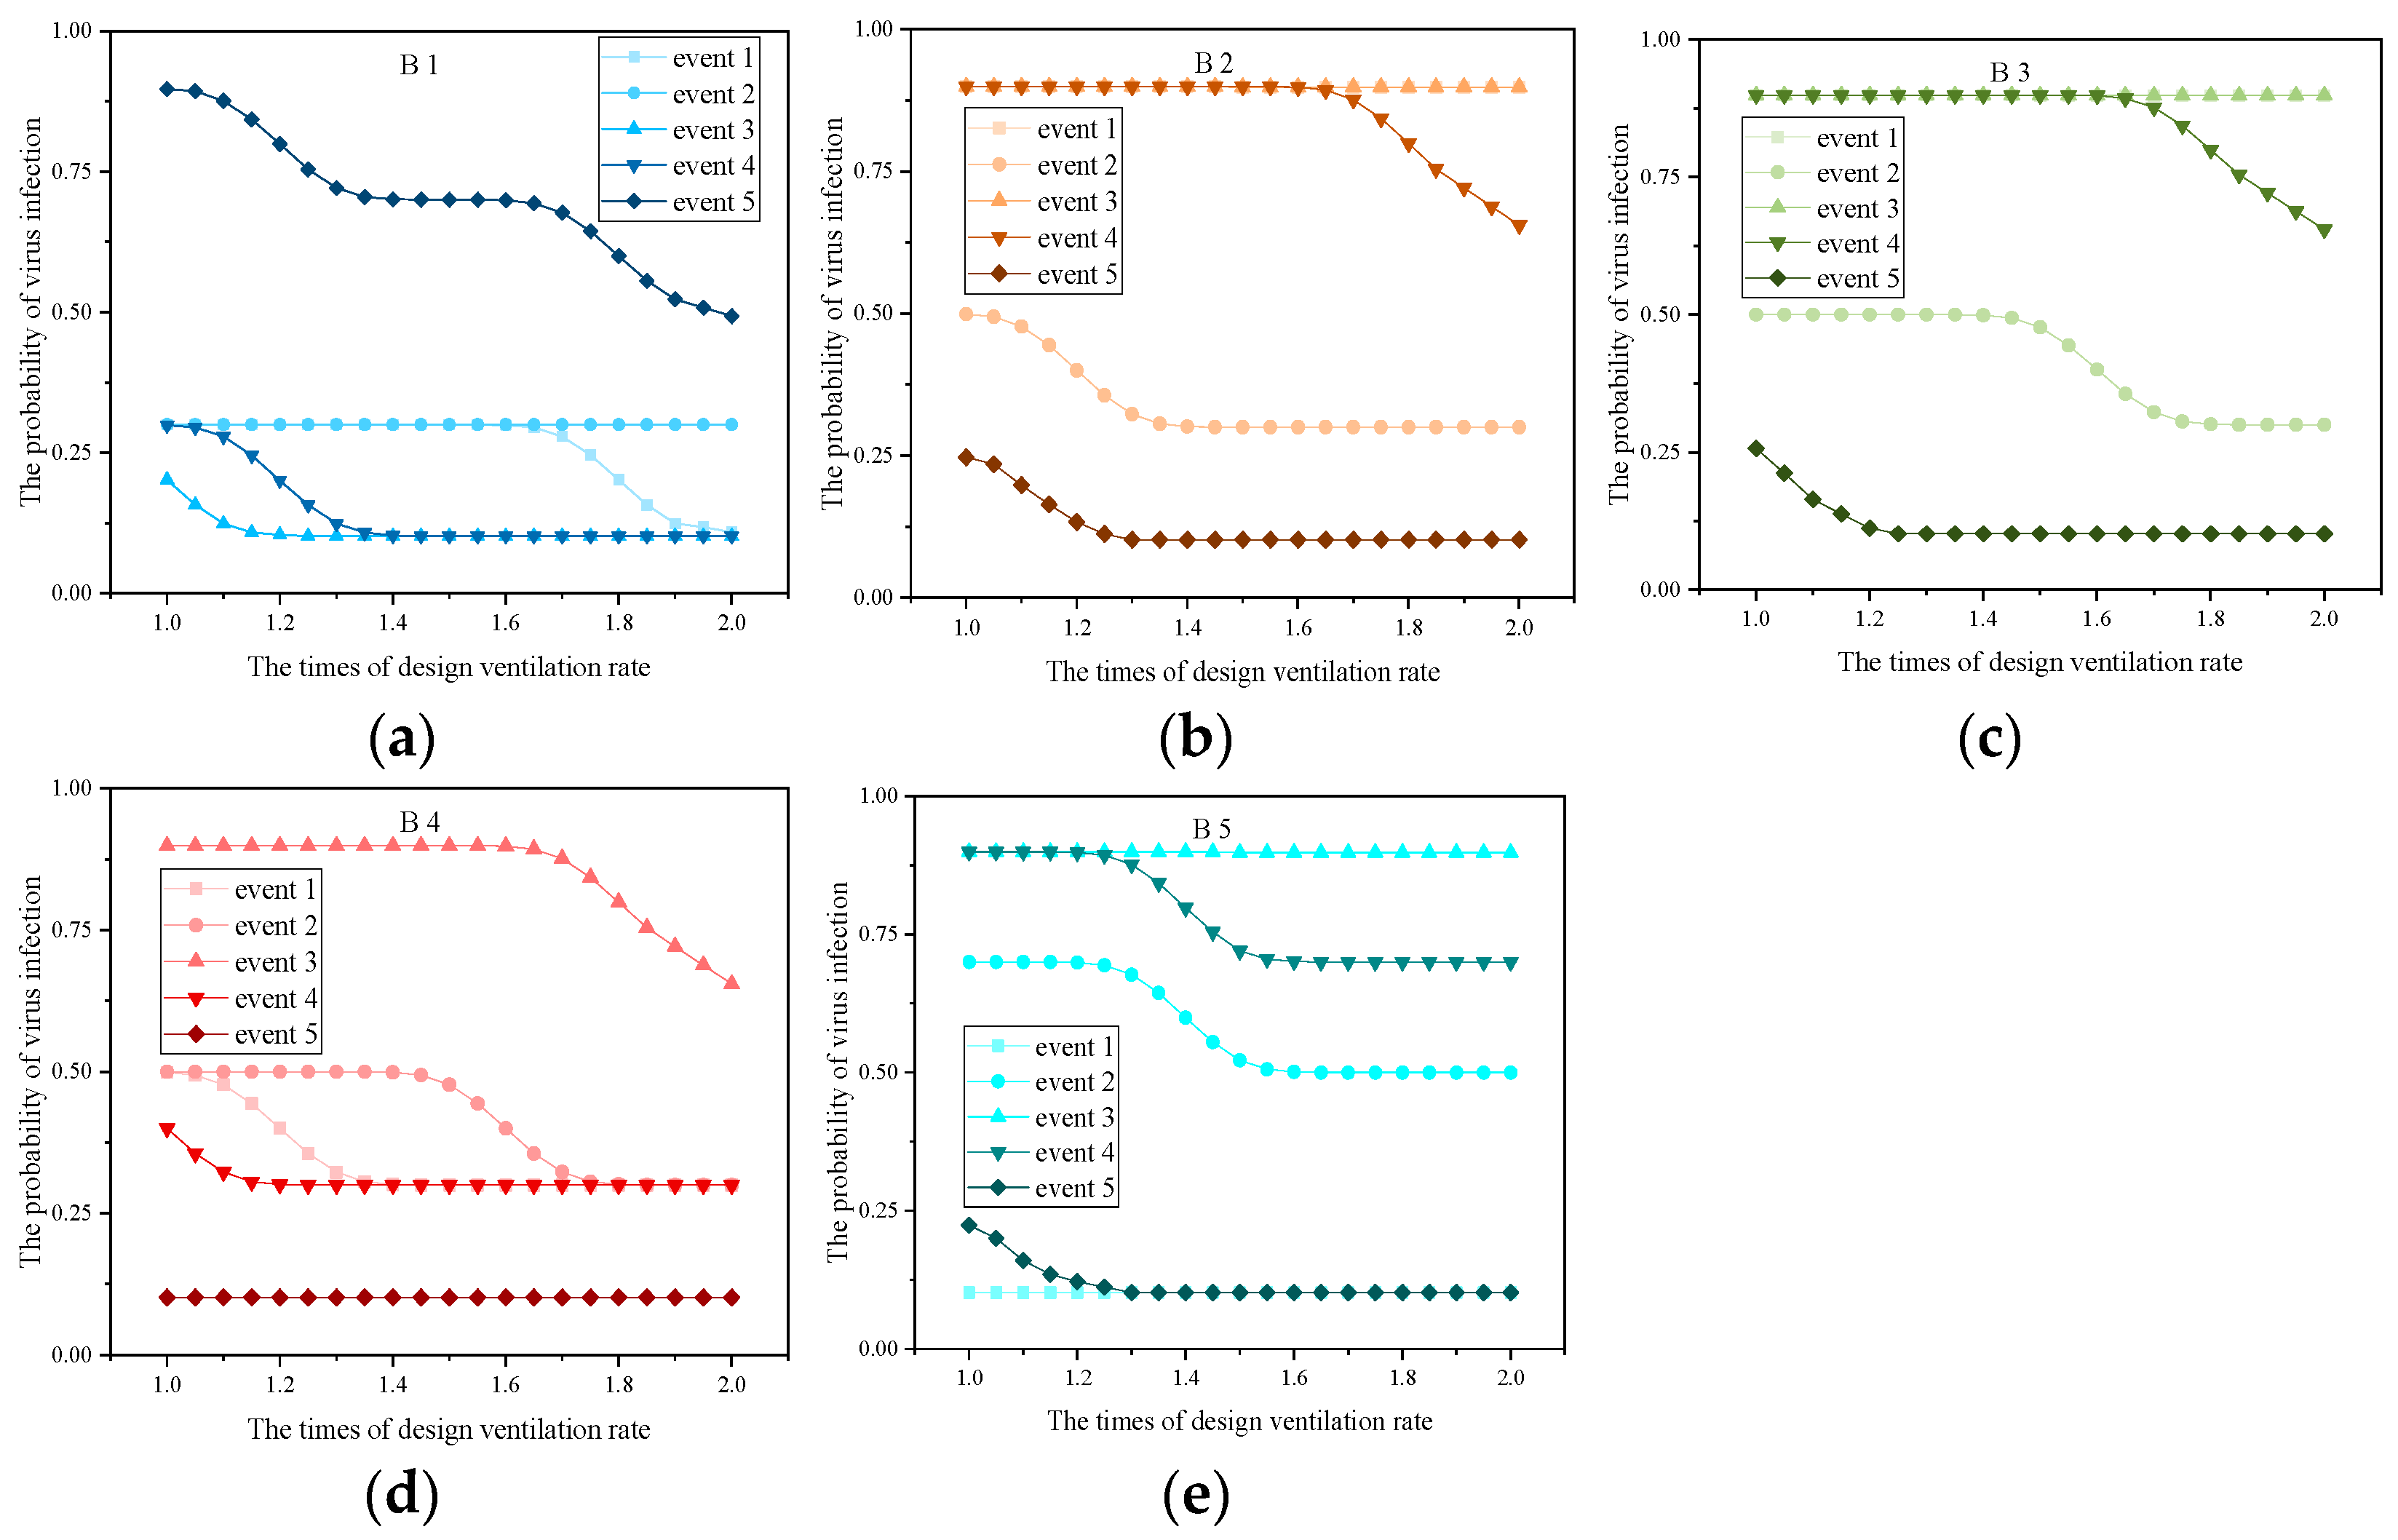
4.2.2. Influence of a Single Prevention Measure on the Probability of Virus Infection
- (1)
- Influence of increasing ventilation rate on the probability of virus infection.
- (2)
- Influence of restricting occupancy on the probability of virus infection.
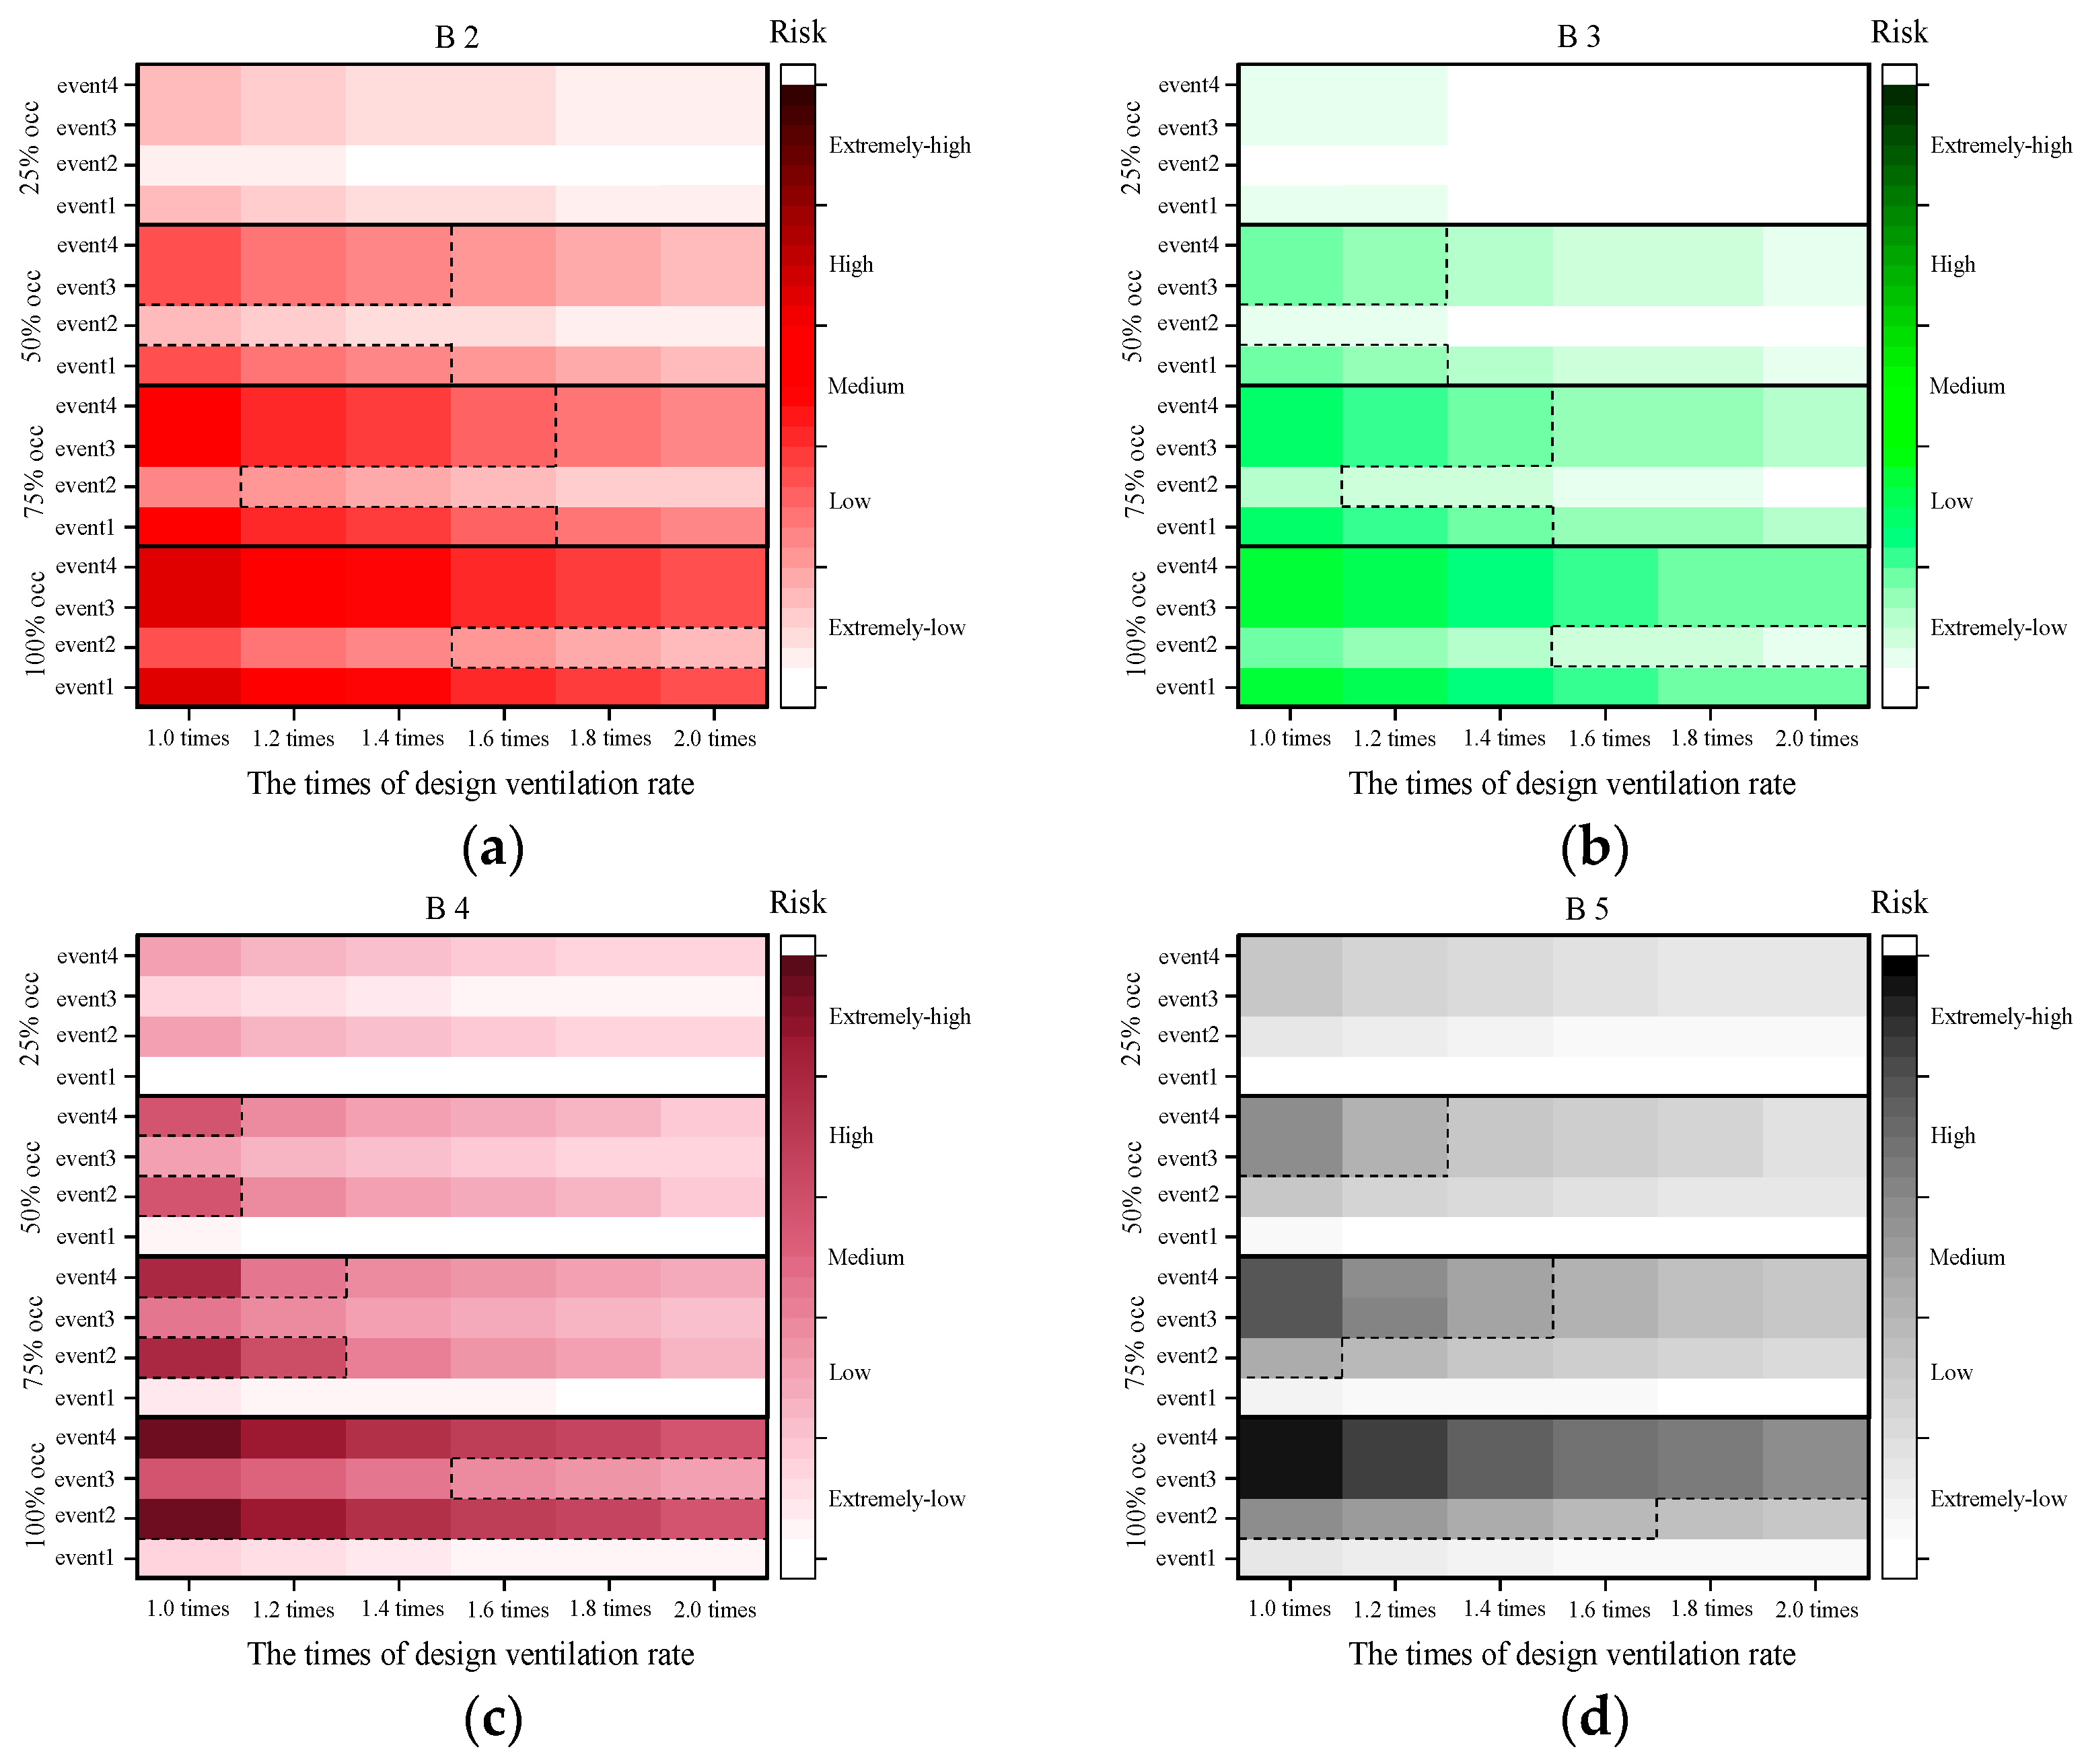
4.2.3. Influence of Multiple Prevention Measures on the Probability of Virus Infection
5. Determination of Optimal Prevention Measures
5.1. Priority to Building Ventilation Intervention
5.2. Priority to Occupancy Constraint
6. Conclusions
Author Contributions
Funding
Institutional Review Board Statement
Informed Consent Statement
Data Availability Statement
Conflicts of Interest
References
- World Health Organization (WHO). WHO Coronavirus (COVID-19) Dashboard. Available online: https://covid19.who.int/ (accessed on 21 January 2022).
- Liu, M.; Liu, J.; Cao, Q.; Li, X.; Liu, S.; Ji, S.; Lin, C.H.; Wei, D.; Shen, X.; Long, Z.; et al. Evaluation of different air distribution systems in a commercial airliner cabin in terms of comfort and COVID-19 infection risk. Build. Environ. 2021, 208, 108590. [Google Scholar] [CrossRef] [PubMed]
- Xiong, Y.; Wang, Y.; Chen, F.; Zhu, M. Spatial statistics and influencing factors of the COVID- 19 epidemic at both prefecture and county levels in Hubei province, China. Int. J. Environ. Res. Public Health 2020, 17, 3903. [Google Scholar] [CrossRef] [PubMed]
- Koo, J.R.; Cook, A.R.; Park, M.; Sun, Y.; Sun, H.; Lim, J.T.; Tam, C.; Dickens, B.L. Interventions to mitigate early spread of SARS-CoV-2 in Singapore: A modelling study. Lancet Infect. Dis. 2020, 20, 678–688. [Google Scholar] [CrossRef]
- Awada, M.; Becerik-Gerber, B.; White, E.; Hoque, S.; O’Neill, Z.; Pedrielli, G.; Wen, J.; Wu, T. Occupant health in buildings: Impact of the COVID-19 pandemic on the opinions of building professionals and implications on research. Build. Environ. 2022, 207, 108440. [Google Scholar] [CrossRef] [PubMed]
- Desjardins, M.R.; Hohl, A.; Delmelle, E.M. Rapid surveillance of COVID-19 in the United States using a prospective space-time scan statistic: Detecting and evaluating emerging clusters. Appl. Geogr. 2020, 118, 102202. [Google Scholar] [CrossRef]
- Jia, J.S.; Lu, X.; Yuan, Y.; Xu, G.; Jia, J.; Christakis, N.A. Population flow drives spatiotemporal distribution of COVID-19 in China. Nature 2020, 582, 389–394. [Google Scholar] [CrossRef]
- Feng, X.; Yan, D.; Hong, T. Simulation of occupancy in buildings. Energy Build. 2015, 87, 348–359. Available online: https://escholarship.org/uc/item/9j6223kx (accessed on 1 January 2015). [CrossRef]
- Wu, J.T.; Leung, K.; Leung, G.M. Now casting and forecasting the potential domestic and international spread of the 2019-nCoV outbreak originating in Wuhan, China: A modelling study. Lancet 2020, 395, 689–697. [Google Scholar] [CrossRef]
- Saari, A.; Tissari, T.; Valkama, E.; Seppänen, O. The effect of a redesigned floor plan, occupant density and the quality of indoor climate on the cost of space, productivity and sick leave in an office building—A case study. Build. Environ. 2006, 41, 1961–1972. [Google Scholar] [CrossRef]
- Kovesi, T.; Gilbert, N.L.; Stocco, C.; Fugler, D.; Dales, R.E.; Guay, M.; Miller, J.D. Indoor air quality and the risk of lower respiratory tract infections in young Canadian Inuit children. Can. Med. Assoc. J. 2007, 177, 155–160. [Google Scholar] [CrossRef]
- Sun, C.; Zhai, Z. The efficacy of social distance and ventilation effectiveness in preventing COVID-19 transmission. Sustain. Cities Soc. 2020, 62, 102390. [Google Scholar] [CrossRef] [PubMed]
- Anand, P.; Cheong, D.; Sekhar, C. A review of occupancy-based building energy and IEQ controls and its future post-COVID. Sci. Total Environ. 2022, 804, 150249. [Google Scholar] [CrossRef] [PubMed]
- Morawska, L.; Tang, J.W.; Bahnfleth, W. How can airborne transmission of COVID-19 indoors be minimised? Environ. Int. 2022, 142, 105832. [Google Scholar] [CrossRef] [PubMed]
- Srivastava, S.; Zhao, X.; Manay, A.; Chen, Q. Effective ventilation and air disinfection system for reducing coronavirus disease 2019 (COVID-19) infection risk in office buildings. Sustain. Cities Soc. 2021, 75, 103408. [Google Scholar] [CrossRef]
- Wang, J.; Huang, J.; Fu, Q.; Gao, E.; Chen, J. Metabolism-based ventilation monitoring and control method for COVID-19 risk mitigation in gymnasiums and alike places. Sustain. Cities Soc. 2022, 80, 103719. [Google Scholar] [CrossRef]
- ASHRAE. ASHRAE Issues Statements on Relationship between COVID-19 and HVAC in Buildings. 2020. Available online: https://www.ashrae.org/about/news/2020/ashrae-issues-statements-on-relationship-between-COVID-19-and-hvac-in-buildings (accessed on 22 October 2020).
- REHVA. REHVA COVID-19 Guidance Document [EB/OL]. (3 April 2020). Available online: https://www.rehva.eu/fileadmin/userupload/REHVACOVID-19guidancedocumentver220200403 (accessed on 29 July 2020).
- CIBSE. Coronavirus COVID-19 and HVAC Systems [EB/OL]. Available online: http://www.cib.seorg/coronavirus-(COVID-19).coronavirus-COVID-19-and-hvac-systems (accessed on 29 July 2020).
- Guo, M.; Xu, P.; Xiao, T.; He, R.; Dai, M.; Miller, S.L. Review and comparison of HVAC operation guidelines in different countries during the COVID-19 pandemic. Build. Environ. 2021, 187, 107368. [Google Scholar] [CrossRef]
- Mondal, S.; Chaipitakporn, C.; Kumar, V.; Wangler, B.; Gurajala, S.; Dhaniyala, S.; Sur, S. COVID-19 in New York state: Effects of demographics and air quality on infection and fatality. Sci. Total Environ. 2022, 807, 150536. [Google Scholar] [CrossRef]
- Cakyova, K.; Figueiredo, A.; Oliveira, R.; Rebelo, F.; Vicente, R.; Fokaides, P. Simulation of passive ventilation strategies towards indoor CO2 concentration reduction for passive houses. J. Build. Eng. 2021, 43, 103108. [Google Scholar] [CrossRef]
- Li, Y.; Leung, G.M.; Tang, J.W.; Yang, X.; Chao, C.Y.; Lin, J.Z. Role of ventilation in airborne transmission of infectious agents in the built environment-amultidisciplinary systematic review. Indoor Air 2007, 17, 2–18. [Google Scholar] [CrossRef]
- Sangsanont, J.; Rattanakul, S.; Kongprajug, A.; Chyerochana, N.; Sresung, M.; Sriporatana, N.; Wanlapakorn, N.; Poovorawan, Y.; Mongkolsuk, S.; Sirikanchana, K. SARS-CoV-2 RNA surveillance in large to small centralized wastewater treatment plants preceding the third COVID-19 resurgence in Bangkok, Thailand. Sci. Total Environ. 2021, 809, 151169. Available online: https://gfbfh1b13095ec5284139skvxcukcoxwkv66kcfgac.eds.tju.edu.cn/10.1016/j.scitotenv.2021.151169 (accessed on 25 February 2022). [CrossRef]
- Xu, J.H.; Fan, Y. An individual risk assessment framework for high-pressure natural gas wells with hydrogen sulphide, applied to a case study in China. Saf. Sci. 2014, 68, 14–23. [Google Scholar] [CrossRef]
- Cook, B.R. Environmental hazards: Assessing risk and reducing disaster. Disasters 2012, 52, 96–97. [Google Scholar] [CrossRef]
- Wang, S.; Mu, L.; Qi, M.; Yu, Z.; Yao, Z.; Zhao, E. Quantitative risk assessment of storm surge using GIS techniques and open data: A case study of Daya Bay Zone, China. J. Environ. Manag. 2021, 289, 112514. [Google Scholar] [CrossRef] [PubMed]
- Tarazona, J.V.; Martínez, M.; Martínez, M.-A.; Anadón, A. Environmental impact assessment of COVID-19 therapeutic solutions. A prospective analysis. Sci. Total Environ. 2021, 778, 146257. Available online: https://gfbfh1b13095ec5284139skvxcukcoxwkv66kcfgac.eds.tju.edu.cn/10.1016/j.scitotenv.2021.146257 (accessed on 15 July 2021). [CrossRef]
- Fan, C.; Cai, T.; Gai, Z.; Wu, Y. The Relationship between the Migrant Population’s Migration Network and the Risk of COVID-19 Transmission in China—Empirical Analysis and Prediction in Prefecture-Level Cities. Int. J. Environ. Res. Public Health 2020, 17, 2630. [Google Scholar] [CrossRef]
- Verhagen, M.D.; Brazel, D.M.; Dowd, J.B.; Kashnitsky, I.; Mills, M.C. Forecasting spatial, socioeconomic and demographic variation in COVID-19 health care demand in England and Wales. BMC Med. 2020, 18, 203. [Google Scholar] [CrossRef]
- Zhang, J.; Litvinova, M.; Liang, Y.; Wang, Y.; Wang, W.; Zhao, S.; Wu, Q.; Merler, S.; Viboud, C.; Vespignani, A.; et al. Changes in contact patterns shape the dynamics of the COVID-19 outbreak in China. Science 2020, 368, eabb8001. [Google Scholar] [CrossRef]
- Prem, K.; Liu, Y.; Russell, T.W.; Kucharski, A.J.; Eggo, R.M.; Davies, N.; Flasche, S.; Clifford, S.; Pearson, C.A.; Munday, J.D. The effect of control strategies to reduce social mixing on outcomes of the COVID-19 epidemic in Wuhan, China: A modelling study. Lancet Public Health 2020, 5, e261–e270. [Google Scholar] [CrossRef]
- Wang, T.; Zhai, Y.; Wang, K.; Zhao, R.; Han, S. Comprehensive risk assessment method for resuming classes in universities during COVID-19 epidemic. China Saf. Sci. J. 2021, 31, 143–148. [Google Scholar]
- Ding, H.; Li, J. Risk assessment method of Chinese schools after resumption of schooling in the context of COVID-19. Henan Sci. 2020, 38, 1669–1677. [Google Scholar]
- Luongo, J.C.; Fennelly, K.P.; Keen, J.A.; Zhai, Z.J.; Jones, B.W.; Miller, S.L. Role of mechanical ventilation in the airborne transmission of infectious agents in buildings. Indoor Air 2016, 26, 666–678. [Google Scholar] [CrossRef] [PubMed]
- Dhou, K.; Cruzen, C. A creative chain coding technique for bi-level image compression inspired by the NetLogo HIV agent-based modeling simulation. J. Comput. Sci. 2022, 61, 101613. [Google Scholar] [CrossRef]
- Gunaratne, C.; Garibay, I. NL4Py: Agent-based modeling in Python with parallelizable NetLogo workspaces. SoftwareX 2021, 16, 100801. [Google Scholar] [CrossRef]
- NetLogo Home Page. Available online: http://ccl.northwestern.edu/netlogo/ (accessed on 24 April 2022).
- Jaxa-Rozen, M.; Kwakkel, J.; Bloemendal, M. A coupled simulation architecture for agent-based/geohydrological modelling with NetLogo and MODFLOW. Environ. Model. Softw. 2019, 9, 19–37. [Google Scholar] [CrossRef]
- To, G.; Chao, C. Review and comparison between the Wells-Riley and dose–response approaches to risk assessment of infectious respiratory diseases. Indoor Air 2009, 20, 2–16. [Google Scholar]
- Li, J.; Li, C.; Tang, H. Airborne infection risk assessment of COVID-19 in an inpatient department through on-site occupant behavior surveys. J. Build. Eng. 2022, 51, 104255. [Google Scholar] [CrossRef]
- Mokhtari, R.; Jahangir, M.H. The effect of occupant distribution on energy consumption and COVID-19 infection in buildings: A case study of university building. Build. Environ. 2021, 190, 107561. [Google Scholar] [CrossRef]
- Park, S.; Choi, Y.; Song, D.; Kim, E.K. Natural ventilation strategy and related issues to prevent coronavirus disease 2019 (COVID-19) airborne transmission in a school building. Sci. Total Environ. 2021, 789, 147764. [Google Scholar] [CrossRef]
- Guo, Y.; Zhang, N.; Hu, T.; Wang, Z.; Zhang, Y. Optimization of energy efficiency and COVID-19 pandemic control in different indoor environments. Energy Build. 2022, 261, 111954. [Google Scholar] [CrossRef]
- Lipinski, T.; Ahmad, D.; Serey, N.; Jouhara, H. Review of ventilation strategies to reduce the risk of disease transmission in high occupancy buildings. Int. J. Thermofluids 2020, 7–8, 100045. [Google Scholar] [CrossRef]
- Li, C.; Tang, H. Study on ventilation rates and assessment of infection risks of COVID-19 in an outpatient building. J. Build. Eng. 2021, 42, 103090. [Google Scholar] [CrossRef]


| Association | Operating Time Point | Running Time in Length | Supplying Fresh Air |
|---|---|---|---|
| ASHARE | Operate 2 h before and post occupied | Run for 24 h a day; Run for 7 days a week | As high as 100% if possible |
| REHVA | Run at the nominal speed for at least 2 h before occupied and at a lower speed 2 h after occupied. | Run toilet ventilation system for 24 h a day; Run toilet ventilation system for 7 days a week | |
| SHASE | Run continuously for 24 h if possible | Run the exhaust system in toilets continuously |
| Probability of Virus Infection | 0% | <25% | 25–50% | 50% | 50–75% | >75% |
|---|---|---|---|---|---|---|
| Risk level of virus infection | No-risk | Extreme low-risk | Low-risk | Medium-risk | High-risk | Extreme high-risk |
| Building Type | Code | Total Floor Area (m2) | Maximum Capacity of Occupant | Maximum Capacity for Each Room | Opening Time | Room Functions |
|---|---|---|---|---|---|---|
| Dormitory building | B1 | 3400 | 500 | 6 | 00:00–24:00 | For living/ studying |
| Lecture building | B2 | 12,670 | 3000 | 100 | 06:30–22:30 | For class/ self-studying |
| Office building | B3 | 3690 | 1000 | 30 | 06:30–22:30 | For official business/ scientific research |
| Canteen | B4 | 4210 | 500 | 300 | 06:30–22:00 | For meal/ communication |
| Library | B5 | 13,100 | 1000 | 100 | 06:30–22:00 | For self-studying |
| Building | The Initial Percentage of the Infectious Occupants | ||
|---|---|---|---|
| 25% | 50% | 75% | |
| B2 |  |  | 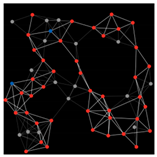 |
| B3 | 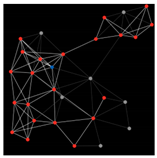 | 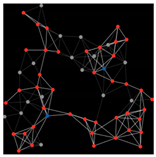 | 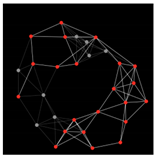 |
| B4 | 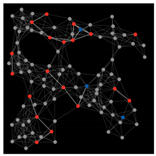 | 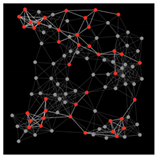 | 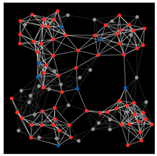 |
| B5 | 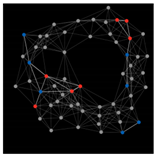 |  |  |
| State | Event | ΔRisk (%) | |||||||
|---|---|---|---|---|---|---|---|---|---|
| Constraining Occupancy | Increasing Ventilation Rate | ||||||||
| 25% | 50% | 75% | 1.2 | 1.4 | 1.6 | 1.8 | 2.0 | ||
| B2 | Event 1 | 23.98 | 11.23 | 0.39 | 5.24 | 9.25 | 12.42 | 14.98 | 17.09 |
| Event 2 | - | - | - | 1.07 | 1.84 | 2.42 | 2.88 | 3.24 | |
| Event 3 | 21.14 | 8.39 | - | 4.96 | 8.73 | 11.70 | 14.09 | 16.05 | |
| Event 4 | 11.80 | - | - | 3.91 | 6.82 | 9.06 | 10.89 | 12.36 | |
| B3 | Event 1 | 22.52 | 11.82 | 2.42 | 4.81 | 1.92 | 3.42 | 4.55 | 5.38 |
| Event 2 | 4.75 | - | - | 1.75 | 1.02 | 1.92 | 2.72 | 3.42 | |
| Event 3 | 19.75 | 0.90 | - | 4.51 | 1.92 | 3.42 | 4.55 | 5.38 | |
| Event 4 | 14.99 | 4.29 | - | 3.95 | 1.92 | 3.42 | 4.55 | 5.38 | |
| B4 | Event 1 | 3.71 | 0.80 | - | 1.09 | 0.49 | 0.96 | 1.40 | 1.82 |
| Event 2 | 7.71 | 4.80 | 1.98 | 1.70 | 0.49 | 0.96 | 1.40 | 1.82 | |
| Event 3 | 11.32 | - | - | 4.62 | 3.25 | 5.20 | 6.24 | 6.66 | |
| Event 4 | 5.85 | 2.93 | 0.11 | 1.42 | 0.49 | 0.96 | 1.40 | 1.82 | |
| B5 | Event 1 | - | - | - | 0.34 | 0.36 | 0.70 | 1.03 | 1.35 |
| Event 2 | 5.02 | - | - | 2.10 | 1.35 | 2.49 | 3.45 | 4.24 | |
| Event 3 | 11.50 | - | - | 4.00 | 2.49 | 4.24 | 5.42 | 6.15 | |
| Event 4 | 4.58 | - | - | 3.12 | 2.49 | 4.24 | 5.42 | 6.15 | |
| Building Type | Controlling Measures | Effect | Reference |
|---|---|---|---|
| Inpatient department | Reducing the ratio of attendant-to-patient | Reducing 15–22% of infection risk. | [41] |
| University building | Changing the occupant distribution pattern | Reducing the number of infected occupants by up to 56%. | [42] |
| Outpatient department | Increasing ventilation rates by 2 times of the Chinese standard | Reducing infection risk to 1.92–5.64 with the infector proportion of 5%, 10%, and 15%. | [43] |
| School building | Securing ventilation rate of 6.51 h−1, restricting exposure time to less than 3 h. | Maintaining infection risk to less than 1%. | [44] |
| Weekdays: workplace, public transport Weekends: markets, shopping centers | Increasing ventilation rate to 50 m3/h/p | Maintaining R0 no more than 1.0. | [45] |
| Classroom | Adopting active ventilation strategy | Reducing average 66% concentration of virus. | [46] |
| University building | Constraining occupant number | Reducing infection risk maximum to 23.98%. | This study |
| Increasing ventilation rate | Reducing infection risk maximum to 17.09% |
| State | Event | ΔRisk (%) | |||||||||||||||||
|---|---|---|---|---|---|---|---|---|---|---|---|---|---|---|---|---|---|---|---|
| n = 1.0 Time | n = 1.2 Times | n = 1.4 Times | n = 1.6 Times | n = 1.8 Times | n = 2.0 Times | ||||||||||||||
| Occ = 25% | Occ = 50% | Occ = 75% | Occ = 25% | Occ = 50% | Occ = 75% | Occ = 25% | Occ = 50% | Occ = 75% | Occ = 25% | Occ = 50% | Occ = 75% | Occ = 25% | Occ = 50% | Occ = 75% | Occ = 25% | Occ = 50% | Occ = 75% | ||
| B2 | Event 1 | 23.9 | 11.2 | 0.39 | 26.3 | 15.3 | 5.6 | 28.0 | 18.3 | 9.6 | 29.3 | 20.6 | 12.7 | 30.4 | 22.5 | 15.3 | 31.1 | 23.9 | 17.4 |
| Event 2 | - | - | - | 0.05 | - | - | 0.96 | - | - | 1.7 | - | - | 2.2 | - | - | 2.6 | - | - | |
| Event 3 | 21.1 | 8.4 | - | 23.5 | 12.4 | 2.8 | 25.2 | 15.4 | 6.7 | 26.5 | 17.8 | 9.9 | 27.5 | 19.6 | 12.4 | 28.3 | 21.1 | 14.5 | |
| Event 4 | 11.8 | - | - | 14.1 | 3.08 | - | 15.8 | 6.09 | - | 17.2 | 8.4 | 0.54 | 18.2 | 10.3 | 3.08 | 18.9 | 11.8 | 5.2 | |
| B3 | Event 1 | 22.5 | 11.8 | 2.4 | 24.4 | 15.2 | 6.9 | 25.8 | 17.8 | 10.4 | 26.9 | 19.7 | 13.1 | 27.7 | 21.3 | 15.2 | 28.4 | 22.5 | 16.9 |
| Event 2 | 4.7 | - | - | 5.8 | 0.8 | - | 6.5 | 2.2 | - | 7.1 | 3.2 | - | 7.5 | 4.1 | 0.8 | 7.8 | 4.7 | 1.8 | |
| Event 3 | 19.8 | 9.0 | - | 21.7 | 12.5 | - | 23.1 | 14.9 | - | 24.1 | 16.9 | - | 24.9 | 18.5 | - | 25.6 | 19.8 | - | |
| Event 4 | 14.9 | 4.3 | - | 16.9 | 7.7 | - | 18.3 | 10.2 | 2.9 | 19.4 | 12.2 | 5.5 | 20.2 | 13.7 | 7.7 | 20.9 | 14.9 | 9.5 | |
| B4 | Event 1 | 3.7 | 0.8 | - | 4.2 | 1.8 | - | 0.46 | 2.45 | 0.39 | 4.83 | 2.9 | 1.2 | 5.0 | 3.4 | 1.8 | 5.2 | 3.7 | 2.2 |
| Event 2 | 7.7 | 4.8 | 1.9 | 8.2 | 5.8 | 3.4 | 8.6 | 6.5 | 4.4 | 8.8 | 6.9 | 5.2 | 9.0 | 7.4 | 5.8 | 9.2 | 7.7 | 6.2 | |
| Event 3 | 11.3 | - | - | 14.6 | - | - | 16.9 | 3.5 | - | 18.8 | 6.9 | - | 20.3 | 9.2 | - | 21.5 | 11.3 | 2.3 | |
| Event 4 | 5.8 | 2.9 | 0.11 | 6.4 | 3.9 | 1.5 | 6.7 | 4.6 | 2.5 | 6.9 | 5.1 | 3.3 | 7.2 | 5.5 | 3.9 | 7.3 | 5.8 | 4.4 | |
| B5 | Event 1 | - | - | - | 0.27 | - | - | 0.53 | - | - | 0.72 | - | - | 0.87 | - | - | 0.99 | - | - |
| Event 2 | 5.0 | - | - | 6.4 | - | - | 7.3 | 1.6 | - | 8.1 | 3.0 | - | 8.6 | 4.1 | - | 9.1 | 5.0 | 1.1 | |
| Event 3 | 11.5 | - | - | 13.9 | 2.2 | - | 15.8 | 5.4 | - | 17.2 | 7.9 | - | 18.3 | 9.9 | 2.2 | 19.2 | 11.5 | 4.5 | |
| Event 4 | 4.6 | - | - | 7.1 | - | - | 8.9 | - | - | 10.3 | 0.98 | - | 11.4 | 2.9 | - | 12.3 | 4.6 | - | |
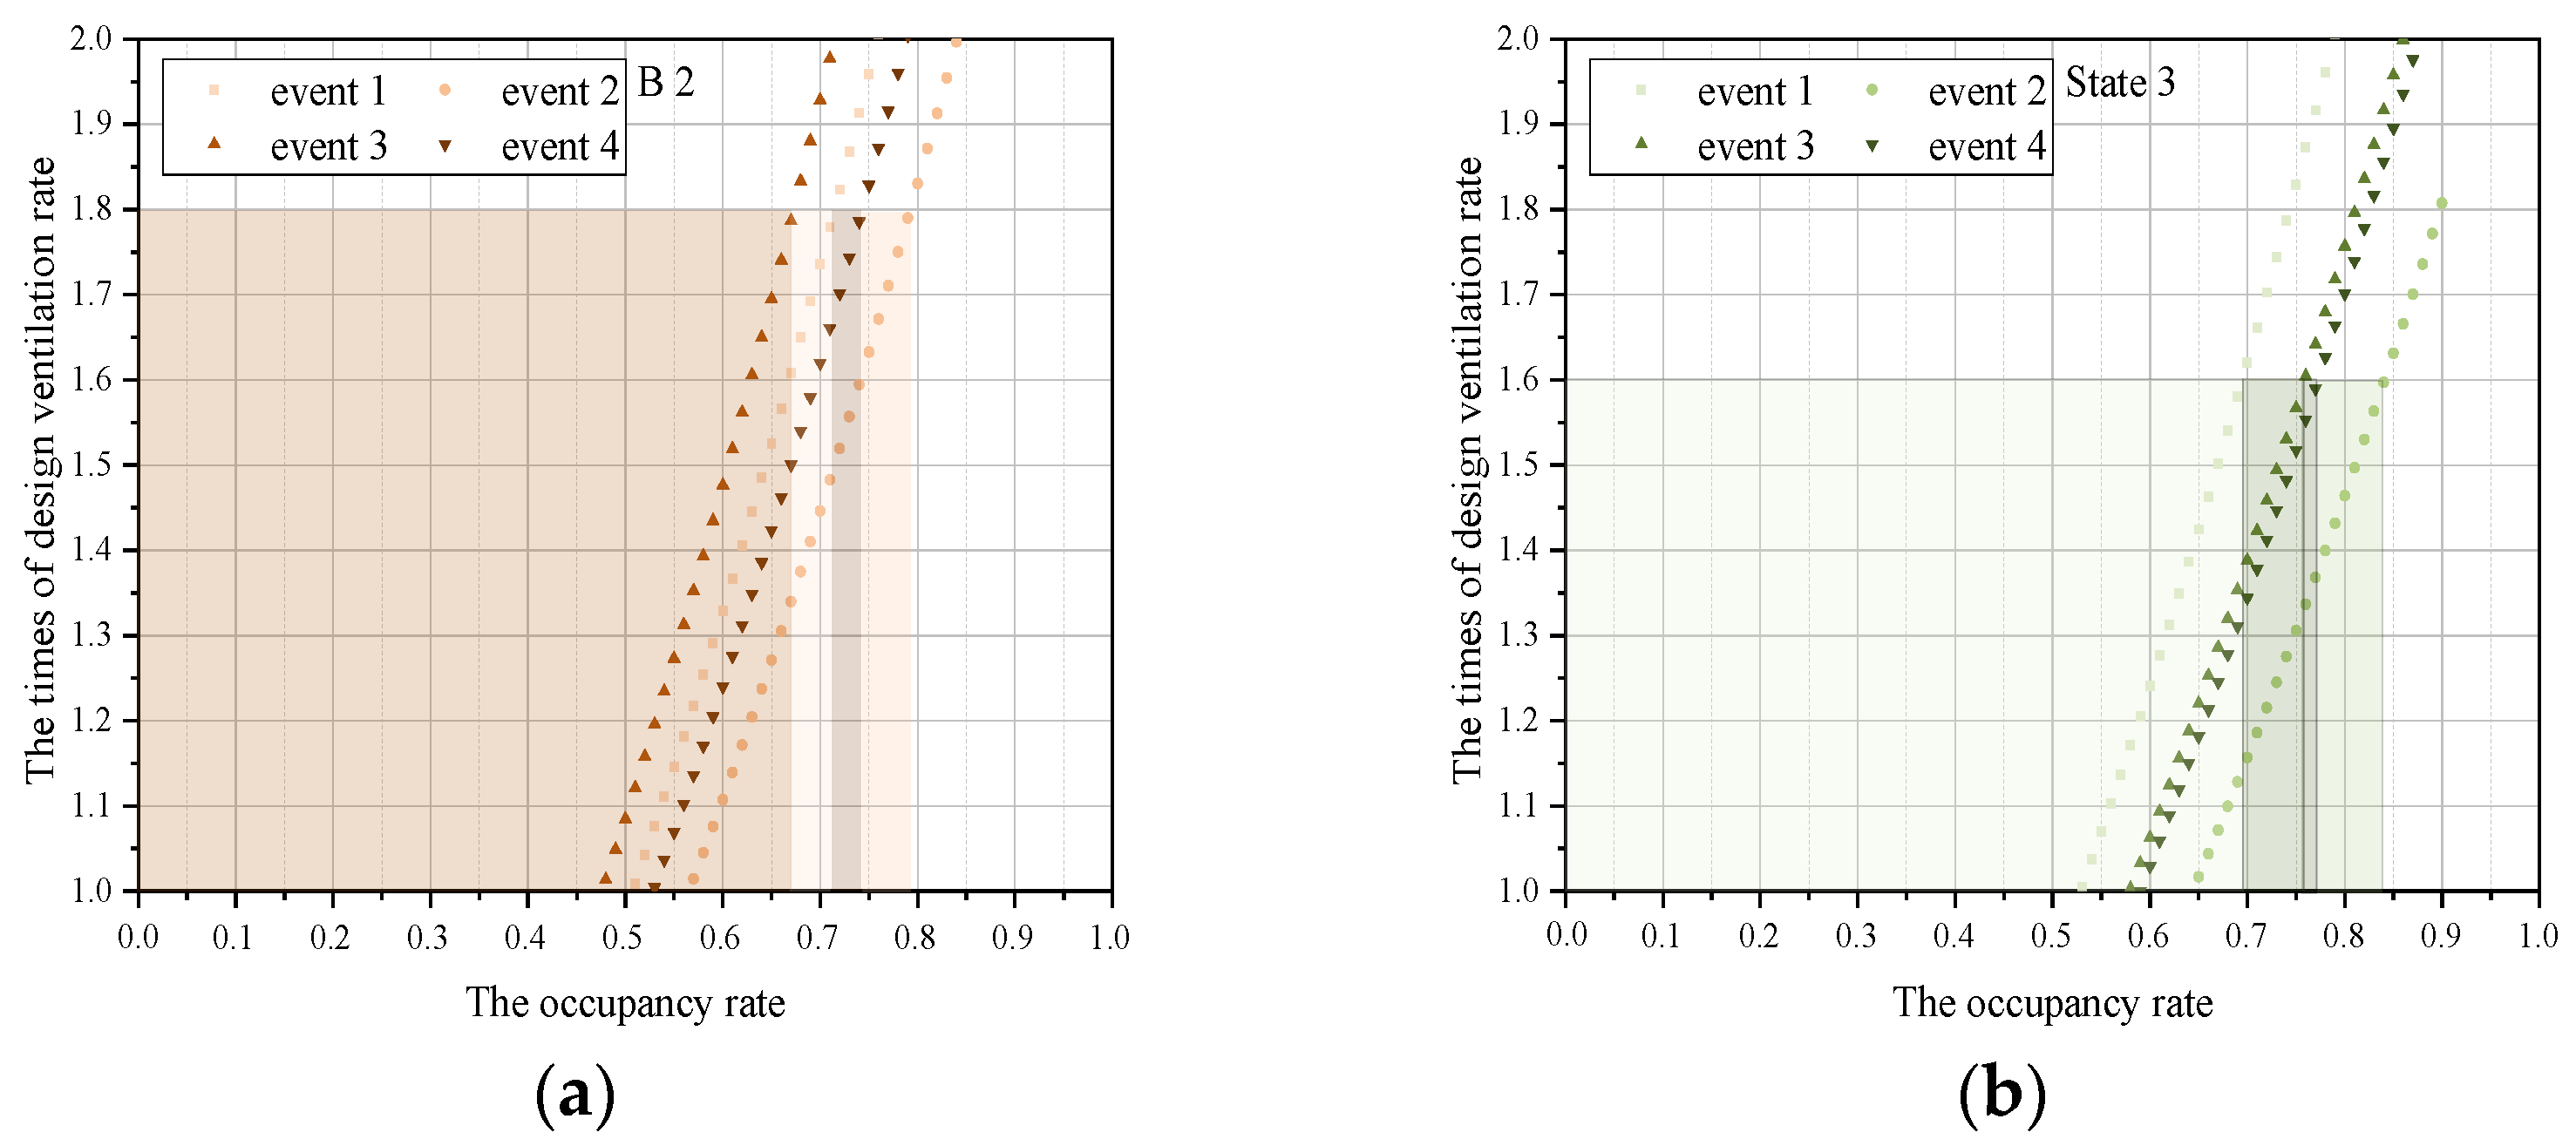
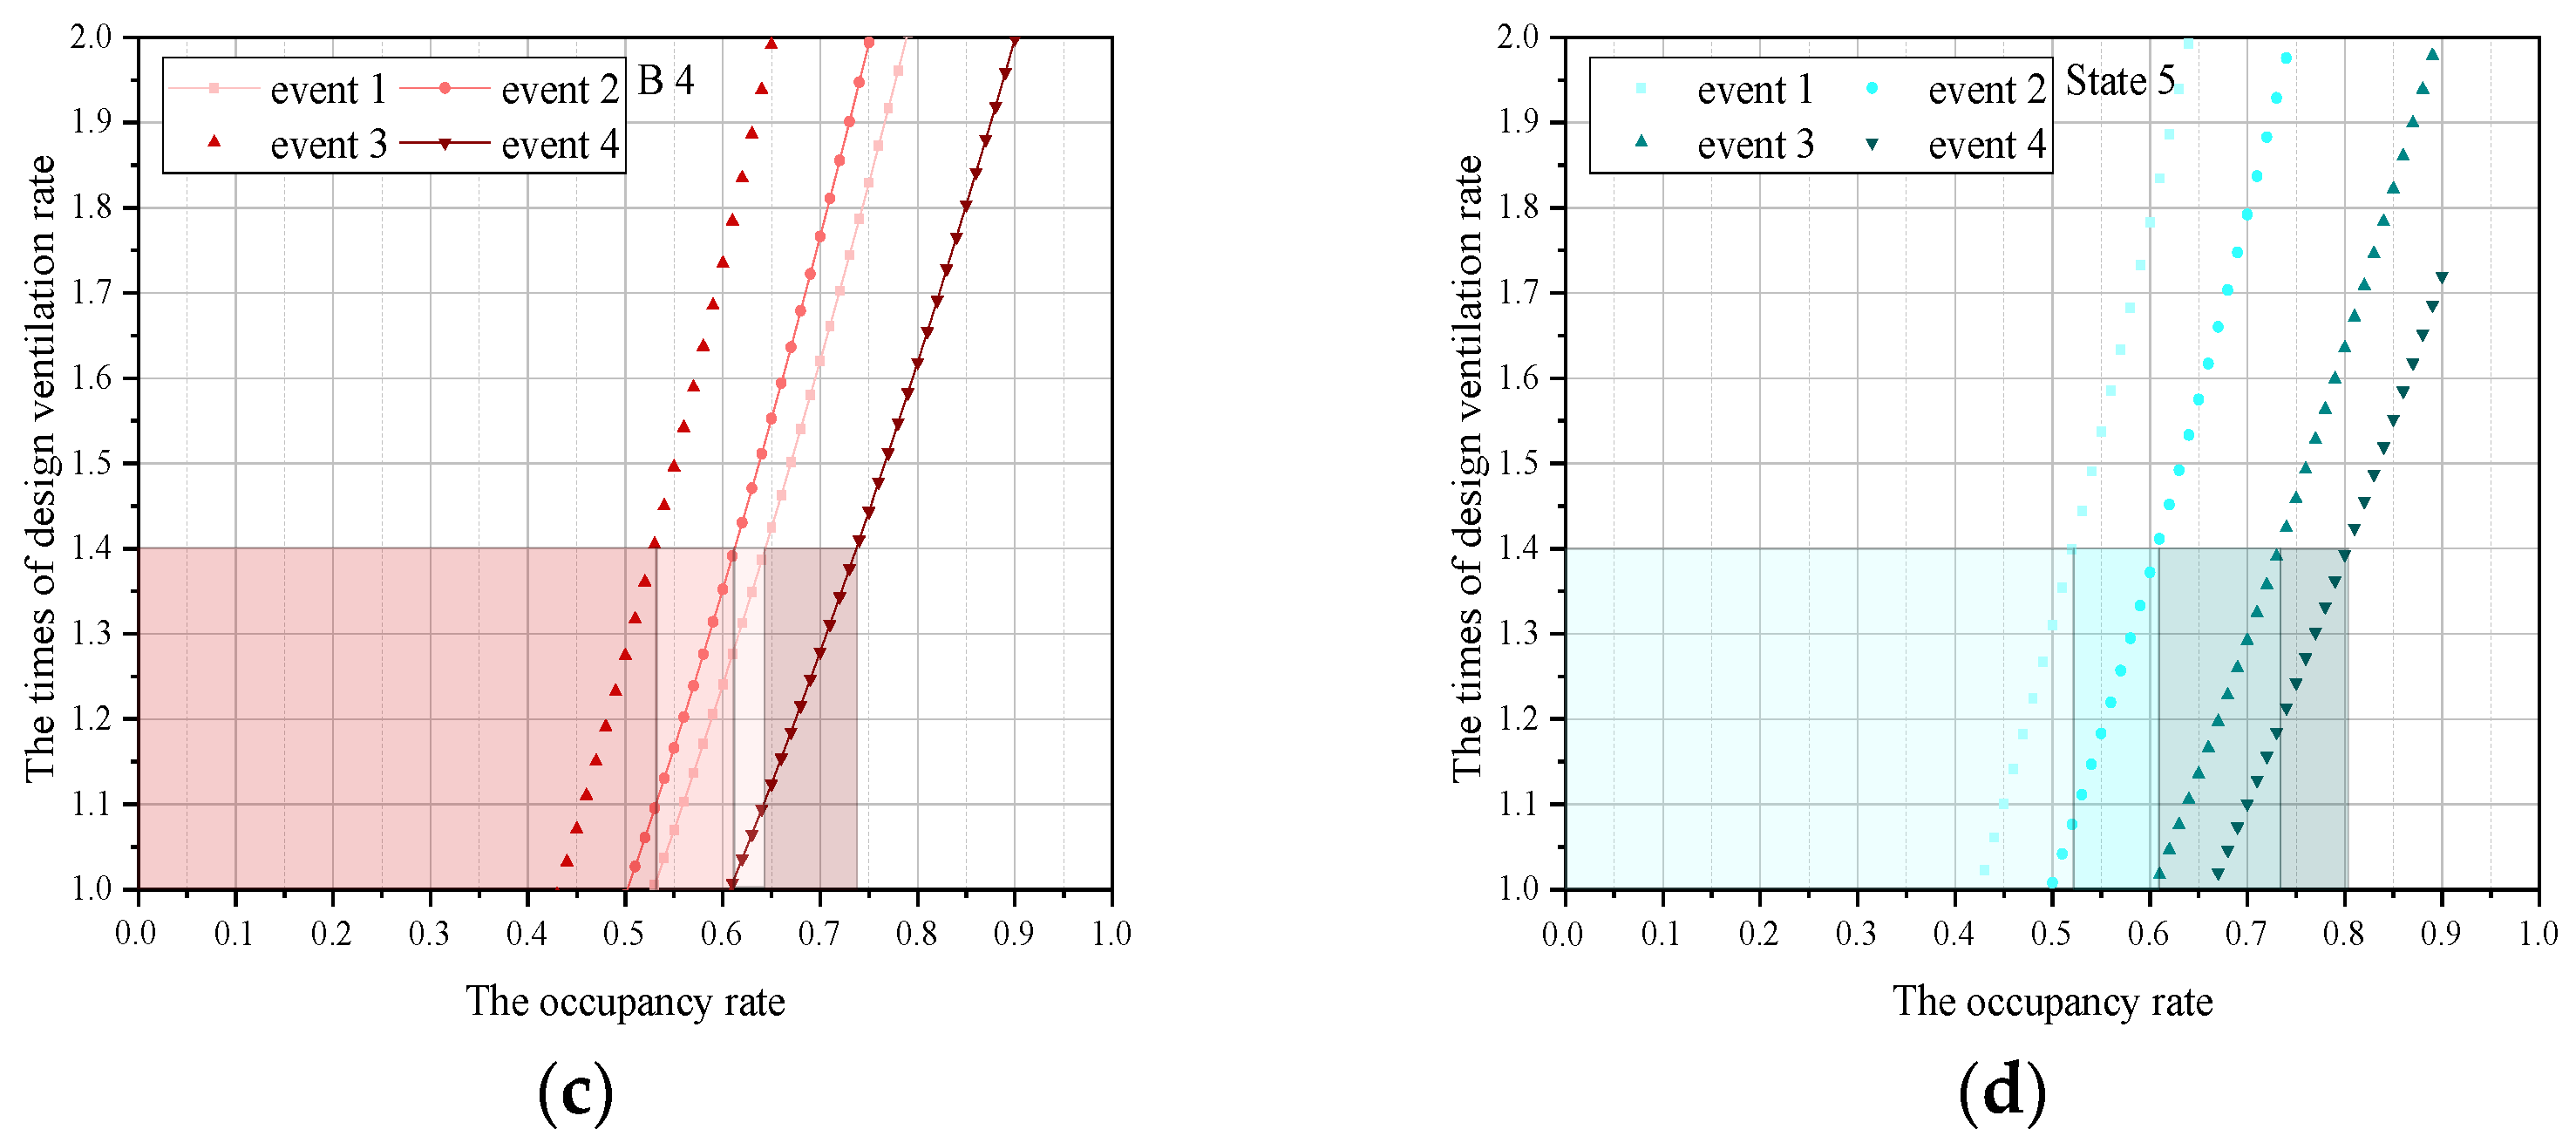
| Building | The Times of Design Ventilation Rate | The Upper Limit of Occupancy Rate during Typical Events | |||
|---|---|---|---|---|---|
| Event 1 | Event 2 | Event 3 | Event 4 | ||
| B2 | 1.0 times | 0.50 | 0.56 | 0.48 | 0.52 |
| 1.2 times | 0.56 | 0.63 | 0.52 | 0.60 | |
| 1.4 times | 0.62 | 0.67 | 0.57 | 0.65 | |
| 1.6 times | 0.67 | 0.74 | 0.63 | 0.70 | |
| 1.8 times | 0.72 | 0.78 | 0.68 | 0.74 | |
| 2.0 times | 0.76 | 0.84 | 0.72 | 0.87 | |
| Reference | 0.72 | 0.21 | 0.67 | 0.48 | |
| B3 | 1.0 times | 0.53 | 0.65 | 0.58 | 0.59 |
| 1.2 times | 0.59 | 0.72 | 0.63 | 0.66 | |
| 1.4 times | 0.64 | 0.77 | 0.70 | 0.72 | |
| 1.6 times | 0.69 | 0.74 | 0.76 | 0.77 | |
| 1.8 times | 0.75 | 0.90 | 0.80 | 0.82 | |
| 2.0 times | 0.79 | 1.0 | 0.85 | 0.87 | |
| Reference | 0.68 | 0.45 | 0.74 | 0.61 | |
| B4 | 1.0 times | 0.53 | 0.50 | 0.43 | 0.61 |
| 1.2 times | 0.58 | 0.52 | 0.48 | 0.68 | |
| 1.4 times | 0.64 | 0.63 | 0.53 | 0.74 | |
| 1.6 times | 0.70 | 0.65 | 0.55 | 0.80 | |
| 1.8 times | 0.75 | 0.70 | 0.60 | 0.85 | |
| 2.0 times | 0.78 | 0.75 | 0.65 | 0.91 | |
| Reference | 0.57 | 0.63 | 0.41 | 0.76 | |
| B5 | 1.0 times | 0.42 | 0.50 | 0.60 | 0.66 |
| 1.2 times | 0.47 | 0.55 | 0.62 | 0.73 | |
| 1.4 times | 0.52 | 0.61 | 0.73 | 0.80 | |
| 1.6 times | 0.57 | 0.67 | 0.78 | 0.87 | |
| 1.8 times | 0.60 | 0.70 | 0.85 | 1.0 | |
| 2.0 times | 0.64 | 0.75 | 0.90 | 1.0 | |
| Reference | 0.24 | 0.41 | 0.66 | 0.33 | |
Publisher’s Note: MDPI stays neutral with regard to jurisdictional claims in published maps and institutional affiliations. |
© 2022 by the authors. Licensee MDPI, Basel, Switzerland. This article is an open access article distributed under the terms and conditions of the Creative Commons Attribution (CC BY) license (https://creativecommons.org/licenses/by/4.0/).
Share and Cite
Chen, W.; Ding, Y.; Zhang, Y.; Tian, Z.; Wei, S. Risk Assessment and Prevention Strategy of Virus Infection in the Context of University Resumption. Buildings 2022, 12, 806. https://doi.org/10.3390/buildings12060806
Chen W, Ding Y, Zhang Y, Tian Z, Wei S. Risk Assessment and Prevention Strategy of Virus Infection in the Context of University Resumption. Buildings. 2022; 12(6):806. https://doi.org/10.3390/buildings12060806
Chicago/Turabian StyleChen, Wanyue, Yan Ding, Yu Zhang, Zhe Tian, and Shen Wei. 2022. "Risk Assessment and Prevention Strategy of Virus Infection in the Context of University Resumption" Buildings 12, no. 6: 806. https://doi.org/10.3390/buildings12060806
APA StyleChen, W., Ding, Y., Zhang, Y., Tian, Z., & Wei, S. (2022). Risk Assessment and Prevention Strategy of Virus Infection in the Context of University Resumption. Buildings, 12(6), 806. https://doi.org/10.3390/buildings12060806