Article

The Influence of Physical Activation of Portland Cement in the Electromagnetic Vortex Layer on the Structure Formation of Cement Stone: The Effect of Extended Storage Period and Carbon Nanotubes Modification

1
Civil Engineering Department, Kazan State University of Architecture and Engineering, 420043 Kazan, Russia
2
Department of Building Materials Technology, Saint Petersburg State University of Architecture and Civil Engineering, 190005 St. Petersburg, Russia
3
Department of Printing Technologies and Materials, Kazan National Research Technological University, 420015 Kazan, Russia
*
Author to whom correspondence should be addressed.
Buildings 2022, 12(6), 711; https://doi.org/10.3390/buildings12060711
Submission received: 29 April 2022 / Revised: 22 May 2022 / Accepted: 23 May 2022 / Published: 25 May 2022
(This article belongs to the Section Building Materials, and Repair & Renovation)

Abstract

:
The article presents research of the influence of the electromagnetic vortex layer on the structure formation of cement stone during the activation of portland cement, both without additives and with carbon nanotubes modification. It has been shown that the storage of portland cement powders in open air for 60 days after activation in the electromagnetic mill leads to partial carbonization, wherein the role in absorption reducing of the super plasticizer additive is increased since there is more uniformly localization of the additive on the surface of the portland cement particles. The processing of portland cement in the electromagnetic mill leads to the physical activation of portland cement, which is accompanied by an increase in the amount of heat generated by the hydration of portland cement and the rate of hydration. Thus, the rate of hydration of compositions activated in the electromagnetic mill isincreased 1.615 times at the temperature of the thermostat 22 °C; 1.85 times at 40 °C; 2.71 times at 60 °C; 2.3 times at 80 °C. The modification of cement stonewith carbon nanotubes, which was obtained from portland cement activated in an electromagnetic mill, leads to a higher quantity of silicate phase of portland cement (by 12–39%), as confirmed by a decrease in the number of portlandite in these compositions by 8% in comparison with control composition.

1. Introduction

Improving the physical and mechanical properties of building composites is an actual task of building materials science [1,2,3]. One of the effective ways of increasing the physical and mechanical properties of building materials without additional physical and chemical modification or increase of the binder content is physical activation. Numerous studies have been carried out in this regard. For example, the influence of siliceous tailings as an additive to portland cement by high energy grinding [4], steel slag wet grinding [5], flyash wet grinding [6], nano-kaolin wet grinding [7], glass powder [8] on the properties of obtained cement stone and concrete. The activation of initial binder, or fillers, aggregates, mixing water was produced in devices of different design solution, characterized by the method used for mill charge impact [9,10].
Depending on the design of the activation devices, the following effects on the activated material are distinguished: pressure intensity [11,12], shifted pressure [13], external effects [14,15] and non-mechanic effects [16]. In the development of grinding devices, the highest priority is given to the power density indicator, determined by the amount of energy transferred to the unit of material per time unit [17]. This indicator is the highest in vortex-layer devices by comparison between different ball and vibration mills, rotary-pulsation devices [18]. The first assessing of the influence extent in the vortex layer on the material processed in the devices of such constructions was described by Logvinenko D. D. in 1976, who, with the help of IR spectroscopy, observed a significant deformation of the crystal kaolin lattice [19].
The vortex layer device (VLD), also known as the electromagnetic mill, can be used for processing mineral raw materials and is characterized by minimal energy consumption in relation to achievement results [20]. The work [21] shows an effective method for producing clinkerless cements in the electromagnetic mill. It has been established that the activation of blast furnace slag increases its hydraulic properties. The influence of the motion of grinding bodies, size of working chamber on productivity of electromagnetic mill, the comparison of dry and wet grinding, and optimization of energy consumption in electromagnetic mill are represented in works [22,23,24,25]. However, no results of the study on the influence of the vortex electromagnetic layer in the activation of portland cement on the structure formation of cement materials can be observed in the presented data.
Furthermore, the result of processed material in the vortex layer device is an increase in the surface area of portland cement particles, which contributes to the improvement in the sorption of water vapor from air during the storage period. There is a [26,27] decrease in the strength of cement stone to 30% from portland cement stored in the open air within 3–6 months. It is also noted that portland cement stored in open-air can increase its mass to 13% [28]. However, studies aimed at determining the duration of the activation effect after grinding in the vortex layer device almost are not given. The practical value of such research is obvious, regardless of the method of activation or the type of device in which it is performed.
The number of studies has increased significantly in the field of modification of cement materials by different types of nano-microsized particles: silica, titanium dioxide, iron, soot, astralenes, fullerenes, single-wall (SWCNT) and multi-wall (MWCNT) carbon nanotubes, nanofibers, etc. There is an increased interest in using CNTs [29] cement composites as modifiers. This is due to their lower cost and the effectiveness of an impact on the physical–mechanical properties of composites. The effectiveness of an impact of MWCNT on the operating properties of building compositions is determined by their quality, which depends on the method of producing (chemical deposition from the gas phase, laser ablation, and electric arc method) and treatment techniques [30,31,32].
However, it is the method of activation of nanodispersed additives (functionalization, dispergation in a nanocluster, and dispergation in the solutions of active surfactant material) that has a decisive influence on the structural formation of construction composites. The Russian Federation patent for the invention [33] of a method for CNT dispergation in the air dispersion of portland cement by means of a vortex electromagnetic field impact is proposed. At the same time, there are no practical results of the influence of CNT on the mineralogical composition of the cement stone produced according to this method. The aim of this paper is to investigate the effects of processing parameters in the vortex layer device on the chemical composition and properties of portland cement, both immediately after treatment and after long-term storage in the natural atmosphere, and determining the influence of CNT and plasticizer on mineralogical composition of hydration products of activated portland cement and properties of cement dough and cement stone.

2. Materials and Methods

The cement used in this study was portland cement CEM I 42.5 of the Novotroitsky cement factory (Novotroitsk, Russia); the properties meet the requirements according to the state Russian standard 31108-2016. Carbon nanotubes (CNT) were applied in the research: «TUBALLTM» is a single-wall carbon nanotube manufactured by «OCSiAl» (Luxembourg) (a specific surface of 500–1000 m2/g), and «Graphistrength» tubesare multi-wall carbon nanotubes manufactured by «Arkema» Istanbul, Turkey. As an additive, a plasticizer (SP) Melflux 2651 F (hereinafter, MF) was used, which is a chemical additive based on polyether carboxylate (the polymer chain is formed by α, β-unsaturated carboxylic acids), a powder with a bulk density of 400–600 kg/m3, produced by the «BASF» Ludwigshafen, Germany. The content of MF plasticizer was 1% in the test compositions, the content of the test carbon nanotubes amounted to 0.005% of the weight of portland cement.
For determining the heat flux of the test samples during hydration, differential scanning calorimetry (DSC) was applied. The studies were carried out in a differential scanning calorimeter Q200 by «TAInstruments» (New Castle, DE, USA). For measuring heat flux, a sample pressed into a crucible and an empty comparing crucible were fixed on a thermoelectric disk of the oven. With the oven temperature variation (usually heating occurs at a linear velocity), heat is transferred to the sample and the comparing crucible through a thermoelectric disk. The alteration of differential heat flow between the sample and the comparison sample is measured by the use of thermocouple elements.
The preparation of samples for the test by the DSC method was as follows: a 200 mL glass of polypropylene was filled with a thoroughly mixed 100 g cement suspension. Further, a sample was taken for thermal analysis with the amount of 5 mg, sealed on a manual press with a non-airtight lid. The crucible with a sample was placed in the temperature chamber of the DSC device at a predetermined test temperature (22; 40; 60 and 80 °C) and the test program was set: “exposure within 8 h” by controls of the DSC device. Obtained data were processed using the «Universal TAInstruments» software, New York, NY, USA. The DSC system consists of three main components: a differential scanning calorimeter, a cell (Figure 1), which monitors heat flow and temperature, and a cooling system. The choice of cooling system is effectuated in accordance with the required temperature range.
IR spectroscopy was used to investigate portland cement hydration products. To accomplish this, cubes with dimension 2 × 2 × 2 cm were obtained from cement paste, hardened for 28 days under normal humidity conditions. The IR spectra of the samples were recorded on the Fourier IR spectrophotometer of Perkin-Elmer, Waltham, MA, USA, model Spectrum 65, by means of the attenuated total internal reflection spectroscopy Miracle ATR (crystal ZnSe) in the area of 4000–600 cm−1, usually with 30 scans. The registration and subtraction of the background spectrum was recorded automatically. The samples were preliminarily ground in the agate mortar to micron-sized particles, after which the formed powder was applied against the ATR crystal with a special clamp, included in the kit. After registration, the ATR was automatically carried out and saved. Quantitative analysis is based on the application of the laws of light absorption. The area calculation was performed, using the supplied Spectrum 10 software and was used to quantify functional groups.
The specific surface of the powder materials was determined by the gas permeability method on the PSC-9 appliance. The temperature of portland cement processed in VLD was measured with TemPro 300 pyrometer, Calgary, AB, Canada, with a range between minus 32 to plus 350 °C, with an accuracy of measurement ±1.5 °C.
The mechanical properties of fine concrete were determined according to the Russian standard 10180-2012 Concretes. Methods for strength determination used reference specimens on samples of cubes of 10 × 10 × 10 cm (set of 6 samples). According to the information received, the arithmetic mean of the tested samples in the series was defined. The portland cement consumption amounted to 400 kg/m3. The water–cement ratio was selected for the purpose of receiving concrete compositions of one consistency with the fluidity P3 in accordance with EN 12350-1:2009 and Russian standard 10181-2014. The change in the mass of the initial portland cement, including that processed in VLD and (or) modified by plasticizers, stored in the desiccator at a relative humidity of 70 ± 5% and a temperature of 20 ± 3 °C (%) was calculated by the formula
∆M = 100·(m1 − m0)/m1
where m0 is the original mass of portland cement, and m1 is the post-test mass of portland cement. One of the criteria for reducing the technical properties of activated portland cement affected by air curing over time is the change in the mass of portland cement due to contact with air of natural humidity. The amount of water absorbency (in %) was calculated by the formula
W = 100·(m0 − m2)/m0
where m2 is the mass of portland cement after air curing and subsequent drying with the temperature of 105–110 °C.

Activation in an Electromagnetic Mill

Cement was processed in the vortex layer device (VLD), using model 297 manufactured by LLC «Regionmettrans». The standard design of the vortex layer device is shown in Figure 2. Numbers displayed in the figure denote the following: 1—the magnetic circuit of the inductor; 2—three-phase winding of the inductor; 3—the non-magnetic cylindrical body of the working area of the device; 4—ferrimagnetic needles; 5—treated material; 6—casing.
Then, the estimated quantity of CNT was previously mixed with portland cement and we processed the resultant mixture of portland cement and CNT in the vortex layer device in accordance with the method which is represented in the work [33]. In this regard, dispersion processes of mixture components were occurred, as well as their interfusion and volume distribution. The processing duration in the VLD was varied in the range of 1–5 min. At the same time, according to [34,35], the optimal modes of VLD operation are as follows: processing time (activation)—5 min; the rotating velocity of electromagnetic field—70 Hz; diameter–length ratio of ferromagnetic material—0.12; the ratio of ferromagnetic material mass to the mill charge mass—0.4. After processing, the resulting mixture was unloaded into a concrete mixer and mixed with the components of cement stone or concrete.
It was established in works [34,35] that with the abovementioned parameters of the activation of portland cement in VLD, the compressive strength of the concrete of forecasted class B22.5 at the age of 28 days of hardening increased to 1.5 times, and in the first days of hardening increased to 2.44 times.

3. Results

The IR spectroscopy method [36] is one of the tested methods for the investigation of the chemical composition of a substance, the detection of new chemical bonds (compounds), and the evaluation of various technological and/or operational factors on stress condition of the material.

3.1. Determination the Impact of Activation of Portland Cement in VLD on Chemical Composition by IR-Spectroscopy Method

The IR spectra of portland cement powders processed within different times in VLD and other optimal parameters of machine operation were obtained. The initial portland cement powders were processed for 1, 3, 5 and 7 min. The IR spectrograms selected immediately after activation of the investigated powders are shown in Figure 3. Furthermore, the effect of the VLD treatment on the chemical composition of portland cement included in a mixture of portland cement and MF plasticizer was further investigated.
As shown in Figure 3, visible differences in the IR spectra of the initial and processed portland cement powders are identified at any duration in the VLD. For example, visible spectrum increasing and widening is observed at 3645 cm−1; 1125 cm−1 и 885 cm−1. A narrow peak at 3645 cm−1 relates to valence vibrations of the –OH group included in the crystalline structure of silicates (water fixed in the crystallographic structure) [
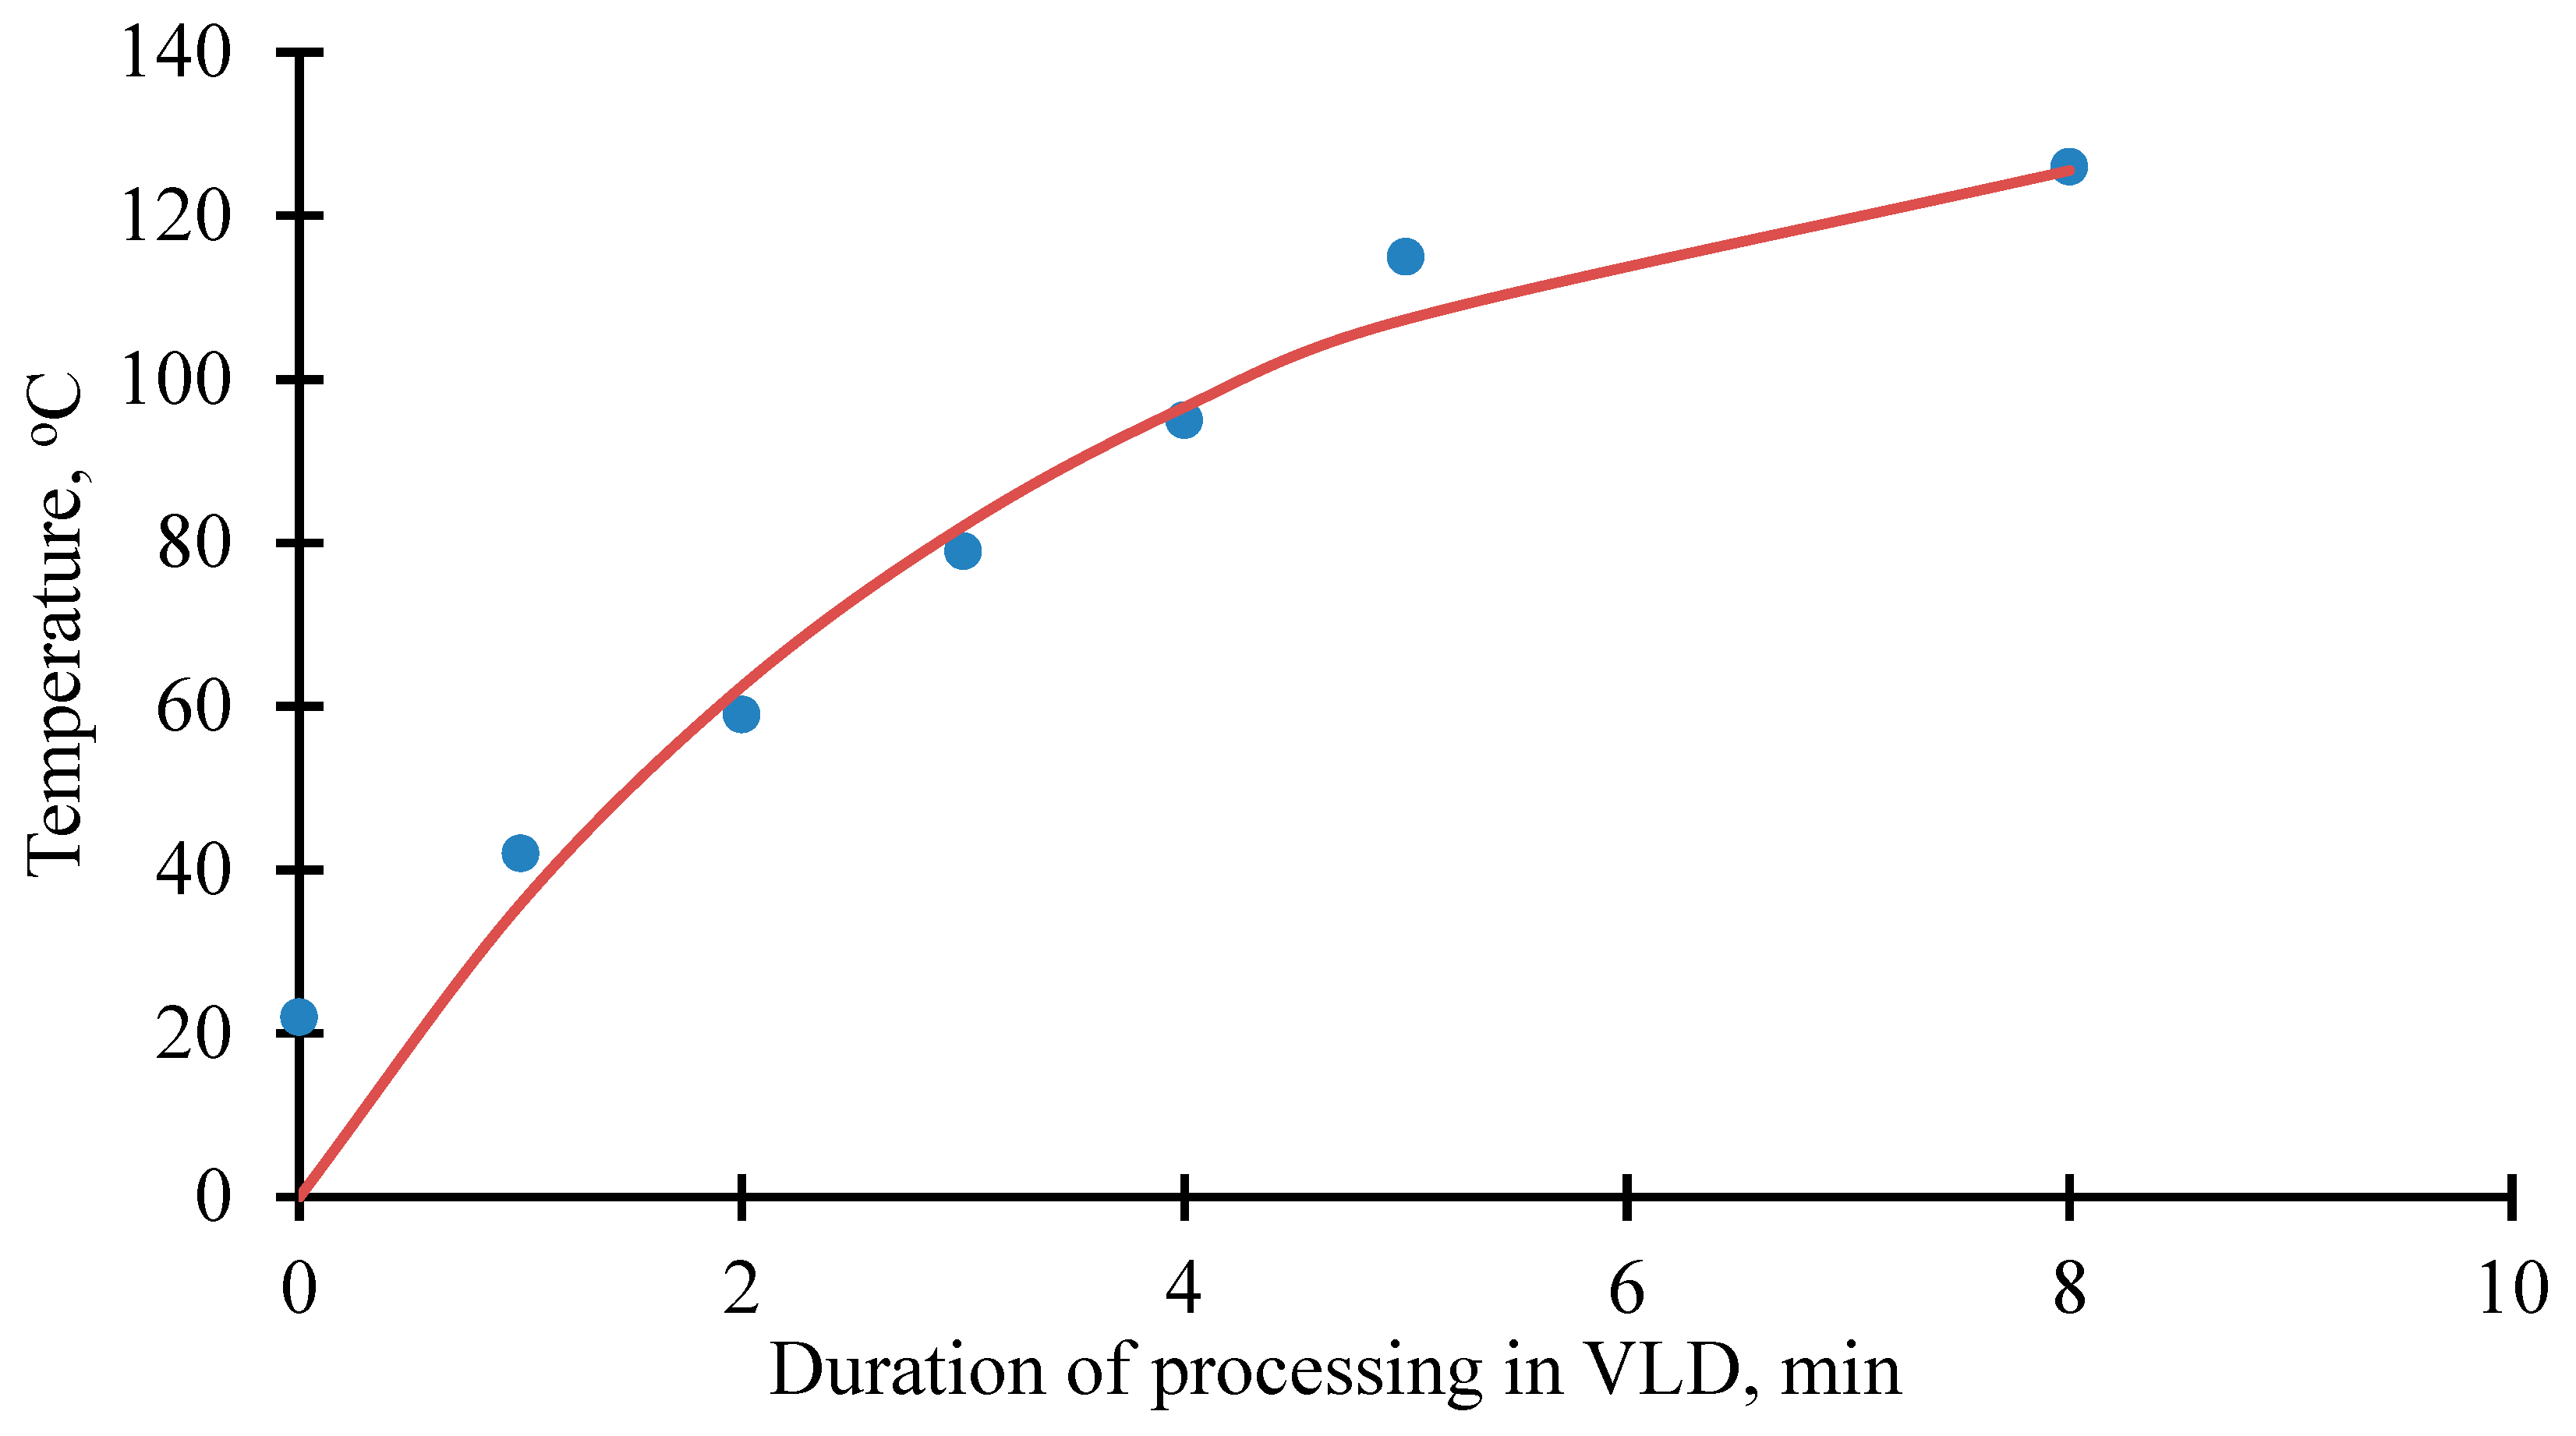
36]. Activation leads to a reduction of this absorption band, suggesting that water is removed from the portland cement powders. This assumption is supported by the temperature of the portland cement powder processed in VLD (Figure 4). From the data presented, it is evident that the temperature of portland cement powder up to 5 min of processing in VLD is growing almost linearly at a rate of 18.4 °C/min. Then, the growth rate of the temperature is significantly reduced (3.7 °C/min). The relationship between the temperature of the portland cement powder and the processing duration in the VLD has the following form:
T ( t ) = 137.9 ( 1 exp ( 0.302 t ) )
It is seen from relationship (3) that the maximal heating-up temperature of portland cement powder processed in VLD above 8 min can reach 138 °C. The experimentally established heating-up temperature (the processing time in VLD at least 2 min) provided thermal degradation of such portland cement components as gypsum stone.
The absorption band of control sample is recorded in the range 3410–3420 cm−1 associated the valence oscillations of the -OH group by hydrogen bonds [37]. Compared to the control composition, the activation of 1 min reduces significantly the intensity of the maximum characteristic of the related -OH -groups. The longer activation time of more than 1 min leads to the disappearance of the band associated with the dehydration of the samples due to the increased temperature during processing in VLD.
The absorption band observed in the investigated infrared spectra at 1474 cm−1 is caused by the oscillation of CO3 groups in calcium carbonate crystals. The activation of portland cement practically does not affect the change in intensity of the specified band. This leads to the conclusion that there is no effect of the treatment in VLD on the calcium carbonate content in portland cement. In the range at 1125 cm−1 there are valence oscillations of the Si-O bond, and there is an increase in the spectrum with the duration of activation.
The absorption bands on the portlandcement in the area 500–885 cm−1 by IR spectrogram correspond to the mixed complex combinations of Al-O and Ca-O, which is the case for the mixture of mono-, calcium dialuminate and α-Al2O3. The lack of absorption bands of -OH valence bands and the increase in the number of Al-O and Ca-O bonds in activated compositions indicate an increase in the adsorption capacity of activated portland cement. The characteristic anomaly area according to Figure 3 is shown in Table 1.
The IR spectra of powders were investigated within 60 days of storage from the time of their activation in order to determine the changes occurring in portland cement processed in VLD during natural atmospheric conditions. The duration of storage of portland cement powders’ storage period for 60 days is determined by the requirements of Russian standard 30515-2013, conforming to European standards EN 197-1:2011 and EN 197-2:2000. According to these standards, the portland cement storage period is 60 days in the manufacturer’s packing. The obtained results are presented in Table 2.
After the 60-day portland cement storage period, characteristic bands are observed on IR spectrograms which tally with the samples taken immediately after activation. However, deviations in anomaly areas are observed at 1474 cm−1. More significant carbonization of portland cement (over 90% in comparison to the control composition) is identified, which increases with the duration of processing in VLD.
Thus, it is established that due to the heating during processing of the portland cement in VLD, the intensity of the maximum is reduced at 3645 cm−1, characterizing the –OH group. It is shown that the activation of portland cement has almost no effect on the intensity of the absorption band at 1474 cm−1, which characterizes the oscillation of the CO3- group in the calcium carbonate crystals. Furthermore, the infrared spectra of portland cement powders after 60 days of storage from the moment of their activation show an increase in the intensity of the peak corresponding to the CO3- group with an increase in the processing time in the VLD. In addition, the increase in the number of Al-O and Ca-O bonds in the VLD activation compositions indicates an increase in the adsorption capacity of activated portland cement.
Naturally, the physical activation of dispersed materials (powders) should lead to significant impact associated with surface effects (dissolution, adsorption, wetting, etc.). As is known, wetting heat is released by the wetting of a solid body [38] which is more affected for lyophilic materials than for lyophobic materials. For chemically active components, surface events are expected to occur more intensively. In this context, a study was carried out on the influence of the activation of portland cement in VLD on the heat of its hydration using the differential scanning calorimetry method. Measurements were made for 480 min at different thermostat temperatures: 22 °C, 40 °C, 60 °C and 80 °C. The resulting thermograms are shown in Figure 5, and the analysis of the received thermograms is summarized in Table 3.
According to the Table 3 it can be seen that the total amount of emitted heat in the first 100 min of hydration activated in the VLD is higher in 5,6 times at the temperature of the thermostat 22 °C; 1.43 times at 40 °C; and 5.126 times at 60 °C 2.24 times at 80 °C, as compared to the conventional formulations, accordingly.
Furthermore, the rate of hydration of the compositions produced by activation in VLD is greater than the compositions produced without activation 1.615 times at 22 °C; 1.85 times 40 °C; 2.71 times 60 °C; 2.3 times at 80 °C. A characteristic showing the physical activation of portland cement in VLD are the properties listed in Table 3 assigned to the surface area of the powdered portland cement. These specific characteristics are presented in Table 4.
Table 4 shows that the treatment of portland cement in VLD leads to the physical activation of portland cement, which is accompanied by an increase in the amount of heat generated by the hydration of portland cement and the rate of hydration.

3.2. Determination the Impact of Storage Duration of Portland Cement on Kinetics of Mass-Change and Compressive Strength of Fine-Aggregate Concrete

The influence of processing portland cement in VLD and the presence of a plasticizer on the kinetics of mass-change of portland cement during storage in laboratory conditions at a relative humidity of 70 ± 5% and at a temperature of 20 ± 3 °C within 1.5–3 months is determined. The results of the experiment are given in Figure 6a. The analysis of the obtained experimental data was carried out according to the given characteristic ∆M/Si, (here, Si is the specific surface area of the i composition). The results are presented in Figure 6b.
Figure 6a shows that the activation of portland cement increases the absorption of moisture from the natural atmosphere. Moreover, as the processing time in VLD increases, the quantity of water absorbed by the portland cement powder from the natural atmosphere increases. By 90 days of exposure in the natural atmosphere, the amount of water absorbed by composition No 3 is greater than composition No 1 by 37%, and by 53% for composition No 4. Obviously, this difference related to a change in the specific surface area of the portland cement powder. The evaluation of the quantity of absorbed water shows that this value is almost identical for compositions No 1, No 3 and No 4; the deviations are small and may be related to the physical inaccuracy of measurement (Figure 6b). Thus, the increase in the amount of water absorbed by portland cement powder when exposed in the natural atmosphere is caused by the increase in the surface area of the powder.
A significant decrease in the amount of water absorbed by portland cement powder is observed for portland cement processed in VLD jointly with the MF plasticizer (Figure 6). Moreover, the dependence on the processing time in VLD maintains the trends, that is, as the processing time in VLD increases, the quantity of water absorbed decreases. An obvious assumption for determining the cause of these deviations in the absorption of portland cement powder is the placement on the surface of the particles of portland cement of a plasticizer MF, which in this case should have less ability to absorb water from the natural atmosphere. The experimental test confirmed the assumption that MF plasticizer powder has less ability to absorb water from the atmosphere (Figure 6b). Comparison of data of Figure 6a,b shows that the water absorption of portland cement powder with the MF plasticizer is higher than for MF plasticizer powder only. This indicates the presence of a surface of portland cement powder not covered by the MF «free» plasticizer surface, the fraction of which can be calculated by the formula:
δ S 0 = π f , p π p π f π p ,
where π f , p —the amount of water absorbed by the powder produced by the treatment in VLD of portland cement and MF plasticizer; π f —the quantity of water absorbed by the powder of portland cement; π p —the quantity of water absorbed by the powder of MF plasticizer. The results of the Formula (4) calculation are presented in Table 5.
Table 5 shows that the average proportion of free surface of portland cement particles treated with MF plasticizer in VLD is, on average, 34%. The variation of δ S 0 in time is linked only to random changes in experimental data.
The absorption of water from the natural atmosphere by portland cement should certainly have a negative impact on its strength. In this connection, studies have been carried out on the hardening kinetics of fine-grained concrete from portland cement stored in open air for 0–90 days. The results of the tests are presented in Table 6.
Table 6 shows that storage of portland cement in air results in a significant reduction in the compression strength of the resulting fine-grained concrete. Thus, the reduction in compression strength is up to 36% in compositions No 1 and No 4, and up to 43% in compositions No 2–3, and No 5–6.
The introduction of MF during the grinding of portland cement in VLD and the further storage of obtained cement in open air can slow down the rate of strength reduction of fine-grained concrete. Thus, the decrease in strength is 26–34%, depending on the activation time (compositions No 5–6).
Table 6 shows that the introduction of plasticizer reduces the water–cement ratio, which naturally increases the strength of the material (according to the Bolomei–Skramtaev law [39,40]). In this context, it is interesting to estimate the activity of portland cement in fine-grained concrete (comparing of the compositions No 1–3 and No 4–6). This can be estimated by a formula that is a consequence of the Bolomei–Skramtaev law:
R c , 1 R c , 2 = R b , 1 R b , 2 ( ( C W ) 2 + 0.5 ( C W ) 1 0.5 )
where R c , i is the activity (strength) of portland cement; R b , i —concrete strength; C / W is thecement–water ratio; index «1» и «2» complies with concrete without (compositions No 1–3) and with plasticizer (compositions No 4–6), respectively; sign «+» is chosenas the rule of application in accordance with the rule of application of the Bolomei–Skramtaev law for fine-grained concrete with plasticizer C / W 0.4 .
According to Table 6, the ratio of R c , 1 / R c , 2 for compositions No 1 and No 4 is 1.33, for compositions No 2 and No 5— R c , 1 / R c , 2 = 1.34 and for compositions No 3 and No 6— R c , 1 / R c , 2 = 1.37 . These values display that the contribution of portland cement to the strength of concrete without plasticizer is higher than with a plasticizer. This result is appropriate, as portland cement hydration products in concrete without plasticizer have no spatial difficulty in placing. However, this has negative consequences, both in the formation of a less dense cement stone and in the formation of a cement stone containing fewer clinker stocks, which is a prerequisite for a low durability [41,42].

3.3. Determination the Impact of Activation of Portland Cement in VLD on Phase Composition of Nanomodified Cement Stone

The spectrograms of cement stones obtained without activation and with activation of portland cement in VLD were explored for determination the impact of activation exposure against chemical composition change. Spectrograms of cement stone samples received by traditional method are shown in Figure 7. Quantitative values on basic wavenumberare presented in Table 7.
IR spectrograms of samples of cement stone processed by the activation of portland cement in VLD is illustrated in Figure 8. Estimated absorption areas according to data in Figure 8 are shown in Table 8.
The chemical composition of the hydration products of the cement stone samples, obtained by various methods, has a response rate of 3642; 3400; 1415; 1102; 950; 874 cm−1. The absorption band at 3642 cm−1 was caused by oscillations of –OHgroups and identifies calcium hydrosilicates of different structures (portlandite, xenolite and other hydrosilicates of similar structure). The number of such hydrosilicates in compositions No 2, No 3, produced without activation, decreases by 8–25%, compared to composition 1. The combined activation of CNT TUBALL and portland cement in VLD also reduces the number of hydrosilicates in the cement stone by 8%, compared to the unmodified composition. The modification of the CNT Graphistrength does not affect the content of the mentioned hydrosilicates. The number of hydrosilicates in this group is reduced by 61–69% in compositions No 4–5 (Table 8).
Haчaлoφopмы
Koнeцφopмы
The presence of anomalies at reflections of 1400–1600 cm−1, as well as a wide-banded spectrum in the region of 3400–3500 cm−1, indicates the presence of submicrystallinehydrosilicates of a tobermorite-like structure [43]. The number of hydrosilicate data in the compositions No 2–3 is decreasing compared to the reference composition, while the introduction of the MF additive makes it possible to increase the number of sub-microcrystalls of hydrosilicates of a tobermonite-like structure by 6–32% (Table 7). The activation of portland cement together with CNT and MF in VLD increases the number of mentioned hydrosilicates by 22–55% (Table 8). The clearer resolution of the spectrum in this area indicates a higher degree of roundness of the mentioned hydrosilicates in MF-added compositions.
Haчaлo φopмы
Koнeц φopмы
Absorption bands at 1415–1473cm−1 indicate oscillations of the –OH groups at the vertices of silica–acid tetrahedrons, either belong to calcium carbonate, or may indicate the presence of both components [44]. The insertion of CNT in various methods for producing cement stone slightly reduces the amount of the silicate phase in comparison with preparations without additives. The activation of portland cement in the VLD together with the CNT and the MF additive (compositions No 4, No 5 Table 8) contributes to the formation of the silicate phase by 48–66% more than in the composition No 1. In compositions No 4, and No 5, Table 7, the number of the silicate phase increases by 17–49%, compared to composition No 1. The calcium hydrosilicates of the two-dimensional structure and the one-dimensional ones in the form of chains ν(SiO), observed in absorption bands of 1000–1100 cm−1 increase in compositions No 2 and No 3, Table 7 (39% for CNT Graphistrength, and 47% for CNT Tuball as compared to No 1). The additional introduction of MF significantly increases the number of mentioned calcium hydrosilicates (84–261%).
With the activation of portland cement in VLD, the introduction of CNT TUBALL causes a decrease in the calcium hydrosilicates of the two-dimensional structure, and the introduction of the CNT Graphistrength causes an increase of 28%. The activation of portland cement results in a 39% increase in the hydrosilicate data (compositions No 1 Table 7 and Table 8). In compositions No 4–5 of Table 8, the quantity of calcium hydrosilicates of the two-dimensional structure does not increase significantly.
The valence oscillations of Si(OH), as well as the groups of calcium hydrosulfoaluminate (HSAC) occur at 950 cm−1 [45]. The modification of the cement stone CNT shows a decrease in the intensity of the reflection band, and hence the modification of the CNT results in a reduction of the HSAC group by 21–23% (compositions No 2–3 of the Table 7). The activation of portland cement in the VLD together with the CNT does not reduce the amount of GAC. Regardless of the method for producing cement stone, the introduction of the MF additive makes it possible to significantly reduce the amount of HSAC.
Weak reflections at 874 cm−1 are characteristic of –(Si4O10) groups, that is, the silicate phase [46]. The introduction of CNT increases the number of silicate phases having –(Si4O10) groups. For example, the modification of cement stone CNT increases the quantity of this silicate phase by 6–21% in the compositions of Table 2, Table 3 and Table 7, and 5–5.1% in Table 2, Table 3 and Table 8. The introduction of the MF additive makes it possible to substantially increase the number of silicate phases having –(Si4O10)-groups, especially in the compositions produced by VLD activations by 85–28%.

4. Conclusions

Practical and theoretical studies have been conducted showing the influence of the physical activation of portland cement in the VLD, providing simultaneous mechanical and electromagnetic effects on the processed material on the degree of portland cement changes over time: change in mass, quantity of chemically bound water. The evidence of the effect of portland cement activation in VLD on the rate of hardening of the cement test at different thermostat temperatures wasobtained: the chemical composition of cement stone by the IR spectroscopy method, obtained both by traditional method and by activation in VLD.
  • It was established, through warming of the portland cement powder during treatment in VLD, that there was a decrease in the intensity of the maximum IR spectra at 3.645 cm−1, which characterizes the –OHgroups. It was shown that the activation of portland cement does not affect the intensity change of the absorption band at 1474 cm−1, which characterizes the oscillation of the CO3- group in the calcium carbonate crystals. Furthermore, the infrared spectrum of portland cement powders after 60 days of storage from the moment of their activation show an increase in the intensity of the peak corresponding to the CO3 group with an increase in the processing time in the VLD. In addition, the increase in the number of bonds Al-O and Ca-O of activated compositions in the VLD indicates an increase in the adsorption capacity of activated portland cement.
  • The introduction of additive MF based on ether polycarboxylate during activation of portland cement in VLD reduces sorption moisture uptake from the air. This occurs through forming a superplasticizer membrane on the particles of portland cement that reduces the interaction of moisture and cement. As a result of the joint activation of the superplasticizer and portland cement, a more uniform localization of the additive was proceeded in the area of portland cement particles. At the same time, the free surface content of portland cement particles amounted to 34% by treatment together with the MF plasticizer in the VLD.
  • The application of differential scanning calorimetry established that the hydration rate of the compositions produced by activation in VLD is greater than those produced without activation by 1.615 times at the temperature of the thermostat 22 °C; 1.85 times 40 °C; 2.71 at 60 °C; and 2.3 times 80 °C. This is due to the increased dilution of portland cement particles treated in the VLD compared to the untreated composition. The treatment of portland cement in VLD leads to physical activation of portland cement, which is accompanied by an increase in the amount of heat released by portland cement hydration and the rate of hydration.
  • Modification of the cement stone CNT received from portland cement activated in VLD leads to the increase in the amount of the silicate phase of portland cement (by 12–39%), which is confirmed by a decrease in the quantity of portlandite in these compositions by 8% compared to the initial composition. The combined activation of portland cement, CNT of various structures, SP MF in VLD leads in a reduction of portlandite by 61–69%, and an increase of 48–66% in the content of the silicate phase.

Author Contributions

Conceptualization, I.R. and K.E.; methodology, P.L.; software, K.A.; validation, I.R., K.E. and D.T.; formal analysis, K.E.; investigation, P.L.; resources, D.T.; data curation, I.R.; writing—original draft preparation, I.R.; writing—review and editing, K.E.; visualization, P.L.; supervision, D.T.; project administration, K.E.; funding acquisition, D.T. All authors have read and agreed to the published version of the manuscript.

Funding

This study was supported by the Kazan State University of Architecture and Civil Engineering. Project No. 456.

Institutional Review Board Statement

Not applicable.

Informed Consent Statement

Not applicable.

Data Availability Statement

Not applicable.

Conflicts of Interest

The authors declare no conflict of interest.

References

  1. AlShareedah, O.; Nassiri, S. Pervious concrete mixture optimization, physical, and mechanical properties and pavement design: A review. J. Clean. Prod. 2020, 288, 125095. [Google Scholar] [CrossRef]
  2. Afroughsabet, V.; Biolzi, L.; Monteiro, P.J.; Gastaldi, M.M. Investigation of the mechanical and durability properties of sustainable high performance concrete based on calcium sulfoaluminate cement. J. Build. Eng. 2021, 43, 102656. [Google Scholar] [CrossRef]
  3. Aiken, T.A.; Kwasny, J.; Sha, W.; Tong, K.T. Mechanical and durability properties of alkali-activated fly ash concrete with increasing slag content. Constr. Build. Mater. 2021, 301, 124330. [Google Scholar] [CrossRef]
  4. Wang, Z.; Chu, H.; Wang, J.; Feng, E.; Zhang, Y.; Lyu, X. Mechanical activation of siliceous tailings and its application as cement admixtures. Miner. Eng. 2021, 177, 107366. [Google Scholar] [CrossRef]
  5. Zhu, H.; Ma, M.; He, X.; Zheng, Z.; Su, Y.; Yang, J.; Zhao, H. Effect of wet-grinding steel slag on the properties of Portland cement: An activated method and rheology analysis. Constr. Build. Mater. 2021, 286, 122823. [Google Scholar] [CrossRef]
  6. Yang, J.; Zeng, L.; He, X.; Su, Y.; Li, Y.; Tan, H.; Jiang, B.; Zhu, H.; Oh, S.-K. Improving durability of heat-cured high volume fly ash cement mortar by wet-grinding activation. Constr. Build. Mater. 2021, 289, 123157. [Google Scholar] [CrossRef]
  7. Wang, Y.; Tan, H.; Gu, X.; He, X.; Zhang, J. Preparation of nano-kaolin by wet-grinding process and its application as accelerator in Portland cement. J. Build. Eng. 2021, 44, 103401. [Google Scholar] [CrossRef]
  8. Chen, Z.; Wang, Y.; Liao, S.; Huang, Y. Grinding kinetics of waste glass powder and its composite effect as pozzolanic admixture in cement concrete. Constr. Build. Mater. 2019, 239, 117876. [Google Scholar] [CrossRef]
  9. Fediuk, R.S. Mechanical Activation of Construction Binder Materials by Various Mills. Mater. Sci. Eng. 2016, 125, 012019. [Google Scholar] [CrossRef]
  10. Altun, O.; Benzer, H.; Karahan, E.; Zencirci, S.; Toprak, A. The impacts of dry stirred milling application on quality and production rate of the cement grinding circuits. Miner. Eng. 2020, 155, 106478. [Google Scholar] [CrossRef]
  11. Höfgen, E.; Collini, D.; Batterham, R.J.; Scales, P.J.; Stickland, A.D. High pressure dewatering rolls: Comparison of a novel prototype to existing industrial technology. Chem. Eng. Sci. 2019, 205, 106–120. [Google Scholar] [CrossRef]
  12. Johansson, M.; Evertsson, M. A time dynamic model of a high pressure grinding rolls crusher. Miner. Eng. 2018, 132, 27–38. [Google Scholar] [CrossRef]
  13. Cleary, P.W.; Delaney, G.W.; Sinnott, M.D.; Cummins, S.J.; Morrison, R.D. Advanced comminution modelling: Part 1—Crushers. Appl. Math. Model. 2020, 88, 238–265. [Google Scholar] [CrossRef]
  14. Flizikowski, J.; Kruszelnicka, W.; Macko, M. The Development of Efficient Contaminated Polymer Materials Shredding in Recycling Processes. Polymers 2021, 13, 713. [Google Scholar] [CrossRef] [PubMed]
  15. Nöske, M.; Li, K.; Brüning, K.; Breitung-Faes, S.; Kwade, A. Impact of stress conditions on stirred media milling of a two component mixture. Miner. Eng. 2019, 146, 106100. [Google Scholar] [CrossRef]
  16. Lapshin, O.V.; Boldyreva, E.V.; Boldyrev, V.V. Role of Mixing and Milling in Mechanochemical Synthesis (Review). Russ. J. Inorg. Chem. 2021, 66, 433–453. [Google Scholar] [CrossRef]
  17. Ibragimov, R.A.; Korolev, E.V.; Kayumov, R.A.; Deberdeev, T.R.; Leksin, V.V.; Sprince, A. Efficiency of activation of mineral binders in vortex-layer devices. Mag. Civ. Eng. 2018, 82, 191–198. [Google Scholar] [CrossRef]
  18. Ibragimov, R.A.; Korolev, E.V.; Deberdeev, T.R.; Leksin, V.V. Efficient complex activation of Portland cement through processing it in the vortex layer machine. Struct. Concr. 2018, 20, 851–859. [Google Scholar] [CrossRef]
  19. Logvinenko, D.D.; Shelyakov, O.P. Intensification of Technological Processes in the Devices of the Vortex Layer; Tehnika Publ.: Kyiv, Ukraine, 1976; 144p. [Google Scholar]
  20. Wołosiewicz-Głąb, M.; Foszcz, D.; Ogonowski, S. Design of the electromagnetic mill and the air stream ratio model. IFAC-PapersOnLine 2017, 50, 14964–14969. [Google Scholar] [CrossRef]
  21. Khaydarov, B.; Suvorov, D.; Pazniak, A.; Kolesnikov, E.; Gorchakov, V.; Mamulat, S.; Kuznetsov, D. Efficient method of producing clinker-free binding materials using electromagnetic vortex milling. Mater. Lett. 2018, 226, 13–18. [Google Scholar] [CrossRef]
  22. Ogonowski, S.; Wołosiewicz-Głąb, M.; Ogonowski, Z.; Foszcz, D.; Pawełczyk, M. Comparison of Wet and Dry Grinding in Electromagnetic Mill. Minerals 2018, 8, 138. [Google Scholar] [CrossRef] [Green Version]
  23. Krawczykowski, D.; Foszcz, D.; Ogonowski, S.; Gawenda, T.; Wołosiewicz-Głąb, M. Analysis of the working chamber size influence on the effectiveness of grinding in electromagnetic mill. IOP Conf. Ser. Mater. Sci. Eng. 2018, 427, 012033. [Google Scholar] [CrossRef]
  24. Foszcz, D.; Wołosiewicz-Głąb, M.; Krauze, O.; Ogonowski, S.; Gawenda, T. Influence of grinding media movement on the throughput of dry grinding circuit with electromagnetic mill. IOP Conf. Ser. Mater. Sci. Eng. 2019, 641, 012018. [Google Scholar] [CrossRef]
  25. Ogonowski, S. On-Line Optimization of Energy Consumption in Electromagnetic Mill Installation. Energies 2021, 14, 2380. [Google Scholar] [CrossRef]
  26. Matalkah, F.; Soroushian, P. Shelf life of alkali activated cement: Effects of storage condition and duration. Constr. Build. Mater. 2019, 222, 664–672. [Google Scholar] [CrossRef]
  27. Dvorkin, L.; Dvorkin, O. Stroitelniye Mineralnie Vyachshuschiye Materiali (Mineral Construction Binding Materials); Infra: Moscow, Russia, 2011; p. 541. [Google Scholar]
  28. Korovkin, M.; Eroshkina, N. Influence of a Superplasticizer on Cement Grinding and Its Activity Reduction During Storage. Procedia Eng. 2016, 150, 1600–1604. [Google Scholar] [CrossRef] [Green Version]
  29. Siahkouhi, M.; Razaqpur, G.; Hoult, N.; Baghban, M.H.; Jing, G. Utilization of carbon nanotubes (CNTs) in concrete for structural health monitoring (SHM) purposes: A review. Constr. Build. Mater. 2021, 309, 125137. [Google Scholar] [CrossRef]
  30. Ibragimov, R.A.; Izotov, V.S. Effect of carbon nanotubes on the structure and properties of cement composites. Inorg. Mater. 2015, 51, 834–839. [Google Scholar] [CrossRef]
  31. Ramezani, M.; Dehghani, A.; Sherif, M.M. Carbon nanotube reinforced cementitious composites: A comprehensive review. Constr. Build. Mater. 2021, 315, 125100. [Google Scholar] [CrossRef]
  32. Sheikh, T.M.; Anwar, M.P.; Muthoosamy, K.; Jaganathan, J.; Chan, A.; Mohamed, A.A. The mechanics of carbon-based nanomaterials as cement reinforcement—A critical review. Constr. Build. Mater. 2021, 303, 124441. [Google Scholar] [CrossRef]
  33. Method for Preparing Concrete Mixture. U.S. Patent 2667180 Rus. Federation, 18 August 2017. Bul. No. 26. 5 p.
  34. Ibragimov, R.A.; Korolev, E.V.; Deberdeev, T.R.; Leksin, V.V. Durability of Heavy-Weight concrete with Portland cement treated in apparatus of vortex layer. Constr. Mater. 2017, 10, 28–31. [Google Scholar]
  35. Ibragimov, R.A.; Korolev, E.V.; Deberdeev, T.R.; Leksin, V.V. Structural parameters and properties of fine-grained concrete on Portland cement, activated with plasticizers in vortex layer apparatuses. ZKG Int. 2018, 5, 28–35. [Google Scholar]
  36. Smith, A. Applied Spectroscopy; Mir: Moscow, Russia, 1982; 328p. [Google Scholar]
  37. Rebouças, J.P.; Rohwedder, J.J.R.; Pasquini, C. Near infrared emission spectroscopy for rapid compositional analysis of Portland cements. Anal. Chim. Acta 2018, 1024, 136–144. [Google Scholar] [CrossRef] [PubMed]
  38. Rebinder, P.A.; Shchukin, E.D. Surface phenomena in solids during the course of their deformation and failure. Sov. Phys. Uspekhi 1973, 15, 533–554. [Google Scholar] [CrossRef]
  39. Bazhenov, Y.M. Concrete Technology; Vysshaya Shkola: Moscow, Russia, 1987; p. 449. (In Russian) [Google Scholar]
  40. Zvezdov, A.I.; Falikman, V.R. To the 100th anniversary of B.G. skramtaev birthday (1905–1966). Beton I Zhelezobeton 2005, 1, 31–32. [Google Scholar]
  41. Babkov, V.V.; Sakhibgareev, R.R.; Chujkin, A.E.; Anvarov, R.A.; Komokhov, R.G. Specific features of high-strength cement stone structure-formation under the conditions of long-duration solidification. Stroit. Mater. 2003, 10, 42–44. [Google Scholar]
  42. Polak, A.F.; Babkov, V.V. Effect of cement dispersion on its hydrate strength. [vliyanie dispersnosti tsementa na prochnost’ ego gidrata]. Tsement 1980, 9, 15–17. [Google Scholar]
  43. Morandeau, A.; Thiéry, M.; Dangla, P. Investigation of the carbonation mechanism of CH and C-S-H in terms of kinetics, microstructure changes and moisture properties. Cem. Concr. Res. 2014, 56, 153–170. [Google Scholar] [CrossRef] [Green Version]
  44. Mohaček-Grošev, V.; Đuroković, M.; Maksimović, A. Combining Raman Spectroscopy, DFT Calculations, and Atomic Force Microscopy in the Study of Clinker Materials. Materials 2021, 14, 3648. [Google Scholar] [CrossRef]
  45. Azeem, M.; Saleem, M.A. Hydration model for the OPC-CNT mixture: Theory and experiment. Constr. Build. Mater. 2020, 264, 120691. [Google Scholar] [CrossRef]
  46. Vetter, M.; Gonzalez-Rodriguez, J.; Nauha, E.; Kerr, T. The use of Raman spectroscopy to monitor phase changes in concrete following high temperature exposure. Constr. Build. Mater. 2019, 204, 450–457. [Google Scholar] [CrossRef]
Figure 1. Cell DSC Q200: 1—heat chamber; 2—crucible with the sample; 3—comparing crucible.
Buildings 12 00711 g001
Figure 2. Standard design of the vortex layer device with a rotating electromagnetic field [34].
Buildings 12 00711 g002
Figure 3. The IR spectrograms of powders: 1—initial Portland cement 2—Portland cementprocessed in VLD within 1 min; 3—same, 3 min; 4—same, 5 min; 5—same, 7 min; 6—Portland cement contained into the composition of SP MF mixture, processed within 5 min.
Buildings 12 00711 g003
Figure 4. The dependence variation of heating temperature of portland cement with activation time.
Buildings 12 00711 g004
Figure 5. Thermogram of cement paste: (a) initial; (b) activated. Thermostat temperature: 1—22 °C; 2—240 °C; 3—60 °C; 4—80 °C.
Buildings 12 00711 g005
Figure 6. (a) kinetics of mass-change of researched portland cement; (b) the dependency of ∆M/Si ratio and storage duration (the numeration of compositions is indicated in Figure 3).
Buildings 12 00711 g006
Figure 7. Spectrograms of samples of cement stone: 1—composition without additives; 2—modified composition with CNT TUBALL; 3—modified composition with CNT Graphistrength; 4—modified composition with CNT TUBALL and MF; 5—modified composition with CNT Graphistrength and MF.
Buildings 12 00711 g007
Figure 8. Spectrograms of samples of cement stone processed by activation of portland cement in VLD: the numeration of compositions is shown in Figure 7.
Buildings 12 00711 g008
Table 1. Anomaly area in compliance with Figure 1.
No Composition *Wavenumber, cm−1
3645341714741125885727
10.061.530.722.0913.450.11
20.040.940.892.8816.010.13
30.050.973.0918.750.15
40.041.083.3819.580.18
50.041.113.3621.290.20
60.041.113.3721.400.20
Note *: the numeration of compositions is shown in Figure 3.
Table 2. Anomaly area of investigated powders after 60 days from the date of activation.
No Composition *Wavenumber, cm−1
3645341714741125885727
10.031.680.712.2213.160.10
20.031.261.362.6014.500.12
30.031.543.2718.310.16
40.031.593.3718.940.18
50.031.833.1319.000.19
60.051.243.9021.220.19
Note *: the numeration of compositions is shown in Figure 3.
Table 3. Thermograms analysis in accordance with Figure 5.
ParameterInitial Portland Cement at Thermostat Temperature, °CActivated Portland Cement at Thermostat Temperature, °C
2240608022406080
Rate of hydration, μW/min0.2160.47727.1655.160.3480.88373.76127.02
Total amount of evolved heat within 100 min during hydration, J/g3.37746.35315.411537.018.91119.341617.03453.0
Table 4. Unit values of the rate of hydration and the total amount of emitted heat in the 100 min of hydration.
ParameterInitial Portland Cement at Thermostat Temperature, °CActivated Portland Cement at Thermostat Temperature, °C
2240608022406080
Rate of hydration, nW/(min·m2)0.581.2772.43147.090.661.67139.17239.66
Total amount of evolved heat, μJ/(kg·m2)9.01123.60841.094098.6735.68225.163050.946515.09
Table 5. Calculation data share of «free» surface.
CharacteristicLength of Exposure, Days Mean   Value   δ S 0
3715306090
δ S 0 , %33393434343534
Table 6. The impact of storage duration of fine-grained concrete on strength.
No ItemDuration of the Activation, MinWater Cement Ratio The Amount of Additive MF, %Compressive Strength (MPa) the Samples of Portland Cement, Stored within, Days:The Amount of Chemically Bound Water, %
0306090
100.44051.043.437.532.62.92
230.44056.246.639.232.13.14
350.44066.055.446.737.83.33
400.34174.265.757.849.9
530.34181.271.262.153.62.74
650.34193.484.676.868.52.52
Table 7. Absorption area in accordance with Figure 7.
No Composition *Wavenumber, cm−1
3642340014151102950874
10.125.118.340.513.620.48
20.113.147.710.752.840.51
30.113.436.860.712.790.58
40.095.429.770.9420.67
50.096.7612.411.842.470.82
Note *: the numeration of compositions is shown in Figure 7.
Table 8. Absorption area in accordance with Figure 8.
No Composition *Wavenumber, cm−1
3642340014151105950874
10.134.9411.420.712.830.55
20.124.858.660.622.720.58
30.134.989.560.912.740.83
40.046.0416.870.792.141.02
50.057.6618.911.322.322.1
Note *: the numeration of compositions is shown in Figure 7.
Publisher’s Note: MDPI stays neutral with regard to jurisdictional claims in published maps and institutional affiliations.

