Article

LCIA Parameters and the Role of BIM towards Sustainability: Regional and Temporal Trends

by
Tayyab Ahmad
1,* and
Muhammad Jamaluddin Thaheem
2
1
Department of Building and Real Estate, Polytechnic University Hong Kong, Hong Kong 999077, China
2
School of Architecture & Built Environment, Deakin University, Geelong 3220, Australia
*
Author to whom correspondence should be addressed.
Buildings 2022, 12(5), 700; https://doi.org/10.3390/buildings12050700
Submission received: 11 April 2022 / Revised: 4 May 2022 / Accepted: 17 May 2022 / Published: 23 May 2022
(This article belongs to the Section Building Materials, and Repair & Renovation)

Abstract

:
Building materials with a low environmental impact are critical to the sustainability of the built environment. The environmental impact of materials can be determined by a Life Cycle Impact Assessment (LCIA), which constitutes multiple parameters such as the water used in a material’s life cycle. To use the LCIA approach for building material selection, its parameters need to be assigned different weights, which is the primary objective of this study. Building Information Modelling (BIM) can play an influential role when using LCIA during the building design process. With this consideration, we study the attention given to environmental sustainability in buildings and the responsiveness of BIM in this case. A multi-regional survey of 120 experts from academia and industry was conducted. The results show the relative importance of LCIA parameters and the focus of the building sector on environmental sustainability. The current and the future responsiveness of BIM towards environmental sustainability is also indicated. To promote the integration of LCIA in building design and performance assessment, the future role of BIM applications is explored. The results will contribute to research and practice in the sustainable built environment by helping select environment-friendly building materials.

1. Introduction

Buildings protect humans from the undesirable effects of nature, and they provide places to live, work, and rejoice. However, their overarching role in society comes at an environmental cost. The development and the operation of buildings are associated with a significant environmental burden. For instance, one-sixth of freshwater, one-quarter of wood harvest, and two-fifth of material and energy flows are attributed to the global building sector [1,2,3]. Across the globe, building-driven carbon emissions are speculated to reach 42.4 billion tonnes in 2035—43% above 2007 levels [4]. Negative impacts of buildings may also include traffic congestion, dust, noise, waste disposal, and water pollution during the construction stage. However, the environmental impact of buildings is not limited to the construction stage only as buildings continue to impact the environment in their operational life [4]. Due to its contribution of the largest portion of landfill wastes and consumption of about half of mineral resources, the construction industry is compelled to improve in sustainability terms [5]. Owing to urbanization, an unparalleled growth in building development is observed worldwide. The International Energy Agency has predicted that by 2050, the number of commercial and institutional buildings will increase by two times [6]. Hence, sustainable practices incorporated into building construction can make substantial contributions in the future. This trend in building construction also points toward the potential harm if this sector keeps ignoring the sustainability approach.

1.1. Relative Attention toward Environmental Sustainability in Buildings

Sustainable development results from attention toward the triple bottom line: planet, people and profit. Accordingly, sustainable practices in all disciplines must ensure the fulfilment of environmental, social and economic objectives. Sustainable buildings also need to comply with the triple bottom line, but equal attention toward the social, economic, and environmental dimensions is rarely observed. Buildings developed for business activities are often more focused on economic and social aspects than environmental, which cost significantly more when incorporated. On the contrary, buildings developed with an environmental agenda (i.e., certified green buildings) focus more on environmental and social sustainability and less on affordability or economic aspects. Hence, environmental, economic and social sustainability are popularly recognized as three dimensions of sustainability, but they are typically not given equal emphasis when developing and operating buildings. Research has reported the emphasis in the form of weights associated with economic and social sustainability in buildings [7,8]. However, relative weights related to environmental sustainability in buildings are yet to be explored in the literature.

1.2. Life Cycle Impact Assessment of Building Products

The adverse environmental impact of a building could be reduced by making well-informed decisions regarding the choice of construction materials [9]. Life cycle analysis of the building materials can ease the decision-making process in the earlier stages of a project when the design changes can be introduced at low costs [10]. For the built environment, the scope of life cycle analysis can be broadened to include buildings and even entire neighborhoods [11], or narrowed to include individual building products [12]. The scope of the current study involves the application of life cycle analysis on building products.
Life cycle analysis of a building product involves tracking its inventory and a subsequent impact assessment. Life cycle inventory analysis is about identifying and quantifying all resources used to produce a product: energy, water, raw materials and processed materials; all substances released into the environment, such as the emission of pollutants into the air, soil and water; and losses resulting from the production and consumption of the product [13]. However, Life Cycle Impact Assessment (LCIA) is a further development of the inventory analysis as it converts the inventory data of materials under assessment into a set of potential impacts such as the global warming potential associated with the raw material extraction, manufacturing, transportation, installation, and disposal. This enables practitioners and decision-makers to better understand the damage caused by resource use and emissions [14].
Even though LCIA is a science-based, quantitative method for evaluating the environmental impacts of a product, an overall assessment is ultimately subjective because few products are likely to outperform their alternatives across all impact parameters [9]. For instance, LCIA can provide the values of impact parameters such as global warming potential, ozone depletion potential, and smog creation potential associated with different types of structural columns made of alternative materials such as steel, timber and concrete. LCIA can provide objective parameter values for different materials (i.e., steel, timber and concrete). While the steel columns may be a reasonable choice compared to the other two alternatives when judged using global warming potential, timber columns may be a more favorable choice based on smog creation potential. Hence, LCIA provides environmental data regarding construction material alternatives, yet the resulting objective information alone may not help to decide the optimum materials in terms of environmental performance. To reconcile these likely performance trade-offs, the optional step of incorporating weights in LCIA can be useful for aggregating performance scores for all relevant impact categories into a single score. Weights are the link between the quantitative results of Life Cycle Assessment (LCA) and the value-based, subjective choices of decision-makers [9]. Associating weights with LCIA parameters can ease the selection of construction materials. By combining both the objective values of Impact Parameters (I) and the subjective weights of those indicators (W), a weighted aggregation model, as given in Equation (1), can generate a value for the overall environmental performance (P) of building materials under consideration.
P E n v . = i = 1 n I E n v i . W E n v i
There is a serious lag in studies conducted on this topic. Also, the findings of previous studies may have been outdated since they were conducted more than a decade ago. The lack of recent research on LCIA parameter weights implies that there is a missing account of current priorities towards environmental issues. This can create a hindrance in the use of weighted aggregation models for the selection of environment-friendly materials.

1.3. Use of BIM for Environmental Sustainability Assessment in Buildings

To ease the use of the LCIA approach in building material selection, it needs to be integrated into the building design process. An efficient way to achieve this is through Building Information Modelling (BIM). The concept of BIM dates back 30 years, and it is credited to Chuck Eastman [15]. In early 2002, industry analyst Jerry Laiserin coined the term Building Information Modelling to describe virtual design and construction as well as facilities management [16]. The American Institute of Architects (AIA) defines BIM as a model-based technology coupled with a project information database, which is accessible and sharable to various project participants [17,18]. Among the contemporary tools available for design, construction and operation, BIM has outstanding prospects in integrating environmental sustainability in building projects. For an increased uptake of LCIA based tools in the selection of building materials, it is important to understand the current and the future responsiveness of BIM towards environmental sustainability.

1.4. Research Objectives

Based on the increasing concern of society towards environmental sustainability in the building sector and the importance of the weighted LCIA approach for sustainable material procurement, this study aims to account for contemporary considerations towards environmental issues in the building sector. The specific objectives are:
  • To investigate the consideration towards environmental sustainability in commercial and residential buildings
  • To investigate the contemporary priorities toward environmental issues encompassed in the LCIA framework
  • To explore the prospects of using BIM for environmental sustainability in buildings

2. Literature Review

In this section, the impact parameters constituting LCIA are explained, and then the developments of BIM in terms of building sustainability are explained.

2.1. LCIA Indicators and Parameters

The use of LCIA-based impact parameters for building sustainability assessment is not new. For many regions, LCA-based building-related tools have been developed that act as decision support systems, such as Athena® by Athena Sustainable Materials Institute, Canada; EcoQuantum® financed by the Netherlands government; and Envest® by Clarity Environment, a consultancy based in the UK. Although these tools are region-specific and they use different modelling techniques, they operate on a whole-building level, making use of LCI parameters to provide information regarding design alternatives [19]. Another important tool to mention in this regard is BEES 4.0, developed by the National Institute of Standards and Technology, USA, which provides the LCIA related information within the context of the US and it helps to compare the environmental performance of different alternatives of building components [20]. These tools typically depend on multiple parameters to assess the environmental performance of building components or entire buildings.
It is important to define indicators and parameters since they are key components of LCIA. The purpose of an indicator is to provide useful information regarding social, physical or economic systems, often through numerical data [21,22]. Indicators can be very useful in describing the system state, identifying state changes as well as demonstrating cause-and-effect relationships. Besides their mutual differences, indicators typically address important issues such as lifecycle costs, resource consumption, comfort, environmental pressure, indoor air quality and energy and water efficiency [23]. Considerable research has gone into identifying and establishing indicators of environmental sustainability. LCI indicators are well established in the research and the practice of life cycle assessment, and they provide a comprehensive account of the environmental sustainability of a material. These indicators are operationalized and represented through sets of impact parameters. A parameter, while acting as a sign or a signal, transmits an intricate message from numerous possible sources in a simple, utile manner. Hence, parameters are about simplifying the behavior of something, quantifying it, and communicating it. The following is a brief account of the LCIA impact parameters that can represent different indicators [24]:
  • Acidification potential: The potential of a material to result in the acidification of the environment.
  • Eutrophication potential: The potential of a material to result in eutrophication which is the addition of mineral nutrients to the soil or water. This can result in undesirable shifts in the number of species in ecosystems and a reduction in ecological diversity.
  • Ecological toxicity: This measure indicates the potential of a chemical (associated with the material under study) released into the environment to harm terrestrial and aquatic ecosystems.
  • Fossil fuel depletion: This accounts for the non-renewable energy used throughout the product system and the embodied energy in products, such as the hydrocarbons in plastics and chemicals. This parameter has much significance and is even used alone to decide on environment-efficient building products [25].
  • Smog potential: This accounts for the potential of smog creation throughout the product life cycle (i.e., in raw material processing, manufacturing, transportation, installation and at the End-of-life).
  • Global warming potential: This accounts for the potential of global warming resulting from the chemicals associated with a product’s life cycle.
  • Water use: This accounts for the inventory of net water used throughout a product system.
  • Land use: This accounts for the surface area of land occupied and/or transformed within the system boundaries of a product system.
  • Ozone depletion potential: This characterizes the ozone-depleting gases in a product system.
  • Indoor air quality: This accounts for the indoor air quality by determining the emissions in the form of Volatile Organic Compounds (VOCs) from a product. Unlike other impact parameters, this parameter does not apply throughout a product’s lifecycle and instead applies only to the operation/use stage of a product. This parameter is particularly relevant to floor coverings, interior wall finishes, and furniture.
  • Human health: This characterizes the relative health concern associated with various chemicals used throughout a product system.
  • Criteria air pollutants: This quantifies the criteria air pollutants associated with a product system. There are six criteria air pollutants, including carbon monoxide, ground-level ozone, lead, nitrogen dioxide, particulate matter and Sulphur dioxide. These pollutants can harm health and the environment, and they can cause property damage.
Life Cycle Assessment is a quantitative method for understanding the environmental impacts of a product, yet all product purchasing decisions are ultimately subjective. Weights are the nexus between the quantitative results of Life Cycle Assessment and the values-based, subjective choices of decision-makers [9]. For the list of LCI impact parameters provided above, some studies have been conducted in the past to determine their relative weights, including the Harvard University study [26], the US Environmental Protection Agency’s (EPA) Science Advisory Board (SAB) study [27,28], and National Institute of Standards and Technology (NIST) study [9]. Originally in 1990 and again in 2000, SAB developed lists of the relative importance of various environmental impacts to help the EPA best allocate its resources [27,28]. The criteria used to develop the lists include a spatial scale of the impact, the severity of the hazard, degree of exposure and penalty for noncompliance. SAB did not explicitly consider fossil fuel depletion or water intake as impacts as they can be assumed as medium- and low-risk problems, respectively [29]. The relative weights of LCI impact parameters interpreted from these studies are provided in Table 1. The classification of impact parameters into indicator categories, as shown in Table 1, is inspired by studies from Bragança, Mateus [23] and Mateus and Bragança [30].
Although the SAB and the Harvard-based weights are valuable, and they offer guidance from a broad base of constituents, several interpretations and assumptions are required for their use [9]. The most recent study to determine the weights of LCIA impact parameters was conducted more than a decade ago in 2007 by NIST [9]. The opinion among experts regarding the relative importance of environmental issues may have changed, hence requiring an inquiry to provide a contemporary account of the preferences towards environmental issues (i.e., weights of LCIA indicators and parameters).

2.2. BIM

Sustainability analyses during the design and the pre-construction phases that are vital to deciding on sustainable features of a building [31,32] can hardly be performed using the planning environment of a traditional Computer-Aided Design (CAD) platform. Along with the assortment of sustainable building materials, which is an important aspect of building design [33], access to a comprehensive dataset comprising a building’s form, context, materials and Mechanical-Electrical-Plumbing (MEP) systems is needed to make accurate building performance assessments in the early design and the pre-construction phases. BIM creates an opportunity to incorporate sustainable measures throughout the design process by merging multi-disciplinary information within a single model [32,34].
The design phase being of utmost importance for the implementation of BIM in projects, has received significant attention from both academia and industry [35]. BIM can significantly reduce the costs of energy and sustainability analyses, and it can make the sustainability performance information conveniently available simply as an additional outcome of the standard design process [36]. BIM’s contribution to sustainable design and sustainability assessment is continuously evolving and making significant leaps. Owing to the scope of this study, only a review of BIM applications for sustainability assessment is provided.
According to a study by Azhar and Brown [37], using the opinion of industry professionals, significant time and cost savings are realized by BIM-based sustainability analyses as compared to traditional methods. Some popular BIM applications for sustainability assessment include Ecotect™ and Green Building Studio (GBS)™ by Autodesk®, US; and Virtual Environment (VE)™ by Integrated Environmental Solutions Ltd., UK. Along with the capability of BIM to export data for energy analysis, some other sustainability analyses related activities, including energy use calculations, green construction material use potential and Leadership in Energy and Environmental Design (LEED) compliance, can be ensured by using supplementary programs known as plugins [15]. This indicates that BIM’s ability to evolve through plugin applications will play a significant role in its potential to address sustainable development in buildings.
Within sustainability-related research, BIM has been used on multiple instances for LCA-based methodologies. For instance, to assess the environmental impact of concrete-based materials, Lee, Tae [38] used the LCA methodology on a BIM-enabled design. The assessment included different impact parameters, i.e., global warming, abiotic depletion, acidification, etc. In a similar study, Filho, da Costa [39] used BIM in the context of Life Cycle Sustainability Assessment comprising socio-economic and environmental aspects. A study by Peng [40] contended that the estimation of carbon emissions over a building’s life cycle can be simplified by BIM and Ecotect as they can supply most of the relevant information required for LCA calculations. This can also resolve the issue of insufficient information while conducting building LCA studies. Although it has been emphasized that LCA calculations must be based on BIM information [41], some barriers hinder this approach. Currently, LCA requires BIM integration with other software [35], as exemplified by Ajayi, Oyedele [42] and Tahmasebi, Banihashemi [43] who used BIM with Athena Impact Estimator (developed by Athena Sustainable Materials Institute, Canada) and EcoDesigner (developed by Graphisoft, Hungary), respectively, to calculate building material and energy-related impacts. Tally®, a BIM-based plugin developed by KieranTimberlake Innovations, US, is a development to bridge the gap between LCIA and BIM-based information. Material information from a BIM model can be directly imported into Tally which can then inform the environmental performance of materials based on different LCIA impact parameters. Najjar, Figueiredo [44] and Tushar, Bhuiyan [45] have verified the use case of this BIM-based application for LCIA. With such developments in BIM to incorporate environmental sustainability issues, it is important to ascertain how architecture, engineering and construction (AEC) professionals think about the prospects of BIM to ensure environmental sustainability in buildings.

3. Methodology

To determine the current consideration of the building sector towards environmental sustainability, weights of LCIA indicators and parameters and the responsiveness of BIM towards environmental sustainability in buildings, this study employs the findings from expert opinion. The expert sampling approach, which is a type of purposive sampling is employed in this study. The reason to use expert sampling is that it provides the opportunity to incorporate the opinion of people with a high degree of knowledge about the subject area [46]. For sampling purposes, relevant experts from academia were identified based on their research activity in LCA and BIM. Relevant experts from the industry were identified based on their affiliation with green building certification systems (i.e., LEED, BREEAM, Green Star). With more than 2000 survey requests sent, 120 responses were obtained, resulting in a response ratio of 0.06. As a sampling strategy, there was an equal emphasis on engaging industry and academic professionals. However, as an outcome, far more academic professionals participated compared to industry professionals, indicating their interest, expertise and knowledge about the subject area (i.e., LCA and BIM).
To record the expert opinion, a multi-regional survey comprised of three stages was conducted with a submission option at the end of each stage. Resultantly, a different number of experts responded at different stages, as shown in Table 2. In total, 73% of the respondents primarily belonged to research and education, while the respondents from construction and design consultancies had a participation of 4% and 19%, respectively. In terms of awareness, 92% declared to be well-aware of environmental sustainability in building projects, and 8% had little knowledge. Such a high level of awareness of the subject matter is not coincidental since only selected academics and industry practitioners renowned for their work in sustainability as well as BIM were reached to participate in the Survey. Different questions related to the three stages of inquiry can be seen in Table 2. These questions correspond to the three objectives of this study.
The survey data was analyzed using descriptive statistics, which measured the frequency, central tendency, dispersion or variation and position of data. The data from the first stage of the Survey was also analyzed by considering the degree of human development and environmental performance of participants’ regions of affiliation.
The regional affiliation of respondents for the first stage of the multi-regional Survey is indicated in Figure 1. It can be observed that the highest participation in the first stage of the Survey is from the USA (n = 27), the UK (n = 11) and Italy (n = 9). Data related to the ideal and the typical sustainability weights of buildings were analyzed at two levels. For the holistic analysis, where the overall trend towards environmental sustainability weight was to be presented, data from all survey respondents were cumulatively considered. For the detailed analysis, where the environmental sustainability weights for individual regions were to be considered, only findings for countries with at least three participants were used. This ensured that the findings were subject to some degree of normalization and that the personal bias of participants was addressed to some degree.
To investigate the consideration of environmental sustainability in commercial and residential buildings, the findings from the first stage of the Survey were used (see Table 2). The Ideal and Typical/Usual Environmental Sustainability weights of buildings associated with different countries were obtained. These sustainability weights were then rationalized based on the level of human development and environmental performance of different regions. This was because, on the scale of countries, different drivers influenced the regional attention towards sustainability dimensions. Human needs have varying priorities; for instance, if issues of inequity, health, poverty and illiteracy were taken into consideration, it could be argued that the focus of sustainable development in developing countries should be on socio-economic issues rather than on the environmental [47,48]. Accordingly, developing and developed countries have different preferences toward sustainability [47,49]. Hence, the distribution of countries into various groups while presenting the survey findings would help to see the priorities currently given to environmental sustainability in buildings by countries having different degrees of human development. To determine the level of human development in different regions, the measure used in this study was the Human Development Index (HDI), a United Nations measure of well-being in a country, which can help rank countries by their level of human development. The HDI is a composite statistic of education, life expectancy and income per capita. A country gets a higher HDI score when education level, lifespan and GDP per capita are higher, and inflation and fertility rates are lower. Notably, countries with an HDI value above 0.8 are considered to have very high HDI values. An HDI value above 0.8 is classified as very high, between 0.7 and 0.799 as high, 0.55 to 0.699 as medium, and below 0.55 as low [50]. This criterion was used to segregate, analyze and rationalize the survey findings related to the first objective.
These survey findings were also rationalized using the holistic environmental performance of countries for which building environmental sustainability weights were provided in the Survey. To determine the holistic level of the environmental performance of different regions, the measure used in this study is the Environmental Performance Index (EPI). The EPI ranks regional environmental performance in two areas: protection of human health and ecosystems [51].
The impact parameters obtained from the second stage of this Survey are used in an exemplary case to show the role of these weights in the selection of building materials. The example compares structural beams made of different materials. The impact parameter values for the beams are obtained from BEES™ online tool developed by the National Institute of Standards and Technology, USA. The objective parameter values alongside the subjective weights of parameters are used to determine the beam material with optimum environmental impact.

4. Results and Discussion

This section is comprised of three sub-sections to address the individual objectives of this study. This section provides a detailed analysis of the survey findings and a detailed discussion of the outcomes.

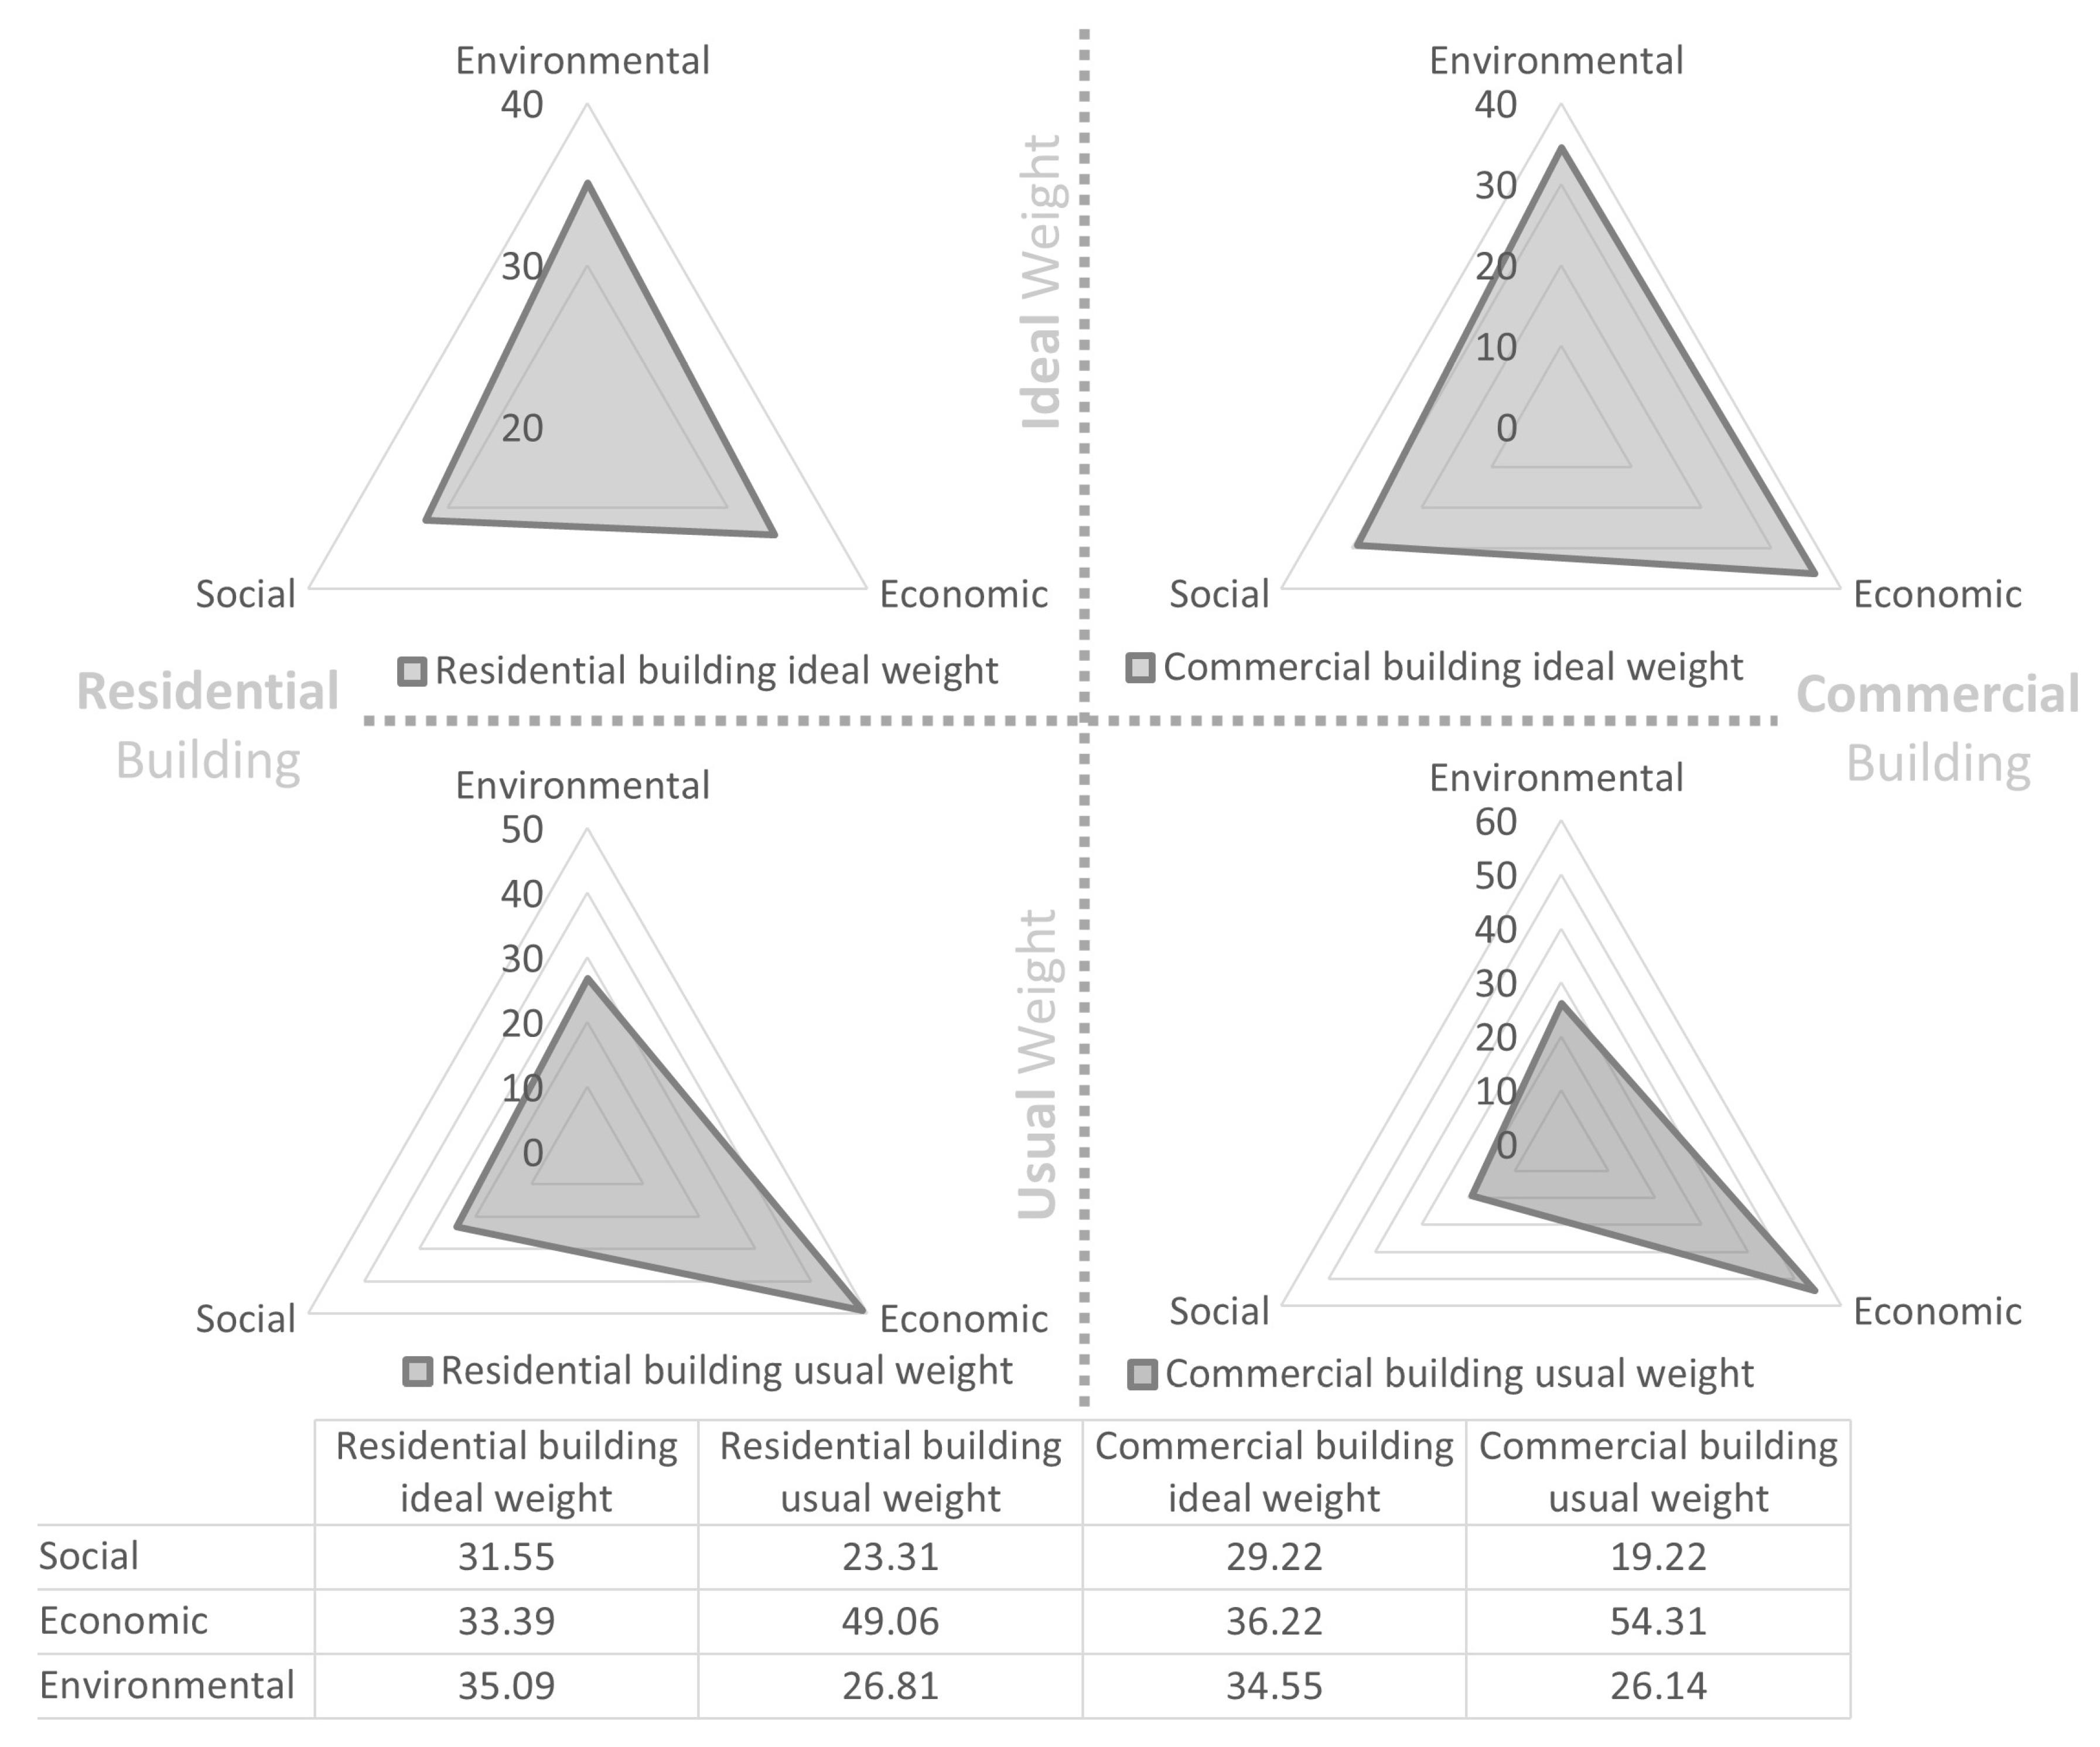
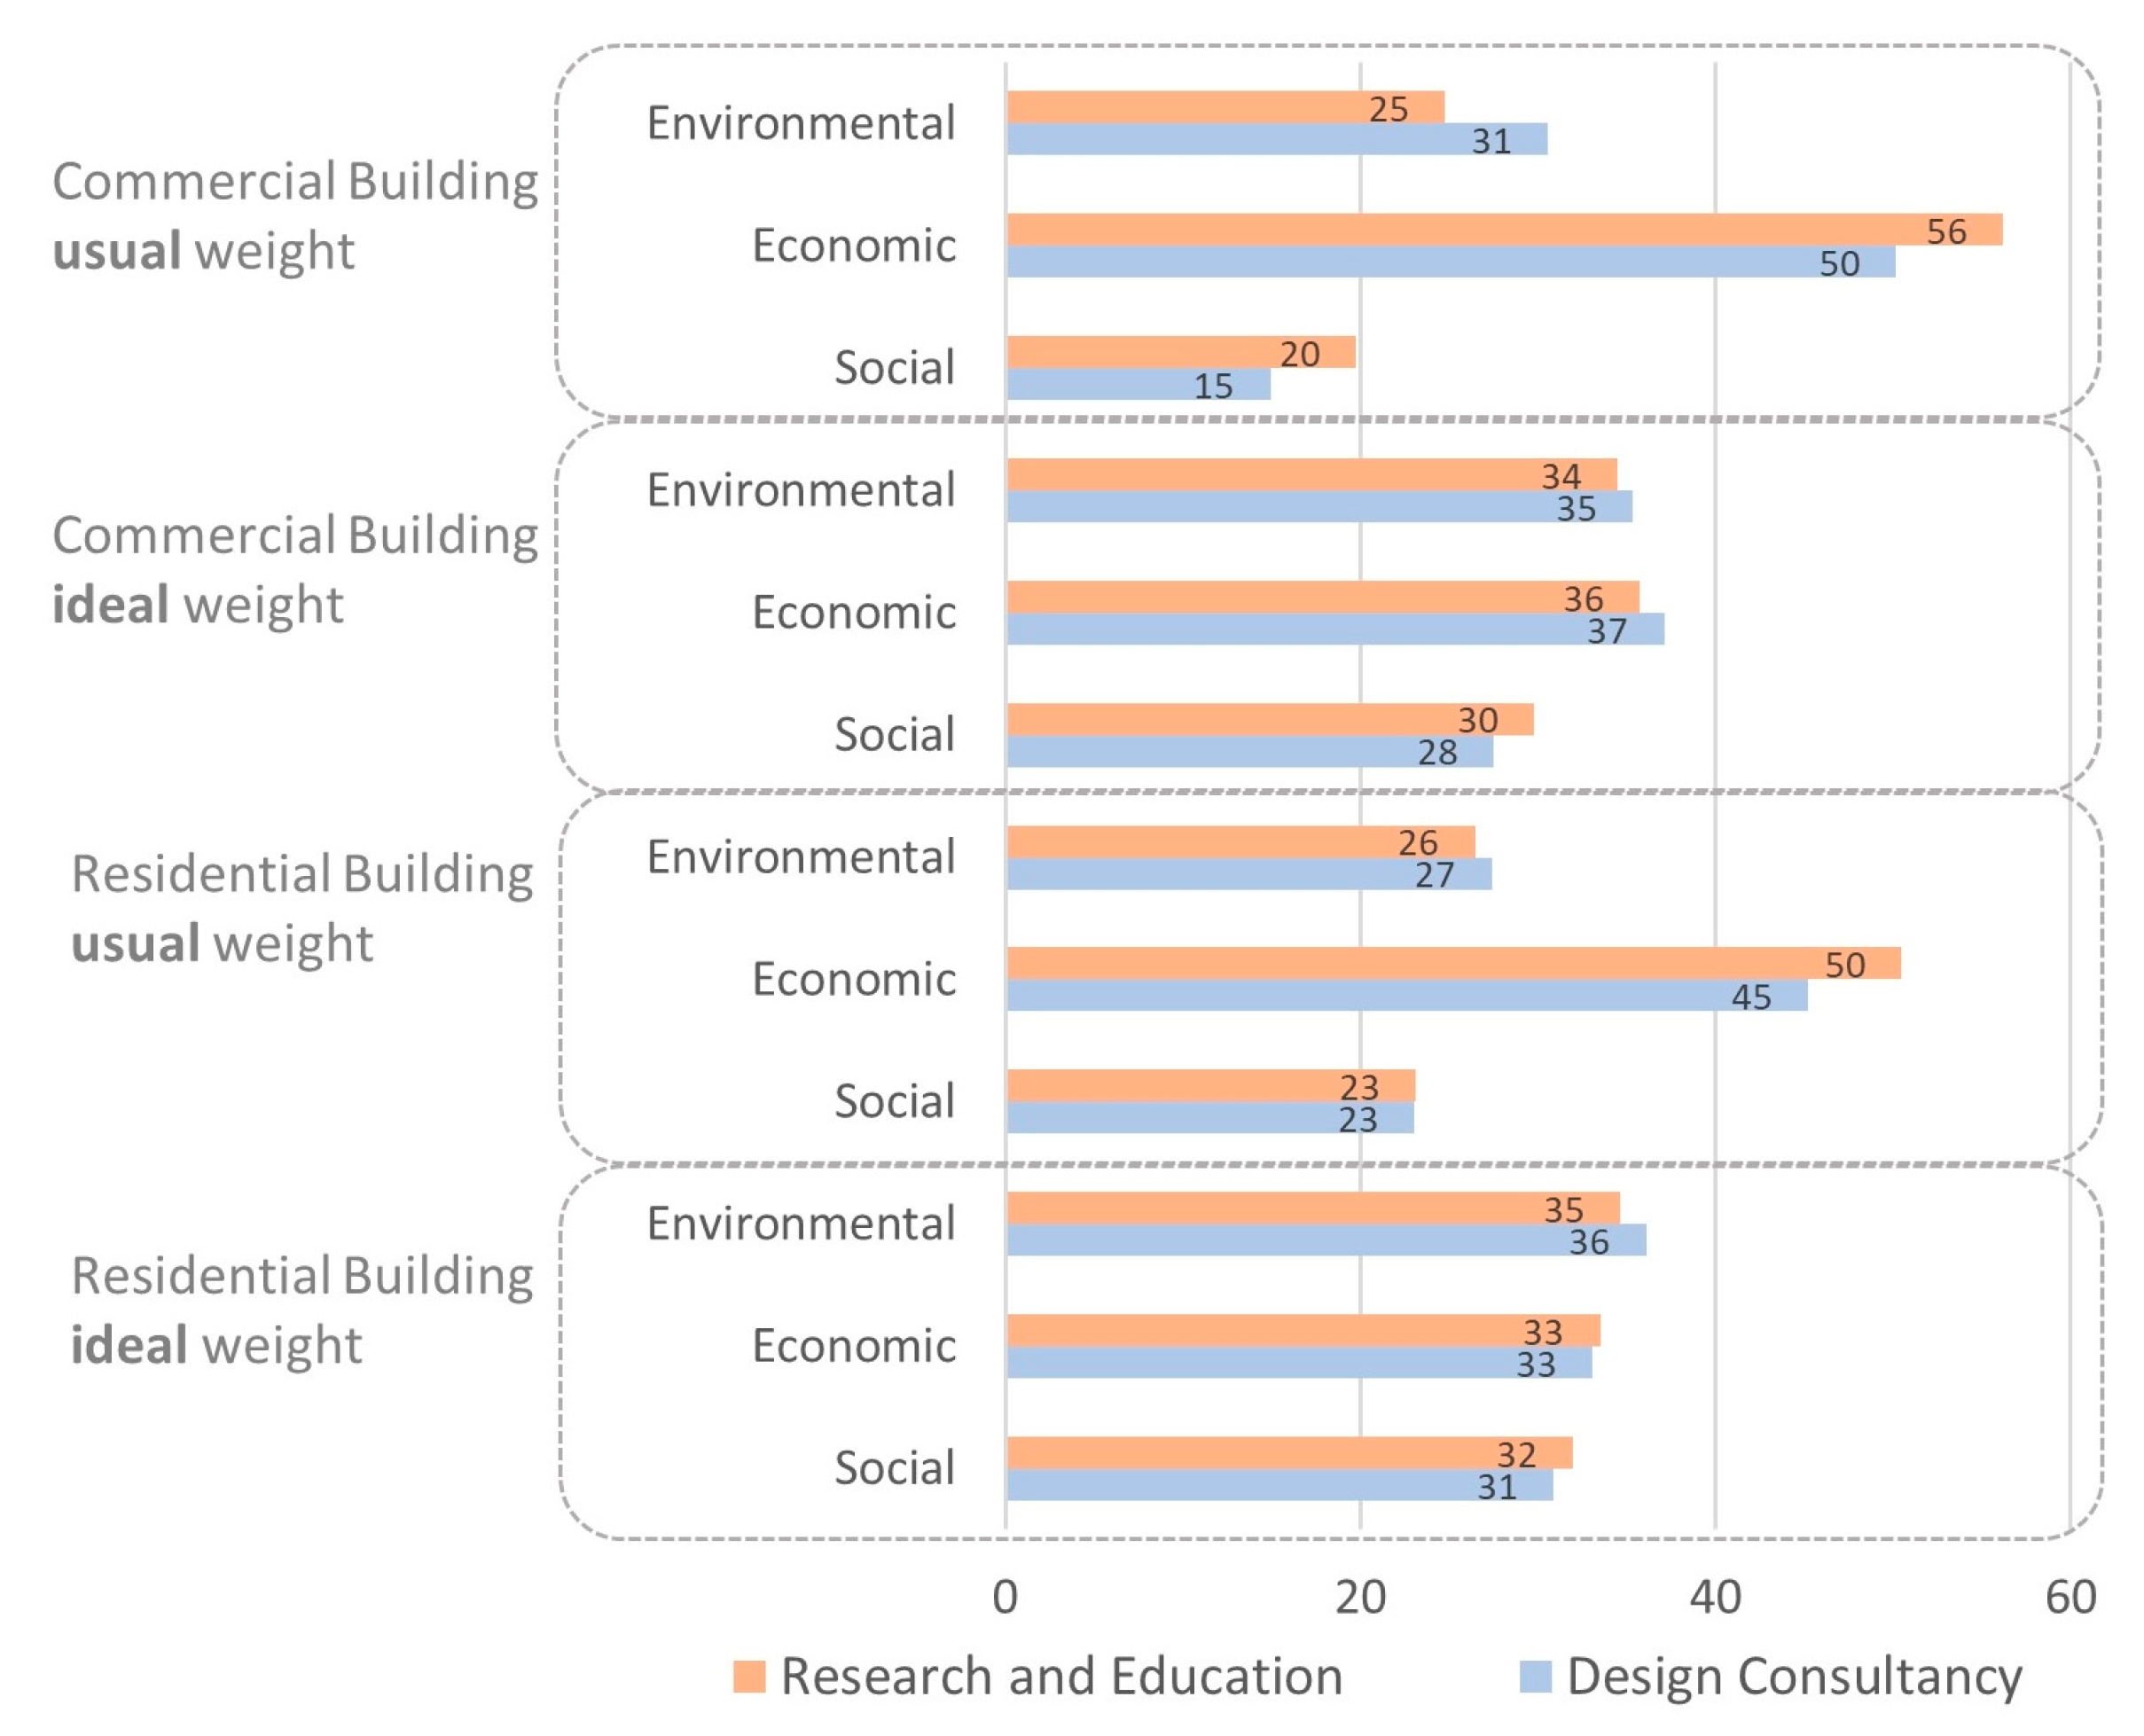
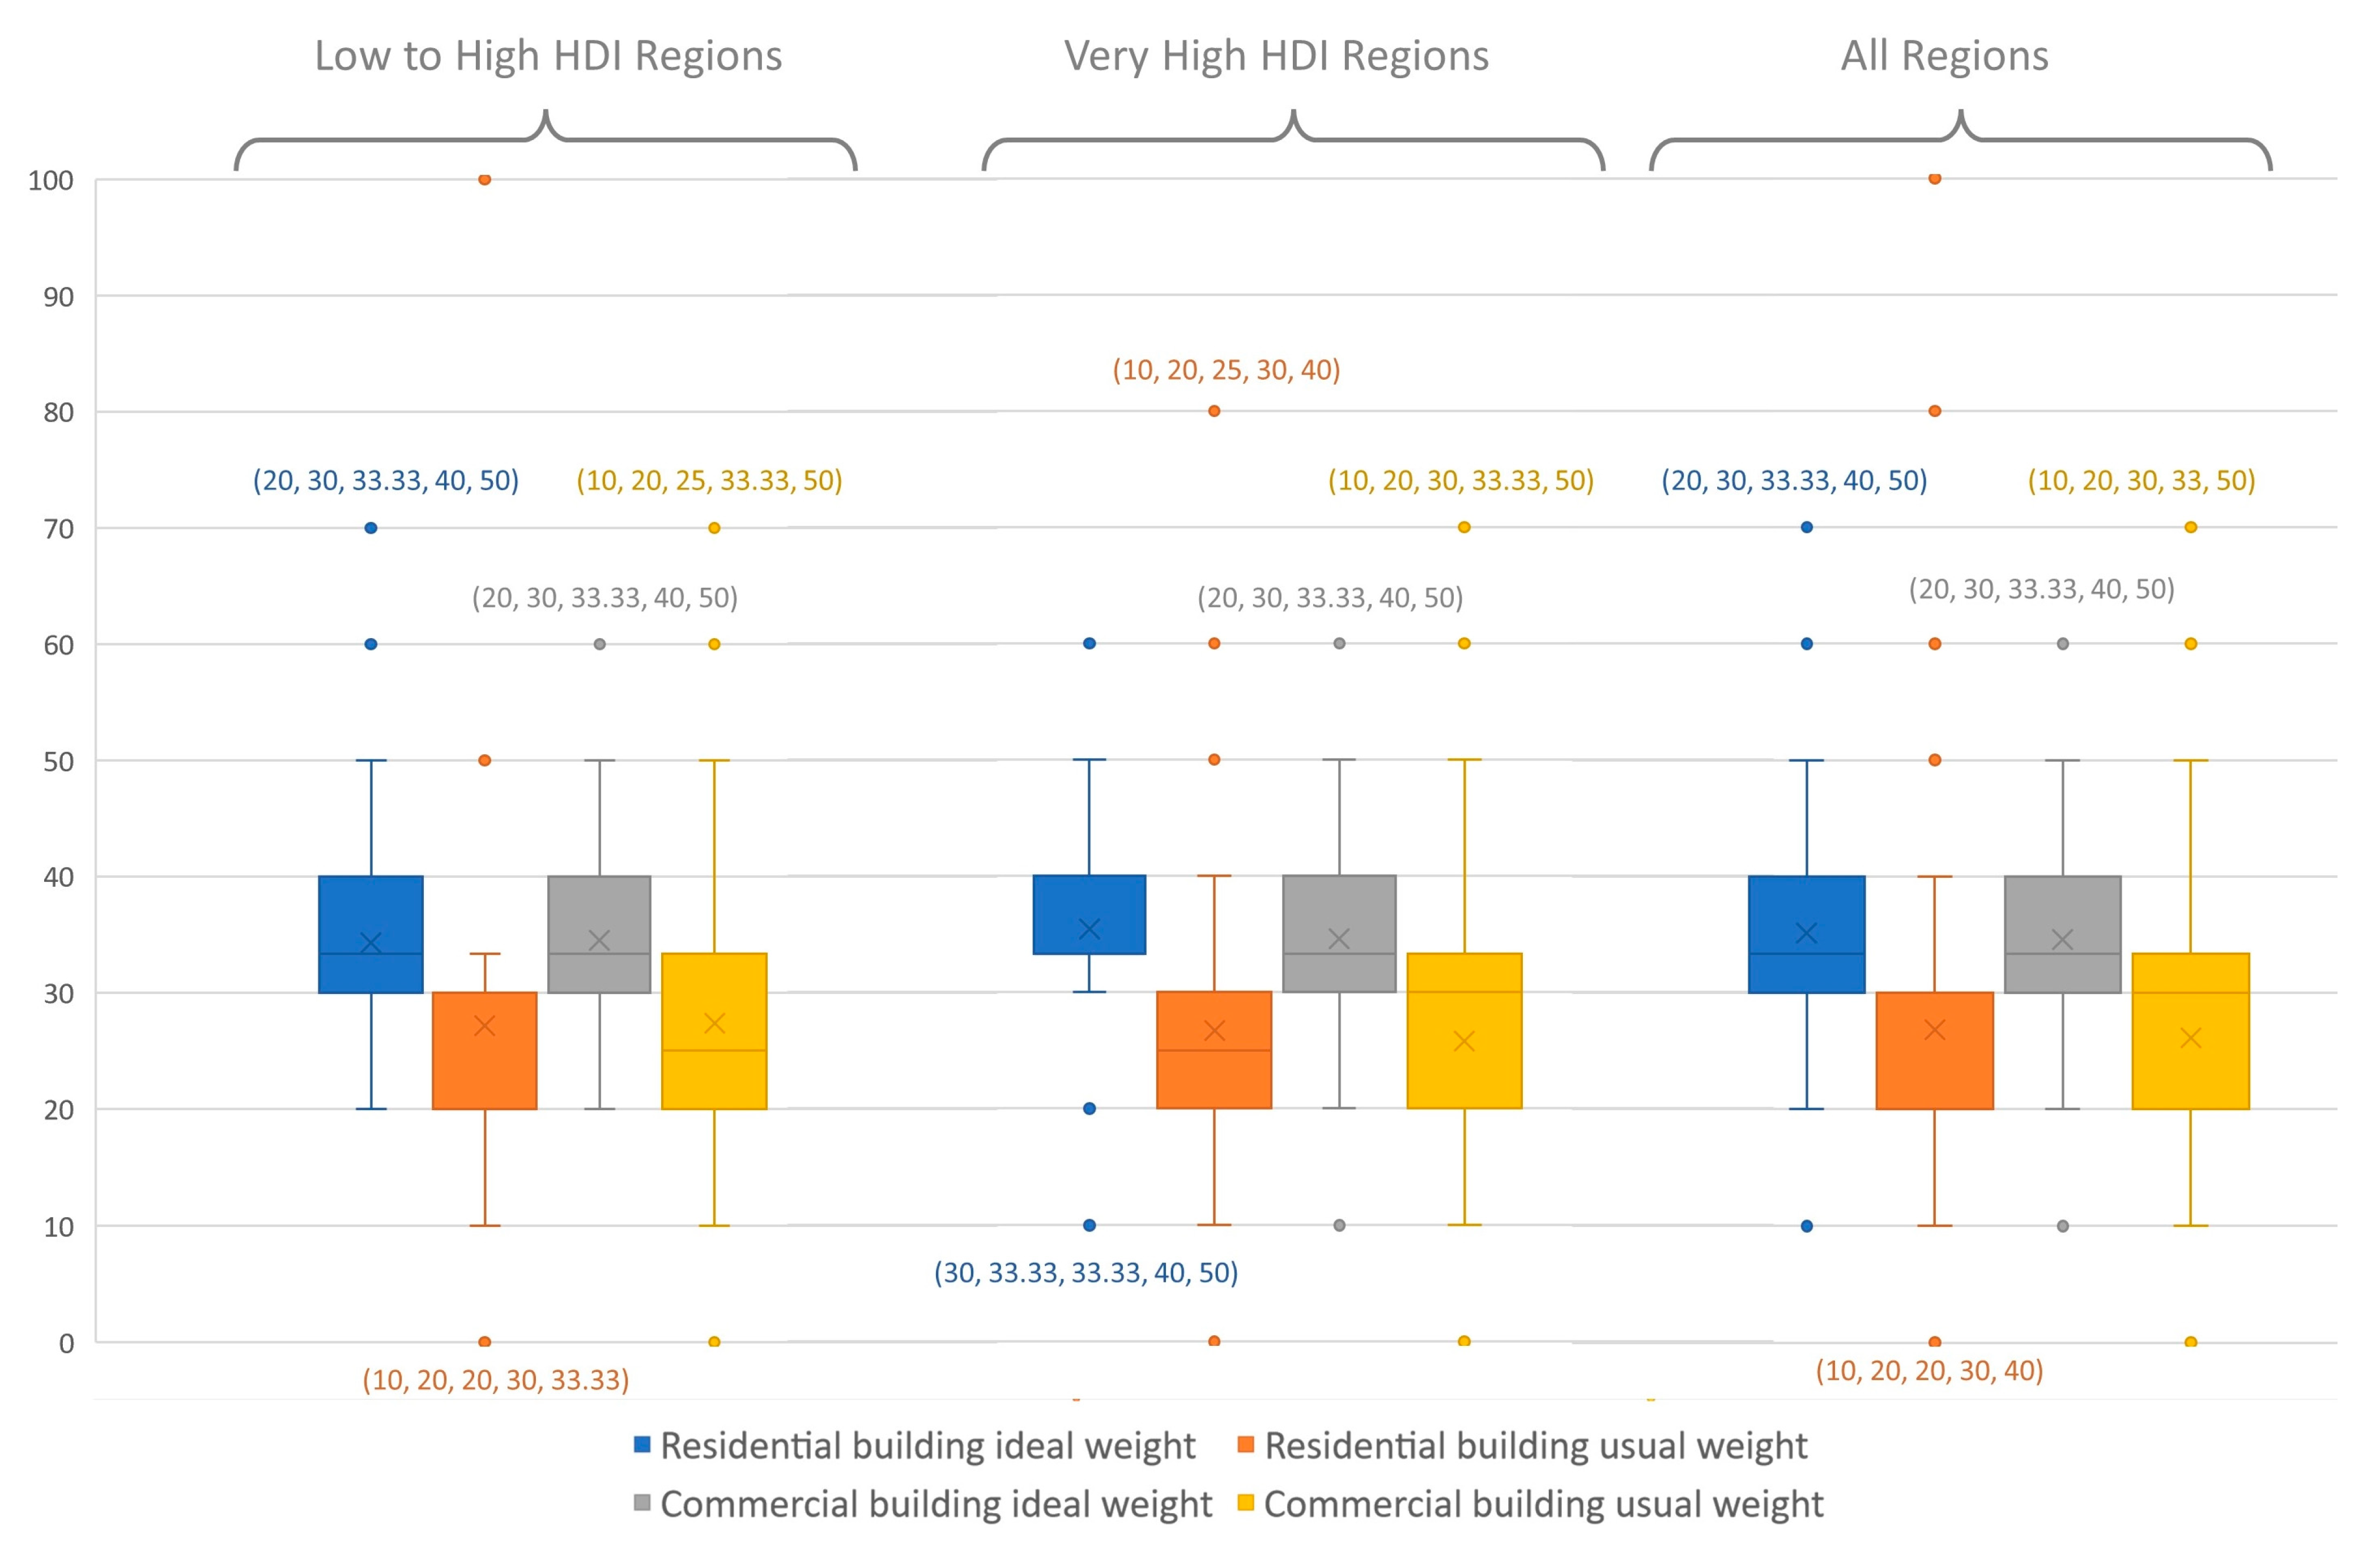
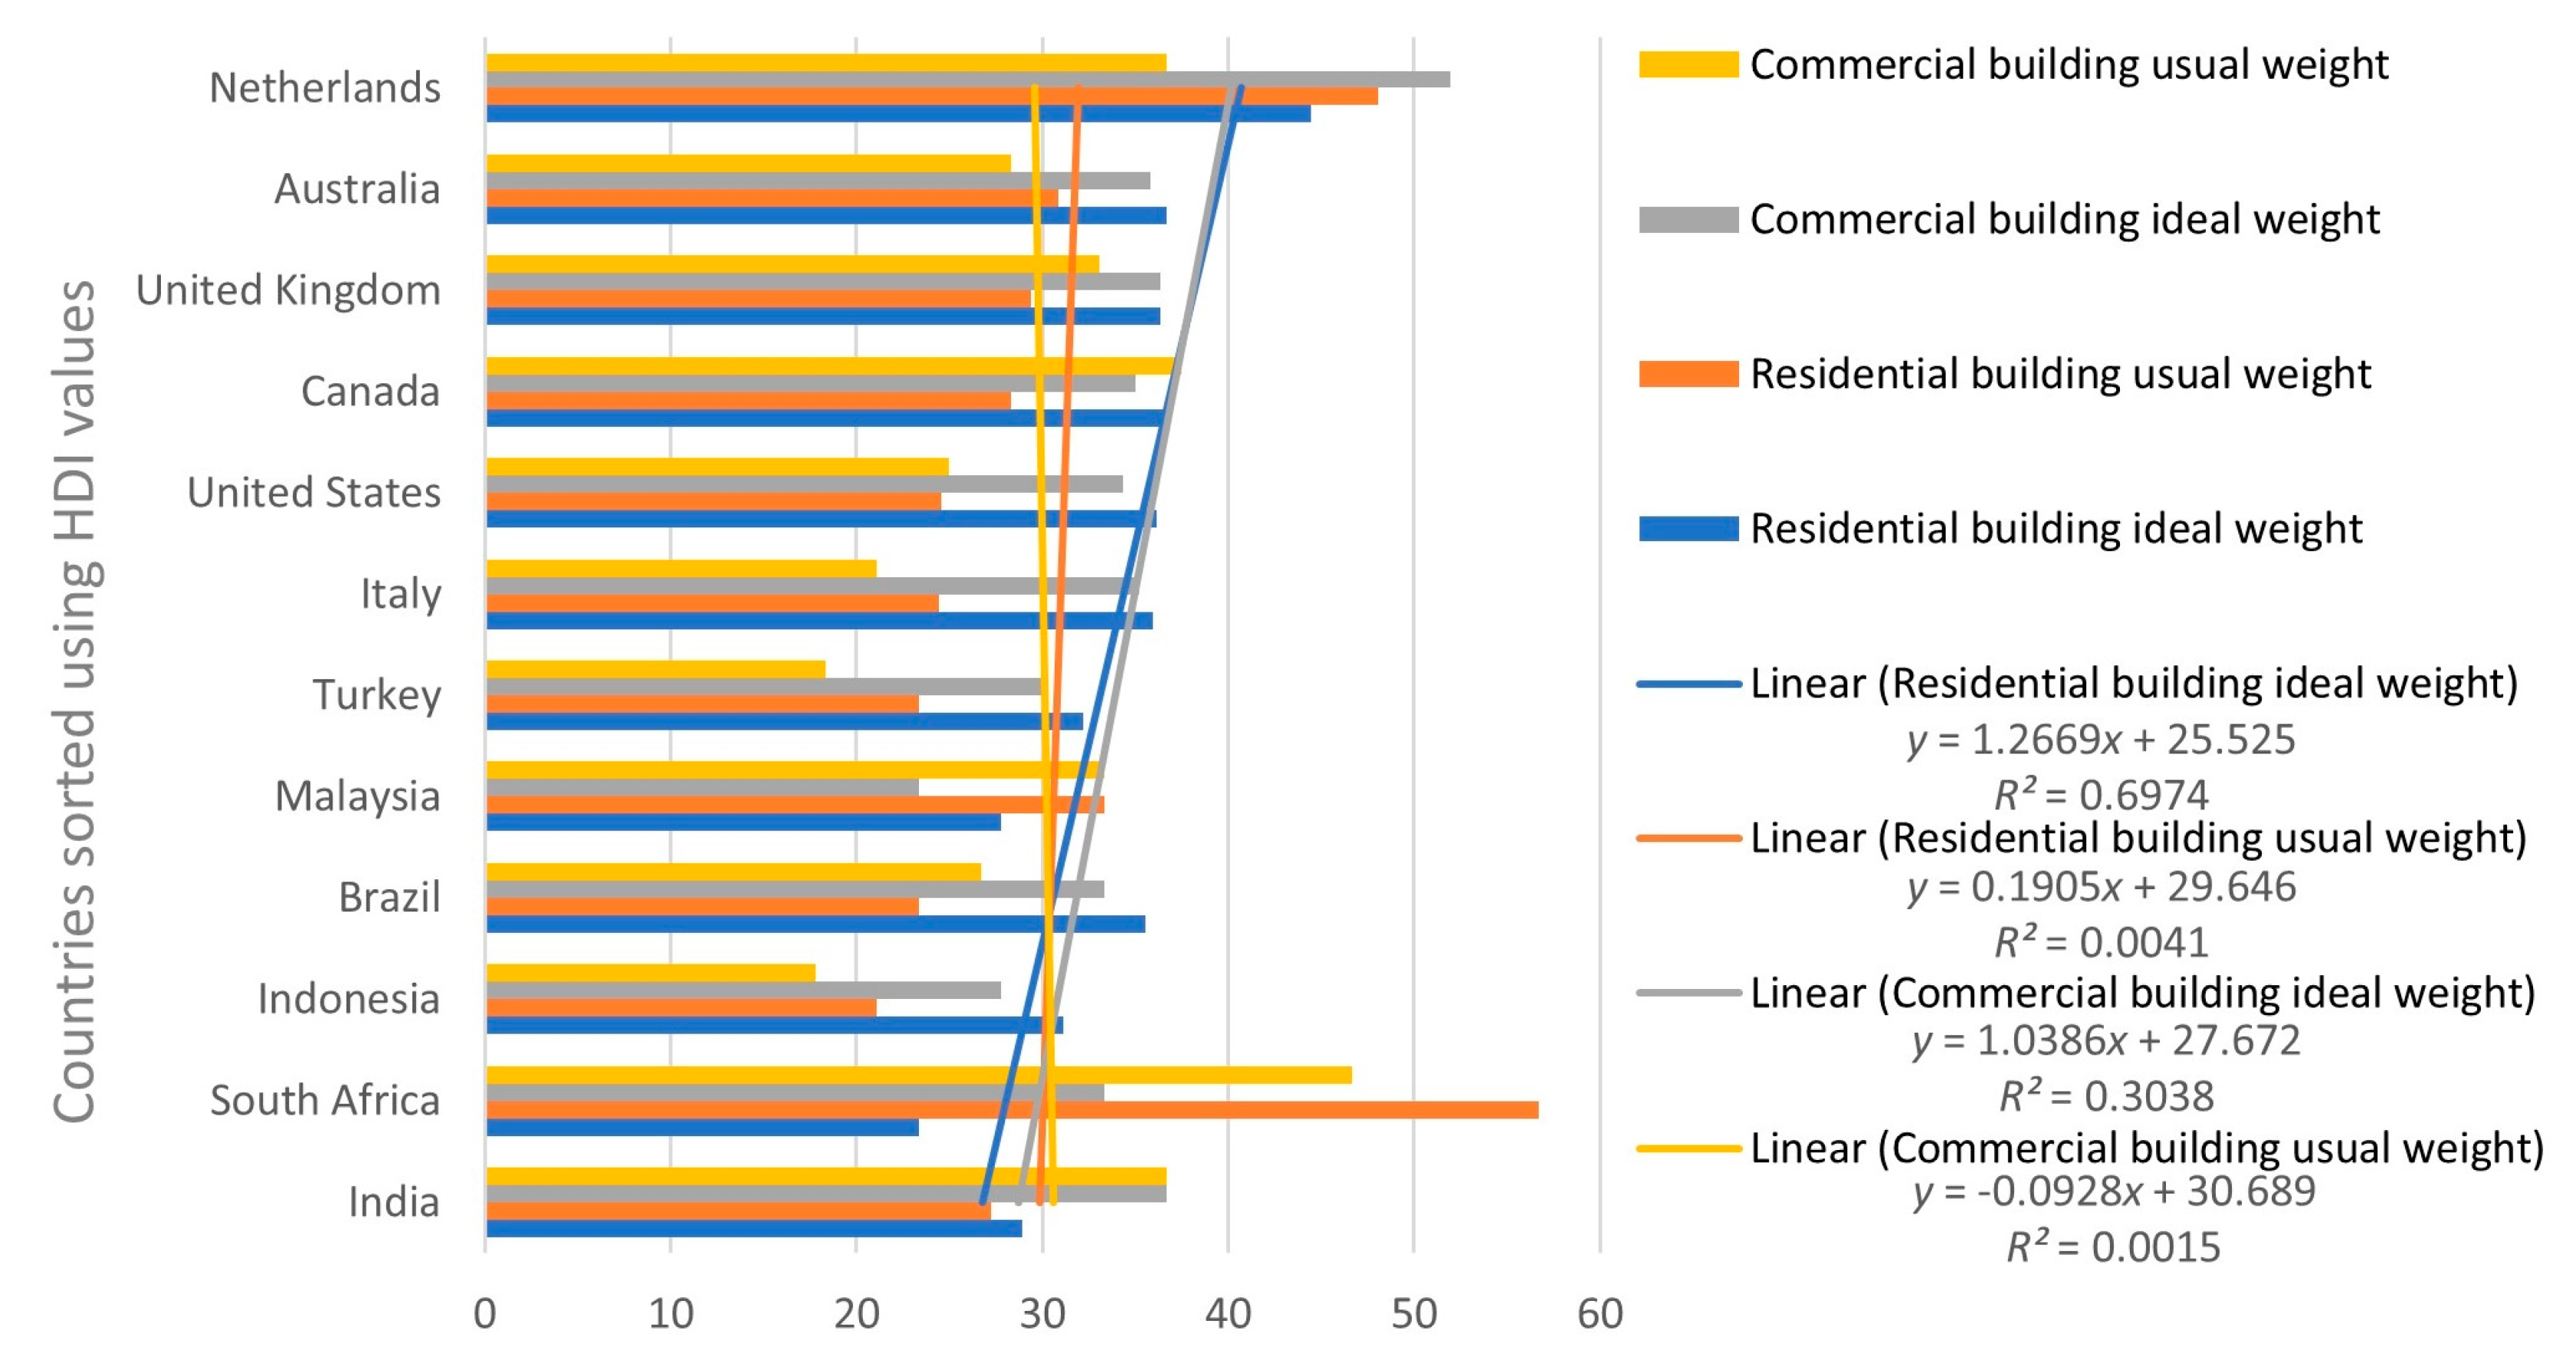
4.1. Weight of Environmental Sustainability Dimension

To address the first objective of this study, the respondents were asked to present for their respective countries the weights given to environmental sustainability from the group of three sustainability dimensions (i.e., social, economic and environmental sustainability) with the cumulative sum of all three dimensions equating to 100. Respondents opined about the current (i.e., typically assigned) and idealistic weights of environmental sustainability dimensions for residential and commercial buildings in their countries. ‘Ideal weight’ implies the relative attention which must be given to environmental sustainability in buildings. ‘Usual weight’ implies the relative attention given to environmental sustainability, in reality. Equal attention to three sustainability dimensions (i.e., environmental, social and economic) implies a weight of 33.33% for environmental sustainability. An environmental sustainability weight of less or more than 33.33% either indicates less or more attention to the environmental sustainability dimension compared to the other two sustainability dimensions.

4.1.1. Environmental Sustainability in Comparison with Social and Economic Dimensions

Sustainable development is about satisfying human needs by adhering to socio-economic and environmental values [47,52]. For a building project to be regarded as sustainable, all three sustainability dimensions need consideration [30]. Average weight values of the sustainability dimensions from all the survey responses are provided in Figure 2, which indicates the average trends towards social, economic and environmental sustainability in residential and commercial buildings. As shown by the radar charts in Figure 2, the most balanced weight values for the three sustainability dimensions are only for ideal residential and commercial building scenarios. In the case of usually assigned weights for commercial and residential buildings, much higher weight values are associated with the economic dimension compared to the environmental and the social dimensions. All three sustainability dimensions belong to a cohort, following a zero-sum approach which implies that an increase in the weight of one dimension decreases values for the other two dimensions. Based on analysis (see Figure 2), currently, in the building sector, social and environmental dimensions are dominated by their economic counterpart, and the survey participants have idealized that all three dimensions in the building sector should receive somewhat similar scores.
The difference in sustainability dimension weights can originate on the micro-level because of the difference in views of different project stakeholders and on the macro-level because of the difference in the regional policies. The disparity in expert opinions is analyzed in Figure 3, which shows the weights of sustainability dimensions with respect to respondents’ professional affiliation. The survey respondents belonged to Research and Education (n = 87), Design Consultancy (n = 23), Construction Consultancy (n = 5) and other construction-related professions (n = 5). Owing to the significant representation of Research and Education (n = 87) and Design Consultancy (n = 23) professions in the dataset, only their responses are presented in Figure 3. For ideal weights of residential and commercial buildings, respondents from both professions assigned roughly equal weights to all three dimensions. A slight difference in weights with respect to professional affiliation is observed in the case of the usual weights of commercial buildings. Compared to the professionals from Research and Education, those from Design Consultancy tend to associate slightly less weight with Social and Economic sustainability, but slightly more weight with Environmental sustainability. A detailed discussion regarding the social and the economic sustainability dimension in buildings and the indicators and the parameters associated with social and economic sustainability is beyond the scope of this paper, and it has been addressed by authors elsewhere [7,8].
When comparing the ideal sustainability weights from the Survey with previous studies, it is realized that some studies have prioritized environmental sustainability by assigning it a higher weight compared to other dimensions. For instance, in a study by Mateus and Bragança [30], while assessing the overall sustainability of Portuguese residential buildings, the weights used for environmental, social and economic dimensions were 40%, 30% and 30%, respectively. This indicates that for ideal case scenarios, environmental aspects have higher or at least equal weight compared to social and economic aspects.
The environmental and economic sustainability dimensions in building development typically have an inverse relationship. However, this inverse relation of environmental and economic sustainability may ease with improved processes as well as technology. In this regard, a study by Ahmad, Aibinu [53] has shown that all three sustainability dimensions are interrelated, and they may affect each other positively or negatively depending on some underlying conditions.

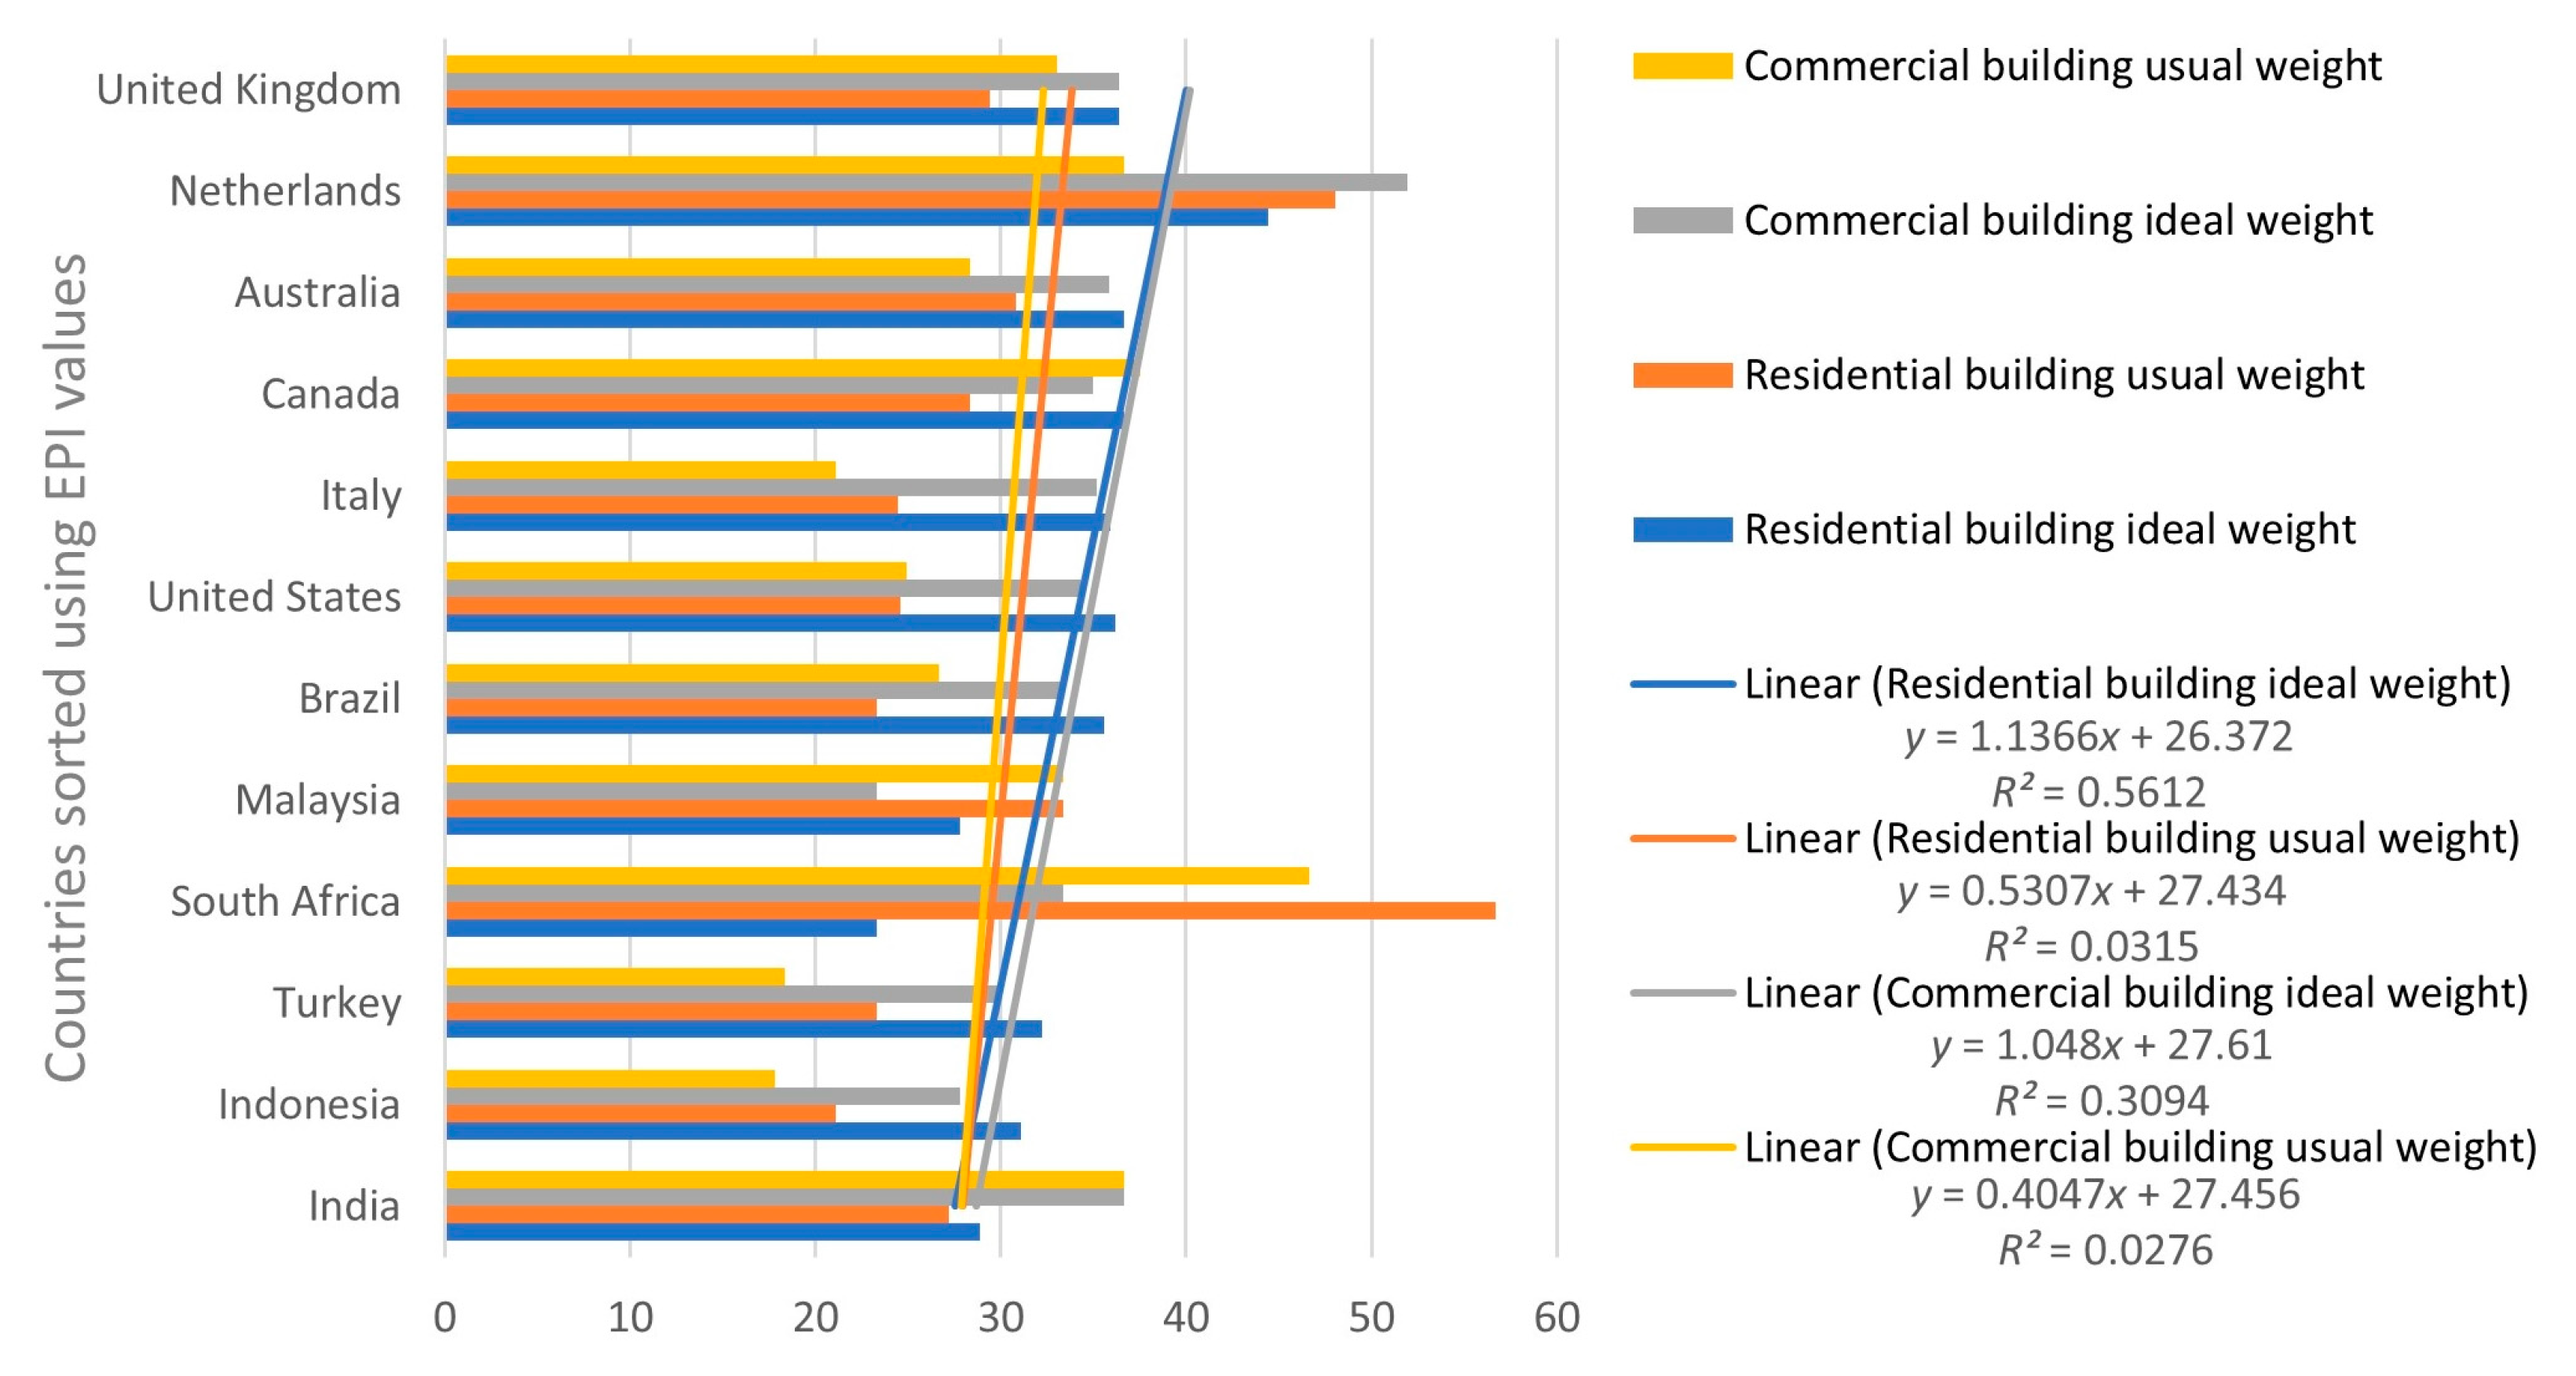
4.1.2. Detailed Analysis of Environmental Sustainability Weights

Respondents were asked about the relative weight of sustainability dimensions from the perspective of their countries. To investigate the regional trends, the survey data was segregated based on HDI estimates of 2019 [54]. This division helped to rationalize the weight distribution from the viewpoint of regional development. For the Survey conducted in this study, most of the participants belonged to highly developed regions (n = 92); hence the environmental sustainability weights they indicated were for countries with very high HDI. For countries with high, medium and low HDI values, 19, 6 and 3 responses were obtained, respectively. Owing to the relatively lesser number of responses for high, medium and low HDI value countries, the responses for these three groups of countries were collectively presented within the group of low to high HDI countries. Figure 4 presents the box whisker plots of environmental sustainability weights for buildings in countries with low to high and very high HDI values. Based on the median values as shown in five-number summaries, it can be deduced that very high HDI countries typically tend to give relatively more attention to environmental sustainability for residential buildings (Median = 25) and commercial buildings (Median = 30), compared to the weights typically given to residential buildings (Median = 20) and commercial buildings (Median = 25) in low to high HDI countries.
The survey findings related to the first objective of this study were also rationalized using the environmental performance of countries (i.e., EPI) for which building environmental sustainability weights were provided by survey participants. Environmental sustainability weights as opted by respondents from different countries are shown as comparative plots in Figure 5 and in Figure 6. The bar chart in Figure 5 indicates a trend in the weights upon sorting the responses in the order of the EPI score of countries for which the responses were provided. The environmental sustainability weights used in these analyses are average values of the weights suggested by different participants for a region. For instance, the weights for the USA in Figure 5 and in Figure 6 are the average values of weights provided by all USA-based participants (n = 27). The analyses presented in Figure 5 and Figure 6 are only for regions for which at least three survey participants provided their responses. This helped to reduce the likelihood of personal bias and inconsistent opinions while establishing regional trends toward environmental sustainability.
Among the countries included in the analysis, India has the lowest EPI score (27.6), and the UK has the highest EPI score (81.3). The linear trend lines provide an understanding of overall tendencies. The ideal weight of both residential and commercial buildings significantly increases from low to high EPI countries with a slope value of 1.136 and 1.048, respectively. However, the typical weight of residential and commercial buildings slightly increases from low to high EPI countries with a slope value of 0.53 and 0.40, respectively.
The bar chart in Figure 6 establishes trends in the weights upon sorting the responses in the descending order of the HDI values of countries for which responses are provided. With India having the lowest HDI value (0.645) and the Netherlands having the highest (0.944) of the regions considered for analysis, the linear trend lines provide an understanding of overall tendencies. The ideal weights of both the residential and commercial buildings have trend lines showing significant weight increase from low to high HDI value countries with a slope value of 1.27 and 1.04, respectively. On the contrary, the usual weights of residential and commercial buildings have trend lines showing very slight differences in weight among low and high HDI value countries with slope values of 0.19 and −0.09, respectively. The environmental sustainability weights, along with the EPI score and HDI value of respective countries (listed in Figure 5 and in Figure 6), are shown in Table 3.
Both Figure 5 and Figure 6 provide trends in environmental sustainability weights according to the EPI and the HDI values of countries, respectively. For the trendlines of ideal weights presented in Figure 5 and in Figure 6, R-square values are reasonably high, implying that there are clear correlations of HDI and EPI with ideal environmental sustainability weights of buildings in a country. On the contrary, low R-square values for typical weight trendlines in Figure 5 and in Figure 6 suggest that there is a weak correlation between the HDI and the EPI for typical environmental sustainability weights of buildings in a country. This implies that compared to low HDI and EPI regions, countries with the high level of human development and environmental performance would ideally associate more weight with building environmental sustainability. To address the second objective of this study, the findings of the second stage of the Survey are presented in the next section.

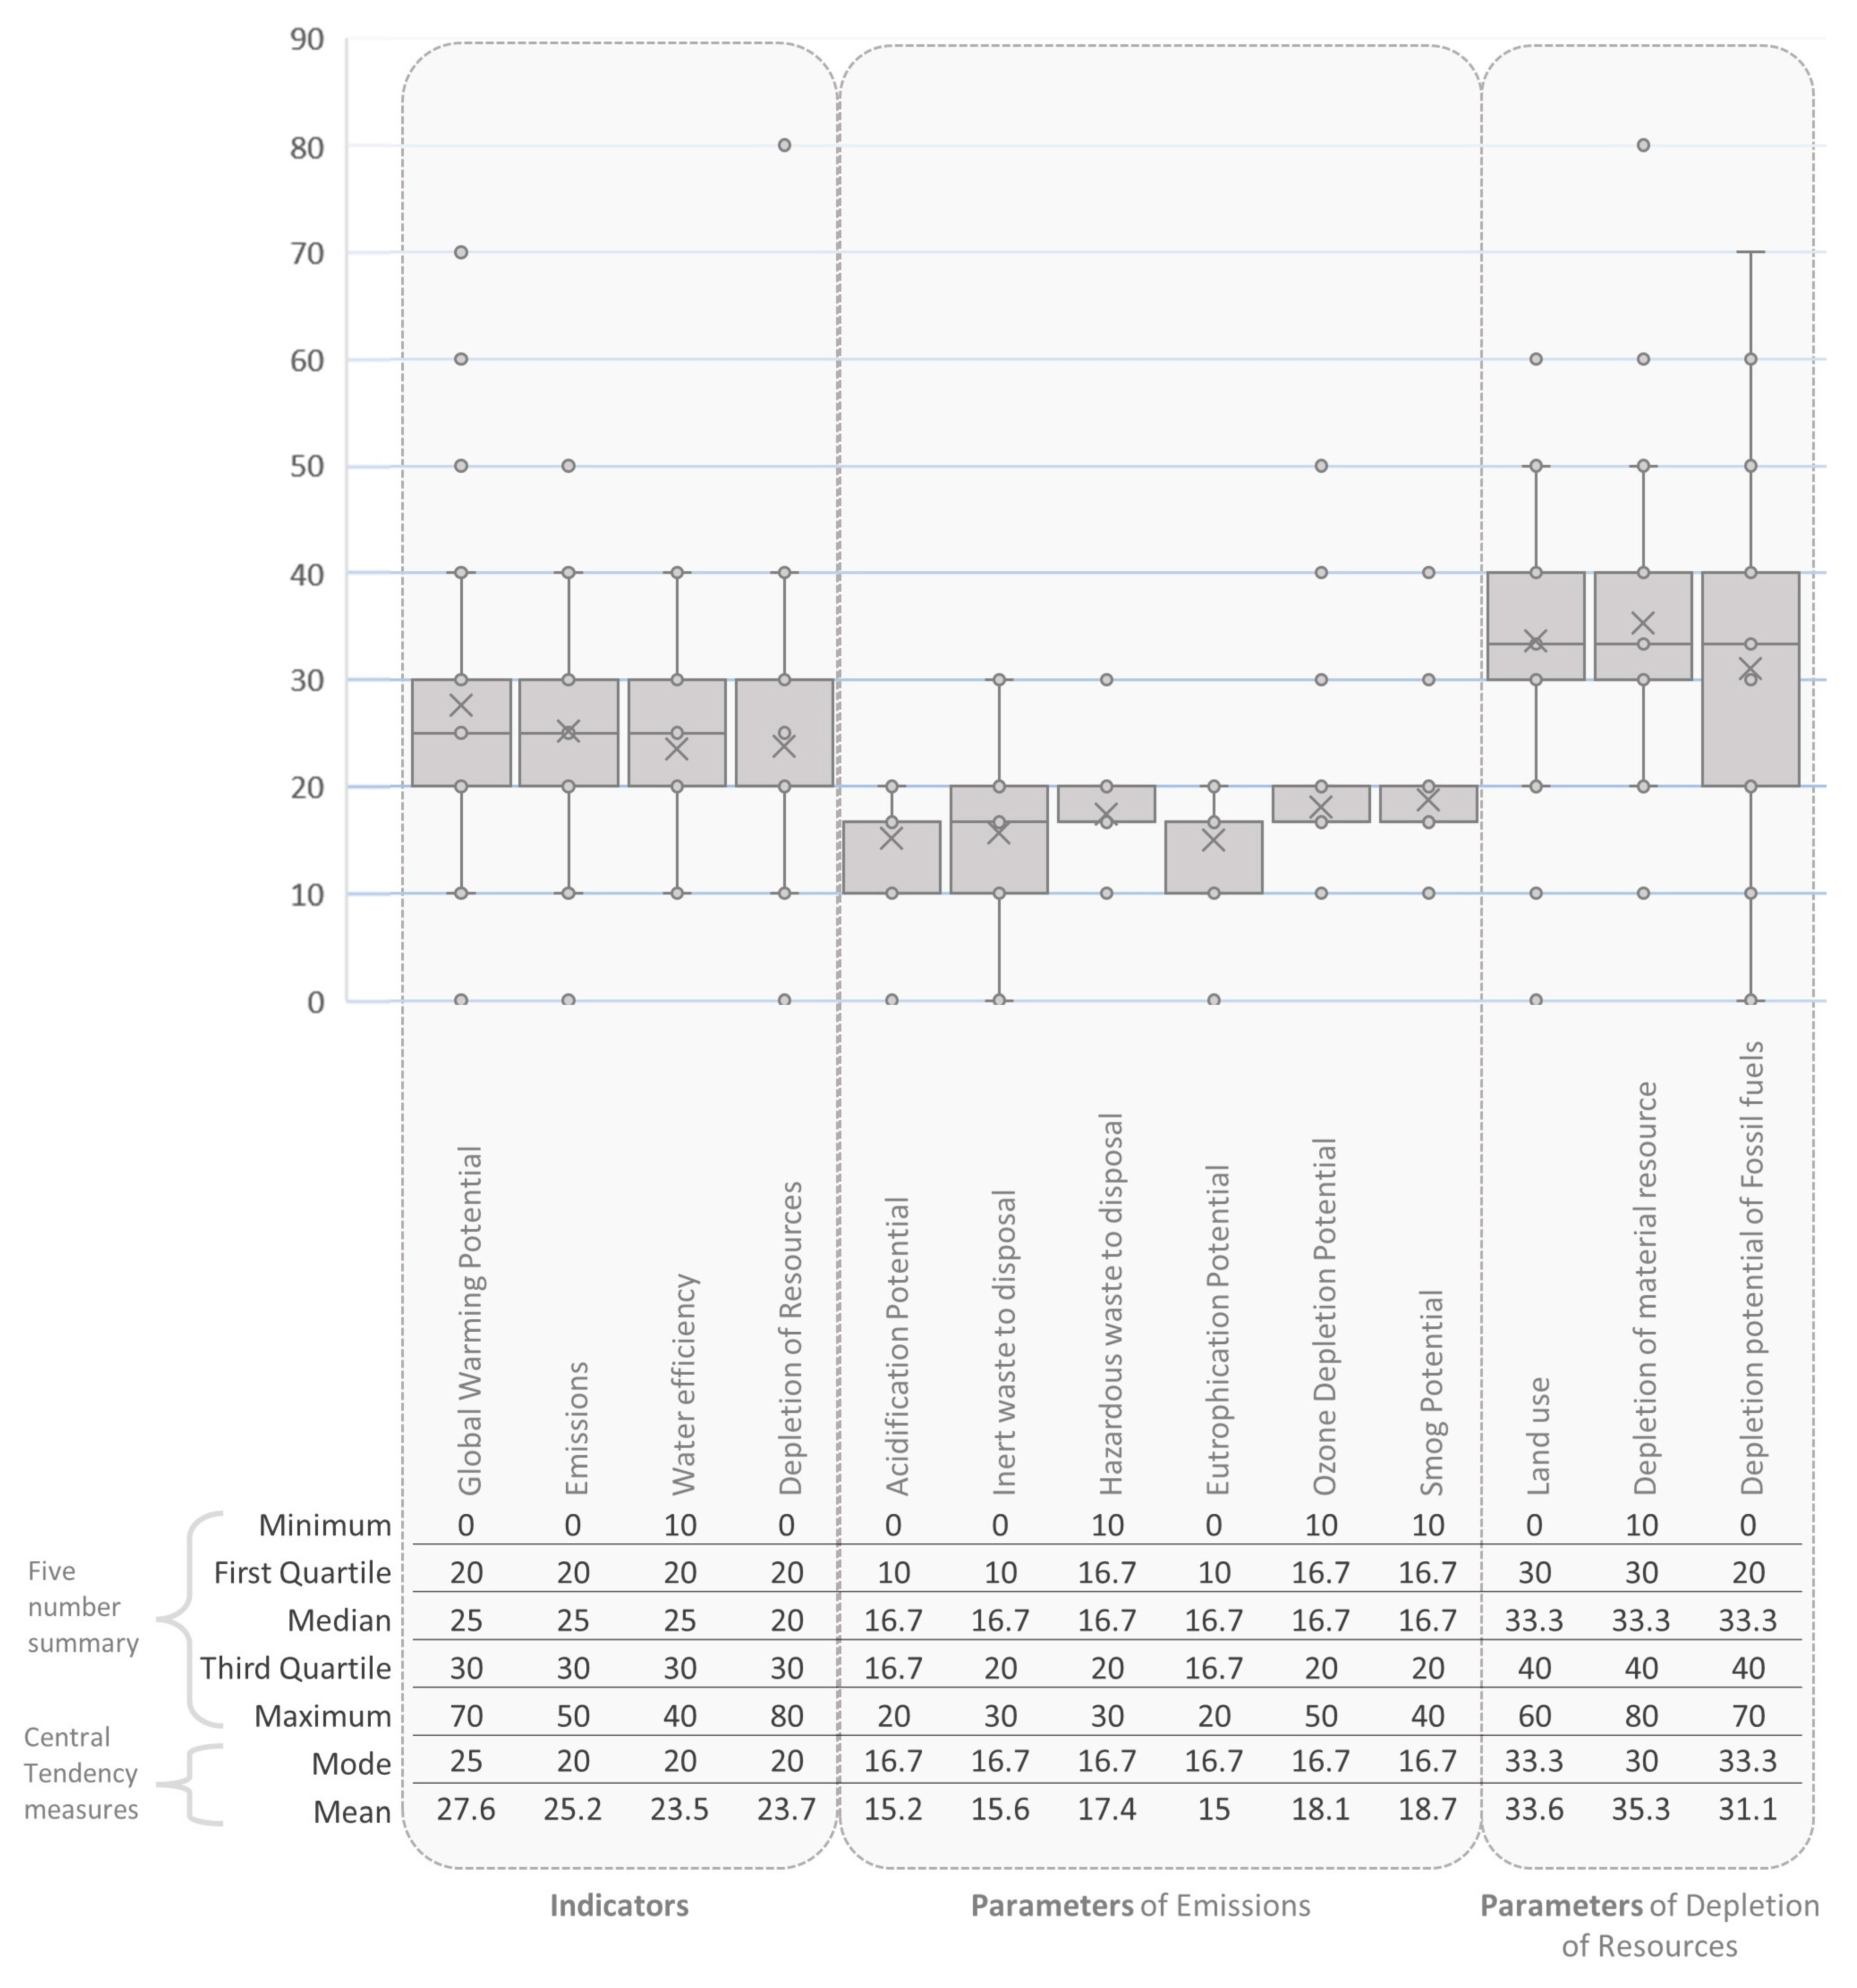
4.2. Weights of LCIA Indicators and Impact Parameters

To investigate the contemporary priorities towards environmental issues encompassed in the LCIA framework, the respondents were asked to provide their opinion regarding the relative weights for indicators and impact parameters of environmental sustainability. Other than the Human Health-related parameters shown in Table 1, all other indicators and parameters from the list were inquired. To discuss the variation in opinions from survey respondents, Figure 7 shows box whisker plots for weights of different indicators and parameters and provides the five-number summary of these weights. As apparent, a significant difference in opinions exists in the case of fossil fuel depletion potential, while the majority of respondents agree on the weights of smog potential, ozone depletion potential and hazardous waste to disposal parameters. However, for the weights of other indicators and parameters, the difference of opinion is between these two extremes.
The relative weights given to different indicators and parameters by survey participants have been highlighted in Figure 8. Among the four inquired indicators, global warming potential (mean weight = 27.6%) and emissions (mean weight = 25.2%) were associated with the highest relative weights. The depletion of resources indicator is comprised of three parameters (see Figure 8). Among them, the highest relative weight was assigned to depletion of material resources (mean weight = 35.3%). Also, the emissions indicator is comprised of six parameters. Among them, the highest relative weights were given to smog potential (mean weight = 18.7%) and ozone depletion potential (mean weight = 18.1%); and the least relative weights were assigned to eutrophication potential (mean weight = 15%) and acidification potential (mean weight = 15.2%).
The weight values assigned by survey participants in this study are somewhat symmetric, which means that among the various indicators and parameters of environmental sustainability, somewhat similar weights were assigned. Although a big difference in assigned weights is observed from the five-number summary (see Figure 7), the mean weight values in many cases are close to each other and give the appearance of symmetrical distribution. Since indicator and parameter weights were not inquired for individual regions, these weights from Survey have not been explained using the regional affiliation of survey participants.

4.2.1. Example of the Use of Parameter Weights

To demonstrate the role of identified parameter weights in deciding appropriate construction materials and assemblies, the example of a structural beam is provided in this section. Using the BEES Online tool, the objective impact parameter values for three 4K psi structural beams made of 100% Portland Cement Concrete (PC), 40% Fly Ash (FA) substituted, 20% Fly Ash (FA) and 30% slag substituted material were obtained (see Table 4). For this example, LCIA boundary conditions include the USA as the region of study and the life cycle encompassing all processes from material extraction to use in product form. For all three beam types, the impact parameter values are multiplied by their respective weights obtained from the Survey. The aggregate of these product values, as indicated in Table 4, helped decide the structural beam with the least environmental impact. From the example used in this study, it seems that beams with 100% PC have the highest environmental impact, while the beams using 20% FA and 30% slag as substitute material have the least environmental impact from the triad. This example demonstrates how the parameter weights provided by this study can help compare the overall environmental impact of building products to help the selection of environment-efficient materials.

4.2.2. Comparison of Survey Findings with Previous Studies

As shown in Table 5, a comparison of the indicator and impact parameter weights resulting from this study was made with the weights reported in the Harvard University study [26], SAB study [27,28] and NIST study [9]. In this study, only the indicators and parameters associated with environmental sustainability were considered. The weights from previous studies also include some parameters for human health (see Table 1). To compare the weights from this study with the weights of previous studies, human health-related parameters were eliminated from the lists of previous studies, and the weights of remaining environmental parameters were adjusted accordingly to have an aggregate value of 100. Parameter weights obtained from survey findings were also adjusted for comparison. This was accomplished by multiplying the percentage weight values of indicators with their respective impact parameters. Resultantly, the sum of the adjusted weights of all environmental parameters equaled ‘100’, hence making the parameter weights of this study comparable with the parameter weights of previous studies.
The following are some important highlights based on the comparison of parameter weights:
  • The highest difference in parameter weights was noticed in the case of the ‘water use’ parameter. In the previous studies, the highest weight value associated with ‘water use’ was 12. This study has indicated a weight value of 23.5 for this parameter which is almost double the highest value previously associated with this parameter.
  • Compared to general weight trends in previous studies, this study has associated relatively low weights with ‘emissions’-related parameters.
The next section addresses the findings from the third stage of the Survey.

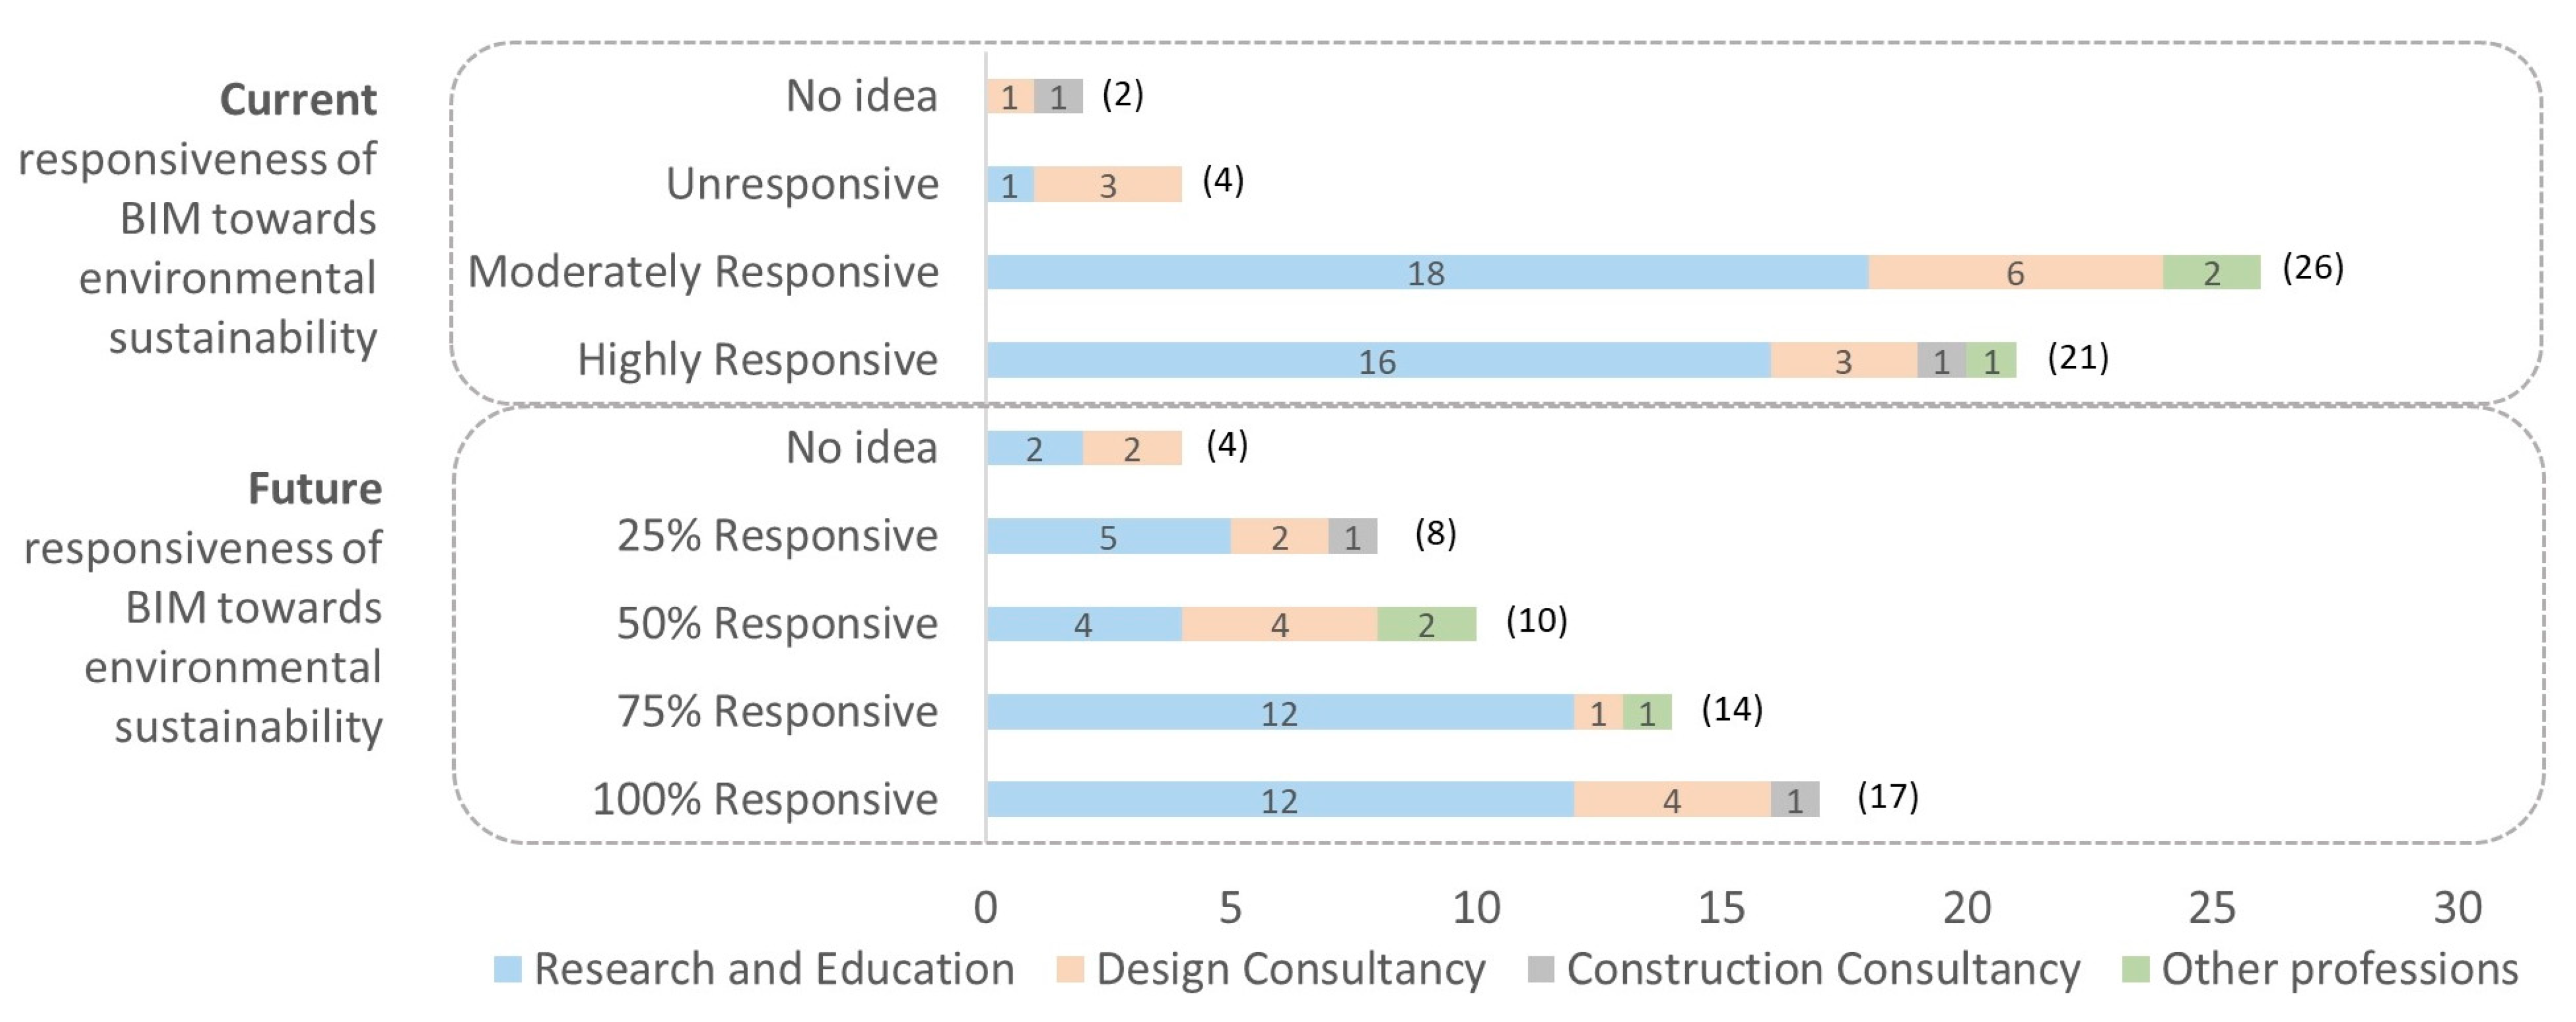
4.3. Responsiveness of BIM towards Building Environmental Sustainability

To explore the prospects of using BIM for environmental sustainability in buildings, opinions from 53 respondents were obtained about the current and future responsiveness of BIM towards the environmental sustainability of buildings.
As shown in Figure 9, a high number of respondents (89%) opined that BIM is currently highly (n = 21; 40%) or moderately (n = 26; 49%) responsive towards environmental sustainability in buildings. For the futuristic responsiveness, a high number of respondents (58.5%) opined that BIM in future will be 100% responsive (n = 17; 32%) or 75% responsive (n = 14; 26%) towards environmental sustainability.
Figure 9 explains the respondents’ choice for BIM’s current and futuristic responsiveness in the context of their professional affiliation (research and education, design consultancy, construction consultancy and others). For the question of current BIM responsiveness towards environmental sustainability, a higher proportion of respondents belonging to research and education opted for highly and moderately responsive choices. Based on the analysis, it can be concluded that in comparison with ‘unresponsive’ and ‘no idea’ choices, the significant majority of respondents for ‘highly responsive’ and ‘moderately responsive’ choices belonged to the ‘research and education’ area, therefore making these selections hardly contestable. For the question of futuristic potential responsiveness of BIM towards environmental sustainability, not only a high number of respondents is noticed in the case of ‘100% responsive’ and ‘75% responsive’ choices, the proportion of respondents from research and education in both these cases was approximately 70%. This gives credibility to these response choices, and the findings can be picked by BIM developers as a roadmap for future growth.
The capability of BIM for life cycle sustainability assessments faces several socio-technical challenges and barriers [55], which must be addressed to realize increased responsiveness of BIM towards environmental sustainability in future. A potential way of easing the challenges of life cycle sustainability assessment in BIM is through the use of generative design capabilities of BIM, a recommendation discussed in detail in the next section.

Using LCIA in Generative Design: Recommendations for Future Development of BIM

With the help of plugin applications such as Tally, LCIA is already being used in BIM platforms to help select environment-friendly building materials during building design [44,45]. However, the use of these plugins during the building design process implies that the designer would have to make changes to building assemblies and materials on a hit and trial basis to eventually select the materials with relatively lower environmental impacts. A potential improvement in this labor-intensive material selection process is possible by bridging BIM’s generative design capabilities with the LCIA approach.
The generative design technique is an artificial intelligence-enabled iterative design process that automatically identifies high performing design alternatives based on certain design rules, constraints and aspirations. This technique is typically applied to solve complexity in projects and generate unique design solutions that a human may not be able to conceive on their own [56]. Generative design has mainly been used in the manufacturing industry, and it has only recently been considered for use in the building sector. This approach not only reduces the effort of a designer, but it may also result in such high performing designs that may not be conceived by the human mind. Very few research studies and even fewer practical examples of the use of generative design in the building sector and the context of BIM are seen. However, the few studies which have considered generative design in the context of BIM have found their merger promising [57,58,59,60,61]. Even though studies considering BIM-based generative design and life cycle assessment are non-existent to the best of the authors’ knowledge, there are some studies which have considered the use of generative design for life cycle assessment and for improving the environmental performance of buildings [62,63,64,65]. A possible reason for the lack of studies on BIM-based generative design and life cycle assessment is that generative design has only recently been used in combination with BIM. This is an important research gap, which once filled will make BIM more responsive to environmental sustainability in buildings.
Generative design is inherently effective in generating design choices with optimal performance across several constraints, rules and variables. Software such as Revit and ArchiCAD have already incorporated generative design capabilities on BIM platforms to some extent. The bridging of BIM-enabled generative design and BIM-enabled LCIA would result in the automated generation of multiple design alternatives for buildings with relatively lower environmental impact. Future studies can explore this direction to further improve the responsiveness of BIM towards environmental sustainability.

5. Conclusions

Environmental sustainability is progressively embraced in the assessment and development of the built environment. Assessment of environmental sustainability of building materials is enabled by LCIA, which is comprised of indicators and impact parameters representing environmental issues. To assist material-related decision-making in this regard, LCIA parameters and indicators need to be assigned different weights, which was a key objective of this study. This study also investigated the inclination toward environmental sustainability in buildings and the role of BIM in environmental sustainability.
To address the research objectives, this study harnessed the viewpoint of 120 AEC professionals from a multi-regional survey. In the first stage of the Survey (n = 120), typical and ideal weights for environmental sustainability were found for residential and commercial buildings. It was realized that in the case of residential and commercial buildings, the ideal weights aspired by survey participants were reasonably high compared to the weights usually given to environmental sustainability in buildings. This indicated that the survey participants felt the need for more attention to environmental sustainability in buildings compared to the attention typically given to socio-economic aspects of buildings.
The second stage of the Survey (n = 75) involved the determination of indicators and impact parameter weights. The mean values of the weights were found to have some differences when compared with weights from previous studies. The weights from this study were used in an example case to indicate how they help provide an aggregate value of environmental impact associated with building material. This case example elaborated the practical implication of the study findings in selecting construction material alternatives with relatively lower environmental impact.
In the third stage of the survey (n = 53), a high number of respondents (89%) reported that BIM was currently highly (n = 21; 40%) or moderately (n = 26; 49%) responsive toward environmental sustainability. For the futuristic responsiveness, a high number of respondents (58.5%) hoped that BIM would be 100% responsive (n = 17; 32%) or 75% responsive (n = 14; 26%) towards environmental sustainability. Detailed recommendations were provided to enable the adoption of LCIA in BIM to increase the future responsiveness of BIM towards building environmental sustainability.
One of the key contributions of this study is to employ the opinion of building sector professionals in determining the weights of LCIA indicators and parameters. Such a selection of participants has resulted in a unique perspective and hence sets this study apart from the other studies on the LCIA-related weights. Nonetheless, there are some limitations of this study which need to be highlighted. Even though most of the participants in the Survey were selected based on their detailed understanding of environmental issues, some of the weight-related responses they provided had a high level of disparity. Future studies need to address this issue by employing methods which reduce disparity in data collection. More participants from academia participated in this study compared to industry participants. This limits the interpretation of findings based on the role of participants in the construction industry. Future studies may benefit from more balanced sample sets with a similar number of responses from different regions and different types of industry stakeholders. Also, the subjective weights of LCIA impact parameters may depend on the pertinent environmental issues within a regional context; hence, future studies more localized in terms of regional contexts may yield results more suitable for specific regions.

Author Contributions

Conceptualization, T.A. and M.J.T.; methodology, T.A. and M.J.T.; software, T.A.; validation, T.A.; formal analysis, T.A.; investigation, T.A.; resources, T.A. and M.J.T.; data curation, T.A.; writing—original draft preparation, T.A.; writing—review and editing, T.A. and M.J.T.; visualization, T.A.; supervision, M.J.T. All authors have read and agreed to the published version of the manuscript.

Funding

This research received no external funding.

Institutional Review Board Statement

Not applicable.

Informed Consent Statement

Informed consent was obtained from all subjects involved in the study.

Data Availability Statement

Not applicable.

Acknowledgments

Authors are thankful to respondents of the multi-regional Survey. The time they spared for this study has enabled most of the findings in this study.

Conflicts of Interest

The authors declare no conflict of interest.

References

  1. Chan, E.H.W.; Qian, Q.K.; Lam, P.T.I. The market for green building in developed Asian cities—The perspectives of building designers. Energy Policy 2009, 37, 3061–3070. [Google Scholar] [CrossRef]
  2. Gottfried, D.A. Sustainable Building Technical Manual—Green Building GB Design, Construction, and Operations; Produced by Public Technology Inc., USGB Council, Sponsored by US Department of Energy, US Environmental Protection Agency; Public Technology Inc.: Alexandria, VA, USA, 1994. [Google Scholar]
  3. Rodman, D.; Lenssen, N. A Building Revolution: How Ecology and Health Concerns Are Transforming Construction; Worldwatch Paper 124; Worldwatch Institute: Washington, DC, USA, 1996. [Google Scholar]
  4. Zuo, J.; Zhao, Z.-Y. Green building research–current status and future agenda: A review. Renew. Sustain. Energy Rev. 2014, 30, 271–281. [Google Scholar] [CrossRef]
  5. Ajayi, S.O.; Oyedele, L.O.; Akinade, O.; Bilal, M.; Owolabi, H.A.; Alaka, H.A.; Kadiri, K.O. Reducing waste to landfill: A need for cultural change in the UK construction industry. J. Build. Eng. 2016, 5, 185–193. [Google Scholar] [CrossRef]
  6. WBCSD. 2050 The New Agenda for Business; World Business Council for Sustainable Development: Geneva, Switzerland, 2010. [Google Scholar]
  7. Ahmad, T.; Thaheem, M.J. Developing a residential building-related social sustainability assessment framework and its implications for BIM. Sustain. Cities Soc. 2017, 28, 1–15. [Google Scholar] [CrossRef]
  8. Ahmad, T.; Thaheem, M.J. Economic sustainability assessment of residential buildings: A dedicated assessment framework and implications for BIM. Sustain. Cities Soc. 2018, 38, 476–491. [Google Scholar] [CrossRef]
  9. Gloria, T.P.; Lippiatt, B.C.; Cooper, J. Life cycle impact assessment weights to support environmentally preferable purchasing in the United States. Environ. Sci. Technol. 2007, 41, 7551–7557. [Google Scholar] [CrossRef]
  10. Kovacic, I.; Waltenbereger, L.; Gourlis, G. Tool for life cycle analysis of facade-systems for industrial buildings. J. Clean. Prod. 2016, 130, 260–272. [Google Scholar] [CrossRef]
  11. Skaar, C.; Lausselet, C.; Bergsdal, H.; Brattebø, H. Towards a LCA Database for the Planning and Design of Zero-Emissions Neighborhoods. Buildings 2022, 12, 512. [Google Scholar] [CrossRef]
  12. Hegeir, O.A.; Kvande, T.; Stamatopoulos, H.; Bohne, R.A. Comparative Life Cycle Analysis of Timber, Steel and Reinforced Concrete Portal Frames: A Theoretical Study on a Norwegian Industrial Building. Buildings 2022, 12, 573. [Google Scholar] [CrossRef]
  13. Torabi, F.; Ahmadi, P. Chapter 1—Battery Technologies. In Simulation of Battery Systems; Torabi, F., Ahmadi, P., Eds.; Academic Press: Cambridge, MA, USA, 2020; pp. 1–54. [Google Scholar]
  14. Laurin, L.; Dhaliwal, H. Life Cycle Environmental Impact Assessment. In Encyclopedia of Sustainable Technologies; Abraham, M.A., Ed.; Elsevier: Oxford, UK, 2017; pp. 225–232. [Google Scholar]
  15. Eastman, C.; Eastman, C.; Teicholz, P.; Sacks, R.; Liston, K. BIM Handbook: A Guide to Building Information Modeling for Owners, Managers, Designers, Engineers and Contractors; John Wiley & Sons: Hoboken, NJ, USA, 2011. [Google Scholar]
  16. Chuang, T.-H.; Lee, B.-C.; Wu, I.-C. Applying Cloud Computing Technology to BIM Visualization and Manipulation. 2011. Available online: https://www.researchgate.net/profile/I-Chen-Wu-8/publication/320404555_Applying_Cloud_Computing_Technology_to_BIM_Visualization_and_Manipulation/links/5b3b9a344585150d23f63f2c/Applying-Cloud-Computing-Technology-to-BIM-Visualization-and-Manipulation.pdf (accessed on 15 March 2022).
  17. Lee, G.; Sacks, R.; Eastman, C.M. Specifying parametric building object behavior (BOB) for a building information modeling system. Autom. Constr. 2006, 15, 758–776. [Google Scholar] [CrossRef]
  18. Nguyen, T.; Shehab, T.; Gao, Z. Evaluating sustainability of architectural designs using building information modeling. Open Constr. Build. Technol. J. 2010, 4, 1–8. [Google Scholar] [CrossRef]
  19. Trusty, W.B.; Horst, S. Integrating LCA Tools in Green Building Rating Systems. In Proceedings of the US Green Building Annual Conference, Pittsburgh, PA, USA, 12–14 November 2003. [Google Scholar]
  20. Lippiatt, B.C. Bees 4.0: Building for Environmental and Economic Sustainability. Technical Manual and User Guide; NIST Pubs: Gaithersburg, MD, USA, 2007. [Google Scholar]
  21. Farrell, A.; Hart, M. What does sustainability really mean? The search for useful indicators. Environ. Sci. Policy Sustain. Dev. 1998, 40, 4–31. [Google Scholar] [CrossRef]
  22. Gallopin, G.C. Indicators and their use: Information for decision-making. Scope Sci. Comm. Probl. Environ. Int. Counc. Sci. Unions 1997, 58, 13–27. [Google Scholar]
  23. Bragança, L.; Mateus, R.; Koukkari, H. Building sustainability assessment. Sustainability 2010, 2, 2010–2023. [Google Scholar] [CrossRef] [Green Version]
  24. Kneifel, J.; Lavappa, P.; Polidoro, B.; Greig, A.L. Building for Environmental and Economic Sustainability (BEES) Online 2.1 Technical Manual; US Department of Commerce, National Institute of Standards and Technology: Washington, DC, USA, 2018.
  25. Chan, M.; Masrom, M.A.N.; Yasin, S.S. Selection of Low-Carbon Building Materials in Construction Projects: Construction Professionals’ Perspectives. Buildings 2022, 12, 486. [Google Scholar] [CrossRef]
  26. Norberg-Bohm, V.; Kneifel, J.; Lavappa, P.; Polidoro, B.; Greig, A.L. International Comparisons of Environmental Hazards: Development and Evaluation of a Method for Linking Environmental Data with the Strategic Debate Management Priorities for Risk Management; Center for Science and International Affairs, John F. Kennedy School of Government, Harvard University: Cambridge, MA, USA, 1992. [Google Scholar]
  27. U.S. EPA. Reducing Risk: Setting Priorities and Strategies for Environmental Protection: The Report of the Science Advisory Board: Relative Risk Reduction Strategies Committee to William K. Reilly, Administrator, United States Environmental Protection Agency; US Environmental Protection Agency: Washington, DC, USA, 1990.
  28. EPA. Toward Integrated Environmental Decision-Making; EPA (Environmental Protection Agency): Washington, DC, USA, 2000.
  29. Levin, H. Best Sustainable Indoor Air Quality Practices in Commercial Buildings. 1996. Available online: https://www.researchgate.net/publication/267632120_Best_sustainable_IAQ_Practices_for_commercial_buildings (accessed on 15 March 2022).
  30. Mateus, R.; Bragança, L. Sustainability assessment and rating of buildings: Developing the methodology SBToolPT–H. Build. Environ. 2011, 46, 1962–1971. [Google Scholar] [CrossRef]
  31. Azhar, S.; Brown, J.; Sattineni, A. A case study of building performance analyses using building information modeling. In Proceedings of the 27th International Symposium on Automation and Robotics in Construction (ISARC-27), Bratislava, Slovakia, 20 June 2010. [Google Scholar]
  32. Azhar, S.; Carlton, W.A.; Olsen, D.; Ahmad, I. Building information modeling for sustainable design and LEED rating analysis. Autom. Constr. 2011, 20, 217–224. [Google Scholar] [CrossRef]
  33. Akadiri, P.O. Understanding barriers affecting the selection of sustainable materials in building projects. J. Build. Eng. 2015, 4, 86–93. [Google Scholar] [CrossRef]
  34. Improving Building Industry Results through Integrated Project Delivery and Building Information Modeling. 2008. Available online: http://images.autodesk.com/latin_am_main/files/bim_and_ipd_whitepaper.pdf (accessed on 15 March 2022).
  35. Chong, H.-Y.; Wang, X.; Lee, C.-Y. A mixed review of the adoption of Building Information Modelling (BIM) for sustainability. J. Clean. Prod. 2017, 142, 4114–4126. [Google Scholar] [CrossRef] [Green Version]
  36. Building Information Modeling for Sustainable Design. 2005. Available online: http://images.autodesk.com/latin_am_main/files/bim_for_sustainable_design_oct08.pdf (accessed on 15 March 2022).
  37. Azhar, S.; Brown, J. BIM for sustainability analyses. Int. J. Constr. Educ. Res. 2009, 5, 276–292. [Google Scholar] [CrossRef]
  38. Lee, S.; Tae, S.; Roh, S.; Kim, T. Green Template for Life Cycle Assessment of Buildings Based on Building Information Modeling: Focus on Embodied Environmental Impact. Sustainability 2015, 7, 16498–16512. [Google Scholar] [CrossRef] [Green Version]
  39. Filho, M.V.A.P.M.; da Costa, B.B.F.; Najjar, M.; Figueiredo, K.V.; de Mendonça, M.B.; Haddad, A.N. Sustainability Assessment of a Low-Income Building: A BIM-LCSA-FAHP-Based Analysis. Buildings 2022, 12, 181. [Google Scholar] [CrossRef]
  40. Peng, C. Calculation of a building’s life cycle carbon emissions based on Ecotect and building information modeling. J. Clean. Prod. 2016, 112 Pt 1, 453–465. [Google Scholar] [CrossRef]
  41. Antón, L.Á.; Díaz, J. Integration of Life Cycle Assessment in a BIM Environment. Procedia Eng. 2014, 85, 26–32. [Google Scholar] [CrossRef] [Green Version]
  42. Ajayi, S.O.; Oyedele, L.O.; Ceranic, B.; Gallanagh, M.; Kadiri, K.O. Life cycle environmental performance of material specification: A BIM-enhanced comparative assessment. Int. J. Sustain. Build. Technol. Urban Dev. 2015, 6, 14–24. [Google Scholar] [CrossRef] [Green Version]
  43. Tahmasebi, M.M.; Banihashemi, S.; Hassanabadi, M.S. Assessment of the Variation Impacts of Window on Energy Consumption and Carbon Footprint. Procedia Eng. 2011, 21, 820–828. [Google Scholar] [CrossRef] [Green Version]
  44. Najjar, M.; Figueiredo, K.; Palumbo, M.; Haddad, A. Integration of BIM and LCA: Evaluating the environmental impacts of building materials at an early stage of designing a typical office building. J. Build. Eng. 2017, 14, 115–126. [Google Scholar] [CrossRef]
  45. Tushar, Q.; Bhuiyan, M.A.; Zhang, G.; Maqsood, T. An integrated approach of BIM-enabled LCA and energy simulation: The optimized solution towards sustainable development. J. Clean. Prod. 2021, 289, 125622. [Google Scholar] [CrossRef]
  46. The SAGE Encyclopedia of Educational Research, Measurement, and Evaluation; SAGE Publications Inc.: Thousand Oaks, CA, USA, 2018.
  47. Almahmoud, E.S.; Doloi, H.K. Social sustainability health check: A model for integrating stakeholders’interests in evaluating and optimising social sustainability performance of construction projects. CIB Int. Conf. 2012, 2012, 98–105. [Google Scholar]
  48. Talukhaba, A.; Ngowi, A.; Letlape, K. Implementation of socioeconomic sustainability in construction projects at the planning stage in developing countries. In Proceedings of the CIBW99 Working Commission Fourth Triennial Conference—Rethinking and Revitalizing Construction Safety, Health and Quality, Port Elisabeth, South Africa, 17–20 May 2005. [Google Scholar]
  49. Du Plessis, C. Agenda 21 for Sustainable Construction in Developing Countries. Available online: https://d1wqtxts1xzle7.cloudfront.net/44239864/Agenda_21-with-cover-page-v2.pdf?Expires=1652801158&Signature=CPOTBtLoV7FxYobHsceRjC6-74OP94WEKWuvZLF0PSQjMm5Cjs6vg~Y59hzDpYFD6GHLIbi4qjfYhyUFU46PDOEUNG0o~5Oue8F~eZjL-Y4sC1aA2gPwxHh5TtXFu-BodOj7Uo2N8ZPxf22RWVjdieCJcVX3JaN7vB1KmQ5yt14M0qlqZ6agi0KbXyCij67M~UGBj4Tp8zdUWdXi~AVN9cNIRllxWONGBLizigdyvWERk8gii2qIeU6gw8ox49Pgr3LY~DxE~Tam3vucb375W5yhCJYRDIs9g0ONnyQ7AsZVQVsevzvs0gDgmfVV4FExn83B69P4I~aIsepaiMH3kw__&Key-Pair-Id=APKAJLOHF5GGSLRBV4ZA (accessed on 15 March 2022).
  50. Human Development Index (HDI); Human Development Reports. 2019. Available online: https://hdr.undp.org/sites/default/files/hdr2019.pdf (accessed on 15 March 2022).
  51. Yale Center for Environmental Law + Policy—YCELP, Yale University; Center for International Earth Science Information Network—CIESIN, Columbia University. 2020 Environmental Performance Index (EPI); NASA Socioeconomic Data and Applications Center (SEDAC): Palisades, NY, USA, 2020.
  52. Brundtland, G.H. World Commission on Environment and Development: Our Common Future; Oxford University Press: Oxford, UK, 1987. [Google Scholar]
  53. Ahmad, T.; Aibinu, A.A.; Stephan, A.; Chan, A.P. Investigating associations among performance criteria in Green Building projects. J. Clean. Prod. 2019, 232, 1348–1370. [Google Scholar] [CrossRef]
  54. Conceição, P. Human Development Report 2020: The Next Frontier Human Development and the Anthropocene; UNDP: New York, NY, USA, 2020. [Google Scholar]
  55. Onososen, A.; Musonda, I. Barriers to BIM-Based Life Cycle Sustainability Assessment for Buildings: An Interpretive Structural Modelling Approach. Buildings 2022, 12, 324. [Google Scholar] [CrossRef]
  56. Pasetti Monizza, G.; Bendetti, C.; Matt, D.T. Parametric and Generative Design techniques in mass-production environments as effective enablers of Industry 4.0 approaches in the Building Industry. Autom. Constr. 2018, 92, 270–285. [Google Scholar]
  57. Abrishami, S.; Goulding, J.S.; Pour-Rahimian, F.; Ganah, A. Integration of BIM and generative design to exploit AEC conceptual design innovation. J. Inf. Technol. Constr. 2014, 19, 350–359. [Google Scholar]
  58. Gan, V.J. BIM-based graph data model for automatic generative design of modular buildings. Autom. Constr. 2022, 134, 104062. [Google Scholar] [CrossRef]
  59. Ma, W.; Wang, X.; Wang, J.; Xiang, X.; Sun, J. Generative design in building information modelling (BIM): Approaches and requirements. Sensors 2021, 21, 5439. [Google Scholar] [CrossRef] [PubMed]
  60. Sydora, C.; Stroulia, E. Rule-based compliance checking and generative design for building interiors using BIM. Autom. Constr. 2020, 120, 103368. [Google Scholar] [CrossRef]
  61. Zarzycki, A. Parametric BIM as a Generative Design Tool; ACSA: Boston, MA, USA, 2012. [Google Scholar]
  62. Caldas, L. GENE_ARCH: An Evolution-Based Generative Design System for Sustainable Architecture. In Workshop of the European Group for Intelligent Computing in Engineering; Springer: Berlin/Heidelberg, Germany, 2006. [Google Scholar]
  63. Caldas, L. Generation of energy-efficient architecture solutions applying GENE_ARCH: An evolution-based generative design system. Adv. Eng. Inform. 2008, 22, 59–70. [Google Scholar] [CrossRef]
  64. Schwartz, Y. An Integrated Thermal Simulation & Generative Design Decision Support Framework for the Refurbishment or Replacement of Buildings: A Life Cycle Performance Optimisation Approach; UCL University College London: London, UK, 2018. [Google Scholar]
  65. Schwartz, Y.; Raslan, R.; Korolija, I.; Mumovic, D. A decision support tool for building design: An integrated generative design, optimisation and life cycle performance approach. Int. J. Archit. Comput. 2021, 19, 401–430. [Google Scholar] [CrossRef]
Figure 1. Regional affiliation of survey respondents.
Buildings 12 00700 g001
Figure 2. Radar chart showing typical and ideal weights of three sustainably dimensions.
Buildings 12 00700 g002
Figure 3. Weight of sustainability dimensions with respect to respondents’ area of belonging.
Buildings 12 00700 g003
Figure 4. Box whisker plots for environmental sustainability weights.
Buildings 12 00700 g004
Figure 5. Environmental sustainability weights for different countries sorted by EPI score.
Buildings 12 00700 g005
Figure 6. Environmental sustainability weights for different countries sorted by HDI value.
Buildings 12 00700 g006
Figure 7. Box whisker plots for indicator and impact parameter weights.
Buildings 12 00700 g007
Figure 8. Radar chart for the indicator and parameter weights.
Buildings 12 00700 g008
Figure 9. Current and future responsiveness of BIM towards environmental sustainability.
Buildings 12 00700 g009
Table 1. Relative weights of LCI impact parameters.
IndicatorImpact ParameterNIST WeightsSAB WeightsHarvard Study Weights
Climate changeGlobal warming potential291611
Water efficiencyWater use 839
Resources
depletion
Fossil fuel depletion 1057
Habitat alteration/Land use6166
EmissionsEutrophication potential659
Acidification potential359
Ozone depletion potential2511
Smog potential469
Ecological toxicity 8116
Human HealthCriteria air pollutants 9610
Human health 13116
Indoor air quality 3117
Table 2. Questions in different stages of the Survey.
Survey
Stage
Survey ThemesNumber of
Respondents
1Respondents’ introduction120
Understanding of sustainability dimensions
Typical weight of environmental sustainability for residential and commercial buildings currently prevalent in respondents’ country
The ideal weight of environmental sustainability for residential and commercial buildings that must prevail in respondents’ country
2Weights of environmental sustainability indicators and impact parameters75
3Current and futuristic responsiveness of BIM towards environmental sustainability53
Table 3. Building environmental sustainability weights for different regions.
CountryNumber of
Respondents
Residential
Building
Commercial
Building
Country HDI Value (2019) [54]Global EPI Rank (2020) [51] EPI Score (2020) [51]
Ideal WeightUsual WeightIdeal WeightUsual Weight
India628.8927.2236.6736.670.64516827.6
Indonesia331.1121.1127.7817.780.71811737.8
Turkey632.2223.333018.330.829942.6
South Africa323.3356.6733.3346.670.7099843.1
Malaysia327.7833.3323.3333.330.816847.9
Brazil335.5523.3333.3326.670.7655551.2
United States2736.1724.5734.3224.940.9262469.3
Italy935.9324.4435.1821.110.8922271
Canada436.6728.333537.50.9292071
Australia436.6730.8335.8328.330.9441374.9
Netherlands344.4448.0651.9436.670.9441175.3
United Kingdom1136.3629.3936.3633.030.932481.3
Mode *12033.332033.3320
Mean *12035.1426.8134.5526.14
Median *12033.332033.3330
Note: * implies mean, mode, and median of environmental sustainability weights provided by all survey participants.
Table 4. LCIA-related calculations for structural beam.
ParameterUnit of
Measure
Adjusted
Parameter Weight
Value of Impact
Parameter
Product of Impact
Parameter Weight and Value
100% PC40% FA20/30% FA/slag100% PC40% FA20/30% FA/slag
Global warming potentialkg CO2 eq27.6016.6012.9011.704.603.503.20
Water useLiter23.50128.50125.10123.7030.2029.4029.10
Primary energy demand—non-renewableMJ7.40118.10101.2094.008.707.507.00
Land usem216.400.130.090.070.020.020.01
Eutrophicationkg N eq3.801.6 × 10−21.2 × 10−21 × 10−26.2 × 10−44.5 × 10−43.8 × 10⁻⁴
Acidificationkg SO2 eq3.804.9 × 10−24.1 × 10−24.4 × 10−21.9 × 10−31.6 × 10−31.7 × 10⁻³
Ozone depletionkg CFC-11 eq4.602.5 × 10−71.8 × 10−71.5 × 10−71.2 × 10−88.4 × 10−97 × 10−9
Smogkg O3 eq4.701.000.840.770.050.040.04
EcotoxicityCTUe8.3022.1016.6014.301.801.401.20
Sum45.441.940.5
Table 5. Comparison of impact parameter weights from the Survey and previous studies.
IndicatorIndicator Weights from Survey (Mean Values)Impact
Parameter
Parameter Weights from Survey
(Mean Values)
Adjusted Parameter Weights from Survey NIST Study Weights
(Adjusted)
SAB Weights (Adjusted)Harvard Study Weights
(Adjusted)
Climate change27.6Global warming potential 27.6382214
Water
efficiency
23.5Water use 23.511412
Resources
depletion
23.7Fossil fuel depletion 31.17.41379
Habitat
alteration
[16.4]8228
- Land use33.68.0
- Depletion of
material
resource
35.38.4
Emissions25.2Eutrophication
potential
15.03.88712
Acidification
potential
15.23.84712
Ozone depletion
potential
18.14.63714
Smog
potential
18.74.75812
Ecological toxicity [8.3]11158
- Inert waste to disposal15.63.9
- Hazardous waste to disposal17.44.4
Note: Previous studies have considered both ‘land use’ and ‘depletion of material resource’ within the parameter of ‘Habitat Alteration’. This study has considered both aspects of this parameter as separate parameters. To compare the findings of this study with previous studies, sum values [ ] of the two parameters are provided. ‘Ecological Toxicity’ is considered to include two parameters; ‘inert waste to disposal’ and ‘hazardous waste to disposal’. While the previous studies have investigated ‘Ecological Toxicity’, this study has considered ‘inert waste to disposal’ and ‘hazardous waste to disposal’ separately. To compare the findings of this study with previous studies, sum values [ ] of the two parameters are provided.
Publisher’s Note: MDPI stays neutral with regard to jurisdictional claims in published maps and institutional affiliations.

