
Compressive Behavior of a Fully Prefabricated Liftable Connection for Modular Steel Construction


 ,
,
Abstract
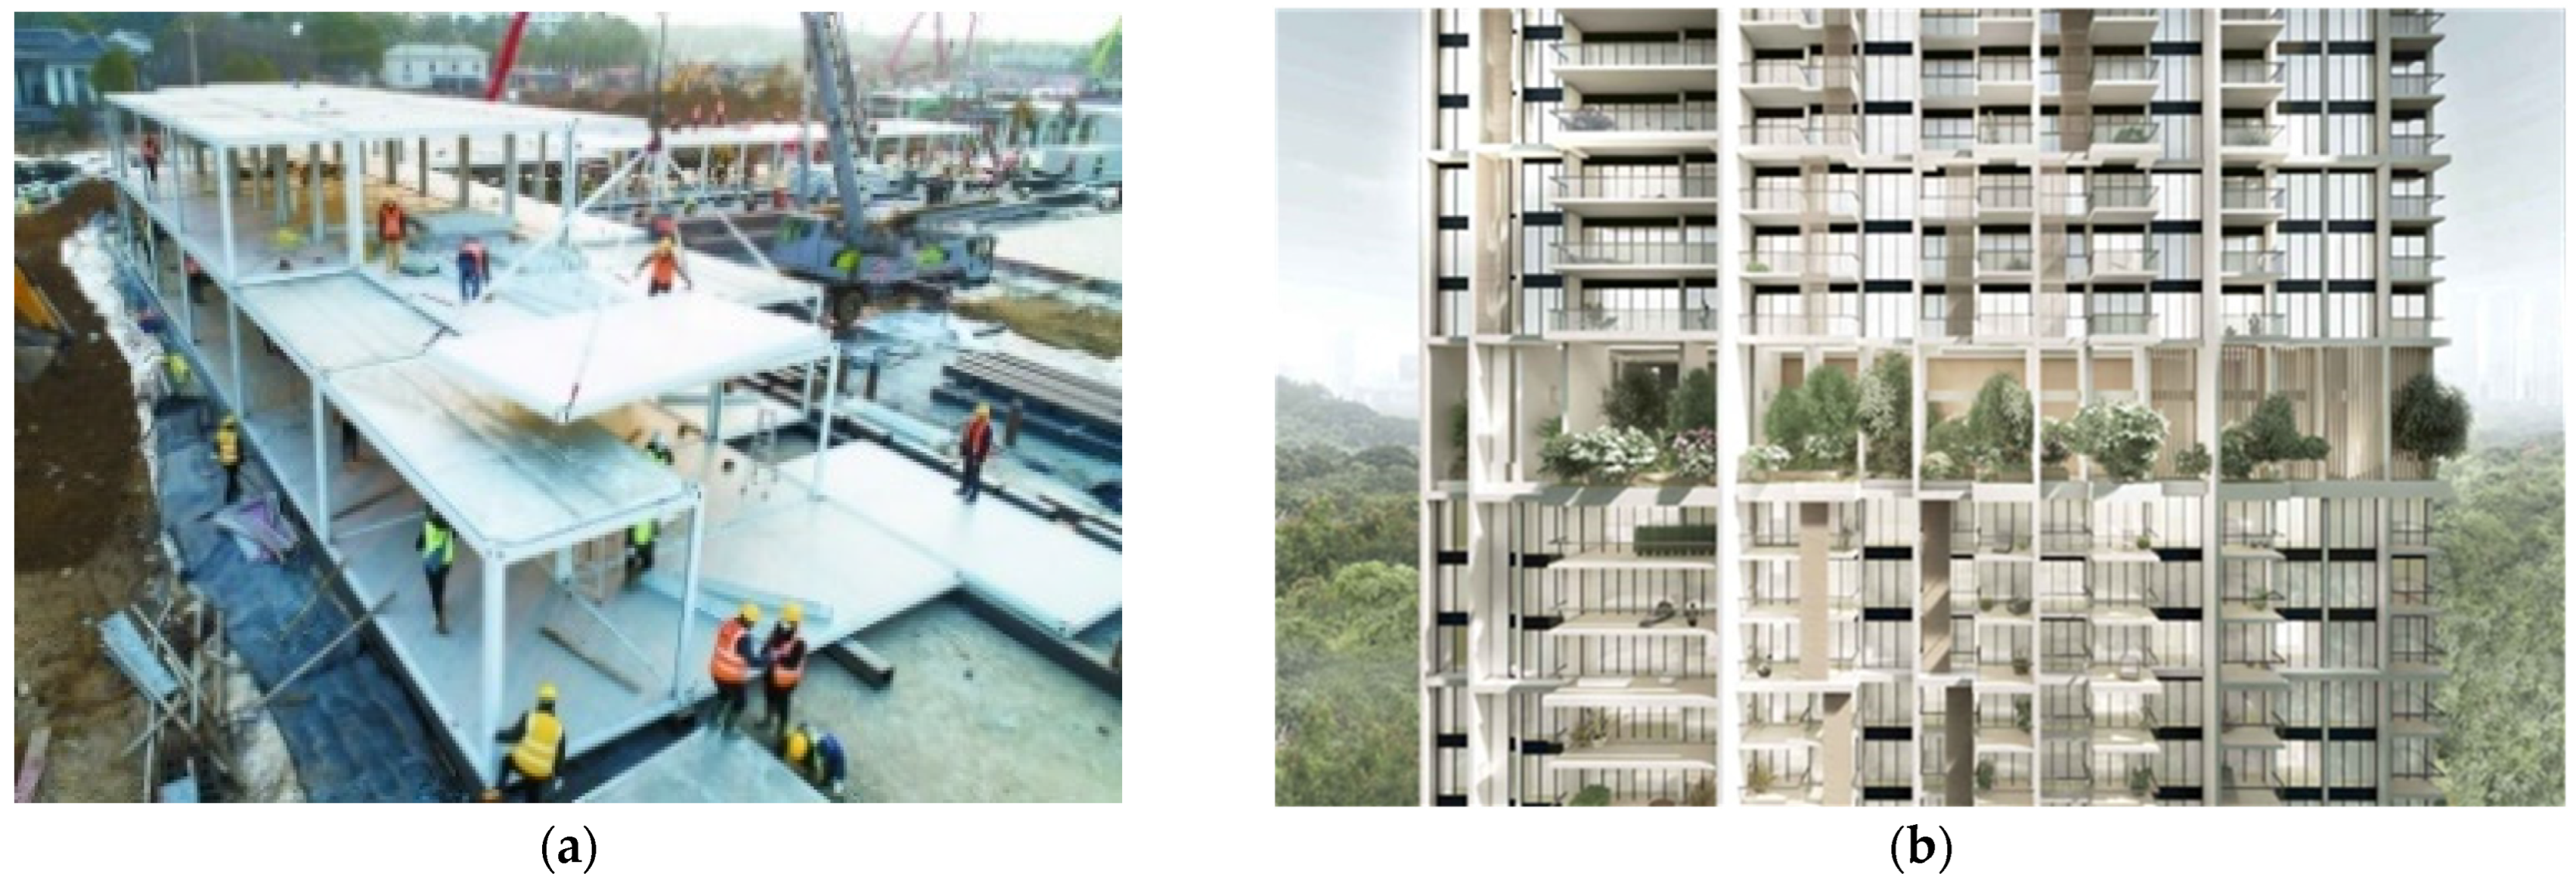
:1. Introduction
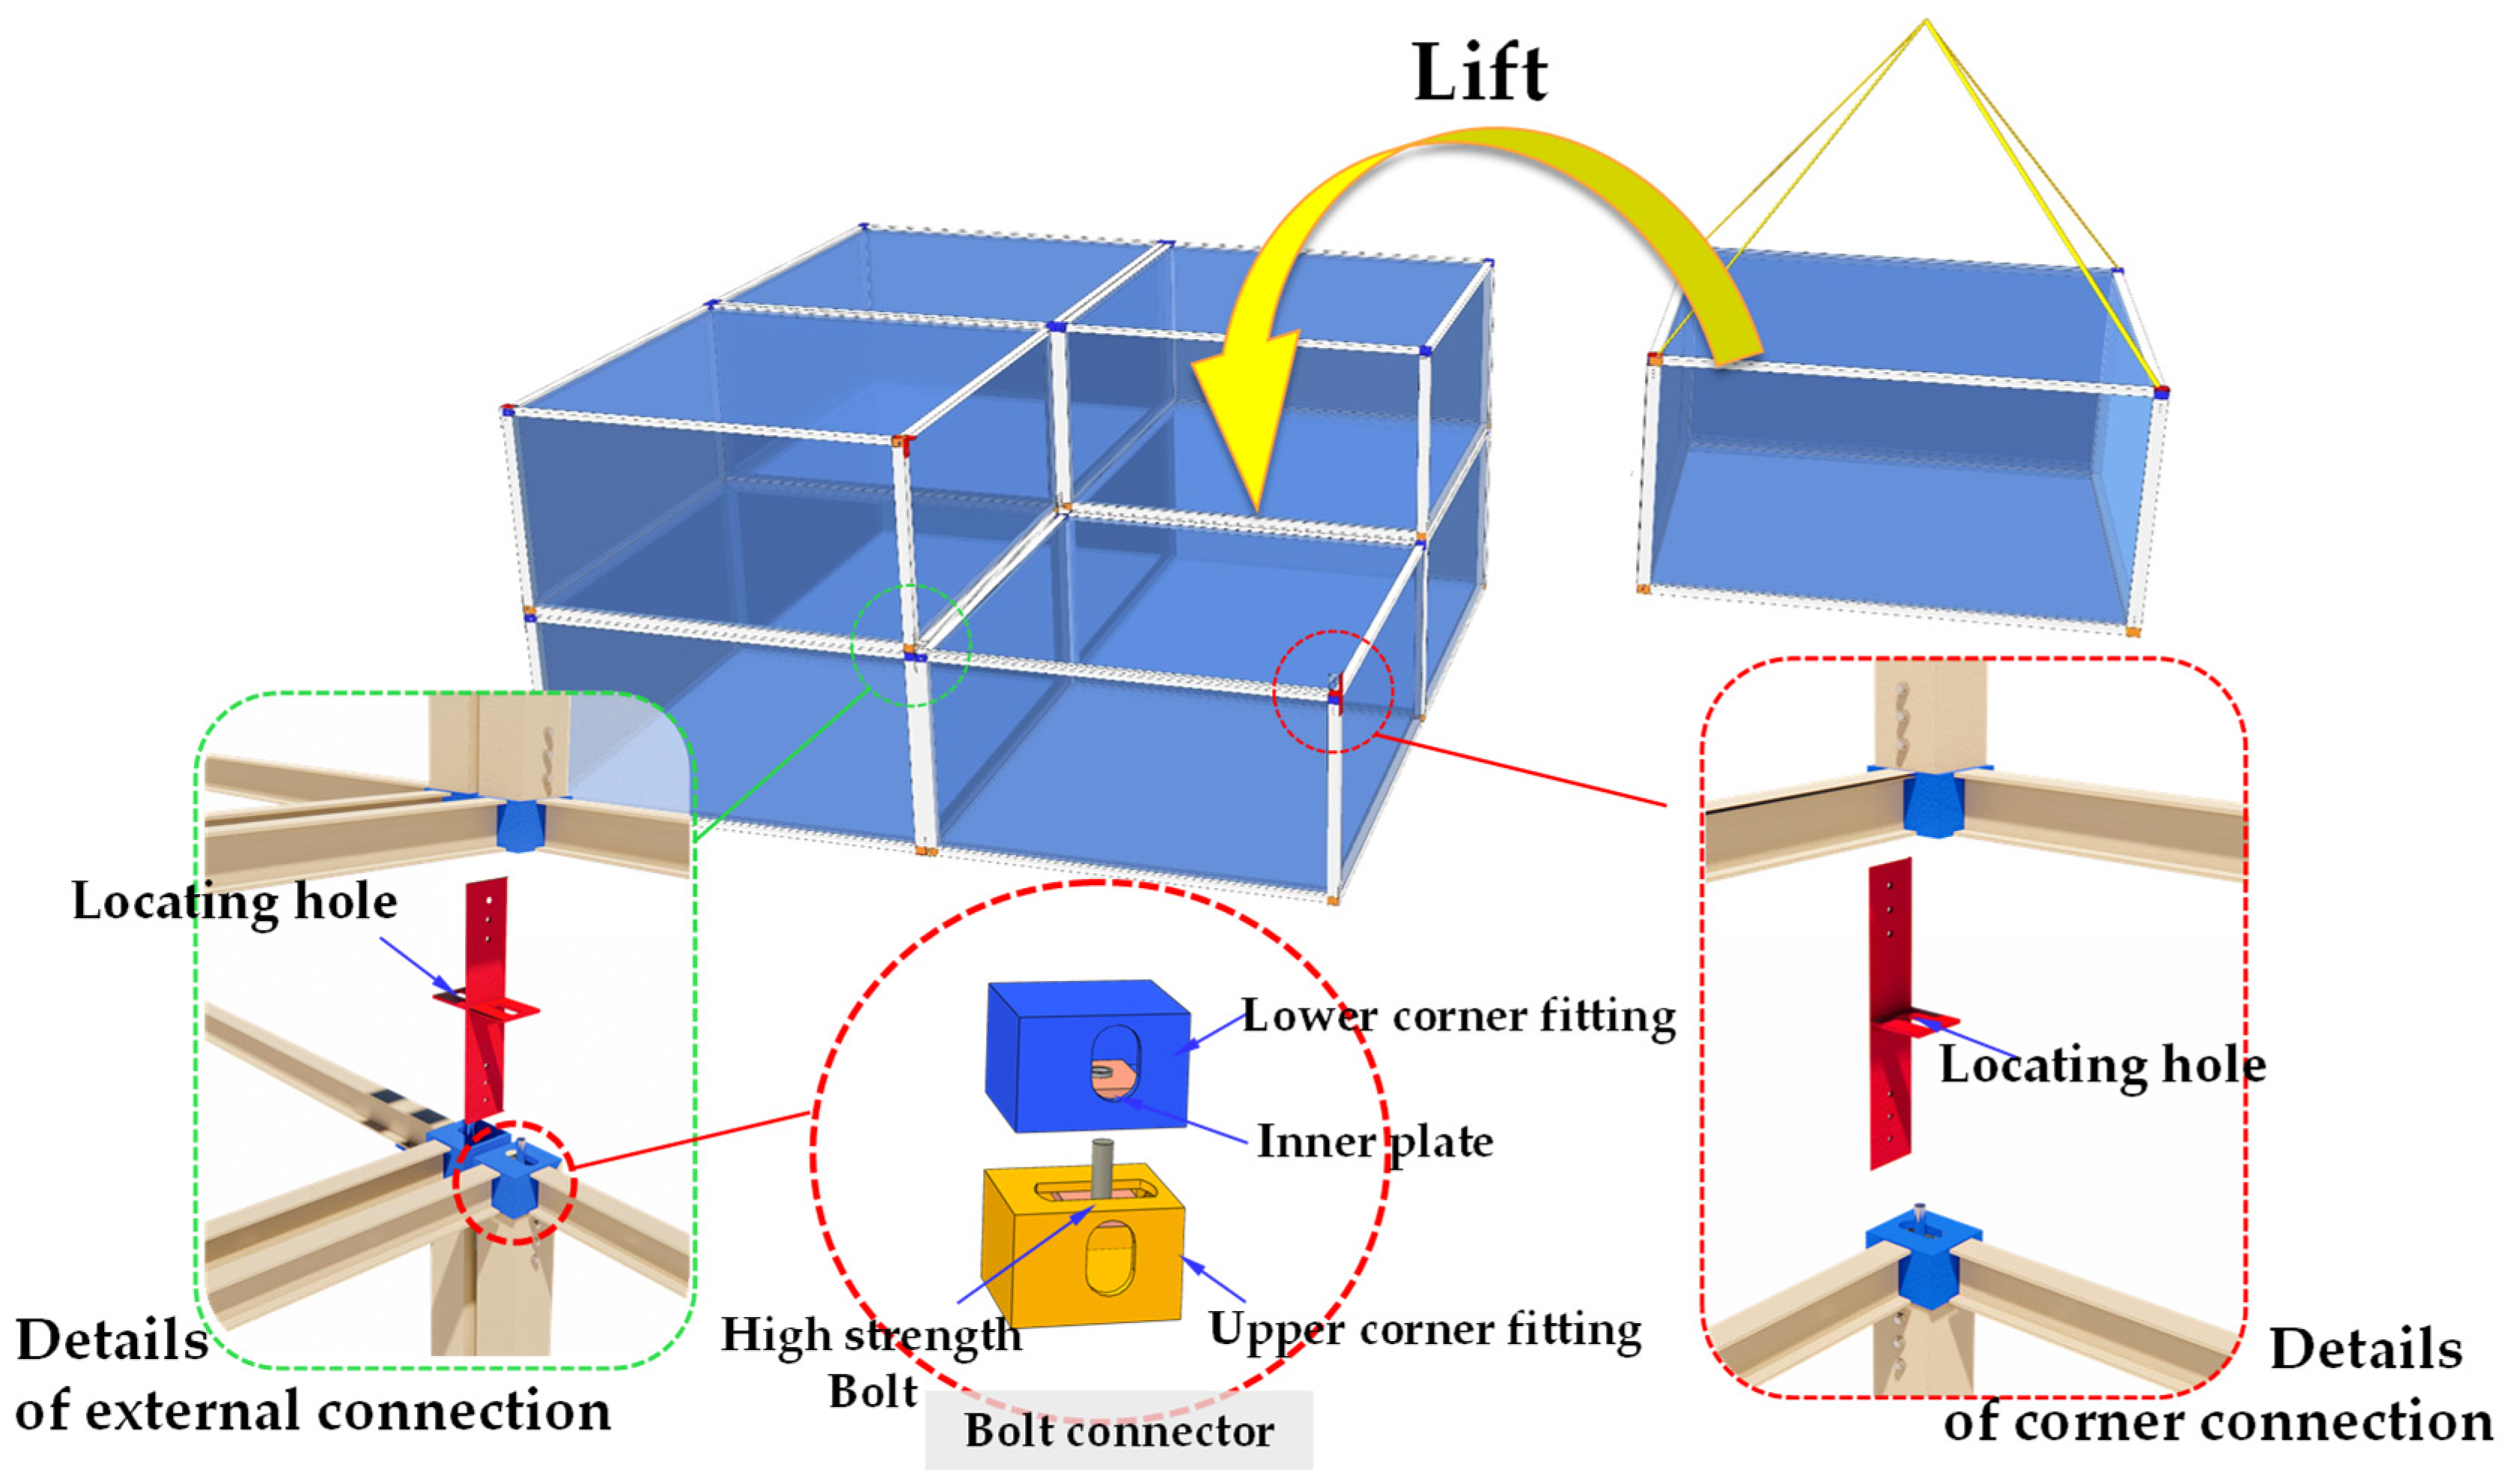
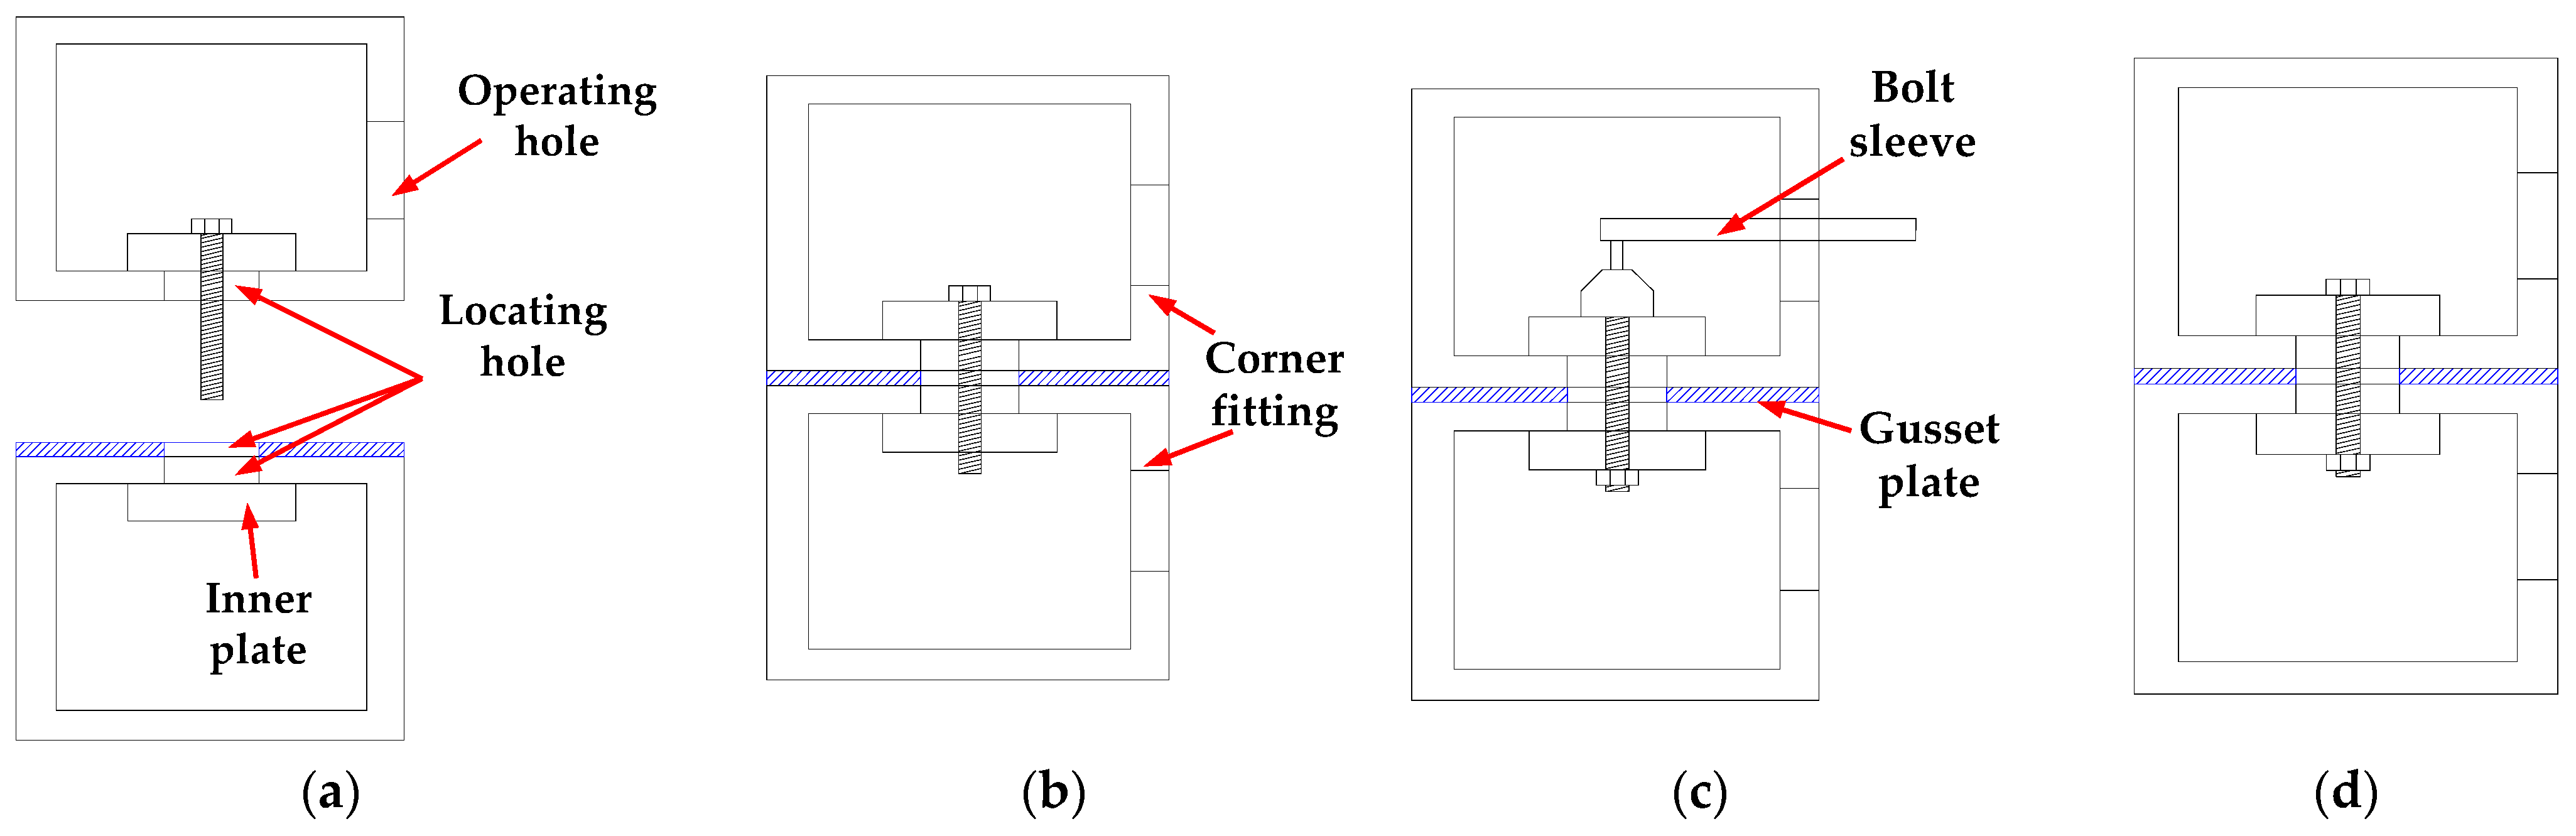
2. Conceiving of the Fully Prefabricated Liftable Connection
3. Experimental Program
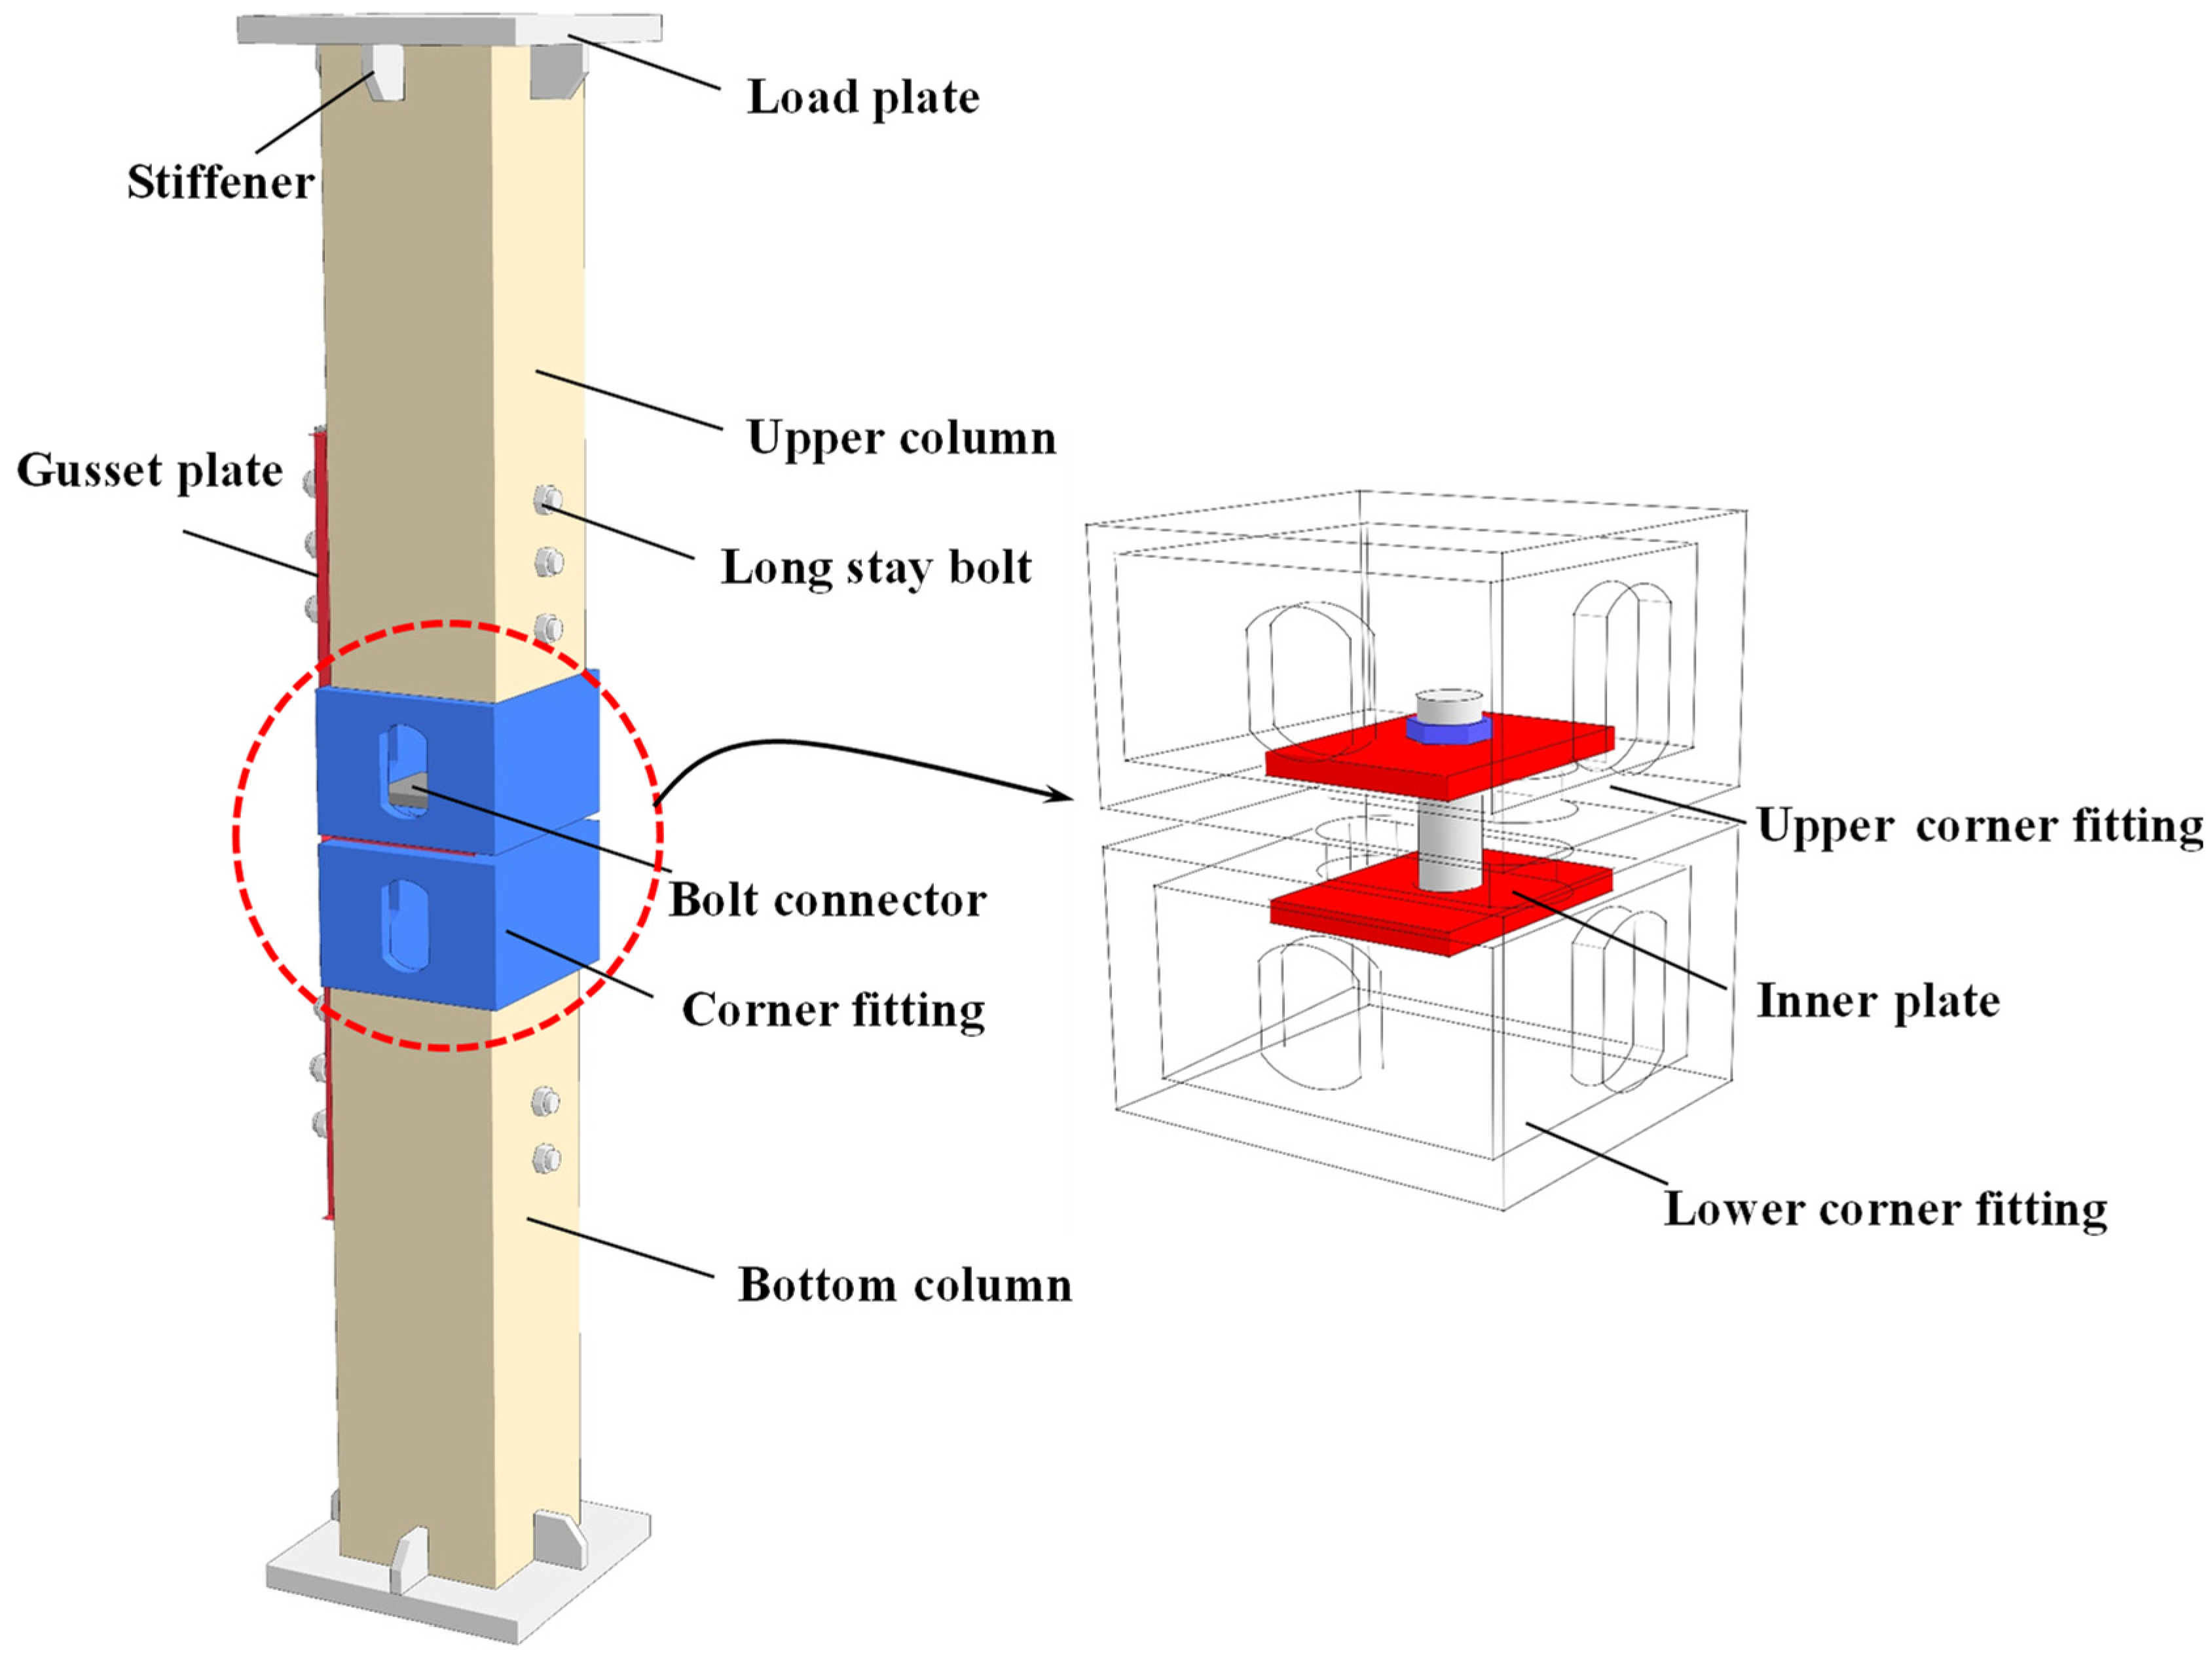
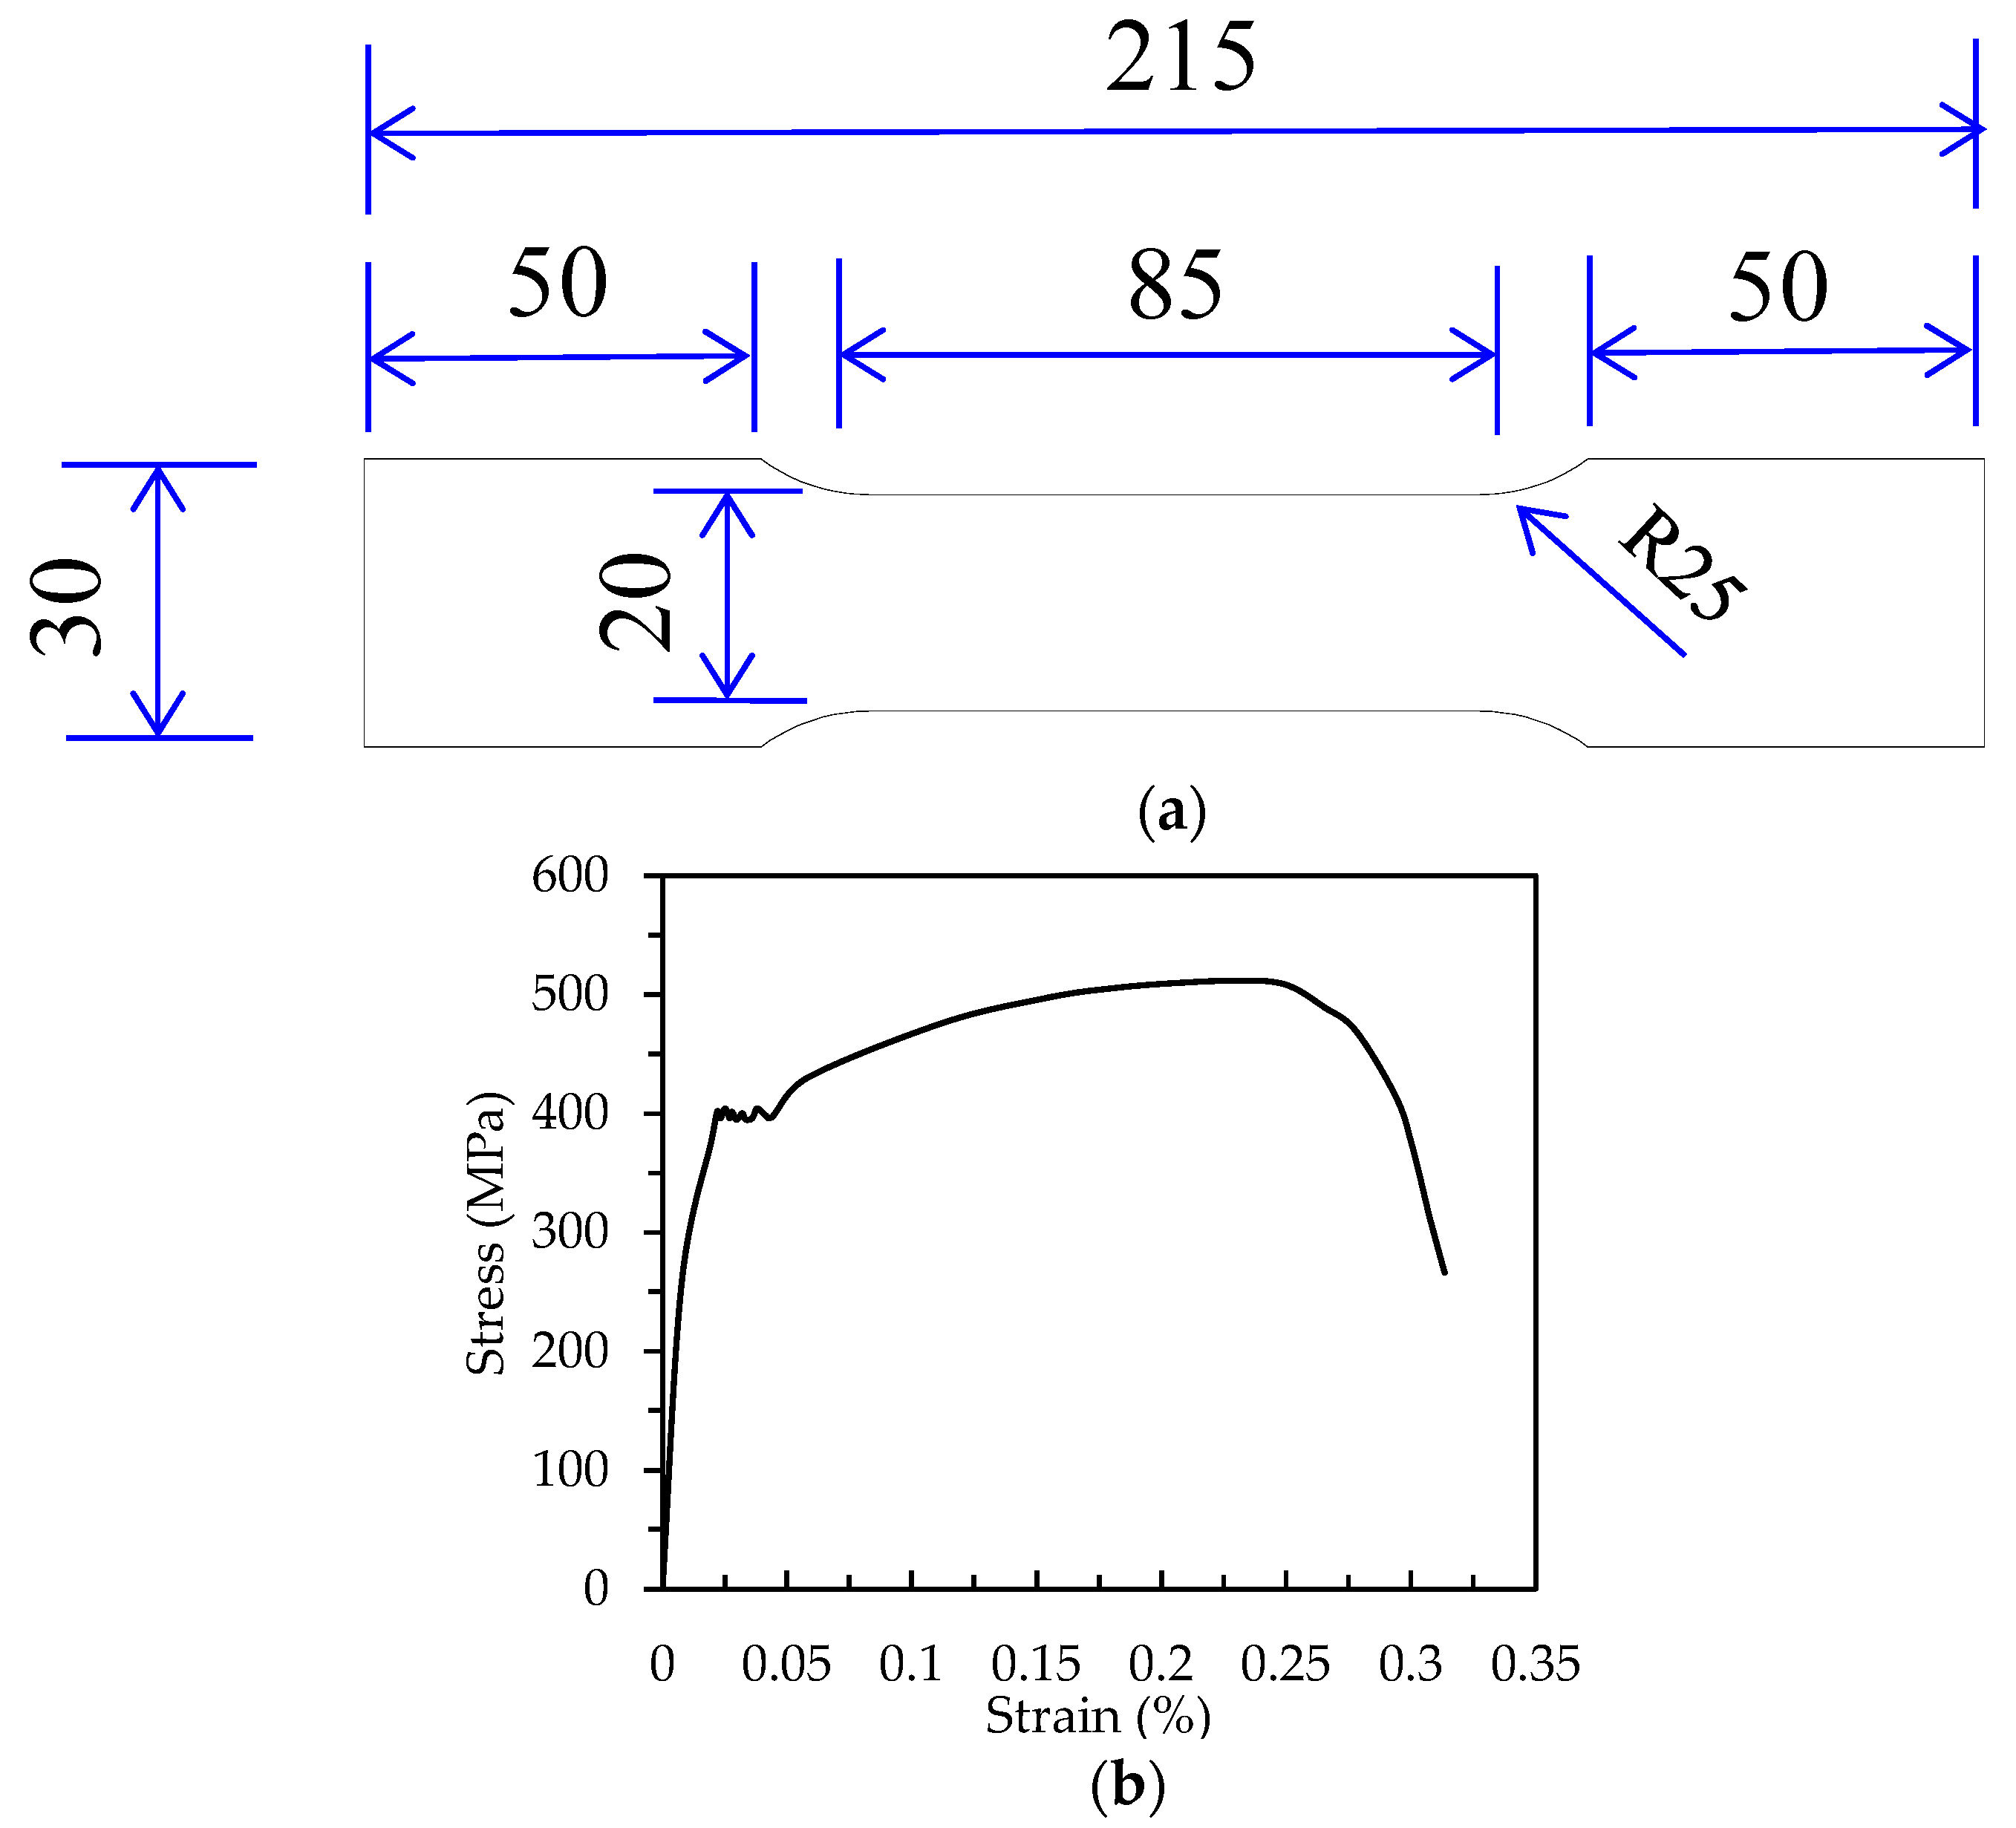
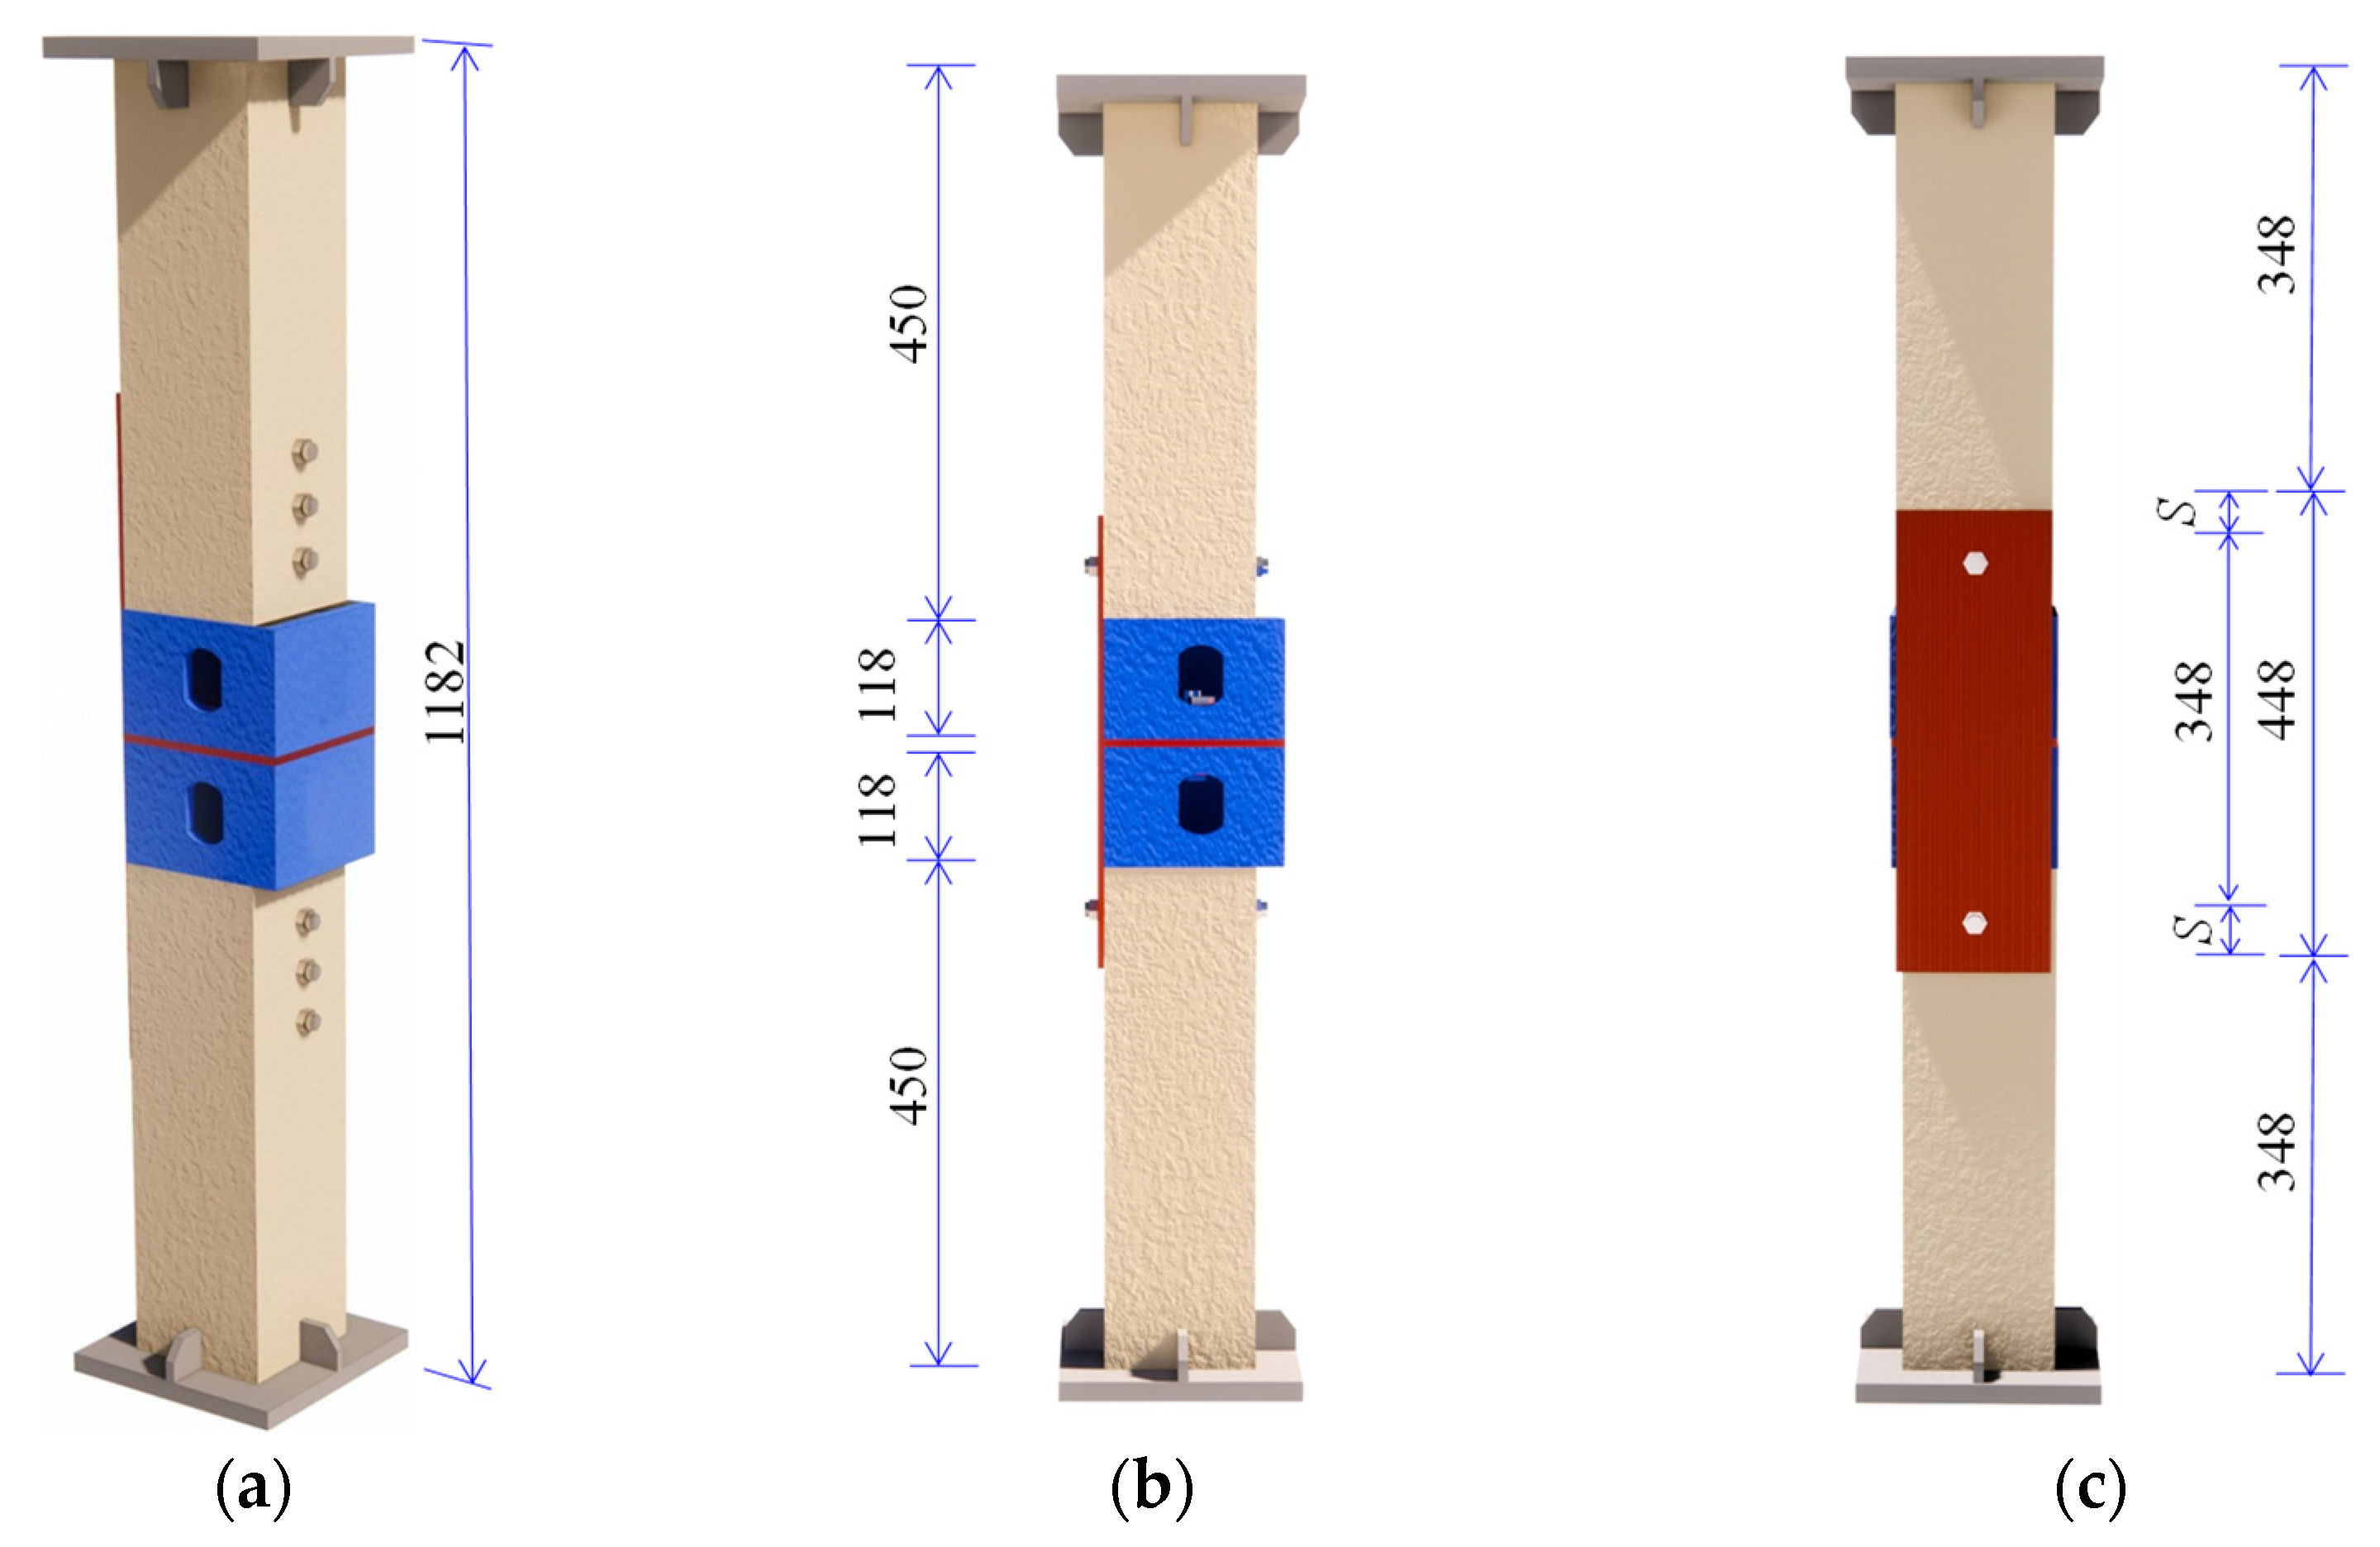
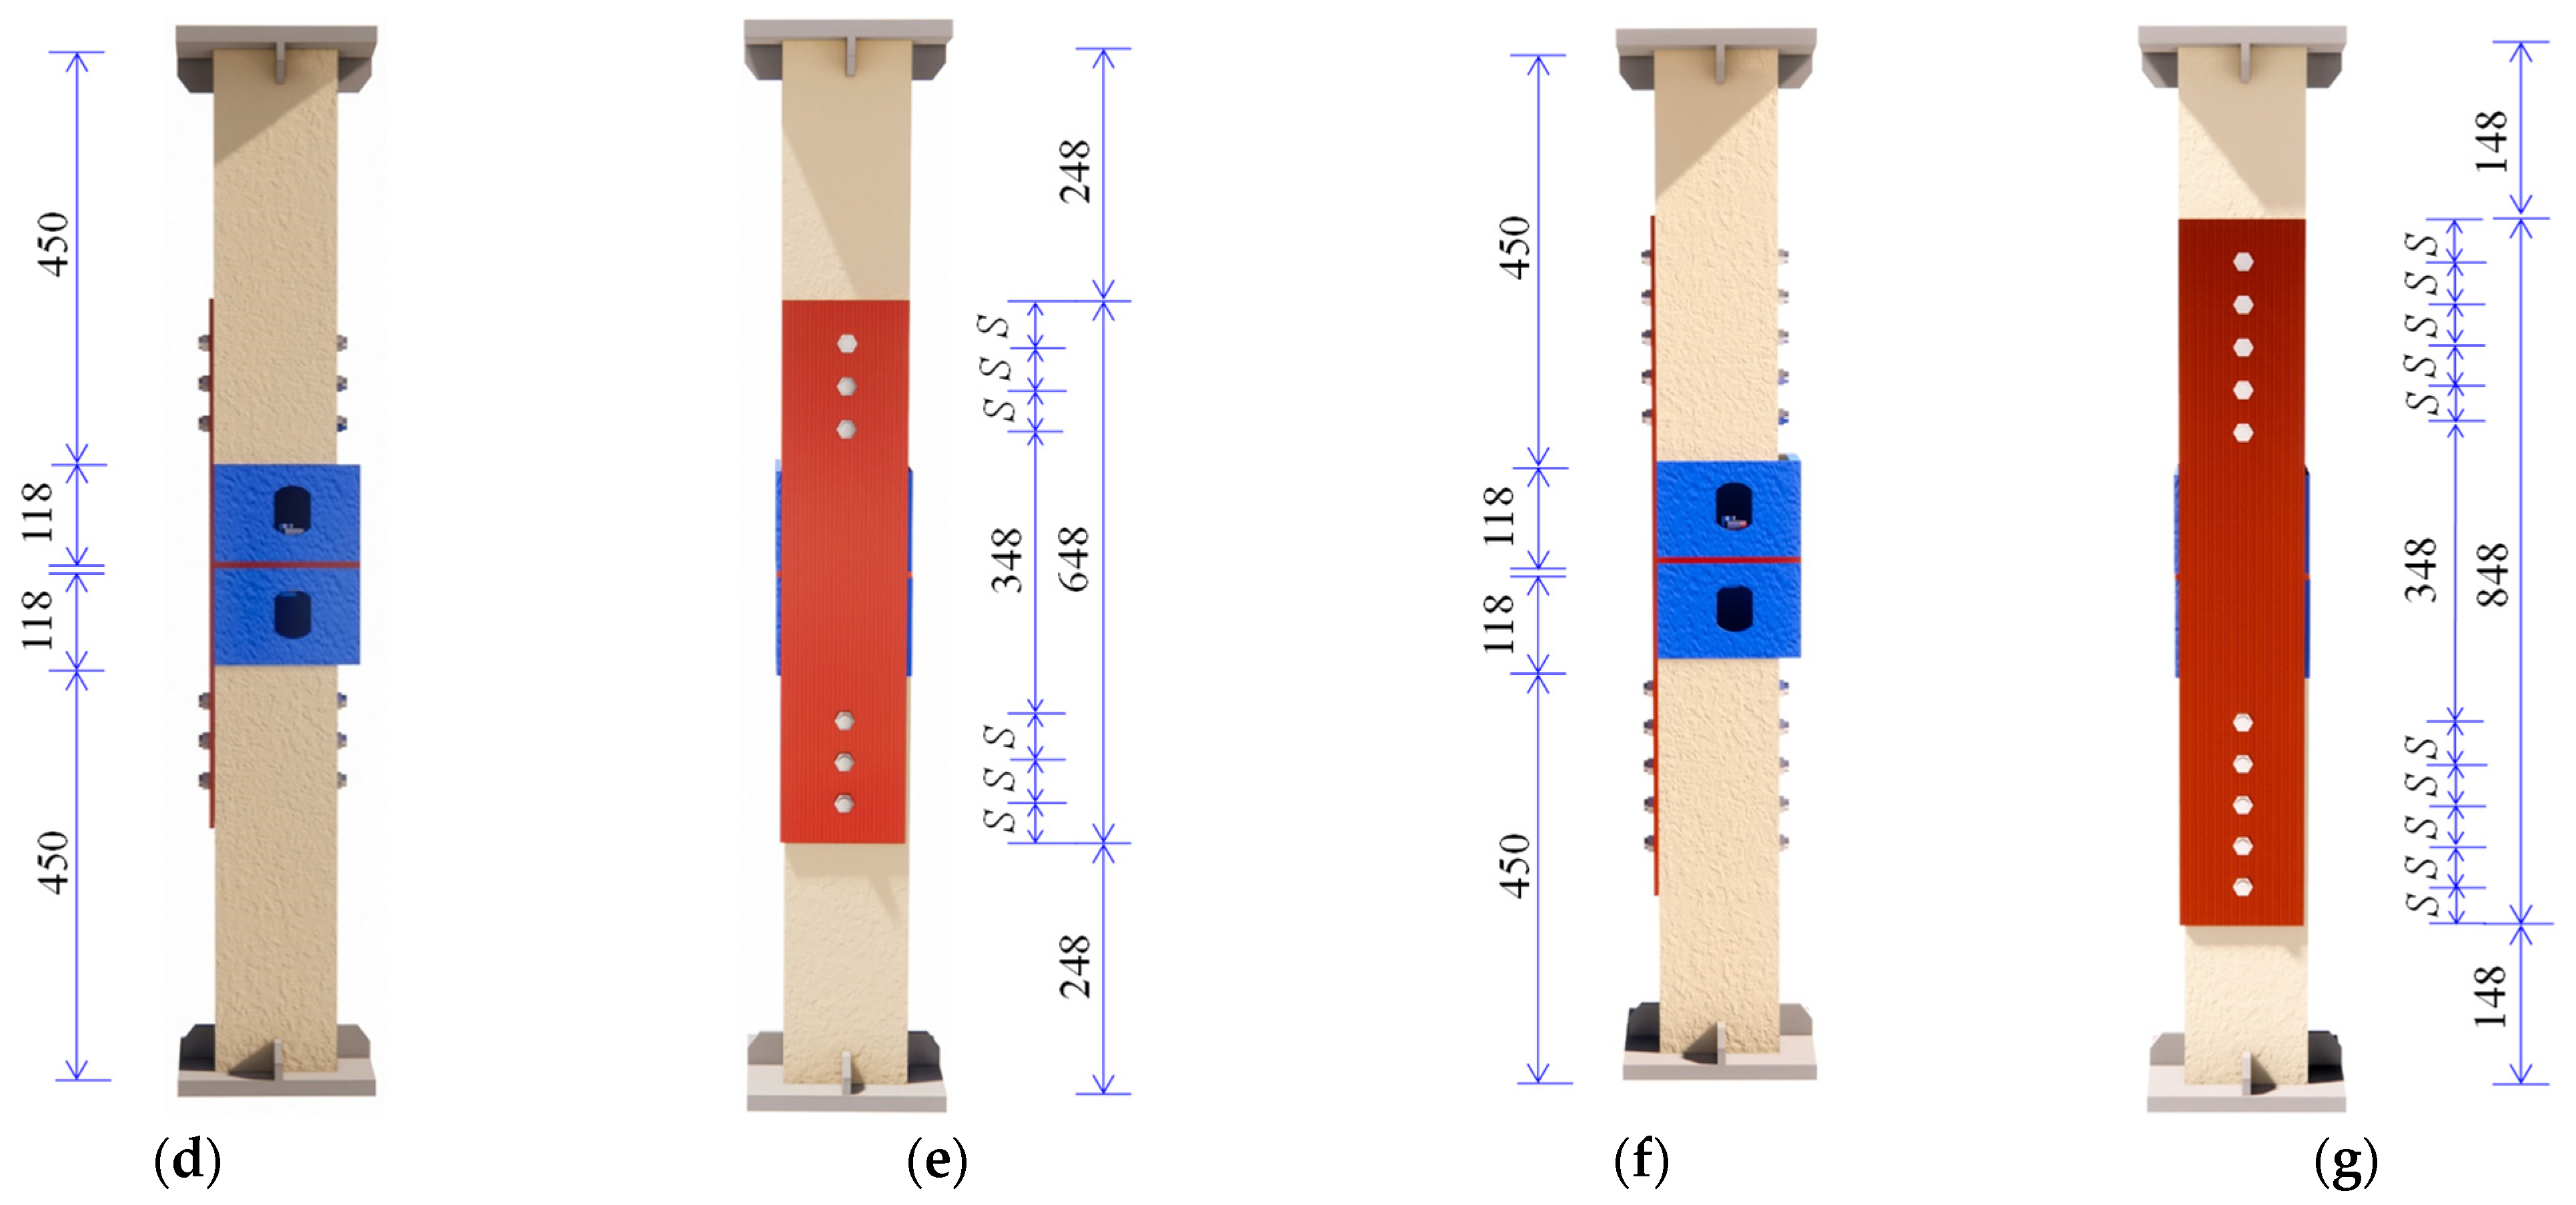
3.1. Specimen Design
3.2. Test Setup and Loading
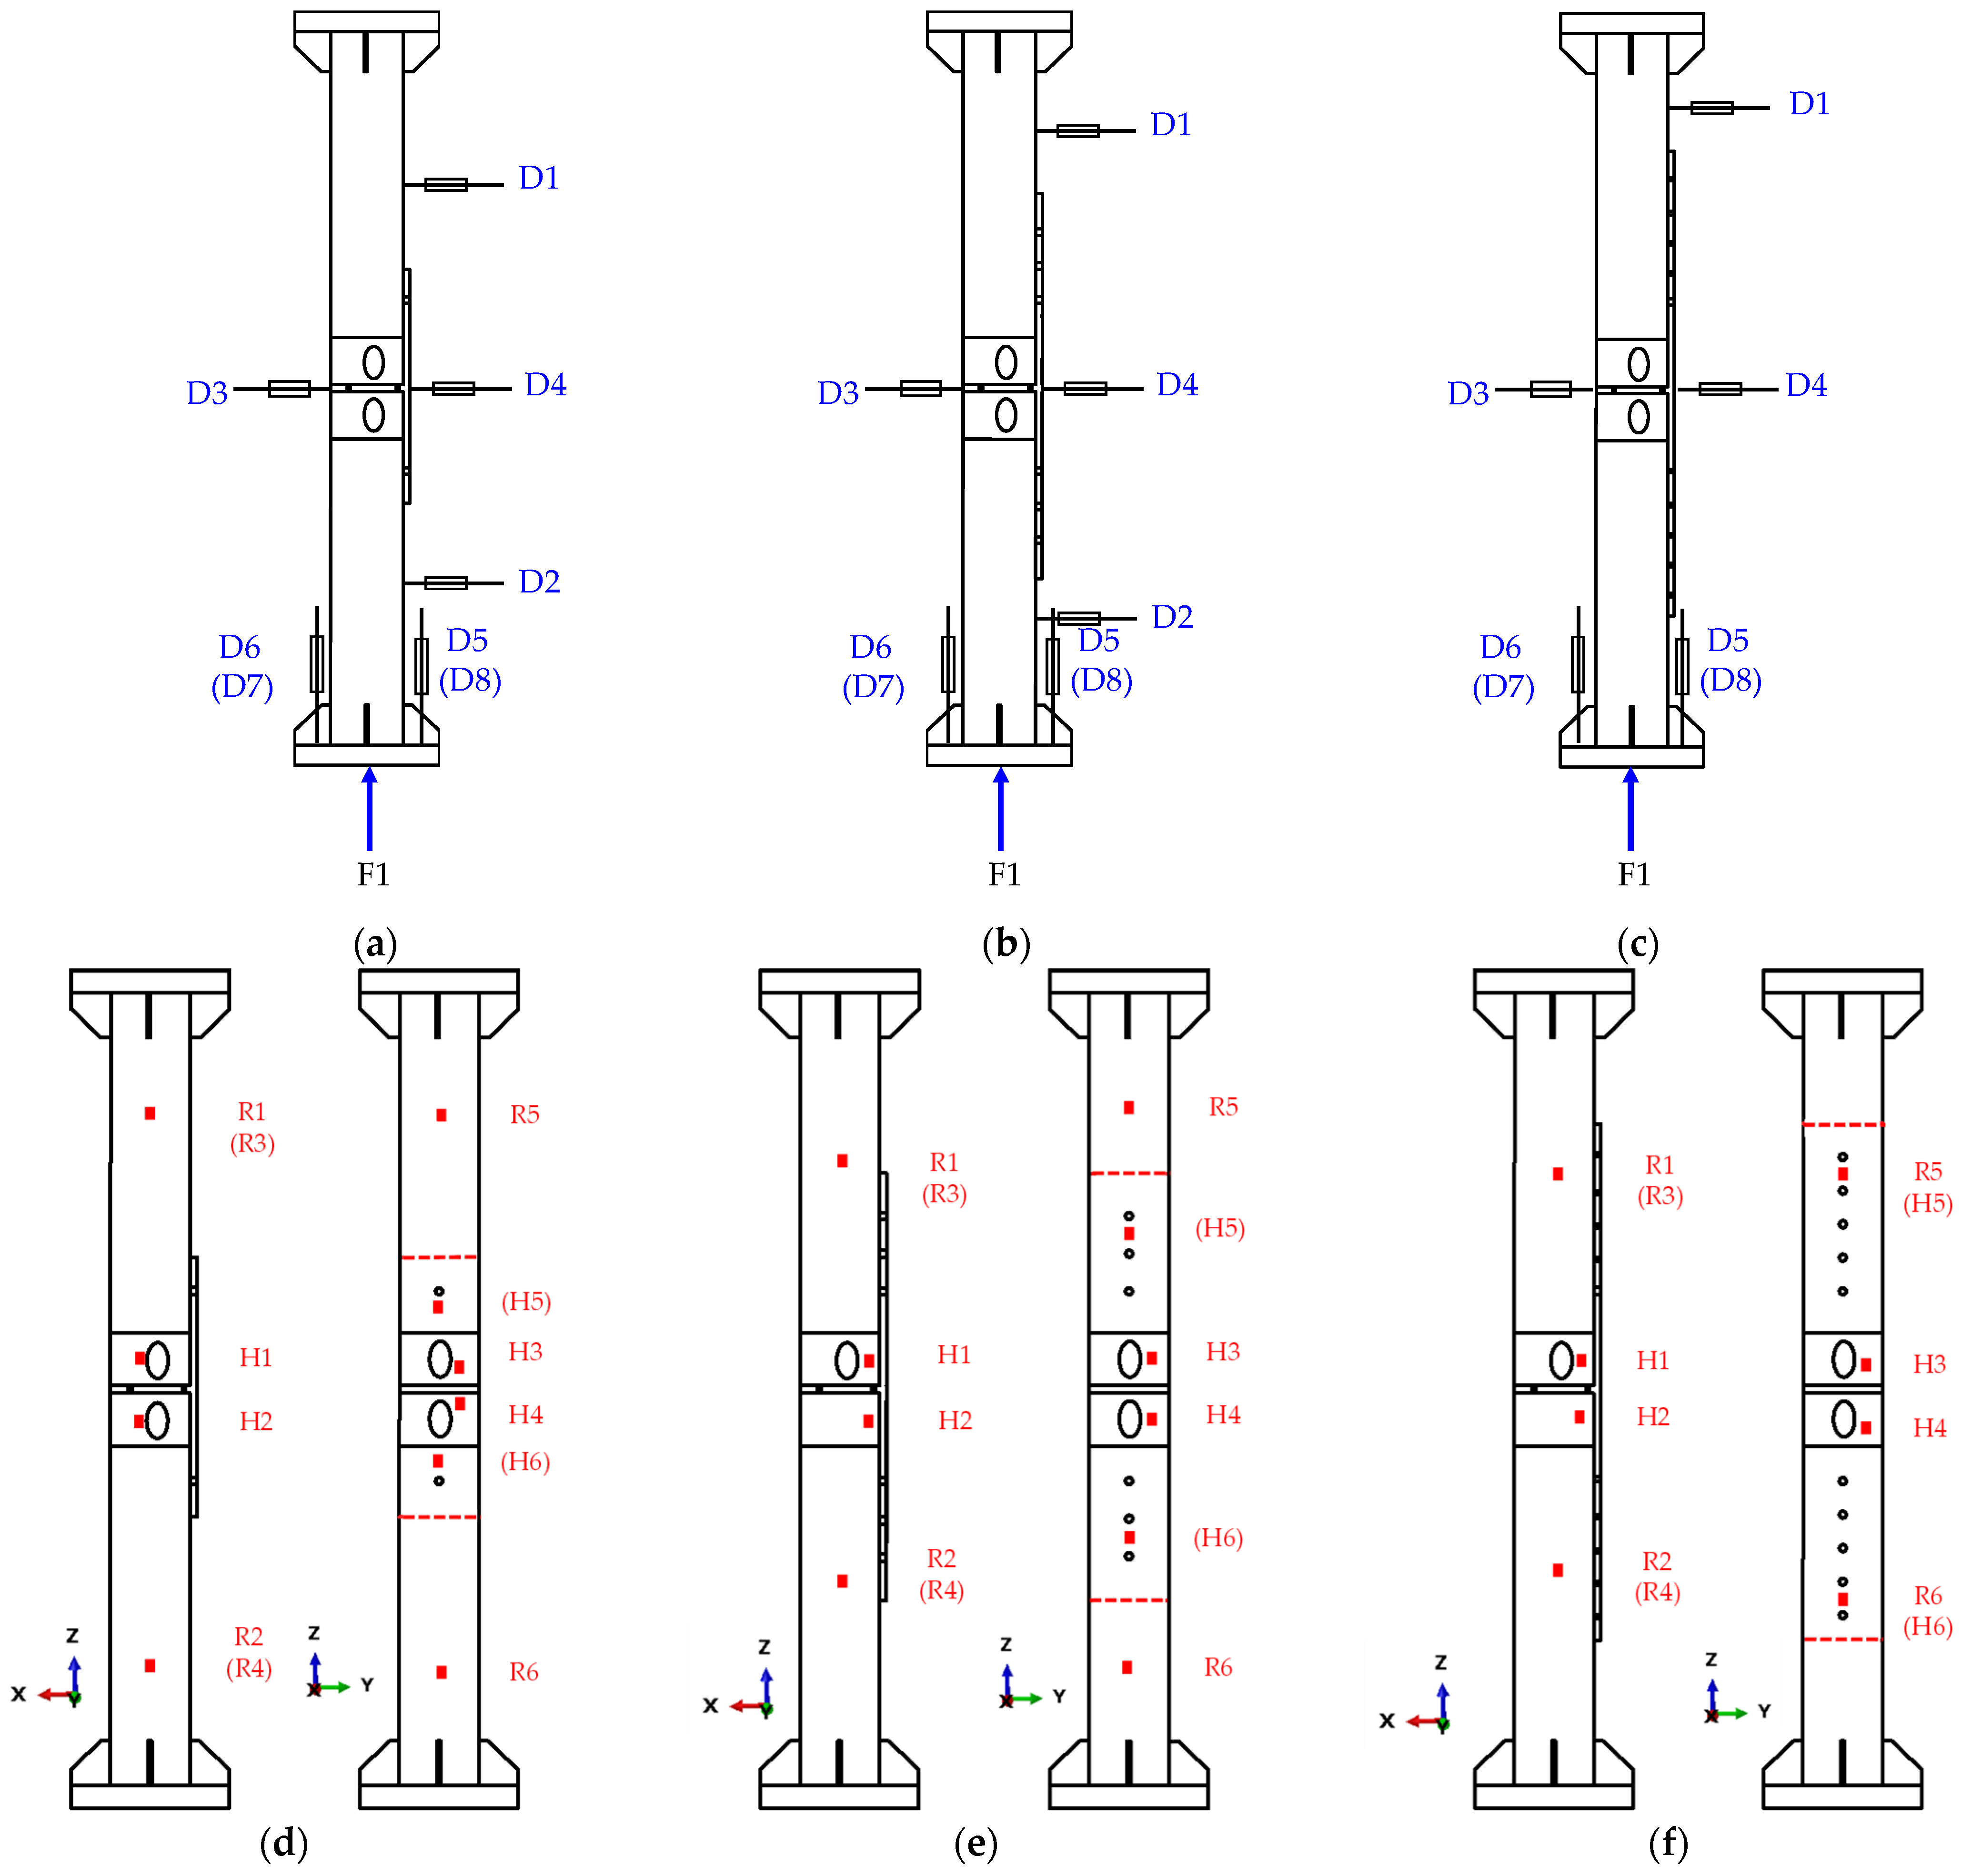
3.3. Layout of the Measuring Points
4. Experiment Results and Analysis
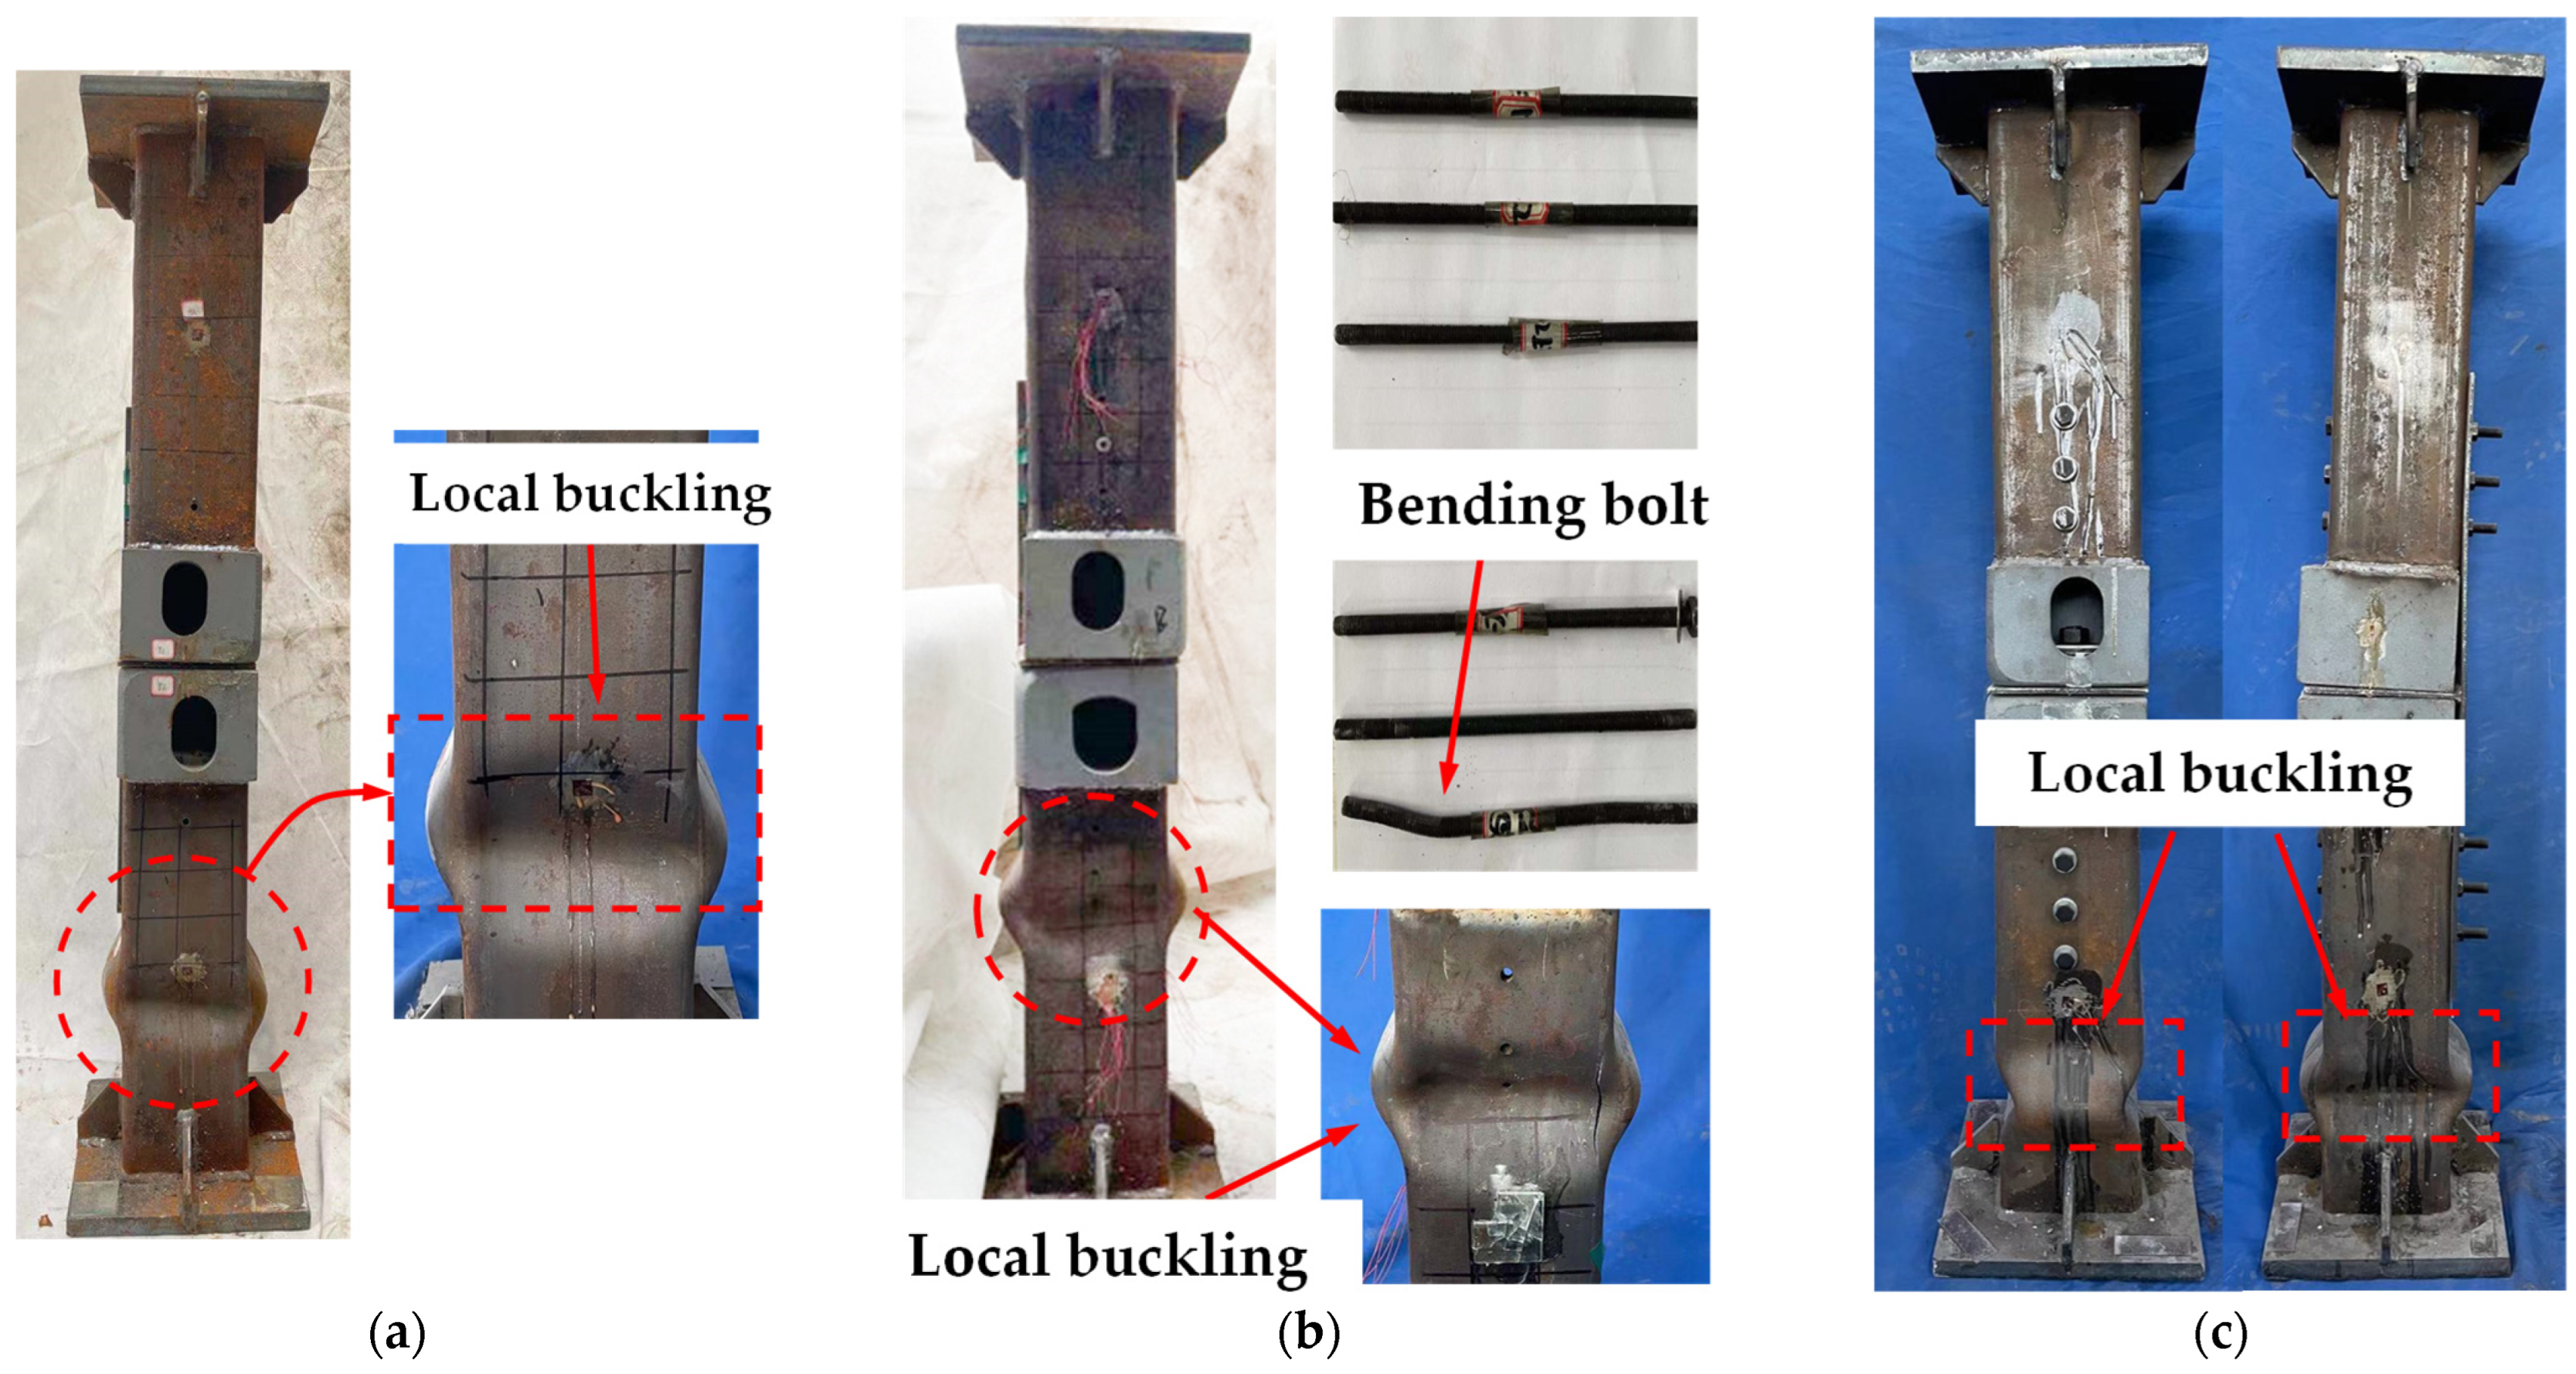
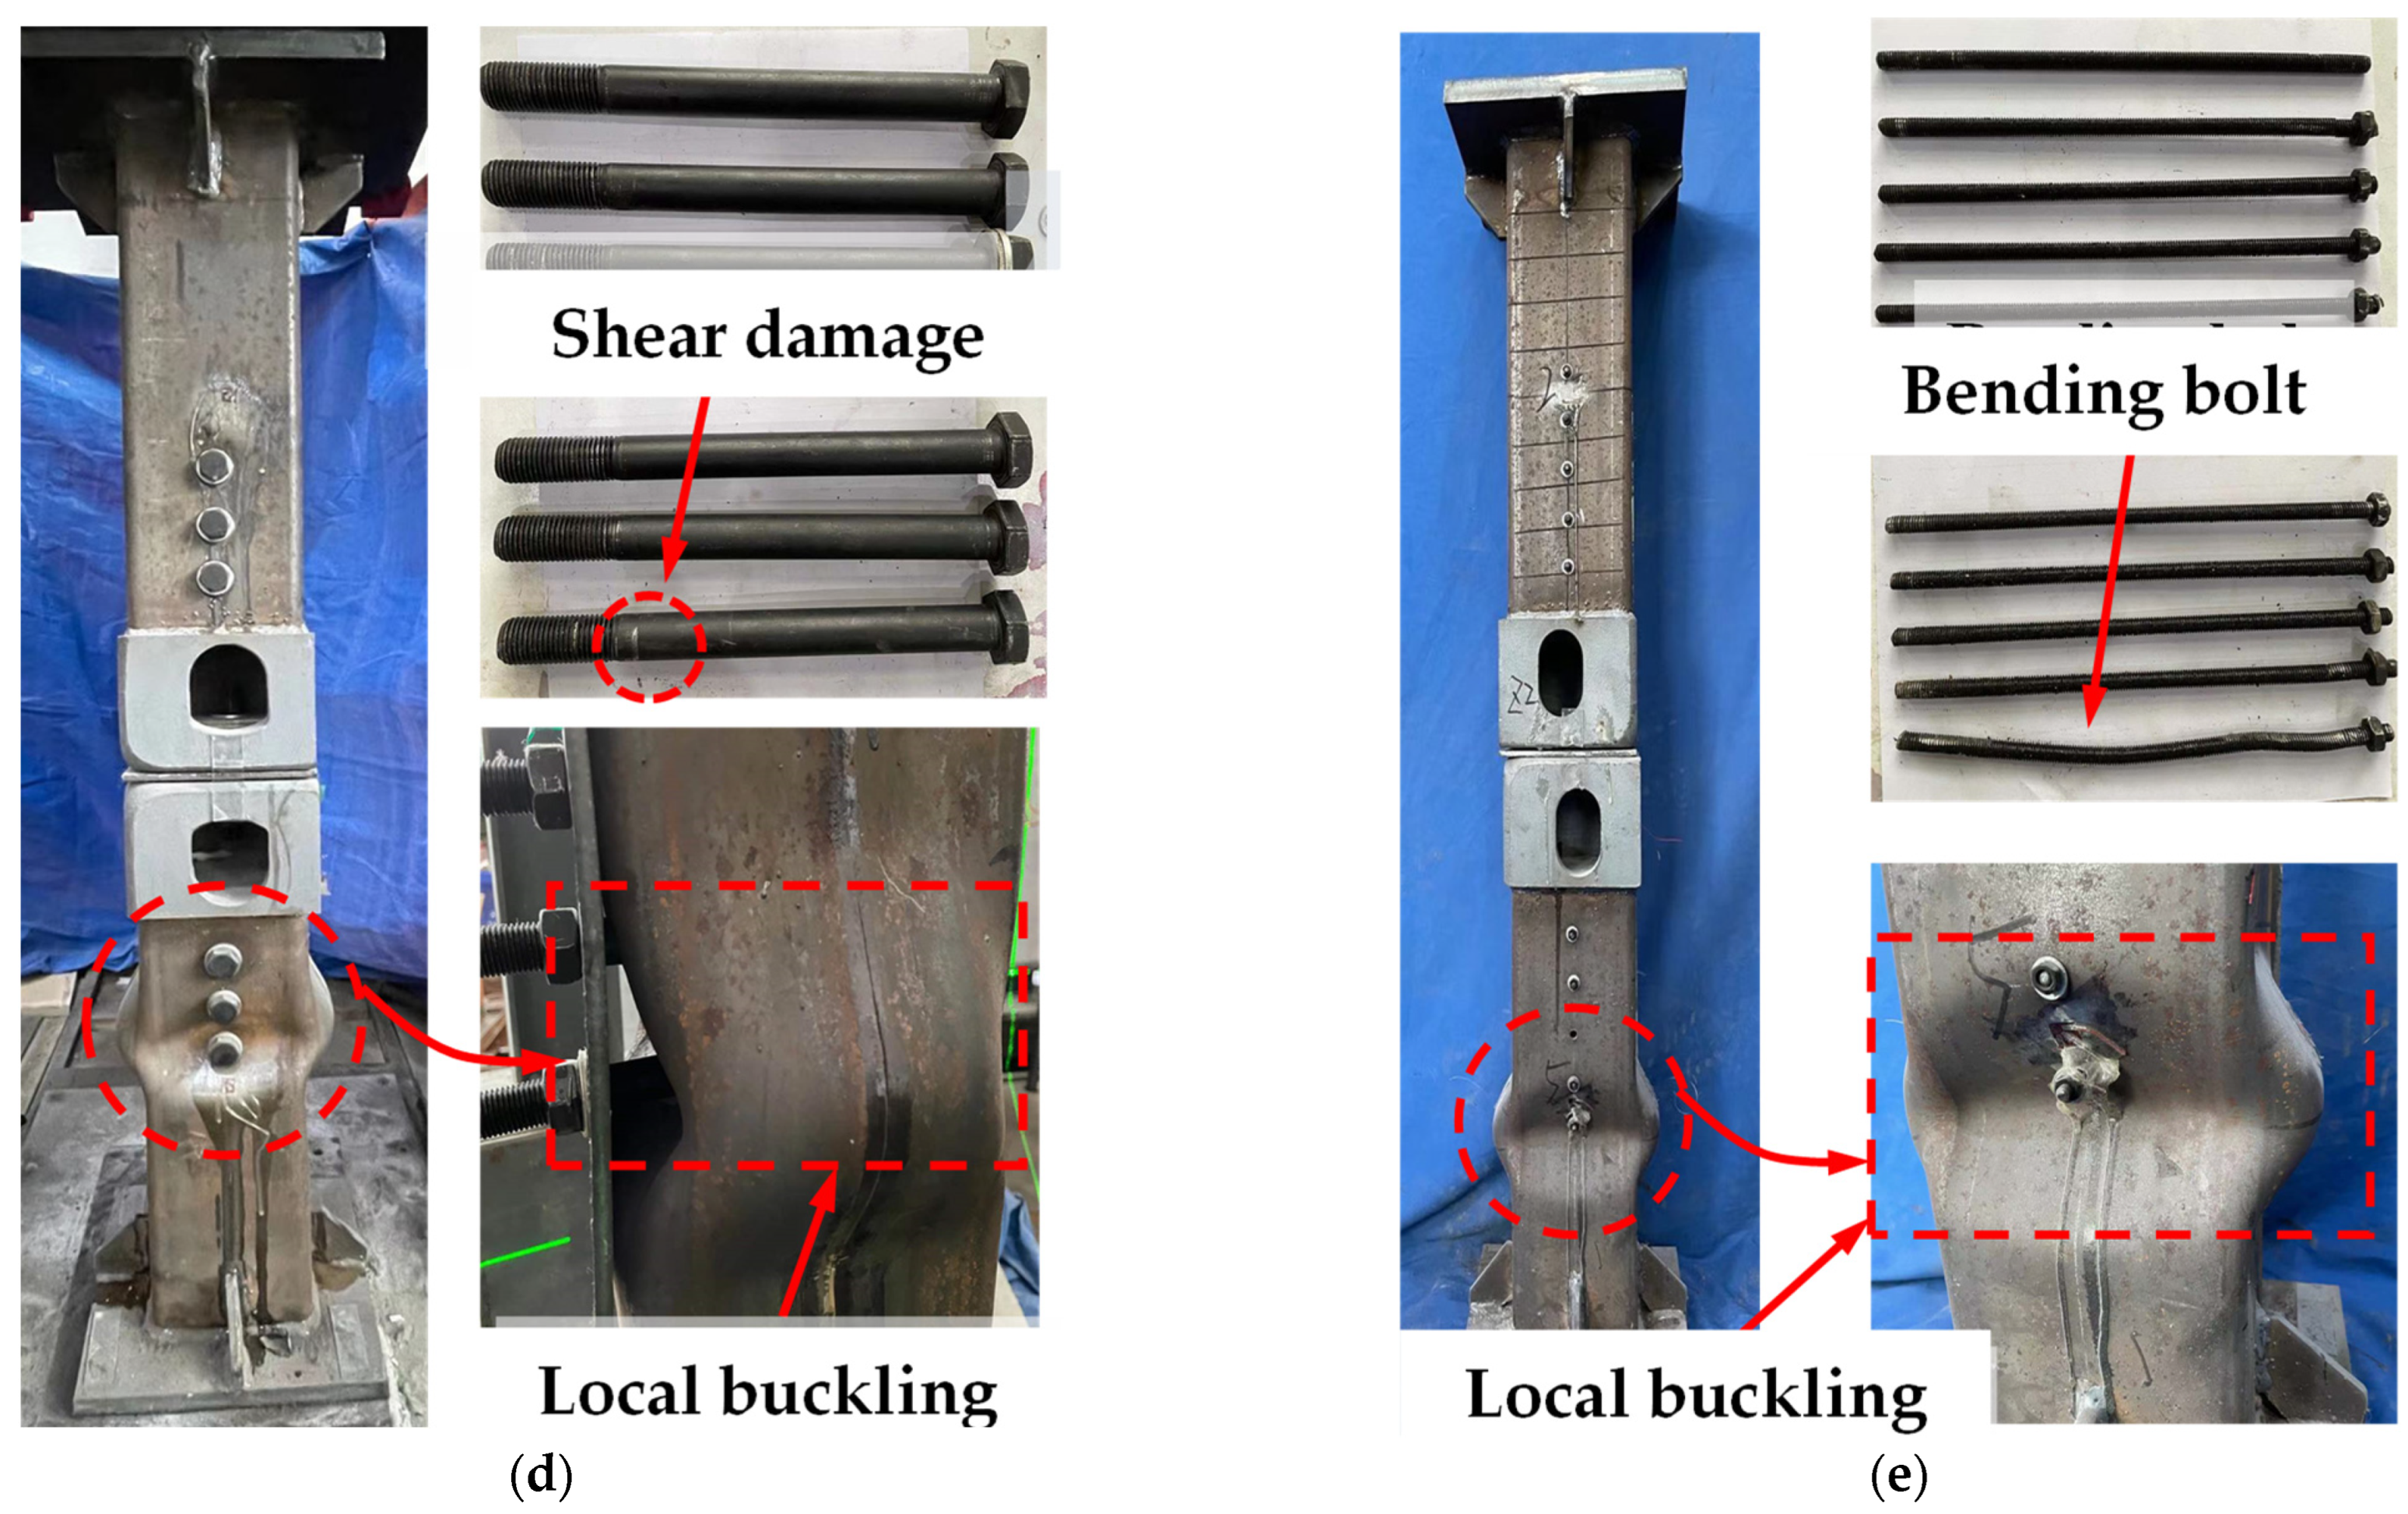
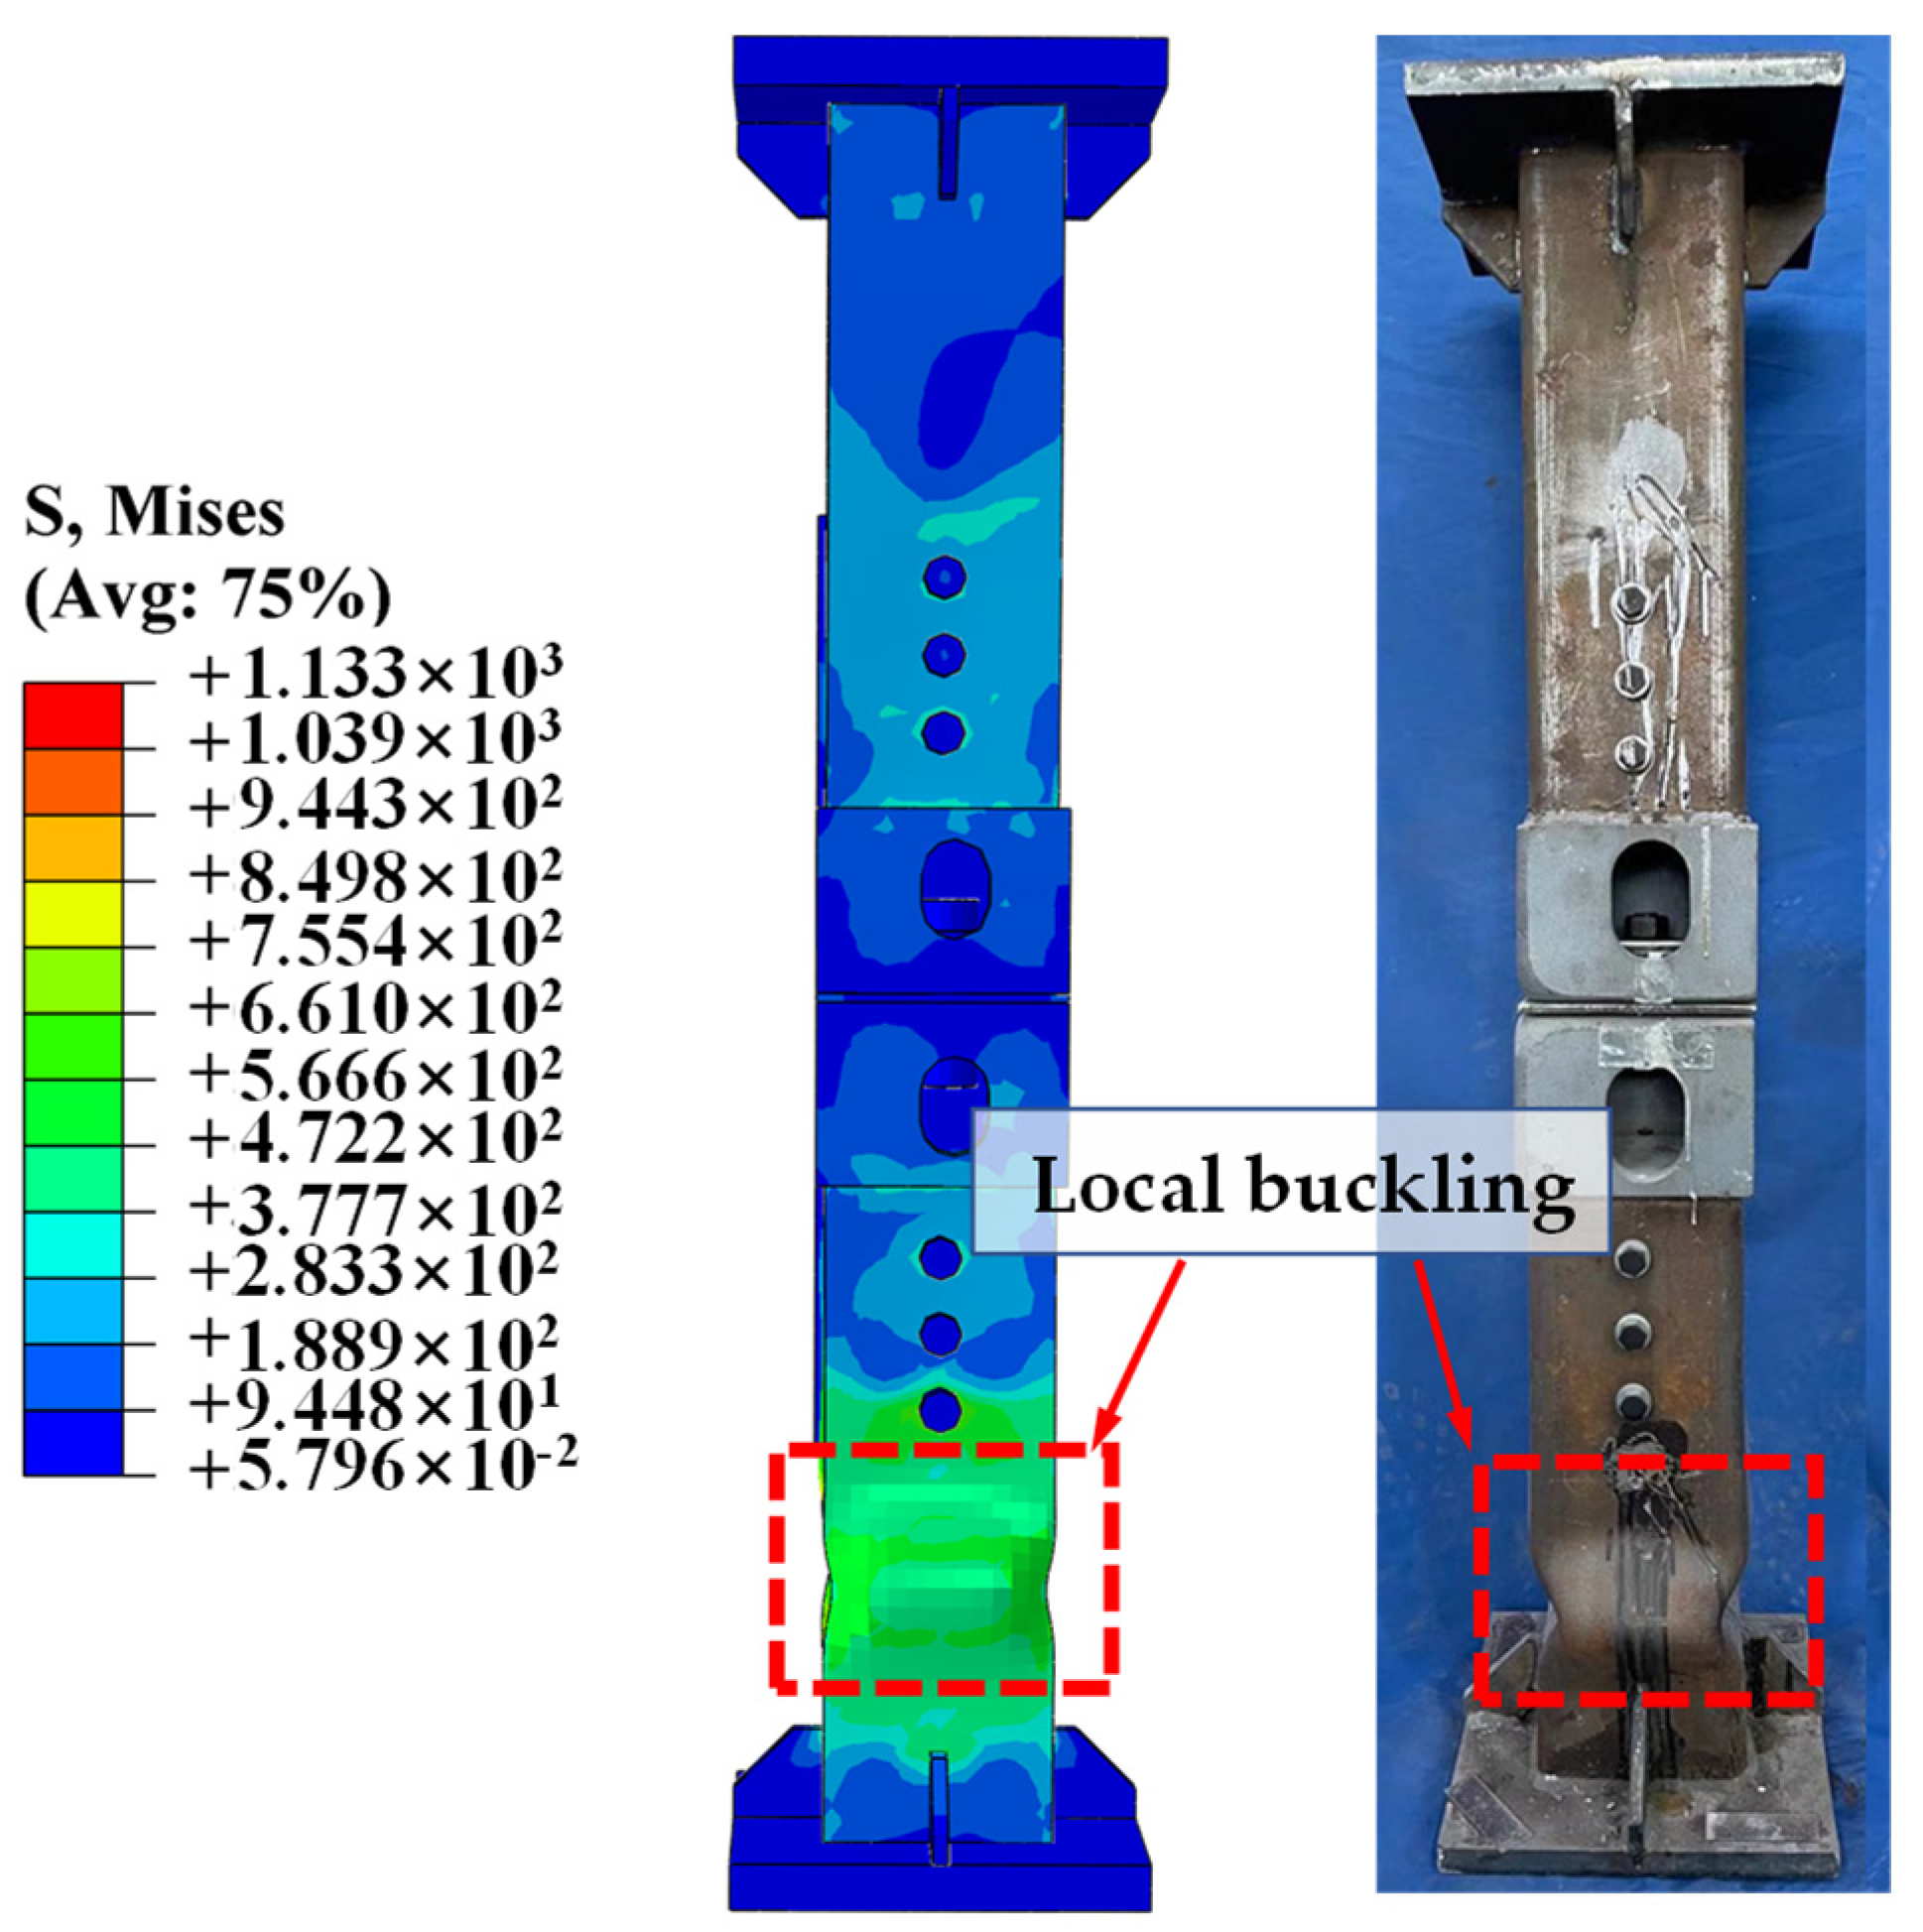
4.1. Failure Mode
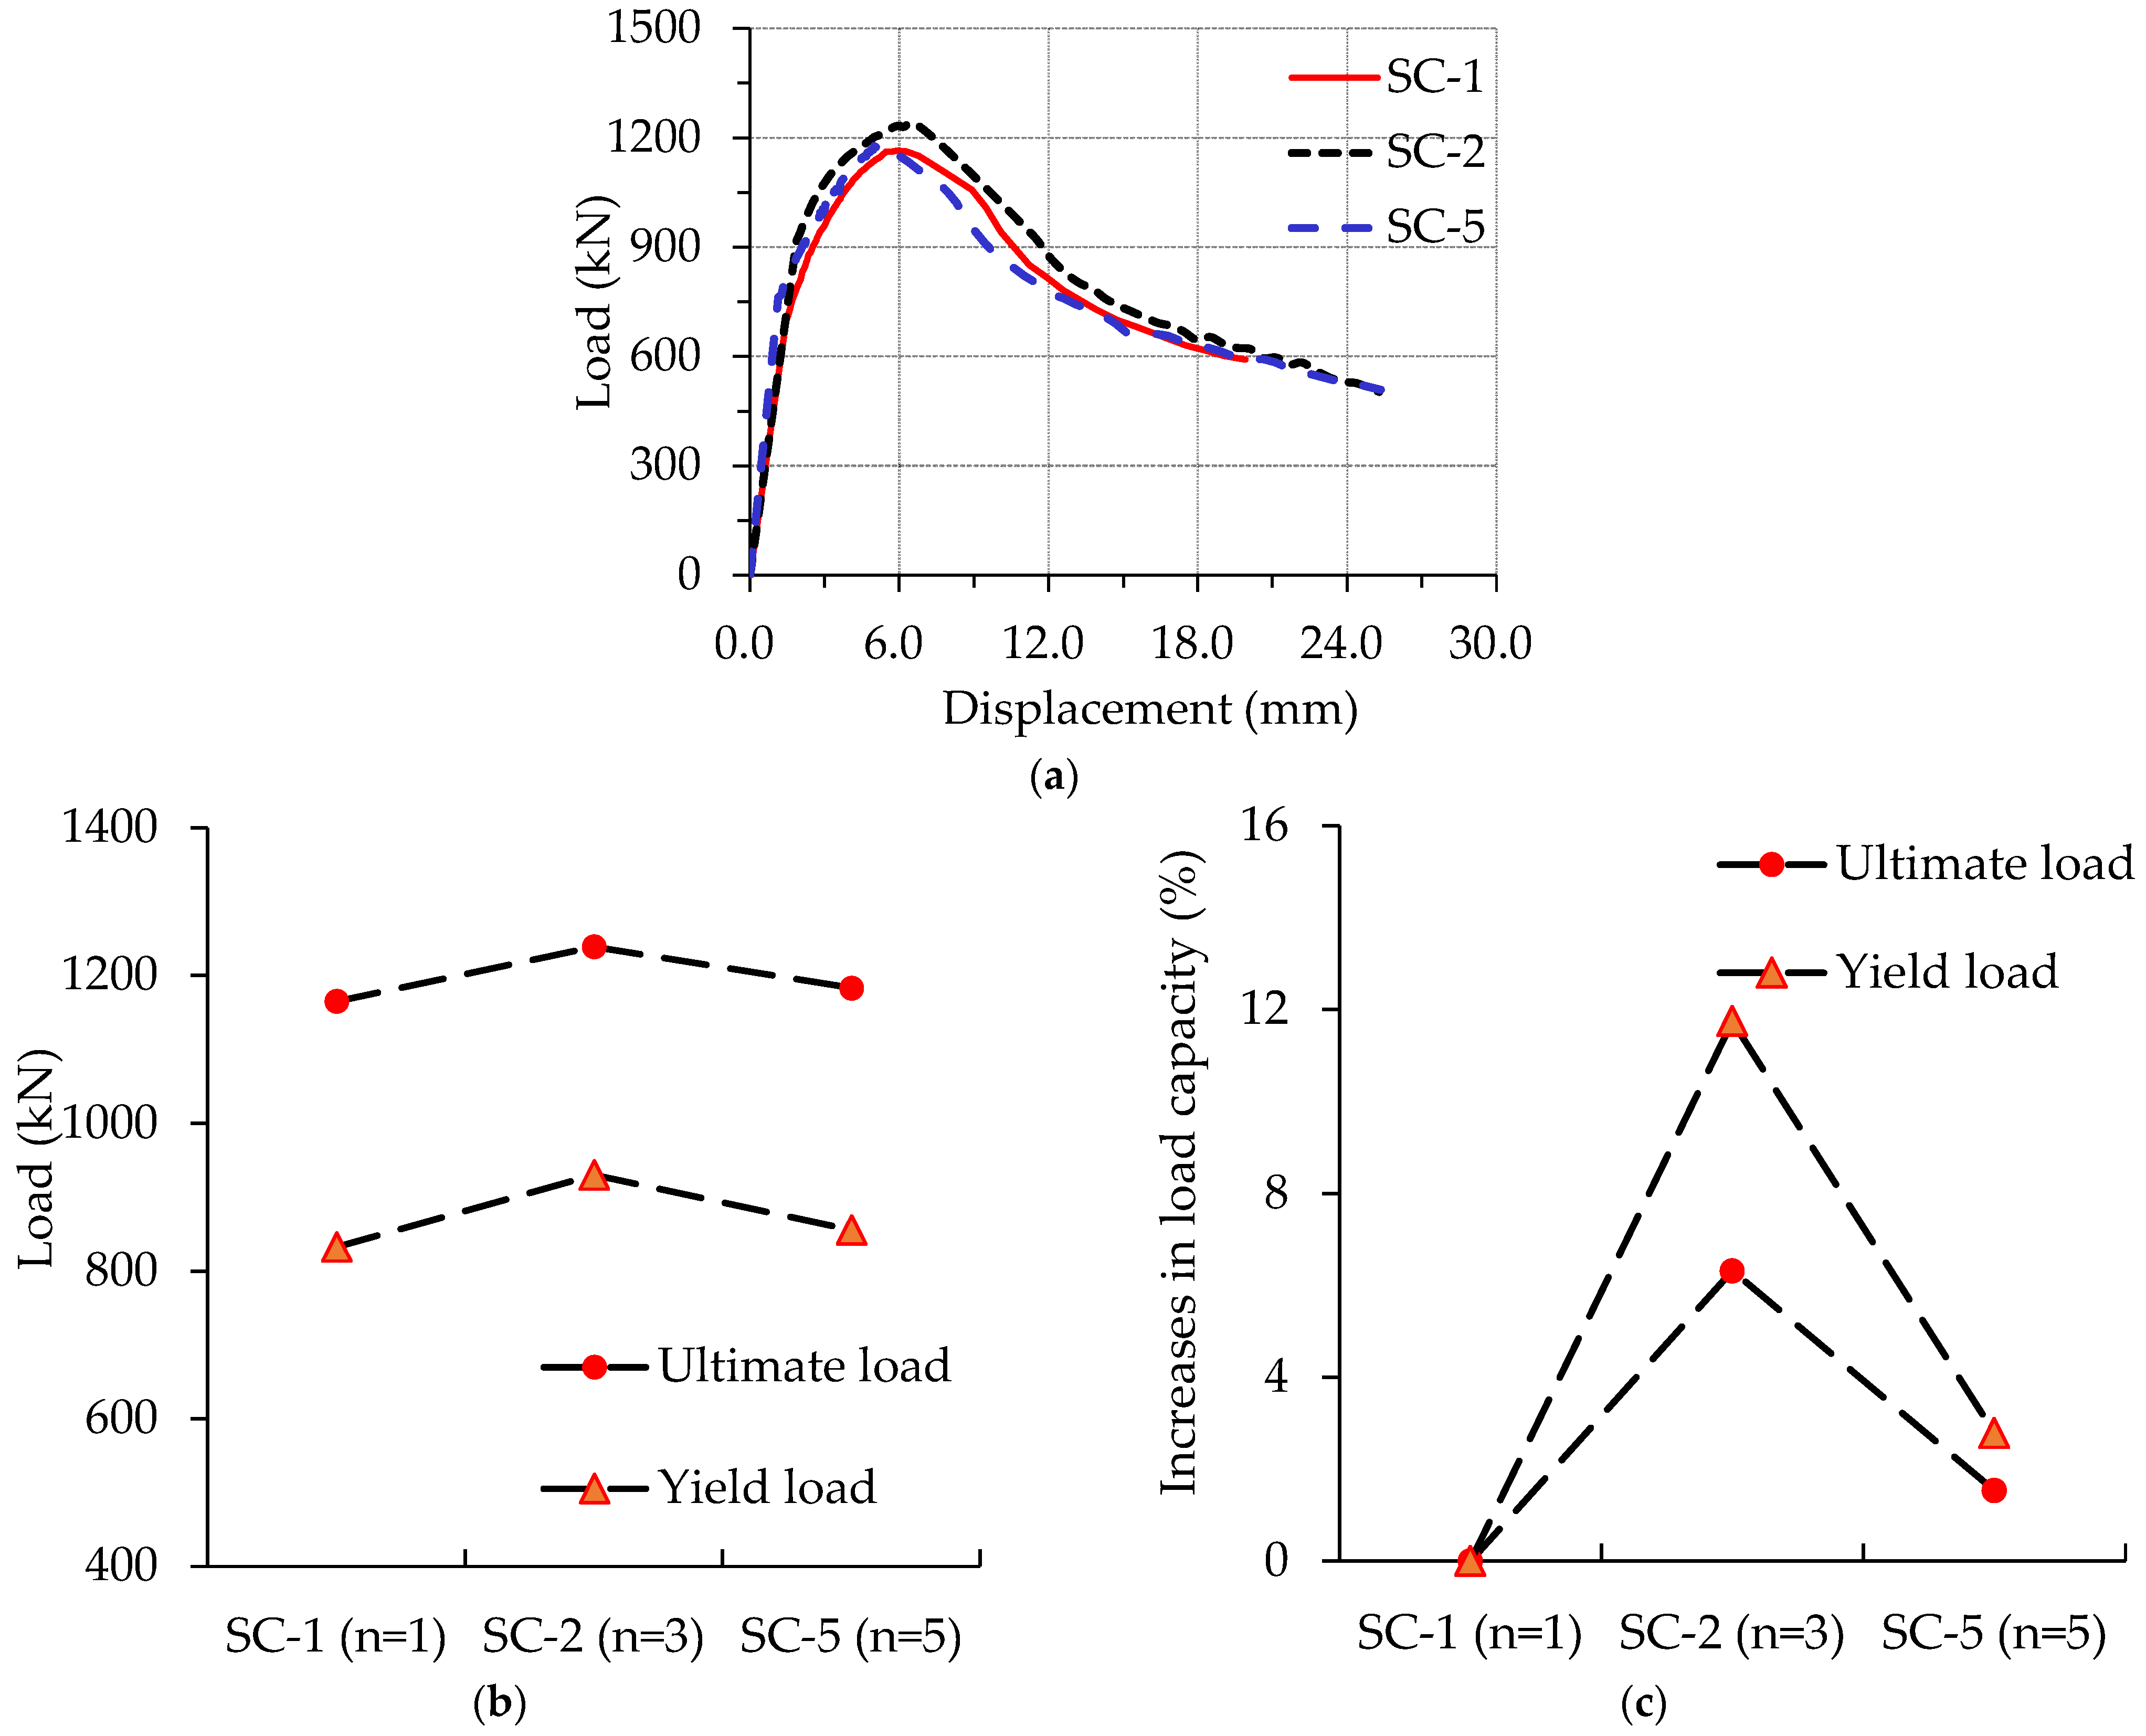
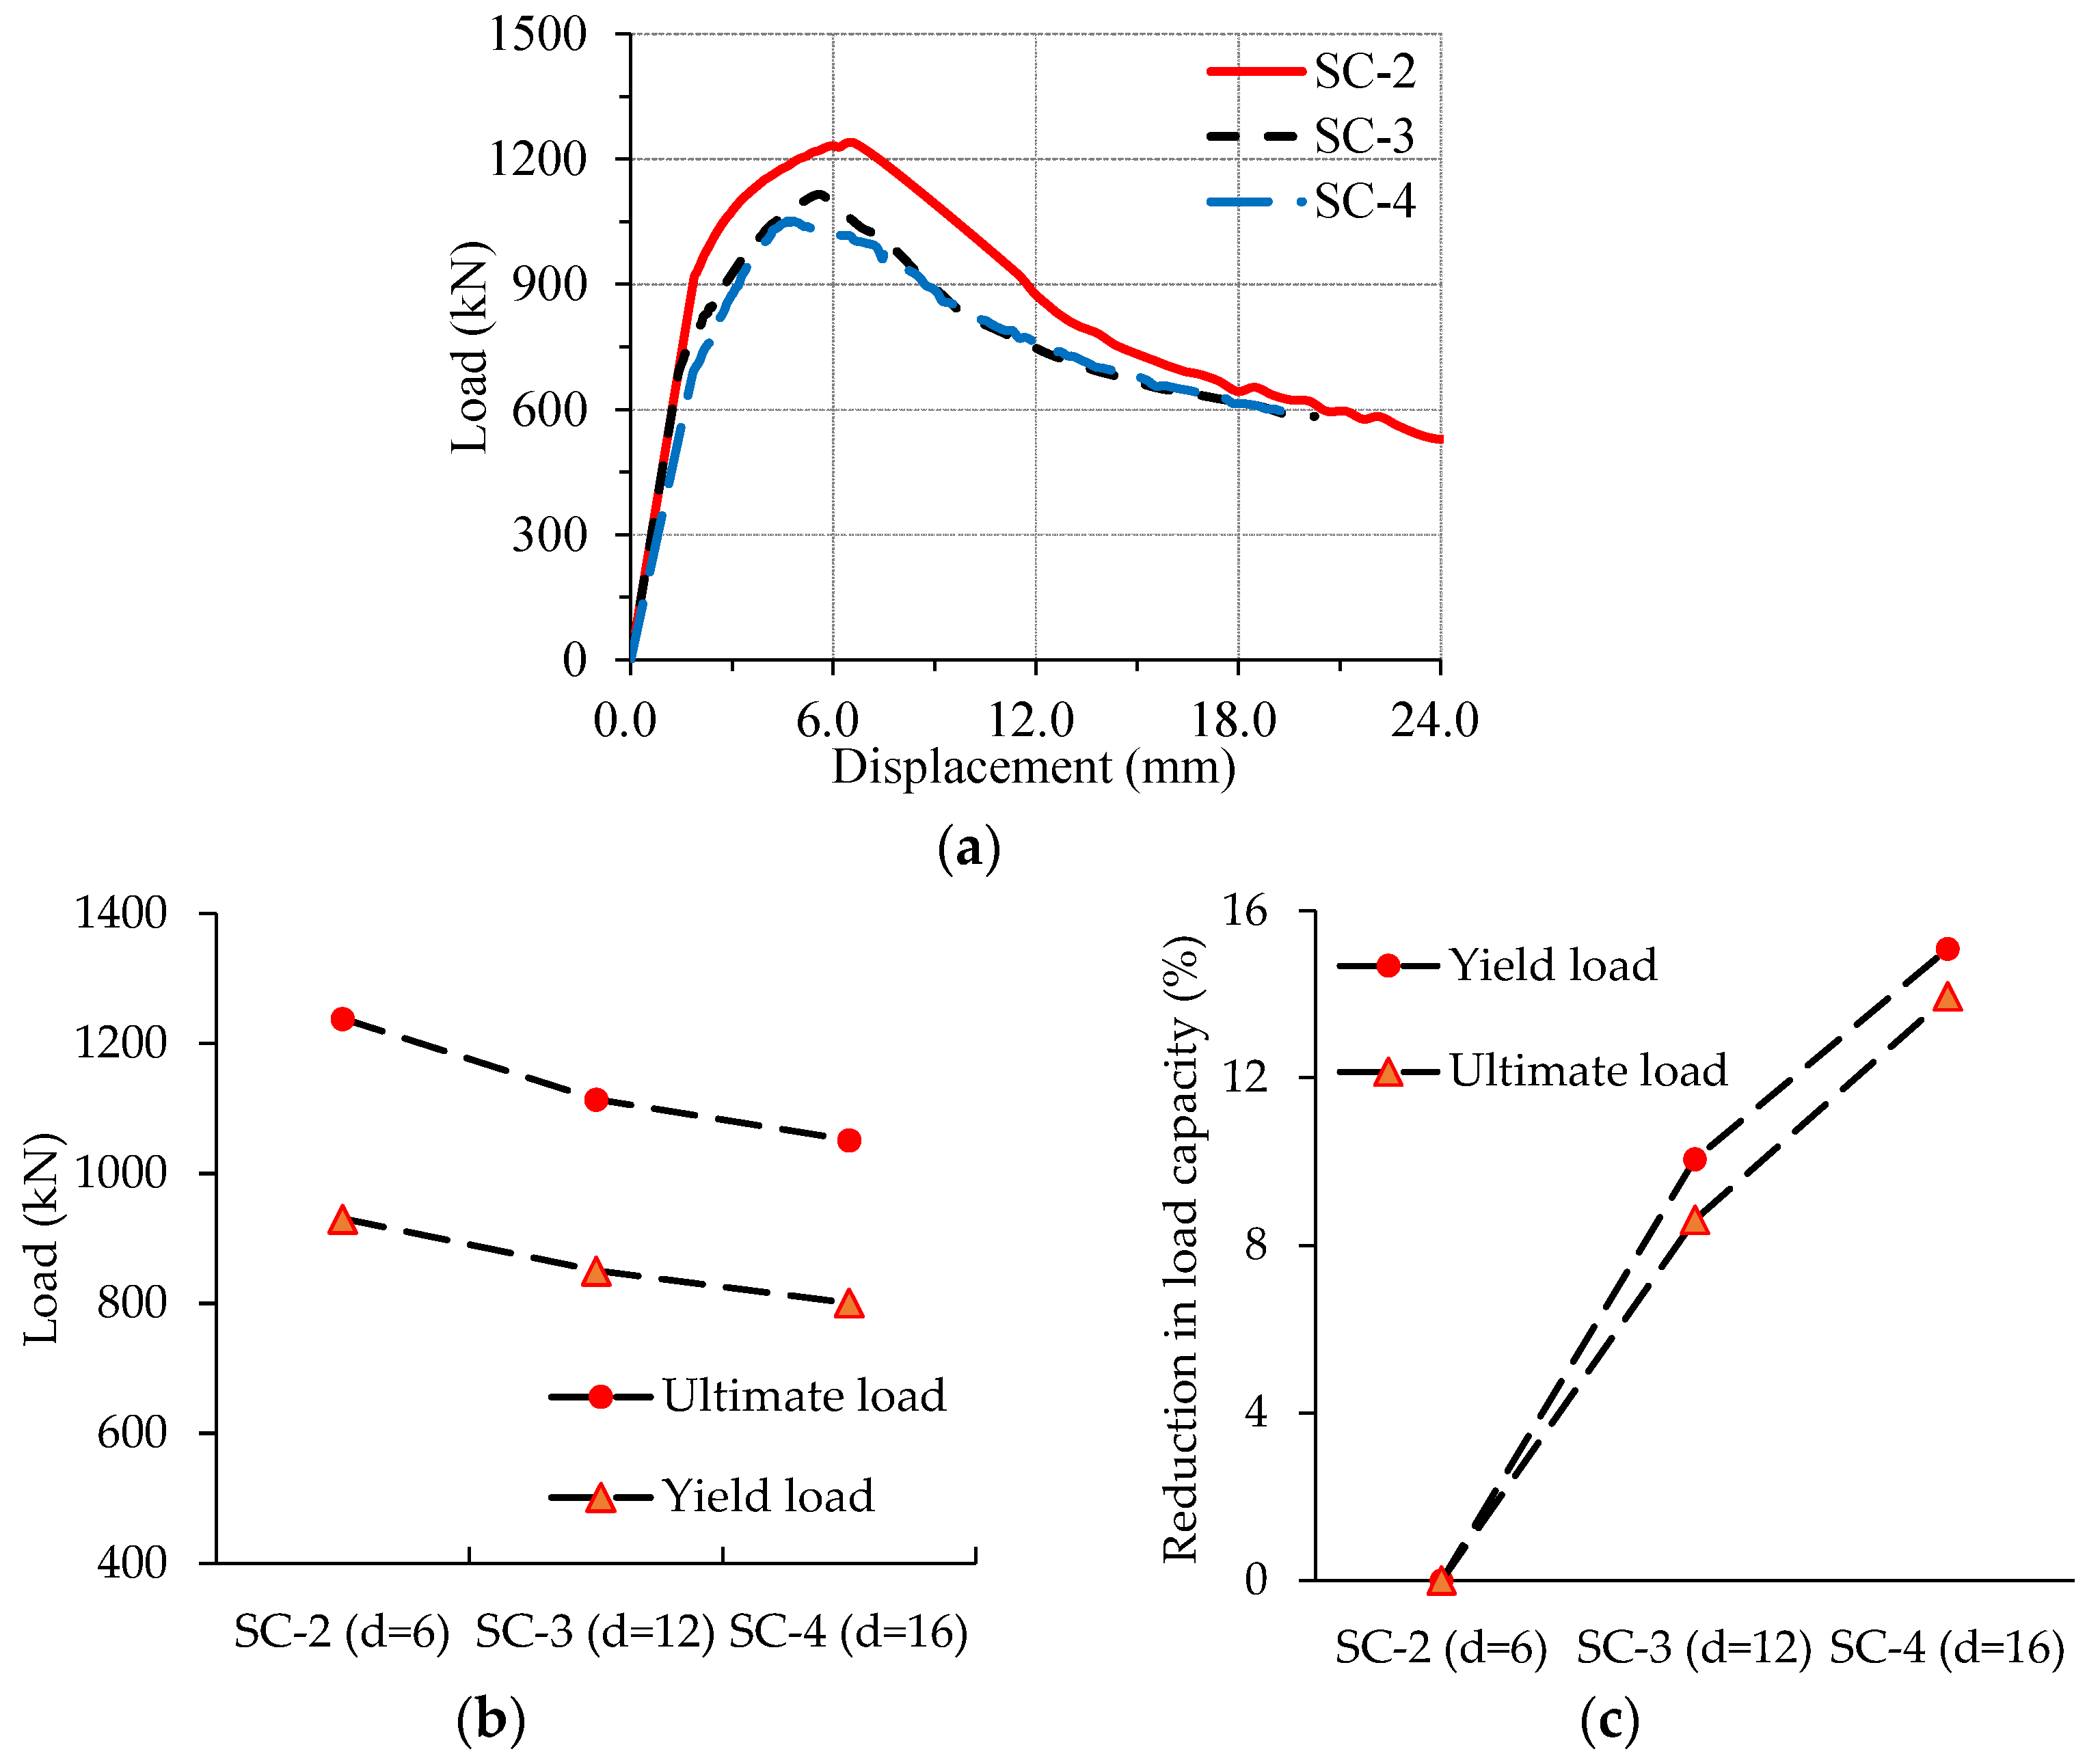
4.2. Load-Displacement Curve Analysis
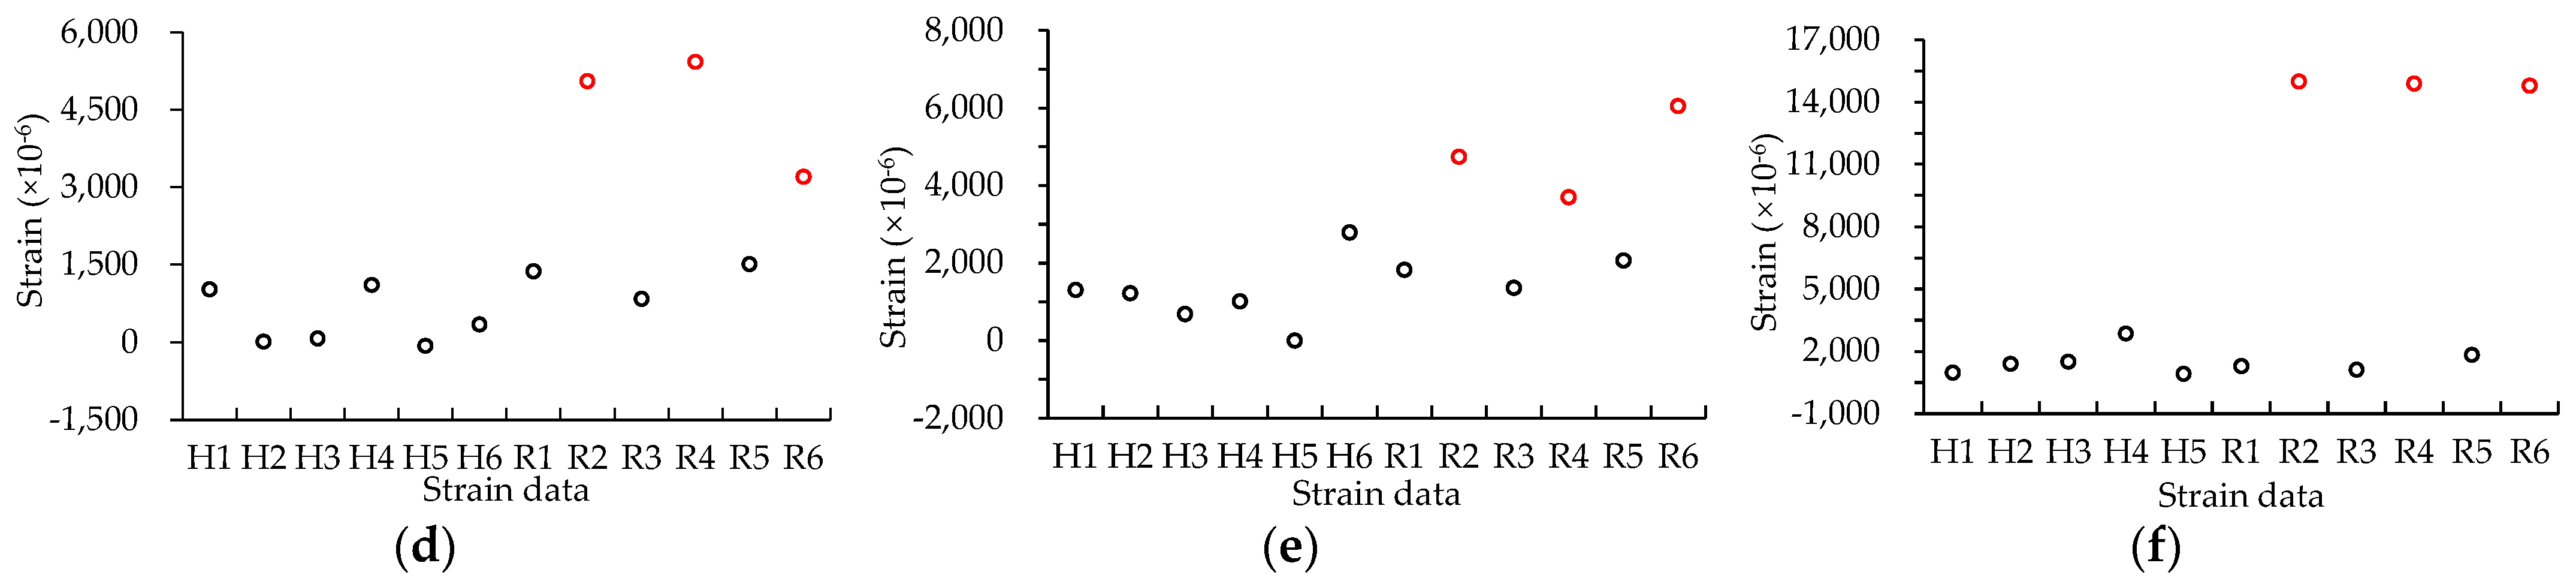
4.3. Strain Distribution and Development
5. Development and Validation of Finite Element Model
5.1. General
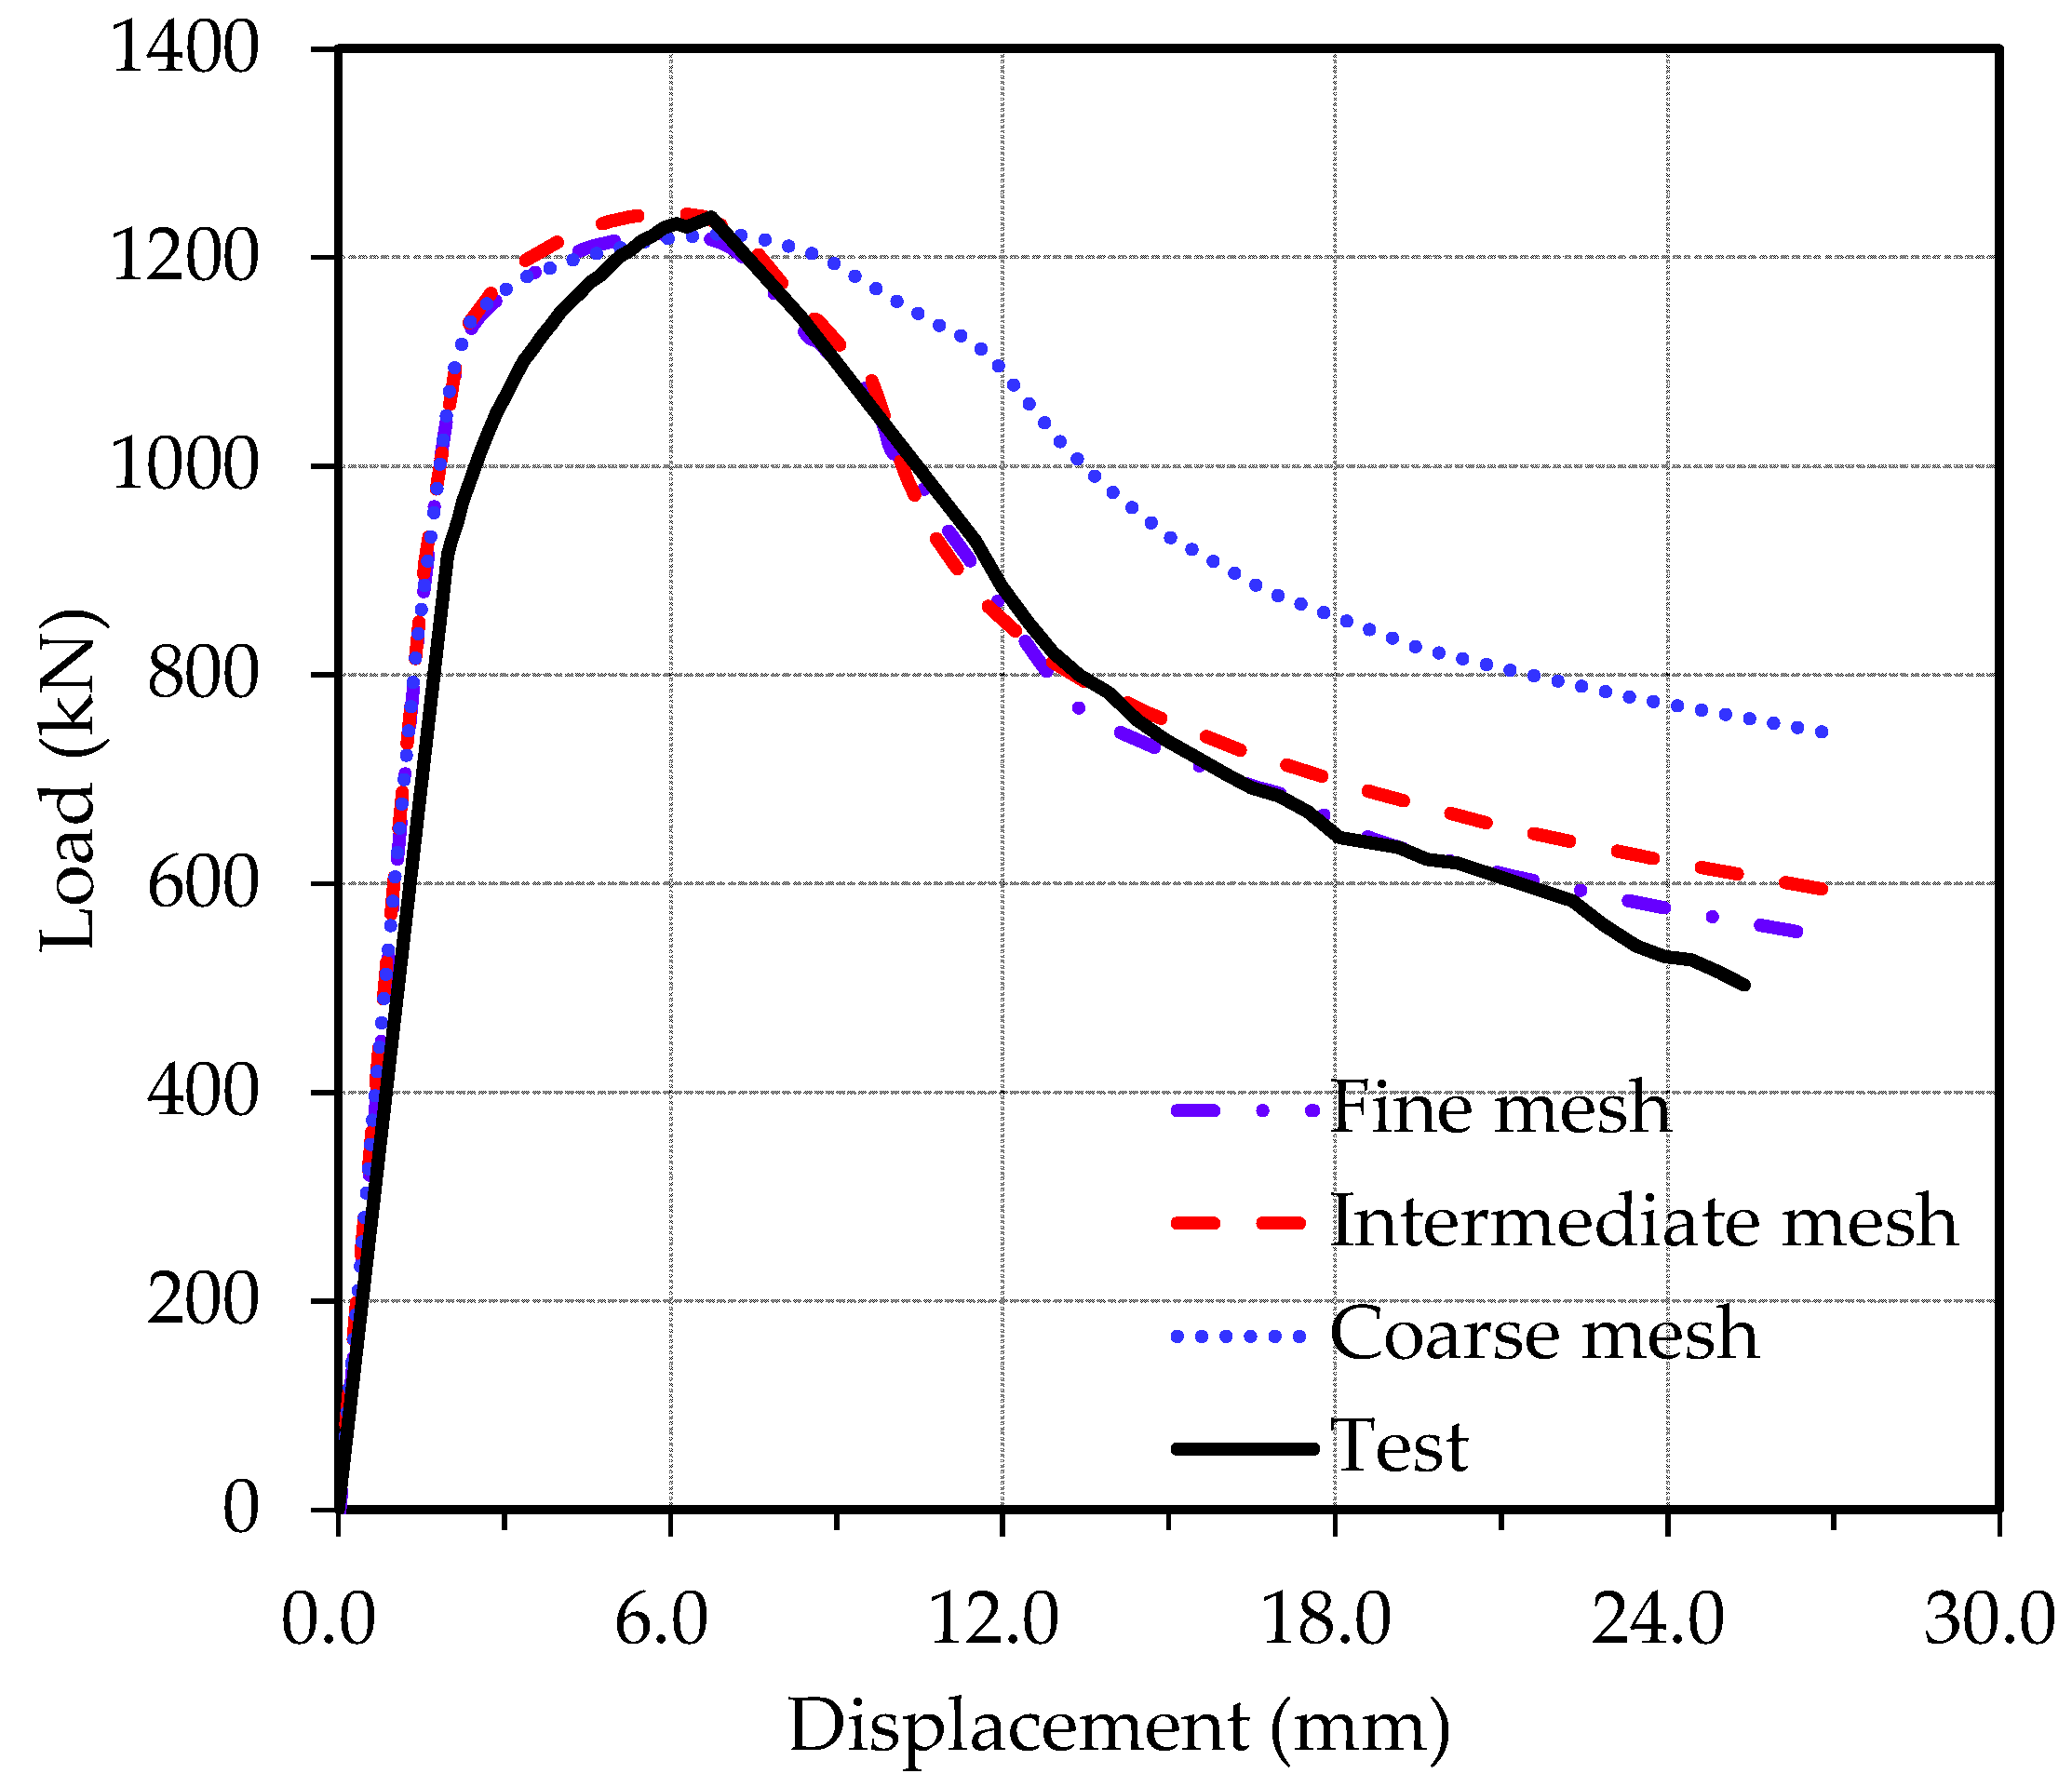
5.2. Element Type, Boundary Condition, Mesh, and Loading
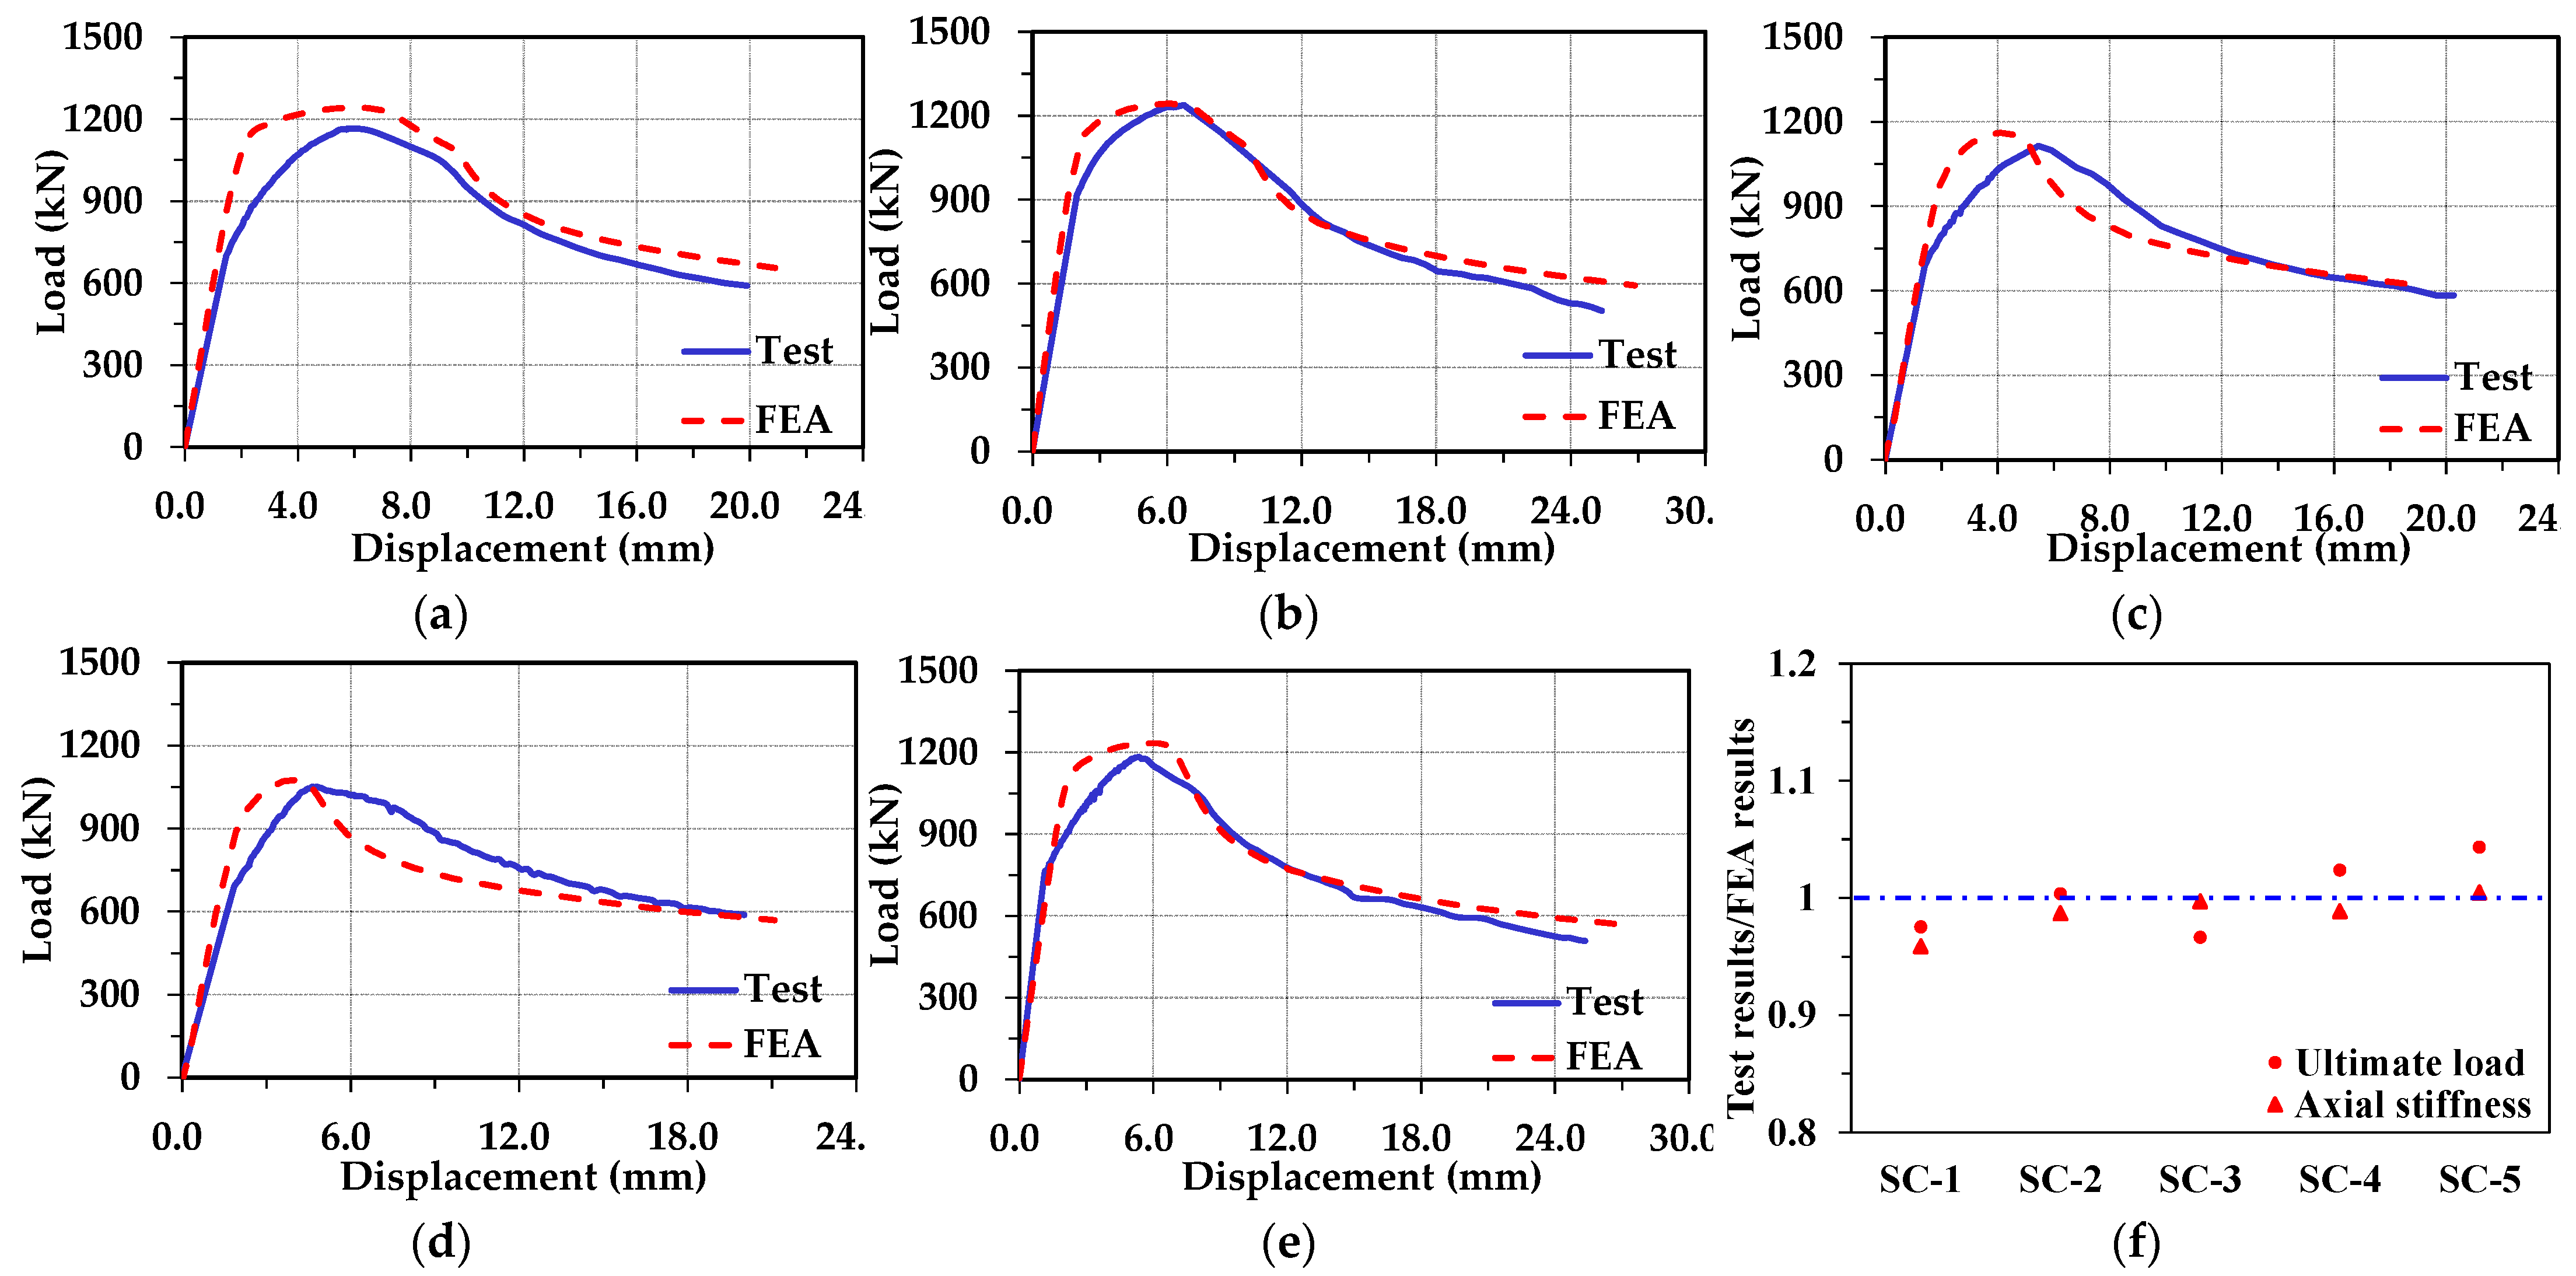
5.3. Verification of the FEM
6. Parametric Study
6.1. Details of the Parameters
6.2. Effect of Location of the Column
6.3. Effects of Weight Reduction of the Corner Fitting
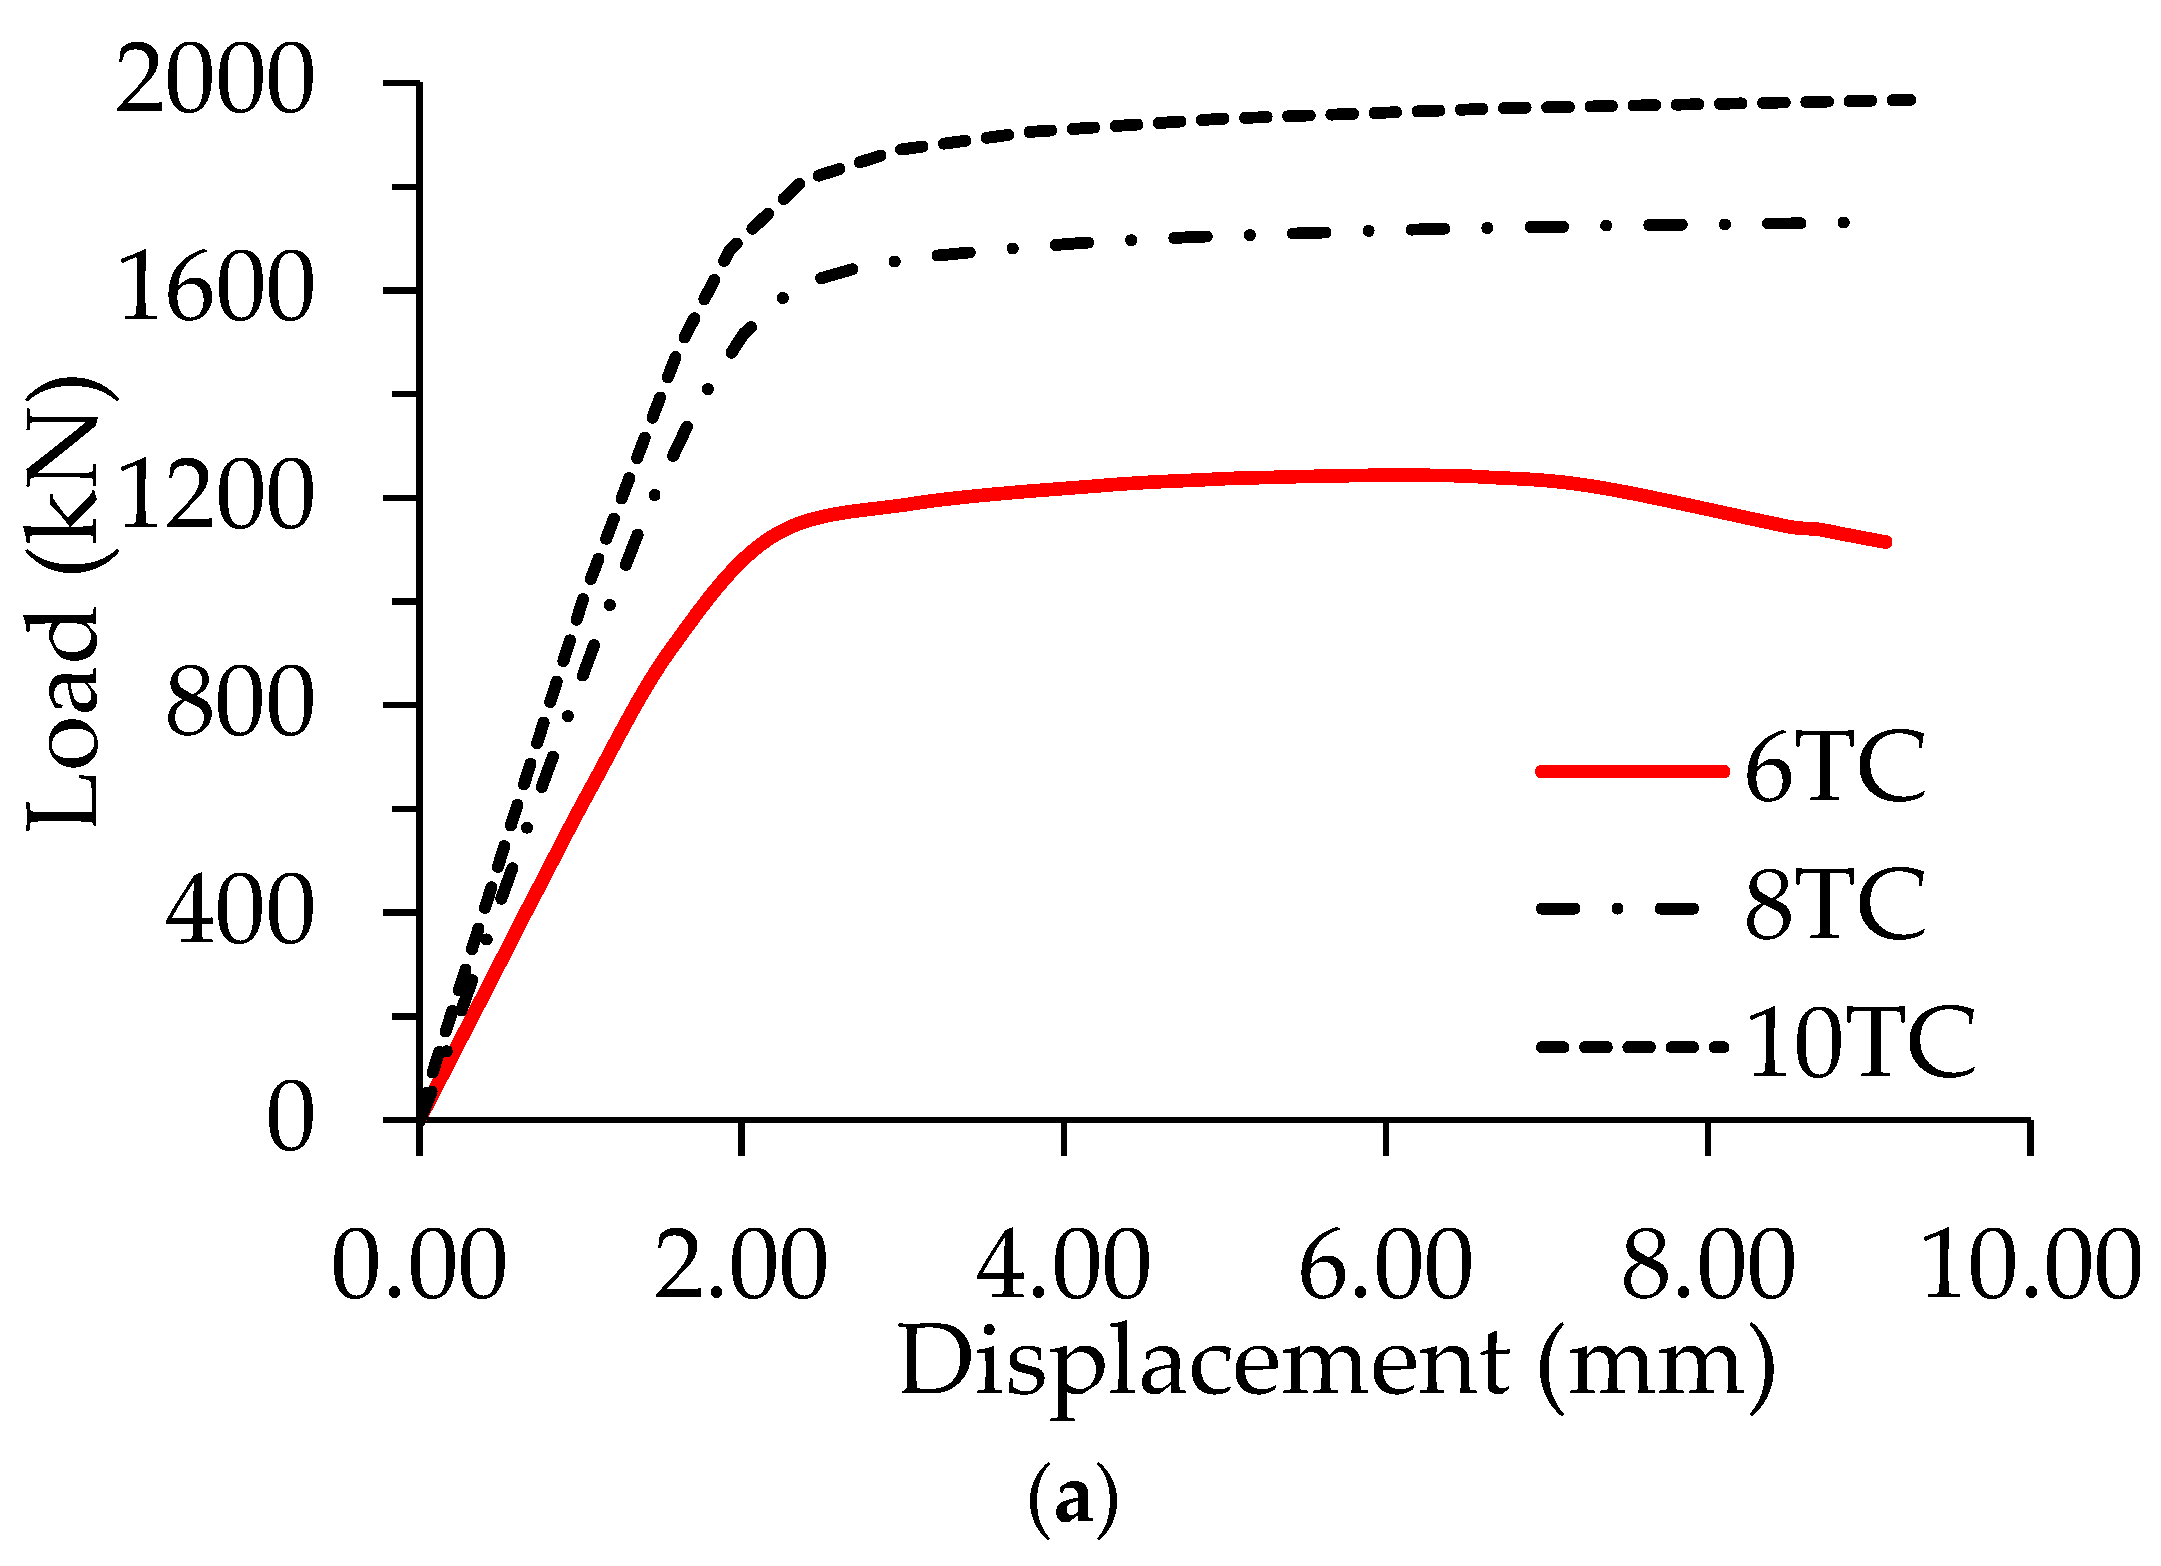
6.4. Effects of the Columns
6.5. Summary and Discussions
7. Conclusions
- The equivalent strain obtained from the test indicated that plastic strain occurred in columns earlier. The failure mode of the connection under axial compression is governed by local buckling of the column.
- Full-scale experiment and nonlinear FEA on the innovative connection showed that ultimate load and yield load of the connection may apparently decrease with an increase of the areas of the bolt hole on the column wall. In other words, the axial load-bearing capacity of the FPLC may decrease as the diameter and number of the long stay bolts increase.
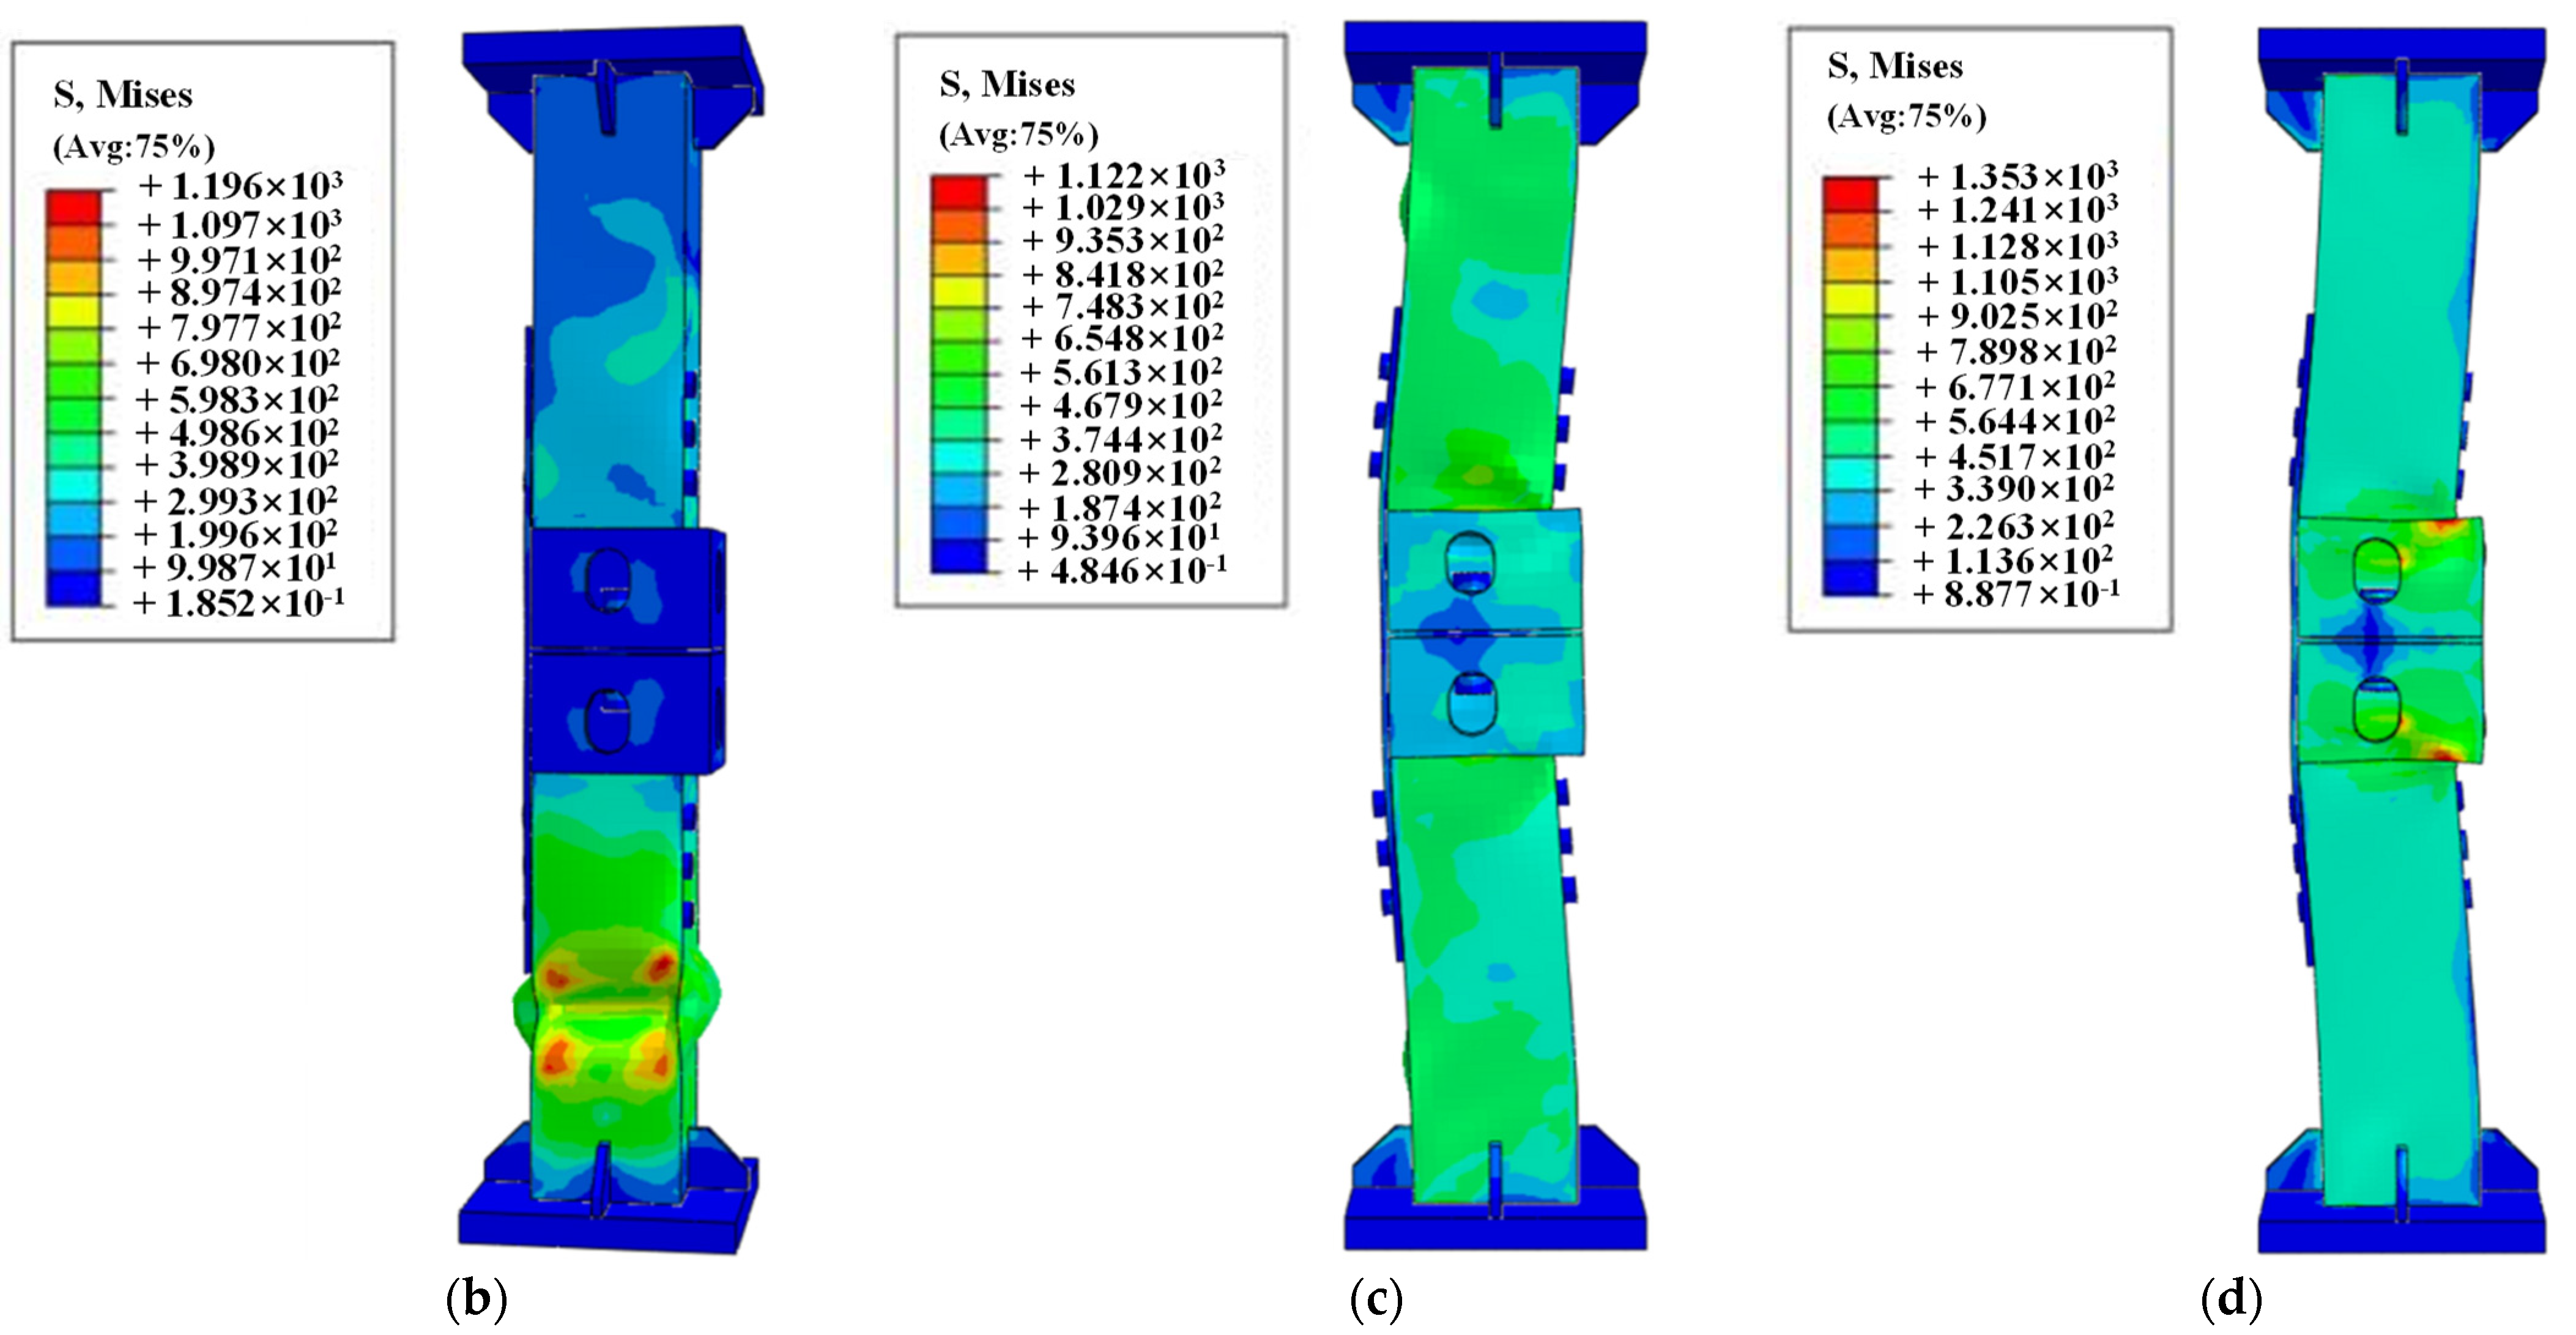
- The location of the column on the corner fitting does not play a main role in the compressive strength of the FPLC. However, the location of the column affects the Von Mises stress and PEEQ distribution, and the original, middle, and middle column locations are suggested for columns with thicknesses of 6 mm, 8 mm, and 10 mm, respectively.
- The compressive resistance of the connection is closely related to the thickness, length, and strength of the module column. Increasing the conditional yield strength of the columns increases the ultimate compressive load of the FPLC. Increasing the length of the column results in a decrease of the ultimate compressive-load capacity. The thickness of the column occupies a main factor of the load capacity, and the failure mode may become inelastic global buckling when the thickness of the column increases.
- The weight reduction (WR) of the corner fitting can be up to 15% in the 6 TC-Original and 8 TC-Middle models when the axial load-bearing capacity decreases by 8.27% and 7.71%, respectively. It is not suitable for the model with a column thickness of 10 mm to reduce the weight of the corner fitting because of an unacceptable decline in the magnitude of the ultimate load, even with a small amount of weight reduction.
Author Contributions
Funding
Institutional Review Board Statement
Informed Consent Statement
Data Availability Statement
Conflicts of Interest
References
- Annan, C.D.; Youssef, M.A.; El-Naggar, M.H. Effect of directly welded stringer-to-beam connections on the analysis and design of modular steel building floors. Adv. Struct. Eng. 2009, 12, 373–383. [Google Scholar] [CrossRef]
- Ye, Z.; Giriunas, K.; Sezen, H.; Wu, G.; Feng, D. State-of-the-art review and investigation of structural stability in multi-story modular buildings. J. Build. Eng. 2021, 33, 101844. [Google Scholar] [CrossRef]
- Lacey, A.W.; Chen, W.; Hao, H.; Bi, K. Review of bolted inter-module connections in modular steel buildings. J. Build. Eng. 2019, 23, 207–219. [Google Scholar] [CrossRef]
- Nadeem, G.; Safiee, N.A.; Bakar, N.A.; Karim, I.A.; Nasir, N.A.M. Connection design in modular steel construction: A review. Structures 2021, 33, 3239–3256. [Google Scholar] [CrossRef]
- Ryan, E.S. Prefab Architecture: A Guide to Modular Design and Construction; John Wiley and Sons, Inc.: Hoboken, NJ, USA, 2010. [Google Scholar]
- Corfar, D.; Tsavdaridis, K.D. A comprehensive review and classification of inter-module connections for hot-rolled steel modular building systems. J. Build. Eng. 2022, 50, 104006. [Google Scholar] [CrossRef]
- Gatheeshgar, P.; Poologanathan, K.; Gunalan, S.; Shyha, I.; Sherlock, P.; Rajanayagam, H.; Nagaratnam, B. Development of affordable steel-framed modular buildings for emergency situations (COVID-19). Structures 2021, 31, 862–875. [Google Scholar] [CrossRef]
- World’s Tallest Prefab Skyscrapers Will Rise in Singapore—But They’re Being Built in Malaysia. Available online: https://edition.cnn.com/style/article/singapore-worlds-tallest-prefab-skyscraper-intl-hnk/index.html (accessed on 14 April 2022).
- Lawson, R.M.; Ogden, R.G. “Hybrid” light steel panel and modular systems. Thin-Walled Struct. 2008, 46, 720–730. [Google Scholar] [CrossRef]
- Lawson, R.M.; Ogden, R.G.; Goodier, C. Design in Modular Construction; CRC Press: Boca Raton, FL, USA, 2014. [Google Scholar]
- Kim, J.; Lee, J. A basic study on the application of modular construction. J. Korean Hous. Assoc. 2014, 25, 39–46. [Google Scholar] [CrossRef] [Green Version]
- Park, H.K.; Ock, J.H. Unit modular in-fill construction method for high-rise buildings. KSCE J. Civ. Eng. 2015, 20, 1201–1210. [Google Scholar] [CrossRef]
- Andrade, P.; Veljkovic, M.; Lundholm, J.; Heistermann, T. Innovative construction of student residences: Frameup concept. In Proceedings of the Nordic Steel Construction Conference: Tampere University of Technology, Department of Civil Engineering, Tampere, Finland, 23–25 September 2015; pp. 199–200. [Google Scholar]
- Hou, H.; Yan, X.; Qu, B.; Lu, Y. Cyclic tests of steel tee energy absorbers for precast exterior wall panels in steel building frames. Eng. Struct. 2021, 242, 112561. [Google Scholar] [CrossRef]
- Hou, H.; Zhang, S.; Qu, B.; Zhu, Y.; Liang, Y.; Liang, Y.; Li, K.; Fu, X. Low-rise steel moment-resisting frames with novel re-centering beam-to-column connections: Connection modelling and system performance evaluation. J. Constr. Steel Res. 2021, 180, 106578. [Google Scholar] [CrossRef]
- Srisangeerthanan, S.; Hashemi, M.; Rajeev, P.; Gad, E.; Fernando, S. Review of performance requirements for inter-module connections in multi-story modular buildings. J. Build. Eng. 2020, 28, 101087. [Google Scholar] [CrossRef]
- Annan, C.D.; Youssef, M.A.; Naggar, M.H.E. Experimental evaluation of the seismic performance of modular steel-braced frames. Eng. Struct. 2009, 31, 1435–1446. [Google Scholar] [CrossRef]
- Deng, E.; Zong, L.; Ding, Y.; Dai, X.; Lou, N.; Chen, Y. Monotonic and cyclic response of bolted connections with welded cover plate for modular steel construction. Eng. Struct. 2018, 167, 407–419. [Google Scholar] [CrossRef]
- Chen, Z.; Liu, Y.; Zhong, X.; Liu, J. Rotational stiffness of inter-module connection in mid-rise modular steel buildings. Eng. Struct. 2019, 196, 109273. [Google Scholar] [CrossRef]
- Dai, X.; Zong, L.; Ding, Y.; Li, Z. Experimental study on seismic behavior of a novel plug-in self-lock joint for modular steel construction. Eng. Struct. 2018, 181, 143–164. [Google Scholar] [CrossRef]
- Sanches, R.; Mercan, O.; Roberts, B. Experimental investigations of vertical posttensioned connection for modular steel structures. Eng. Struct. 2018, 175, 776–789. [Google Scholar] [CrossRef]
- Dhanapal, J.; Ghaednia, H.; Das, S.; Velocci, J. Structural performance of state-of-the-art VectorBloc modular connector under axial loads. Eng. Struct. 2019, 183, 496–509. [Google Scholar] [CrossRef]
- Dhanapal, J.; Ghaednia, H.; Das, S.; Velocci, J. Behavior of thin-walled beam-column modular connection subject to bending load. Thin-Walled Struct. 2019, 149, 106536. [Google Scholar] [CrossRef]
- Hou, H.; Wang, C.; Qu, B.; Liang, Y. Cyclic testing of bolted base connections for wide-flange columns. Eng. Struct. 2021, 235, 112024. [Google Scholar] [CrossRef]
- Hou, H.; Sun, B.; Qu, B.; Wang, C.; Zhang, S.; Liang, Y. Testing of bolted base connections for wide-flange columns under combined axial compression and weak-axis lateral forces. J. Constr. Steel Res. 2021, 179, 106547. [Google Scholar] [CrossRef]
- Chen, Z.; Wang, J.; Liu, J.; Khan, K. Seismic behavior and moment transfer capacity of an innovative self-locking inter-module connection for modular steel building. Eng. Struct. 2021, 245, 112978. [Google Scholar] [CrossRef]
- Zhai, S.; Lyu, Y.; Cao, K.; Li, G.; Wang, W.; Chen, C. Experimental study on bolted-cover plate corner connections for column-supported modular steel buildings. J. Constr. Steel Res. 2022, 189, 107060. [Google Scholar] [CrossRef]
- Deng, E.; Zong, L.; Ding, Y.; Zhang, Z.; Zhang, J.; Shi, F.; Cai, L.; Gao, S. Seismic performance of mid-to-high rise modular steel construction—A critical review. Thin-Walled Struct. 2020, 155, 106924. [Google Scholar] [CrossRef]
- Styles, A.; Luo, F.; Bai, Y.; Murray-Parkes, J. Effects of joint rotational stiffness on structural responses of multi-story modular buildings. In Proceedings of the 2016 International Conference on Smart Infrastructure and Construction, ICSIC, Cambridge, UK, 27–29 June 2016; pp. 457–462. [Google Scholar] [CrossRef]
- Sendanayake, S.V.; Thambiratnam, D.P.; Perera, N.J.; Chan, T.H.T.; Aghdamy, S. Enhancing the lateral performance of modular buildings through innovative inter-modular connections. Structures 2021, 29, 167–184. [Google Scholar] [CrossRef]
- Lacey, A.W.; Chen, W.; Hao, H.; Bi, K.; Tallowin, F.J. Shear behaviour of post-tensioned inter-module connection for modular steel buildings. J. Constr. Steel Res. 2019, 162, 105707. [Google Scholar] [CrossRef]
- Choi, K.; Lee, H.-C.; Kim, H. Influence of analytical models on the seismic response of modular structures. J. Korea Inst. Struct. Maint. Insp. 2016, 20, 74–85. [Google Scholar] [CrossRef] [Green Version]
- CECS 334-2013; Technical Specification for Modular Freight Container Building. China Planning Press: Beijing, China, 2013. (In Chinese)
- Zhang, J.; Tian, G.; Zhao, J.; Deng, E.; Wen, M.; Ye, L.; Guo, X.; Zhou, J.; Wang, S.Q.; Xing, X. Experimental Study on Seismic Performance of Connection for ATLS modular house. J. Constr. Steel Res. 2020, 170, 106118. [Google Scholar] [CrossRef]
- GB/T 228.1–2010; Metallic Materials-Tensile Testing-Part 1: Method of Test at Room Temperature. China Quality Press, Standards Press of China: Beijing, China, 2010. (In Chinese)
- EN 1993-1-1; Design of Steel Structures-Part 1-1: General Rules and Rules for Buildings. European Standard: London, UK, 2005.
- JJF 1296.2-2011; Program of Pattern Evaluation of Static Uniaxial Testing Machines-Part 2: Electro-Hydraulic Servo Universal Testing Machines. General Administration of Quality Supervision, Inspection and Quarantine of the People’s Republic of China: Beijing China, 2011. (In Chinese)
- ABAQUS. User Manual Version 6.13; DS SIMULIA Corp: Providence, RI, USA, 2013. [Google Scholar]
- Fleischman, R.B.; Li, X.; Pan, Y.; Sumer, A. Cast Modular Panel Zone Node for Steel Special Moment Frames. I: Analytical Development. J. Struct. Eng. ASCE 2007, 133, 1393–1403. [Google Scholar] [CrossRef]
- Lima, J.M.; Bezerra, L.M.; Bonilla, J.; Barbosa, W.C.S. Study of the behavior and resistance of right-angle truss shear connector for composite steel concrete beams. Eng. Struct. 2022, 253, 113778. [Google Scholar] [CrossRef]
- Ellobody, E.; Young, B. Behavior of cold-formed steel plain angle columns. J. Struct. Eng. 2005, 131, 457–466. [Google Scholar] [CrossRef]
- Shi, G.; Zhou, W.; Bai, Y.; Lin, C. Local buckling of 460 MPa high strength steel welded section stub columns under axial compression. J. Constr. Steel Res. 2014, 100, 60–70. [Google Scholar] [CrossRef]


| Specimen | d/mm | n | l/mm |
|---|---|---|---|
| SC-1 | 6 | 2 | 448 |
| SC-2 | 6 | 6 | 648 |
| SC-3 | 12 | 6 | 648 |
| SC-4 | 16 | 6 | 648 |
| SC-5 | 6 | 10 | 848 |
| Components | Yield Strength/MPa | Ultimate Strength/MPa | Elongation |
|---|---|---|---|
| HSS members and gusset plate | 394 | 500 | 23.2% |
| Long stay bolt | 640 | 800 | 5.0% |
| High-strength bolt | 660 | 930 | 5.0% |
| Corner fitting | 310 | 490 | - |
| Parameter | Values | Notation |
|---|---|---|
| Weight reduction (WR) of the corner fitting | 0%, 5%, 10%, 15%, and 20% | 0 WR, 5 WR, 10 WR, 15 WR, and 20 WR |
| Locations of the column | 0, 14 mm, and 28 mm | Original, Middle, and Corner |
| Thickness of the column | 6 mm, 8 mm, and 10 mm | 6 TC, 8 TC, and 10 TC |
| Material properties of the column | Q355, Q390, Q420, and Q460 | - |
| Length of the column | 450 mm and 700 mm | - |
| Series | Ultimate Load (kN) | n (%) | |
|---|---|---|---|
| 0 WR | Maximum WR | ||
| 6 TC-Original | 1242.9 | 1140.1 (15 WR) | 8.27 |
| 8 TC-Middle | 1733.1 | 1599.5 (15 WR) | 7.71 |
| 10 TC-Middle | 2124.2 | 1885.1 (5 WR) | 11.27 |
Publisher’s Note: MDPI stays neutral with regard to jurisdictional claims in published maps and institutional affiliations. |
© 2022 by the authors. Licensee MDPI, Basel, Switzerland. This article is an open access article distributed under the terms and conditions of the Creative Commons Attribution (CC BY) license (https://creativecommons.org/licenses/by/4.0/).
Share and Cite
Deng, E.-F.; Lian, J.-Y.; Liu, Z.; Zhang, G.-C.; Wang, S.-B.; Cao, D.-B. Compressive Behavior of a Fully Prefabricated Liftable Connection for Modular Steel Construction. Buildings 2022, 12, 649. https://doi.org/10.3390/buildings12050649
Deng E-F, Lian J-Y, Liu Z, Zhang G-C, Wang S-B, Cao D-B. Compressive Behavior of a Fully Prefabricated Liftable Connection for Modular Steel Construction. Buildings. 2022; 12(5):649. https://doi.org/10.3390/buildings12050649
Chicago/Turabian StyleDeng, En-Feng, Jun-Yi Lian, Zhe Liu, Guang-Cao Zhang, Shi-Bo Wang, and Dian-Bin Cao. 2022. "Compressive Behavior of a Fully Prefabricated Liftable Connection for Modular Steel Construction" Buildings 12, no. 5: 649. https://doi.org/10.3390/buildings12050649
APA StyleDeng, E.-F., Lian, J.-Y., Liu, Z., Zhang, G.-C., Wang, S.-B., & Cao, D.-B. (2022). Compressive Behavior of a Fully Prefabricated Liftable Connection for Modular Steel Construction. Buildings, 12(5), 649. https://doi.org/10.3390/buildings12050649