
Identifying and Ranking Landfill Sites for Municipal Solid Waste Management: An Integrated Remote Sensing and GIS Approach

 ,
,  ,
,  ,
,  and
and
Abstract
:1. Introduction and Background
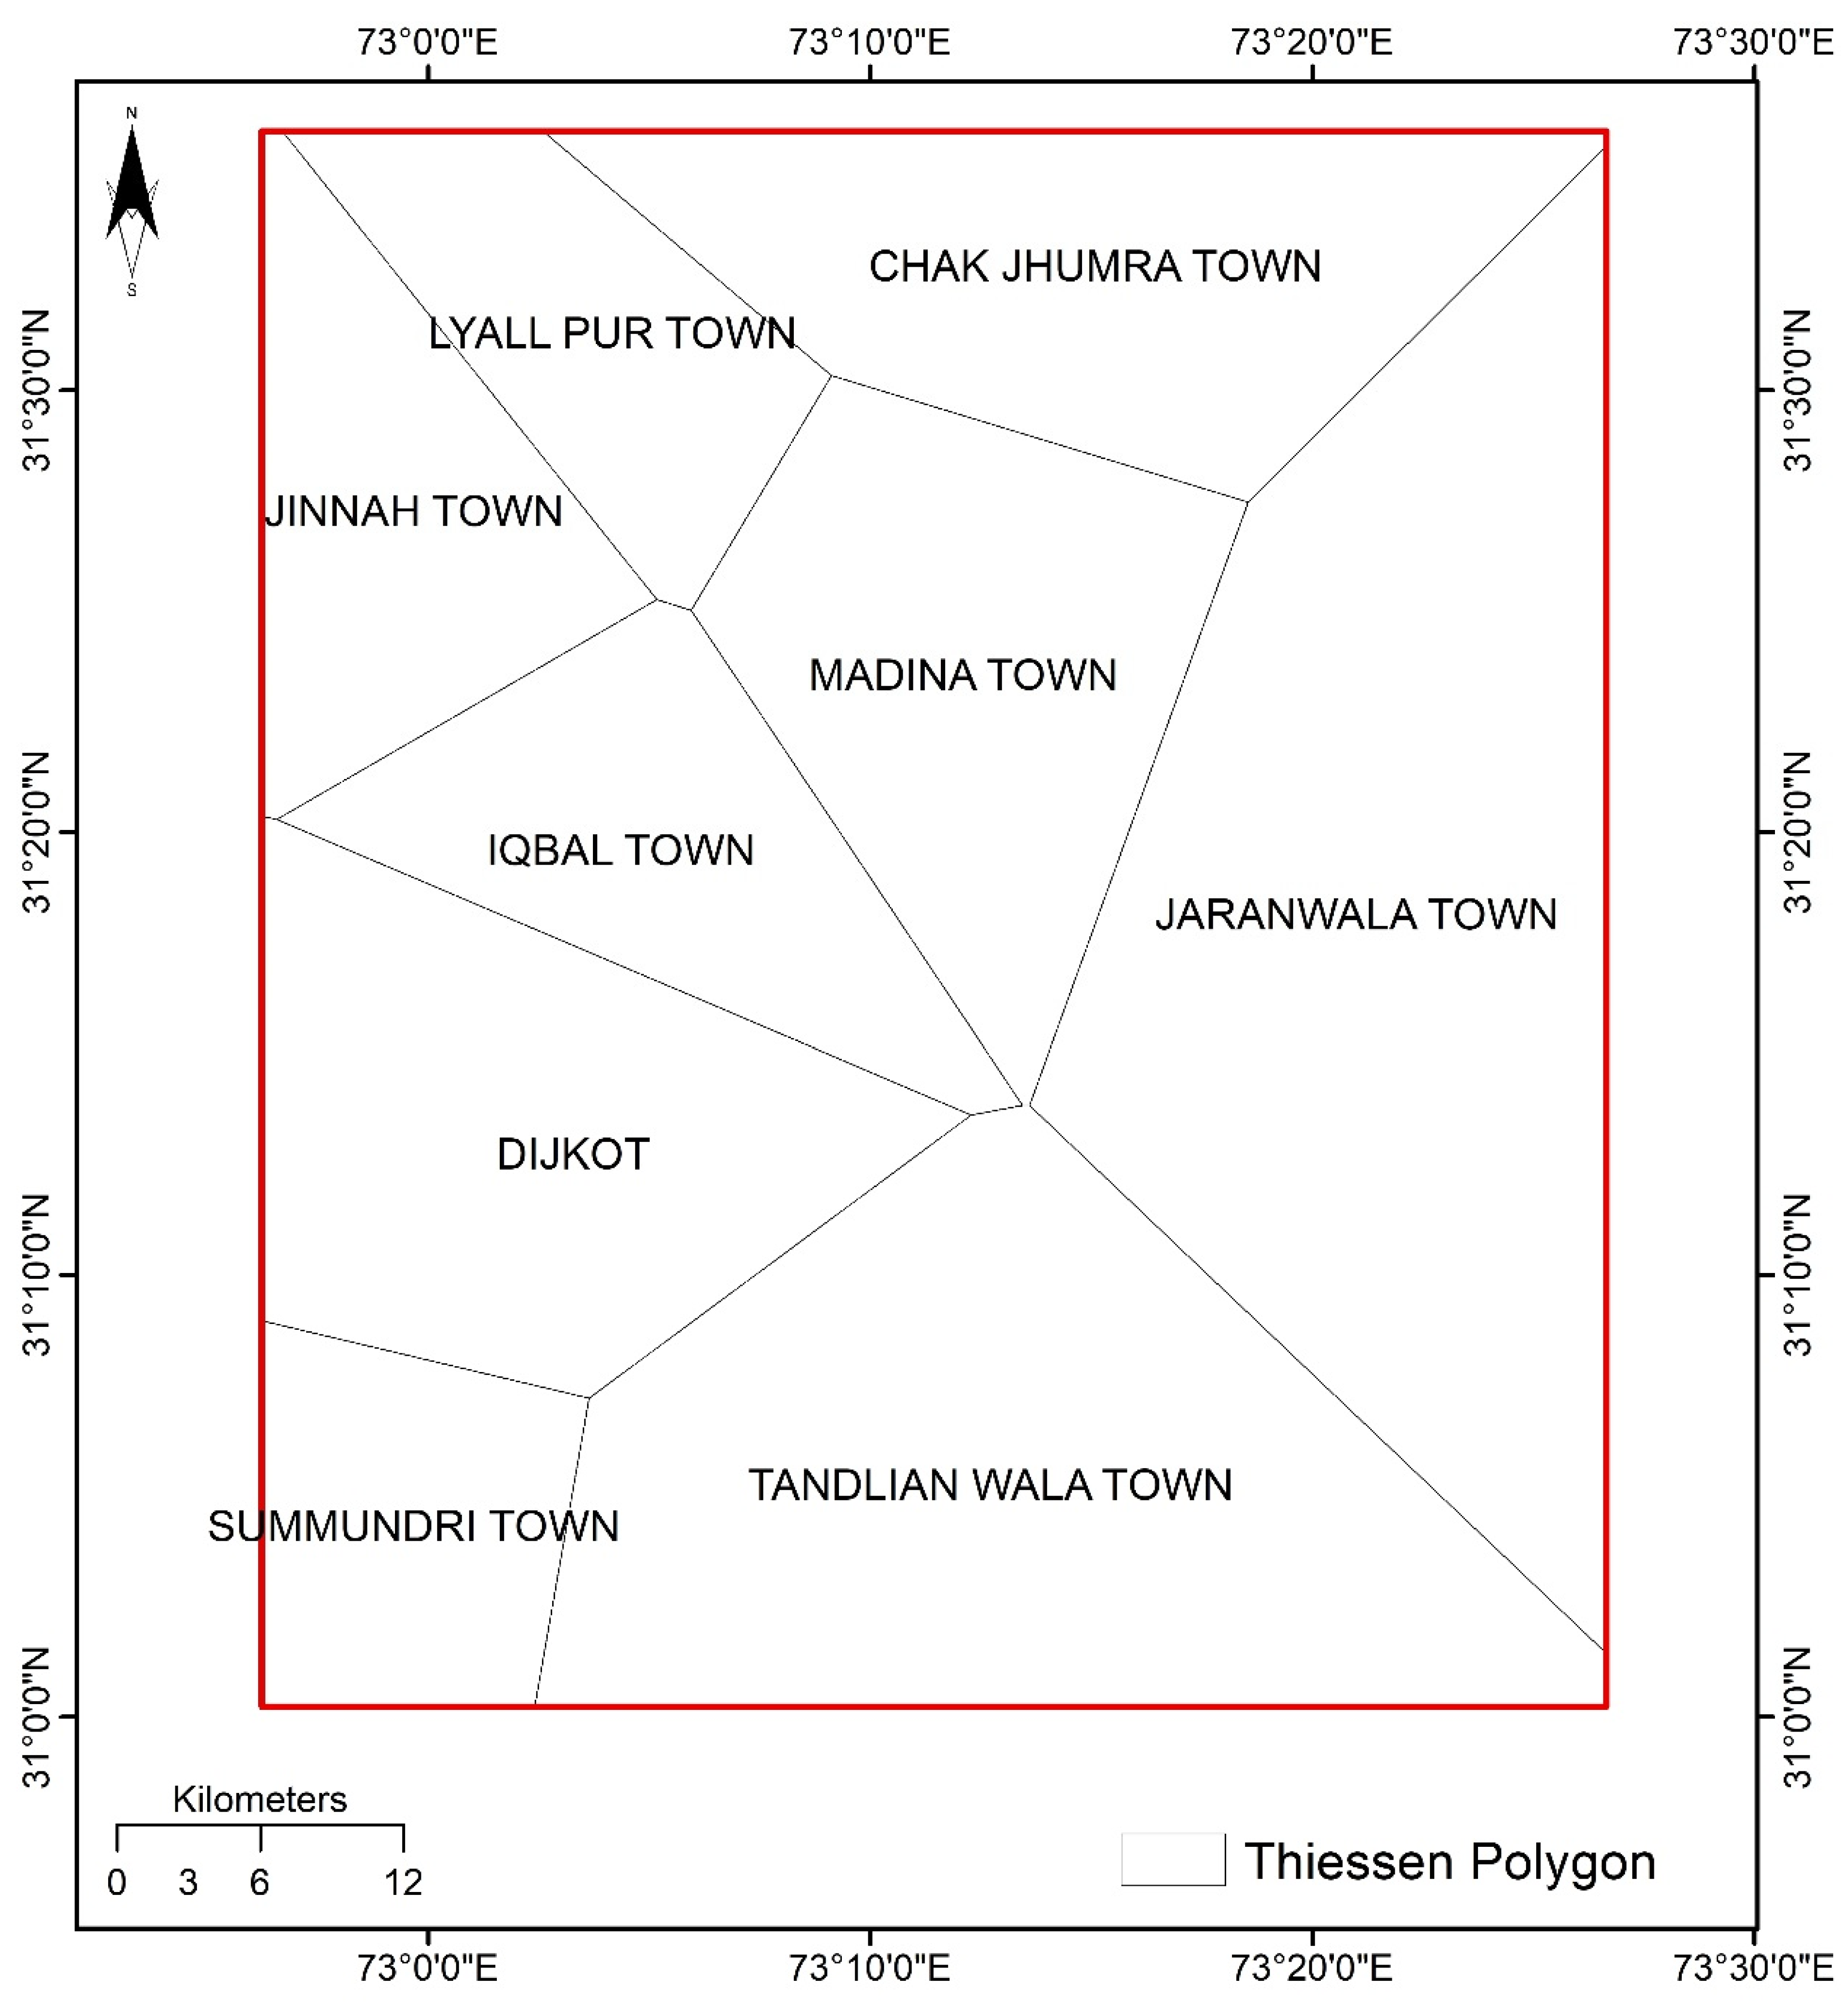
2. Study Area
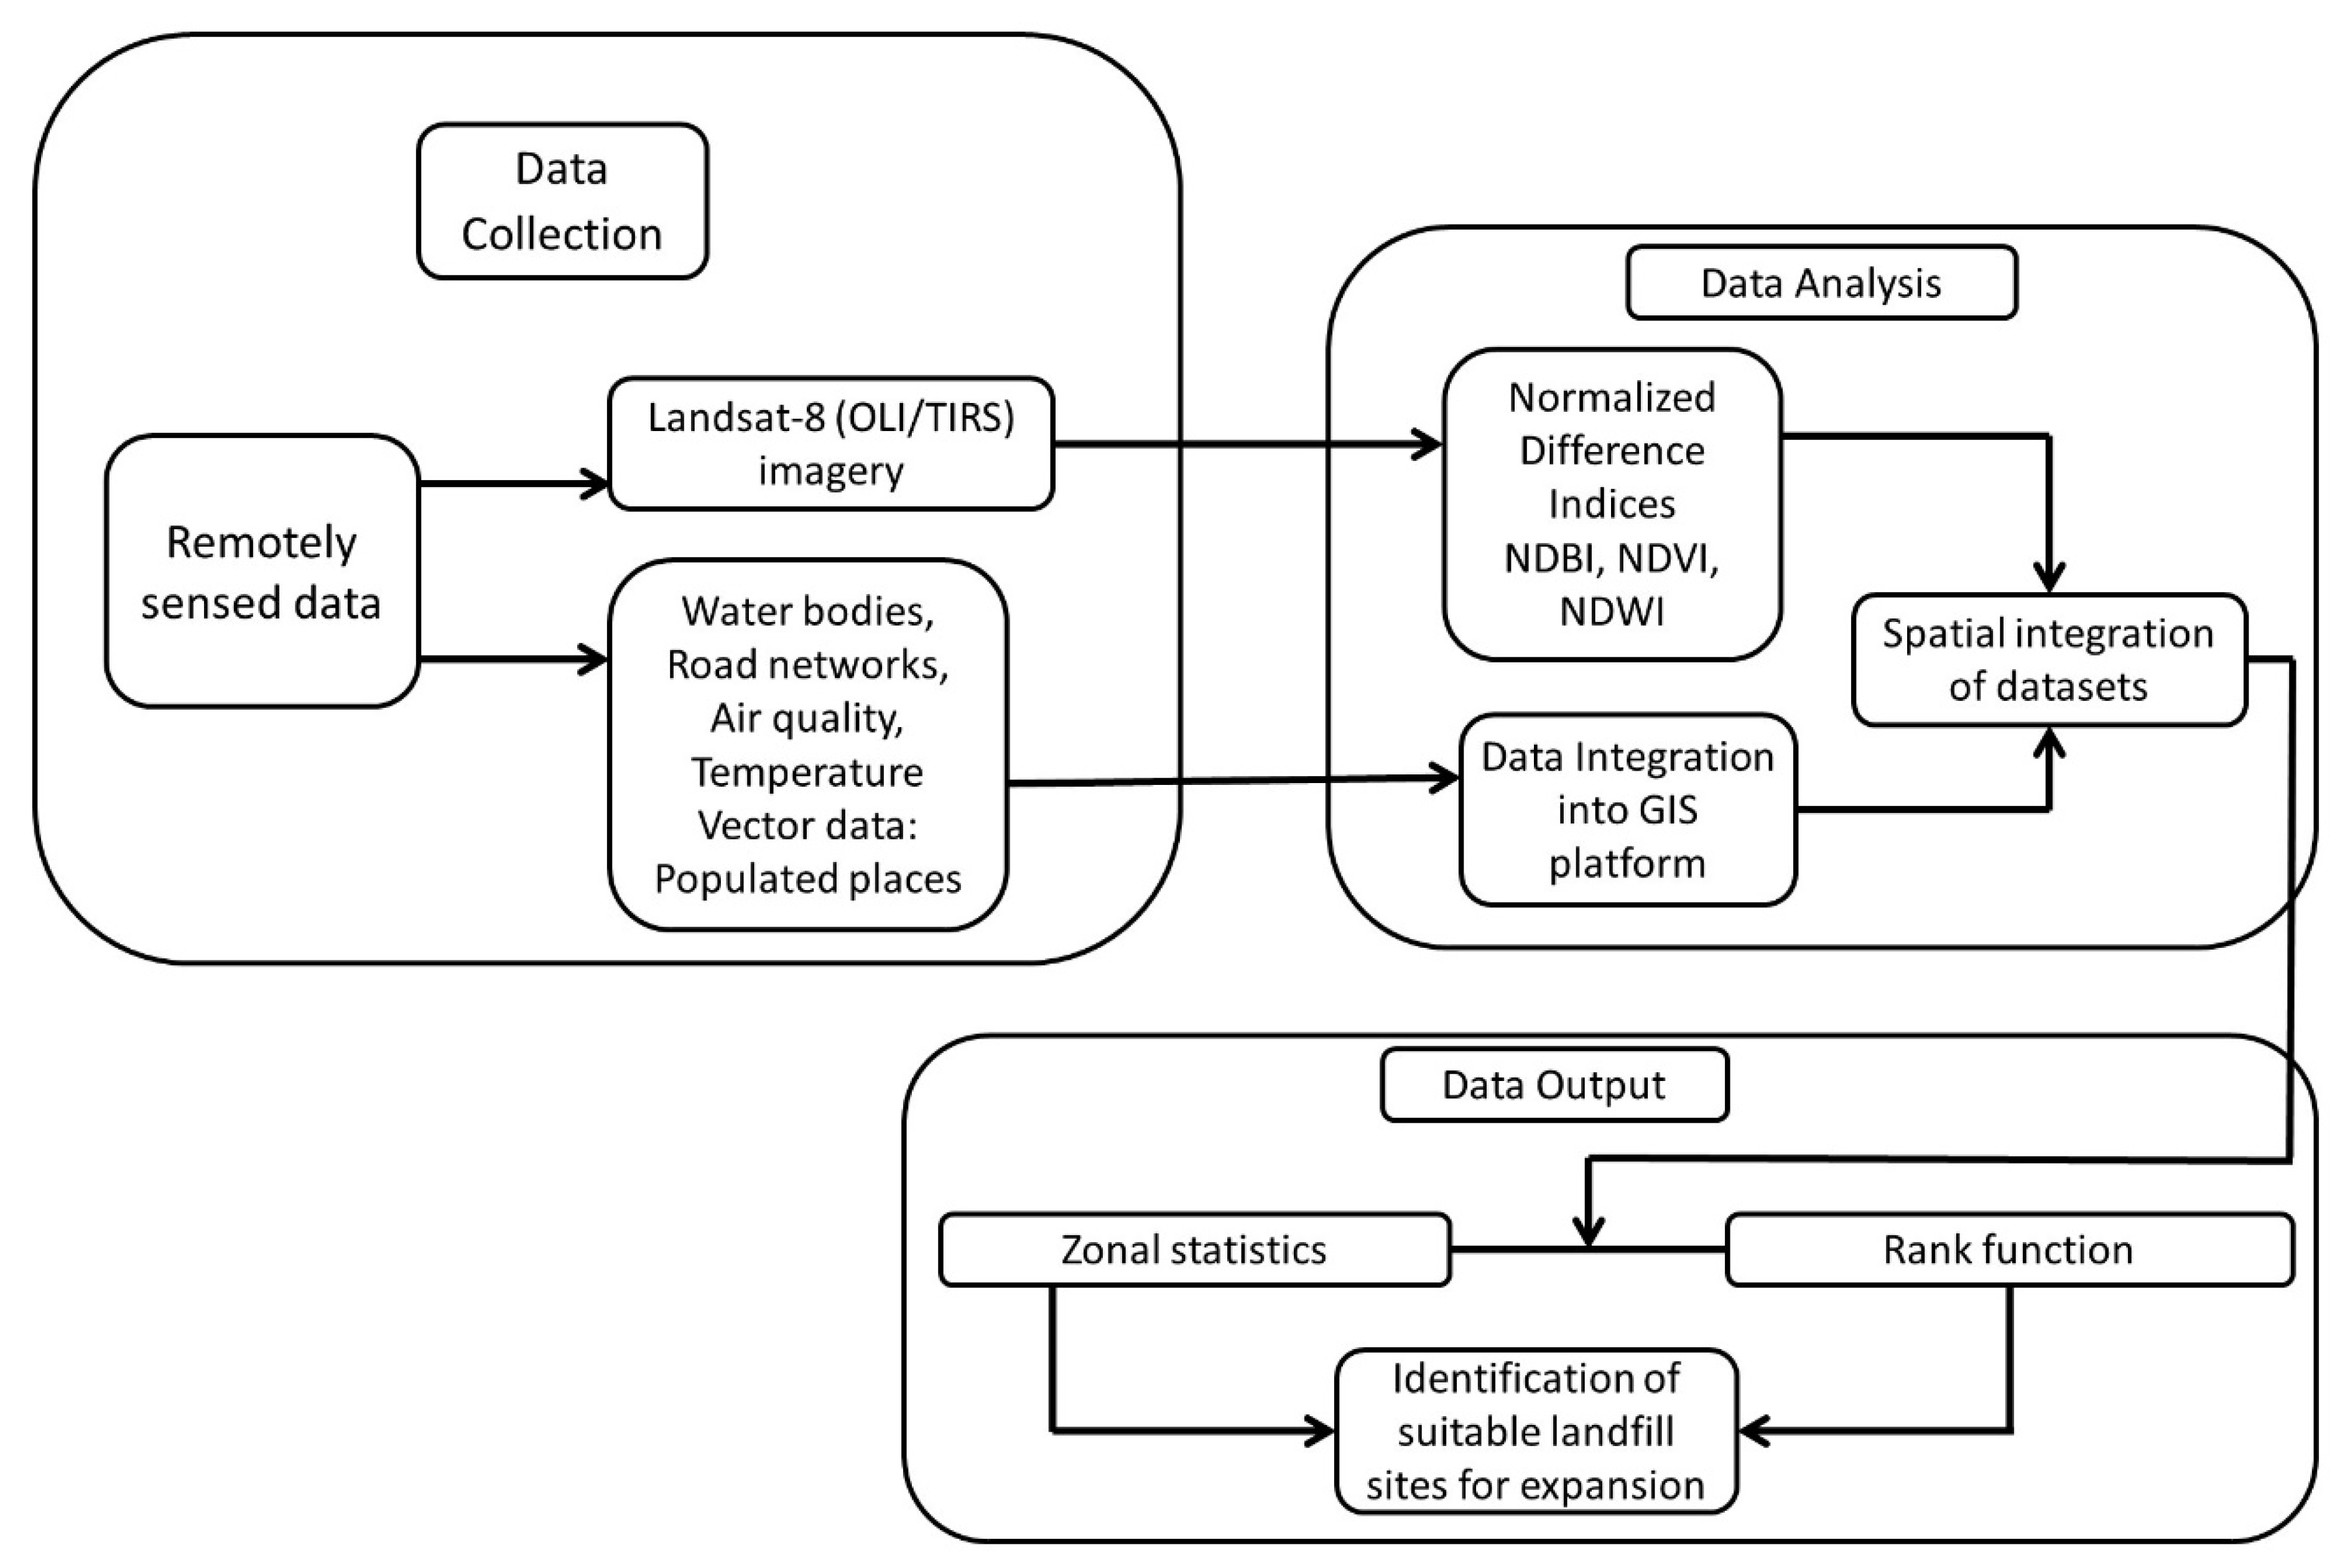
3. Methodology
3.1. Satellite Dataset
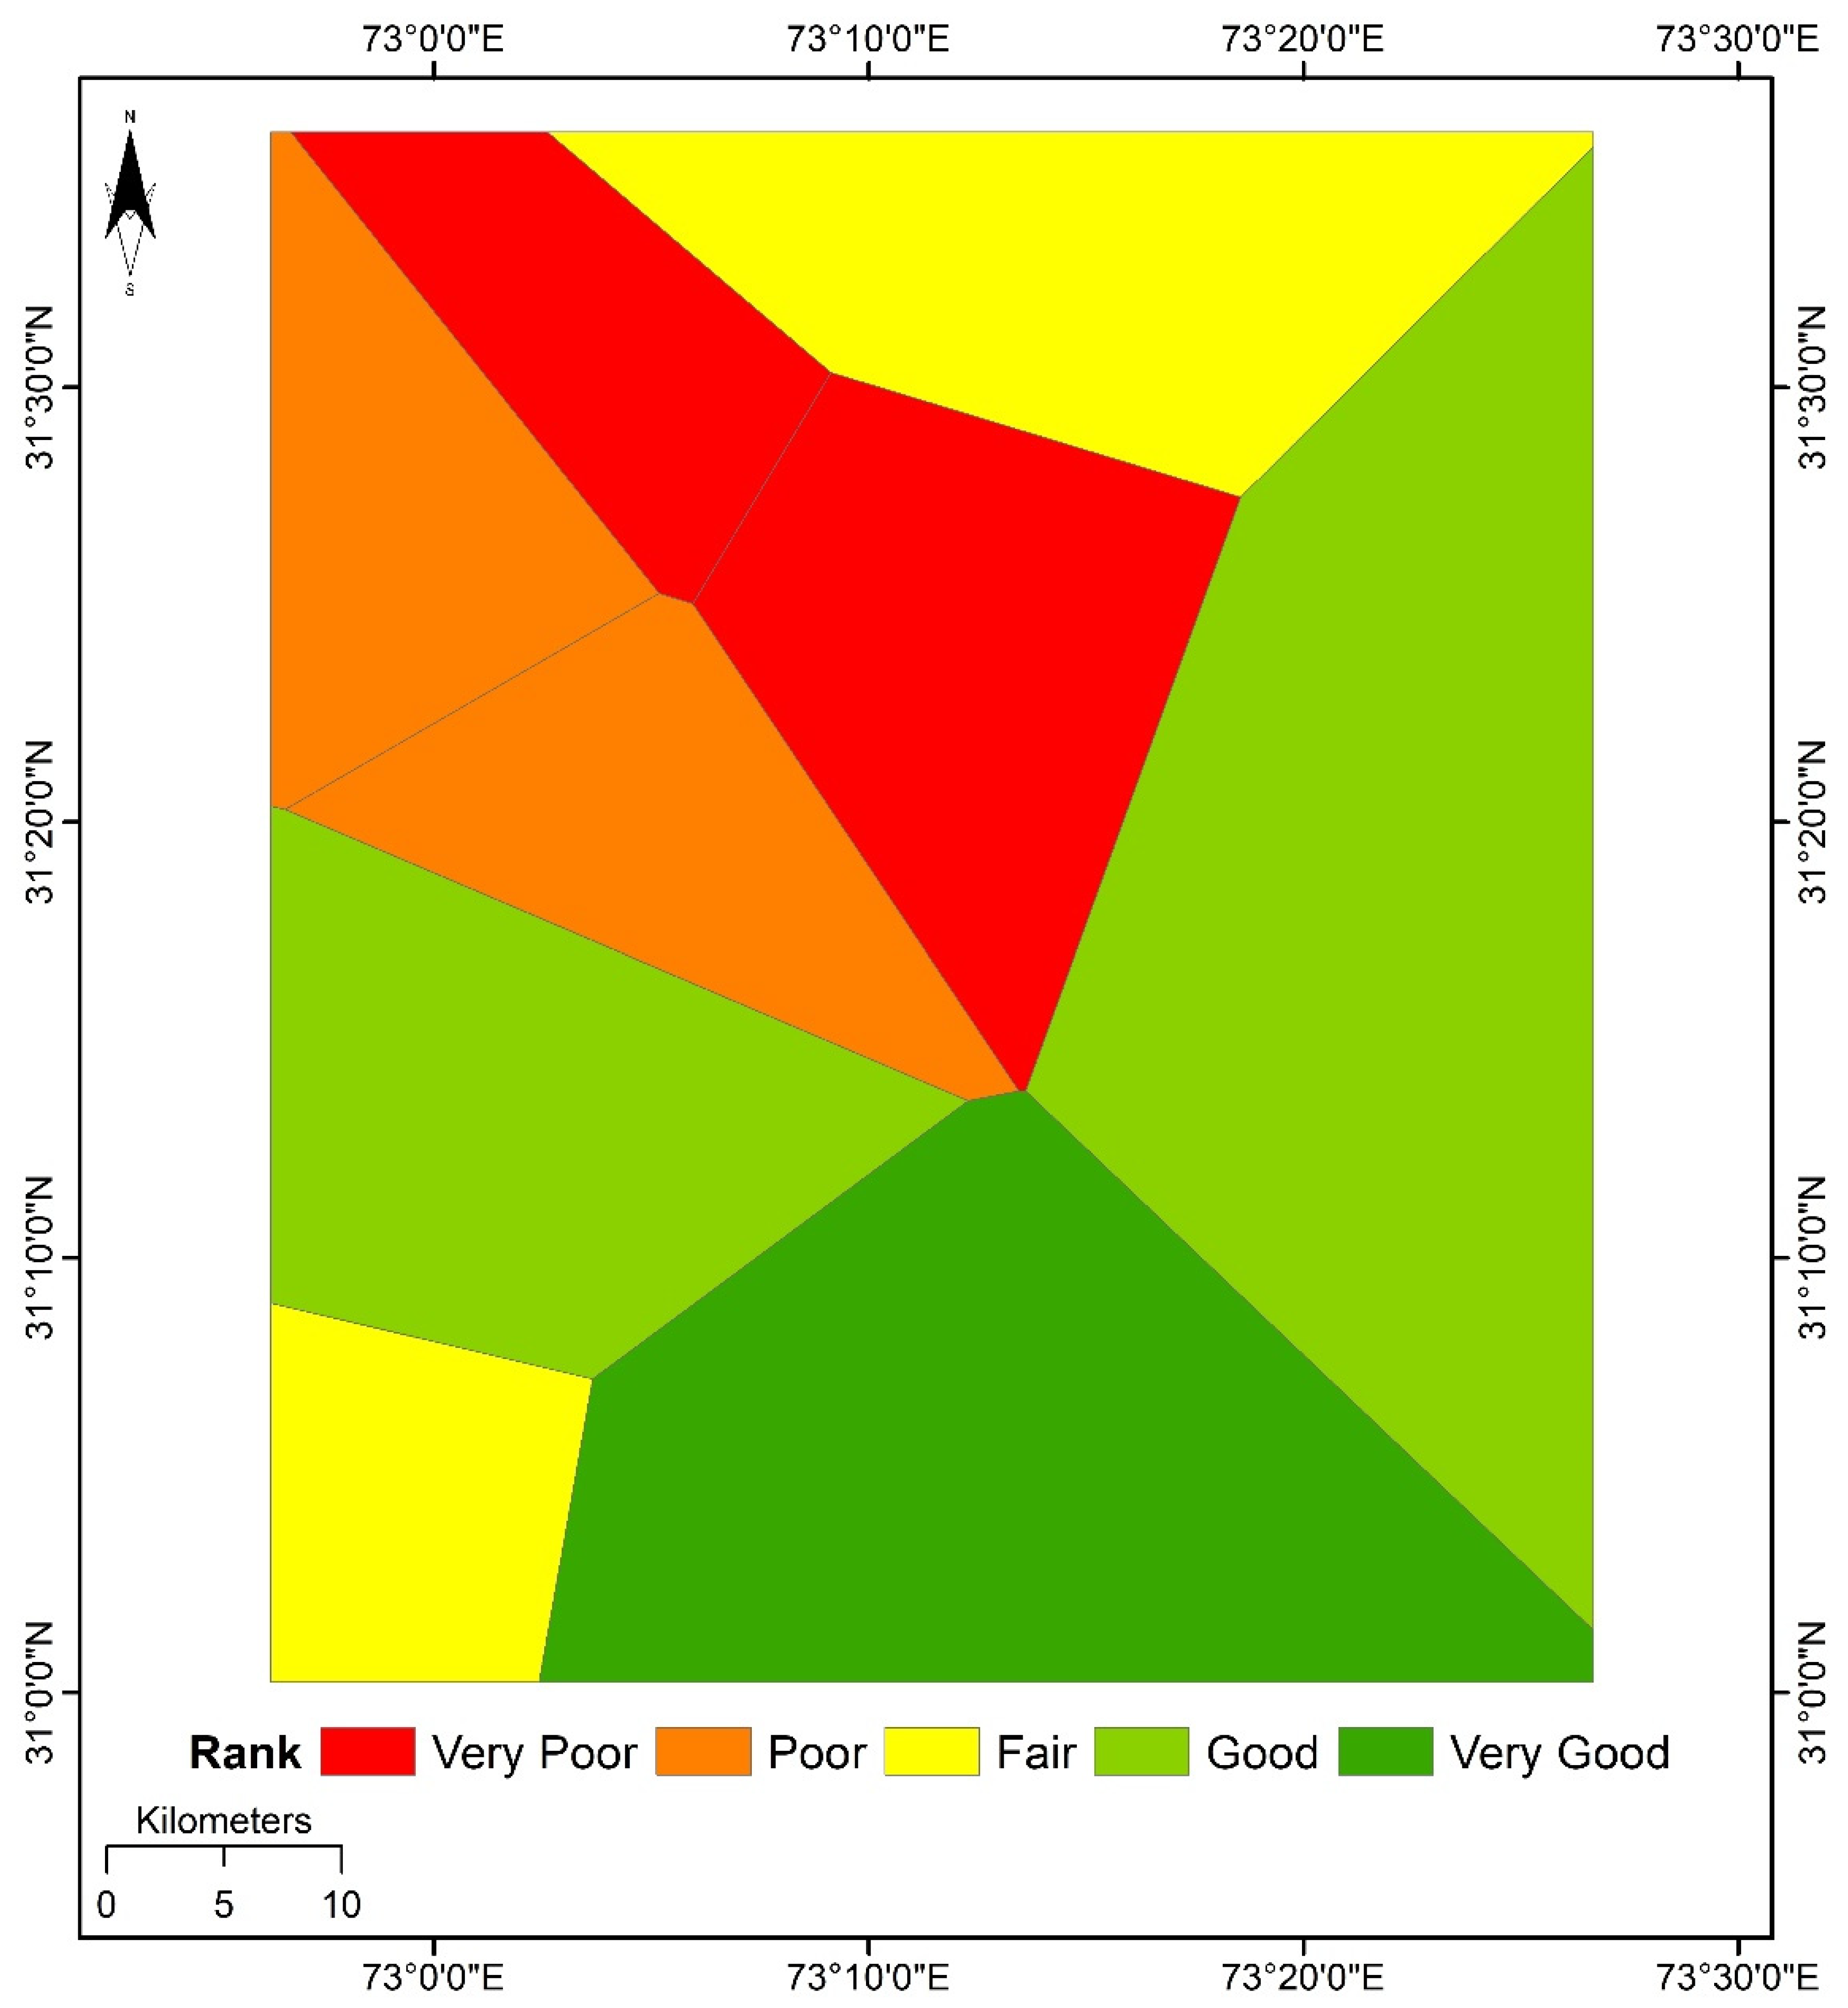
3.2. Creation of Theissen Polygons
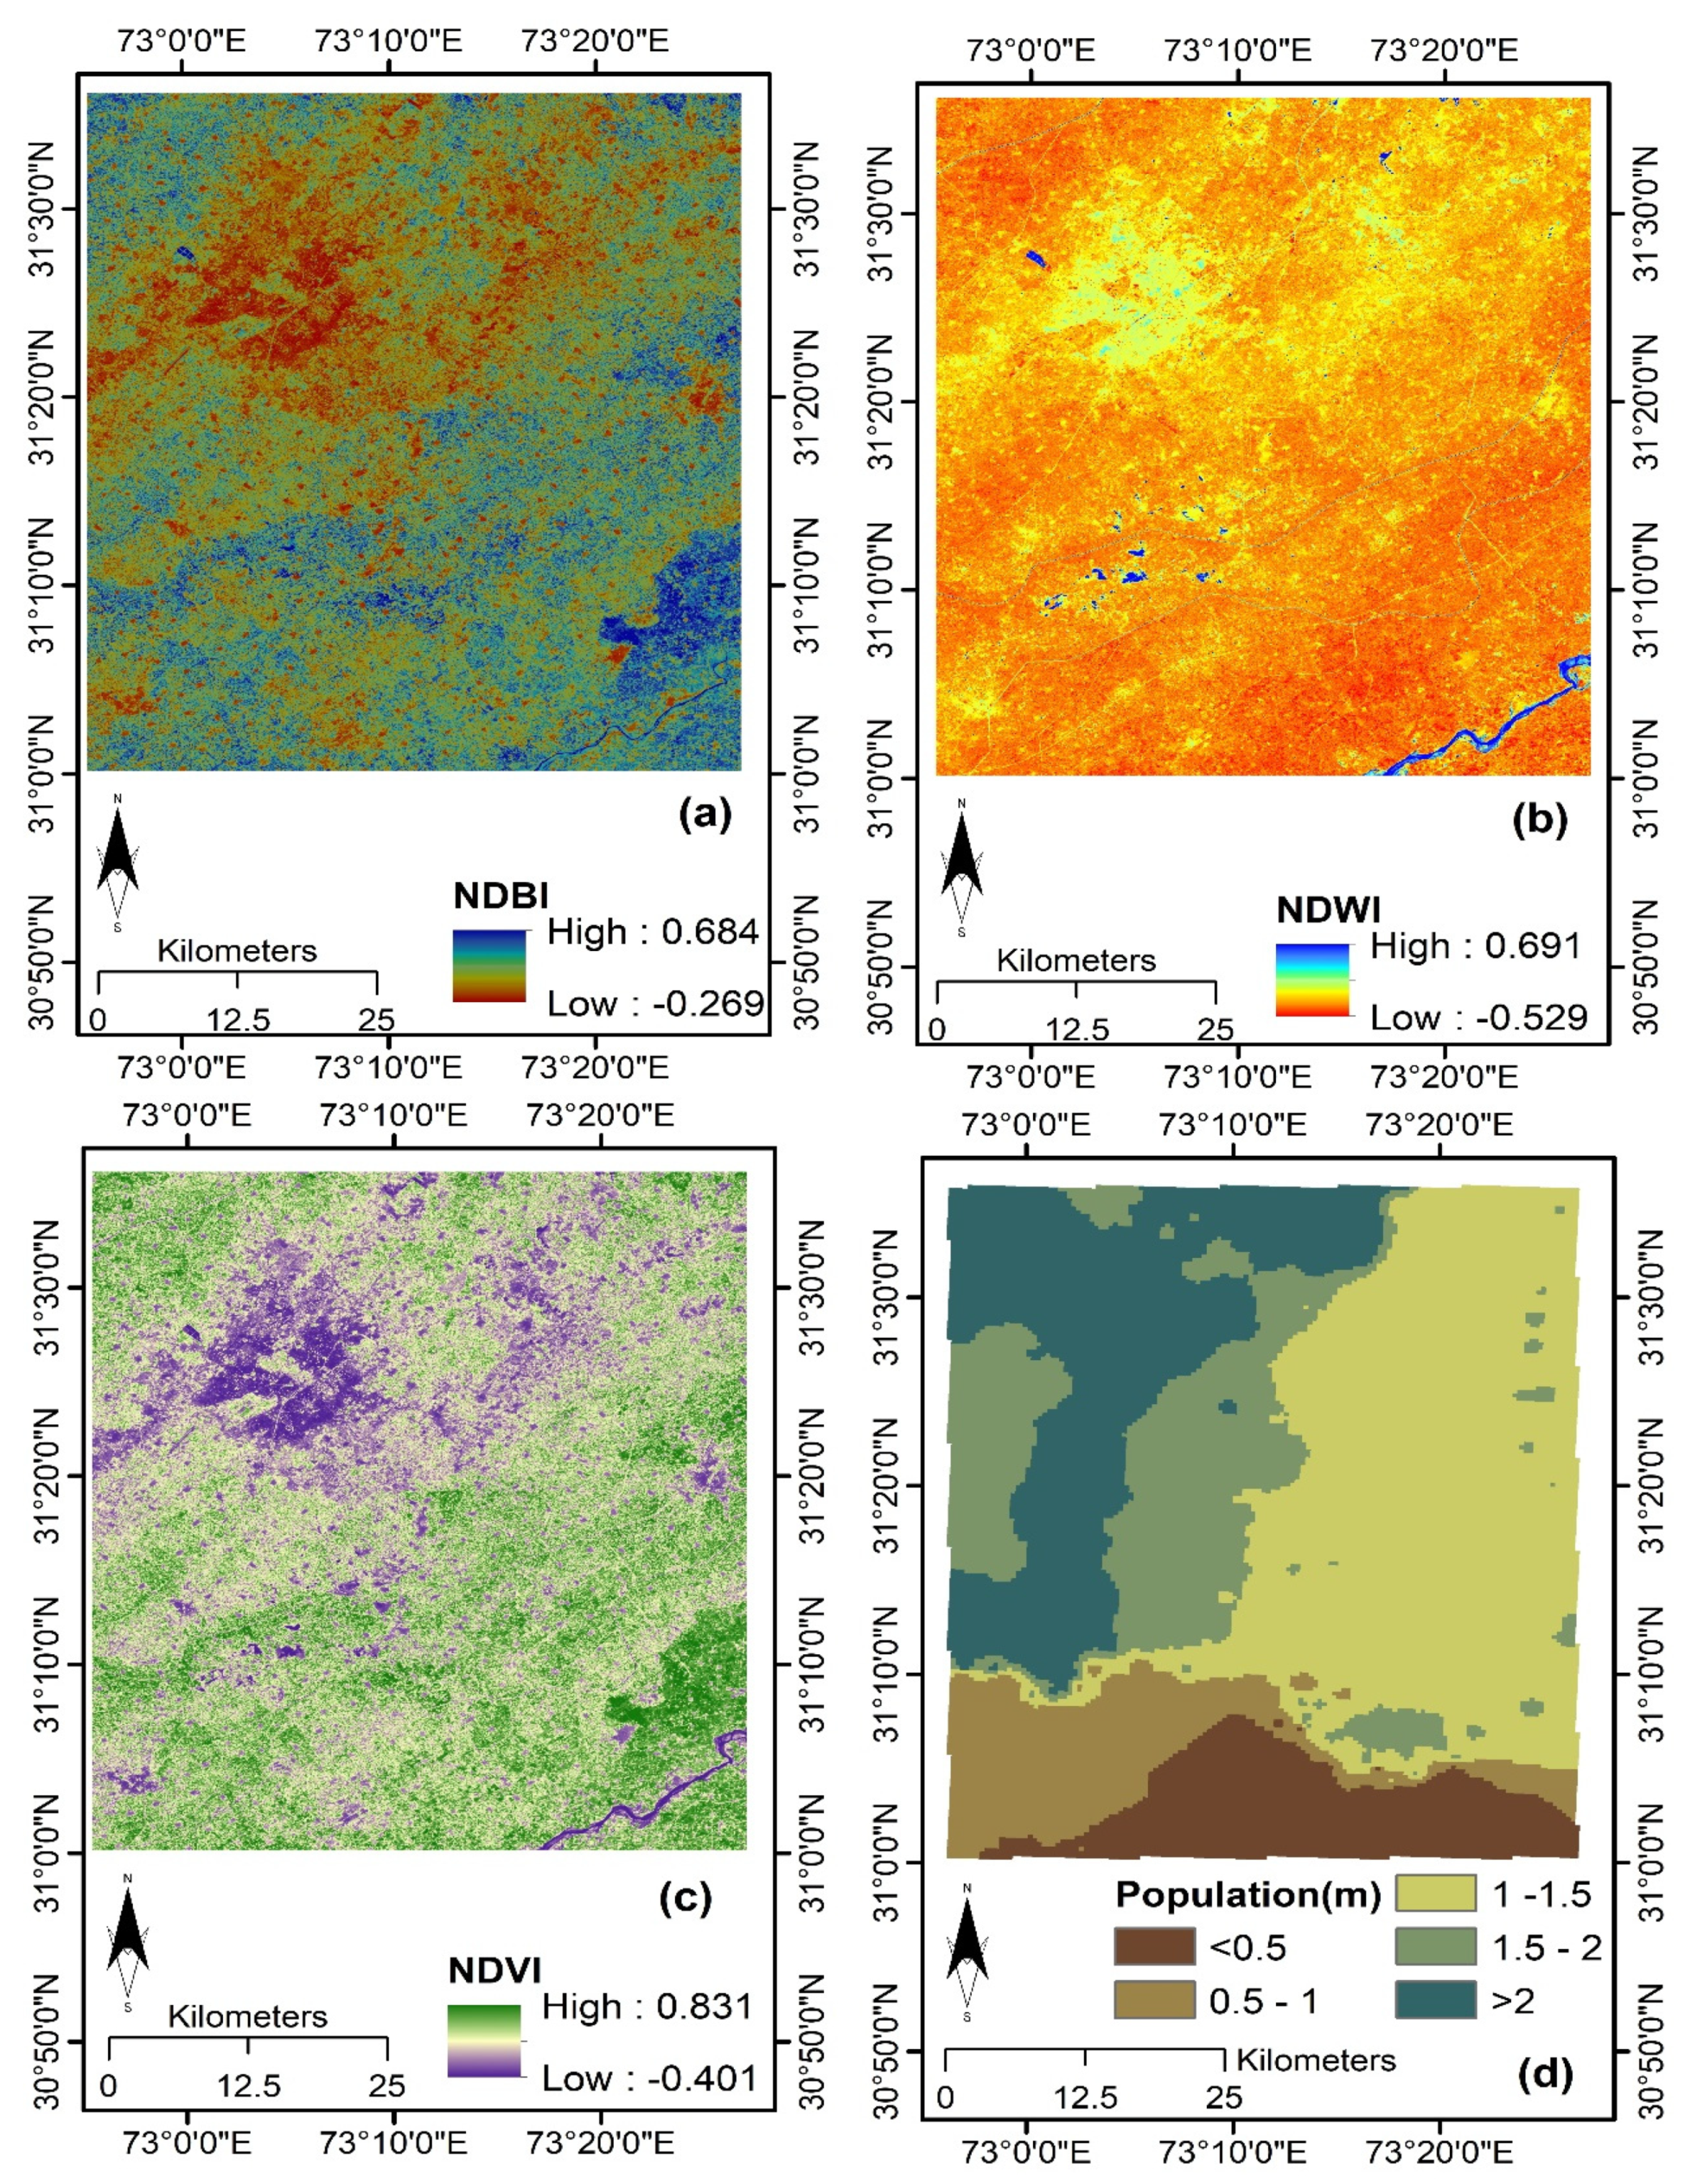
3.3. Remote Sensing Indices
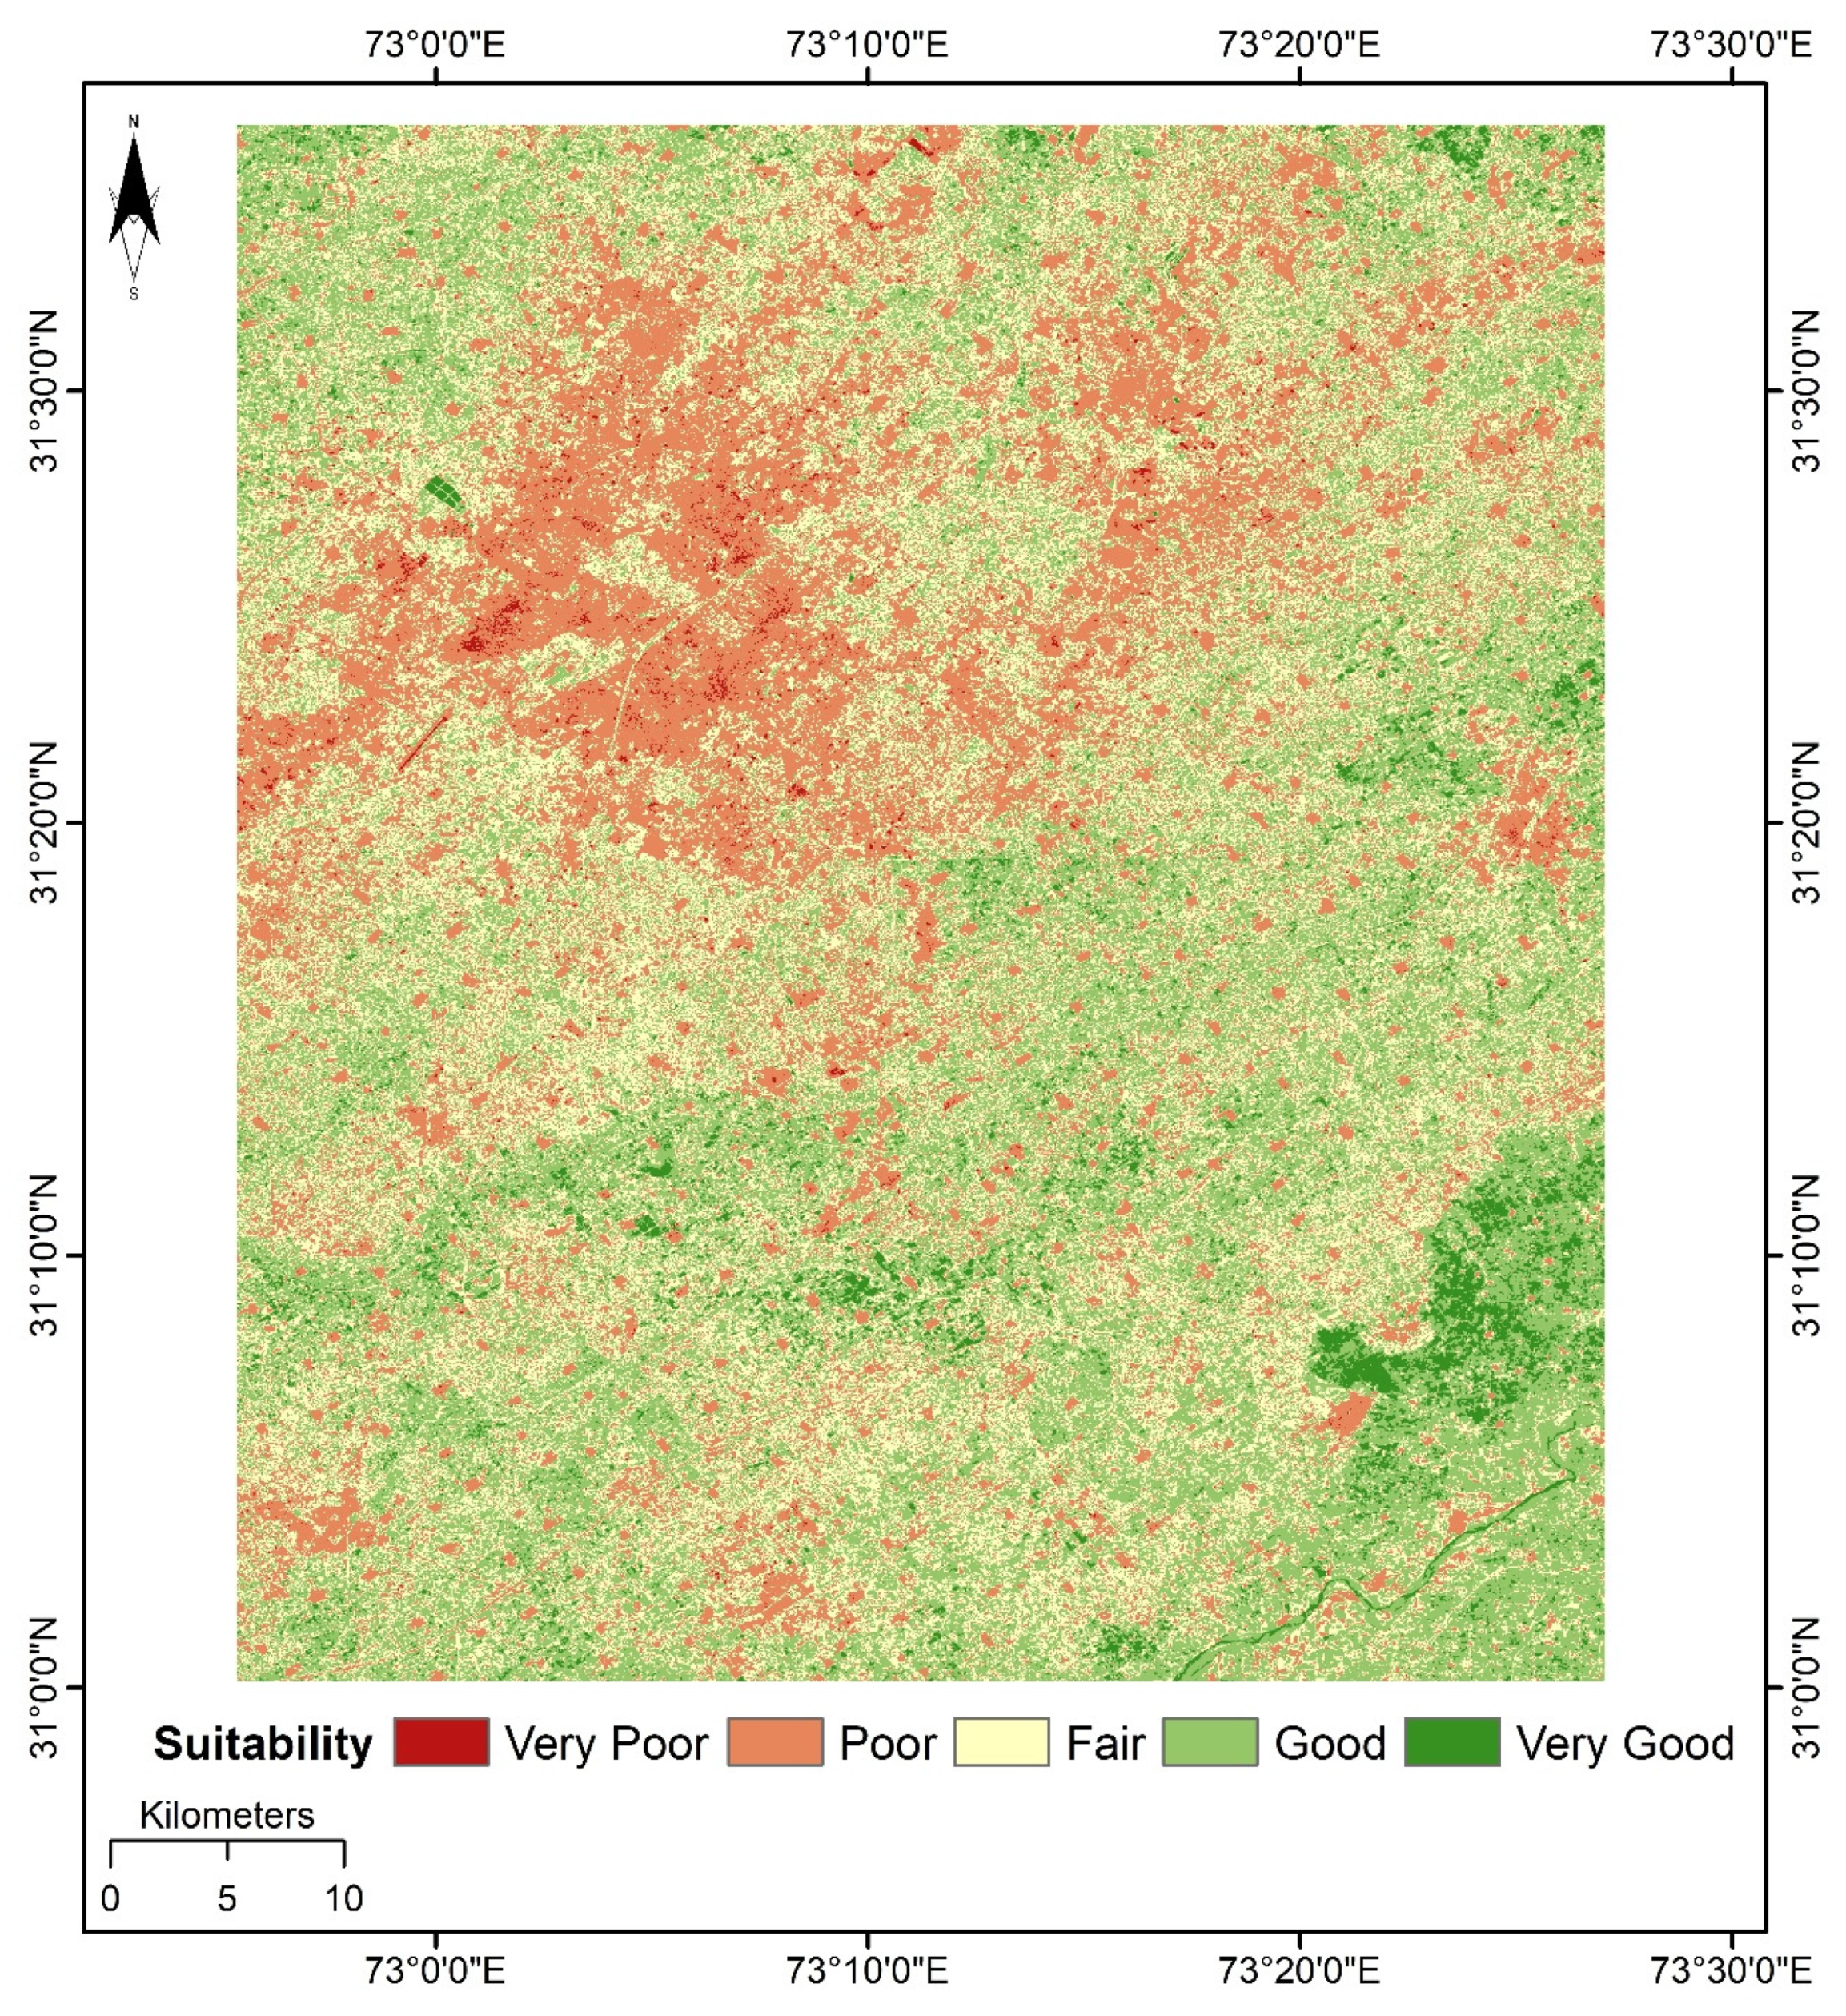
4. Results
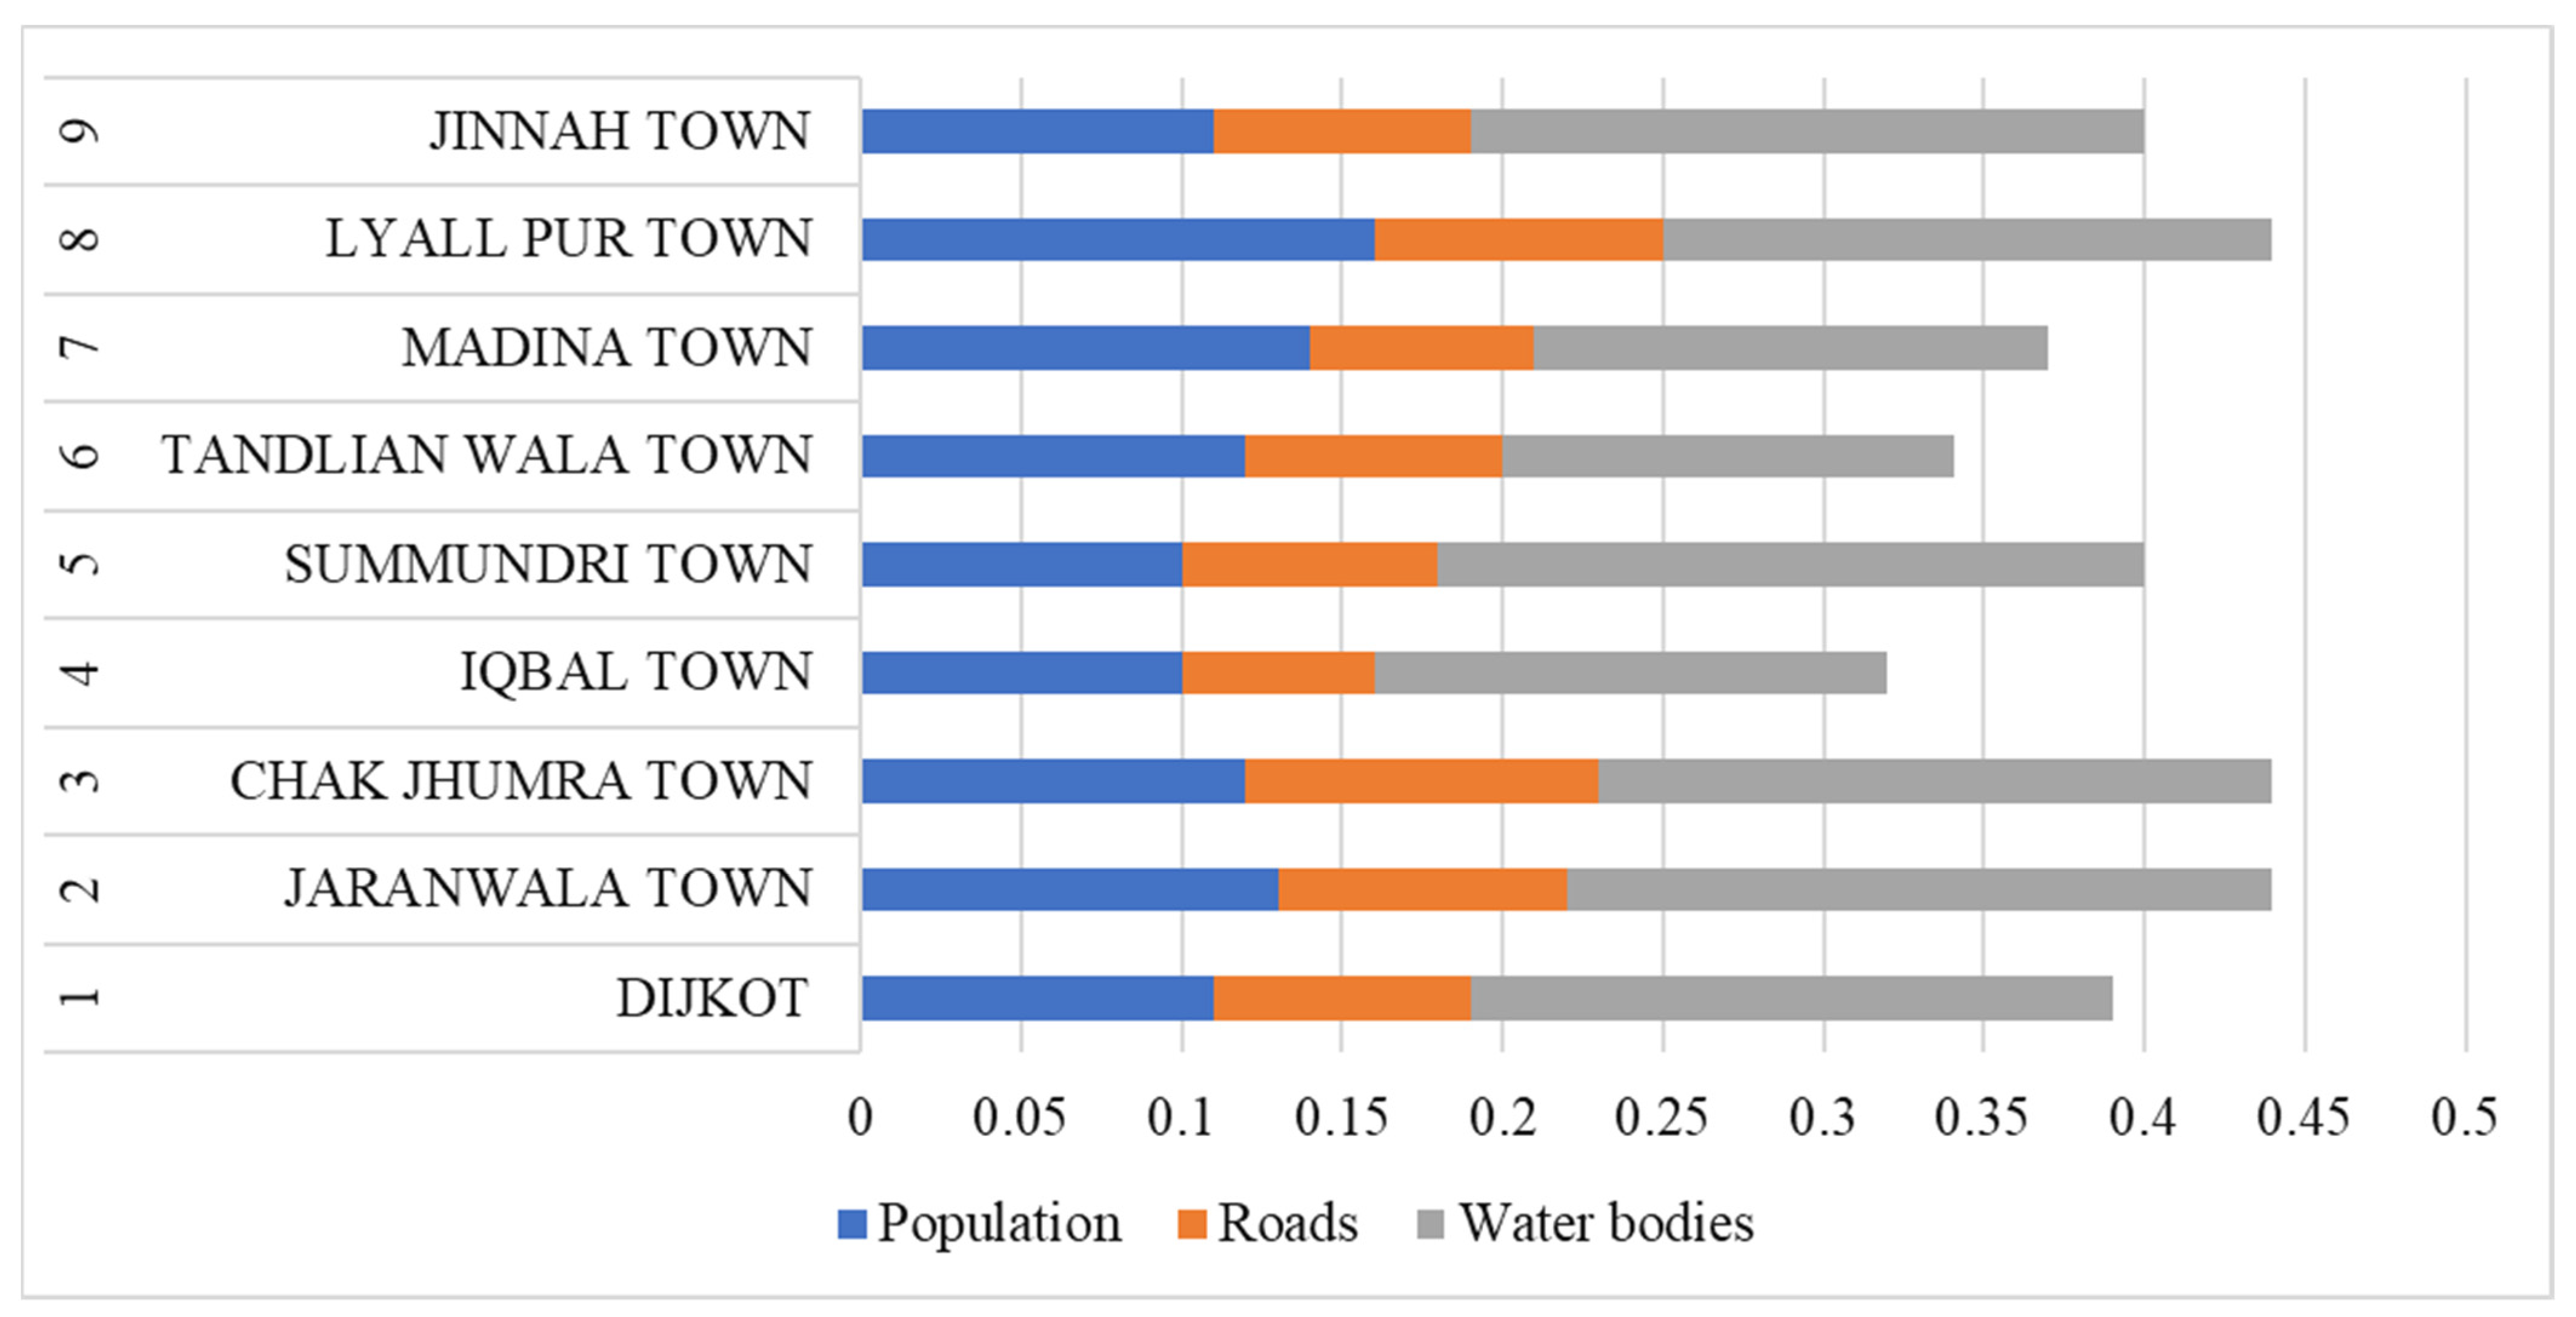
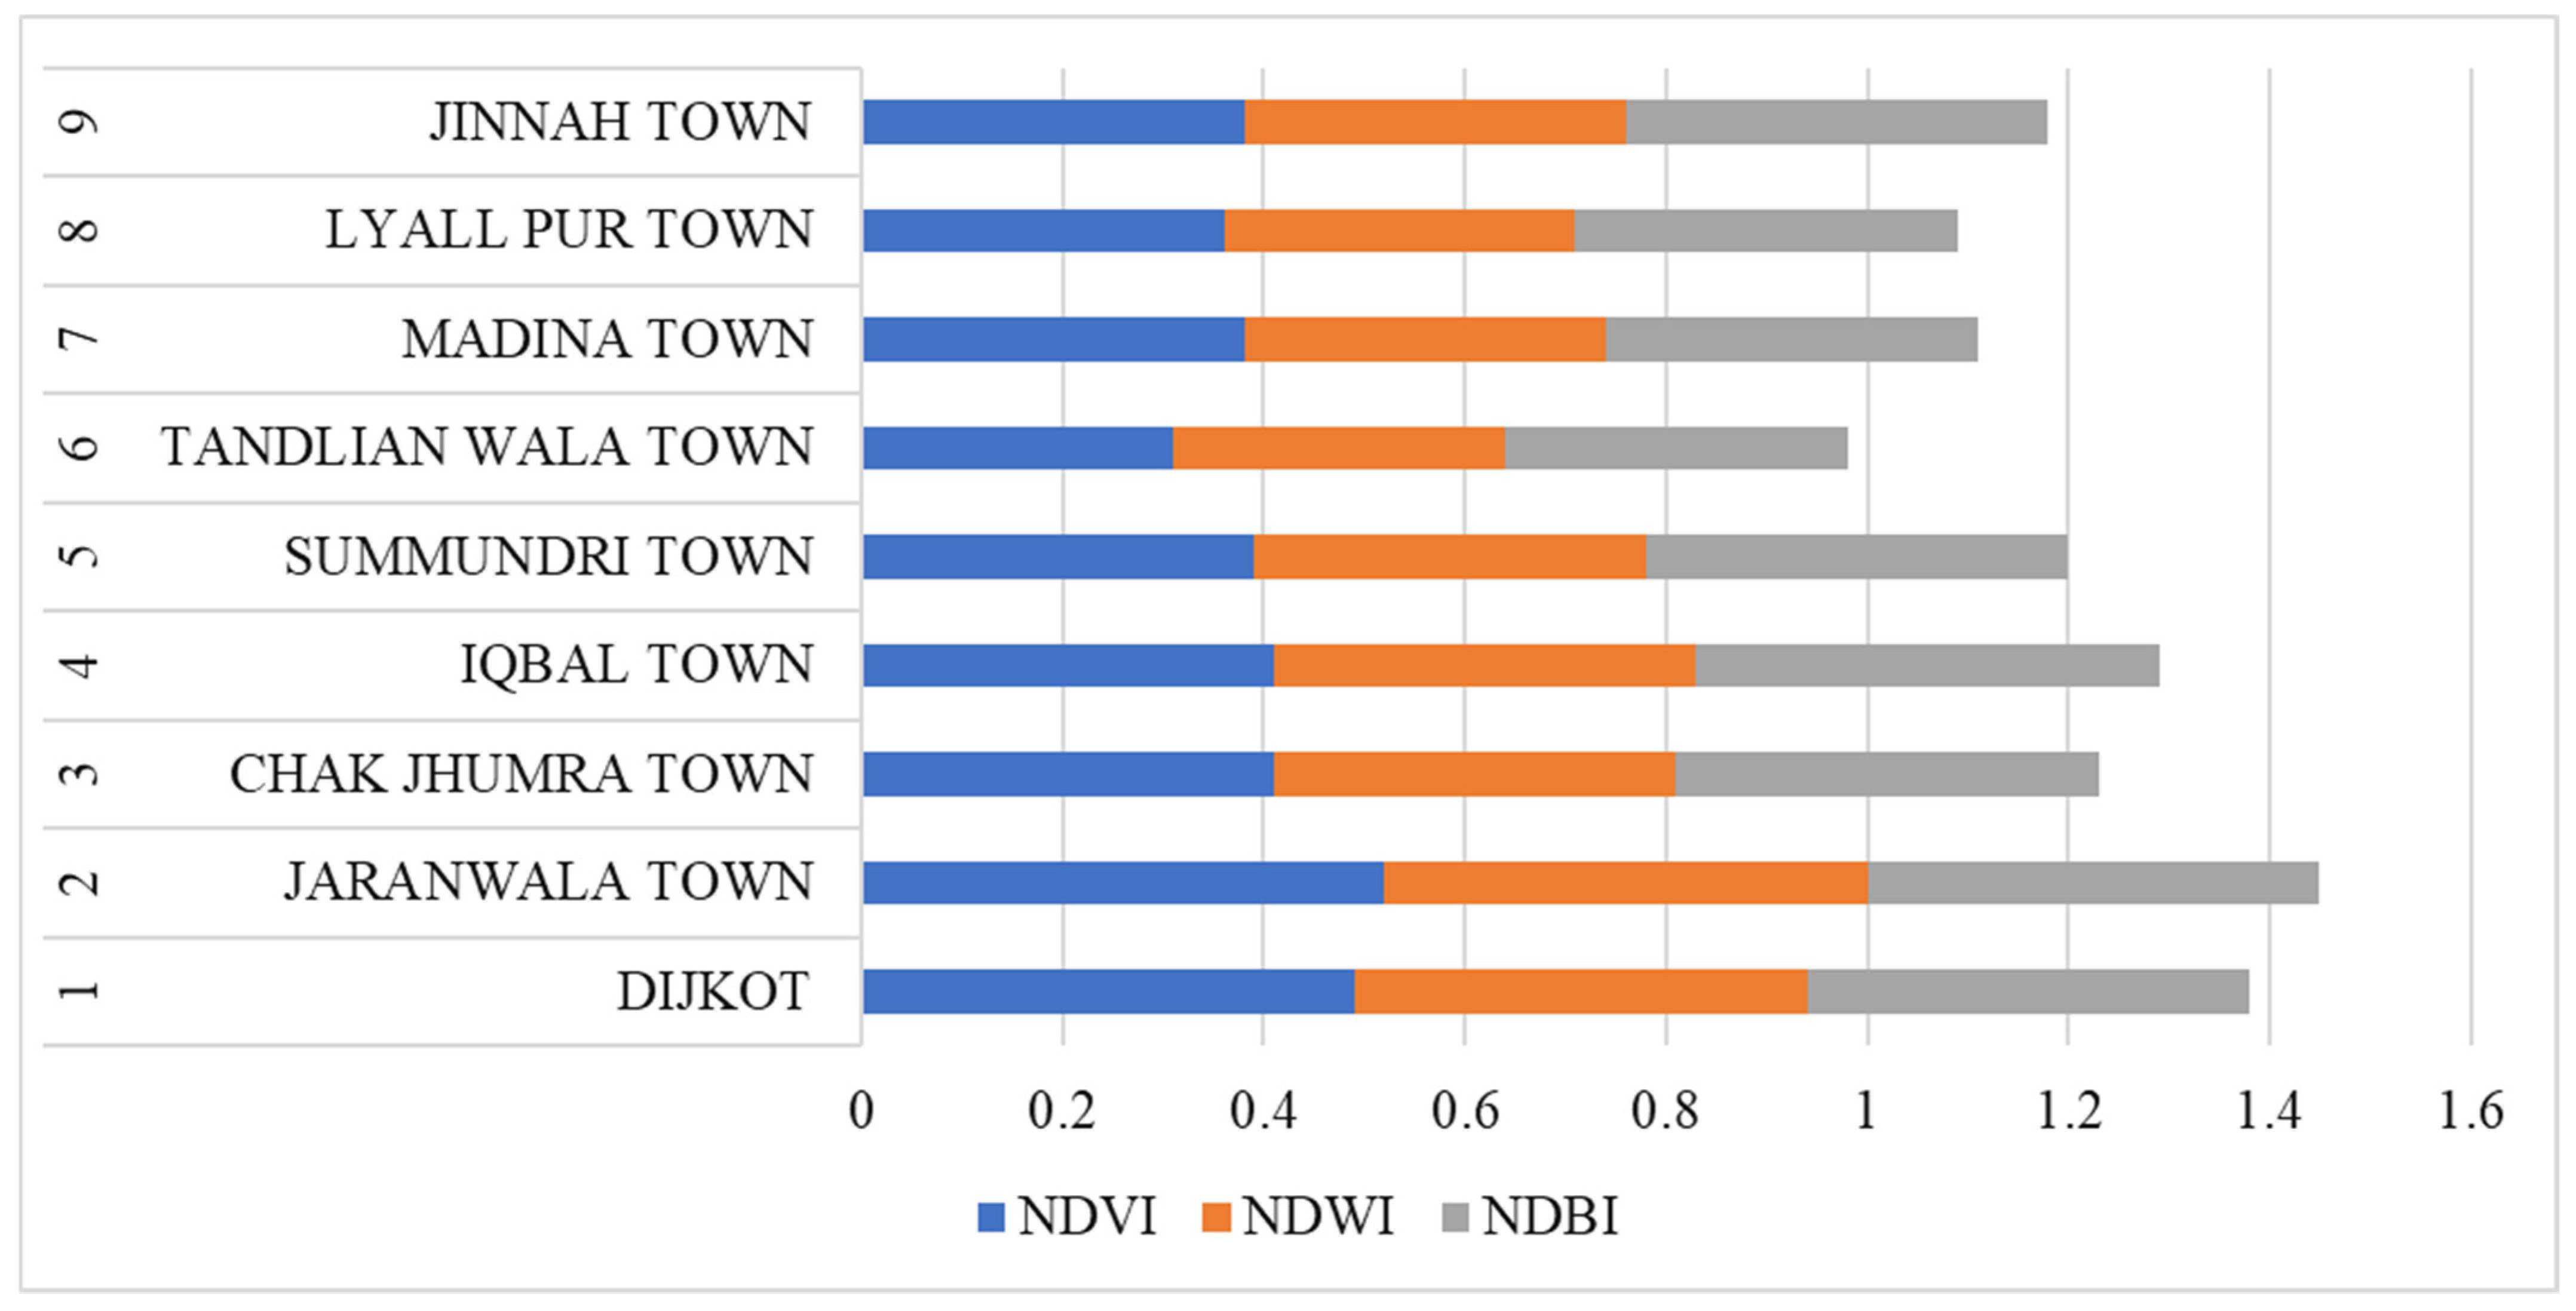
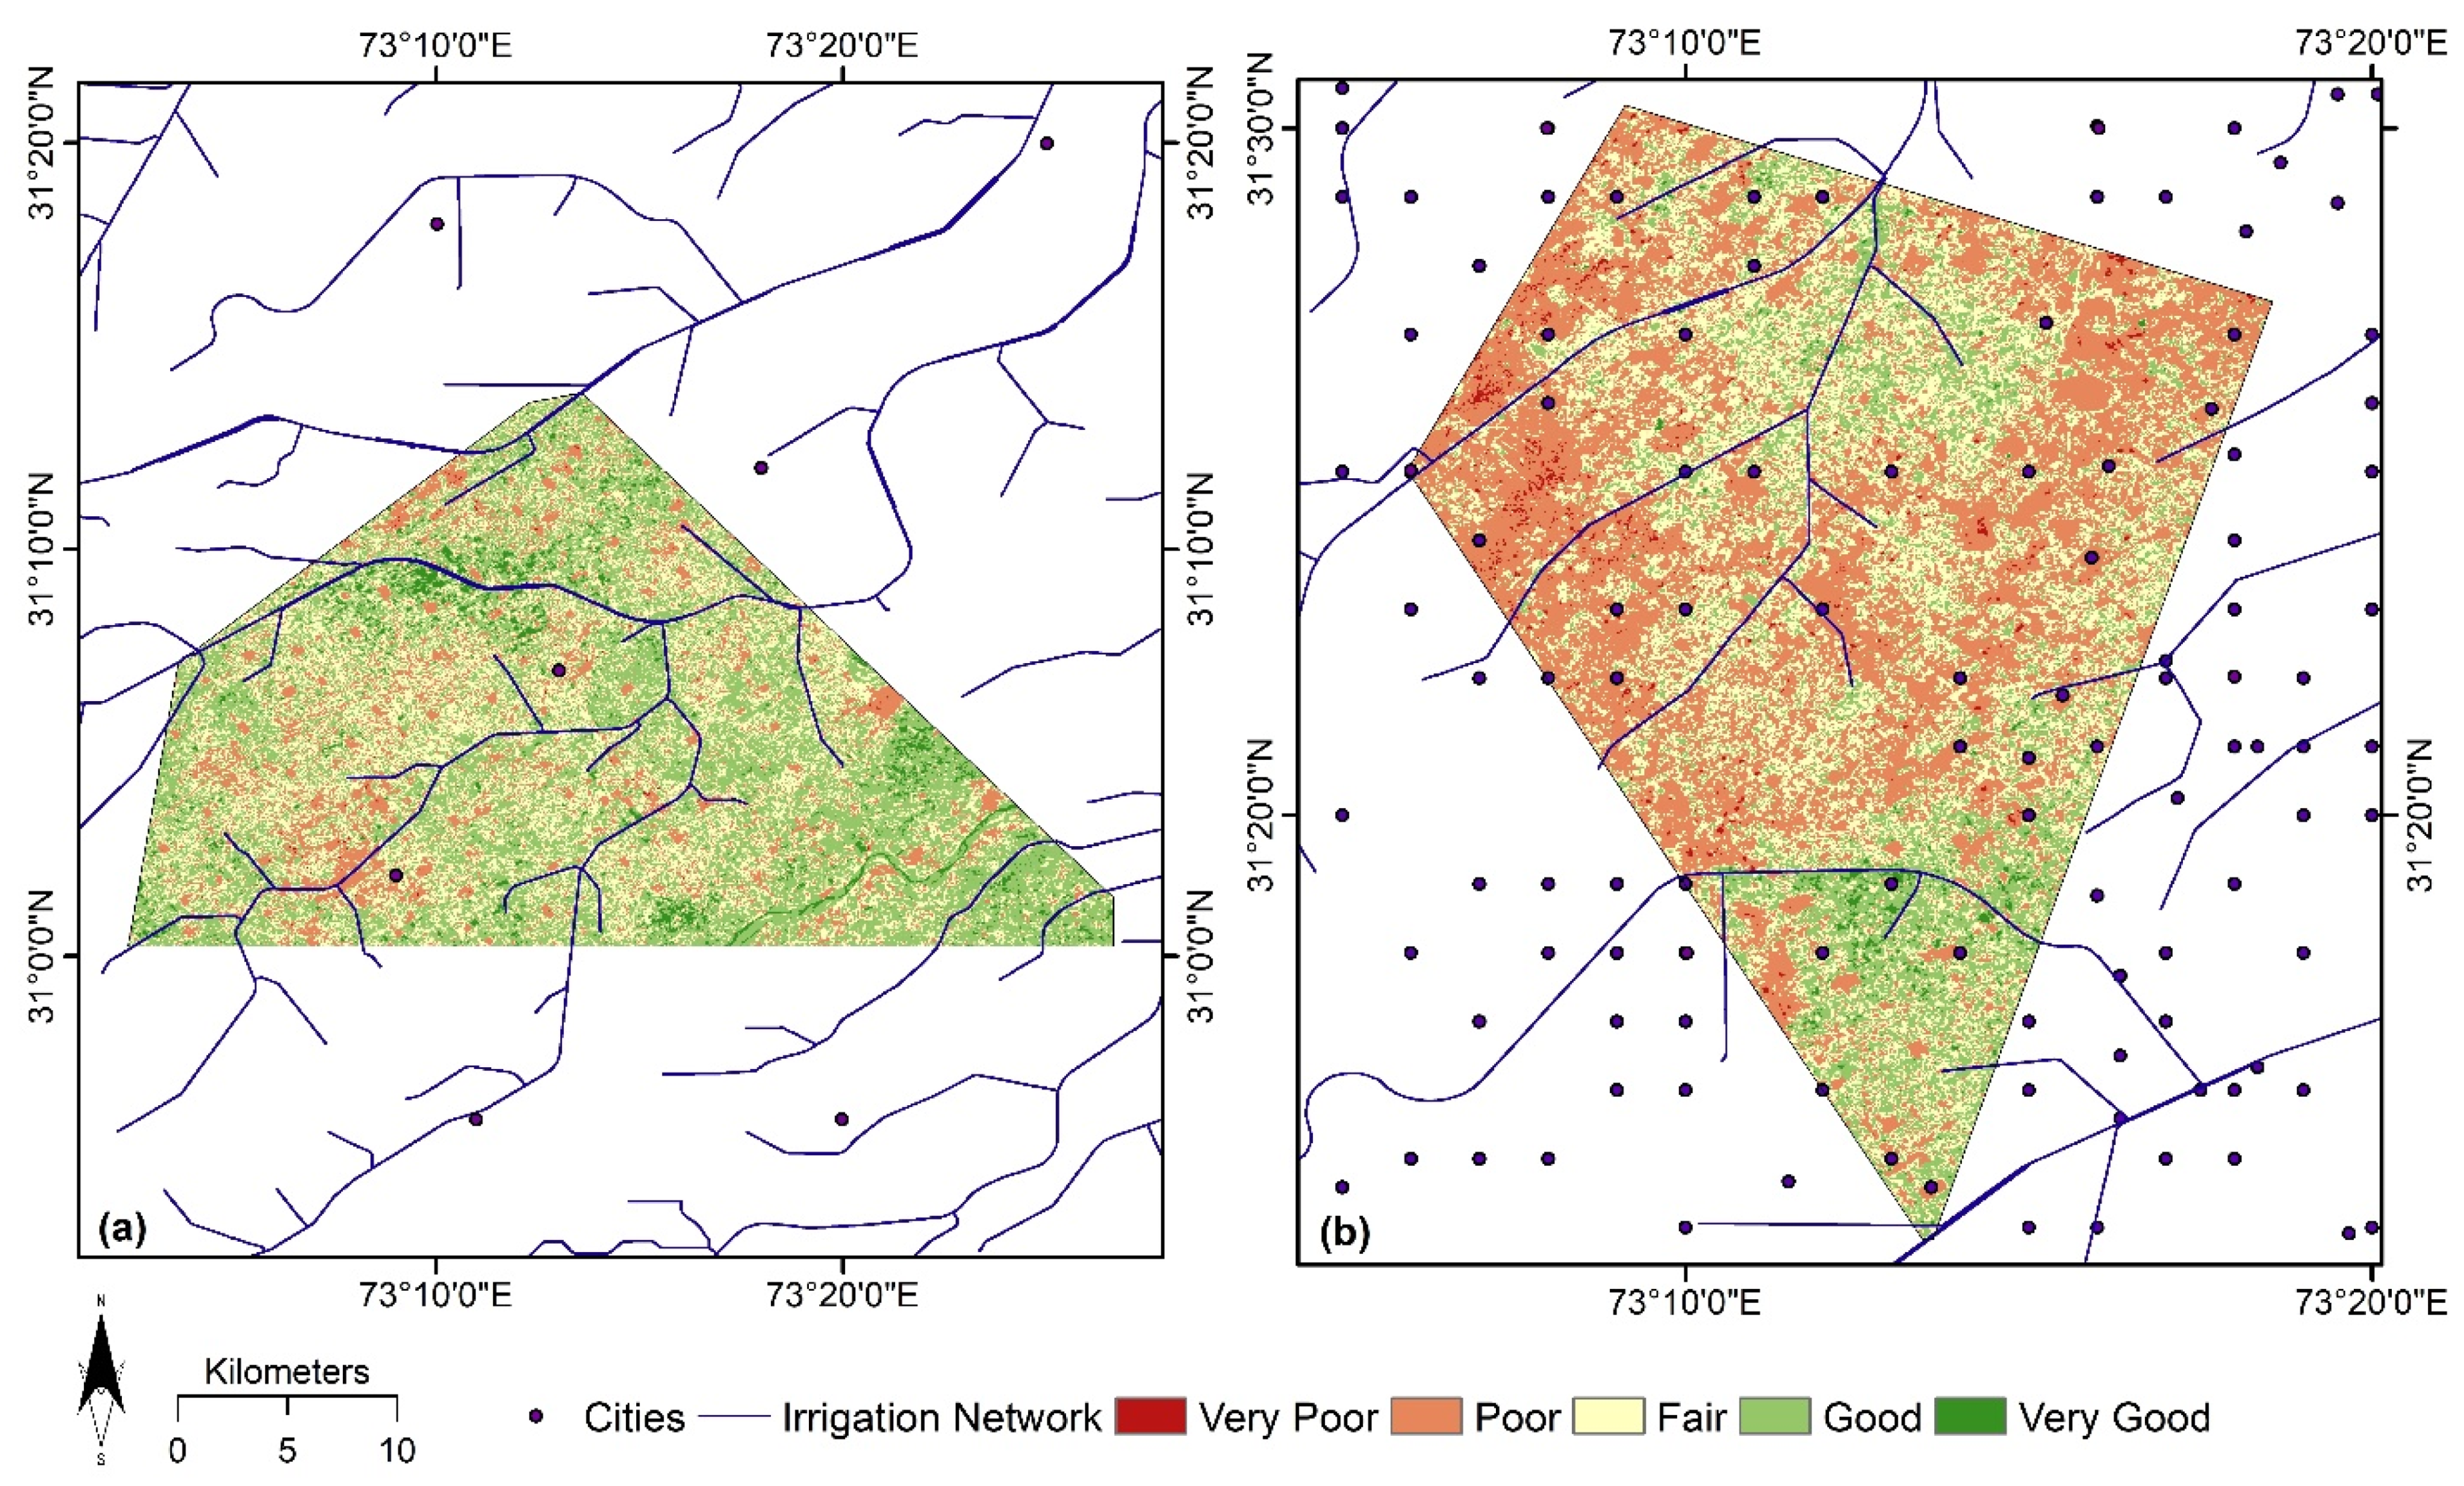
4.1. Average Ranked RS Indices and Vector Data
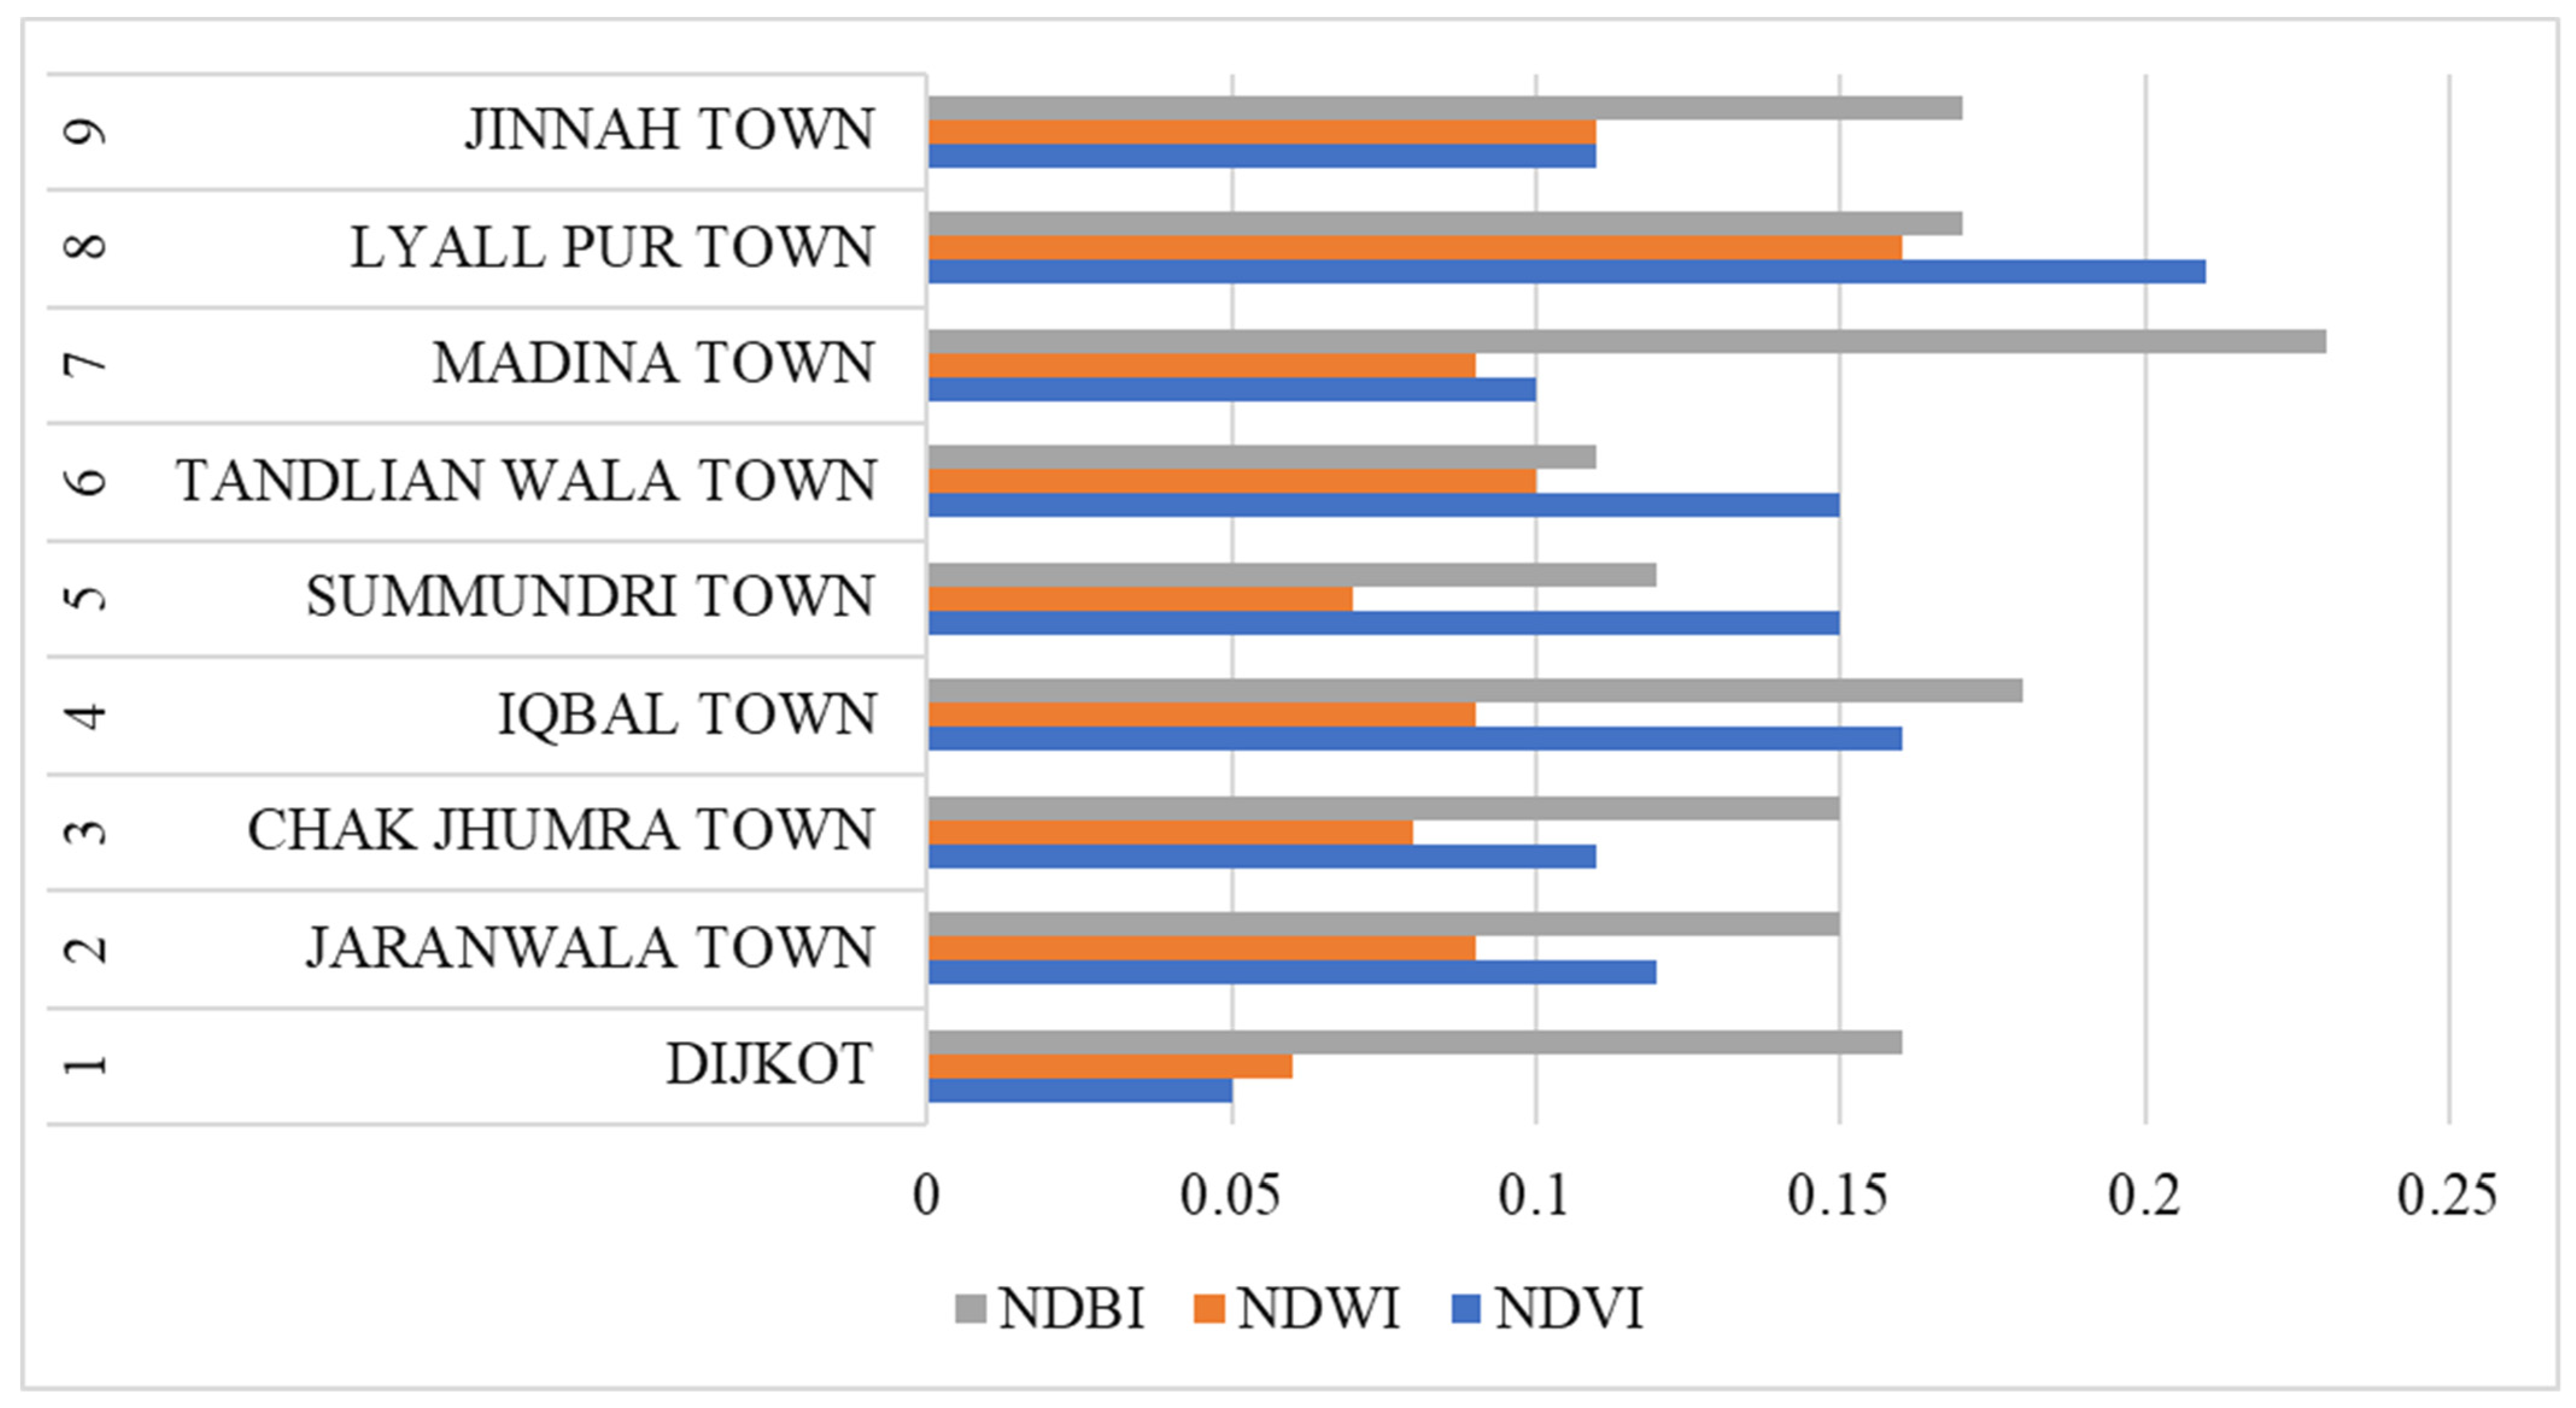
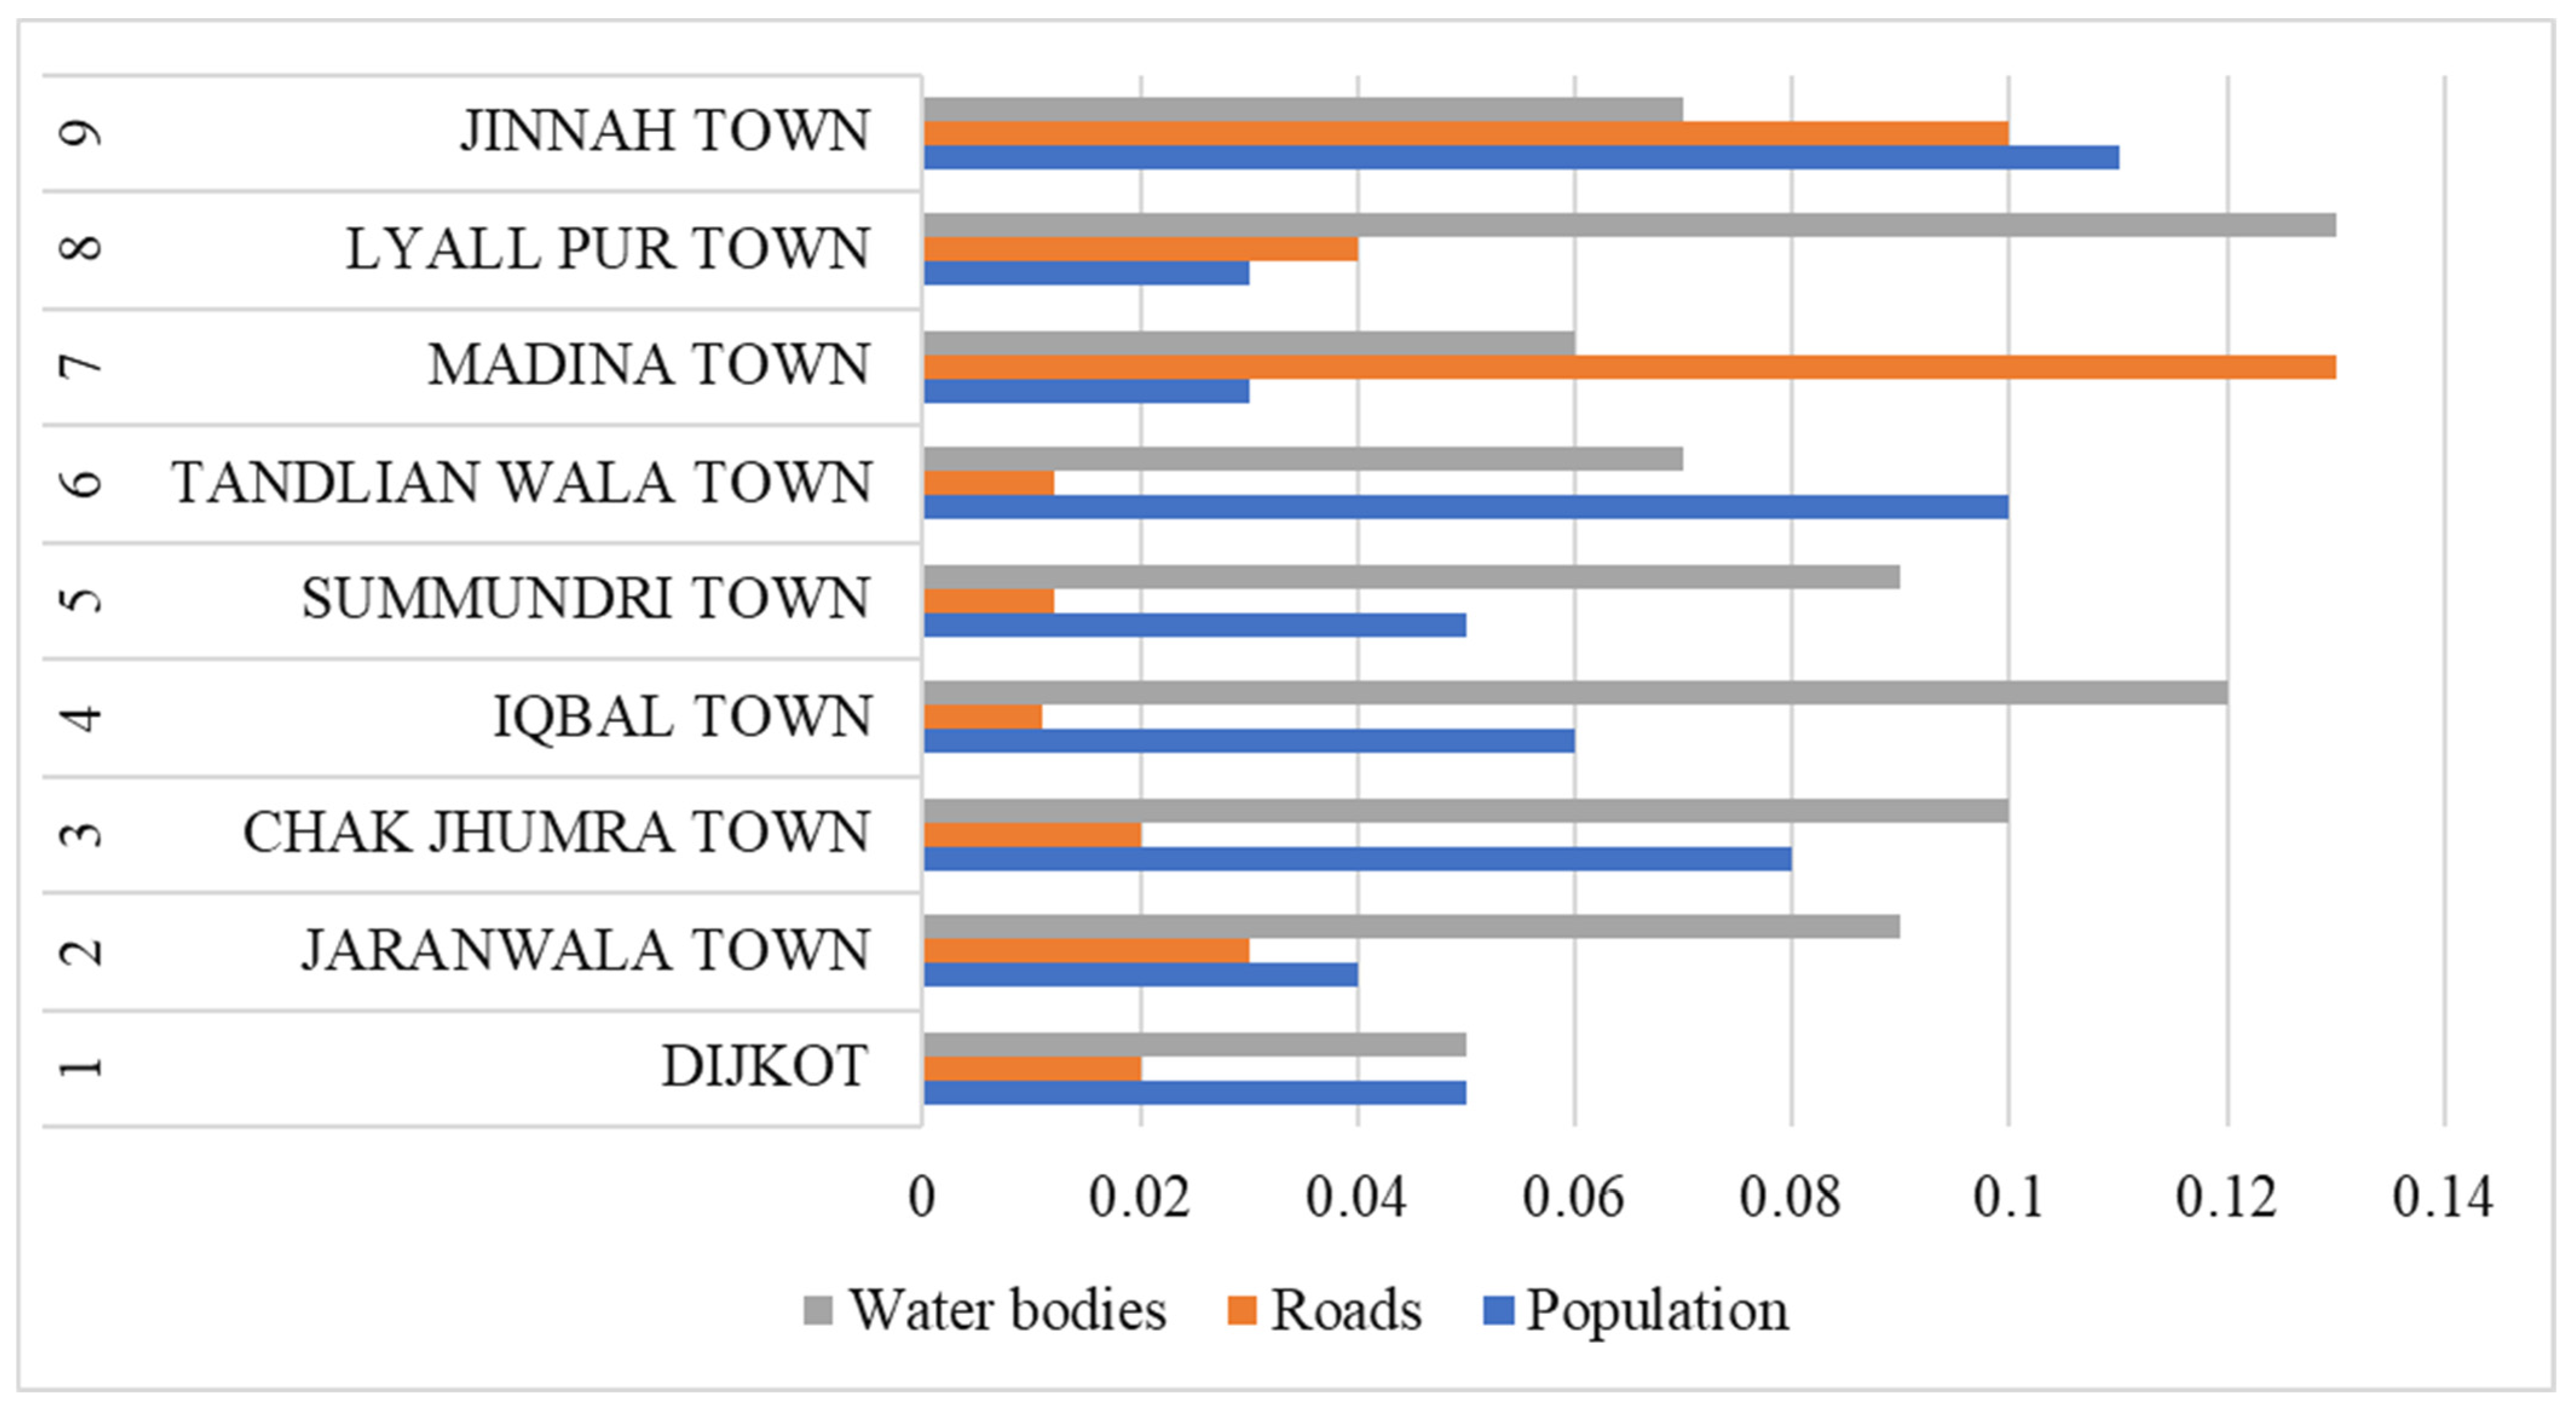
4.2. The Standard Deviation of RS Indices and Vector Data
5. Discussion
6. Conclusions
Author Contributions
Funding
Institutional Review Board Statement
Informed Consent Statement
Data Availability Statement
Acknowledgments
Conflicts of Interest
References
- Aksoy, E.; San, B.T. Geographical information systems (GIS) and multi-criteria decision analysis (MCDA) integration for sustainable landfill site selection considering dynamic data source. Bull. Eng. Geol. Environ. 2019, 78, 779–791. [Google Scholar] [CrossRef]
- Aslam, B.; Maqsoom, A.; Khalid, N.; Ullah, F.; Sepasgozar, S. Urban overheating assessment through prediction of surface temperatures: A case study of karachi, Pakistan. ISPRS Int. J. Geo-Inf. 2021, 10, 539. [Google Scholar] [CrossRef]
- Qayyum, S.; Ullah, F.; Al-Turjman, F.; Mojtahedi, M. Managing smart cities through six sigma DMADICV method: A review-based conceptual framework. Sustain. Cities Soc. 2021, 72, 103022. [Google Scholar] [CrossRef]
- Ullah, F.; Thaheem, M.J.; Siddiqui, S.Q.; Khurshid, M.B. Influence of Six Sigma on project success in construction industry of Pakistan. TQM J. 2017, 29, 276–309. [Google Scholar] [CrossRef]
- Hoornweg, D.; Bhada-Tata, P. What A Waste: A Global Review of Solid Waste Management. 2012. Available online: https://openknowledge.worldbank.org/handle/10986/17388 (accessed on 8 April 2022).
- Eskandari, M.; Homaee, M.; Mahmoodi, S.; Pazira, E.; Van Genuchten, M.T. Optimizing landfill site selection by using land classification maps. Environ. Sci. Pollut. Res. 2015, 22, 7754–7765. [Google Scholar] [CrossRef] [PubMed]
- Bande, L.; Alshamsi, A.; Alhefeiti, A.; Alderei, S.; Shaban, S.; Albattah, M.; Scoppa, M.D. Parametric design structures in low rise buildings in relation to the urban context in UAE. Sustainability 2021, 13, 8595. [Google Scholar] [CrossRef]
- Seng, B.; Kaneko, H.; Hirayama, K.; Katayama-Hirayama, K. Municipal solid waste management in Phnom Penh, capital city of Cambodia. Waste Manag. Res. 2011, 29, 491–500. [Google Scholar] [CrossRef]
- Ghosh, S.K. Circular Economy: Global Perspective; Springer: Berlin, Germany, 2020. [Google Scholar]
- USCB. World Population Clock; United States Census Bureau: Washington, DC, USA, 2020; p. 323.
- Catarinucci, L.; Colella, R.; Consalvo, S.I.; Patrono, L.; Salvatore, A.; Sergi, I. IoT-oriented waste management system based on new RFID-sensing devices and cloud technologies. In Proceedings of the 2019 4th IEEE International Conference on Smart and Sustainable Technologies (SpliTech), Split, Croatia, 18–21 June 2019; pp. 1–5. [Google Scholar]
- Balaban, Y.; Birdoğan, B. Analitik Ağ Süreci Yaklaşimiyla En Uygun Kati Atik Bertaraf Sisteminin Belirlenmesi: Trabzon Ili örneği. Atatürk Üniv. İktisadi İdari Bil. Derg. 2010, 24, 183–197. [Google Scholar]
- Kolay, U.E. Alternatif Katı Atık Deponi Alanlarının Yer Seçiminde Coğrafi Bilgi Sistemi Tabanlı Örnek Bir Uygulama. Master’s Thesis, Fen Bilimleri Enstitüsü, Ankara, Turkey, 2012. [Google Scholar]
- Erdoğan, M.; Kaya, I. Evaluating Alternative-Fuel Busses for Public Transportation in Istanbul Using Interval Type-2 Fuzzy AHP and TOPSIS. J. Mult.-Valued Log. Soft Comput. 2016, 26, 625–642. [Google Scholar]
- Rahimi, S.; Hafezalkotob, A.; Monavari, S.M.; Hafezalkotob, A.; Rahimi, R. Sustainable landfill site selection for municipal solid waste based on a hybrid decision-making approach: Fuzzy group BWM-MULTIMOORA-GIS. J. Clean. Prod. 2020, 248, 119186. [Google Scholar] [CrossRef]
- Batool, S.A.; Chuadhry, M.N. The impact of municipal solid waste treatment methods on greenhouse gas emissions in Lahore, Pakistan. Waste Manag. 2009, 29, 63–69. [Google Scholar] [CrossRef] [PubMed]
- Giusti, L. A review of waste management practices and their impact on human health. Waste Manag. 2009, 29, 2227–2239. [Google Scholar] [CrossRef] [PubMed]
- Hamer, G. Solid waste treatment and disposal: Effects on public health and environmental safety. Biotechnol. Adv. 2003, 22, 71–79. [Google Scholar] [CrossRef] [PubMed]
- Kumar, A.; Samadder, S. Performance evaluation of anaerobic digestion technology for energy recovery from organic fraction of municipal solid waste: A review. Energy 2020, 197, 117253. [Google Scholar] [CrossRef]
- Salman, C.A.; Schwede, S.; Thorin, E.; Yan, J. Predictive modelling and simulation of integrated pyrolysis and anaerobic digestion process. Energy Procedia 2017, 105, 850–857. [Google Scholar] [CrossRef]
- Wang, H.; Xu, J.; Yu, H.; Liu, X.; Yin, W.; Liu, Y.; Liu, Z.; Zhang, T. Study of the application and methods for the comprehensive treatment of municipal solid waste in northeastern China. Renew. Sustain. Energy Rev. 2015, 52, 1881–1889. [Google Scholar] [CrossRef]
- Ferronato, N.; Torretta, V.; Ragazzi, M.; Rada, E.C. Waste mismanagement in developing countries: A case study of environmental contamination. UPB Sci. Bull. 2017, 79, 185–196. [Google Scholar]
- Karimi, H.; Amiri, S.; Huang, J.; Karimi, A. Integrating GIS and multi-criteria decision analysis for landfill site selection, case study: Javanrood County in Iran. Int. J. Environ. Sci. Technol. 2019, 16, 7305–7318. [Google Scholar] [CrossRef]
- Siddiqui, M.Z.; Everett, J.W.; Vieux, B.E. Landfill siting using geographic information systems: A demonstration. J. Environ. Eng. 1996, 122, 515–523. [Google Scholar] [CrossRef]
- Lober, D.J. Resolving the siting impasse: Modeling social and environmental locational criteria with a geographic information system. J. Am. Plan. Assoc. 1995, 61, 482–495. [Google Scholar] [CrossRef]
- Lokahita, B.; Takahashi, F. Prospect of Landfill Mining in Indonesia for Energy Recovery; Tokyo Institute of Technology: Tokyo, Japan, 2016. [Google Scholar]
- Parker, L. A Whopping 91% of Plastic Isn’t Recycled; National Geographic: Washington, DC, USA, 2018. [Google Scholar]
- Kreith, F.; Tchobanoglous, G. Handbook of Solid Waste Management; McGraw-Hill: New York, NY, USA, 2002. [Google Scholar]
- Powell, J.T.; Chertow, M.R.; Esty, D.C. Where is global waste management heading? An analysis of solid waste sector commitments from nationally-determined contributions. Waste Manag. 2018, 80, 137–143. [Google Scholar] [CrossRef] [PubMed]
- Chabuk, A.J.; Al-Ansari, N.; Hussain, H.M.; Knutsson, S.; Pusch, R. GIS-based assessment of combined AHP and SAW methods for selecting suitable sites for landfill in Al-Musayiab Qadhaa, Babylon, Iraq. Environ. Earth Sci. 2017, 76, 209. [Google Scholar] [CrossRef] [Green Version]
- Idowu, I.A.; Atherton, W.; Hashim, K.; Kot, P.; Alkhaddar, R.; Alo, B.I.; Shaw, A. An analyses of the status of landfill classification systems in developing countries: Sub Saharan Africa landfill experiences. Waste Manag. 2019, 87, 761–771. [Google Scholar] [CrossRef] [PubMed]
- Nabavi-Pelesaraei, A.; Bayat, R.; Hosseinzadeh-Bandbafha, H.; Afrasyabi, H.; Chau, K.-W. Modeling of energy consumption and environmental life cycle assessment for incineration and landfill systems of municipal solid waste management-A case study in Tehran Metropolis of Iran. J. Clean. Prod. 2017, 148, 427–440. [Google Scholar] [CrossRef]
- Johansson, N.; Krook, J.; Eklund, M. The institutional capacity for a resource transition—A critical review of Swedish governmental commissions on landfill mining. Environ. Sci. Policy 2017, 70, 46–53. [Google Scholar] [CrossRef] [Green Version]
- Albattah, M.; Roucheray, M.; Hallowell, M. Sustainable buildings: Applying prevention through design. Prof. Saf. 2013, 58, 76–80. [Google Scholar]
- Haeming, H.; Bretthauer, F.; Heyer, K.-U.; Stegmann, R.; Quicker, P. Waste, 8. Landfilling and Deposition. In Ullmann’s Encyclopedia of Industrial Chemistry; Wiley Online Library: Hoboken, NJ, USA, 2011; pp. 1–54. [Google Scholar] [CrossRef]
- Reinhart, D.; Townsend, T. Landfill Bioreactor Design and Operation; Routledge: London, UK, 1998. [Google Scholar]
- Narayana, T. Municipal solid waste management in India: From waste disposal to recovery of resources? Waste Manag. 2009, 29, 1163–1166. [Google Scholar] [CrossRef]
- Lokhande, T.I.; Mane, S.J.; Mali, S.T. Landfill site selection using GIS and MCDA methods: A review. Int. J. Res. Eng. Sci. Technol. 2017, 3, 25–30. [Google Scholar]
- Saaty, T. The Analytic Hierarchy Process: Planning, Priority Setting, Resource Allocation; McGraw-Hill: New York, NY, USA, 1980. [Google Scholar]
- Spigolon, L.M.; Giannotti, M.; Larocca, A.P.; Russo, M.A.; Souza, N.d.C. Landfill siting based on optimisation, multiple decision analysis, and geographic information system analyses. Waste Manag. Res. 2018, 36, 606–615. [Google Scholar] [CrossRef]
- Şener, Ş.; Sener, E.; Karagüzel, R. Solid waste disposal site selection with GIS and AHP methodology: A case study in Senirkent–Uluborlu (Isparta) Basin, Turkey. Environ. Monit. Assess. 2011, 173, 533–554. [Google Scholar] [CrossRef]
- Sumathi, V.; Natesan, U.; Sarkar, C. GIS-based approach for optimized siting of municipal solid waste landfill. Waste Manag. 2008, 28, 2146–2160. [Google Scholar] [CrossRef] [PubMed]
- Yang, K.; Zhou, X.-N.; Yan, W.-A.; Hang, D.-R.; Steinmann, P. Landfills in Jiangsu province, China, and potential threats for public health: Leachate appraisal and spatial analysis using geographic information system and remote sensing. Waste Manag. 2008, 28, 2750–2757. [Google Scholar] [CrossRef] [PubMed]
- Eghtesadifard, M.; Afkhami, P.; Bazyar, A. An integrated approach to the selection of municipal solid waste landfills through GIS, K-Means and multi-criteria decision analysis. Environ. Res. 2020, 185, 109348. [Google Scholar] [CrossRef] [PubMed]
- Balew, A.; Alemu, M.; Leul, Y.; Feye, T. Suitable landfill site selection using GIS-based multi-criteria decision analysis and evaluation in Robe town, Ethiopia. GeoJournal 2020, 87, 895–920. [Google Scholar] [CrossRef]
- Mortazavi Chamchali, M.; Ghazifard, A. The use of fuzzy logic spatial modeling via GIS for landfill site selection (case study: Rudbar-Iran). Environ. Earth Sci. 2019, 78, 305. [Google Scholar] [CrossRef]
- Wang, Y.; Li, J.; An, D.; Xi, B.; Tang, J.; Wang, Y.; Yang, Y. Site selection for municipal solid waste landfill considering environmental health risks. Res. Conserv. Recycl. 2018, 138, 40–46. [Google Scholar] [CrossRef]
- Madi, N.; Srour, I. Managing emergency construction and demolition waste in Syria using GIS. Res. Conserv. Recycl. 2019, 141, 163–175. [Google Scholar] [CrossRef]
- Singh, A. Remote sensing and GIS applications for municipal waste management. J. Environ. Manag. 2019, 243, 22–29. [Google Scholar] [CrossRef]
- Mahmood, K.; Ul-Haq, Z.; Faizi, F.; Tariq, S.; Naeem, M.A.; Rana, A.D. Monitoring open dumping of municipal waste in Gujranwala, Pakistan using a combination of satellite based bio-thermal indicators and GIS analysis. Ecol. Indic. 2019, 107, 105613. [Google Scholar] [CrossRef]
- Richter, A.; Ng, K.T.W.; Fallah, B. Bibliometric and text mining approaches to evaluate landfill design standards. Scientometrics 2019, 118, 1027–1049. [Google Scholar] [CrossRef]
- Tariq, A.; Shu, H. CA-Markov Chain Analysis of Seasonal Land Surface Temperature and Land Use Land Cover Change Using Optical Multi-Temporal Satellite Data of Faisalabad, Pakistan. Remote Sens. 2020, 12, 3402. [Google Scholar] [CrossRef]
- Bhalli, M.; Ghaffar, A.; Shirazi, S.; Parveen, N. Use of multi-temporal digital data to monitor LULC changes in Faisalabad-Pakistan. Pak. J. Sci. 2013, 65, 58. [Google Scholar]
- Richter, A.; Ng, K.T.; Karimi, N.; Wu, P.; Kashani, A.H. Optimization of waste management regions using recursive Thiessen polygons. J. Clean. Prod. 2019, 234, 85–96. [Google Scholar] [CrossRef]
- Philo, C. International Encyclopedia of Human Geography; Elsevier: Amsterdam, The Netherlands, 2009. [Google Scholar]
- Shen, Z.; Chen, L.; Liao, Q.; Liu, R.; Hong, Q. Impact of spatial rainfall variability on hydrology and nonpoint source pollution modeling. J. Hydrol. 2012, 472, 205–215. [Google Scholar] [CrossRef]
- Chen, J.; Wu, X.; Finlayson, B.L.; Webber, M.; Wei, T.; Li, M.; Chen, Z. Variability and trend in the hydrology of the Yangtze River, China: Annual precipitation and runoff. J. Hydrol. 2014, 513, 403–412. [Google Scholar] [CrossRef]
- Khan, M.M.-U.-H.; Vaezi, M.; Kumar, A. Optimal siting of solid waste-to-value-added facilities through a GIS-based assessment. Sci. Total Environ. 2018, 610, 1065–1075. [Google Scholar] [CrossRef]
- Musse, M.A.; Barona, D.A.; Rodriguez, L.M.S. Urban environmental quality assessment using remote sensing and census data. Int. J. Appl. Earth Obs. Geoinf. 2018, 71, 95–108. [Google Scholar] [CrossRef]
- Jin, S.; Sader, S.A. Comparison of time series tasseled cap wetness and the normalized difference moisture index in detecting forest disturbances. Remote Sens. Environ. 2005, 94, 364–372. [Google Scholar] [CrossRef]
- Zha, Y.; Gao, J.; Ni, S. Use of normalized difference built-up index in automatically mapping urban areas from TM imagery. Int. J. Remote Sens. 2003, 24, 583–594. [Google Scholar] [CrossRef]
- Mallick, J. Municipal Solid Waste Landfill Site Selection Based on Fuzzy-AHP and Geoinformation Techniques in Asir Region Saudi Arabia. Sustainability 2021, 13, 1538. [Google Scholar] [CrossRef]
- Manzo, C.; Mei, A.; Zampetti, E.; Bassani, C.; Paciucci, L.; Manetti, P. Top-down approach from satellite to terrestrial rover application for environmental monitoring of landfills. Sci. Total Environ. 2017, 584, 1333–1348. [Google Scholar] [CrossRef] [PubMed]
- Gautam, S.; Brema, J. Spatio-temporal variation in the concentration of atmospheric particulate matter: A study in fourth largest urban agglomeration in India. Environ. Technol. Innov. 2020, 17, 100546. [Google Scholar] [CrossRef]
- Ali, S.A.; Ahmad, A. Suitability analysis for municipal landfill site selection using fuzzy analytic hierarchy process and geospatial technique. Environ. Earth Sci. 2020, 79, 227. [Google Scholar] [CrossRef]
- Maqsoom, A.; Aslam, B.; Yousafzai, A.; Ullah, F.; Ullah, S.; Imran, M. Extracting built-up areas from spectro-textural information using machine learning. Soft Comput. 2022, 1–20. [Google Scholar] [CrossRef]
- Núñez, J.M.; Medina, S.; Ávila, G.; Montejano, J. High-Resolution Satellite Imagery Classification for Urban Form Detection. Satell. Inf. Classif. Interpret. 2019, 78, 779–791. [Google Scholar]


| S No. | Parameter | The Weightage Assigned (%) |
|---|---|---|
| 1 | NDVI | 18 |
| 2 | NDWI | 21 |
| 3 | NDBI | 35 |
| 4 | Protected Area | 26 |
| No. | Name | Area (sq. km) | NDVI | NDWI | NDBI | Population | Roads | Water Bodies |
|---|---|---|---|---|---|---|---|---|
| 1 | Dijkot | 380.4 | 0.49 | 0.45 | 0.44 | 0.11 | 0.08 | 0.2 |
| 2 | Jaranwala Town | 795.9 | 0.52 | 0.48 | 0.45 | 0.13 | 0.09 | 0.22 |
| 3 | Chak Jhumra Town | 367.4 | 0.41 | 0.4 | 0.42 | 0.12 | 0.11 | 0.21 |
| 4 | Iqbal Town | 243.3 | 0.41 | 0.42 | 0.46 | 0.1 | 0.06 | 0.16 |
| 5 | Summundri Town | 166.1 | 0.39 | 0.39 | 0.42 | 0.1 | 0.08 | 0.22 |
| 6 | Tandlian Wala Town | 637.6 | 0.31 | 0.33 | 0.34 | 0.12 | 0.08 | 0.141 |
| 7 | Madina Town | 340.6 | 0.38 | 0.36 | 0.37 | 0.14 | 0.07 | 0.16 |
| 8 | Lyall Pur Town | 188.7 | 0.36 | 0.35 | 0.38 | 0.16 | 0.09 | 0.19 |
| 9 | Jinnah Town | 224.9 | 0.38 | 0.38 | 0.42 | 0.11 | 0.08 | 0.21 |
| No. | Name | Area (sq. km) | NDVI | NDWI | NDBI | Population | Roads | Water Bodies |
|---|---|---|---|---|---|---|---|---|
| 1 | Dijkot | 380.4 | 0.05 | 0.06 | 0.16 | 0.05 | 0.02 | 0.05 |
| 2 | Jaranwala Town | 795.9 | 0.12 | 0.09 | 0.15 | 0.04 | 0.03 | 0.09 |
| 3 | Chak Jhumra Town | 367.4 | 0.11 | 0.08 | 0.15 | 0.08 | 0.02 | 0.1 |
| 4 | Iqbal Town | 243.3 | 0.16 | 0.09 | 0.18 | 0.06 | 0.011 | 0.12 |
| 5 | Summundri Town | 166.1 | 0.15 | 0.07 | 0.12 | 0.05 | 0.012 | 0.09 |
| 6 | Tandlian Wala Town | 637.6 | 0.15 | 0.1 | 0.11 | 0.1 | 0.012 | 0.07 |
| 7 | Madina Town | 340.6 | 0.1 | 0.09 | 0.23 | 0.03 | 0.13 | 0.06 |
| 8 | Lyall Pur Town | 188.7 | 0.21 | 0.16 | 0.17 | 0.03 | 0.04 | 0.13 |
| 9 | Jinnah Town | 224.9 | 0.11 | 0.11 | 0.17 | 0.11 | 0.1 | 0.07 |
Publisher’s Note: MDPI stays neutral with regard to jurisdictional claims in published maps and institutional affiliations. |
© 2022 by the authors. Licensee MDPI, Basel, Switzerland. This article is an open access article distributed under the terms and conditions of the Creative Commons Attribution (CC BY) license (https://creativecommons.org/licenses/by/4.0/).
Share and Cite
Aslam, B.; Maqsoom, A.; Tahir, M.D.; Ullah, F.; Rehman, M.S.U.; Albattah, M. Identifying and Ranking Landfill Sites for Municipal Solid Waste Management: An Integrated Remote Sensing and GIS Approach. Buildings 2022, 12, 605. https://doi.org/10.3390/buildings12050605
Aslam B, Maqsoom A, Tahir MD, Ullah F, Rehman MSU, Albattah M. Identifying and Ranking Landfill Sites for Municipal Solid Waste Management: An Integrated Remote Sensing and GIS Approach. Buildings. 2022; 12(5):605. https://doi.org/10.3390/buildings12050605
Chicago/Turabian StyleAslam, Bilal, Ahsen Maqsoom, Muhammad Dawar Tahir, Fahim Ullah, Muhammad Sami Ur Rehman, and Mohammed Albattah. 2022. "Identifying and Ranking Landfill Sites for Municipal Solid Waste Management: An Integrated Remote Sensing and GIS Approach" Buildings 12, no. 5: 605. https://doi.org/10.3390/buildings12050605
APA StyleAslam, B., Maqsoom, A., Tahir, M. D., Ullah, F., Rehman, M. S. U., & Albattah, M. (2022). Identifying and Ranking Landfill Sites for Municipal Solid Waste Management: An Integrated Remote Sensing and GIS Approach. Buildings, 12(5), 605. https://doi.org/10.3390/buildings12050605