Article

Positive Effects of Advanced Daylight Supply of Buildings on Schoolchildren—A Controlled, Single-Blinded, Longitudinal, Clinical Trial with Real Constructive Implementation

1
Institute of Ecomedicine, Paracelsus Medical University, 5020 Salzburg, Austria
2
Distributed Energy Conversion and Storage, Technische Hochschule Nürnberg Georg Simon Ohm, 90429 Nuremberg, Germany
*
Author to whom correspondence should be addressed.
These authors contributed equally to this work.
Buildings 2022, 12(5), 600; https://doi.org/10.3390/buildings12050600
Submission received: 4 April 2022 / Revised: 27 April 2022 / Accepted: 27 April 2022 / Published: 5 May 2022
(This article belongs to the Topic Energy Efficiency, Environment and Health)

Abstract

:
Sunlight controls endogen hormone balances and numerous health effects. Therefore, it is important to provide building users, such as schoolchildren, with sufficient daylight. Too much of it, however, leads to overheating, which is why shading systems are used. Consequently, these systems improve energy balance, but might not have positive effects on present people’s health. Within this study, shading systems were installed in classrooms of a middle school: common shading in two rooms, while two others were equipped with shading blades “Schlotterer RETROLux 80D” in an innovative design, reflecting more daylight indoors. The participating classes were divided between rooms with ordinary daylighting (n = 43) and advanced daylighting (n = 42). They spent, on average, 5 days weekly and 5–8 h daily in these classrooms. Saliva samples were collected during three semesters to detect hormonal changes. Questionnaires were collected to obtain more information about the mental alterations and, furthermore, to support the physiological results. A significant reduction in cortisol levels between 6:30 AM and 11:30 AM (p < 0.001) was observed within the group that had advanced daylighting. Questionnaires show that both groups sleep less as study duration increases (p < 0.001 time effect), but only the control group has a concurrent increase in daytime sleepiness according to relative treatment effects. The results show that increased daylight supply indoors leads to a significant greater reduction in cortisol levels of children and that those positive outcomes can be achieved by using innovative technologies for buildings.

1. Introduction

By spending time inside buildings, people keep themselves away from natural stimuli, such as daylight, even though it is known that the specific rhythm of color, color temperature, and intensity of natural light has a direct impact on human health and well-being. The strong bluish illumination of sunlight during daytime inhibits the endogenously serotonin-derived hormone melatonin, which is produced by the pineal gland inside the epithalamus. By this process, the brain manages the body’s sleep–wake rhythms [1]. Another endogenous hormone that underlies the circadian rhythm is cortisol, which is a stress hormone, produced by the adrenal cortex, that causes the body to adapt to particular daily strains and exposures [2]. Endogenous hormones, which are subject to such a rhythm, are controlled by external parameters. During the evolution of the human body, first c-opsin and r-opsin receptors developed, which evolved into different highly specialized receptor cell types, each of which has specific hormonal and functional tasks. In terms of the visual interface of the body with its environment, these specialized set of cells consists of rods, cones, bipolar and horizontal cells, amacrine, and ganglion cells [3]. Sunlight changes over the day. The spectrum of light arriving on the ground is reddish at the beginning of the day, because it must pass through more atmospheric particles, bluish at midday, while it is taking the shortest way through the atmosphere, and reddish again as soon as the sun “sets” [4,5]. The stated receptors in the human eyes are reacting to these varying spectra. Wavelength (λ) sensitivity of photoreceptors has been intensively researched for more than 20 years. Especially with regard to the sensitivity to bluish light sources of intrinsically photosensitive retinal ganglion cells (ipRGC), much effort has been invested in science, as these are mainly related to endogenous hormone control [6,7]. However, recent studies suggest that, in addition to ipRGC, receptors for visual perception, i.e., rods and cones, also play a role in hormone control, all of which have different wavelength sensitivities [8]. Most artificial light sources, though, were not developed to mimic the light spectrum of the sun. Their spectra are very dissimilar to that of daylight in most cases and there are several medical conditions related to the long-time exposure to those “wrong” spectra, e.g., there is a link between breast cancer and circadian disruption of melatonin [9] and cortisol [10]. Moreover, long time exposure to fluorescent artificial light results in degradation of dopaminergic neurons, which can be an indication of Parkinson’s disease later on [11]. The healthiest and highest quality of light, to which the internal processes of our body have adjusted, comes from the sun.
In Central Europe, however, 80–90% of our daily routine does not take place openly exposed to daylight, but indoors [12,13]. The indoor spaces where people spend time change over the course of the day. The most common places are the domestic stay, means of transport (bus, train, car), workplace (e.g., offices), schools, universities, etc. [12]. Additionally, modern cities are built in a more compact and dense way than the ones our ancestors used to live in. Dense development does not only have social and cultural advantages. The neighborhood’s carbon footprint is reduced by 42% for every doubling of its density [14]. However, the denser cities are built, the more nature is being suppressed and the less daylight (among many other natural parameters) reaches the inside of the buildings. Given the fact that natural environments keep humans healthy in the long run, the worldwide trend of urbanization makes specific shortcomings severe [13,15]. These facts have come to the attention of legislators in recent years. DIN EN 17037 “Daylight in buildings” is a European standard that was adopted in 2019 [16]. Countries such as Austria and Switzerland thus received a daylight-regulating standard for the first time.
Although sunlight is an important factor for healthy indoor environments, the supply of natural light needs to be managed. In winter times, glazing allows us to gather solar energy, which supports the building’s energy efficiency by heating up the interior, and, depending on fenestration, internal gains from the winter sun can be one of the most influential aspects to a building’s energy performance [17]. In summer times, though, large window sizes overheat the building. Therefore, modern buildings’ windows are being covered by interior or exterior shading systems, such as shading blades, shutters, or textiles.
Human eyes are not the only interface of the body with the rhythm of the sun. The occurrence of electromagnetic radiation (especially UV light) on the skin stimulates the production of pre-vitamin D3, which is then converted into pro-vitamin D3 by nutrient uptake with the help of hormones from the liver, a.o. [18]. Therefore, vitamin D3 production is also subject to wavelength sensitivity, which is also documented in DIN 5031-10 [19]. Psychological disorders, such as delayed sleep phase disorder, are very common for teenagers and young adults while their lifestyle is changing, leading to an intrinsic “free running” circadian rhythm and poor sleep hygiene (watching videos and using social media at night) [20]. Consequently, sleeping disorders such as these might lead to depression and have a negative impact on children’s and adolescents’ performance in school [20]. The logical assumption is that sunlight has a positive effect on all of these issues. Nevertheless, children and adolescents spend a large part of their life indoors. This is confirmed by a study from the USA, in which almost 10,000 households were examined, e.g., depending on the age group, between 7 AM and 5 PM, more than 90% of young people spend their time in schools, while adults occupy offices or manufacturing workplaces [21]. Therefore, they are in special need of advanced (indoor) daylighting in related buildings.
There are more aspects of Indoor Environmental Quality (IEQ) apart from interior lighting. Visual comfort, acoustic comfort, indoor temperatures, air quality, and even more parameters affect the person that is using a building’s interior at the same time. It is well known that indoor air pollution can lead to diverse unhealthy issues. Children are afflicted most frequently [22]. Rating models for thermal comfort currently only exist for adults, while comfort tables for children have only been proposed in research [23]. A study from Korea concluded from a survey of 119 kindergarten children that the thermal comfort range of children is 3 °C lower than that of adults. Thus, they are more sensitive to high temperatures [24]. This aspect is making the stated shading systems for windows even more important in schools and kindergarten buildings.
In a study in 2014, the overall indoor environmental quality of Finnish elementary schools was investigated. Some children suffered from the effects of poorly planned interiors. Within 4248 questionnaires, sleepiness topped the list of symptoms with 7.7% [25]. Furthermore, in most cases, the school’s timetable contradicts with the “free running” circadian rhythm of adolescents, shortening the duration of weekly sleep patterns by as much as 120 min [26]. Making matters more aggravating, 18 out of 29 daily free-time activities of young adults typically take place indoors as well, which was discovered by a German research association through computer-assisted personal interviews with over 1000 children [27].
Other studies on lighting situations in school buildings can be found in the current literature, such as those that investigated the comfort and performance of preschool children in Greece in 2022 [28], the positive impact of lighting system upgrades on the energy performance of African school buildings in 2021 [29], or the holistic improvement of IEQ and related well-being of schoolchildren in Iran in 2018 [30]. The latter found in their study of 842 schoolchildren with building physics measurements and questionnaires a correlation between the degree of energy renovation of the school buildings and the overall IEQ assessment of the schoolchildren. The lighting situation played a major role in this study along with thermal and visual comfort. Nevertheless, a comparable study in which engineers and physicians worked hand in hand on the effects of daylighting on schoolchildren and could demonstrate measurable endogenous hormonal effects of cortisol levels, can hardly be found. This represents a knowledge gap where this study can help provide new information in the subject area. Since the structural situations of indoor spaces that need to be provided with daylight are invariably dissimilar, with countless parameters having an impact on the quality of light, studies that investigate the effects of real built environments are of particular importance to the scientific community.
To sum this up, experiencing sunlight is an important preventive intervention for many health issues for children and adults. Given the fact that humans spend more and more time inside buildings, optimizing a building’s daylight supply is a strong reason for maintaining physical and mental health. All of this shows the risks of poor daylighting and indoor artificial lighting that is not of high quality. The presented controlled, single-blinded, longitudinal clinical trial (ISRCTN Registration number ISRCTN15982336) addresses this issue by implementing an innovative shading system that creates an improved supply of sunlight in classrooms. Throughout the study, psychological and physiological endpoints were observed, such as stress, sleepiness and sleep duration, and concentration.

2. Materials and Methods

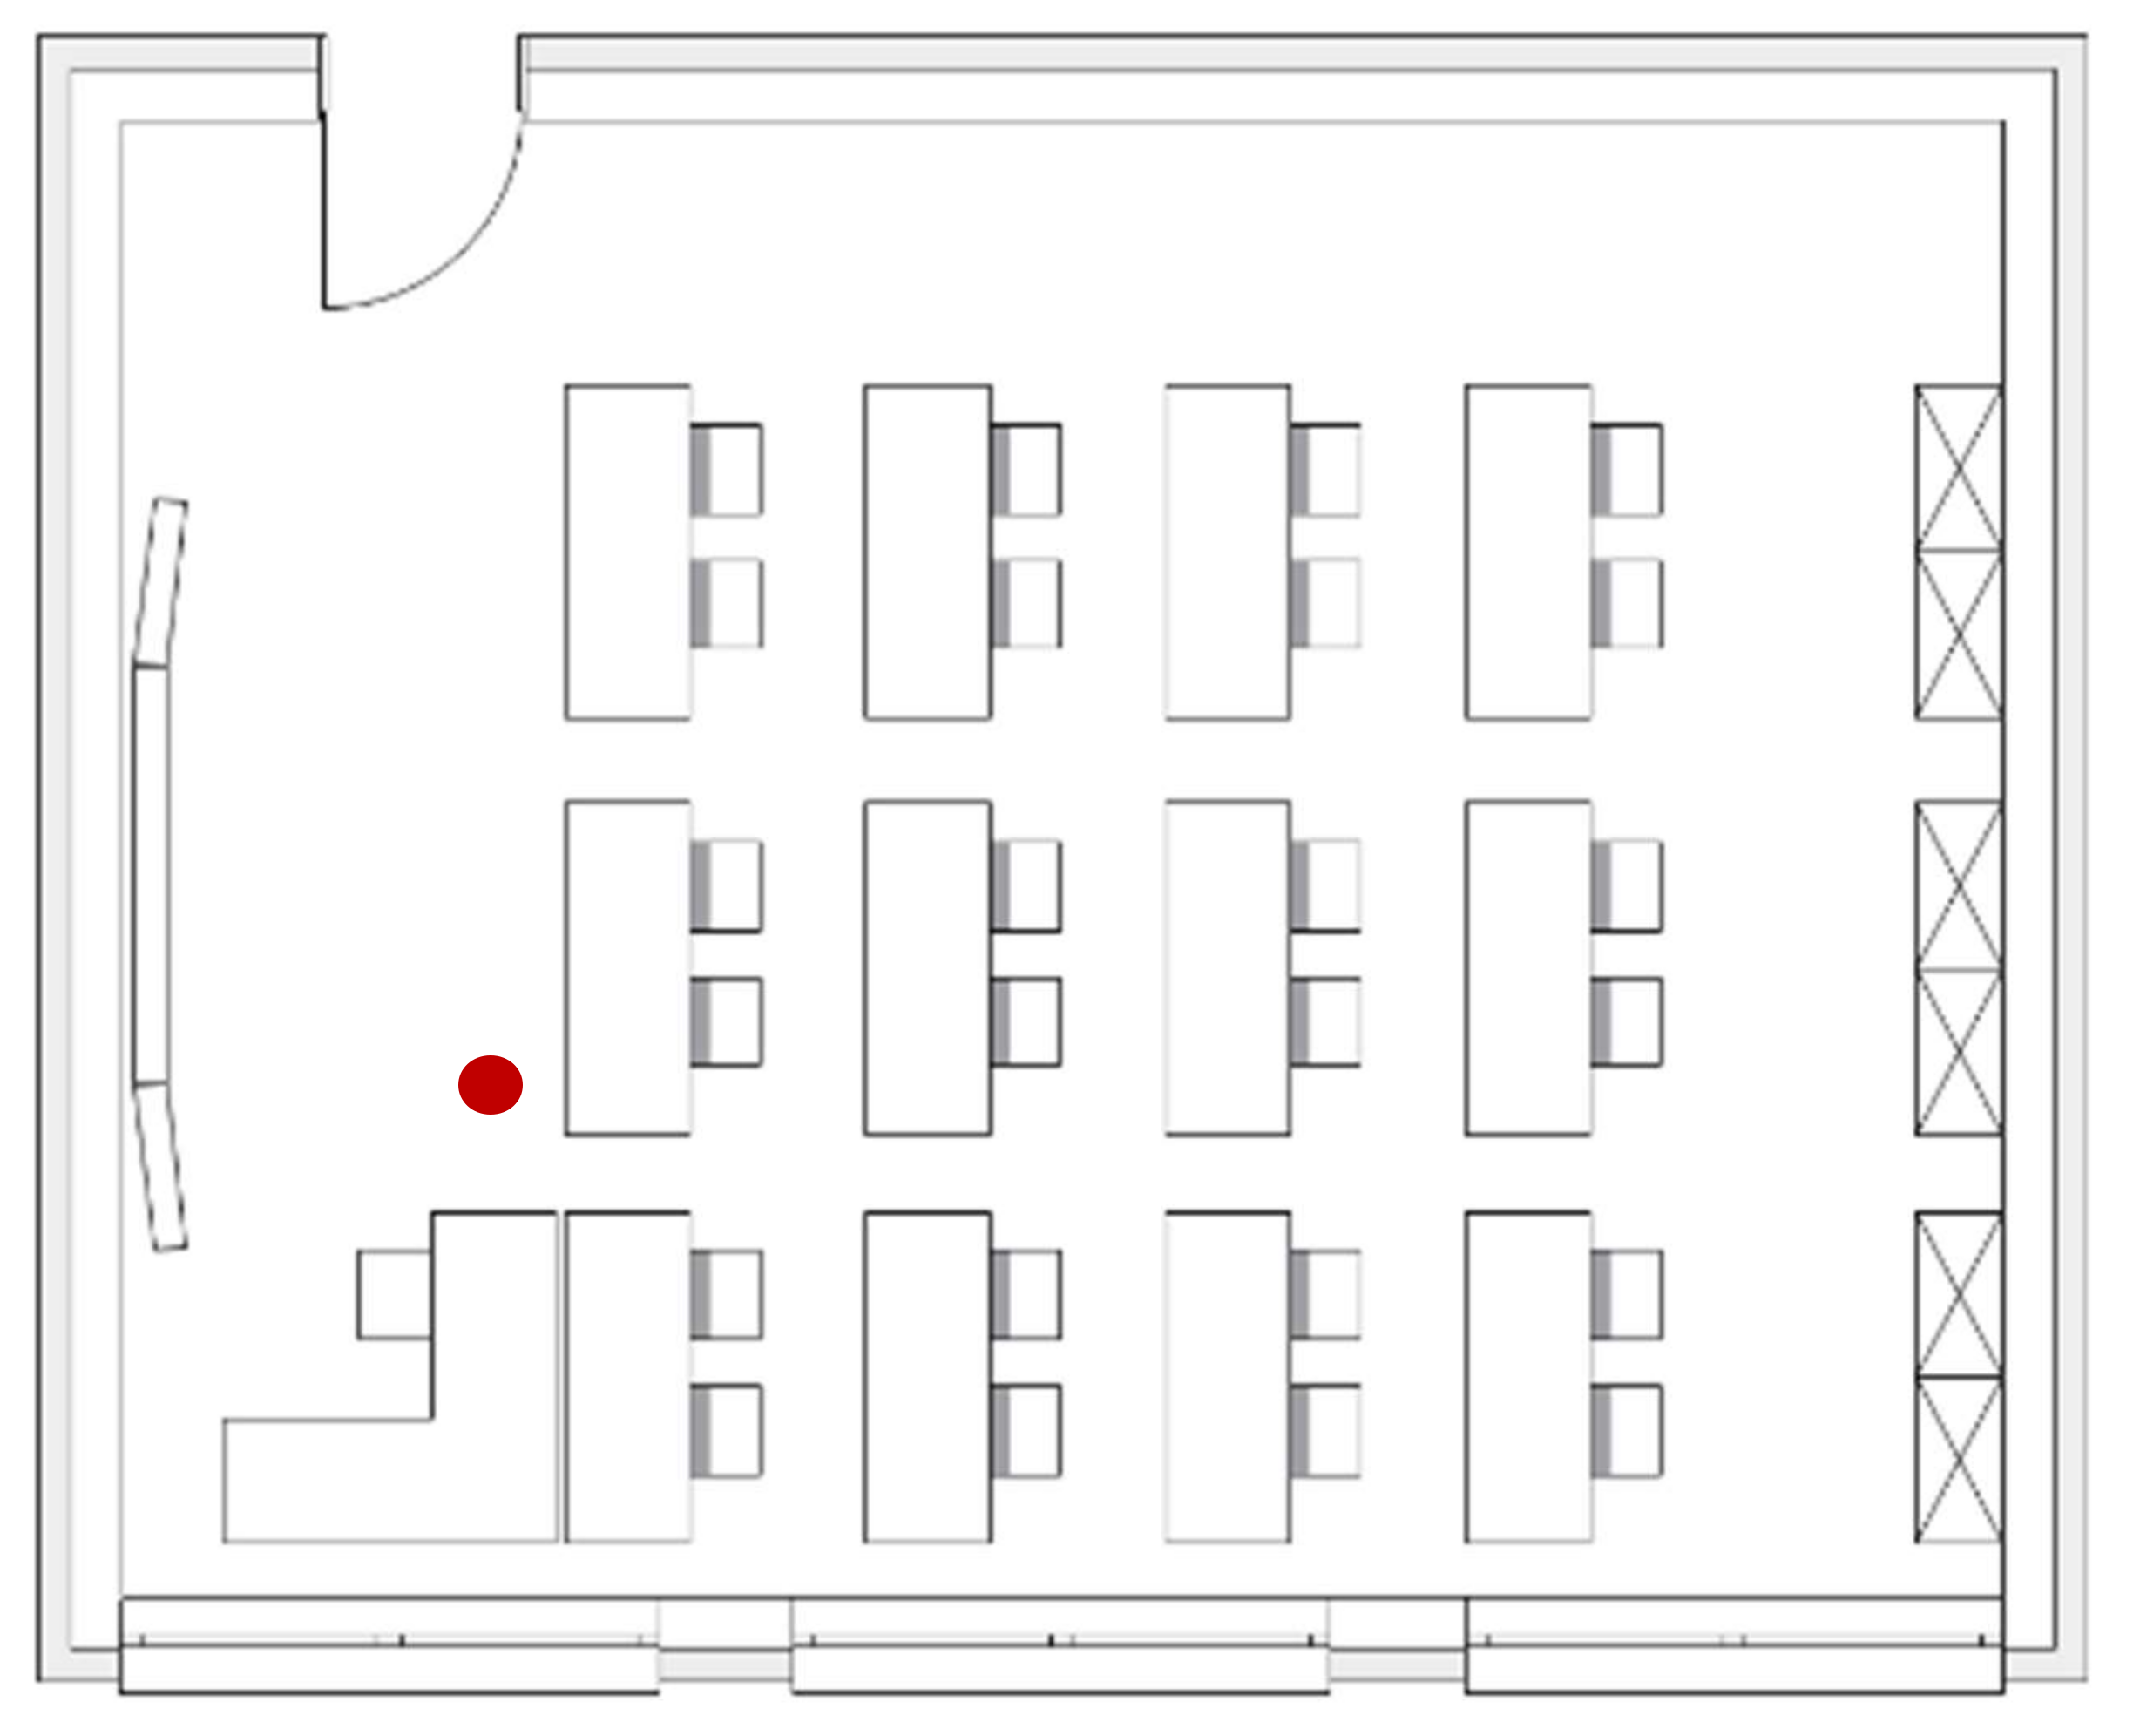
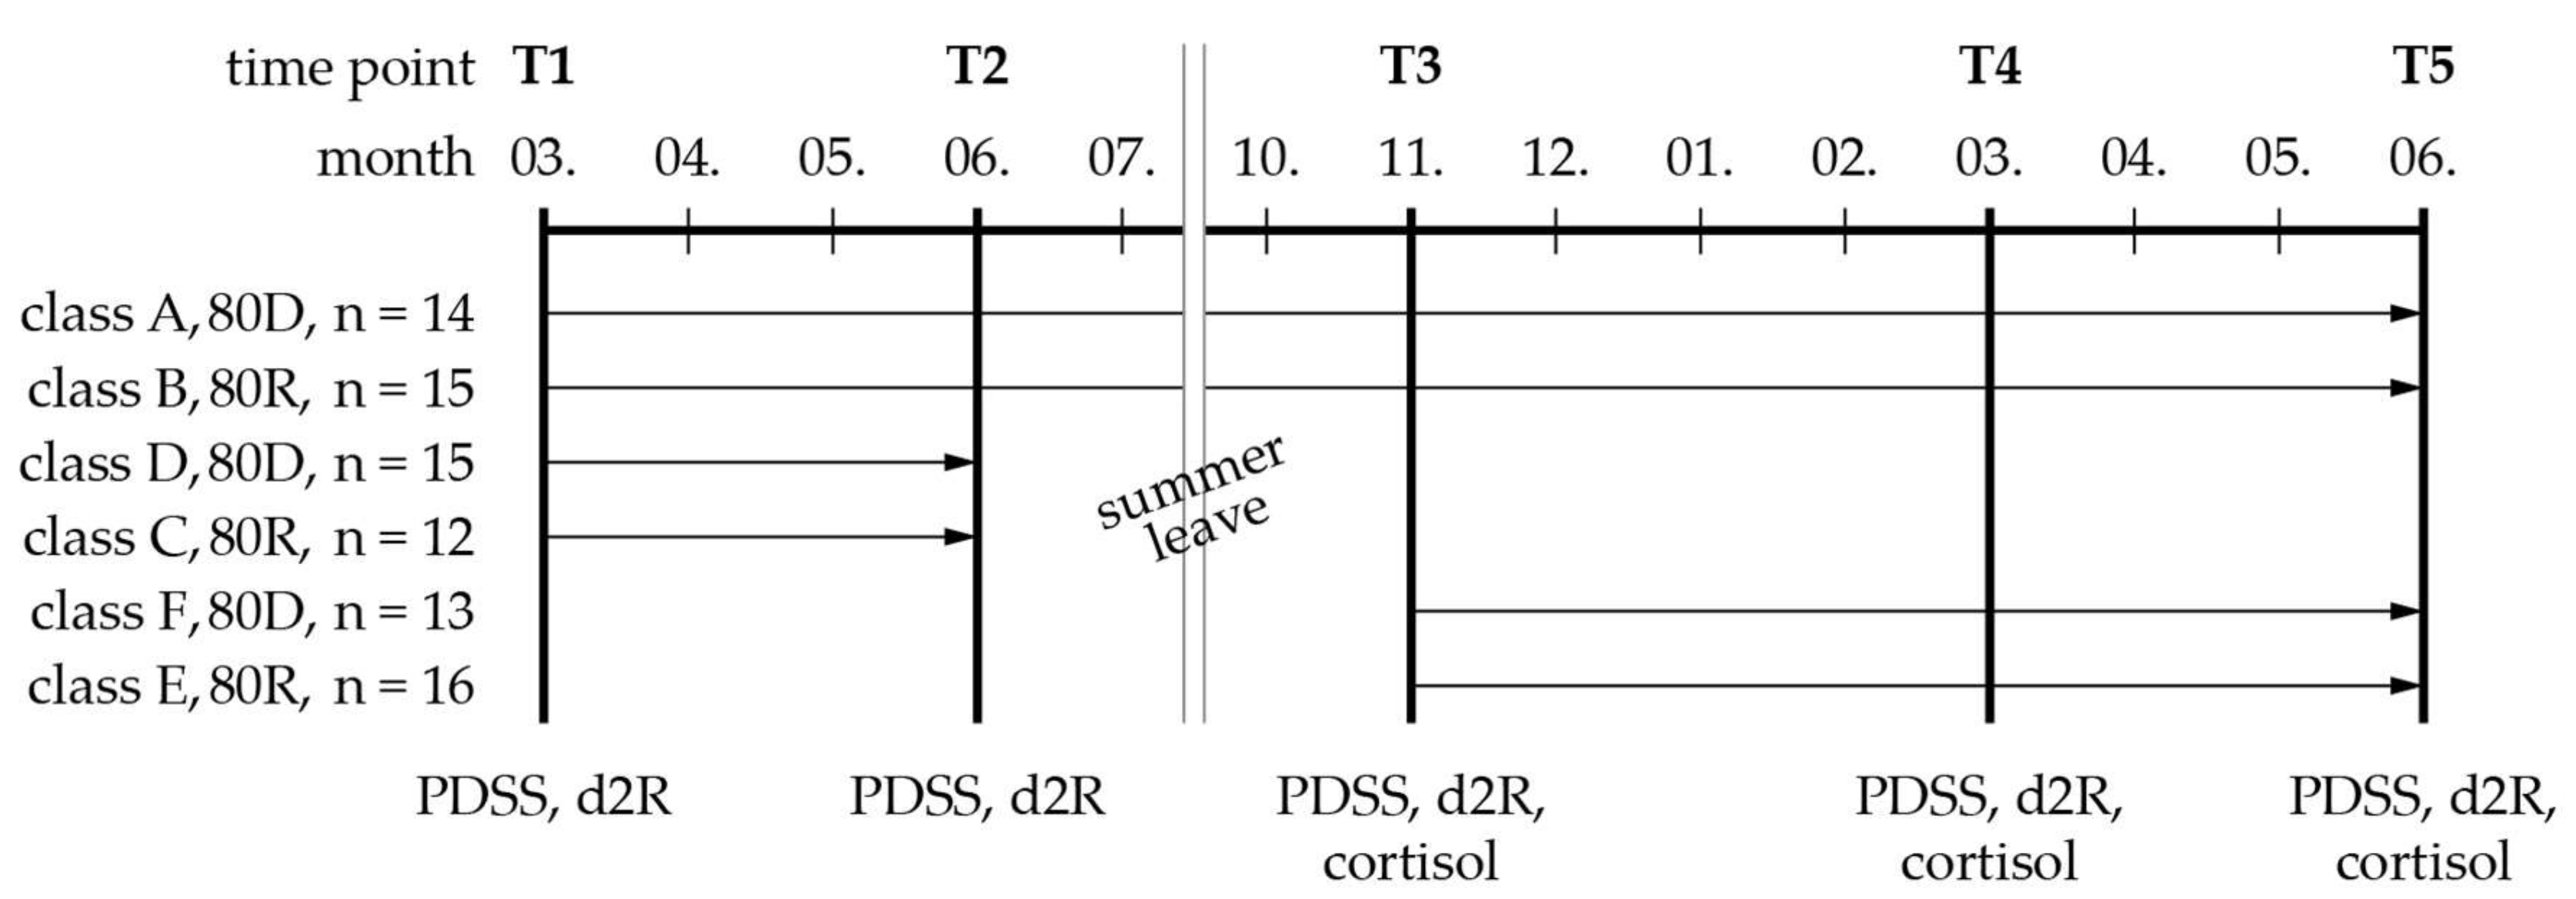
2.1. Study Design and Setting

The present controlled, single-blinded, longitudinal intervention study investigated the effects of advanced daylighting on physiological and psychological parameters of pupils. The allocation ratio for two groups (advanced daylighting and control) was set at comparable sample sizes. The intervention was conducted in the New Secondary School of Adnet (NSSA) (Salzburg, Austria) between March 2015 and June 2016. The study protocol was approved by the Ethics Committee of Salzburg (415-E/1857/2-2015) and was authorized by the State School Council of Salzburg (7151/0022-AP/2015). Due to the graduation of two classes in summer 2015, two new classes were added to the study population in autumn 2016. By doing so, the sample size was kept on a constant level. Therefore, the effects of advanced daylighting are reported for one semester and, subsequently, for two semesters of exposure.

2.2. Study Population
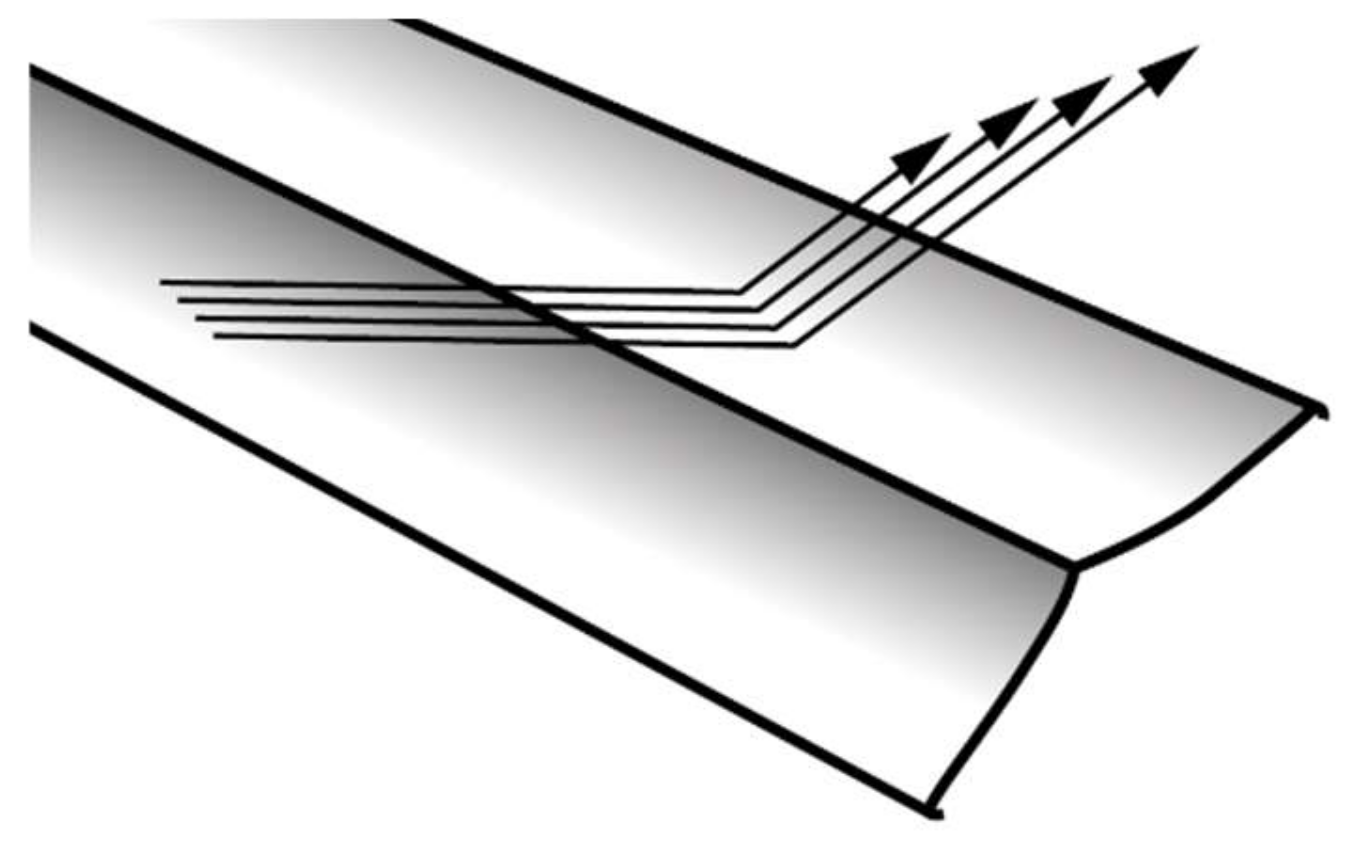
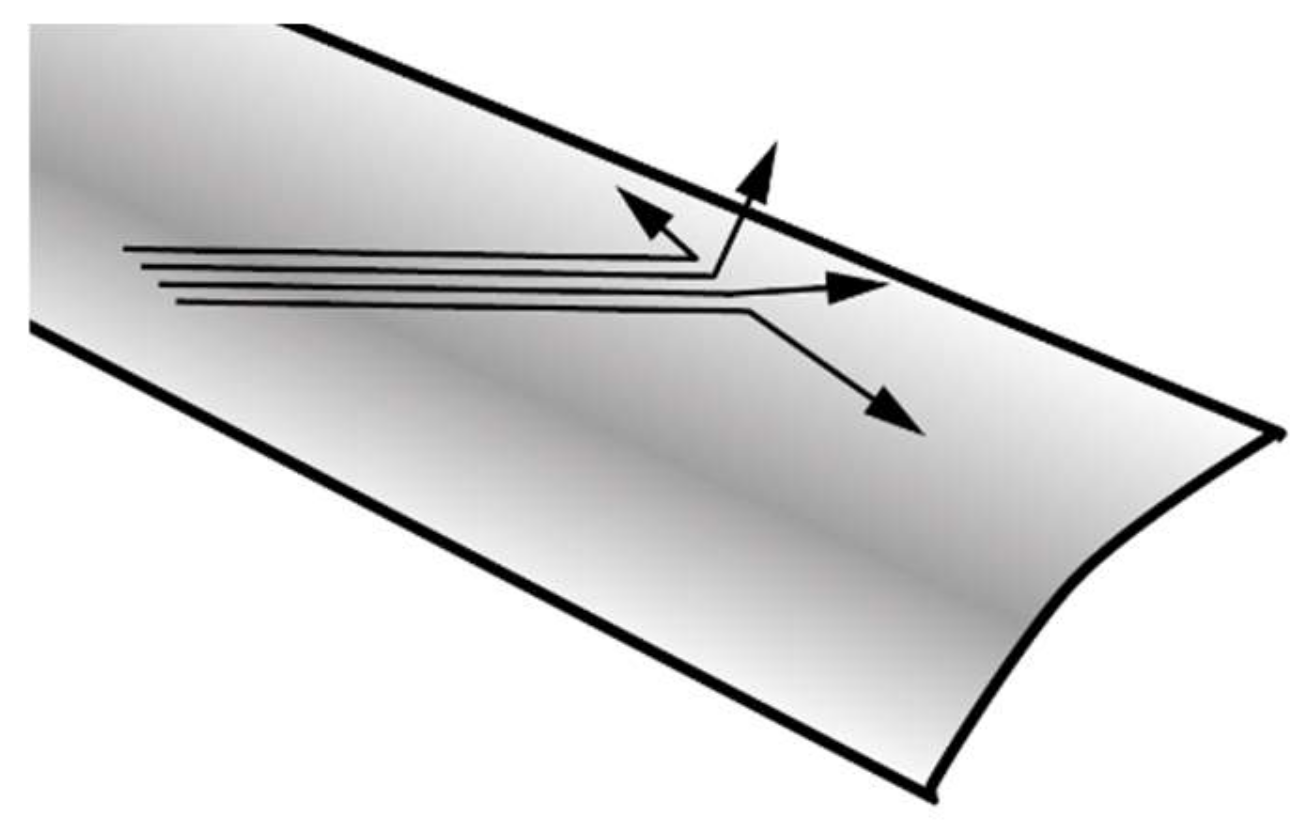
The study population consisted of pupils of the 3rd and 4th grade of the NSSA, which was also set as inclusion criteria. The pupils were aged between 10 and 12 years, e.g., to ensure sufficient reading comprehension. Before participants were finally enrolled in the study, children and their parents or legal guardians had to sign an informed consent form. School administrators and teachers of the enrolled classes gave their consent to the study as well.

2.3. Intervention

The school’s building needed a modernization. Two classrooms were equipped with innovative sun shading systems that were made out of special shading blades, the “Schlotterer RETROLux 80D” (80D) (Figure 1), which reflects more daylight into the building than conventional systems do, while maintaining the protection of overheating in summer. As the control condition, the shading systems “Schlotterer 80R” (80R) (Figure 2) were installed in two rooms. The 80R shading blade was used as a control intervention, as this product represents one of the well-known and most commonly used modern shading devices to protect buildings from sunlight in summer months. The so-called external venetian blinds are the third most demanded external shading technology, after roller shutters and awnings [31]. Figure 3 shows a technical drawing from which it can be deduced how 80D was installed in the facade of the school. The 80R shading blades were installed at the classrooms of the control groups, who did not experience significantly less or more daylight than pupils in an ordinary school building would do. The 80D are folded in a way that direct sunlight in summer times cannot enter the building, whereas indirect light and direct sunlight in winter is reflected inside the room’s ceiling. At the (white painted) ceiling, the light is reflected a second time in a more diffuse way, so it will not glare the building’s users and gets distributed evenly in the entire room. By using the 80D shading blade, the manufacturer states that the daylight yield (light intensity in lux), in comparison to the common design of 80R, will be improved as follows [32]:
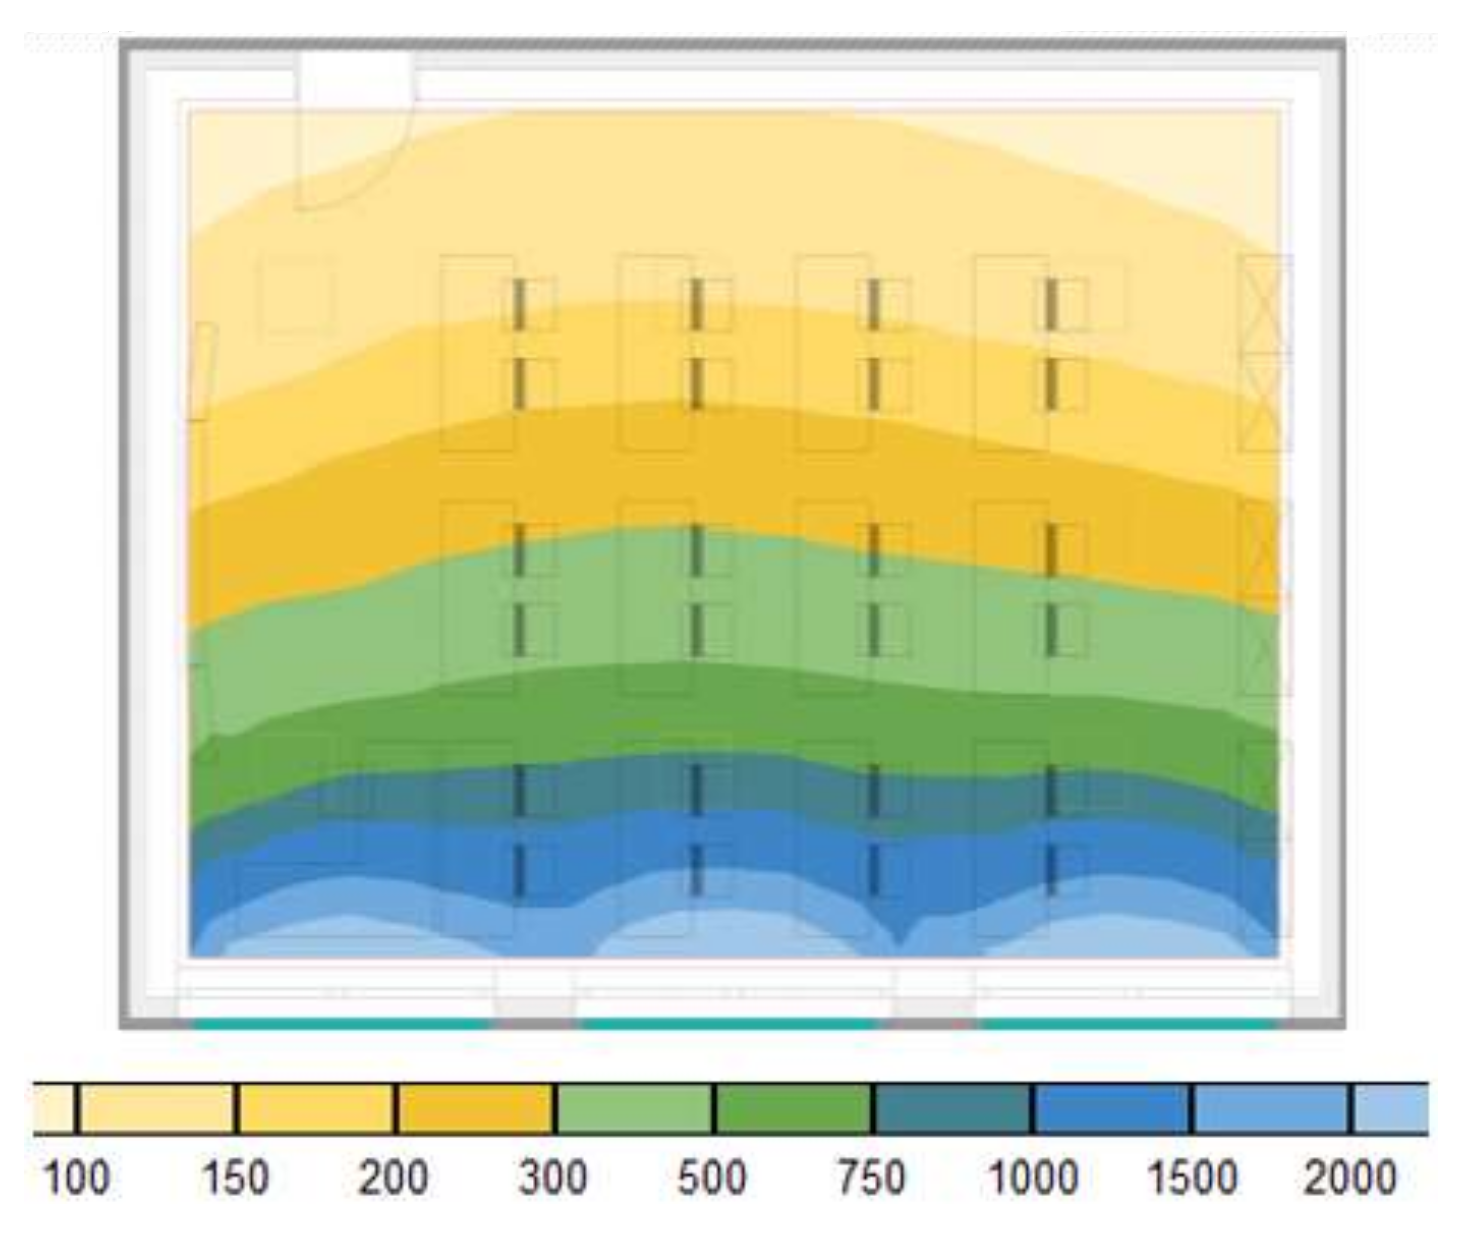
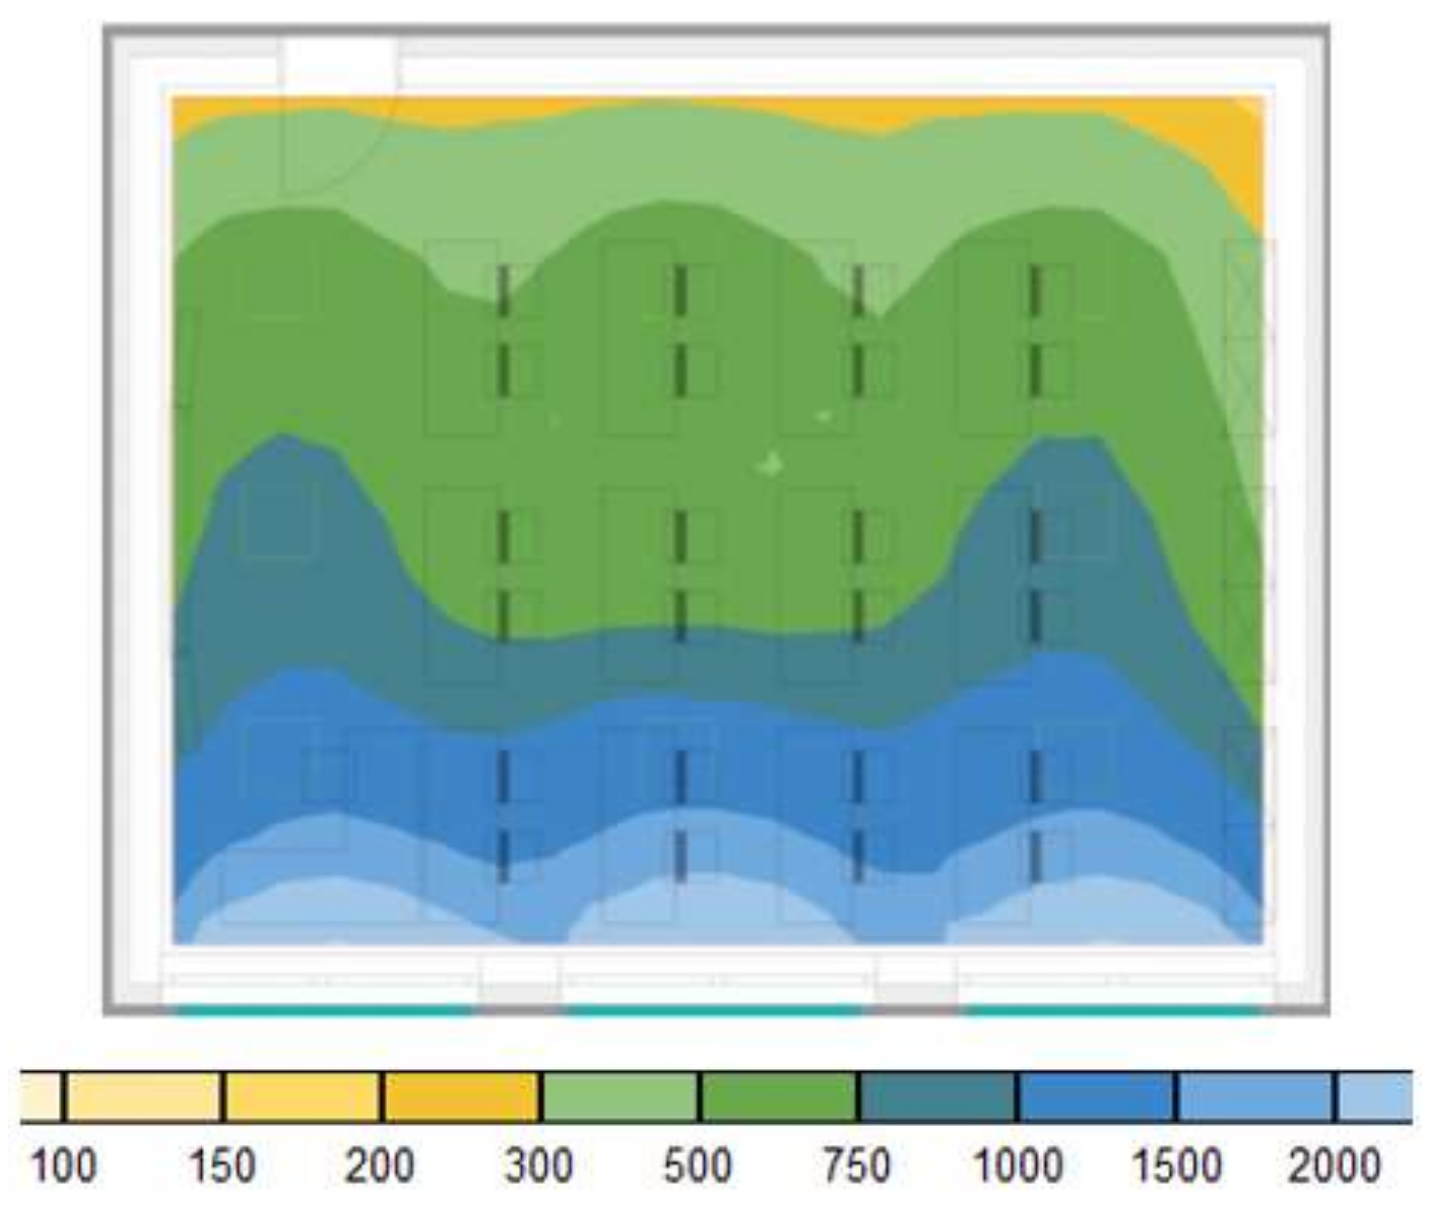
  • 8% to 33% at the back of the room;
  • −10% to 47% at the front of the room;
  • 53% to 63% at the room’s ceiling.
The number variation exists due to different solar altitudes and possible weather conditions. To sum this up, it can be assumed that schoolchildren in classrooms with 80D would be provided with more sunlight during the course of the day. The participating pupils of the NSSA spent 5 days per week and 5 to 8 h a day in their classrooms on average. During the intervention, all children lived at home, maintaining their usual lifestyle. Assessments were performed at the same time between March 2015 and June 2016 over a period of three semesters.

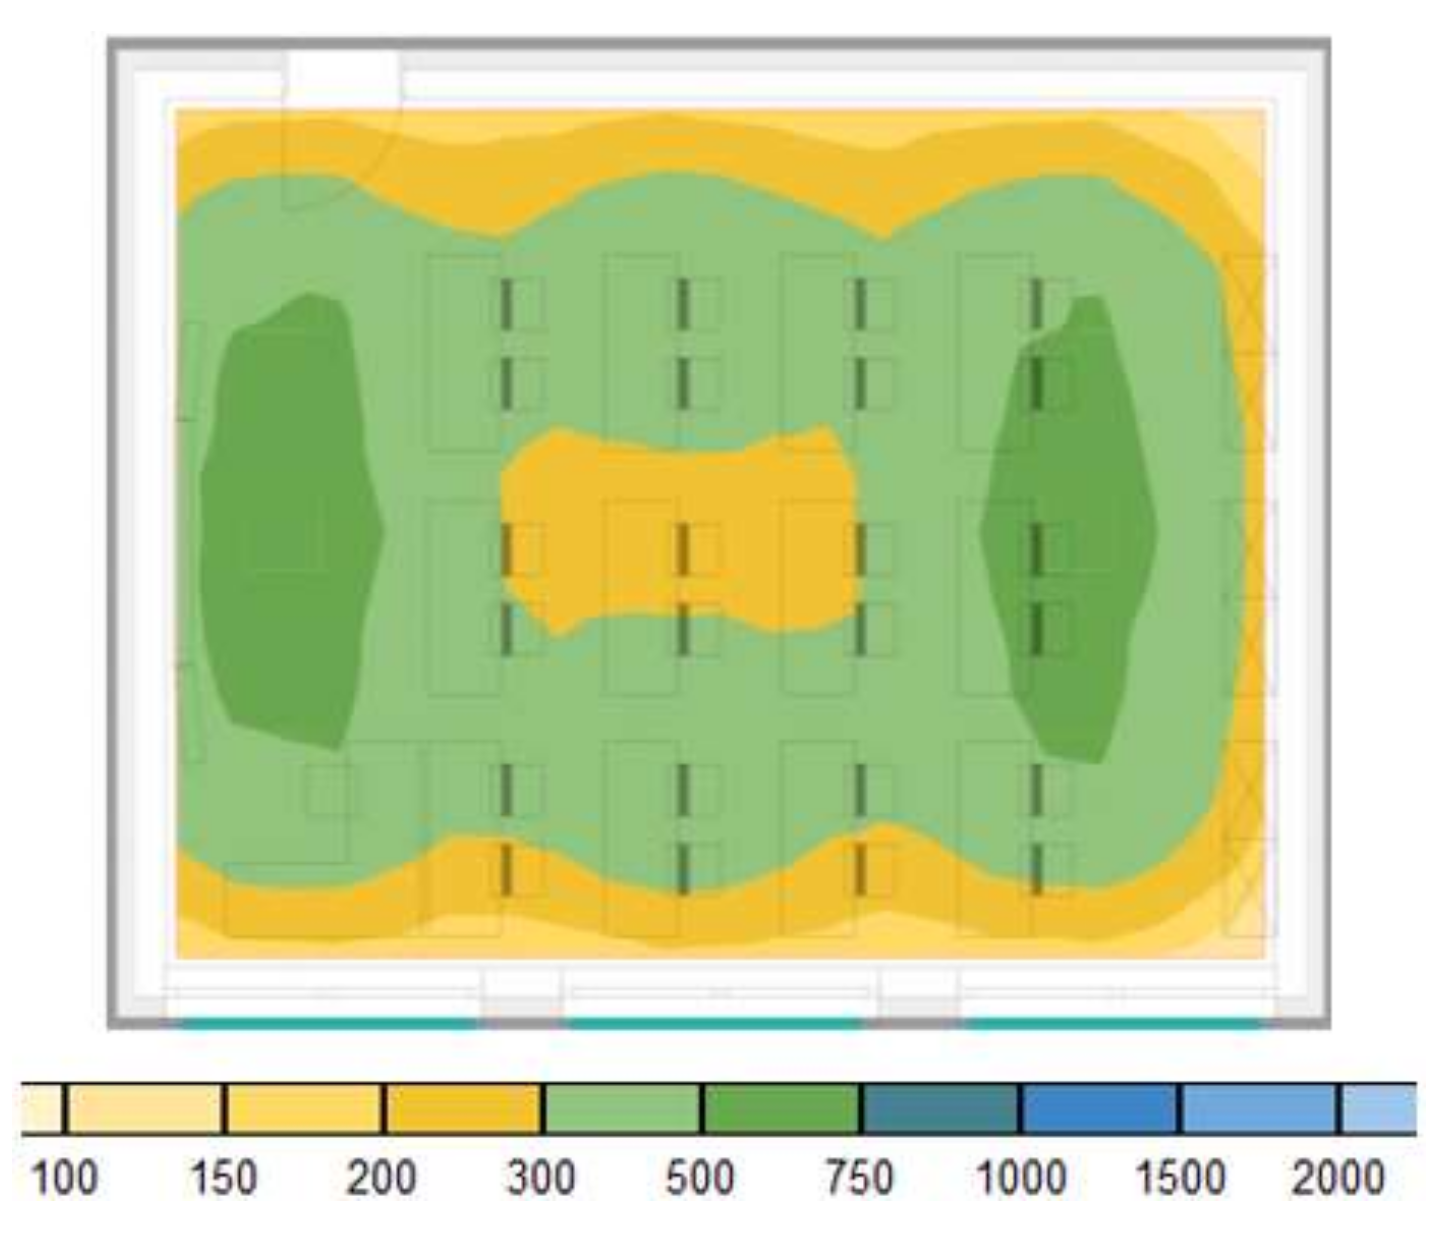
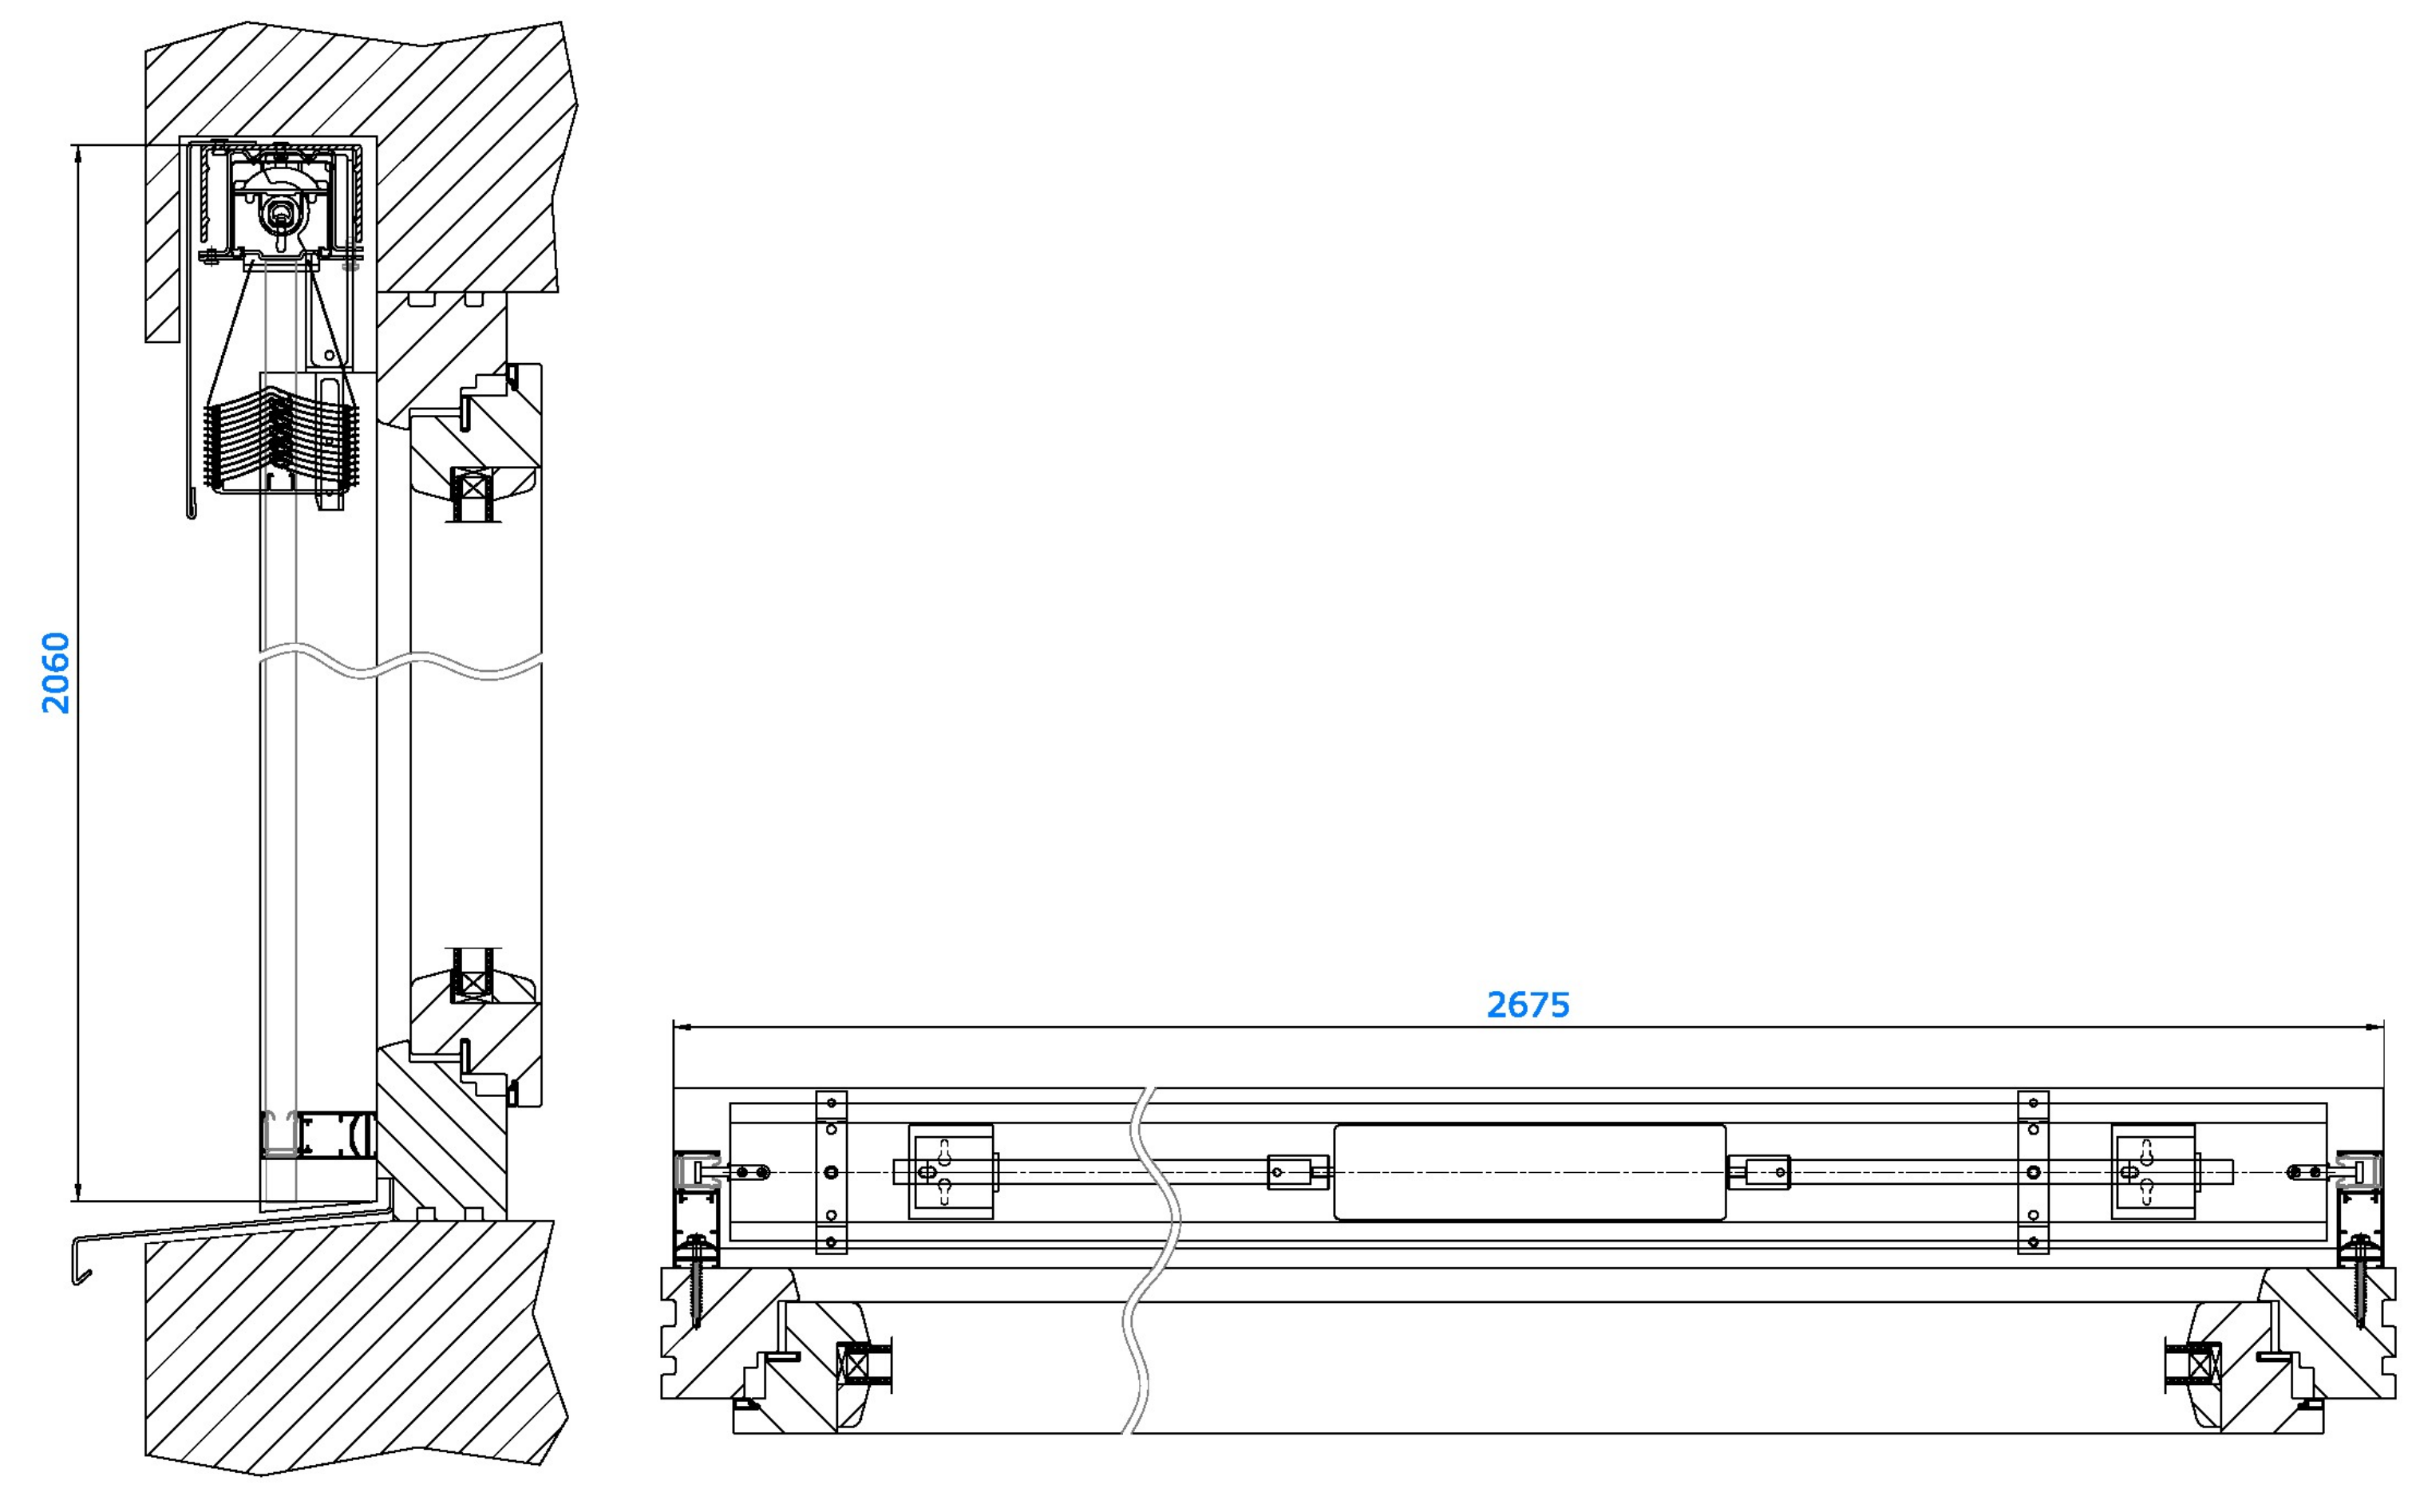
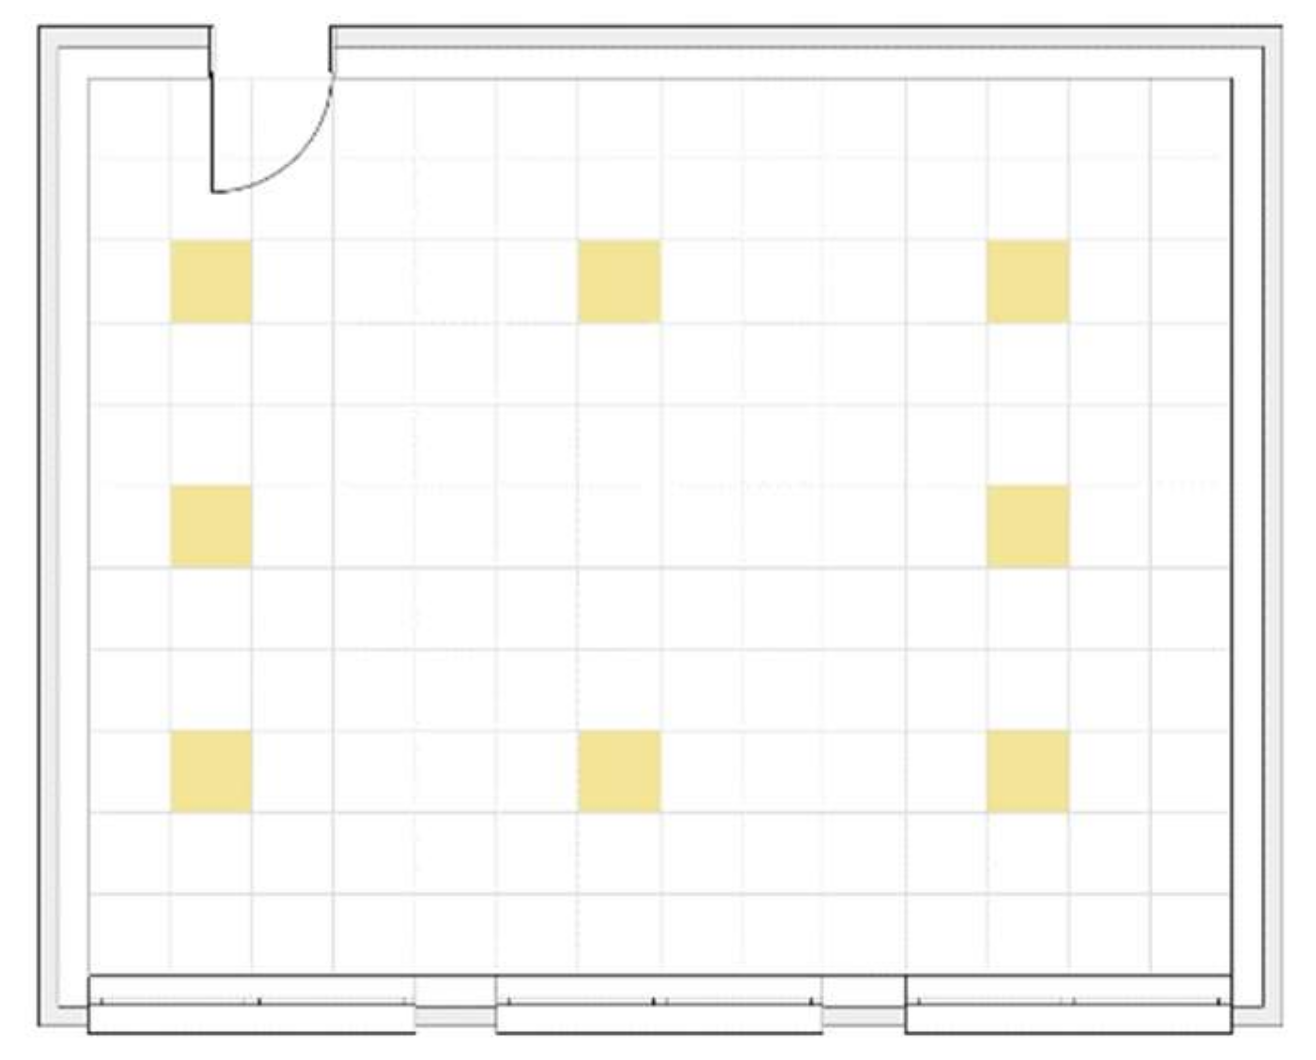
2.4. Building Specifications

The building of the NSSA (GPS: 47°41′41.698″ N 13°7′45,357″ E, 484 m above sea level) is a four-level object, having classrooms facing south-south-east orientation. The four classrooms, which were examined in this study, are located in the third and fourth floor. All rooms have a floor space between 63 m² and 66 m², their walls are painted in the same color, and the same furniture and teaching equipment (desks, chairs, blackboards) are available. The classrooms have three windows of equal size, with a totaled-up glazing surface of 14.0 m² (Figure 4). The artificial lighting system consists of eight luminaires per room that are equally distributed over the ceiling (Figure 5). The artificial light sources of the classrooms are fluorescent light tubes with an applied power of 18 W, which are installed in grid arrays on a suspended ceiling. The correlated color temperature (CCT), according to the manufacturer’s data, corresponds to 4400 Kelvin. The calculated value from the recorded spectral history data, following DIN 5033-7, results in 4330 Kelvin, and thus confirms the factory specification. Calculation outcomes illustrated in the false-color representations show that the technical lighting requirements specified in EN 12464-1 are closely fulfilled by using these luminaires. Illuminants of those lamps are fluorescent lamps, having a spectral power distribution (SPD) that vastly varies from daylight color rendering (Figure 6). The artificial light is not automated. Turning the lights on and off is left to the teacher. The quality and quantity of sunlight children can experience in this building depend on certain parameters, e.g., weather, external shading of the facade openings and wall thickness, shading system, window specifications (number of glass layers, UV-protective or IR-protective glass), window cleanness, and position and orientation of the child’s desk in the room. Most of these parameters did not change during the study or changed equally for every classroom. No major weather events were observed.
The evaluation of the daylight and artificial light situation in a simulation shows that the daylight supply of the existing building is very high on the window side and decreases sharply on the opposite side of the room (Figure 7). The artificial light supply is homogeneous (Figure 8). Daylight and artificial light combined ensure a sufficient supply of light at every workstation in the classroom (Figure 9).

2.5. Outcomes

All outcomes were collected at NSSA. Further examinations were performed in the lab of the Institute of Ecomedicine of Paracelsus Medical University in Salzburg. Data were anonymized by using four-digit IDs. Primary outcome was salivary cortisol levels. Sleep duration and daytime sleepiness measured by the Pediatric Daytime Sleepiness Scale [33], as well as concentration measured by d2-R scales [34] and inverted visual analogue scales (VAS) to investigate stress, sleepiness, and exhaustion were set as secondary outcomes.
Additionally, physical parameters, such as SPD for differentiation of daylight and artificial light usage, indoor air quality with regard to CO2 concentration as described in DIN EN 13211 [35], room air temperature following VDI 2078 [36], and relative humidity, were monitored. These indoor air quality parameters were measured permanently in each of the four classrooms using air quality data loggers (TROTEC, BZ30) and saved every four minutes. This was performed to ensure that influencing variables deviating from standard conditions that might affect the physiological or psychological endpoints of the subjects could be identified. For the analysis of indoor air quality, only school days from 8 AM to 1 PM were included. Quality and intensity of artificial and natural light indoors were measured by using a Q-mini USB (RGB Photonics GmbH, Kelheim, Germany) spectral light meter. It is able to detect visual wavelengths from λ = 350 nm to λ = 750 nm and measures the illuminance in lux [37]. Light was measured every 4 min from 8 AM to 1 PM as well. Since the spectra of artificial light and sunlight are significantly dissimilar, this makes it easy to distinguish whether the shading blades and/or the artificial light sources were in use at a given time. It was, therefore, possible to document the artificial light shares the students experienced during the study period. For simulations, the software Relux by Relux Informatik AG, Münchenstein, Germany, in version 2022.1.3.0 was used.

2.5.1. Data Collection

Assessments were performed at baseline (day 0, T1) (Figure 10), as well as before and after each semester (T2, T3, T4, T5), with the exception of VAS, which were carried out once a week. Saliva samples from the study participants were additionally collected starting at T3 to measure the stress-associated hormone cortisol, whose production and inhabitation is dependent on the supply of daylight [2]. The study timetable is presented in Figure 10, which also illustrates the timing of the assessments.

2.5.2. Salivary Cortisol

Saliva samples were collected at T3–T5 immediately after waking up, and at 9 and 12 AM to determine the strength of cortisol reduction during the course of the morning and at midday. The samples were collected in 15 mL ultra-pure polypropylene tubes by passive drool method. They were cooled within 30 min and stored at −80 °C within four hours of collection until analysis. Levels of active free cortisol in saliva were analyzed with the enzyme immunoassay Cortisol Saliva ELISA Free (Labor Diagnotika Nord GmbH & Co.KG, Lingen/Ems, Germany), following the manufacturer’s instructions. Absorbance was read on a plate reader at 450 ± 10 nm. To reduce the dispersion of the data, responders were defined as >10, ≤40 ng/mL.

2.5.3. Sleepiness and Sleep Duration

The Pediatric Daytime Sleepiness Scale (PDSS) quantifies daytime sleepiness through self-reporting measures. The eight items of the questionnaire consist of daily sleep patterns, school achievement, mood, sleepiness, quality of life, and extracurricular activities. The answers are represented in the form of a Likert-scale ranging from “never” (0) to “always” (4).

2.5.4. Concentration

The d2-R attention and concentration assessment is an established test procedure to measure attention in three categories: concentration performance, work speed, and accuracy, while, in this study, only the subjects’ concentration performance was analyzed. It is validated for the age range from 9 to 60 years. The test consists of 14 lines. Each participant has 20 s for each line to mark all symbols that look like the letter “d” with two dashes. There are many other symbols, such as the letters “d” and “p” with one to four dashes, to challenge the participant [38]. The whole duration of the test totals up to 4 min 40 s.

2.5.5. Visual Analogue Scales

Additionally, the pupils were asked to report sleepiness, stress, and exhaustion on single scales of an inverse visual analogue scale (VAS) on a weekly basis. The scales of 0 to 10 cm ranged from “very bad” to “very good”, whereby a higher value indicates a better clinical result. This unidimensional measuring instrument is widely used in research to examine anxiety [39], pain [40], and other outcomes in children.

2.6. Sample Size, Randomization, and Blinding

The comparable sample size per intervention and control group could be realized based on two approximately equally large class sizes. No sample size calculation was performed. At the beginning of the study, the four selected classes were randomly allocated to one of the two rooms with shading system 80D or one of the two rooms with shading system 80R (control). Since two of these classes graduated, the two additional classes were added and randomized. For the two classes that remained after summer leave, the already existing randomization was not changed. Recruitment and enrollment of eligible participants, as well as randomization, were performed by the same researcher. The allocation to the shading systems was blinded for teachers, schoolchildren, and their parents.

2.7. Statistical Methods

The data were collected in an excel-based database. The statistical analysis and interpretation took place at the Institute for Ecomedicine of the Paracelsus Medical University in Salzburg. All statistical analyses were implemented in the R-GNU software environment (General Public License, R Foundation for Statistical Computing, Vienna, Austria, version 4.0.2). Variables reported in tables are presented as means and their standard deviation, as far as not stated otherwise. The level of significance was set to alpha 0.05. Data were tested for normal distribution with the Shapiro–Wilk test. Longitudinal data analysis was performed with the nparLD package [41], which offers full nonparametric data analysis with ANOVA-type statistics [42]. F1-LD-F1 models were set up for group, time, and group*time interaction effects. In the event of a significant main effect for time, post hoc analyses were used to compare the baseline for each particular time point with another F1-LD-F1 model. Multiple testing was compensated using Bonferroni–Holm corrections. To quantify the effect of the intervention, relative treatment effects (RTE) are reported. The RTE is a unitless value, which ranges between 0 and 1. An RTE of 0.5 indicates that no subgroup has a propensity to rank higher or lower. An RTE of 0.25 for a subgroup indicates that a randomly selected person from this subgroup has a 25% chance of scoring better than a randomly selected person from the overall dataset. On the other hand, it is predicted that a randomly selected person from this subgroup would score lower than a randomly selected person from the entire dataset by 75%.
For the statistical analysis of the cortisol decline, data from T3–T5 were pooled. An F1-LD-F1 model was used to test the hypothesis that the morning cortisol levels do not differ between T3 and T5. As this hypothesis could be confirmed, the pooled cortisol data were analyzed by another F1-LD-F1 model.
In addition to the text-based tables, the data are being represented via dot-and-whiskers diagrams, which include mean, median, and standard deviation values.
For the analysis of the data of the visual analogue scales for self-assessment, a Wilcoxon rank sum test was calculated, as well as p-values. The results are being compared in simple comparisons. The Wilcoxon test was compared by groups rather than by individual time points.

3. Results

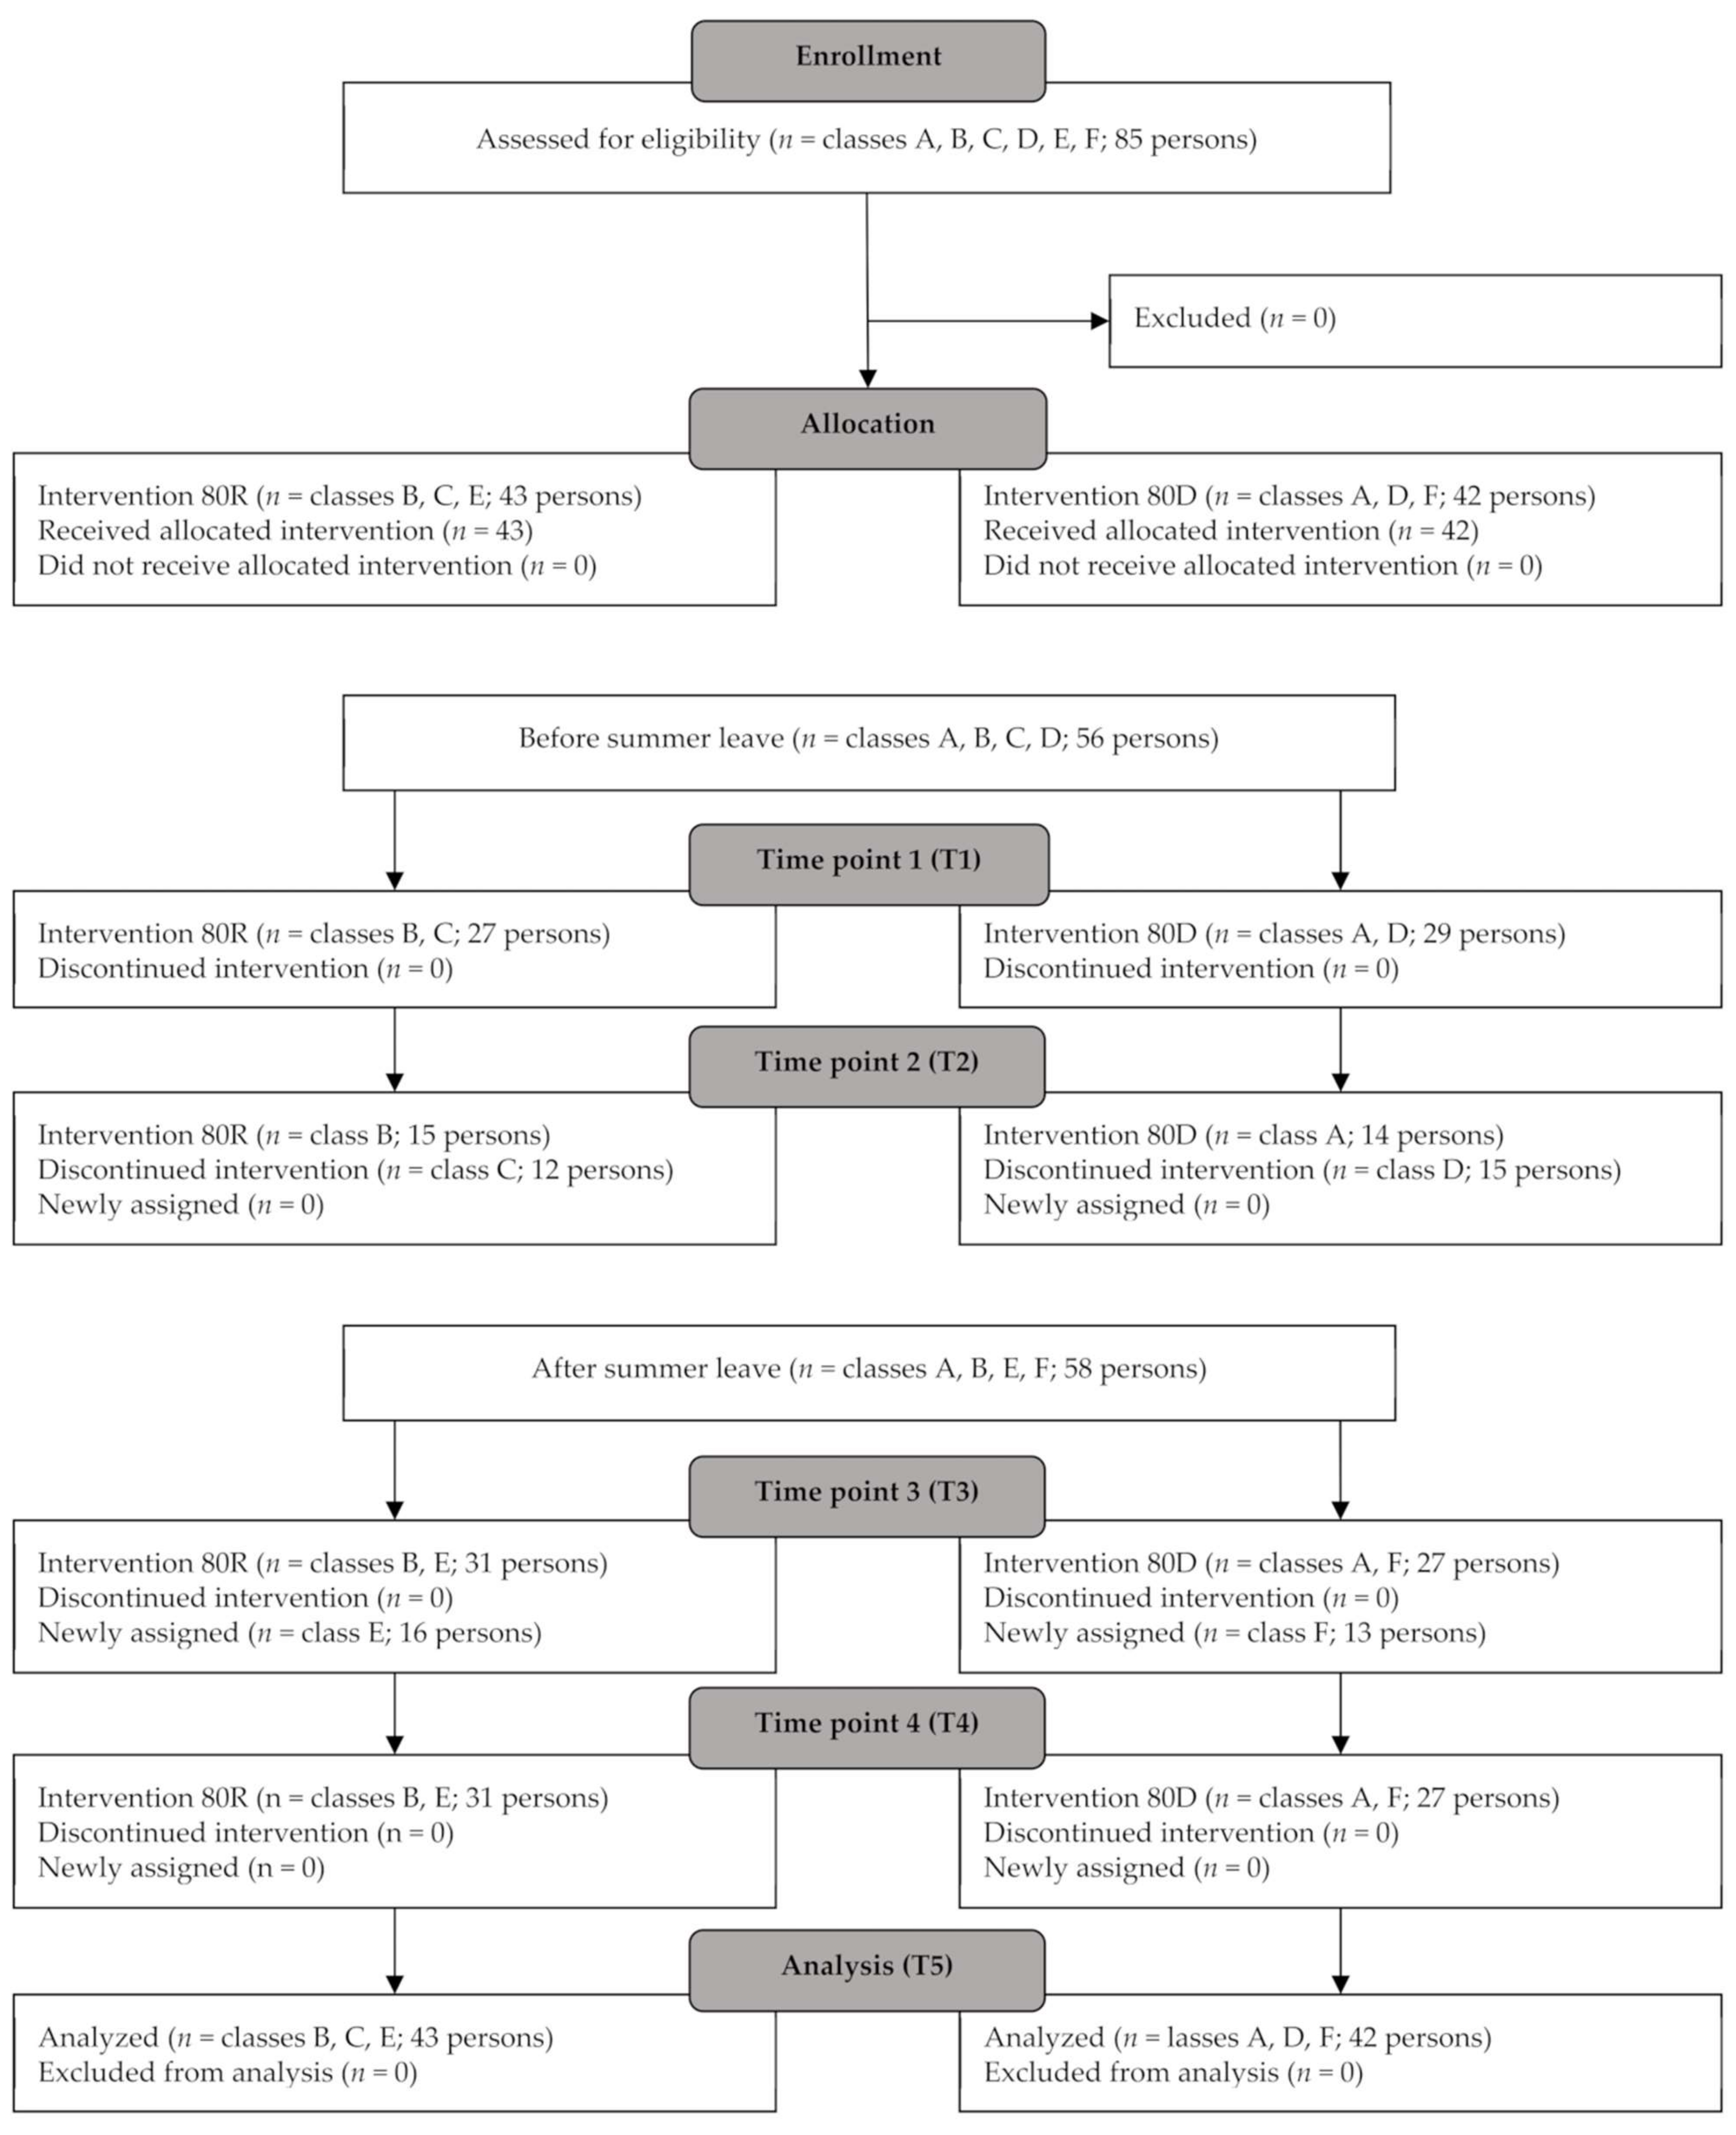
3.1. Study Participants, Baseline Characteristics, and CONSORT Flow Diagram

The study population consisted of 85 schoolchildren. The pupils were 10 to 12 years old. The youngest group, on average, was the control group of the class, which participated for two semesters, starting at T3 (10.45 ± 0.51 years). Meanwhile, the averaged oldest group was the class with advanced daylighting, which took part for one semester, starting at T1 (10.83 ± 0.66 years). These schoolchildren were also among the group with the longest nighttime sleep duration at the beginning of the study (8.67 ± 0.78 h). The highest daytime sleepiness was found in the control group, which attended for one semester, starting at T1 (12.26 ± 5.82). A presentation of those and other baseline criteria is shown in Table 1. No children were excluded during the study (Figure 11).

3.2. Indoor Air Quality

CO2 values were in a representative range throughout the year. Since windows are usually closed far more often during the winter months, the CO2 content in the air increased slightly at this time to the highest values of 1293.62 ± 462.28 ppm in the rooms with 80D and 1070.96 ± 466.21 ppm in the other two rooms (cf. Table 2, CO2 (ppm)). The results of the measurements of air humidity show an equally characteristic picture. In summer, humidity increased to the highest proportion of 44.68 ± 3.16% in rooms with 80D and to 42.83 ± 4.82% in rooms with 80R (cf. Table 2, air humidity (%)). The highest measured mean indoor temperatures of 26.66 ± 1.12 °C for 80D and 25.39 ± 1.80 °C for 80R were documented in summer and the lowest mean temperatures of 24.03 ± 1.05 °C for 80D and 24.67 ± 1.26 °C for 80R occurred during wintertime (cf. Table 2, air temperature (°C)).

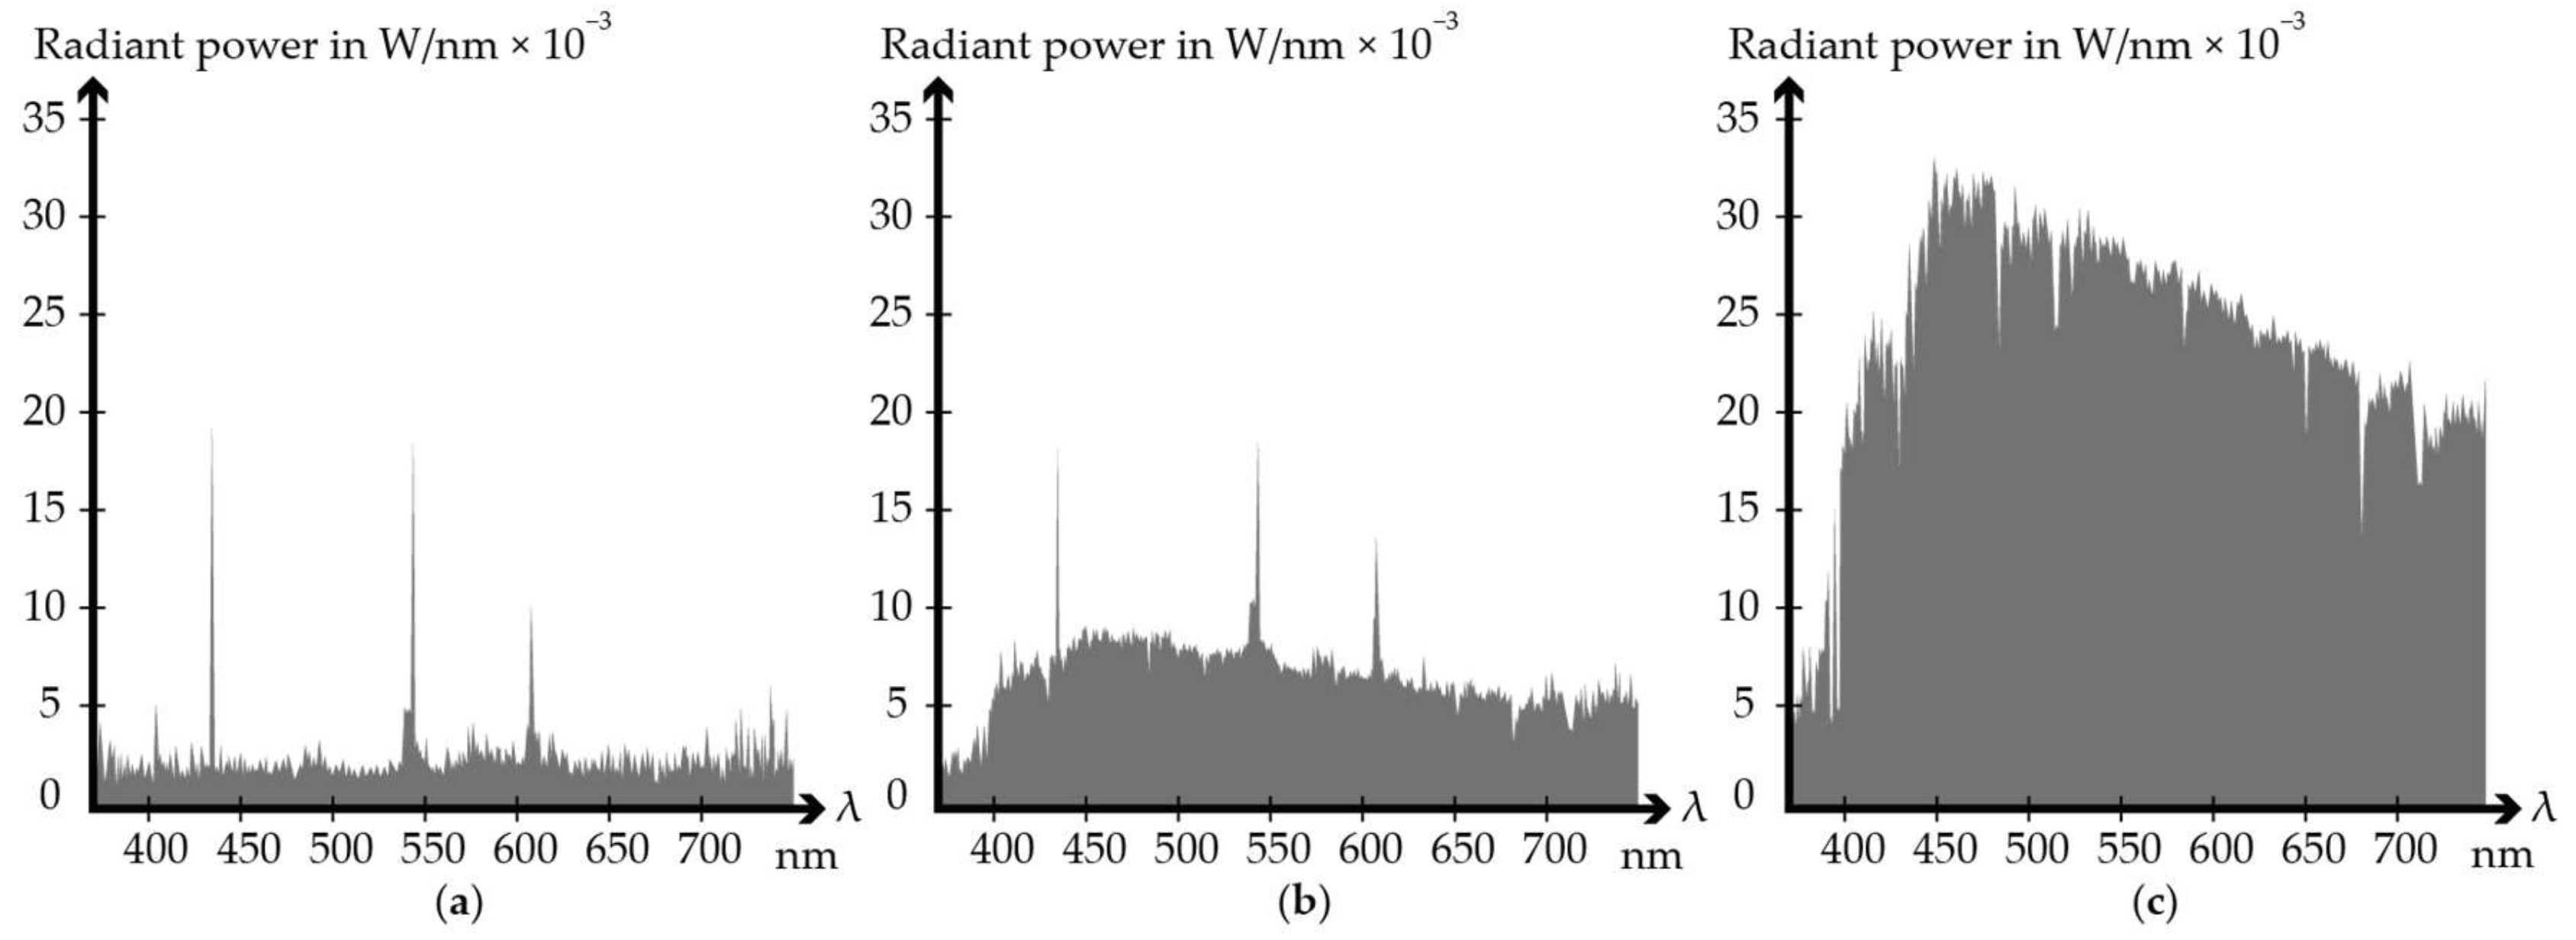
3.3. Artificial lighting
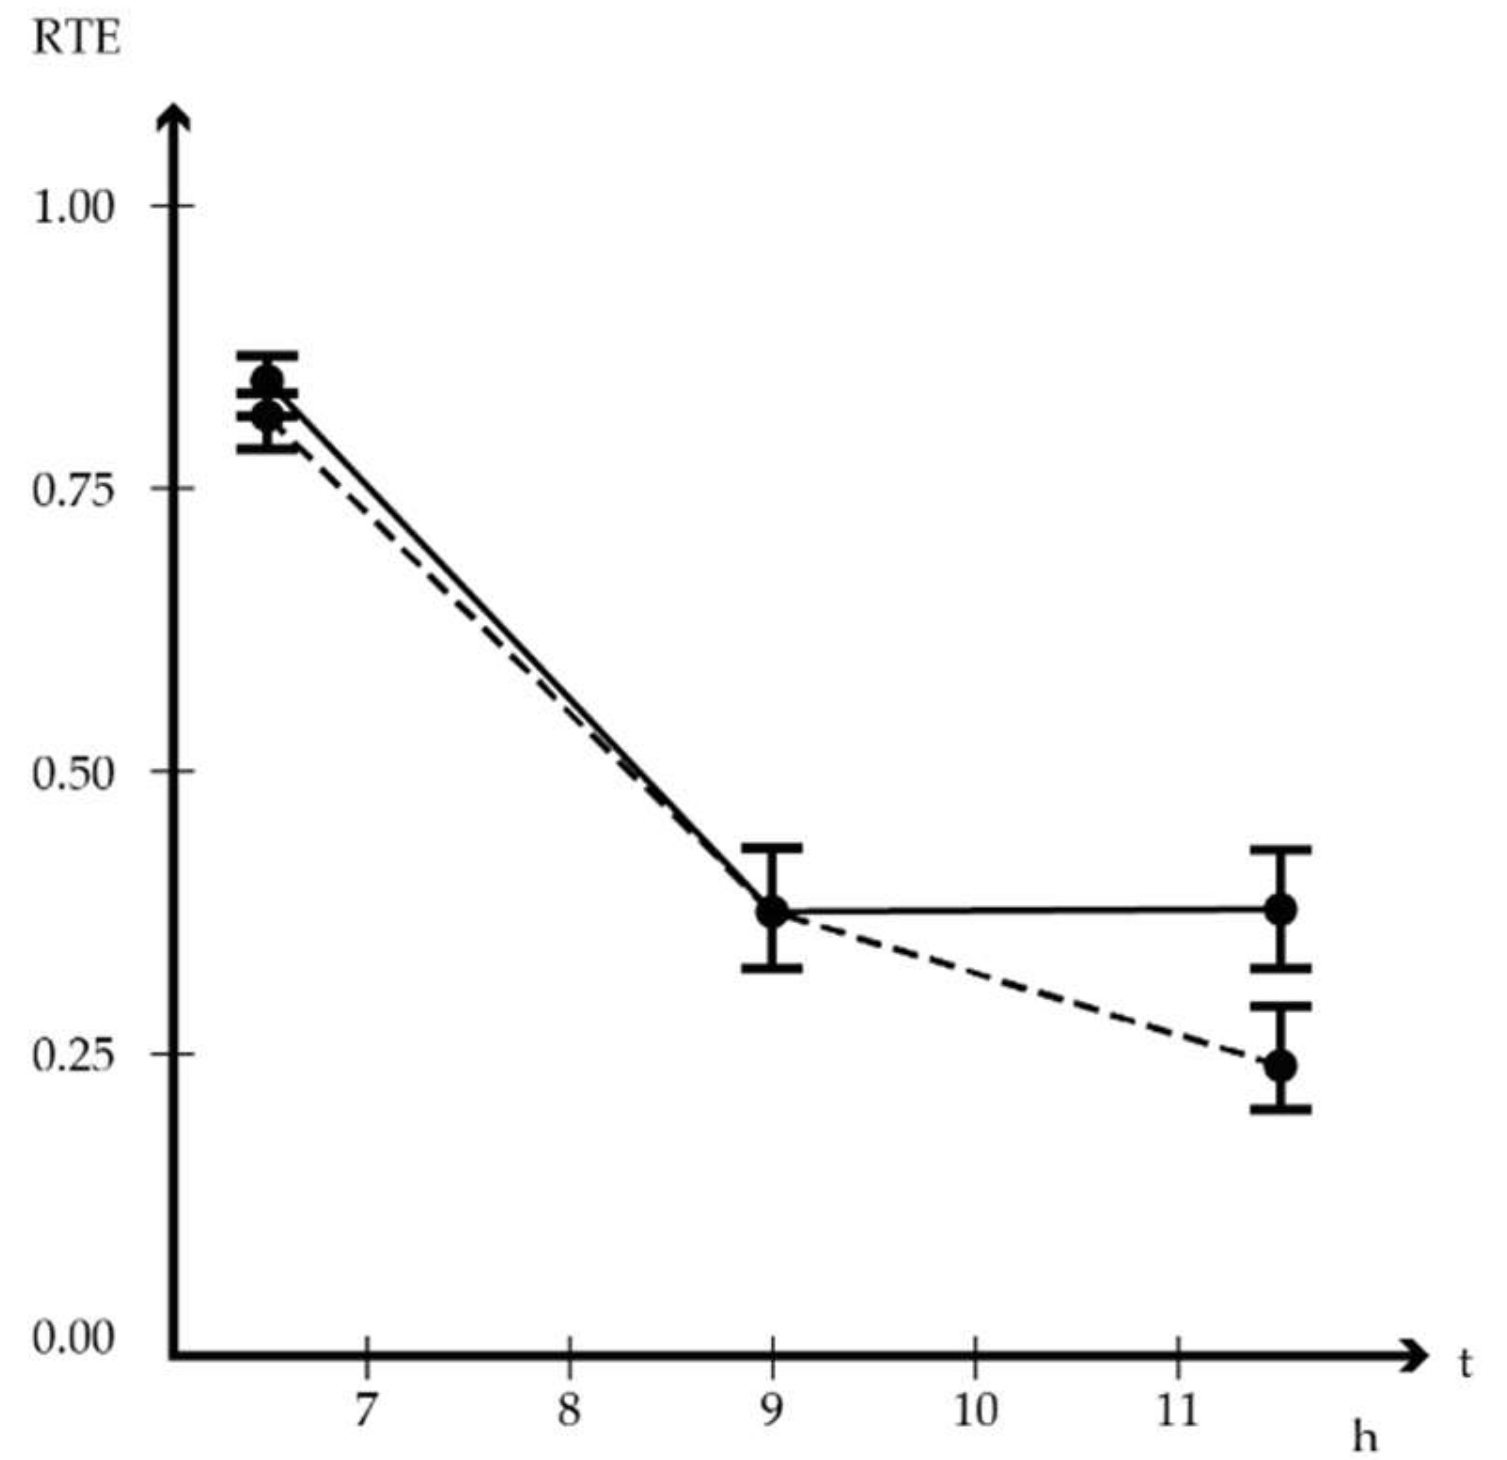
Table 3 shows the shares of the total light supply in the respective classrooms, which were provided by artificial light, for the duration of the study (T1–T5). From the table, e.g., it can be noted that, as is common, daylight harvesting was much lower in the winter months (artificial light share 55.27 ± 27.66% for 80D) than in summer (artificial light share 26.08 ± 32.88% for 80D). Figure 6 aids to analyse which SPD can be expected during those times, respectively. Figure 6a represents a lighting supply yield by artificial light exclusively, while Figure 6c shows how the SPD representation looks whenever artificial light was turned off.
The measurements with the spectrometers show a clear difference in the use of the two sun shading systems (Figure 6). During the activation of the conventional external venetian blind, the characteristic spectrum of daylight almost does not appear, whereas the wide full spectrum of sunlight is clearly shown in the diagram when using the advanced daylighting system.

3.4. Cortisol

No significant difference was found among the morning cortisol levels between T3 and T5. Therefore, data from these time points were pooled for the analysis of salivary cortisol decrease (Table 4). The F1-LD-F1 model for the salivary cortisol decrease between 6:30 AM and 11:30 AM revealed significant treatment, time, and interaction effects. Salivary cortisol levels decrease in both groups. Although post hoc test reveals no further significant effects at the single time points, RTEs indicate lower salivary cortisol levels of the 80D group (RTE 0.24, 2.68 ± 1.54 ng/mL) at midday in comparison to the control group (RTE 0.38, 3.37 ± 2.24 ng/mL) as it is represented in Figure 12.

3.5. PDSS Pediatric Daytime Sleepiness Questionnaire, Sleep Duration, and d-2R Concentration

Table 5 contains daytime sleepiness and sleep duration results. Taking a look at daytime sleepiness during the course of one semester, the outcomes did not change noticeably between T1 (80D, 11.759 ± 4.257; 80R, 12.259 ± 5.815) and T2 (80D, 11.621 ± 4.570; 80R 11.963 ± 5.768), albeit sleep duration decreases significantly (p < 0.01 time effect) in the group with 80D between T1 (8.672 ± 0.782 h) and T2 (7.922 ± 1.223 h). Therefore, the group with advanced daylighting sleeps less with the same level of daytime sleepiness. When looking at daytime sleepiness over two semesters, there is a trend in the main effect for time (p < 0.1). Looking at corresponding RTEs, it becomes clear that the control group suffers from increased daytime sleepiness from T3 (11.613 ± 5.103) to T5 (13.581 ± 5.904), while the values of the 80D group did not increase in between T3 (11.556 ± 3.846) and T5 (10.889 ± 3.945). At the same time, sleep duration decreases significantly in both groups as well from T3 (80D, 8.148 ± 0.959 h; 80R, 8.565 ± 1.124 h) to T5 (80D, 7.574 ± 1.680 h; 80R, 7.306 ± 1.662 h).
Furthermore, Table 5 shows the results of the F1-LD-F1 model regarding the d-2R concentration tests. The test scores of both groups improved considerably during the study, over the course of one semester in between T1 (80D, 104.345 ± 22.502; 80R, 101.852 ± 13.620) and T2 (80D, 109.897 ± 16.205; 80R 114.704 ± 13.958), as well as over the course of two semesters starting at T3 (80D, 107.296 ± 12.776; 80R 104.355 ± 14.190) until T5 (80D, 117.444 ± 12.292; 80R, 114.419 ± 11.372).

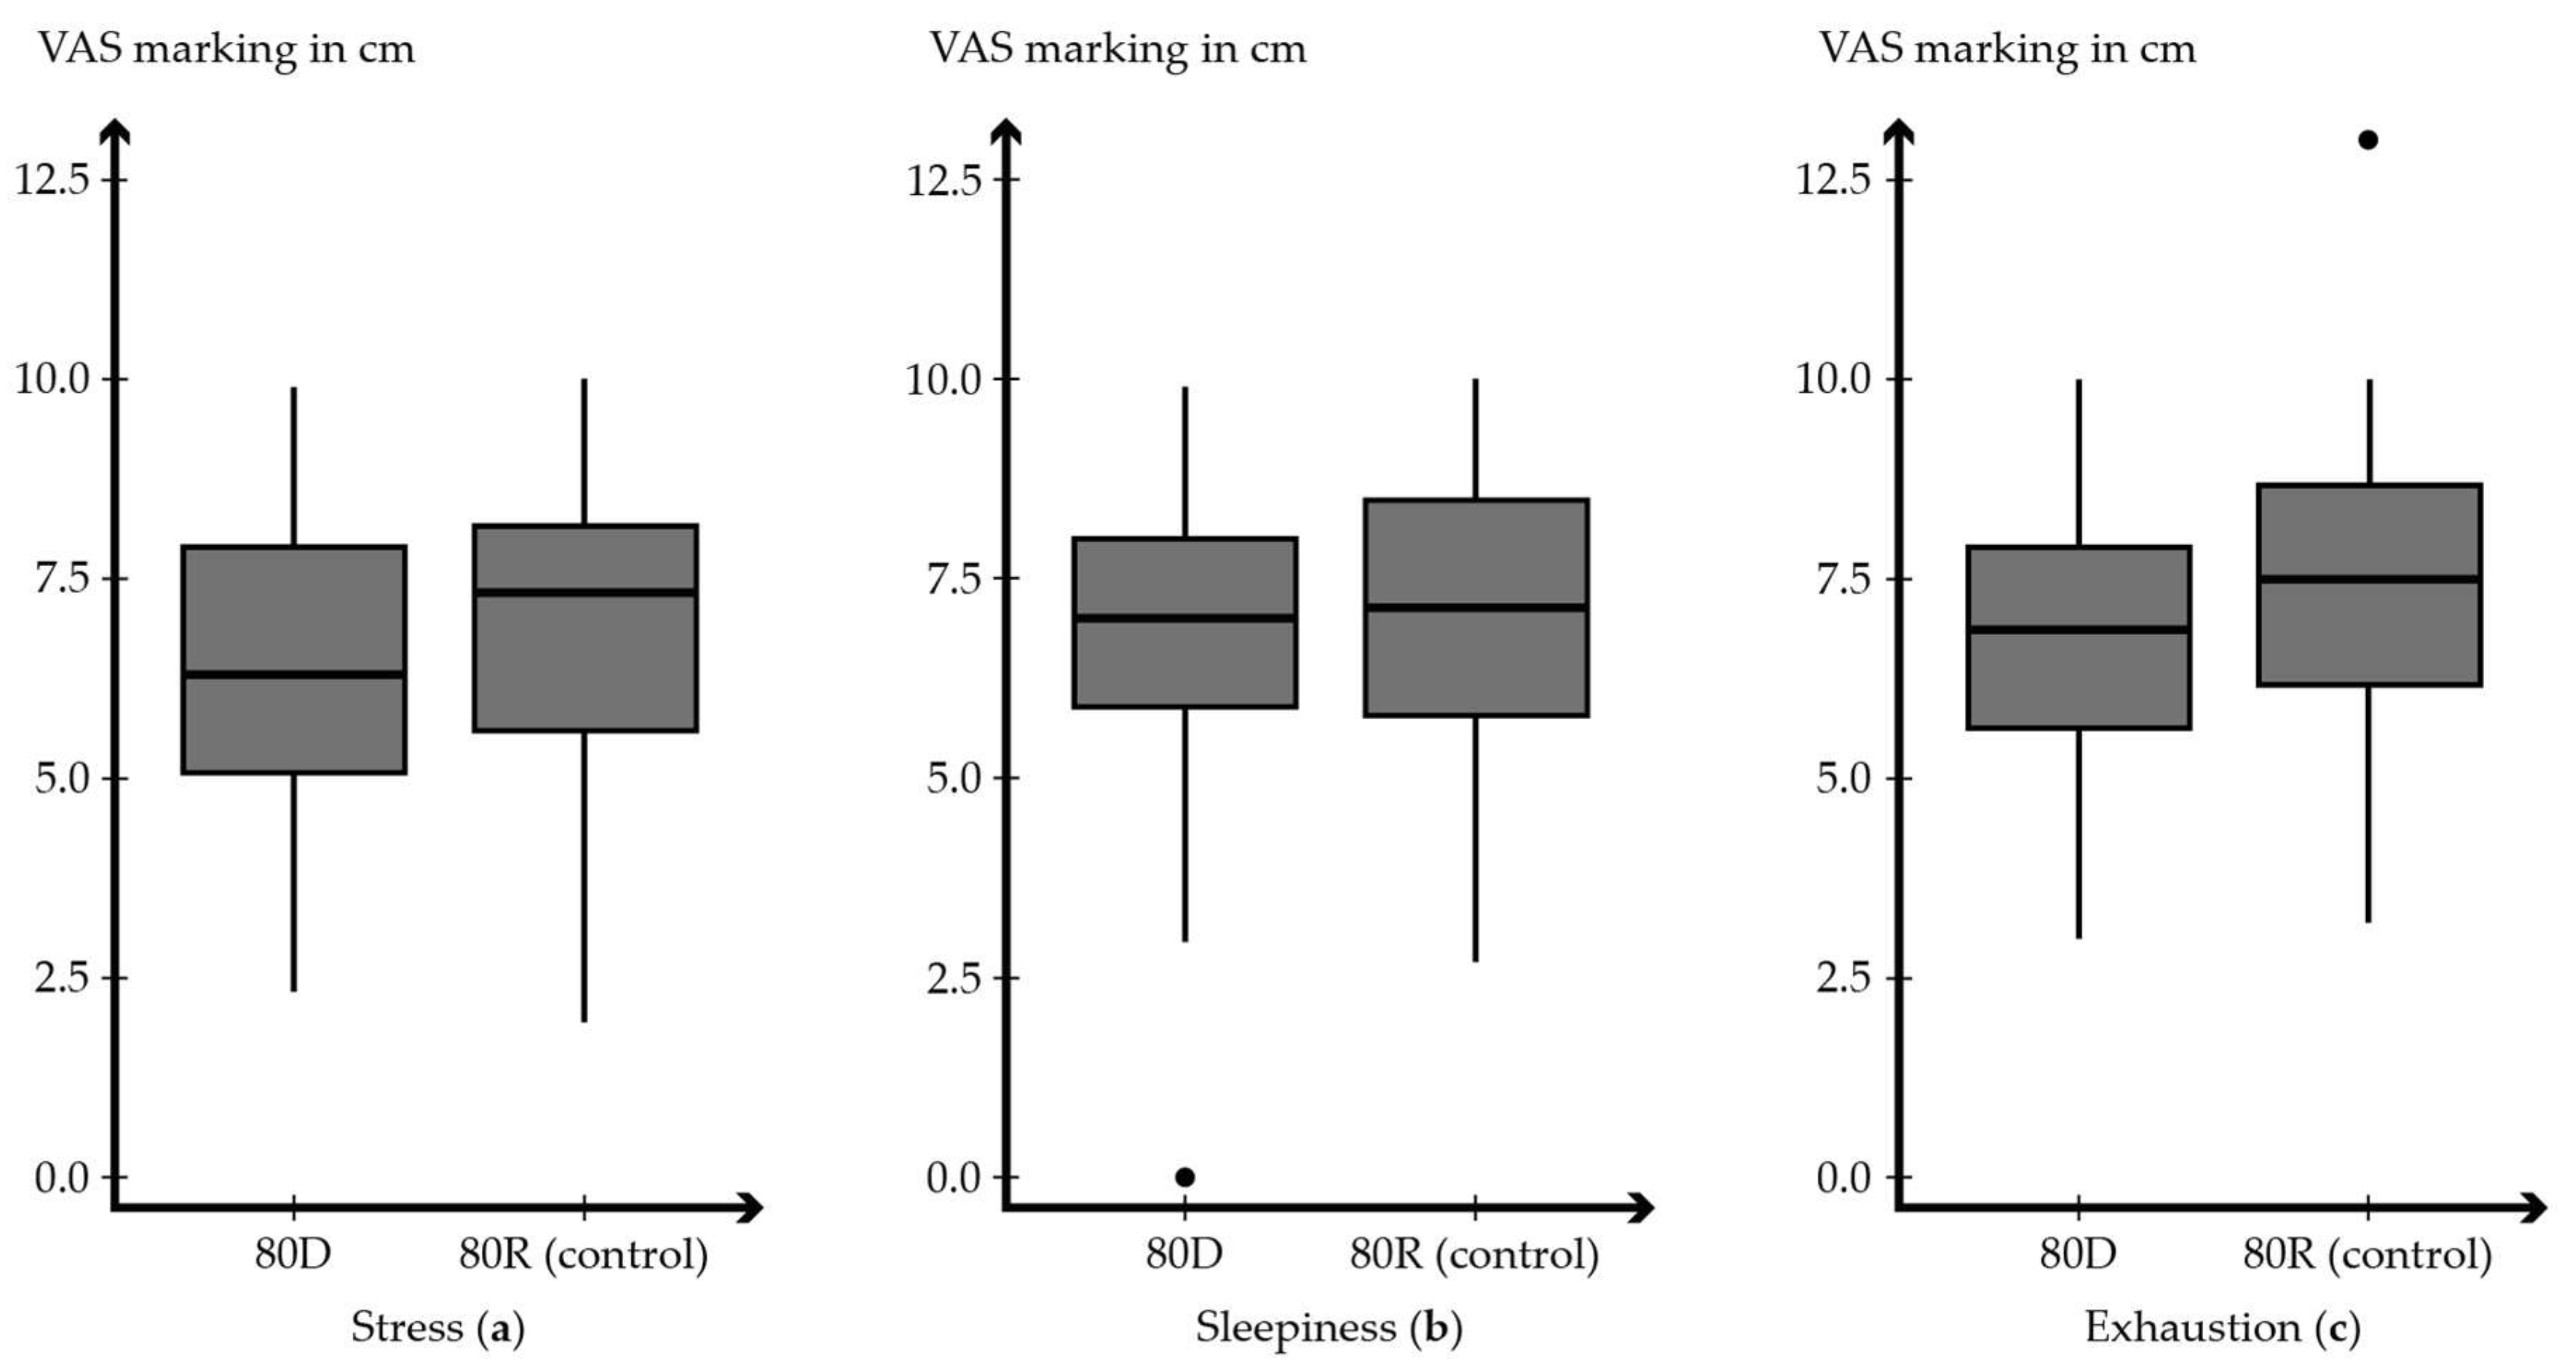
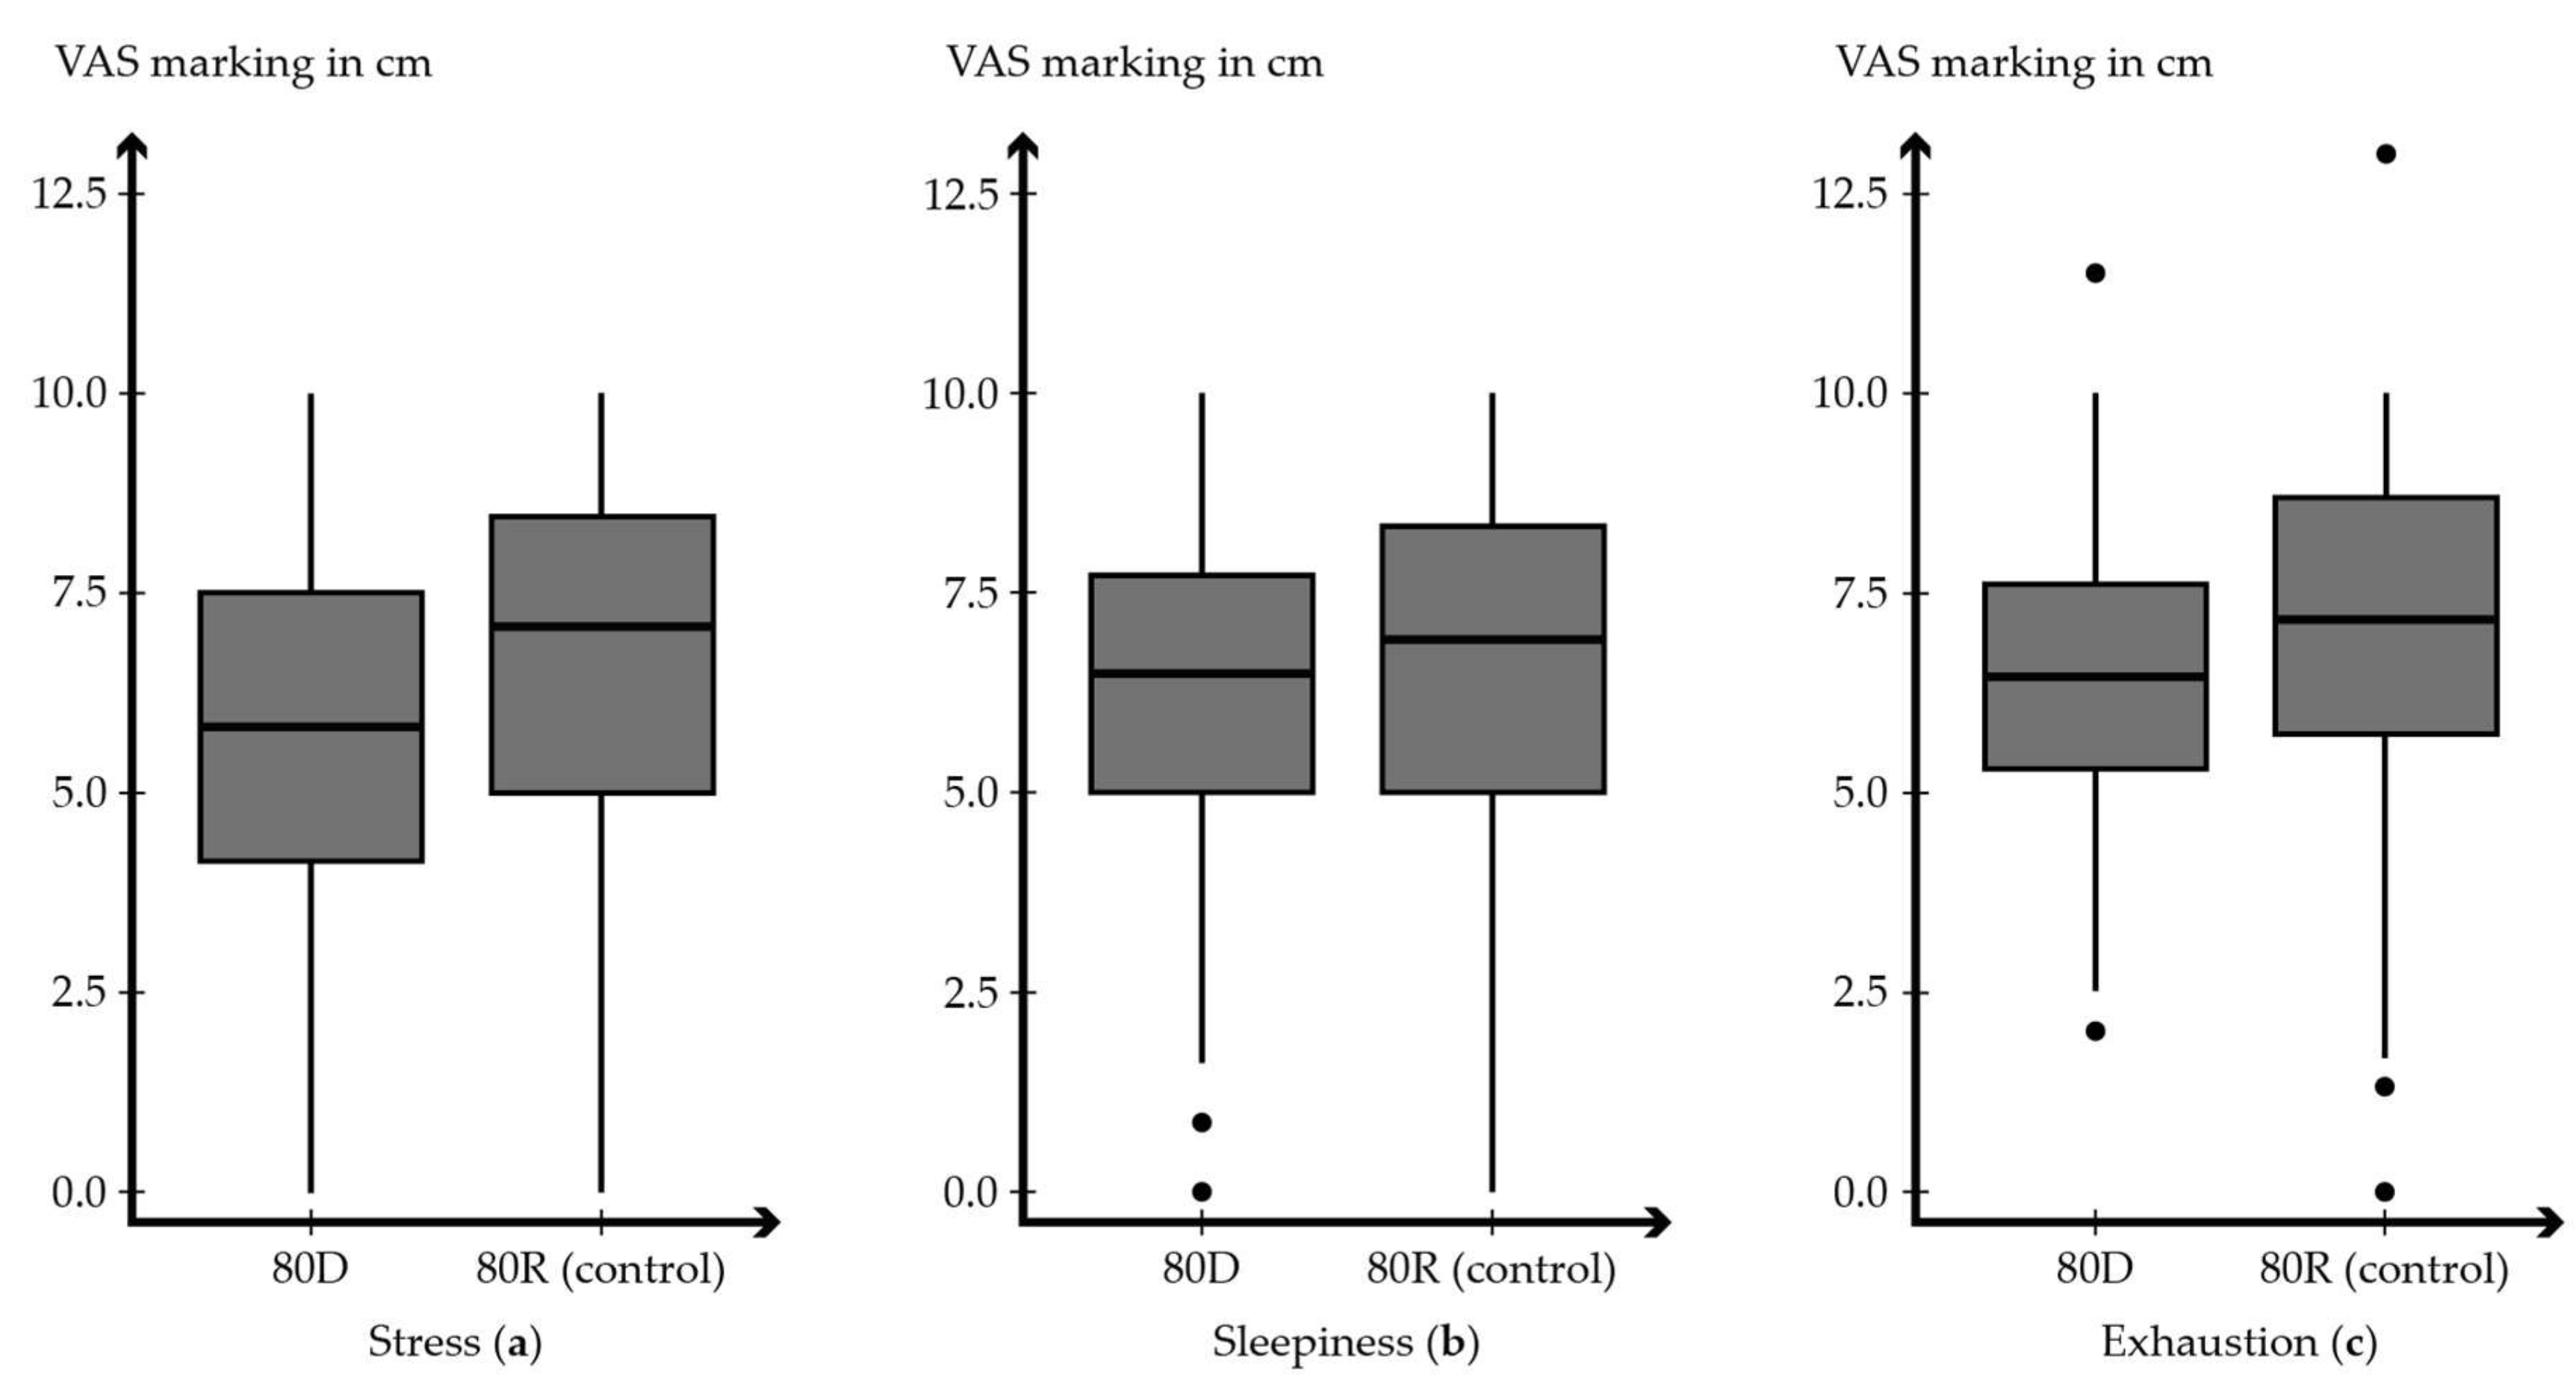
3.6. Visual Analogue Scales

The results of the self-assessment of the physiological and psychological condition by the schoolchildren themselves are summarized in Table 6, as well as in Figure 13 and Figure 14. Over the one-semester course (T1–T2), the lowest score for psychological stress can be found in the 80D group (5.411 ± 1.810 cm), while the highest (best) value on average can be attributed to the control group (7.467 ± 1.616 cm). During the two-semester period (T3T5), a similar picture can be observed. Here, the lowest voting value is also attributable to the 80D group (5.064 ± 2.229 cm), while the highest value lies in the control group (7.290 ± 2.188 cm). In this observation, however, the calculations show a significant difference (p < 0.001) in the simple comparison between 80D and 80R (control). Regarding sleepiness in the one-semester course, the control group has both the lowest (6.430 ± 1.677 cm) and the highest (7.828 ± 1.872 cm) average voting result. It is the same with sleepiness in the two-semester course. Exhaustion voting results for one semester have the same outcome as the ones of psychological stress. The lowest value is within the 80D group (6.193 ± 1.594 cm), while the highest (best) value is found in the control group (7.652 ± 1.743 cm). It is the same with exhaustion in the two-semester observation.

4. Discussion

In the field of IEQ, the relationship between (day-)lighting and user health has been intensively researched for decades. Research projects that confirm scientific findings with real constructive implementations in buildings are not very common in the current literature, which can be experienced by taking a look into current review papers [43,44,45,46,47]. Although it is known that the hormone is subject to a circadian rhythm and is associated with substantial medical inter-relationships, cortisol is rarely addressed in the field of human-centric lighting [10]. Unlike cortisol, the interface between the likewise endogenous hormone melatonin and the long-term health of building users is currently the focus of legislators in Germany and other countries, especially due to the years of development of DIN/TS 5031-100 [48]. Although the links were considered well-known, the melanopic effect of daylight and artificial light sources was significantly questioned in 2015 during the so-called Manchester workshop, as further evidence from ex situ studies emerged, such as that the opacity of the lens of the eye plays an important role in older age and that other photoreceptors besides ipRGC contribute to the melanopic effect. A summary of the workshop results can be viewed as a CIE standard [49]. Since the interface between the hormone cortisol and the lighting situation in buildings currently receives lesser attention from experts than the melanopic effect, it can be expected that findings from field studies will also play an important role in this field in the future. This study additionally addressed the question of how the operator of a building is able to achieve the stated health-promoting effects with the implementation of technology, which is why the results are likewise valuable for the scientific community as well as for professionals in practice and administration.
In this study, with the help of SPD measurement, it can be distinguished at which points in time the interior was supplied with artificial light in combination with sunlight, as the characteristic SPD of the installed energy saving lamps is easily recognizable (Figure 6a). Whenever the daylight supply is not sufficient, artificial light is switched on; this characteristic wavelength distribution is, therefore, shown in combination with daylight (Figure 6b). At time periods when there was enough daylight, the fluorescent lights remained switched off. At these times, the diagrams of the measurement results show a typical curve of a sunlight spectrum (Figure 6c). Just how often the teachers switched on the artificial light is shown in light shares in Table 3. When comparing the curves of SPD with and without switched-on artificial light, it becomes clear that schoolchildren experienced a much more intensive and complete spectrum of light once the total illuminance occurring in the room was provided by daylight only. In addition, the innovative shading blades increase the intensity of daylight indoors by the percentages mentioned in Section 2.3. Therefore, the measurements show that subjects in 80D classrooms were qualitatively and quantitatively exposed to more sunlight during the course of the study.
Initially, it is important to determine whether the psychological or physiological parameters of the subjects were influenced by any uncommon physical IEQ parameters besides lighting. This is why, in addition to the lighting situation, air quality and indoor temperature play an important role in this regard. CO2 concentrations were at or below the benchmark of 1000 ppm at most times of the year. Values above 1400 ppm are categorized as IDA 4 (low indoor air quality) according to DIN EN 16798-3 [19]. In winter, the classrooms with advanced daylighting exceeded 1500 ppm (1293.621 ± 462.284 ppm) occasionally. The indoor air temperature averaged around 24 °C. According to the examples of design criteria for rooms in different types of buildings according to DIN EN ISO 7730, operative temperatures of 23.5 ± 1.0 °C to 23.5 ± 2.5 °C should be planned for kindergartens (schools are not listed) depending on the surface temperatures of surrounding building components [19]. Humidity levels in all classrooms were within a representative range of 40% or below throughout the duration of the study. The conclusions from that (cf. Section 3.2.) and the comparison with the dedicated standards and ordinances show that all influencing parameters are representative. Special attention was paid to the indoor temperature, since 80D is ultimately a shading system, protecting the building from the sun, that must function properly in addition to its supposed positive health effects.
An elevated cortisol level during a period of time that is opposite to the natural biological rhythm is an indicator of an unnecessary amount of psychological stress in the daily life of the studied subjects [50]. There is a highly significant stronger reduction in the pupils’ cortisol level in the classrooms that were equipped with the innovative shading system during the course of the morning in comparison to the control group. The use of advanced daylighting technologies, such as 80D, have a significant stress reducing effect. Table 4 shows that the cortisol levels of pupils in rooms with advanced daylighting are significantly lower (p < 0.001 time effect). Between time points T3 and T5 (October till June), the RTE values resulting from the cortisol saliva samples appeared quite equal after getting up (80D RTE = 0.81, control RTE = 0.84), then, shortly after the start of school day, the values decreased due to the natural circadian rhythm (80D RTE = 0.37, control RTE = 0.38), but, at midday, measurements of the supposed positive effect of the improved supply with daylight become very noticeable (80D RTE = 0.24, control RTE = 0.38). The progression is illustrated in Figure 12. Since this represents a significant difference in cortisol levels between the two groups at that time point of nearly 37%, it is likely that cortisol was reduced more quickly during the day due to the improved supply with natural light.
Supporting these results, it can be additionally observed that the RTEs calculated with the help of the PDSS questionnaire results indicate that the control group suffers more from daytime sleepiness, especially by taking a closer look at the last time point (80D RTE = 0.458, control RTE = 0.606). Overall sleep duration goes down for both groups over time (Table 5), but this means that only the control group suffers from a concurrent increase in daytime sleepiness. Since both positive effects are correlated and each occurs in the group of the classroom with advanced daylighting, it can be argued that 80D have a significant positive influence. The evaluation of the study shows that the installation of the innovative shading system that provides the building with advanced daylight supply leads to a better overnight sleep of the pupils.
The evaluation of the concentration tests shows a clear learning effect. Scales of both groups show a main effect for time in Table 5 (p < 0.001 time effect). 80D, therefore, has no effect on the scales of the D2R when measured over one semester. A similar picture is found when evaluated over two semesters.
In the self-evaluation of schoolchildren by VAS, most of the entries are at a similar level. There were some outliers, especially because children marked outside the scale (higher than 10 mm), which was supposedly a sign to indicate that they were doing particularly well during this time. Trends and also significances in the results of stress and exhaustion can be recognized, which, however, describe mainly a positive situation in the control group. The indications of sleepiness and exhaustion, e.g., started higher in group 80D than in the control group in one semester observation (Table 6). At the end of this period of analysis, the group with advanced daylighting scored lower. None of the results are concerning. The imbalance at the end of the semester may also be due to the exam period.
The use of natural light for a building’s lighting design provides a stronger connection to the daily routines of nature and helps the body to manage its circadian endocrine rhythms. The global trend of urbanization is creating a future situation in which most of the people will be living in dense cities, far away from “healthy” natural parameters. Which is why the handling of those effects, such as daylight, in urban buildings is becoming more and more important. Simply blocking the light from coming in will not be a solution for smart cities of the future. Sunlight needs to be controlled for the indoor environment to remain comfortable, rather than blocked by shading systems. Without shading, the summer sun would overheat the building and the winter sun will glare the building’s user. Consequently, as this study shows, daylighting brings a plausible combination of medical and engineering benefits. In this project, scientists of the medical, engineering, and architectural fields worked together to change a built environment. This interdisciplinary effort made a longitudinal clinical trial possible, the specific results of which are giving an inside perspective into the practical impacts of theoretical medical relations. The otherwise scarce level of information is likewise an important trigger for a change in the market and highlights the share of both healthy and sustainable methods in the creation of modern architecture.

Limitations

Only one school was studied. Therefore, no conclusion can be drawn about the built and natural environment surrounding the school, e.g., in front of the south-south-east facade is a tree, which might influence the classrooms by shading them in different intensities over the year. To avoid a specific bias, both the 80D and the 80R were compared in the third and fourth floor. Shading from the tree, if any occured, was comparable for both groups. Furthermore, most of the direct light is being blocked by the shading system anyway, which is why the tree shadow’s impact is almost insignificant.

5. Conclusions

  • Advanced daylight supply can improve cortisol balance in schoolchildren.
  • Providing more natural light can lower daytime sleepiness, even if sleep duration decreases.
  • Indoors, the benefits of natural light can be obtained by utilizing innovative technology.
Different sources of artificial light and daylight differ considerably in their SPD. Thereby, qualities of light affect health maintenance of our body in a diverse manner. Exposure to school classrooms with advanced daylighting through the use of special sun protection shading blades, redirecting more natural light into the building than convenient blades, led to improved hormonal balance with respect to endogenous cortisol, as well as better sleep quality in schoolchildren during a three-semester clinical study, with reference to the baseline characteristics. Other physical environmental parameters were controlled and remained within a normative range. It is, therefore, very likely that the implementation of innovative daylighting technologies can be used to achieve the known health benefits of sunlight for building users. Studies that are based on specific building measures involve interdisciplinary collaboration between physicians, architects, or engineers. Only when investigating buildings in operation can all the inter-relationships and influencing variables really be considered. The study results attest to the importance of high-quality and nature-based IEQ, in this case, the visual components. The state of knowledge could be extended by further evidence, which shows that decisions in construction and operation of buildings regarding daylight and artificial light supply have a direct influence on the health of building users. Technologies that allow quality light with a full spectrum to reach people indoors, while taking into account the avoidance of overheating the building, should therefore be given preference by operators and developers.

Author Contributions

The study was registered at ISRCTN15982336. Conceptualization, C.R. and A.H.; methodology, C.R., J.F. and A.H.; formal analysis, M.N., C.R., J.F. and D.H.; investigation, M.N., N.G., C.R., J.F., R.W.-E. and A.H.; writing—original draft preparation, M.N.; writing—review and editing, N.G., J.F., D.H., C.P., R.W.-E. and A.H.; visualization, M.N. and J.F.; supervision, A.H.; project administration, C.R. and A.H.; funding acquisition, C.R. and A.H. All authors have read and agreed to the published version of the manuscript.

Funding

This project was funded by the Federal State of Salzburg, Austria (funding scheme: Trans4Tech). Sponsors had no role in the design of the study; in the collection, analyses, or interpretation of data; in the writing of the manuscript, or in the decision to publish the results.

Institutional Review Board Statement

The study was conducted in accordance with the Declaration of Helsinki, and approved by the Ethics Committee of the Federal State of Salzburg, 5010 Salzburg, Austria (protocol code 415-E/1857/2-2015, 16 March 2015).

Informed Consent Statement

Informed consent was obtained from all subjects involved in the study, resp. their legal guardians.

Data Availability Statement

Not applicable.

Acknowledgments

We greatly appreciate the New Secondary School Adnet and all of our study participants that enabled the implementation of the study. We want to thank Erich Franek, NSSA school’s principal, and Wolfgang Auer, mayor of Adnet (Austria), for their important support. Many thanks to our industrial partners “Schlotterer Sonnenschutz Systeme GmbH—CEO Peter Gubisch and technician Michael Mayr, our research partners “Landesinnung BAU Salzburg” and the ITG—“Innovationsservice für Salzburg” for the initialization of this project, as well as their invaluable support and collaboration.

Conflicts of Interest

The authors declare no competing interests.

References

  1. Houser, K.; Boyce, P.; Zeitzer, J.; Herf, M. Human-centric lighting: Myth, Magic or Metaphor? Lighting Res. Technol. 2020, 53, 97–118. [Google Scholar] [CrossRef]
  2. Elverson, C.A.; Wilson, M.E. Cortisol: Circadian Rhythm and Response to a Stressor. Newborn Infant Nurs. Rev. 2005, 5, 159–169. [Google Scholar] [CrossRef]
  3. Arendt, D. Evolution of eyes and photoreceptor cell types. Int. J. Dev. Biol. 2003, 47, 563–571. [Google Scholar]
  4. Hernández-Andrés, J.; Romero, J.; Nieves, J.L.; Lee, R.L. Color and spectral analysis of daylight in southern Europe. J. Opt. Soc. Am. A 2001, 18, 1325. [Google Scholar] [CrossRef]
  5. Judd, D.B.; MacAdam, D.L.; Wyszecki, G.; Budde, H.W.; Condit, H.R.; Henderson, S.T.; Simonds, J.L. Spectral Distribution of Typical Daylight as a Function of Correlated Color Temperature. J. Opt. Soc. Am. 1964, 54, 1031. [Google Scholar] [CrossRef]
  6. Brainard, G.C.; Hanifin, J.P.; Greeson, J.M.; Byrne, B.; Glickman, G.; Gerner, E.; Rollag, M.D. Action Spectrum for Melatonin Regulation in Humans: Evidence for a Novel Circadian Photoreceptor. J. Neurosci. 2001, 21, 6405–6412. [Google Scholar] [CrossRef] [PubMed] [Green Version]
  7. Thapan, K.; Arendt, J.; Skene, D.J. An action spectrum for melatonin suppression: Evidence for a Novel Non-Rod, Non-Cone Photoreceptor System in Humans. J. Physiol. 2001, 535, 261–267. [Google Scholar] [CrossRef]
  8. Lucas, R.J.; Peirson, S.N.; Berson, D.M.; Brown, T.M.; Cooper, H.M.; Czeisler, C.A.; Figueiro, M.G.; Gamlin, P.D.; Lockley, S.W.; O’Hagan, J.B.; et al. Measuring and using light in the melanopsin age. Trends Neurosci. 2014, 37, 1–9. [Google Scholar] [CrossRef] [PubMed]
  9. Stevens, R.G. Circadian Disruption and Breast Cancer: From Melatonin to Clock Genes. Epidemiology 2005, 16, 254–258. [Google Scholar] [CrossRef]
  10. Sephton, S.; Spiegel, D. Circadian disruption in cancer: A Neuroendocrine-Immune Pathway from Stress to Disease? Brain Behav. Immun. 2003, 17, 321–328. [Google Scholar] [CrossRef]
  11. Fasciani, I.; Petragnano, F.; Aloisi, G.; Marampon, F.; Rossi, M.; Coppolino, M.F.; Rossi, R.; Longoni, B.; Scarselli, M.; Maggio, R. A New Threat to Dopamine Neurons: The Downside of Artificial Light. Neuroscience 2020, 432, 216–228. [Google Scholar] [CrossRef] [PubMed]
  12. Moriske, H.-J. (Ed.) Stellungnahme der Kommission Innenraumlufthygiene am Umweltbundesamt; Umweltbundesamt: Dessau-Roßlau, Germany, 2020. [Google Scholar]
  13. al horr, Y.; Arif, M.; Katafygiotou, M.; Mazroei, A.; Kaushik, A.; Elsarrag, E. Impact of indoor environmental quality on occupant well-being and comfort: A Review of the Literature. Int. J. Sustain. Built Environ. 2016, 5, 1–11. [Google Scholar] [CrossRef]
  14. Gudipudi, R.; Fluschnik, T.; Ros, A.G.C.; Walther, C.; Kropp, J.P. City density and CO2 efficiency. Energy Policy 2016, 91, 352–361. [Google Scholar] [CrossRef]
  15. Maller, C.; Townsend, M.; Pryor, A.; Brown, P.; Leger, L.S. Healthy nature healthy people: ‘contact with nature’ as an upstream health promotion intervention for populations. Health Promot. Int. 2006, 21, 45–54. [Google Scholar] [CrossRef] [PubMed] [Green Version]
  16. DIN EN 17037:2019; Daylight in Buildings. German Institute for Standardisation: Berlin, Germany, 2019.
  17. Gasparella, A.; Pernigotto, G.; Cappelletti, F.; Romagnoni, P.; Baggio, P. Analysis and modelling of window and glazing systems energy performance for a well insulated residential building. Energy Build. 2011, 43, 1030–1037. [Google Scholar] [CrossRef]
  18. Wacker, M.; Holick, M.F. Sunlight and Vitamin D: A Global Perspective for Health. Derm. Endocrinol. 2013, 5, 51–108. [Google Scholar] [CrossRef] [Green Version]
  19. DIN EN ISO 7730:2006; Ergonomics of the Thermal Environment—Analytical Determination and Interpretation of Thermal Comfort Using Calculation of the PMV and PPD Indices and Local Thermal Comfort Criteria. German Institute for Standardisation: Berlin, Germany, 2006.
  20. Bartlett, D.J.; Biggs, S.N.; Armstrong, S.M. Circadian rhythm disorders among adolescents: Assessment and Treatment Options. Med. J. Aust. 2013, 199, S16–S20. [Google Scholar] [CrossRef]
  21. Klepeis, N.E.; Nelson, W.C.; Ott, W.R.; Robinson, J.P.; Tsang, A.M.; Switzer, P.; Behar, J.V.; Hern, S.C.; Engelmann, W.H. The National Human Activity Pattern Survey (NHAPS): A Resource for Assessing Exposure to Environmental Pollutants. J. Expo Sci. Environ. Epidemiol. 2001, 11, 231–252. [Google Scholar] [CrossRef] [Green Version]
  22. Committee on Environmental Health. Ambient Air Pollution: Health Hazards to Children. Pediatrics 2004, 114, 1699–1707. [Google Scholar] [CrossRef] [Green Version]
  23. Mors, S.T.; Hensen, J.L.M.; Loomans, M.G.L.C.; Boerstra, A.C. Adaptive thermal comfort in primary school classrooms: Creating and Validating PMV-Based Comfort Charts. Build. Environ. 2011, 46, 2454–2461. [Google Scholar] [CrossRef] [Green Version]
  24. Yun, H.; Nam, I.; Kim, J.; Yang, J.; Lee, K.; Sohn, J. A field study of thermal comfort for kindergarten children in Korea: An Assessment of Existing Models and Preferences of Children. Build. Environ. 2014, 75, 182–189. [Google Scholar] [CrossRef]
  25. Turunen, M.; Toyinbo, O.; Putus, T.; Nevalainen, A.; Shaughnessy, R.; Haverinen-Shaughnessy, U. Indoor environmental quality in school buildings, and the health and wellbeing of students. Int. J. Hyg. Environ. Health 2014, 217, 733–739. [Google Scholar] [CrossRef] [PubMed]
  26. Hansen, M. The Impact of School Daily Schedule on Adolescent Sleep. Pediatrics 2005, 115, 1555–1561. [Google Scholar] [CrossRef] [PubMed] [Green Version]
  27. mpfs, Welche Freizeitaktivitäten übst Du Täglich oder Wöchentlich Aus? 2019. Available online: https://de.statista.com/statistik/daten/studie/29982/umfrage/regelmaessige-freizeitaktivitaeten-von-kindern/ (accessed on 23 November 2020).
  28. Samiou, A.I.; Doulos, L.T.; Zerefos, S. Daylighting and artificial lighting criteria that promote performance and optical comfort in preschool classrooms. Energy Build. 2022, 258, 111819. [Google Scholar] [CrossRef]
  29. Booysen, M.J.; Samuels, J.A.; Grobbelaar, S.S. LED there be light: The Impact of Replacing Lights at Schools in South Africa. Energy Build. 2021, 235, 110736. [Google Scholar] [CrossRef]
  30. Tahsildoost, M.; Zomorodian, Z.S. Indoor environment quality assessment in classrooms: An Integrated Approach. J. Build. Phys. 2018, 42, 336–362. [Google Scholar] [CrossRef]
  31. World Bank; UN DESA. Urbanisierungsgrad: Anteil der Stadtbewohner an der Gesamtbevölkerung in Deutschland in den Jahren von 2000 bis 2019. Statista. 2020. Available online: https://de.statista.com/statistik/daten/studie/662560/umfrage/urbanisierung-in-deutschland/ (accessed on 25 June 2021).
  32. RETROLux 80D Tageslichtlenkung. 2020. Available online: www.schlotterer.com/de/produkte/retrolux-80d (accessed on 12 April 2021).
  33. Meyer, C.; Junior, G.J.F.; Barbosa, D.G.; Andrade, R.D.; Pelegrini, A.; Felden, É.P.G. Analysis of daytime sleepiness in adolescents by the Pediatric daytime sleepiness scale: A Systematic Review. Rev. Paul. De Pediatr. 2017, 35, 351–360. [Google Scholar] [CrossRef] [Green Version]
  34. Brickenkamp, R. d2–Aufmerksamkeits-Belastungstest; Hogrefe: Göttingen, Germany, 2002. [Google Scholar]
  35. DIN German Institute for Standardization, DIN EN 13211 Air Quality—Stationary Source Emissions—Manual Method of Determination of the Concentration of Total Mercury; German Version EN 13211:2001. 2001. Available online: https://www.perinorm.com/document.aspx?hitnr=0&q=AC:DE45757898 (accessed on 26 April 2021).
  36. Association of Engineers, VDI 2078 Calculation of Thermal Loads and Room Temperatures (Design Cooling Load and Annual Simulation). 2015. Available online: https://www.perinorm.com/document.aspx?hitnr=0&q=AC:DE88185767 (accessed on 26 April 2021).
  37. rgb Photonics User Manual. 2020. Available online: https://www.rgb-photonics.com/fileadmin/user_upload/downloads/manuals/Qmini_1_Spectrometer.pdf (accessed on 14 October 2021).
  38. Brickenkamp, R.; Schmidt-Atzert, L.; Liepmann, D. d2-R–Aufmerksamkeits-und Konzentrationstest; Hogrefe Verlag: Göttingen, Germany, 2010. [Google Scholar]
  39. Lazor, T.; Tigelaar, L.; Pole, J.D.; de Souza, C.; Tomlinson, D.; Sung, L. Instruments to measure anxiety in children, adolescents, and young adults with cancer: A Systematic Review. Support. Care Cancer 2017, 25, 2921–2931. [Google Scholar] [CrossRef]
  40. von Baeyer, C.L. Children’s Self-Reports of Pain Intensity: Scale Selection, Limitations and Interpretation. Pain Res. Manag. 2006, 11, 157–162. [Google Scholar] [CrossRef]
  41. Noguchi, K.; Gel, Y.R.; Brunner, E.; Konietschke, F. nparLD: An R Software Package for the Nonparametric Analysis of Longitudinal Data in Factorial Experiments. J. Stat. Softw. 2012, 50, 1–23. [Google Scholar] [CrossRef] [Green Version]
  42. Weinfurt, K.P. Repeated measures analysis: Anova, Manova, and Hlm. In Reading and Understanding More Multivariate Statistics; American Psychological Association: Washington, DC, USA, 2000; pp. 317–361. [Google Scholar]
  43. Zeitzer, J.M. When is a proxy not a proxy? The foibles of studying non-image forming light. J. Physiol. 2018, 596, 2029–2030. [Google Scholar] [CrossRef] [PubMed] [Green Version]
  44. Vetter, C.; Pattison, P.M.; Houser, K.; Herf, M.; Phillips, A.J.K.; Wright, K.P.; Skene, D.J.; Brainard, G.C.; Boivin, D.B.; Glickman, G. A Review of Human Physiological Responses to Light: Implications for the Development of Integrative Lighting Solutions. Leukos 2021, 18, 1–28. [Google Scholar] [CrossRef]
  45. Vetter, C. Circadian disruption: What Do We Actually Mean? Eur. J. Neurosci. 2020, 51, 531–550. [Google Scholar] [CrossRef] [PubMed] [Green Version]
  46. Rossi, M. Conclusions and Possible Guidelines for Circadian Lighting Design. In Circadian Lighting Design in the LED Era; Springer International Publishing: Cham, Switzerland, 2019; pp. 257–277. [Google Scholar] [CrossRef]
  47. Safranek, S.; Collier, J.M.; Wilkerson, A.; Davis, R.G. Energy impact of human health and wellness lighting recommendations for office and classroom applications. Energy Build. 2020, 226, 110365. [Google Scholar] [CrossRef]
  48. DIN/TS 5031-100:2021; Optical Radiation Physics and Illuminating Engineering—Melanopic Effects of Ocular Light on Human Beings—Quantities, Symbols and Action Spectra. German Institute for Standardisation: Berlin, Germany, 2021.
  49. CIE TN 003:2015; Report on the First International Workshop on Circadian and Neurophysiological Photometry. International Commission on Illumination: Vienna, Austria, 2015.
  50. Hellhammer, D.H.; Wüst, S.; Kudielka, B.M. Salivary cortisol as a biomarker in stress research. Psychoneuroendocrinology 2009, 34, 163–171. [Google Scholar] [CrossRef]
Figure 1. Schlotterer RETROLux 80D shading blade, reflecting sunlight direct in winter.
Buildings 12 00600 g001
Figure 2. Schlotterer 80R shading blade design, reflecting sunlight diffuse at any time.
Buildings 12 00600 g002
Figure 3. Structural design of the connection detail in the window reveal for the installation of the 80D shading system at NSSA. This is also standard procedure for installation in solid brickwork with external thermal insulation.
Buildings 12 00600 g003
Figure 4. NSSA floor plan (oriented). Furnishing situation of each classroom consists of cabinets, a blackboard and teacher’s workspace, and desks with two seats each for pupils. The door is located opposite the window side. All investigated classrooms have identical equipment. Red dot: measuring point for SPD.
Buildings 12 00600 g004
Figure 5. Reflected ceiling plan. Existing artificial lighting equipment in the investigated classrooms consists of fluorescent lamps in 60 cm by 60 cm grid arrays. There are eight lamps in total, which are distributed in a circular pattern for uniform illumination of the room.
Buildings 12 00600 g005
Figure 6. SPD of different light situations inside NSSA, measured in spectral radiant flux (electromagnetic radiation power) as a function of wavelength. (a): Measurement of mainly artificial lighting (fluorescent lamps in combination with activated conventional shading 80R) of visual wavelengths in order to demonstrate the characteristic spectrum. (b): Artificial light distribution of the visual spectrum indoors in combination with natural light (activated advanced daylighting 80D). (c): Natural light distribution of the visual spectrum exclusively inside NSSA (no shading system active).
Buildings 12 00600 g006
Figure 7. False-color representation of daylight illumination at NSSA. The intensity distribution of illumination varies from 100 lx (light yellow) along side of the door to 2000 lx (light blue) on the window side.
Buildings 12 00600 g007
Figure 8. False-color representation of artificial light illumination at NSSA. The intensity distribution of illumination varies from 150 lx (yellow) at the far edge of the room to 750 lx (dark green).
Buildings 12 00600 g008
Figure 9. False-color representation of combined daylight and artificial light illumination at NSSA. Exemplary calculation for 21 March at 10 am.
Buildings 12 00600 g009
Figure 10. Study timetable: classes A and B participate during the whole period of time (T1 to T5), while classes C and D graduated after time point 2, which is why classes E and F joined the study at time point 3. VAS was performed once a week, regardless of the time points.
Buildings 12 00600 g010
Figure 11. Study flowchart of schoolchildren included and excluded in the respective semesters presented by a CONSORT flow diagram. Due to the graduation of classes C and D, classes E and F were added after the summer leave.
Buildings 12 00600 g011
Figure 12. Cortisol levels of the morning hours plotted over time (calculation of the combined results of one semester after summer leave), RTE of classes A, B, E, F; dashed line: 80D with advanced daylighting, solid line: 80R (control).
Buildings 12 00600 g012
Figure 13. Results of visual analogue scales for self-assessment over the course of 1 semester from T1 to T2 of stress (a) (p = 0.017), sleepiness (b) (p = 0.061), and exhaustion (c) (p = 0.002) on a scale of 0 to 10 cm (one schoolchild voted out of scale). In this case, the Y-axis scale extends to 12.5 cm because the children voted off-scale in the questionnaire. The black dots represent outliers.
Buildings 12 00600 g013
Figure 14. Results of visual analogue scales for self-assessment over the course of 2 semester from T3 to T5 of stress (a) (p < 0.001), sleepiness (b) (p = 0.590), and exhaustion (c) (p = 0.024) on a scale of 0 to 10 cm (some schoolchildren voted out of scale). In this case, the Y-axis scale extends to 12.5 cm because the children voted off-scale in the questionnaire. The black dots represent outliers.
Buildings 12 00600 g014
Table 1. Baseline characteristics of the study population.
Participation1 Semester Starting at T12 Semesters Starting at T3Whole Study
Group80D80R (Control)80D80R (Control)80D80R (Control)
Number292727315658
Sex—male141915133427
Sex—female15816142429
Age (years)10.83 ± 0.6610.63 ± 0.6310.59 ± 0.5710.45 ± 0.5110.71 ± 0.6210.53 ± 0.57
Cortisol * (ng/mL)N/AN/A12.07 ± 6.59.75 ± 6.2313.6 ± 6.679.76 ± 5.68
PDSS total score11.76 ± 4.2612.26 ± 5.8211.56 ± 3.8511.61 ± 5.111.66 ± 4.0311.91 ± 5.41
Sleep duration (h)8.67 ± 0.788.44 ± 1.148.15 ± 0.968.56 ± 1.128.42 ± 0.98.51 ± 1.12
Data are presented as the mean ± SD; no significant baseline differences were found; 1 semester participation includes students from class A–D, two semester participation includes students from class A, B, E, and F, and whole study participation includes students from class A–F. * Baseline levels at 6:30 AM.
Table 2. Measured variables concerning indoor air quality, i.e., CO2 (ppm), relative air humidity (%), air temperature (°C).
MonthsTime PointCO2 (ppm)Air Humidity (%)Air Temperature (°C)
80D80R (Control)80D80R (Control)80D80R (Control)
March–May1982.68 ± 424.77896.54 ± 409.7435.98 ± 5.9236.97 ± 6.3924.84 ± 1.4224.82 ± 1.72
June2674.38 ± 278.43839.91 ± 443.4944.68 ± 3.1642.83 ± 4.8226.66 ± 1.1225.39 ± 1.80
October–November31066.52 ± 485.651054.97 ± 420.8739.30 ± 5.2436.09 ± 4.9824.04 ± 1.0224.21 ± 0.99
December–February31293.62 ± 462.281070.96 ± 466.2135.46 ± 5.1037.06 ± 6.0124.03 ± 1.0524.67 ± 1.26
March–May4982.68 ± 424.77896.54 ± 409.7435.98 ± 5.9236.97 ± 6.3924.84 ± 1.4224.82 ± 1.72
June5674.38 ± 278.43839.91 ± 443.4944.68 ± 3.1642.83 ± 4.8226.66 ± 1.1225.39 ± 1.80
Data are presented as the mean ± SD.
Table 3. Artificial light shares (%) measured near the teacher’s desk (Figure 4).
MonthsTime Point80D80R (Control)
Mean ± SDMedian ± IQRMean ± SDMedian ± IQR
March–May124.90 ± 31.150.00 ± 45.4631.81 ± 32.4728.57 ± 55.67
June226.08 ± 32.880.00 ± 54.5529.93 ± 32.1510.00 ± 56.00
October–November340.10 ± 29.8941.88 ± 0.9231.19 ± 30.8030.95 ± 55.56
December–February355.27 ± 27.6659.17 ± 40.6348.96 ± 34.3755.05 ± 52.14
March–May424.90 ± 31.150.00 ± 45.4631.81 ± 32.4728.57 ± 55.67
June526.08 ± 32.880.00 ± 54.5529.93 ± 32.1510.00 ± 56.00
Data are presented as the mean ± SD.
Table 4. Results from the F1-LD-F1 model, including relative treatment effects for salivary cortisol over the course of Semester 2–3.
F1-LD-F1 Pretest for Equal Baseline ValuesRelative Treatment Effects (RTE)
Fp-Value 1Time Point80D80R (Control)
Cortisol at 6:30 AMTreatment1.35 (1.00, ∞)0.245n.s. 80D0.54Control0.47
Semester 2–3Time1.68 (1.96, ∞)0.188n.s.T30.4880D × T30.4980R × T30.48
Treat. × Time0.89 (1.96, ∞)0.408n.s.T40.5580D × T40.5880R × T40.51
T50.4780D × T50.5480R × T50.41
F1-LD-F1 Model for Cortisol DecreaseRelative Treatment Effects (RTE)
Fp-Value 1Time of Day80D80R (Control)
Cortisol decreasesTreatment4.60 (1.00, ∞)0.032* 80D0.48Control0.53
6:30 AM–11:30 AMTime253.43 (1.91, ∞)0.000***06:300.8380D × 06:300.8180R × 06:300.84
Treat. × Time3.91 (1.91, ∞)0.022*09:000.3880D × 09:000.3780R × 09:000.38
Treat. × 09:000.96 (1.00, ∞)0.353n.s.11:300.3180D × 11:300.2480R × 11:300.38
Treat. × 11:301.83 (1.00, ∞)0.353n.s.
F1-LD-F1 model with time and treatment and the interaction of treatment and time (treat × time). No effect on the morning values over time or through the treatment was evaluated. All times from the school year 2015 and 2016 can be pooled for a common evaluation. 1 Significance level is indicated as *** p < 0.001; * p < 0.05; n.s. (not significant).
Table 5. Results from the F1-LD-F1 models for daytime sleepiness, sleep duration, and concentration.
F1-LD-F1 ModelRelative Treatment Effects (RTE)
Fp-Value 1Time Point80D80R (Control)
Daytime sleepiness
Semester 1
Treatment0.2440.622n.s. 80D0.483Control0.518
Time0.0020.963n.s.T10.50180D × T10.47880R × T10.524
Treat × Time0.1040.747n.s.T20.50080D × T20.48780R × T20.512
Daytime sleepiness
Semester 2–3
Treatment1.3920.238n.s. 80D0.460Control0.535
Time2.4680.085.T30.52080D × T30.49780R × T30.507
Treat × Time2.1470.117n.s.T40.45880D × T40.42480R × T40.492
T50.53280D × T50.45880R × T50.606
Sleep duration (h)
Semester 1
Treatment0.1070.741n.s. 80D0.490Control0.510
Time5.5640.018*T10.54980D × T10.59580R × T10.503
Treat × Time7.4100.006**T20.45280D × T20.38580R × T20.518
Sleep duration (h)
Semester 2–3
Treatment0.0120.913n.s. 80D0.497Control0.503
Time11.1930.000***T30.59580D × T30.54480R × T30.647
Treat × Time1.8690.158n.s.T40.51480D × T40.53380R × T40.495
T50.39180D × T50.41480R × T50.367
d-2R concentration
Semester 1
Treatment0.0200.887n.s. 80D0.505Control0.495
Time64.1550.000***T10.39680D × T10.42380R × T10.369
Treat × Time2.9650.085.T20.60380D × T20.58680R × T20.621
d-2R concentration
Semester 2–3
Treatment0.8120.368n.s. 80D0.535Control0.470
Time23.9700.000***T30.39580D × T30.43180R × T30.359
Treat × Time0.3600.549n.s.T40.49980D × T40.52680R × T40.472
T50.61380D × T50.64780R × T50.578
F1-LD-F1 model with time and treatment and the interaction of treatment and time (Treat × Time); 1 Significance level is indicated as *** p < 0.001; ** p < 0.01; * p < 0.05; p < 0.1; n.s. (not significant).
Table 6. Results from simple comparison models of visual analogue scales for self-assessed stress, sleepiness, and exhaustion levels over the course of the study.
VAS ScaleTime PointSimple Comparison
Wilcoxon Rank Sump-Value 1
StressT1–T273510.025*
T3–T533,6070.000***
SleepinessT1–T26927.50.171n.s.
T3–T528,1780.333n.s.
ExhaustionT1–T27640.50.005**
T3–T530,3120.014*
1 Significance level is indicated as *** p < 0.001; ** p < 0.01; * p < 0.05; n.s. (not significant).
Publisher’s Note: MDPI stays neutral with regard to jurisdictional claims in published maps and institutional affiliations.

