Article

Fracture Toughness of Reactive Powder Fibrous Concrete Composites under Pure and Mixed Modes (I/III)

by
Sreekumaran Sreenath
1,*,
Kaliyaperumal Saravana Raja Mohan
1 and
Gunasekaran Murali
2,*
1
School of Civil Engineering, SASTRA Deemed University, Thanjavur 613401, India
2
Peter the Great St. Petersburg Polytechnic University, 195251 Saint Petersburg, Russia
*
Authors to whom correspondence should be addressed.
Buildings 2022, 12(5), 599; https://doi.org/10.3390/buildings12050599
Submission received: 3 April 2022 / Revised: 1 May 2022 / Accepted: 3 May 2022 / Published: 5 May 2022

Abstract

:
Reactive Powder Concretes (RPC) are well known for their exceptional strength properties and durability properties. The use of Supplementary Cementitious Materials (SCM) is the best way to enhance the strength and durability characteristics of RPCs further. Among various SCMs, the potential of Ground Granulated Blast-furnace Slag (GGBS) is proven by many researchers. However, the effect of GGBS on the fracture toughness of RPCs, especially under the tearing mode, is not explored. This study investigates the effect of partial replacement of OPC with GGBS in non-fibrous and fibrous RPCs, on its mode I (pure opening), mode III (pure tearing), and mixed-mode I/III fracture behaviour. A significant improvement in mode I, mode III, and mixed-mode I/III fracture toughness was observed due to incorporating GGBS and fibres in RPCs. The fibrous mix with 30% OPC, replaced with GGBS, exhibited the highest values of mode I and mode III fracture toughnesses, which were 2.35 MPa·m0.5 and 0.98 MPa·m0.5, respectively, and significantly high compared to the control non-fibrous and fibrous RPC mixes. The study reveals the ability of GGBS as an SCM to improve the fracture toughness of RPC mixes, thereby delaying the failure of the process of structural components.

1. Introduction

The construction industry has been the principal driver of urbanization and industrial growth in recent years. This industry employs 5–10% of the worldwide workforce and accounts for 5–7% of global gross domestic product [1]. Concrete is the most frequently used, and widely recognized, construction material. The consumption rate of concrete on a global scale is reported as being next to that of water. There is a growing demand for concrete with increased strength and durability properties to extend the life of structures. As a result, Ultra High-Performance Concretes (UHPC), also known as Reactive Powder Concretes (RPC), are in high demand. The RPCs are produced with ultra-fine reactive powders. The RPCs are distinguished with the excellent particle distribution, dense microstructure, and thus low porosity. RPCs possesses compressive strengths ranging from 120 to 800 MPa, tensile strength ranging from 25 to 150 MPa, and flexural strength ranging from 30 to 140 MPa [2,3]. The production of RPCs is based on a microstructural engineering approach that comprises the elimination of coarse aggregates from mix, adoption of a very low water-to-binder ratio, usage of silica fume to reduce the CaO to SiO2 ratio, and the incorporation of steel fibres.
According to the reports, the construction industry utilizes around 40% of global energy and 20–50% of natural resources [4,5,6]. In addition, the construction industry is responsible for 40% of CO2 emissions and 30% of garbage production. Cement production alone is responsible for 7–9% of worldwide CO2 emissions [7]. It can be observed from the recent researches that RPCs consume a large quantity of cement, often 800–1000 kg/m3, to obtain the desired strength and durability [2,8]. However, thermogravimetry analyses reveal that only a part of the added cement participates in hydration, as the water-to-binder ratios are significantly lower. The degree of cement hydration in RPCs ranges from only 40 to 60% [9]. The unhydrated cement will act as a filler to densify the microstructure. Owing to the environmental issues, the usage of a large volume of cement is not recommended. Over the years, concrete researchers have been focusing on the development of techniques to reduce carbon emissions associated with cement manufacturing. These solutions include replacing coal fuel with natural gas, establishing an effective clinker grinding mechanism, and utilizing Supplementary Cementitious Materials (SCM). The employment of SCMs is considered to be the most viable among all these strategies. Fly ash, Ground Granulated Blast-furnace Slag (GGBS), silica fume etc., are the commonly used SCMs. GGBS is a by-product of blast furnace iron ore production, which can be used as an alternative cementitious material to reduce Green House Gas (GHG) emissions significantly [10,11,12,13,14]. Adding GGBS to concrete improves its workability, bleeding resistance, hydration heat, later-age strength, steel corrosion inhibition, porosity control, and impermeability [13,15,16,17]. According to studies, the global production of GGBS is around 530 million tonnes, with the building industry using only 65% of that. This study focuses to evaluate the effects of replacing OPC partially with GGBS on properties of RPCs. According to Kim et al., GGBS is a viable SCM for improving the flowability of Ultra-High-Performance Concrete (UHPC) without sacrificing strength [18]. In a recent research, Ganesh and Murthy discussed the tensile properties and durability characteristics of UHPC made with high volume GGBS as an SCM. The authors concluded that the addition of GGBS can significantly improve the workability, compressive strength, tensile strength and tensile fracture energy (opening mode) of UHPC mixes [5]. To explore further, this study investigates the effect of replacement of OPC partially with GGBS on the pure and mixed modes I/III (opening and tearing mode) fracture toughness of RPCs. Furthermore, RPCs are relatively very strong in compression but significantly weak in tension. This is mainly due to the inherent brittleness of RPCs due to the densified matrices. The addition of SCMs such as GGBS to the mix will further densify the matrix, and the mixes will become more brittle. This brittle behaviour is usually mitigated by the addition of fibres that enhance the concrete’s energy dissipation capacity and ductility. In this study, the pure and mixed mode I/III fracture toughness of non-fibrous and fibrous mixes, with GGBS as SCM, are evaluated.
Failure of concrete is a multi-stage process that is mainly influenced by the intensity and type of imposed external loads and the internal structure of the composite [19,20,21]. According to Meyer and Peng, failure of concrete is because of its anisotropy [22]. This anisotropy of concrete can be mainly due to its high heterogeneity and micro cracks. In addition, most of the concrete structural components have complex geometries and are subjected to complex stress conditions in practice. As a result, structural cracks and discontinuities are common with such components. Cracking of concrete adversely affects the structural integrity, and further loading of such components will lead to the propagation of cracks [23]. This will become a reason for the complete failure of the structures. Hence, to predict the failure of such structures, knowledge of the process of crack initiation and propagation is essential [24]. Thus, the fracture toughness is a critical feature which can crucially control the structural performance [25].
In fact, many practical cases of failure are initiated due to the combined tension and in-plane shearing (mixed mode I/II) [26,27,28,29,30] or the combined tension and out-of-plane shearing (mixed mode I/III) of concrete [31,32]. In some cases, the failure was observed due to the mixity of all the three modes (mixed mode I/II/III) [33]. In the case of structural those elements that undergo torsion, it is critical to evaluate concrete’s tearing resistance (mode III fracture toughness). Ring beams, T-beams, spiral stairs, etc., are a few of such structural components. In addition, components such as bridge girders, industrial floors, etc., will undergo mixed mode I/III loading, mainly due to the significant mass irregularities. As an ultra-high-performance material, RPCs are identified as a promising material for the construction of such components. Hence, it is essential to evaluate the behaviour of RPCs under mixed mode I/III loading. Several studies have addressed the failure of RPCs under mode I (opening mode) fracture and mode II (in-plane shear) fracture. In a recent article, Ganesh and Murthy have investigated the effect of incorporating high volume GGBS on mode I fracture toughness of UHPCs and found that the fracture toughness had significantly improved up to 60% cement replacement with GGBS [5]. In recent research, Xu et al. studied the mode II shear fracture performance of RPCs and concluded that the final failure occurred at 74 to 83% of peak load [34]. However, no known research outputs are available on the performance of RPCs under pure mode III (tearing mode) and mixed-mode I and mode III loadings. As the mode III and mixed mode I/III fracture of RPCs is an unexplored area of research, this study evaluates the pure mode I, mixed mode I/III and pure mode III fracture toughness of fibrous and non-fibrous RPCs admixed with GGBS. The value of mode III fracture and mixed-mode I/III fracture toughness of RPCs will aid designers in assessing the load-bearing capacity and resistance to crack growth of structural components.
Edge Notched Disc Bending (ENDB) specimens are proven candidates for testing concretes for fracture toughness under pure mode I, pure mode III, and mixed-mode I/III loading conditions. This simplified way of evaluating pure opening, pure out-of-plane shearing, and mixed modes of fracture toughness of concretes were introduced by Aliha et al. [35]. In this study, mode I, mode III, and mixed mode I/III fracture toughness of plane and fibred reinforced RPCs are evaluated using ENDB specimens. The pure and mixed loading conditions were simulated by varying the notch inclinations with reference to the loading line. In addition to the fracture toughness of RPCs, the essential characteristics of the mixes, such as flowability, compressive strength, and split tensile strength, are discussed. Further, Scanning Electron Microscope (SEM) images of modified RPC mixes are analysed to ascertain the potential of GGBS in improving the strength and toughness of RPC mixes.

2. Materials and Methods
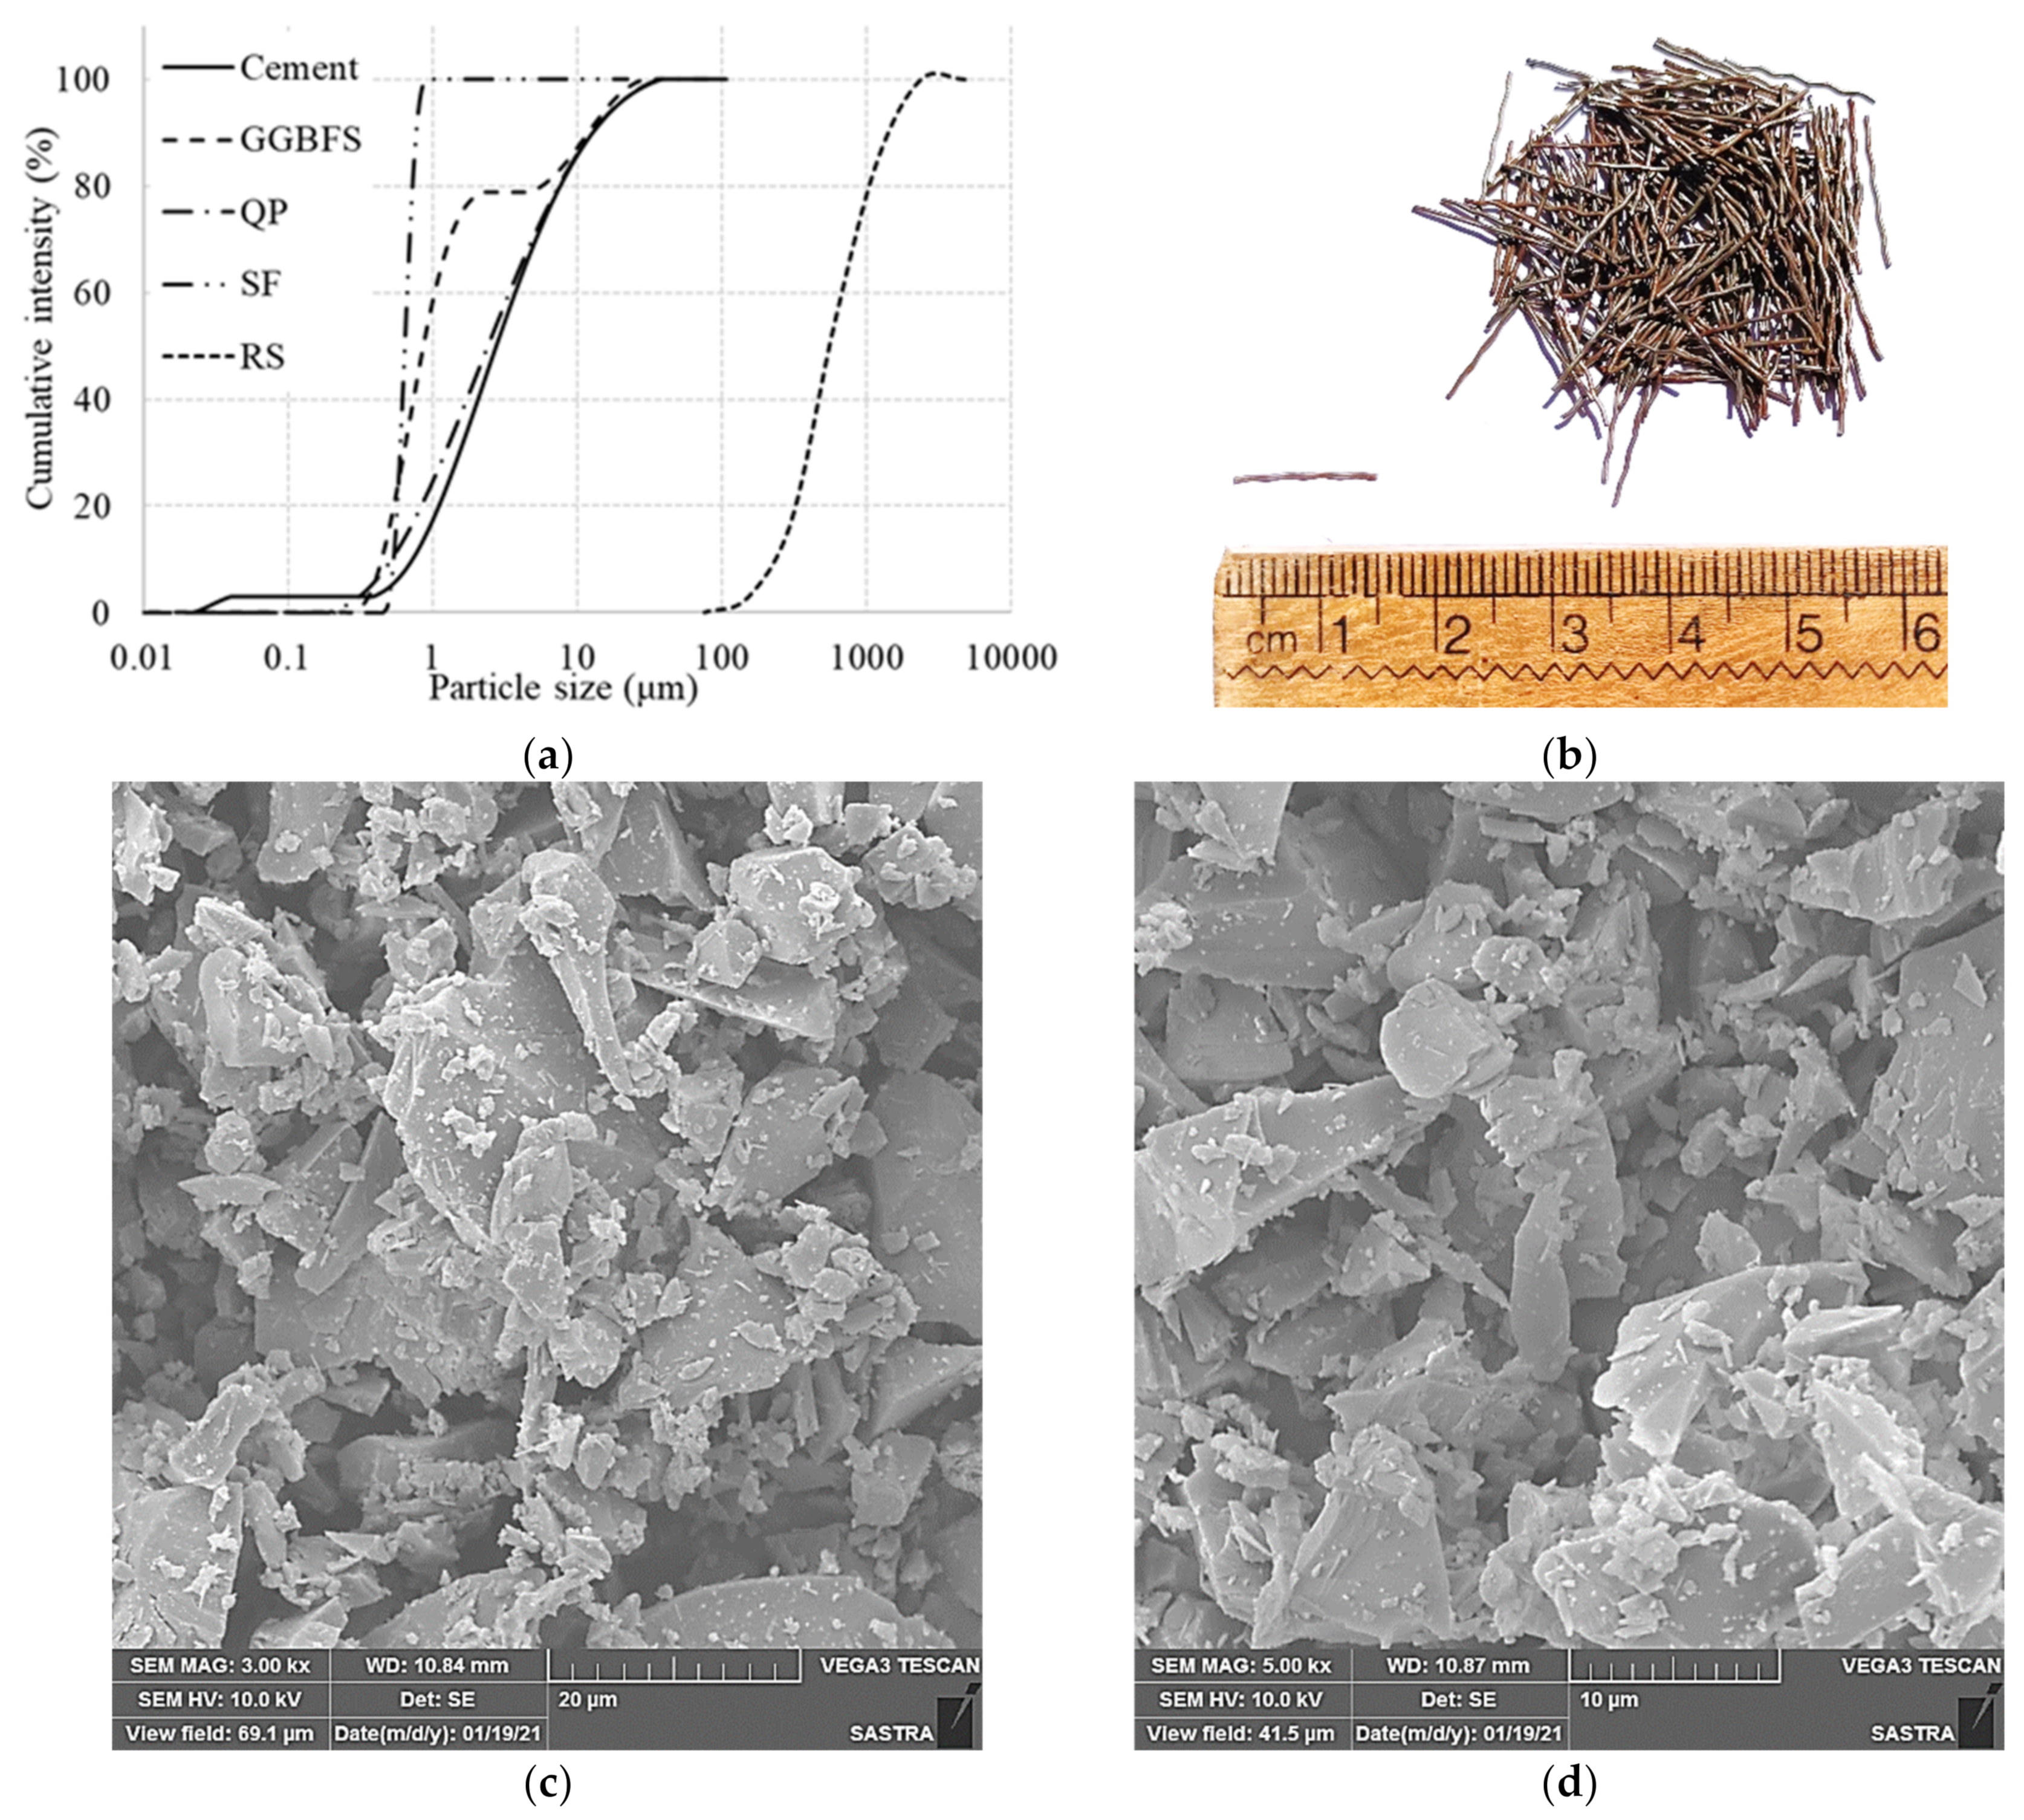
2.1. Materials Used

Hydraulic cement, sand, silica fume, and quartz filler are the common constituents of RPCs. Steel fibres are generally used to strengthen the matrix, which improves the mixes’ strength and ductility. In this investigation, the principal binder was 53 grade Ordinary Portland Cement (OPC) that met IS 12269 [36] requirements. The cement used had a specific gravity of 3.15 and a 260 m2/kg surface area. GGBS, with a specific gravity of 2.85 and a specific surface area of 390 m2/kg, was used as a partial substitute for OPC in this investigation. Silica fume (SF) with a specific gravity of 2.29 and a silica (SiO2) content of 98.70 percent was used in the mixes. Silica fume has a specific surface area of 29,000 m2/kg. River sand, conforming to IS 383 [37], with particles passing through a 2.36 mm sieve and being held on a 150 µm sieve, was employed as fine aggregate in the mixes. Quartz powder (QP) was used as a fine filler in the mixes. QP has a specific gravity of 2.65 and 229 m2/kg surface area. QP particles ranged in size from 2.0 to 75 μm. The hydration of cementitious constituents was done with potable water. The workability of mixes was improved using a polycarboxylate ether-based medium viscosity high range water reducer (TecMix 640 from Techny Chemy, Tiruchirappalli, Tamil Nadu, India), which has a solid content of 35% and a relative density of 1.08 at 25 °C. The elemental composition of the constituent powders was determined using X-ray fluorescence (XRF) test. Table 1 shows the findings of the XRF analysis. The Particulate Systems Nano Plus was used to analyse the particle size of the constituent powders, while a normal sieve set and laboratory sieve shaker were used to analyse the particle size of the sand. Figure 1a shows the particle size distribution of the constituents. The matrices were reinforced with crimped steel fibres with a tensile strength of 1100 MPa. The steel fibres have an aspect ratio of 27.78 (0.45 mm diameter and 12.5 mm length). Figure 1b depicts the profile of the fibres used in this study. Figure 1c,d provides the SEM micrographs of GGBS at different magnification levels, which illustrates the morphology of GGBS particles used in this study.

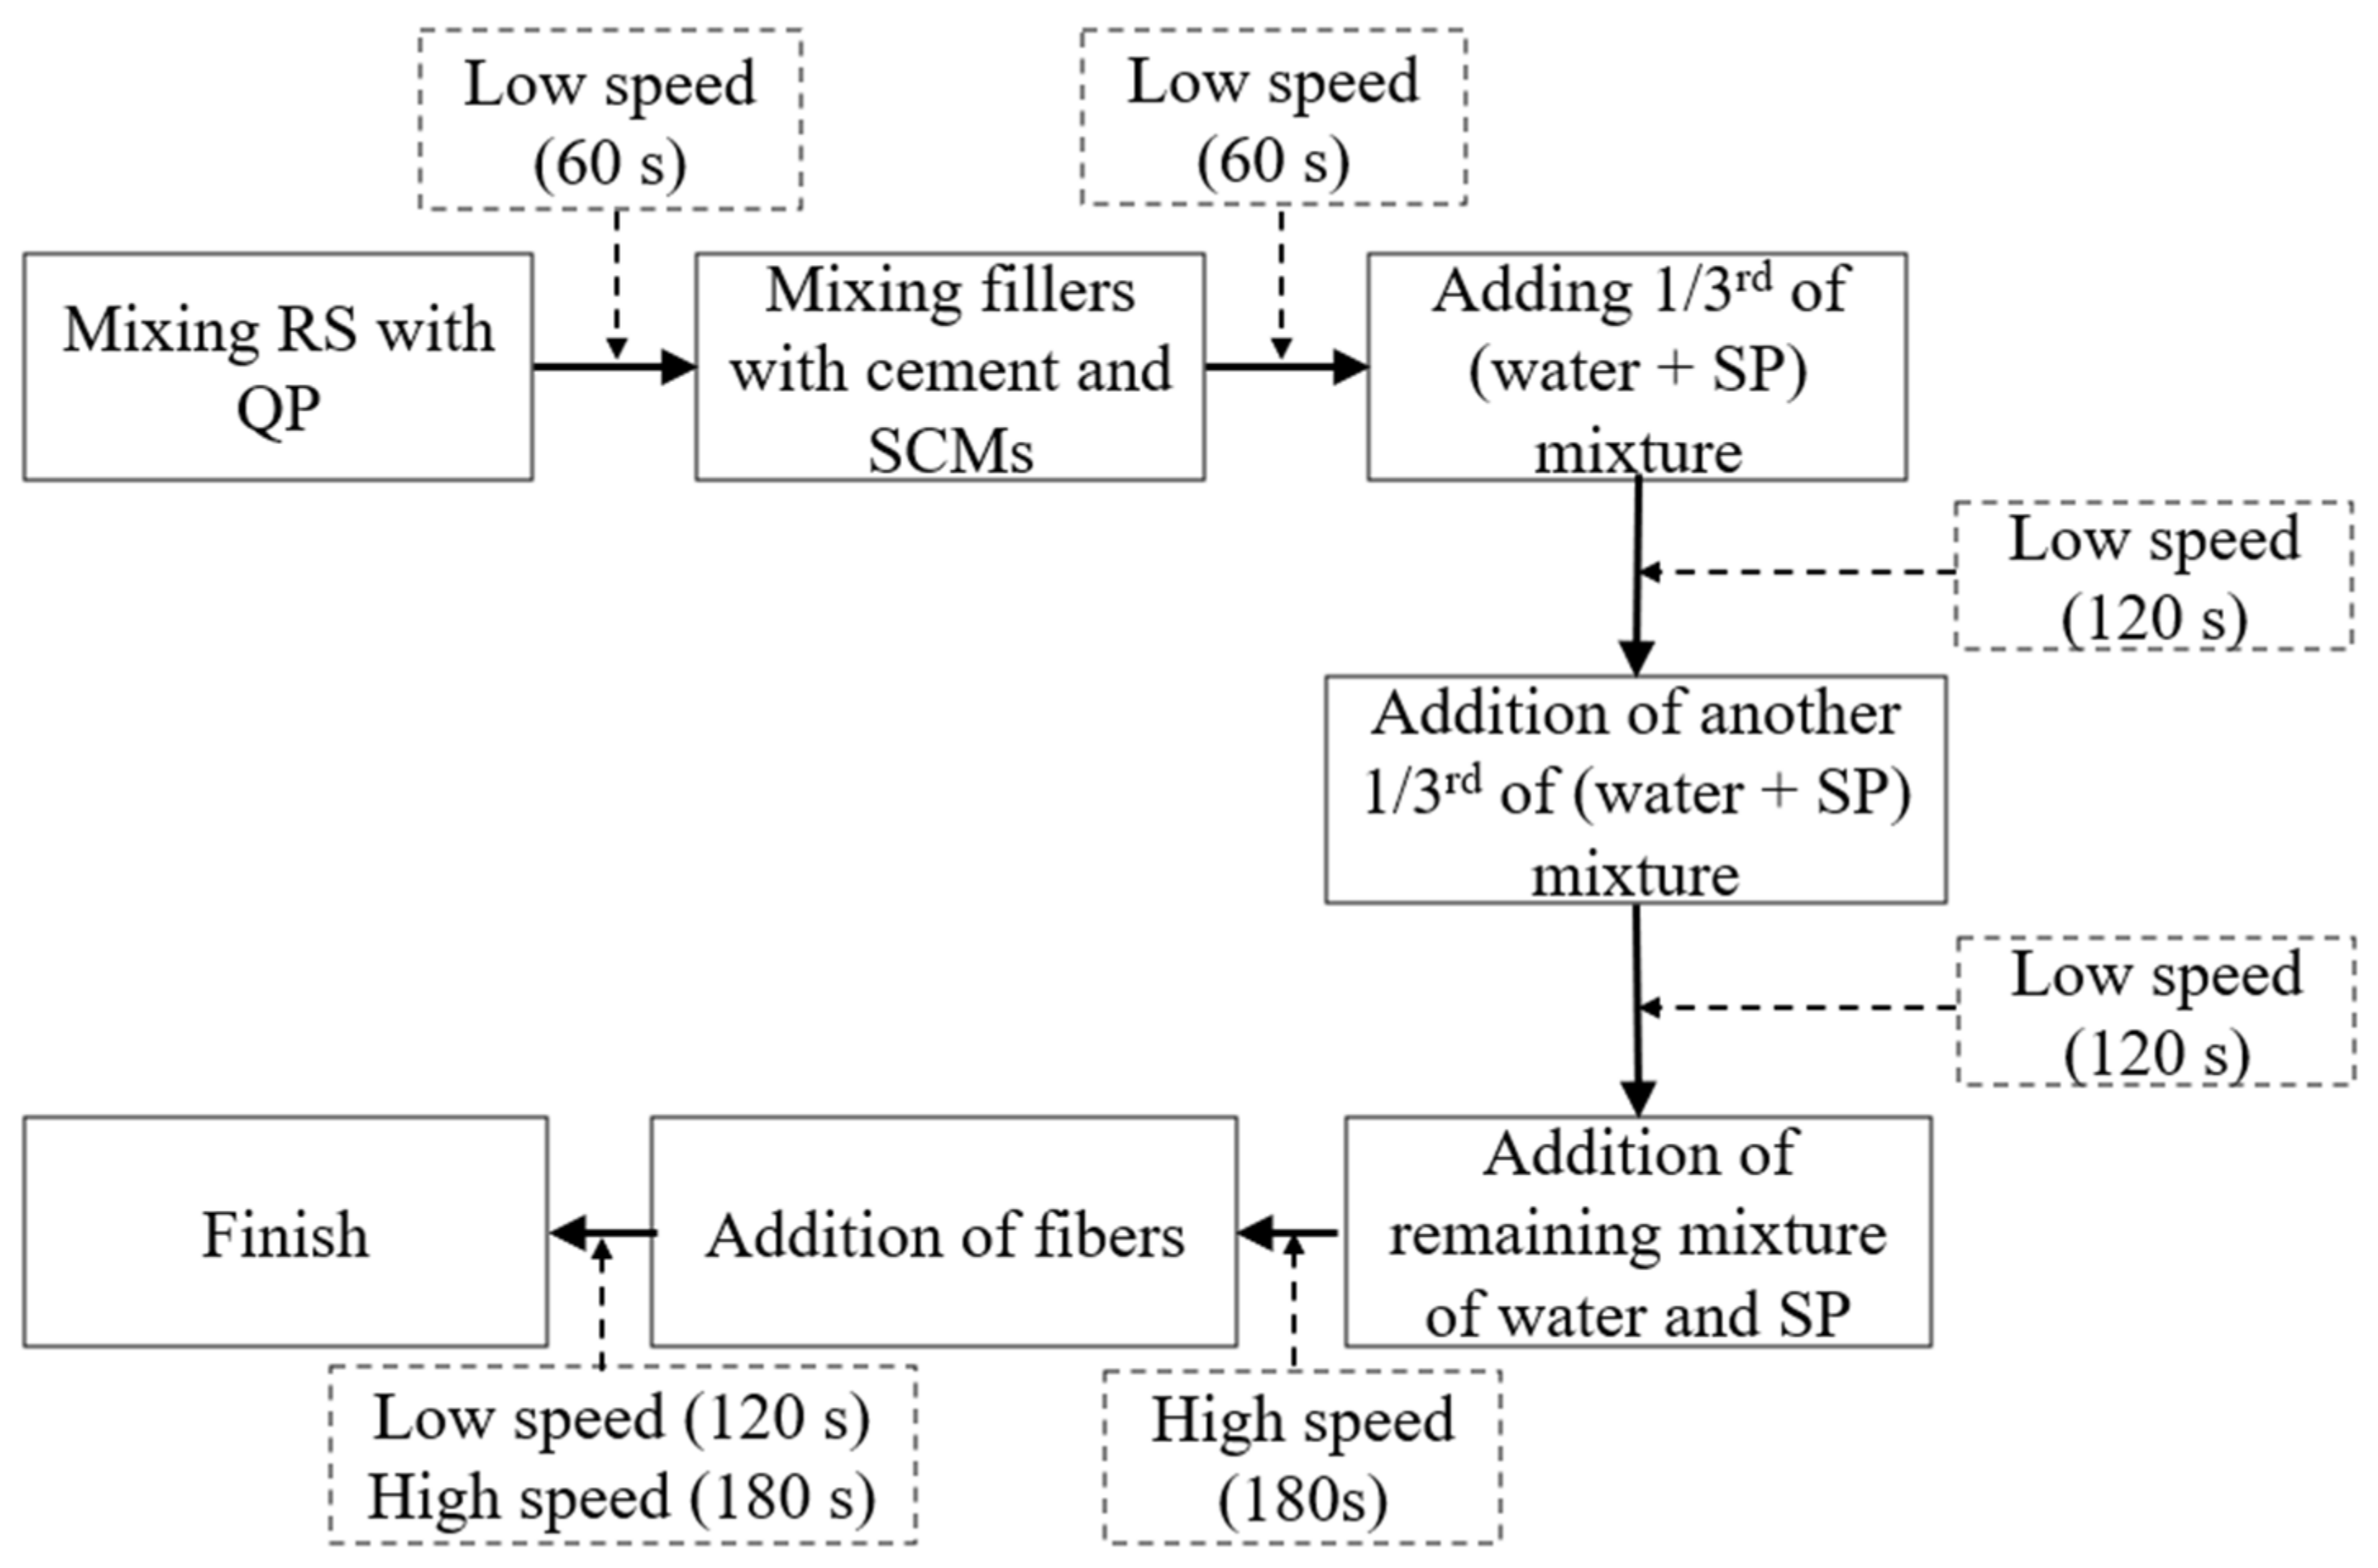
2.2. Preparation RPC Mixes

Models based on particle packing theories are widely accepted for optimizing RPC mix proportions. In this study, numerous trial mixes were made in the laboratory based on the proportions commonly addressed in the research literature, taking into account the delicate nature of particle packing-based mix design. OPC, SF, RS, and QP were used to make the reference mix for this investigation. The binder component of the mix was then altered by partially replacing OPC with GGBS. The replacement was done at four levels: 10, 20, 30, and 40% by mass. The effect of steel fibres on the behaviour of mixes was studied. For all of the mixes, the water-to-binder ratio was 0.17, and the HRWR dosage was 3.5 percent of the binder mass. Table 2 presents the specifics of mix proportions.
To avoid a reduction in workability, fine aggregate in Saturated Surface Dry (SSD) conditions was used to prepare mixes. This will also aid in the formation of stronger bonds. High shear mixing of the constituent powders was done in a laboratory planetary mixer. First, a dry mix of all ingredients (binder and fillers) was made. HRWR is dissolved in the mixing water and then added to the dry constituent mixture in three stages. The addition of water-HRWR solution was followed by thorough mixing. Figure 2 describes the scheme of the mixing program.

2.3. Evaluation of Workability of RPC Mixes

The workability of RPC mixes was evaluated by performing a flow table test, as per ASTM C1437 [38]. The flow table used for the study was in accordance with ASTM C230 [39]. The diameter of the spread was noted as flow diameter. The average flow diameters, measured along four different diametral lines, are the mix’s final flow diameter. The percentage increase in the spread diameter, regarding the base diameter of the conical mould, is presented as the flow percentage.

2.4. Preparation and Testing of Specimens

Cubes of side 70.7 mm were used for evaluating the compressive strength of mixes. Thirty cube specimens (three cubes per mix) were cast and provided with normal water curing for 28 days. The specimens were tested on a Compression Testing Machine (CTM) of capacity 3000 kN, conforming to IS 516 [40]. Cylindrical specimens of diameter 50 mm and height 100 mm were used to evaluate the splitting tensile strength of the mixes. Thirty cylinders (three cylinders per mix) were cast and exposed to normal water curing for 28 days. A splitting tensile test was also conducted on CTM, conforming to ASTM C496 [41]. Average test results (average of three results per test per mix) were considered for further analysis. Circular disc-shaped specimens with a diametral notch are identified as an efficient candidate to evaluate the first and third-mode fracture toughness. The specimens are called Edge Notched Disc Bending (ENDB) specimens.

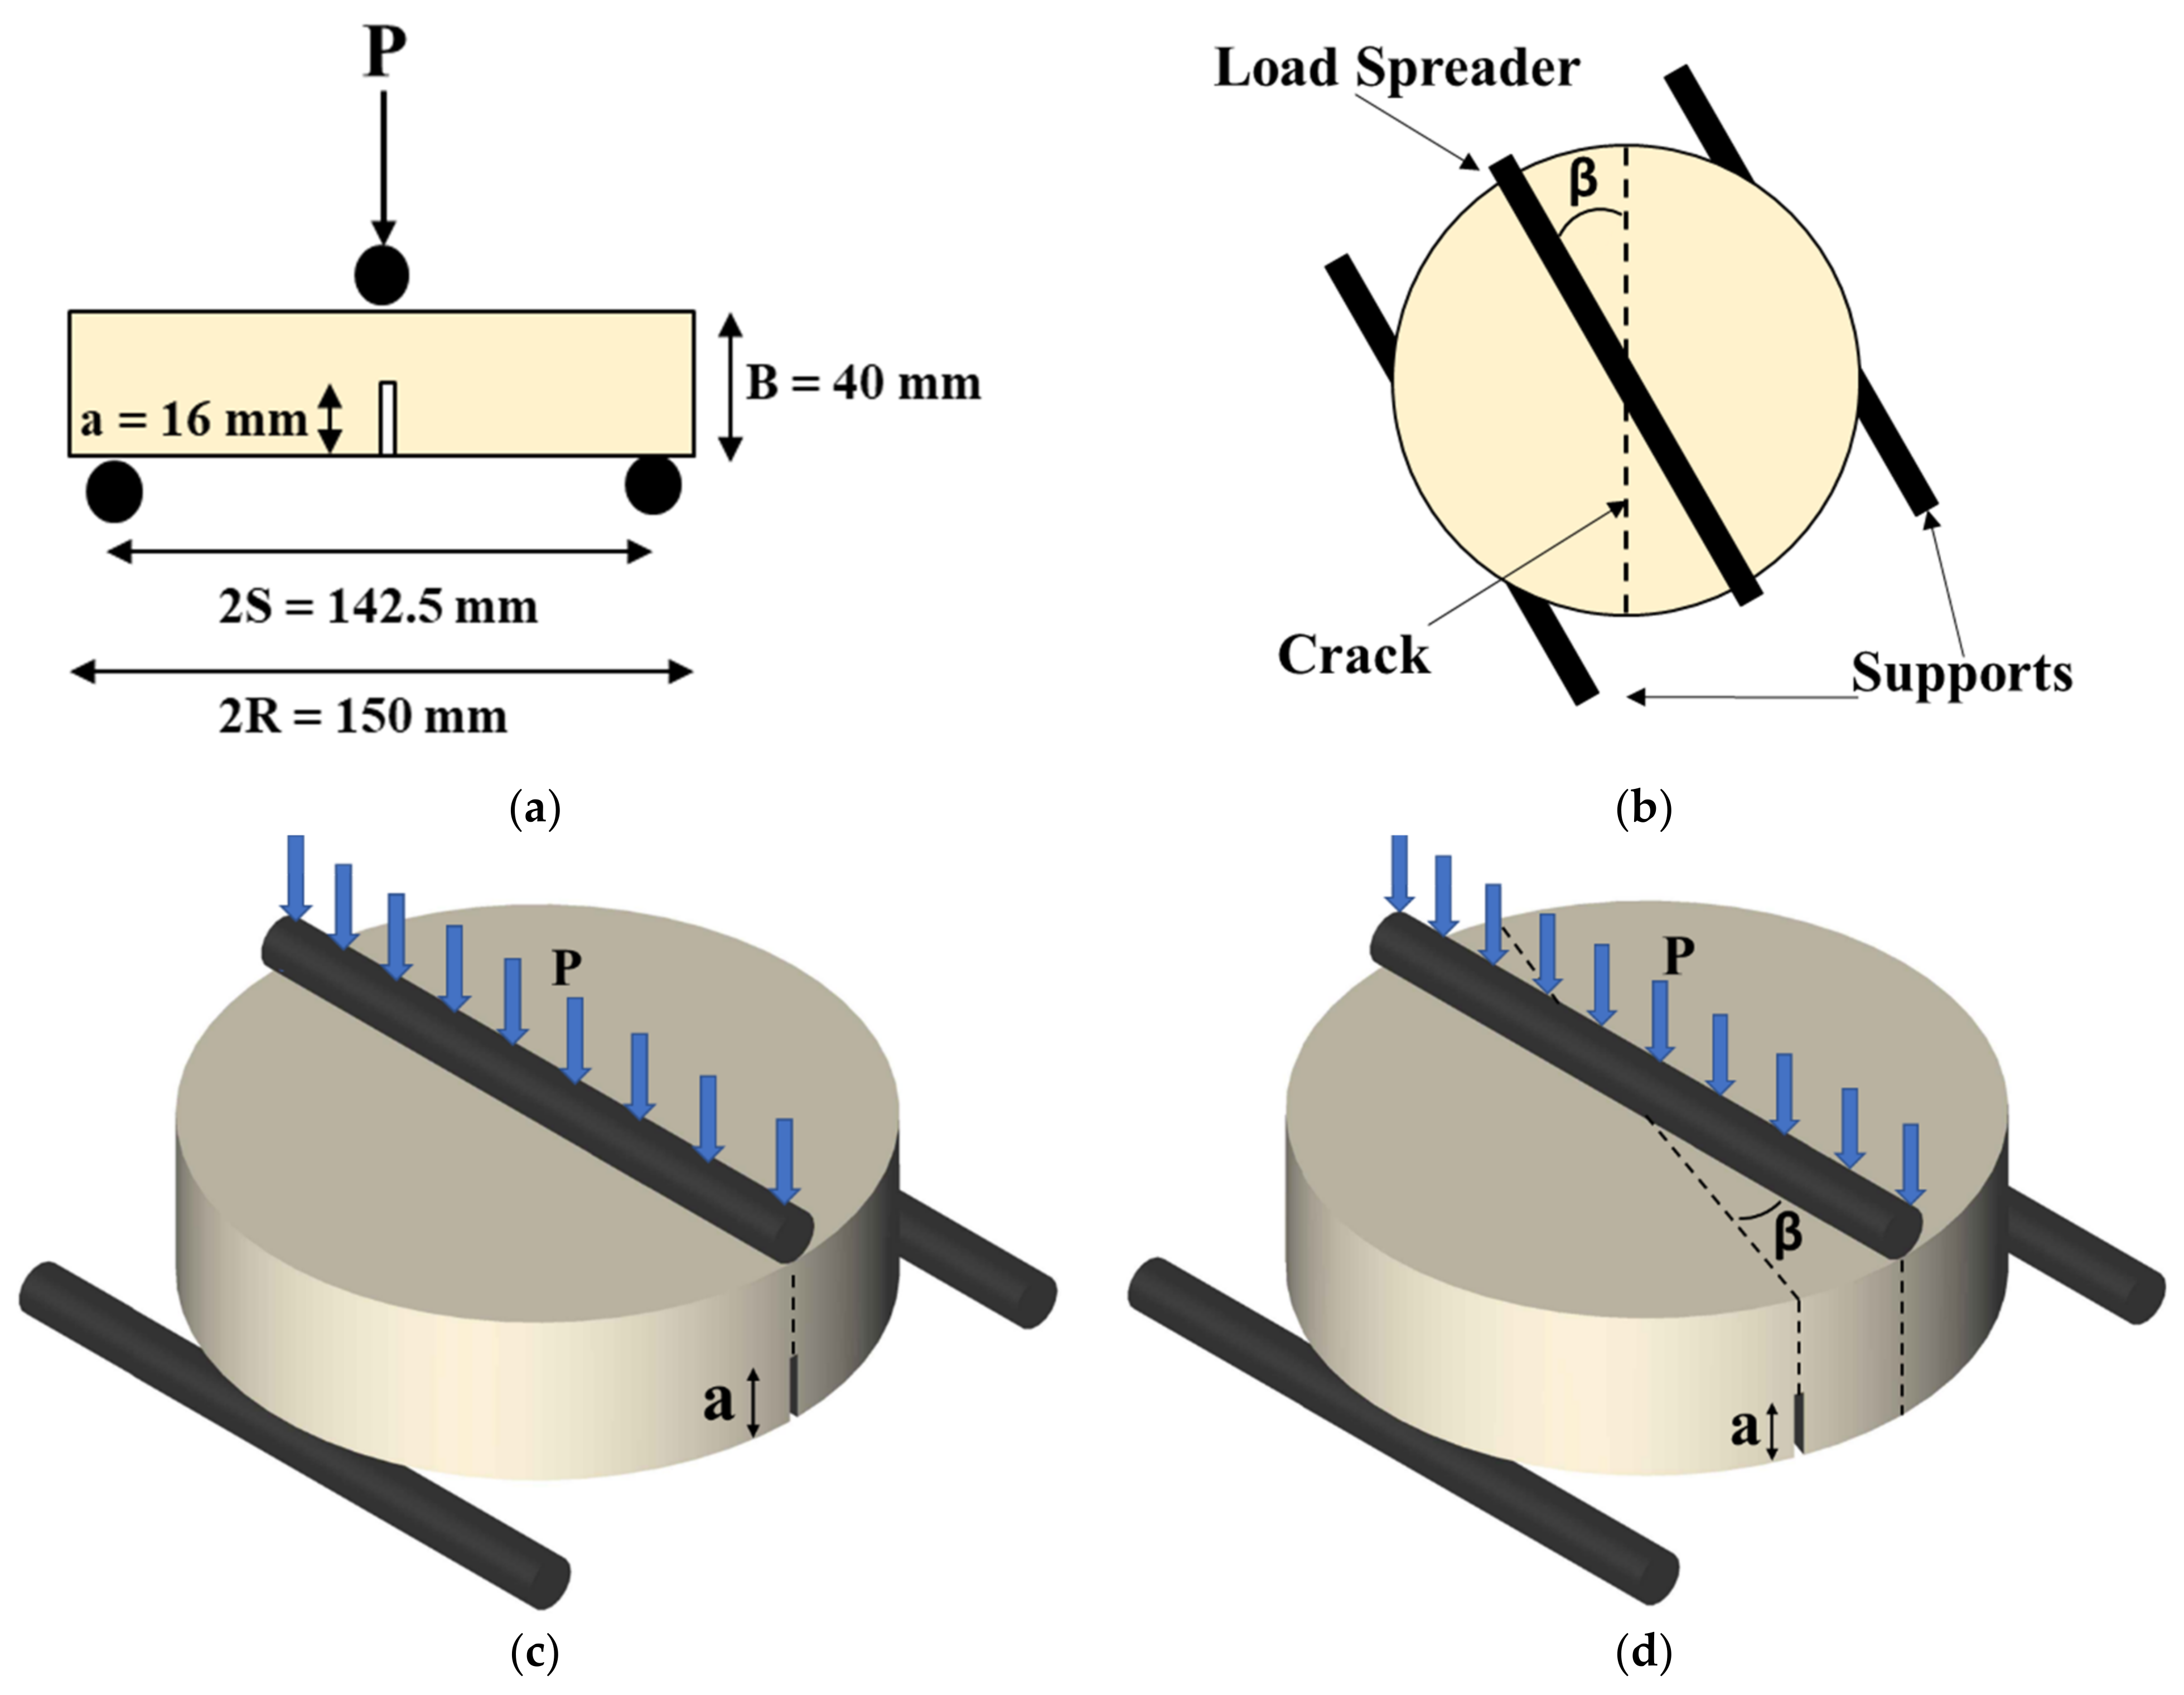
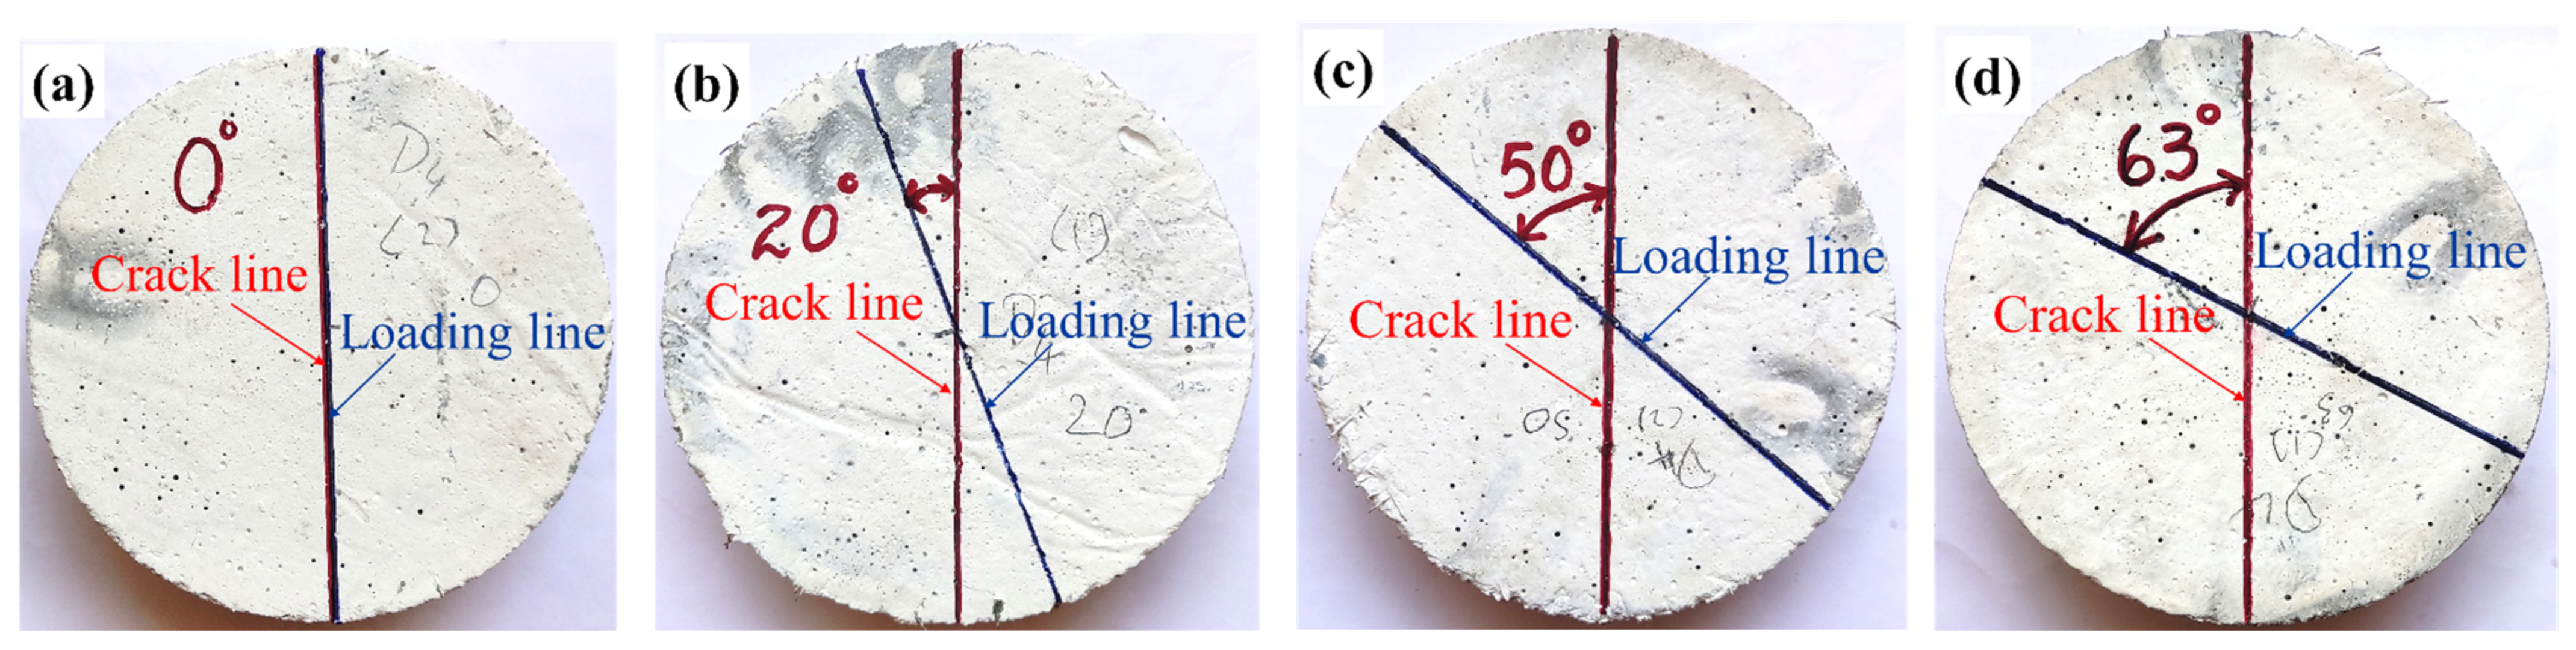
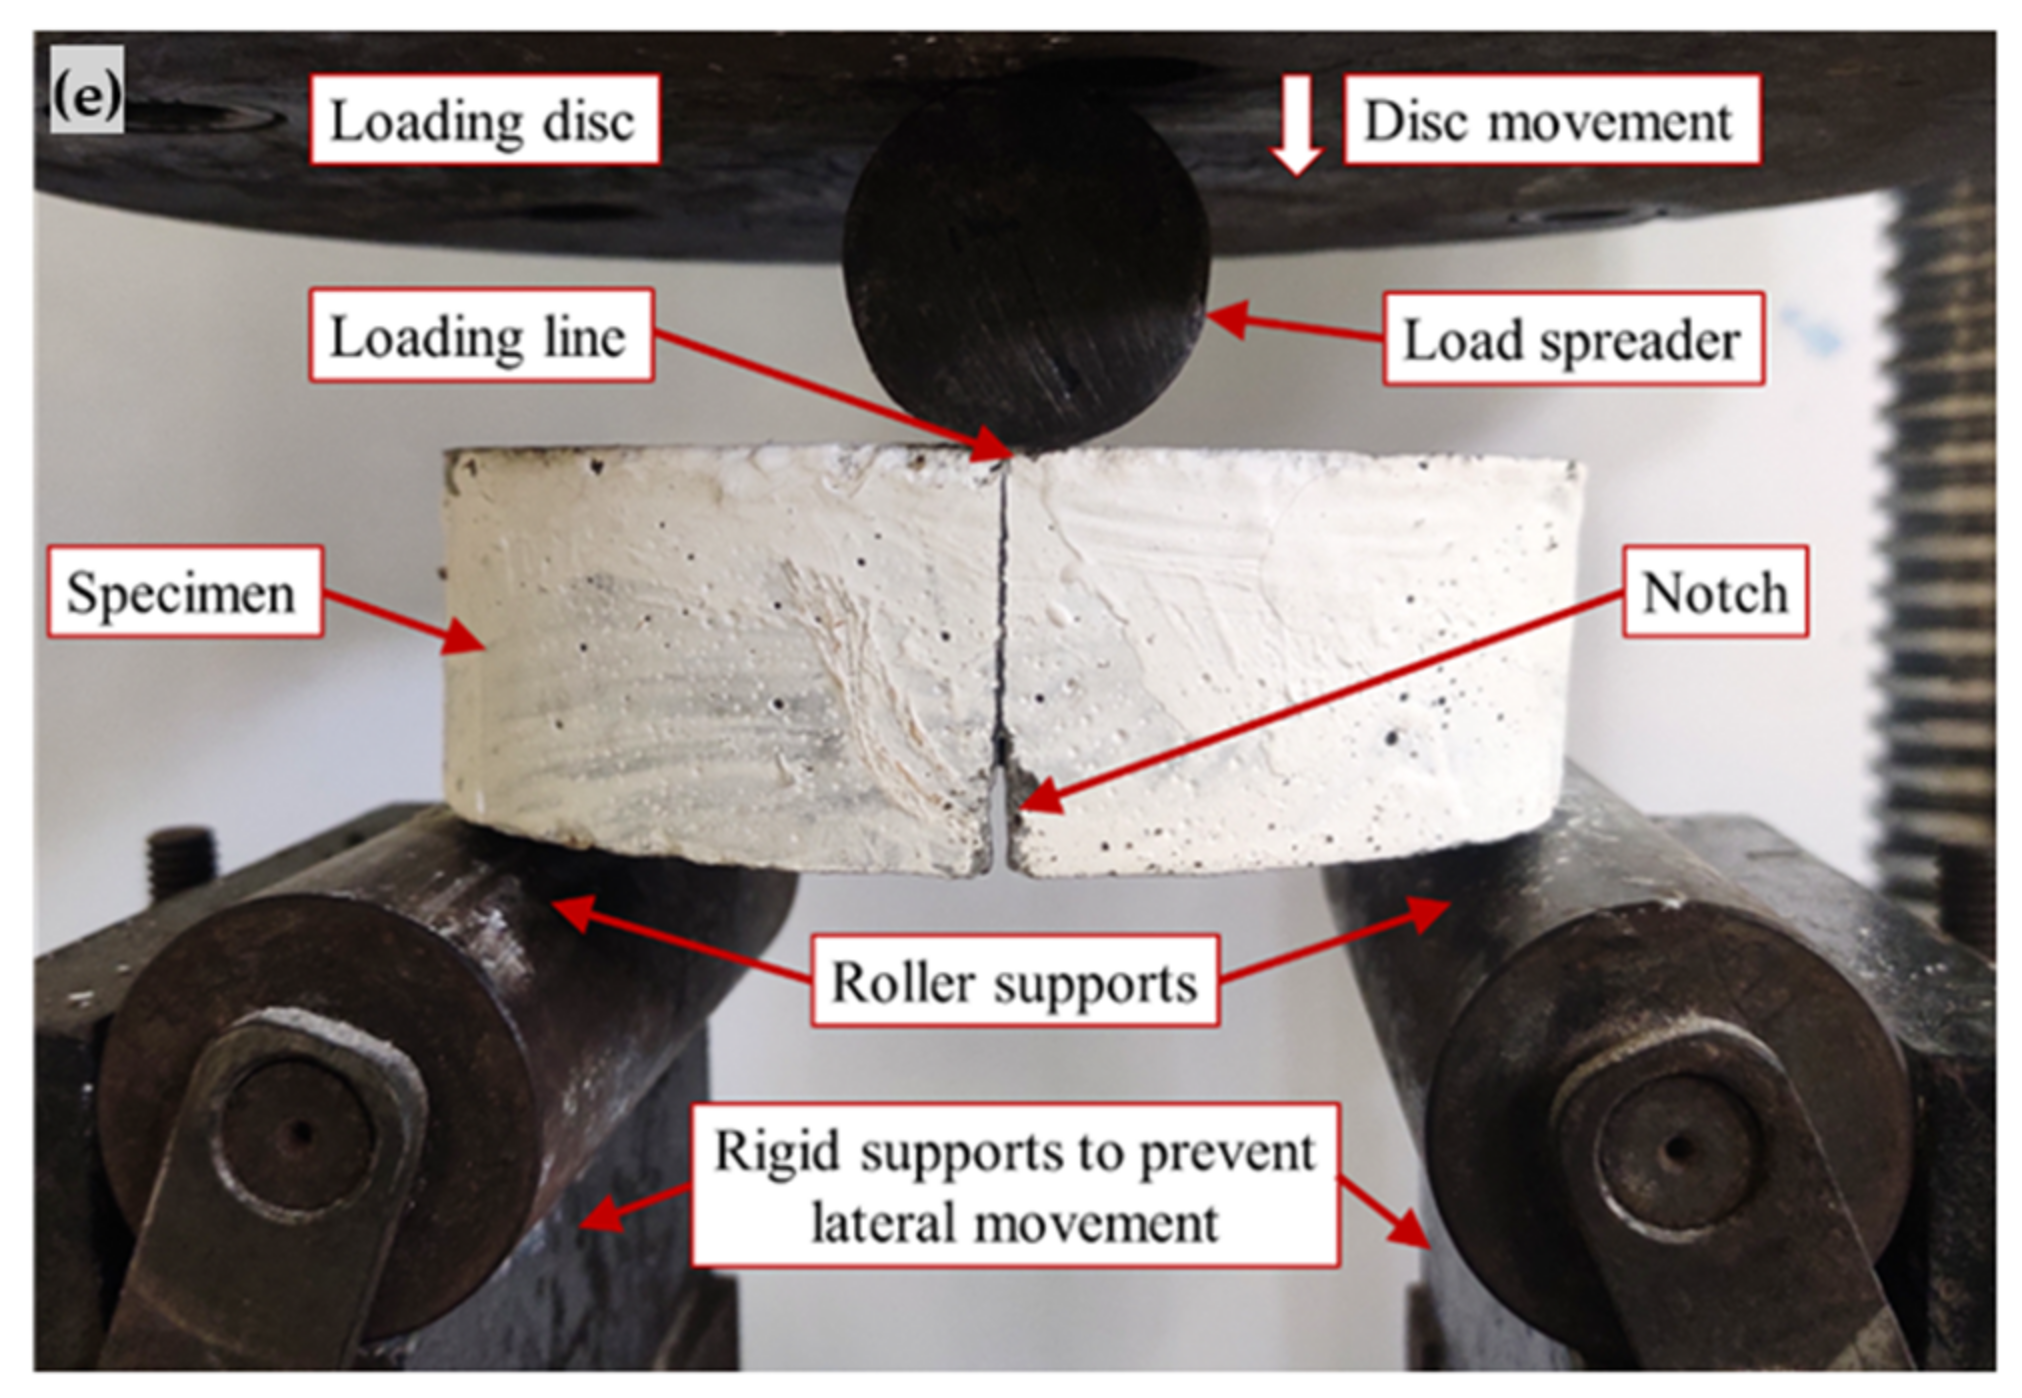
Preparation and Testing of ENDB Specimens

This study used disc specimens with diameter, 2R = 150 mm and depth, B = 40 mm. Diametral notches provided in the specimens were a width of 2.2 mm and depth, a = 16 mm. The span for the bending test (2S) was maintained as 142.5 mm. The geometry of the ENDB specimens is shown in Figure 3a. The arrangement of supports and the spreader is explained with the help of Figure 3b. The specimens will undergo mode I fracture (opening mode) when the loading and the geometry of the specimens are symmetrical with reference to the crack plane. Hence, to attain the pure mode I fracture, the angle made by the notch (crack plane), with reference to the axis of support (β), is maintained as zero degrees. When the inclination of the crack plane, with reference to the loading line (also with reference to the supports), is changed from 0°, a component of mode III fracture (tearing mode) can also be observed in addition to the mode I fracture. The parameters which are governing the mixity of modes are β, a/B, and S/R. Finite Element Models (FEM) for ENDB specimens were developed by Aliha et al. in their recent research [35]. They analysed the models and stated the suitability of ENDB specimens to evaluate mode I, mode III, and mixed-mode deformations. The analysis found that, when β = 0°, both KII and KIII were absent in the crack front. When β possesses a non-zero value, the specimen will undergo an anti-plane loading, producing in-plane and out-of-plane shear deformations (corresponding fracture toughnesses are KI and KIII, respectively). This is mainly due to the development of three-dimensional stress states along the crack front [42,43,44,45,46,47,48]. The researchers also observed that, at the corners of crack flanks, the value of KII was significantly high, which will decrease when approaching the mid-sections. In the mid-sections, the value of KII was considerably less compared to the KI and KIII values. In contrast to the trend followed by KII, the magnitudes of KI and KIII were found to increase when approaching the mid-sections. Thus, at the mid-sections, the magnitudes of KI and KIII are found to be maximum, and that of KII is minimal. For attaining mode III fracture, the magnitude of β is to be maintained between 60° and 65°. In this study, the angle chosen to manipulate mode III was 63°. The angles between 0° and 63° provided the mixed fracture modes. In this study, 20° and 50° were used to evaluate mixed-mode I/mode III fracture toughness. Figure 3c presents the scheme of loading for pure mode I loading, whereas Figure 3d shows the loading scheme for pure mode III and mixed modes. Totally, 120 numbers of ENDB specimens (three specimens per mix per notch angle) were cast and provided with normal water curing for 28 days.
Figure 4a–d are the images of cured ENDB specimens before the test. The images indicate the variation in the value of β for fracture tests under various modes. Figure 4e presents the experimental setup for the three-point bending test of ENDB specimens under various loading modes.
The stress at the peak load was calculated as given in Equation (1). The stress intensity factors for mode I and III were calculated in Equations (2) and (3). The effective stress intensity factor was found for the mixed modes as per Equation (4).
σ = 6 PS RD 2 ,   MPa
K I = σ π a Y I , ( MPa · m 0.5 )
K III = σ π a Y III , ( MPa · m 0.5 )
K eff = K I 2 + K III 2 ,   ( MPa · m 0.5 )
where σ is the stress at the peak load, P, S is the span for the test, R is the radius of the specimen, and D is the depth of the specimen. The parameter a represents the depth of the notch provided. KI and KIII are the stress intensity factors under mode I and mode III loading. Keff is the effective stress intensity factor for the mixed modes of loading. YI and YIII are the geometry factors for mode I and mode III, respectively, which are functions of β, a/B and S/R. The magnitudes of the geometry factors were obtained from the research article authored by Mansourian et al. [49] and are given in Table 3.
The mixity ratio (M) is a parameter used to pronounce the contribution of the different loading modes to the failure. The mixity ratio for pure mode I loading is 1, whereas that of pure mode III loading is 0. For the mixed mode (mode I/III at β = 20° and 50°), the mixity ratios are calculated using Equation (5).
M = 2 π tan 1 K I K III

3. Results and Discussions

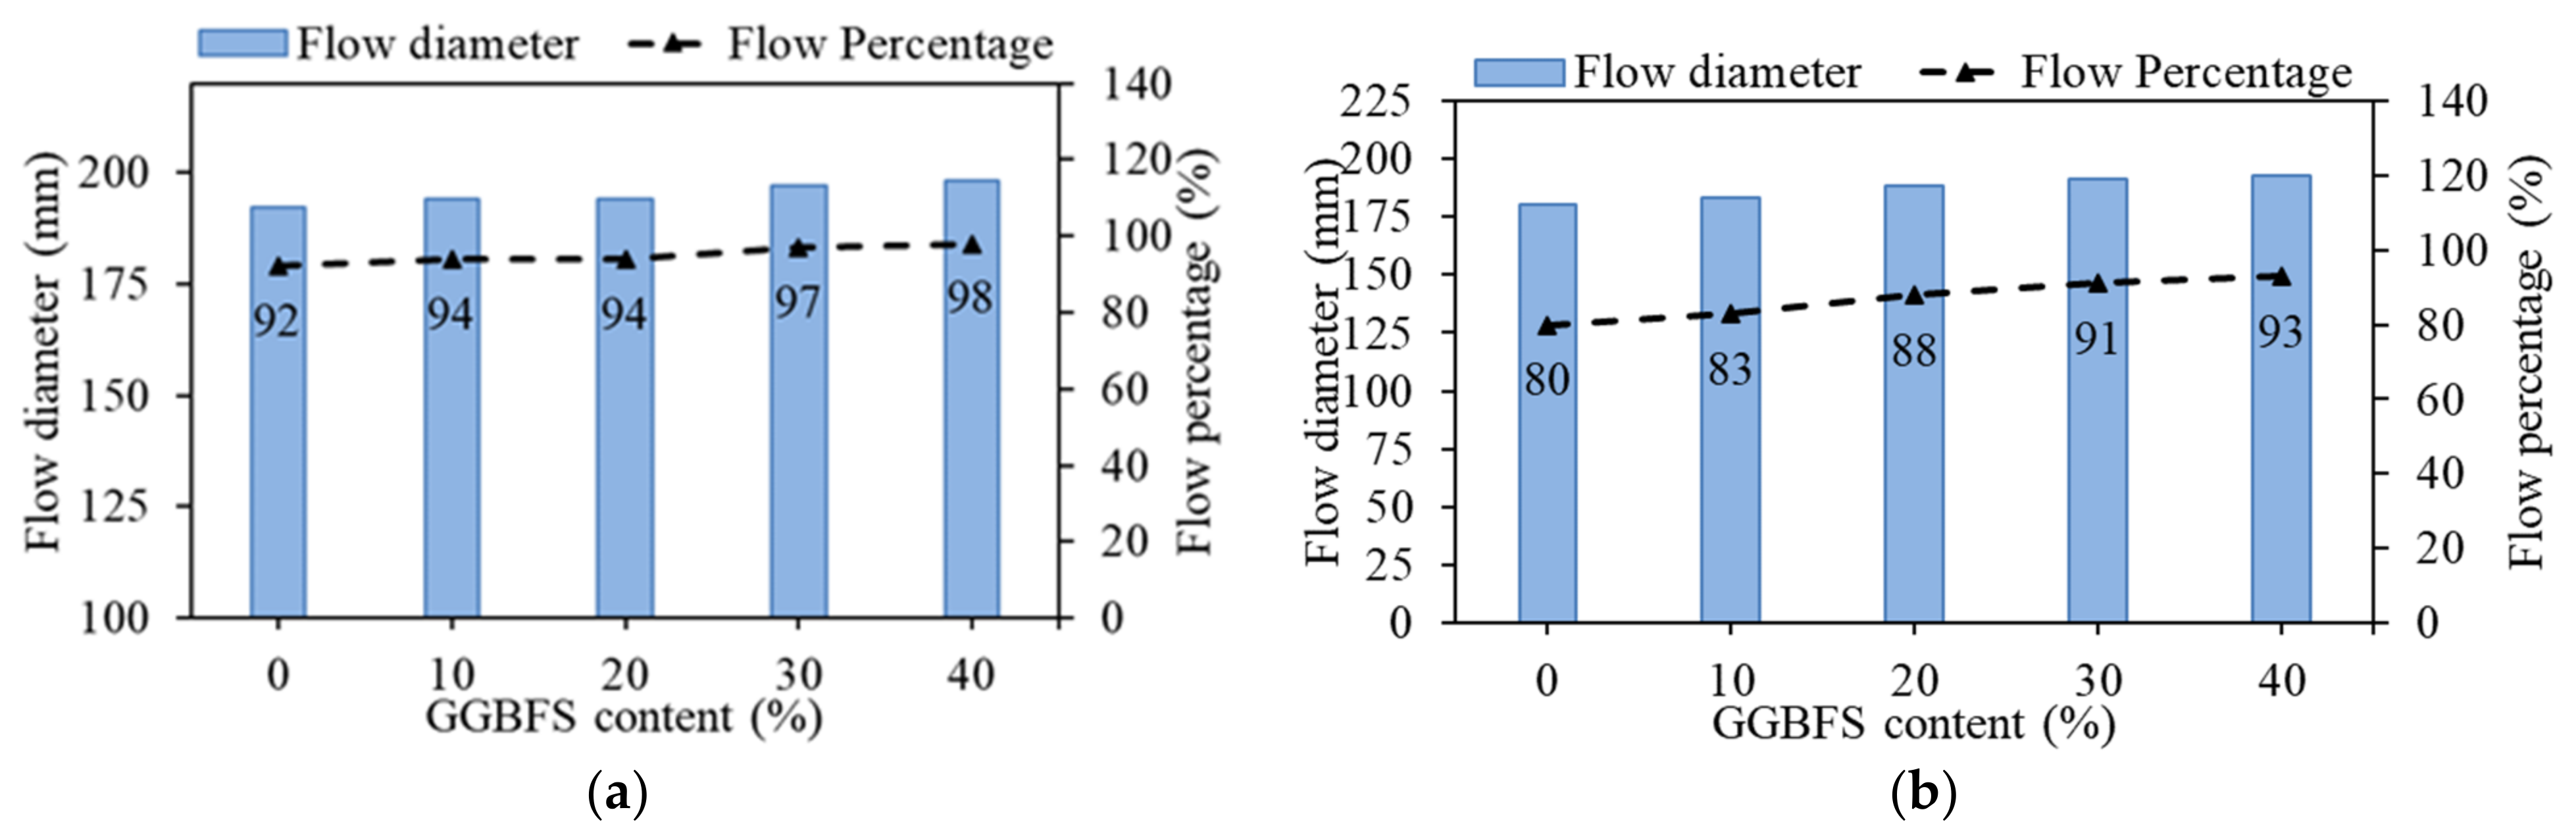
3.1. Workability of RPC Mixes

The flow test results conducted on RPC mixes are plotted in Figure 5. Figure 5a,b present the variation in flow, due to the increase in GGBS content in non-fibrous and fibrous mixes, respectively. A notable improvement in the flow of the mixes, due to the addition of GGBS, was evident from the flow test results. However, the addition of fibres to the matrix had an adverse effect on the flow of mixes.
Among the mixes without fibre reinforcement, the one with 40% OPC replaced with GGBS (mix NF40) exhibited better workability. The flow percentage of this mix was 6% higher than that of the control mix (NF0). Further, a significant reduction in the flow was observed due to the addition of fibres to the matrix. Among the fibrous mixes, the mix with 40% OPC replaced with GGBS (mix F40) showed a higher grade of workability. The flow percentage of this mix was improved by 13% compared to that of the fibrous mix containing 0% GGBS (mix F0). Though fibres adversely affected the flow of mixes, the mix F40 showed a better flow than the control mix NF0.
One of the reasons for the improved workability is the morphology of added GGBS grains. GGBS particles are spherical and smooth. Excellent dispersion of GGBS particles due to high shear mixing is also a reason for the improved workability. In addition, the slow hydration of GGBS also contributed to the improved workability of mixes [11,50]. Fibre interlocking and reorientation during the placement (spreading) is the reason for reduced flow in the case of fibrous RPC mixes [51].

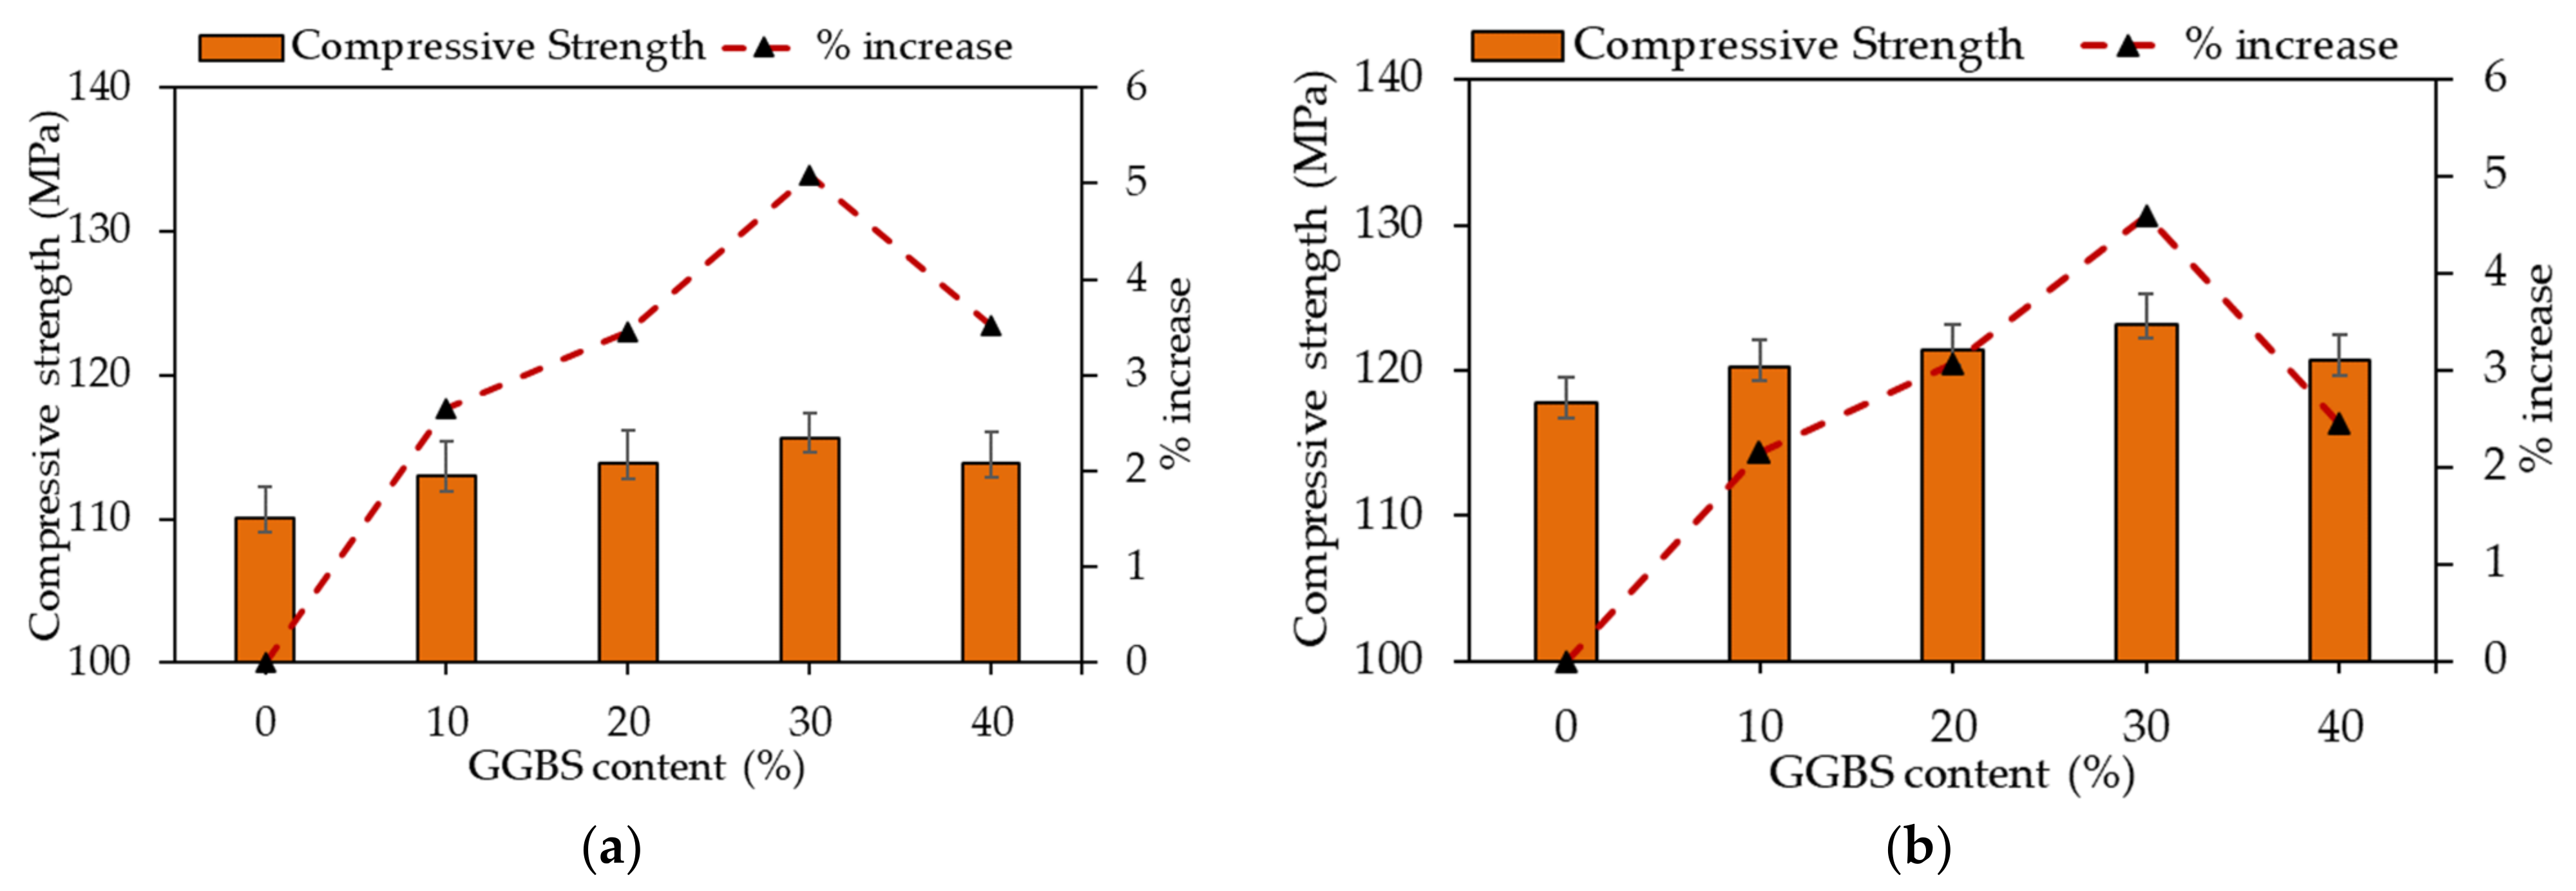
3.2. Compressive Strength

Cube specimens were tested under compression after 28 days of normal water curing. The compression test results of the developed RPC mixes are presented in Figure 6. Figure 6a,b present compressive strength variations due to increased GGBS content in non-fibrous and fibrous mixes, respectively. The variation in the strength values due to the addition of GGBS to the matrix is plotted. The percentage variation in the strength values of various mixes, with reference to the respective control mixes, is also plotted. A notable improvement in compressive strength was observed up to a replacement of 30% OPC with GGBS. Further addition of GGBS leads to the reduction in compressive strength.
In the case of non-fibrous mixes, the mix with 30% OPC replaced with GGBS (mix NF30) showed a higher compressive strength value. The compressive strength of this mix was 115.6 MPa, which was 5.1% higher than that of the control mix. The control mix with 0% GGBS (mix NF0) showed a compressive strength of 110 MPa. The mix with 30% OPC replaced with GGBS (mix F30) had the highest compressive strength among the fibrous mixes. The mix F30 exhibited a compressive strength of 124.3 MPa. The strength of this mix is 4.5% higher than that of the fibrous mix with 0% GGBS in it (mix F0). Further, the strength of the mix F30 was 7.5% higher than mix NF30 and 13% higher than mix NF0. It is noted that the mixes F10, F20, and F40 have also achieved a strength higher than the target level of 120 MPa.
It was clear from the observed results that the added GGBS has a significant role in improving compressive strength. The well-dispersed fine particles of GGBS can fill the pores in the matrix. This phenomenon will help in improving the density of the microstructure of mixes. The pozzolanic reaction of GGBS leads to the production of supplementary C–S–H (Calcium Silicate Hydrate) gel, which will further densify the matrix and thereby contribute to the improvement in compressive strength [5]. The substitution of more than 30% OPC with GGBS showed a reduction in the compressive strength. This is attributed to the low-density C–S–H gel produced by GGBS and the absence of free calcium hydroxide, which is essential for the pozzolanic reaction [50].
Further, SF particles also participated in pore filling, thereby helping refine the microstructure of the mixes. The addition of fibres also affected the compressive strength of mixes. Well-dispersed and properly oriented fibres in the matrix will result in improved integrity and improved compressive strength of mixes.

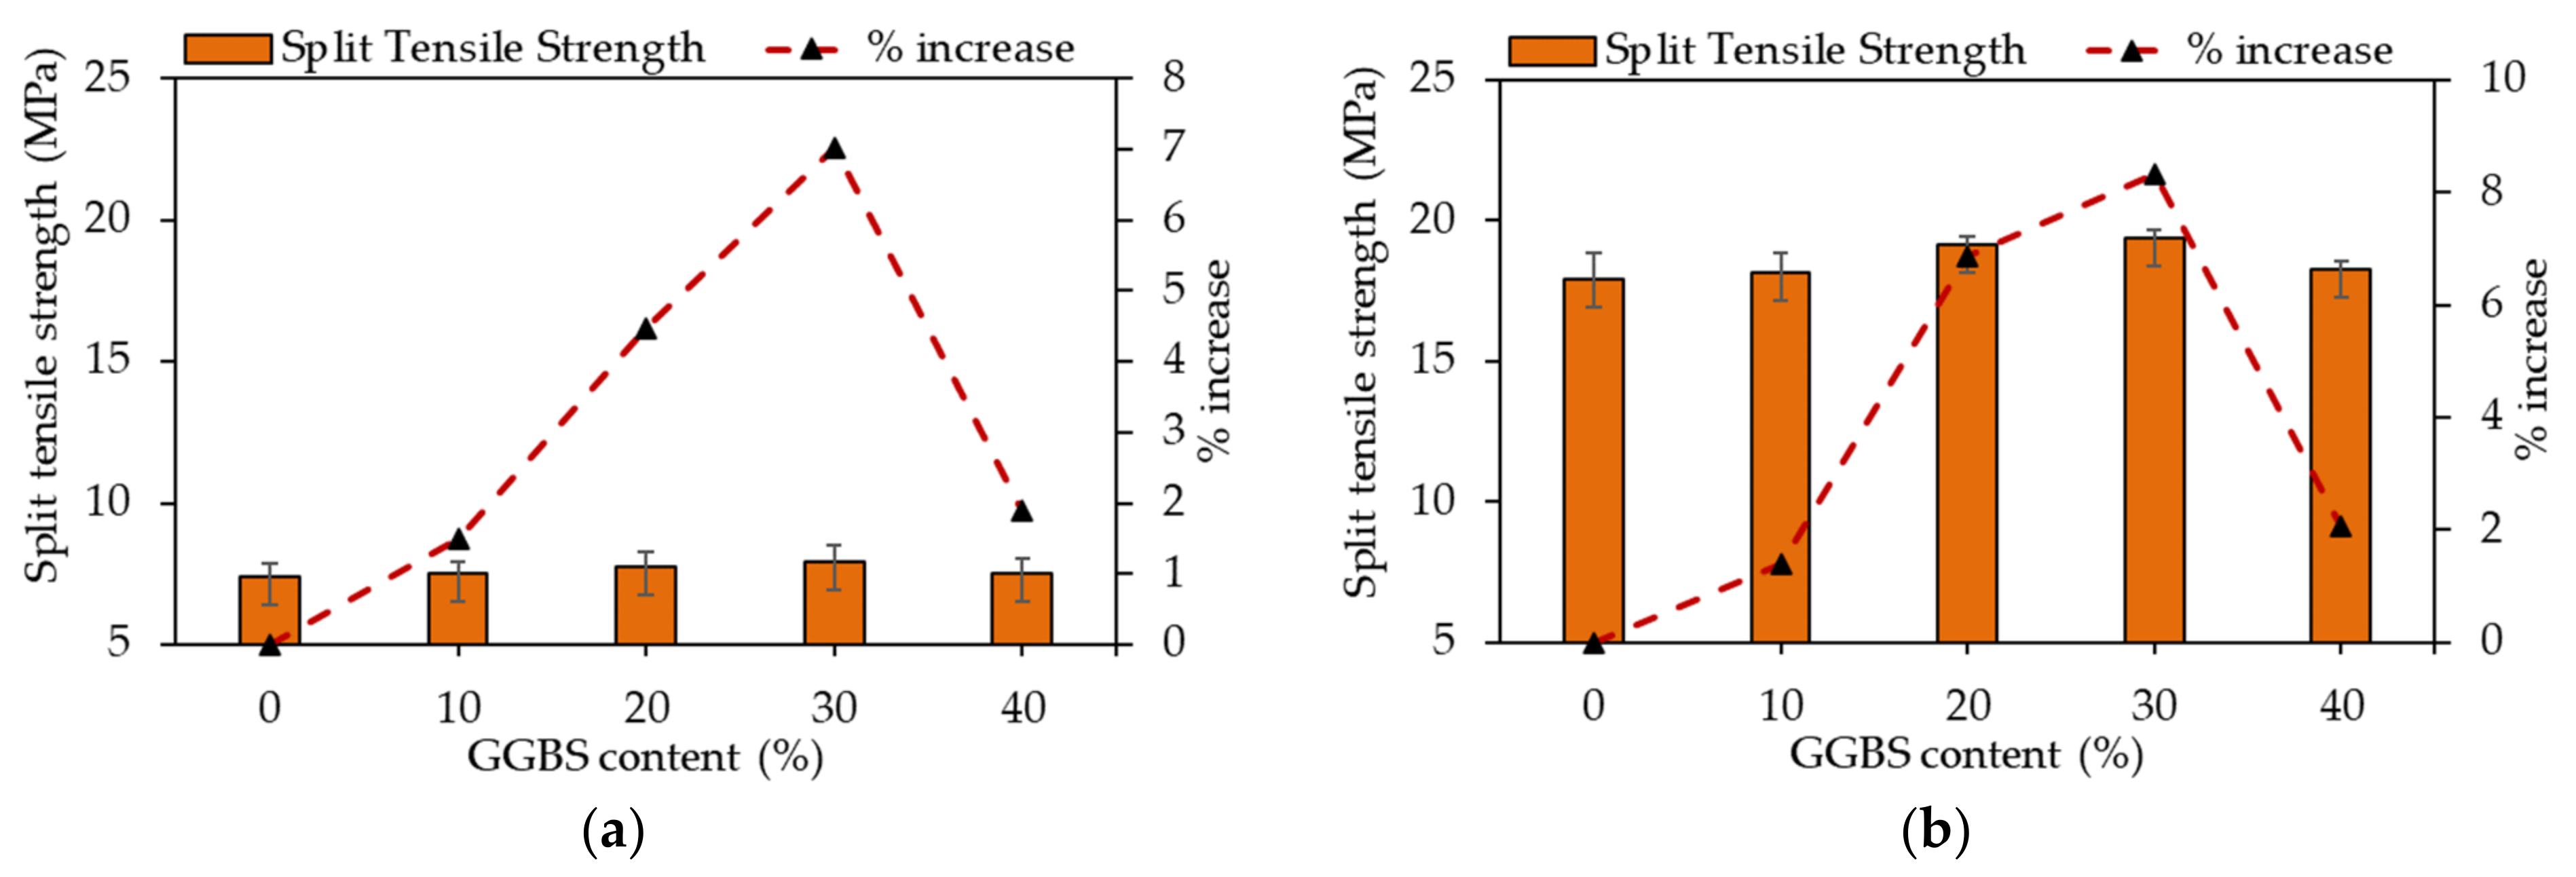
3.3. Splitting Tensile Strength

Similar to the compression test, the splitting tension test was also carried out after 28 days of normal water curing. The average splitting tensile strength test results of the developed RPC mixes are presented in Figure 7. Figure 7a shows the variation in splitting tensile strength of the non-fibrous mixes due to the addition of GGBS. The figure presents the percentage variation of splitting tensile strength of the mixes with reference to the mix NF0. Figure 7b shows the variation in the splitting tensile strength of the fibrous mixes due to the addition of GGBS. The figure also presents the percentage variation of the splitting tensile strength of the mixes with reference to the mix F0.
Significant improvement in the splitting tensile strength of the mixes was observed due to OPC replacement with GGBS. Among the non-fibrous mixes, the mix with 30% OPC replaced with GGBS (mix NF30) exhibited the highest value of splitting tensile strength. The strength exhibited by the mix was 7.92 MPa. This strength was 7.02% higher than that of the non-fibrous mix with 0% GGBS (NF0). The mix NF0 exhibited a strength of 7.4 MPa. The improved strength can be attributed to the production of supplementary C–S–H gel due to the pozzolanic reaction of GGBS. Addition of GGBS beyond 30% leads to the reduction in splitting tensile strength. The low reactivity of GGBS particles, in the development of low-density C–S–H produced by GGBS, could thereby be a reason for this reduction in strength [5]. This is mainly due to the poor hydration of GGBS at the early ages and additional demand for free portlandite. However, the mic NF40 exhibited a strength of 7.54 MPa, which is still higher than the control mix (mix NF0).
The addition of fibres significantly improved the splitting tensile strength of RPC mixes. Among the fibrous RPC mixes, the mix with 30% GGBS (mix F30) showed the highest value of splitting tensile strength. The strength exhibited by this mix was 19.39 MPa, which is 8.32% higher than that of fibrous mix with 0% GGBS (mix F0). The mix F0 showed a strength of 17.9 MPa. The splitting tensile strength of mix F30 was 144.8% higher than that of NF30 and 162% higher than that of the mix NF0.
The lower value of splitting tensile strength of non-fibrous mixes is mainly due to the brittle failure of bonds offered by binders. In the case of fibrous mixes, even though there was a sudden initial failure of bonds, fibres will come into action as the crack widens. Fibres will bridge across the cracks, and they will undergo axial tension. The ability of steel fibres to carry high tensile loads helped delay the failure process. Further stress reduction will happen as the fibres are pulled out of the matrix [52].

3.4. Fracture Toughness

ENDB specimens were subjected to the three-point bending test after 28 days of normal water curing. The influence of factors such as the GGBS content and presence of fibres on mode I, mode III, and mixed-mode I/III were analysed from the test results.

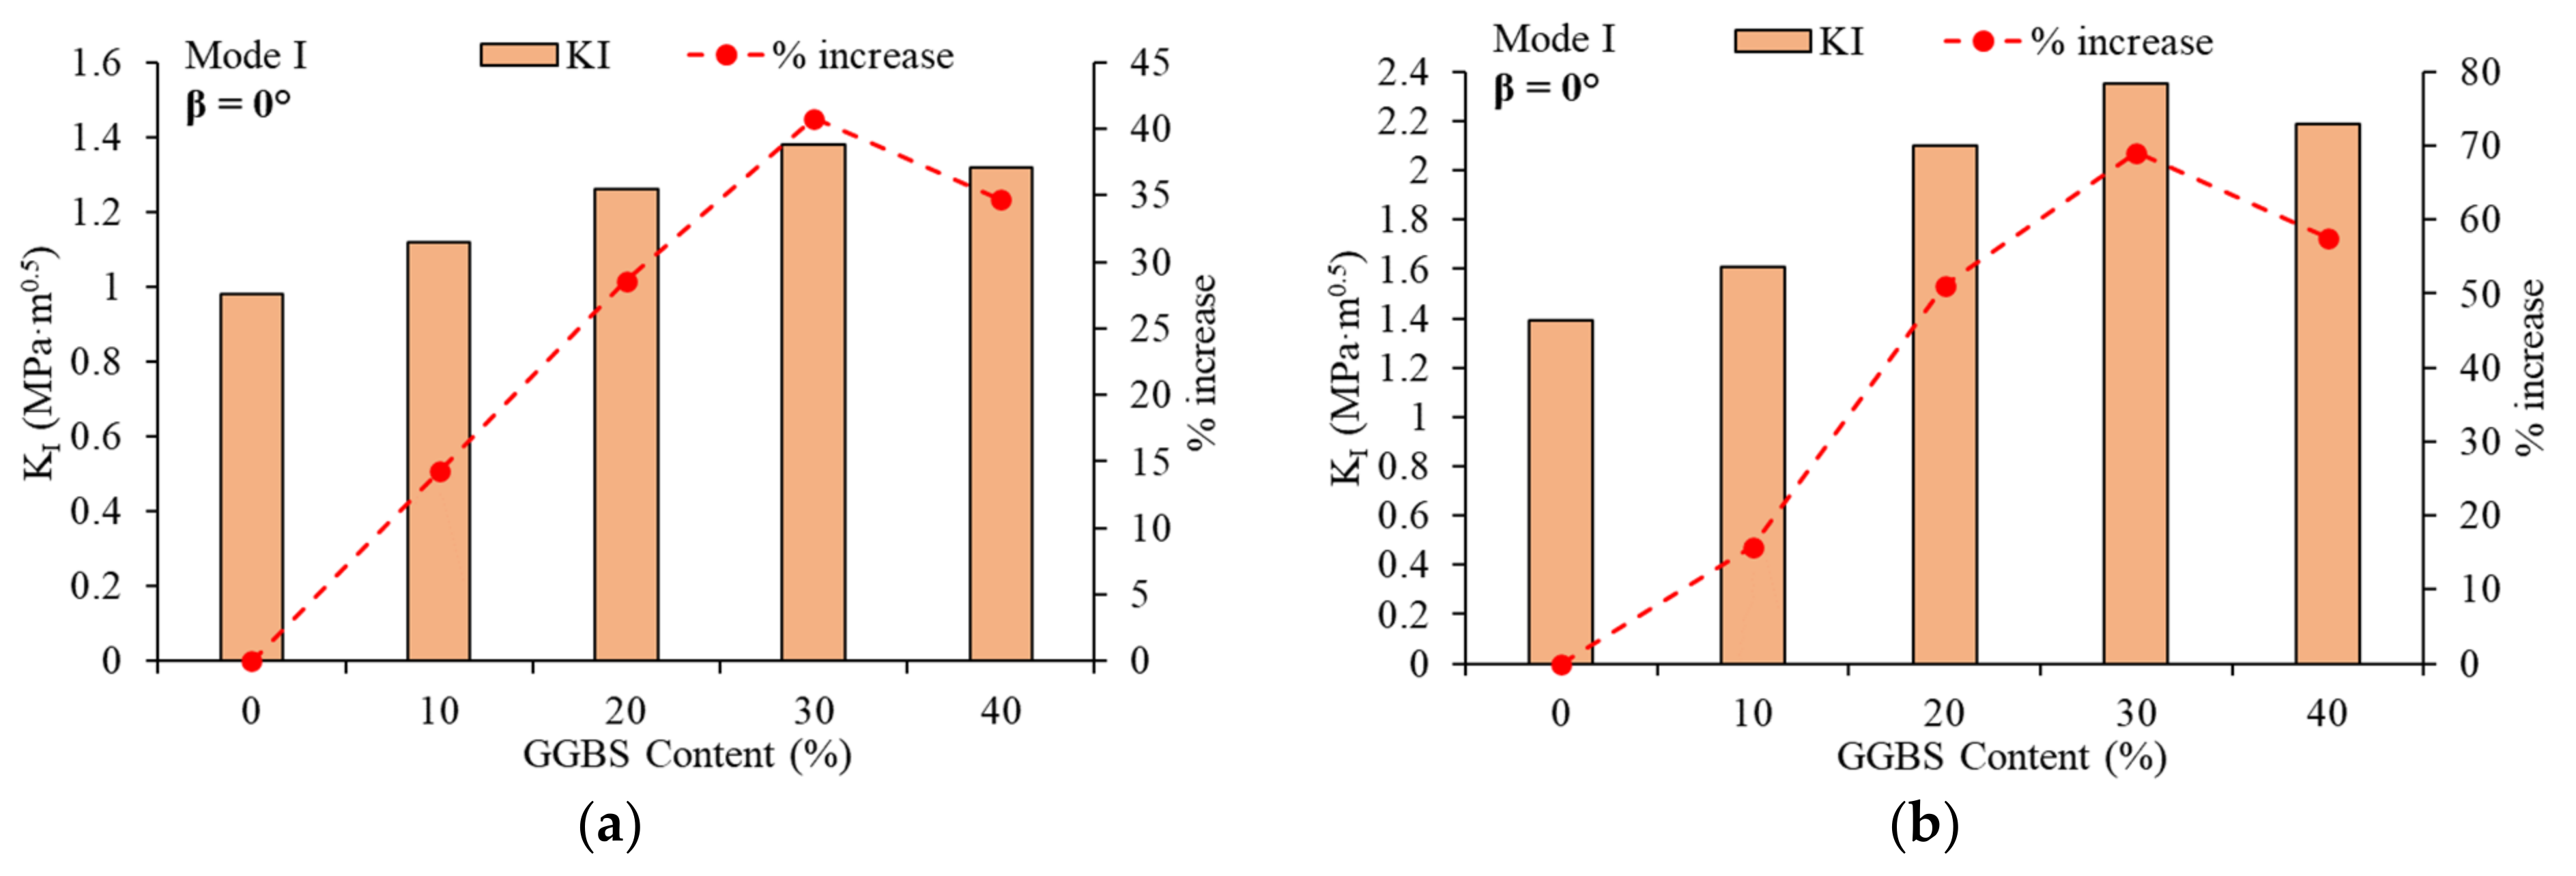
3.4.1. Effect of Addition of GGBS on Pure Mode I Fracture Toughness

The effect of OPC replacement with GGBS on the pure mode I fracture toughness is discussed in this section. Figure 8a,b present the variation in KI due to the increase in GGBS content in the non-fibrous and fibrous mixes.
Analysis of the test results revealed that the trend in variation of KI due to the addition of GGBS is concurrent with the compressive strength results. In the case of non-fibrous mixes, an increased KI was observed up to a replacement of 30% OPC with GGBS. The mix NF30 showed a KI value of 1.38. It was 40.8% higher than the non-fibrous mix with 0% GGBS (mix NF0). The addition of GGBS beyond 30% led to a reduction in the KI value. The mix NF40 exhibited a toughness of 1.32 MPa·m0.5, which was 34.6% higher than the mix NF0. It is recorded that even 40% replacement also helped in the enhancement of KI in comparison with that of NF0. A similar trend was observed in the case of fibrous mixes also. The mix with 30% OPC replaced with GGBS (mix F30) showed a higher value of KI. The mix F30 exhibited a mode I toughness of 2.35 MPa·m0.5. This was 69.1% higher than that of mix F0. The Mix F0 exhibited a mode I fracture toughness of 1.39 MPa·m0.5.

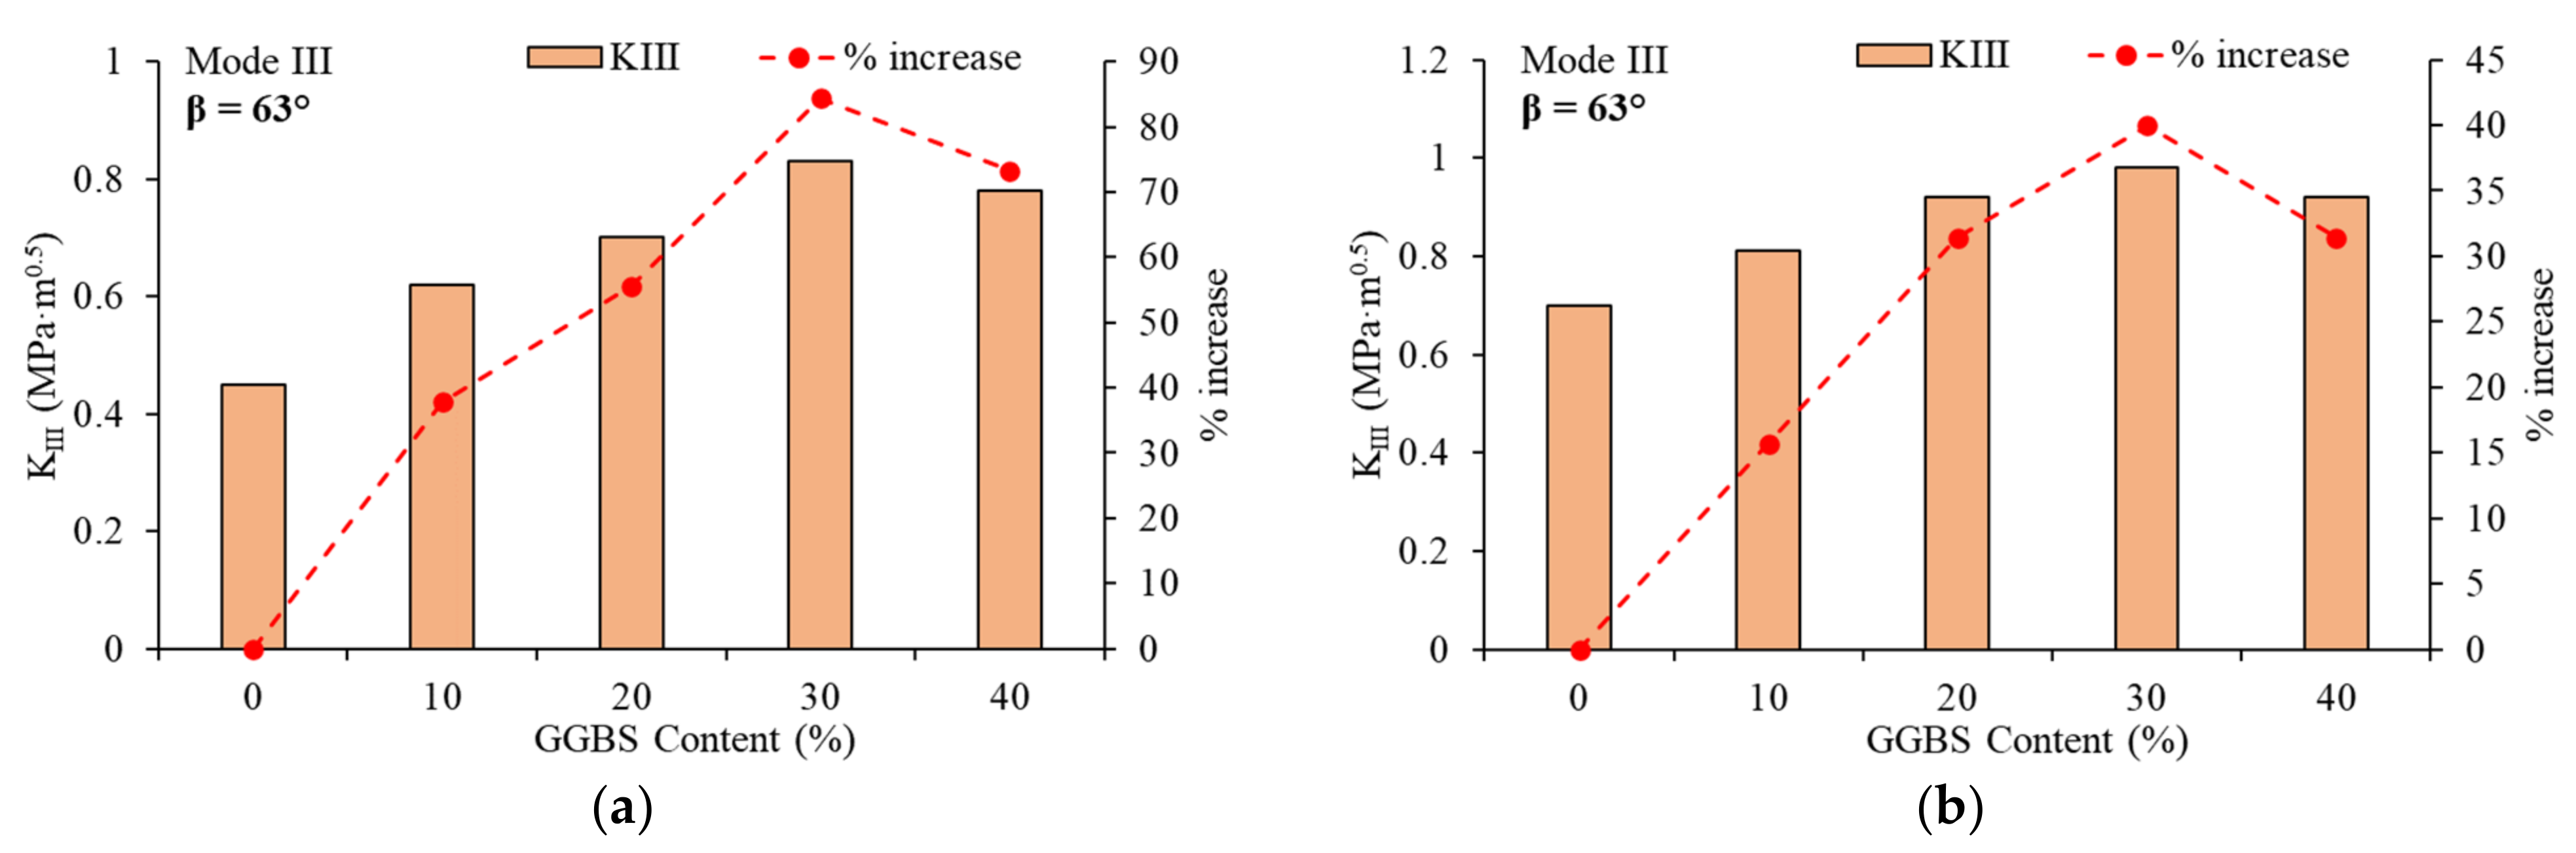
3.4.2. Effect of Addition of GGBS on Pure Mode III Fracture Toughness

The effect of OPC replacement with GGBS on the pure mode III fracture toughness is discussed in this section. Figure 9a,b present the variation in KIII due to the increase in GGBS content in the non-fibrous and fibrous mixes, respectively.
As in the case of the mode I fracture test, the variation in KIII values due to the addition of GGBS also was in concurrence with the trend observed in the compression test. Among non-fibrous mixes, the mix NF30 exhibited the highest value of KIII, which was 0.83 MPa·m0.5. The value of KIII for NF30 was 84.4% higher than that of the mix NF0. The mix NF0 showed a mode III fracture toughness of 0.45 MPa·m0.5. Among the fibrous mixes, the mix F30 showed the highest value of KIII. The value of KIII for F30 was 0.98 MPa·m0.5, which was 40% higher than that of the mix F0. The mix F0 exhibited a mode III fracture toughness of 0.70 MPa·m0.5. Further increase in GGBS content led to the reduction in fracture toughness in the case of both non-fibrous and fibrous mixes. In addition, it is worthy to note that mixes NF40 and F40 showed a higher mode III fracture toughness than NF0 and F0, respectively. This reveals the potential of high volume GGBS content in delaying the failure process.

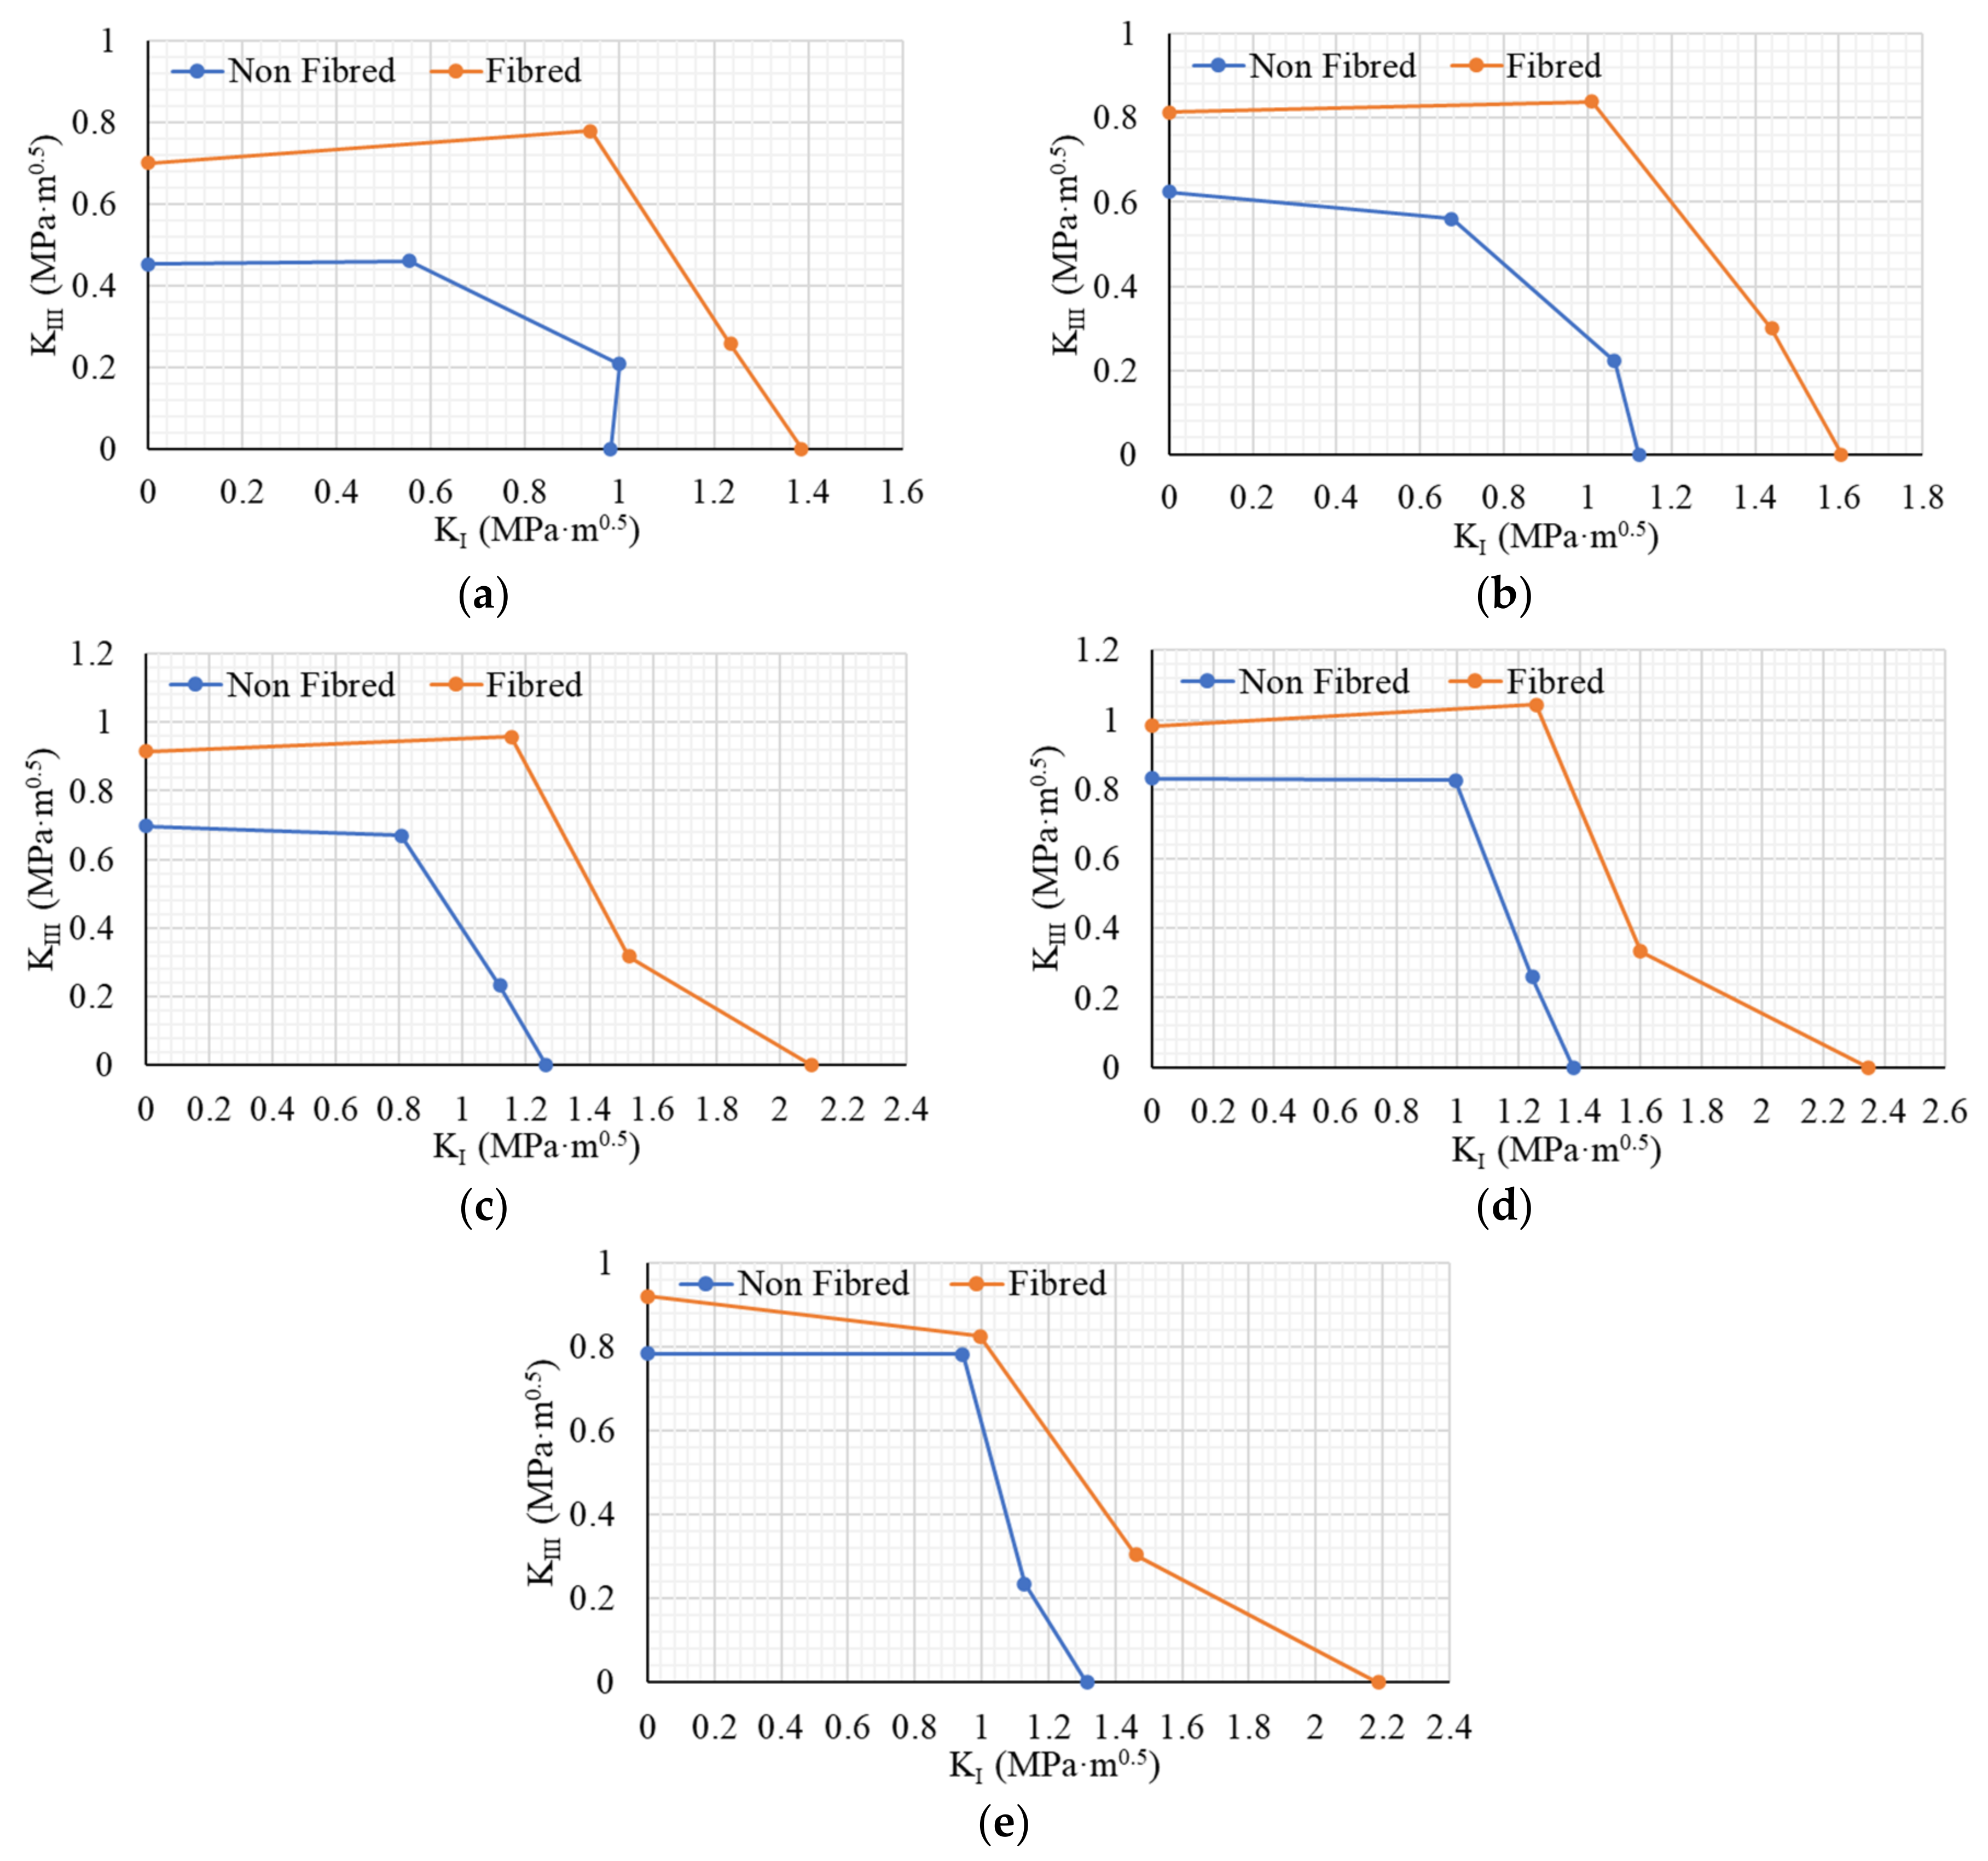
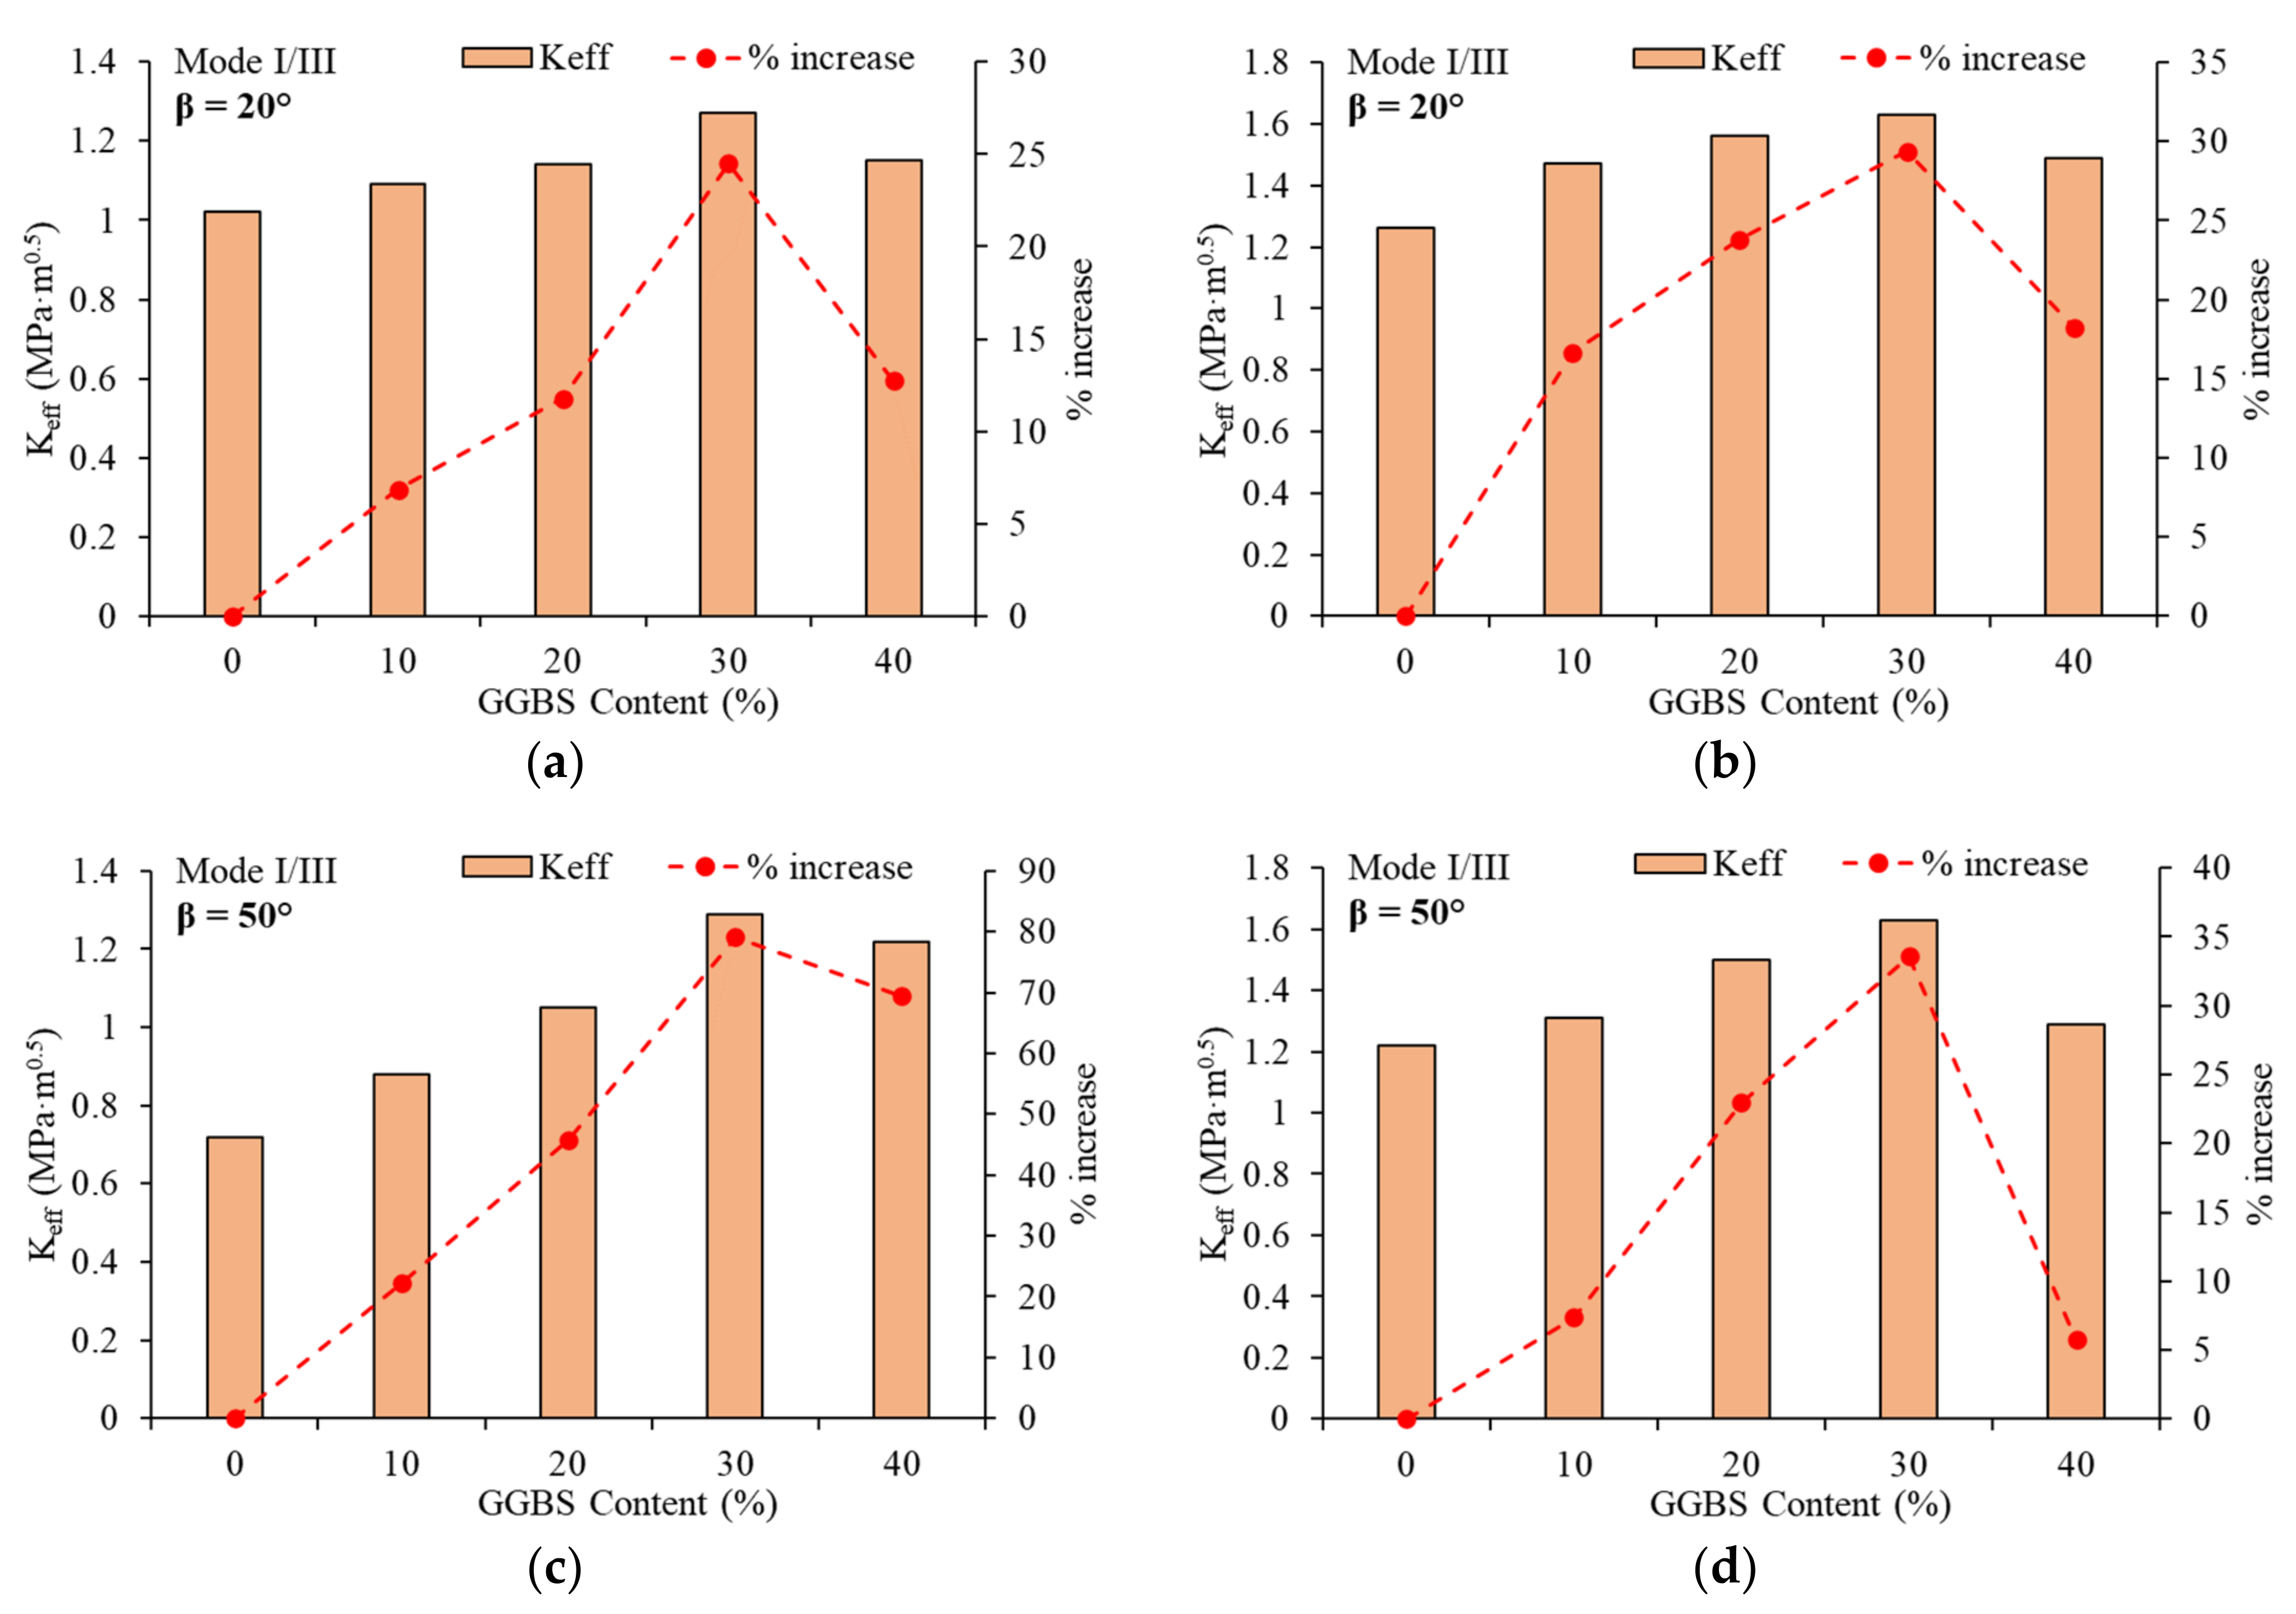
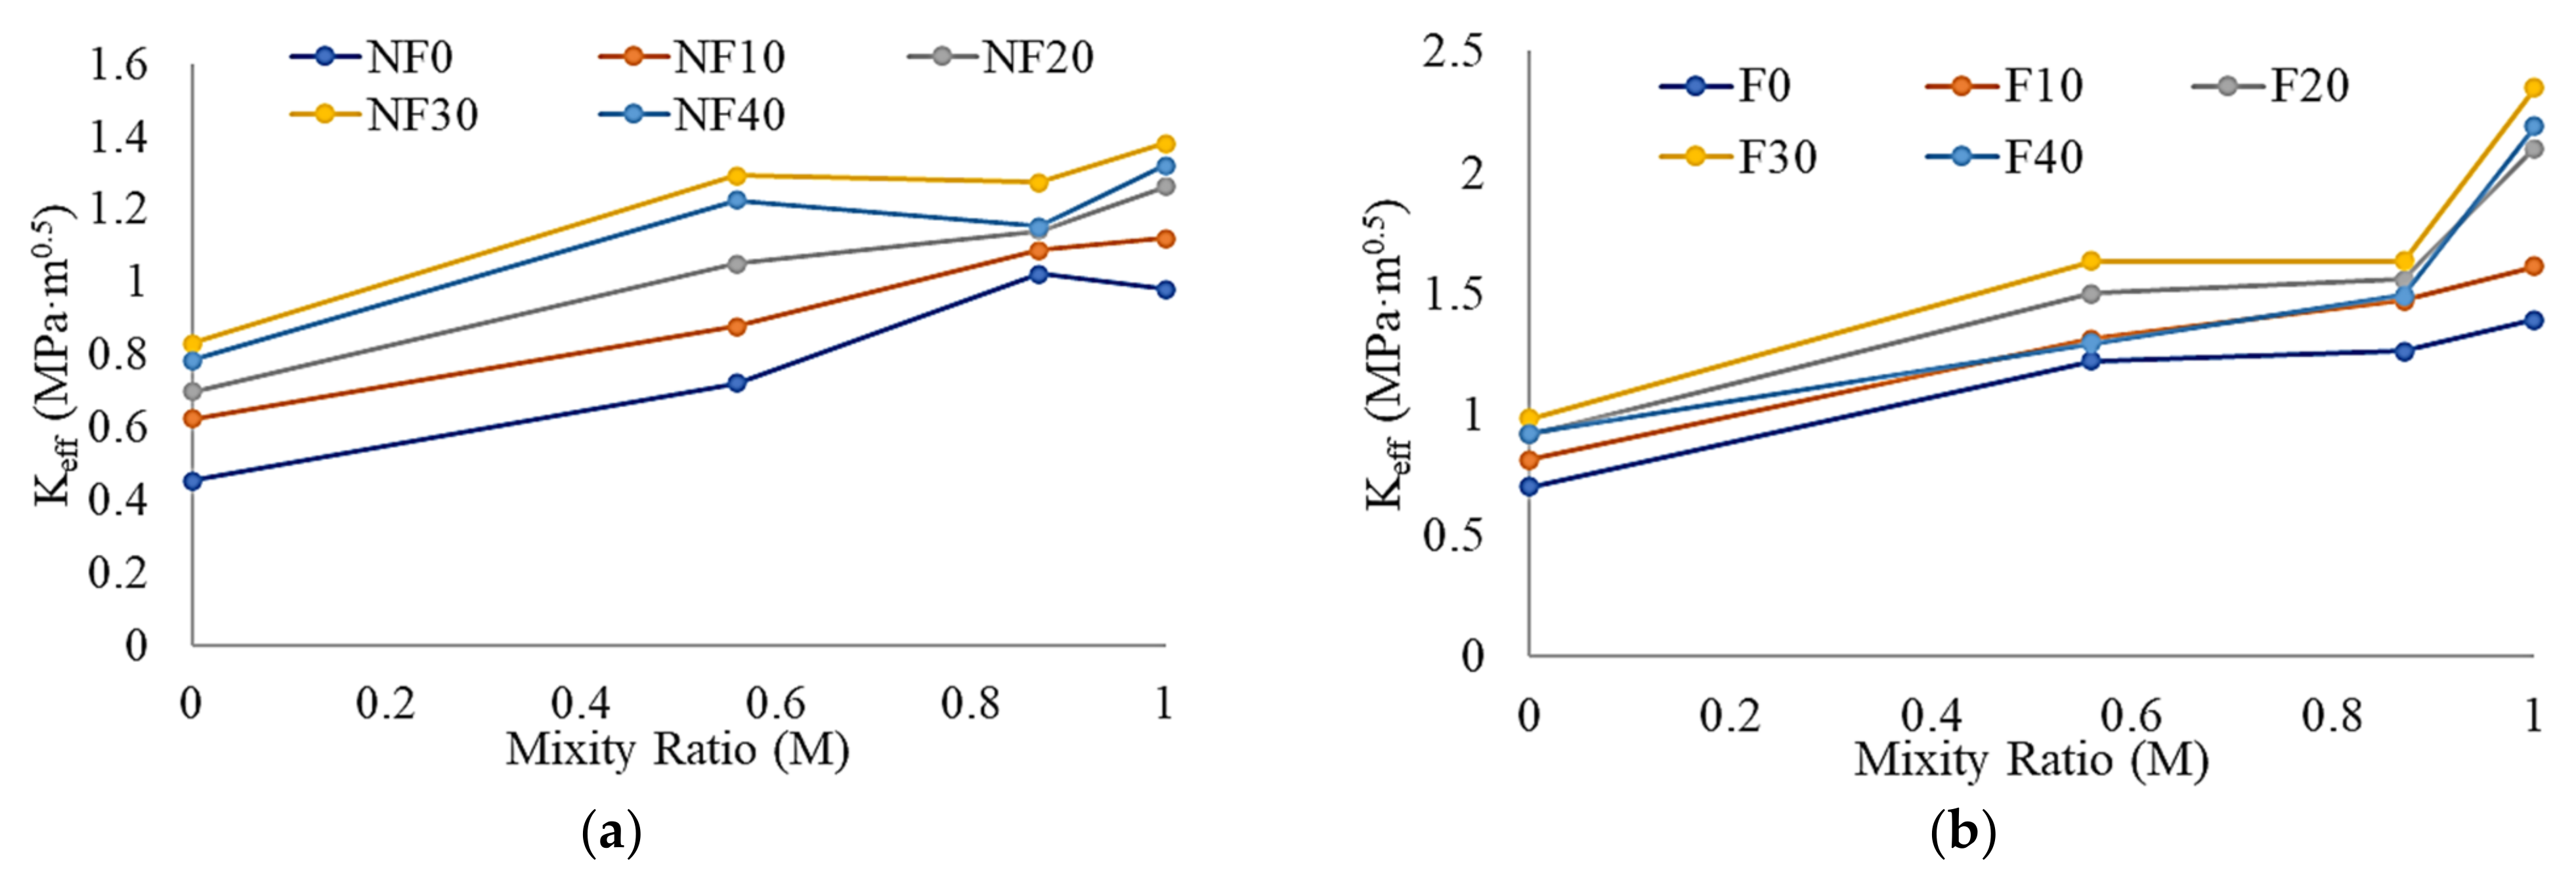
3.4.3. Effect of Addition of GGBS on Mixed-Mode I/III Fracture Toughness

The effect of the replacement of OPC with GGBS on the mixed-mode I/III fracture toughness is discussed in this section. Figure 10a,b present the variation in effective fracture toughness for β = 20° due to the addition of GGBS in the non-fibrous and fibrous mixes, respectively. Additionally, Figure 10c,d present the variation in effective fracture toughness for β = 50° due to the increase in GGBS content in the non-fibrous and fibrous mixes, respectively.
A trend similar to that of mode I fracture toughness was also observed in the case of mixed modes. An increase in the fracture toughness was observed when replacing 30% of cement with GGBS. The mix NF30 exhibited an effective fracture toughness value of 1.27 MPa·m0.5 at β = 20°. This value was 24.5% higher than that of the mix NF0. The mix NF0 showed an effective fracture toughness of 1.02 MPa·m0.5. The mix F30 showed an effective fracture toughness of 1.63 MPa·m0.5, which was 29.4% higher than that of the mix F0. The mix F0 exhibited an effective fracture toughness of 1.26 MPa·m0.5. Further, for the angle β = 50°, the mixes NF30 and F30 showed almost similar fracture toughness results of 1.29 MPa·m0.5 and 1.63 MPa·m0.5 respectively.
The test results revealed that GGBS, an efficient SCM, has a significant influence on the enhancement of fracture toughness of RPC mixes, thereby contributing to the slowing down of the failure process. It was observed that, in all the loading cases, the fracture toughness values were gradually increasing up to a 30% replacement of OPC with GGBS. Further increase in GGBS content led to a decrease in fracture toughness. This can be attributed to the poor hydration of GGBS and increased demand of portlandite [5]. The brittle failure of non-fibrous mixes can be attributed to the densification of the matrices due to the addition of GGBS [53]. Further, the addition of GGBS helped in attaining a better bond with fibres. The observed value of mode I fracture toughness of RPC was in better agreement with the results of previous research [54], where the value of KI was in the range of 1.74 to 2.25 MPa·m0.5. This ascertains the suitability of ENDB specimens for the evaluation of mode I fracture toughness of RPC mixes. However, there are no available experimental results on pure mode III fracture toughness and mixed-mode I/III fracture toughness of RPC (or UHPC) mixes. The lacking test results on mode III and mixed-mode I/III signifies the necessity of this research.

3.4.4. Effect of Addition of Fibres on Fracture Toughness

Figure 11a–e present the variation in fracture toughness of non-fibrous and fibrous RPC mixed with varying GGBS content. It was observed from the test results that fibrous addition significantly helped in improving the fracture toughness of RPC mixes.
Among the mixes with 0% GGBS, the mix F0 exhibited a mode I fracture toughness of 1.38 MPa·m0.5, which was 41% higher than the mix NF0. The mix NF0 exhibited a toughness of 0.98 MPa·m0.5. Among all the mixes, those with 30% GGBS showed better enhancement of KI due to the addition of fibres. The mix F30 showed a mode I fracture toughness of 2.35 MPa·m0.5, which was about 70% higher than the mix NF30. The mix NF30 exhibited a toughness of 1.38 MPa·m0.5. A similar trend was observed in the case of mixed modes with β = 20° and β = 50°. The enhancement in mode I fracture, due to fibre addition, is due to the fibres’ ability to bridge across the crack propagation path, slowing down crack flanks’ opening. Randomly oriented fibres are almost perpendicular to the crack flanks in the matrix. Due to the applied load, fibres will undergo axial tension as crack propagation begins. The high tensile strength of steel fibres thus helps in enhancing the post-cracking behaviour of RPC mixes [55].
The addition of macro steel fibres did not help much to enhance the mode III fracture toughness of RPC mixes admixed with GGBS. The KIII value of the mix F0 was 0.69 MPa·m0.5 and 53% higher than that of the mix NF0. A gradual decrease in the percentage enhancement was observed due to the addition of GGBS. The mix F30 exhibited a KIII value of 0.98 MPa·m0.5, which was only 18% higher than that of mix NF30. The mix NF30 showed a KIII value of 0.83 MPa·m0.5. This can be attributed to the higher brittleness of the matrix due to the addition of GGBS and easy fibre pullout while undergoing out-of-plane shear. It can also be due to short profiled fibres’ inability to bridge the wider curvilinear failure planes under mode III loading.

3.4.5. Effect of Mode of Loading on Fracture Toughness of RPC Mixes

The mixity ratio (M) is a parameter used to pronounce the contribution of the different loading modes to the failure. Figure 12a,b present the variation in the effective fracture toughness of non-fibrous and fibrous mixes, respectively, for various values of mixity ratios. For pure mode I, the value of M = 1, whereas for pure mode III, the value of M = 0.
As described in Figure 13a,b, mode III loading is quite critical among all the modes of loading (including the mixed modes). The effective fracture toughness values of all the mixes for the mode III loading were lesser than those under the other loading modes. Mode III toughness of mix NF30 was about 40% lesser than its mode I toughness. Nevertheless, in the case of fibrous specimens, the reduction was a little higher. Mode III toughness of the mix F30 was 58% lesser than its mode I toughness. This can be due to the poor crack bridging of fibres in out-of-plane shear. Failure planes are wider in the case of mode III loading compared to the other modes. A facile pullout of fibres is possible in the case of such failure planes. Hence, the fibre addition could help improve the mode III fracture toughness of mixes. This can be observed in contrast with the opening mode (mode I), where fibres can bridge over the narrow crack openings and delay the failure.

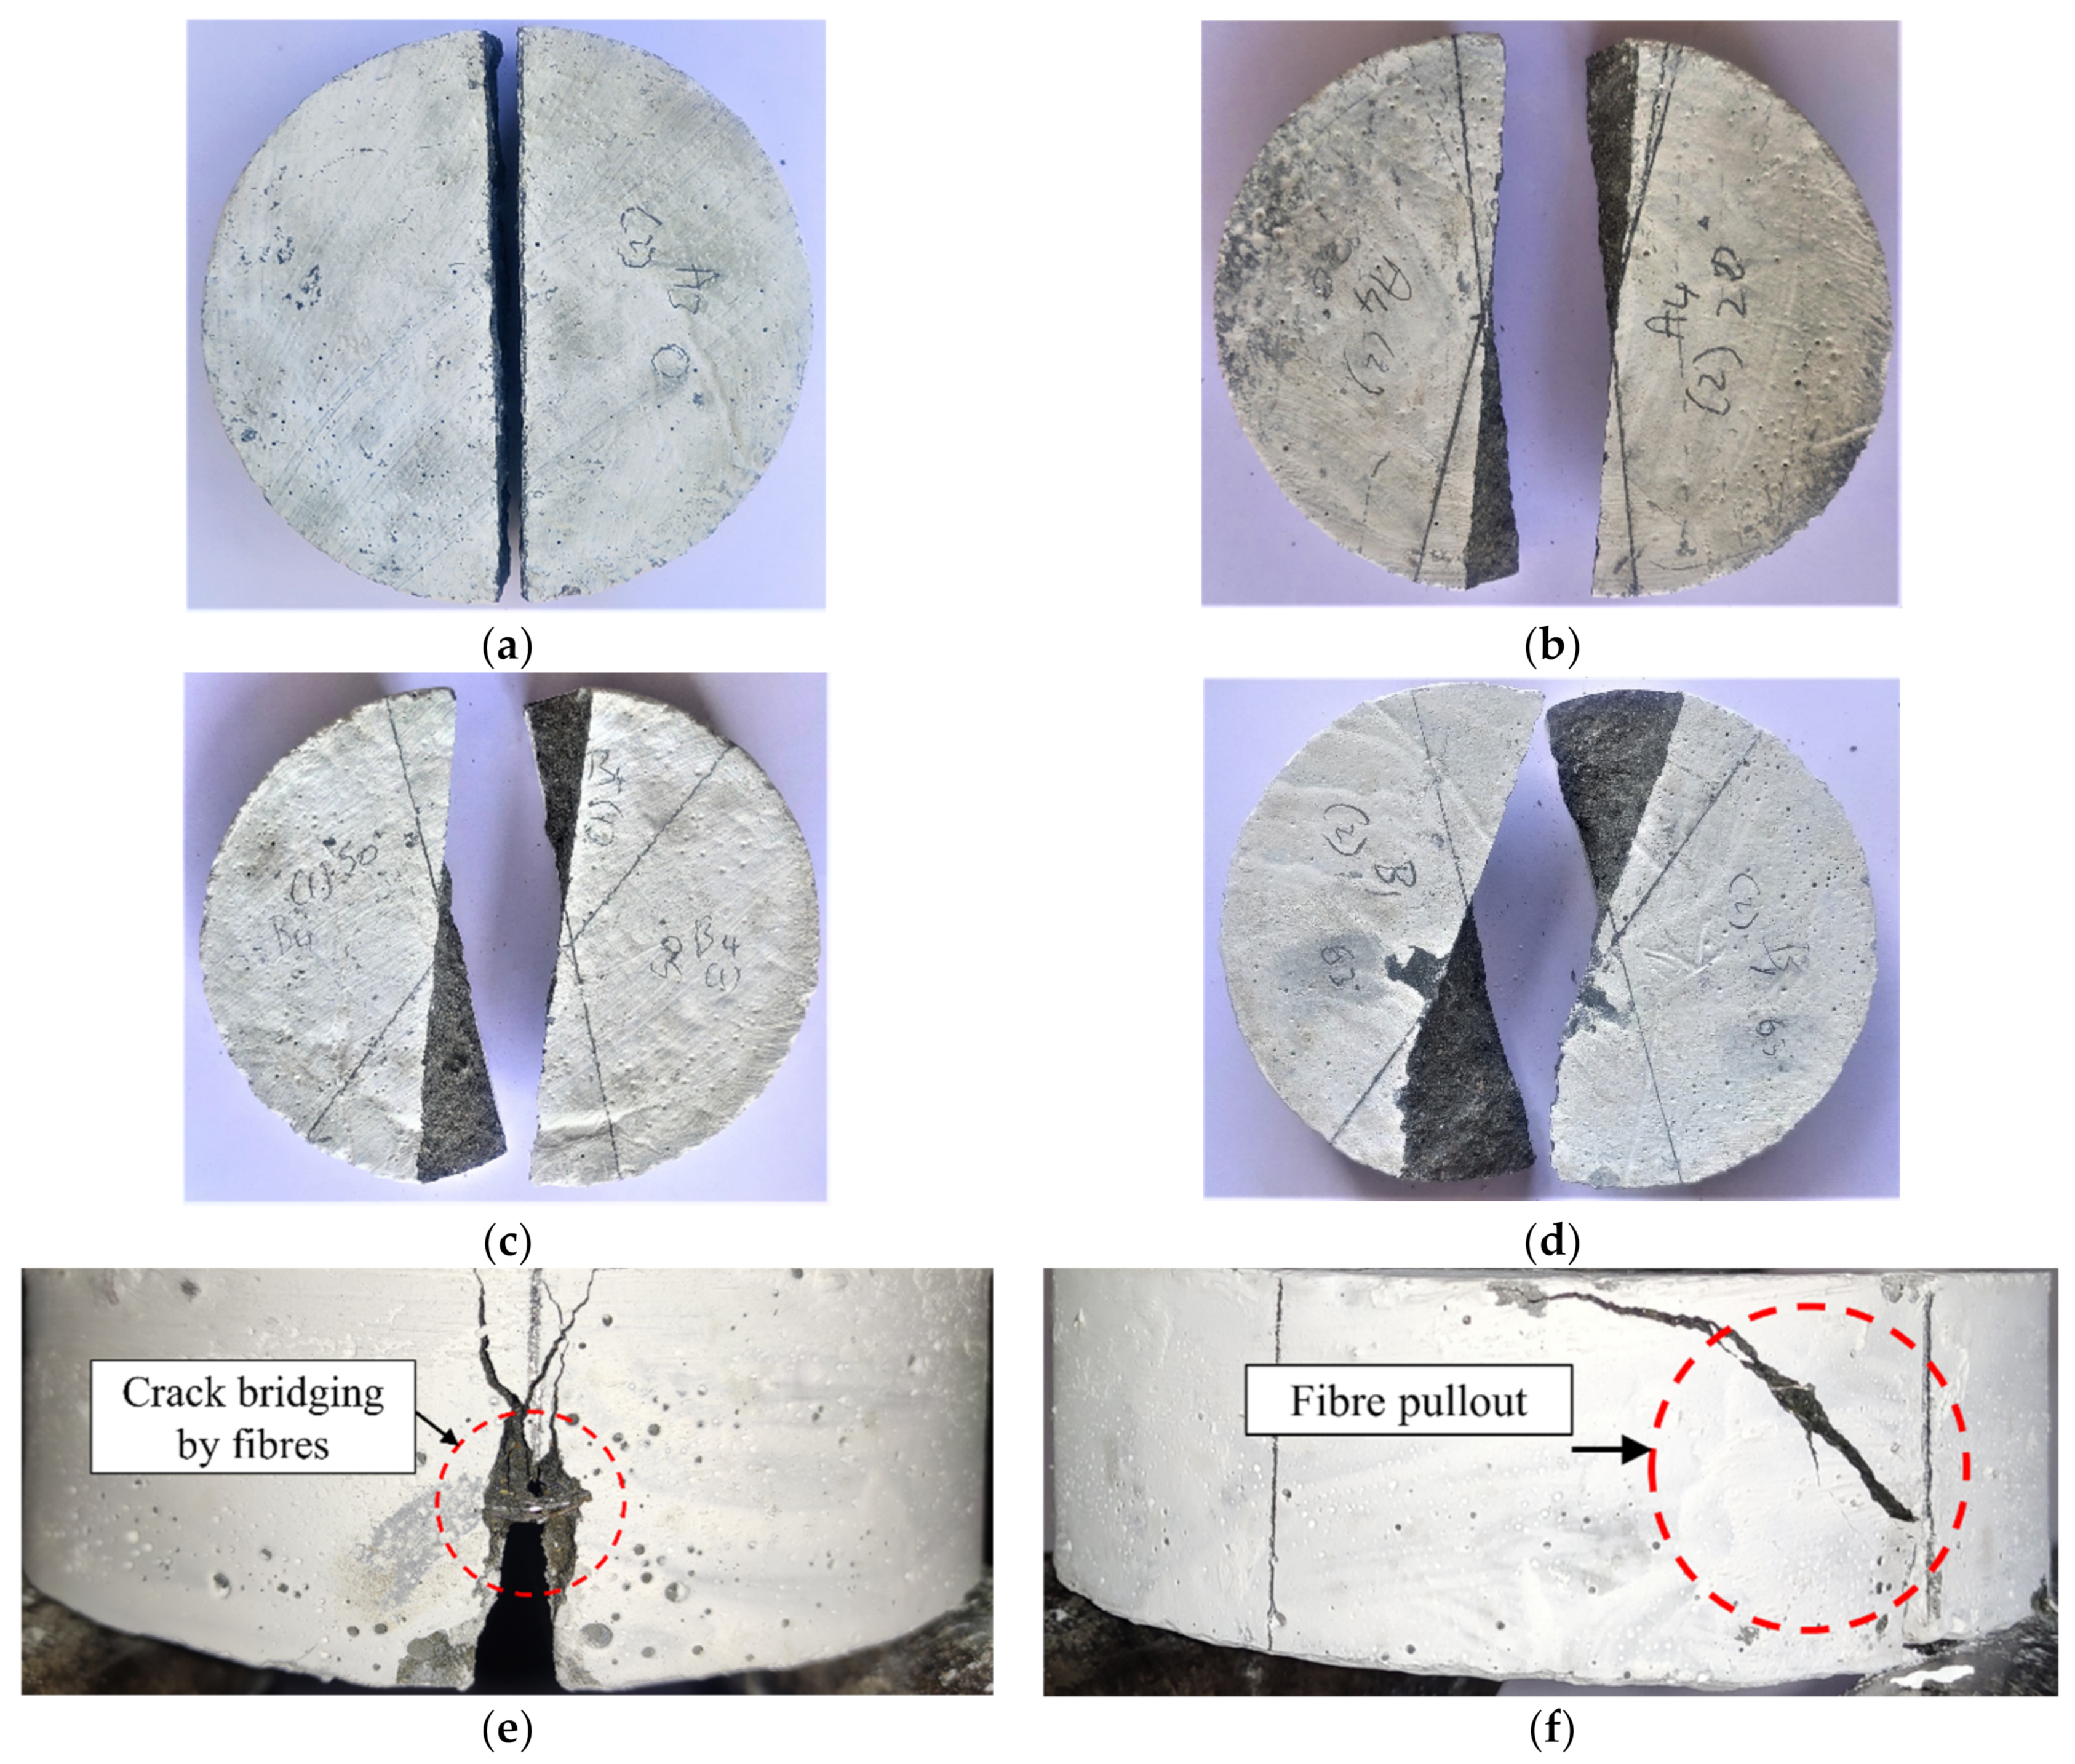
3.5. Failure Patterns

Figure 13a–d present the failure pattern of non-fibrous specimens tested under various loading modes. Figure 13e presents the pattern of fibrous specimens under mode I loading, and Figure 13f describes the typical pattern followed by fibrous specimens under mixed modes and mode III loading.
Sudden and brittle failure was observed in the case of non-fibrous specimens. As shown in Figure 13a, under the pure mode I loading condition, the fracture path of non-fibrous specimens extends along the initial crack front. As shown in Figure 13e, a similar crack path was observed in the case of fibrous specimens tested under mode I loading. However, unlike non-fibrous specimens, the propagation of the failure path of fibrous specimens was gradual. As shown in Figure 13b–d, a twisted curvilinear failure path was observed in the case of non-fibrous specimens tested under mixed modes and pure mode III loadings. Though a similar pattern of failure was observed in the case of fibrous specimens tested under mixed modes and mode III loading, the failure mechanism was gradual. The gradual propagation of the failure path of fibrous specimens can be attributed to steel fibres’ ability to bridge the crack, thereby slowing down the opening of crack flanks. The failure patterns observed were in better agreement with those presented in similar works [55].

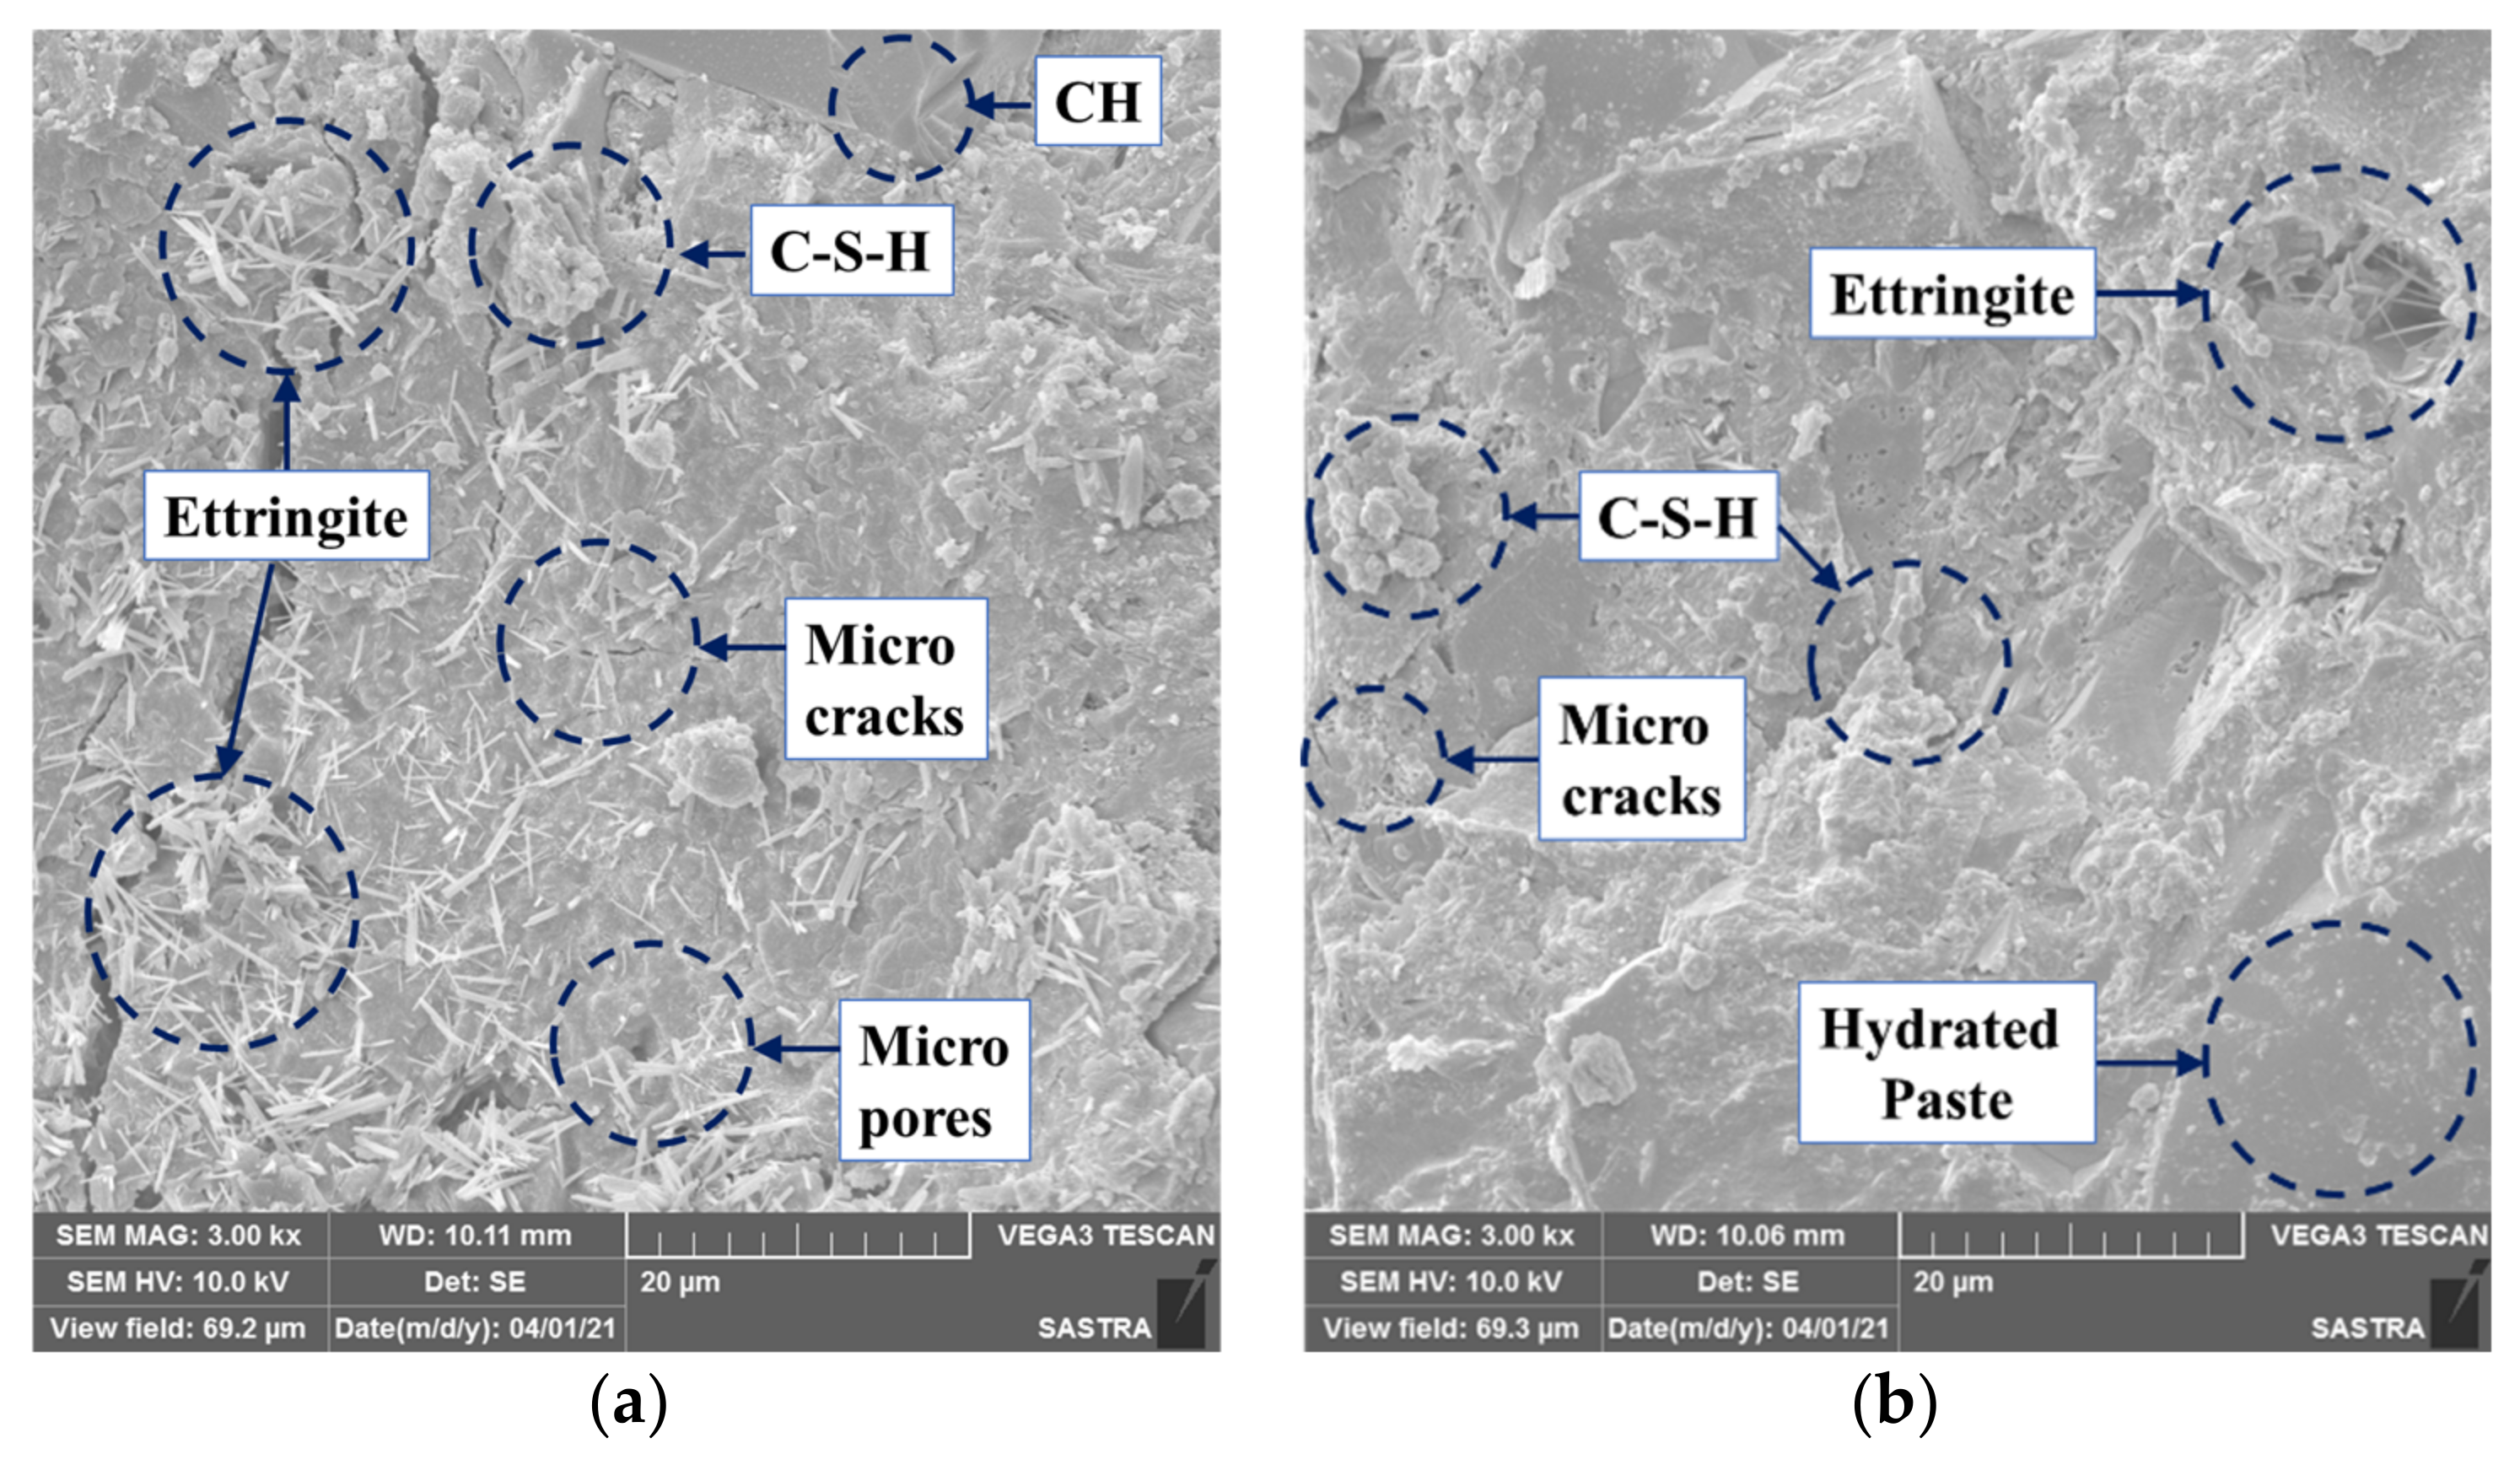
3.6. Morphology Assessment by SEM

Figure 14a,b are the SEM micrographs of the mixes with 0% and 30% GGBS, respectively.
The ruptured surfaces of the matrices were examined at a magnification level of 3000× to ascertain the potential of GGBS in improving the strength and toughness characteristics of RPC mixes. As presented in Figure 14, the mix with 0% GGBS was with light C–S–H phases. The presence Portlandite (CH) phases were also observed in this mix. In addition, the presence of needle-shaped ettringite was also evident from the SEM micrograph of this mix. In contrast with these observations, in the micrograph of mix with 30% GGBS, dense C–S–H phases were observed. In this mix, CH phases were not found, which can be due to the low density of the same. The low density of CH phases can be due to the better consumption of the same by the GGBS to produce supplementary C–S–H gel. The micropores observed in the case of mix with 0% GGBS can be due to the hydration reaction of Alite and Belite. Further, the density of micropores in the mix with 30% GGBS was negligible compared to that of the mix with 0% GGBS. The compactness of this mix is due to the pozzolanic action of GGBS, and this ascertains the ability of GGBS in pore filling, thereby improving the density of the mix [56]. The microcracks observed in the matrices can be due to the shrinkage. Other major cracks visible in the micrographs are due to the rupture of matrices under loading.

4. Conclusions

This research investigates the performance of fibrous and non-fibrous RPCs under the pure mode I, pure mode III, and mixed modes I/III loading conditions. The key findings of the study are summarized below.
  • The compressive strength of RPC mixes was significantly improved due to the partial replacement of OPC with GGBS. The non-fibrous and fibrous mixes with 30% OPC replaced with GGBS showed the highest compressive strength values. This phenomenon is attributed to the pore filling ability of GGBS particles and the densification matrices due to the production of supplementary C–S–H gel and pozzolanic action of GGBS. Further fibres bridged across the cracks and helped improve the mix’s integrity, thereby contributing to the improvement in compressive strength.
  • The splitting tensile strength of RPC mixes was also highly influenced by the addition of GGBS. Non-fibrous mixes exhibited considerably low values of splitting tensile strength. This can be due to the high brittleness of the mixes associated with the densification of matrices and pozzolanic action of GGBS. The fibrous mix with 30% OPC replaced with GGBS exhibited the highest values of splitting tensile strength. In addition to the densification of matrices due to the action of GGBS, the ability of steel fibres in bridging over the cracks, and thereby delaying the failure process, helped in attaining a higher value of splitting tensile strength.
  • Partial replacement of OPC with GGBS significantly improved pure mode I, pure mode III, and mixed-mode I/III fracture toughness of RPC mixes. Sudden brittle failure was observed in the case of non-fibrous specimens. However, ductile failure was observed in the case of fibrous specimens. The fibrous mix with 30% OPC replaced with GGBS exhibited the highest mode I, mode III, and mixed-mode I/III fracture toughness values. This can also be attributed to the pozzolanic action of GGBS and the ability of steel fibres in crack bridging.
  • The addition of short macro steel fibres helped improve the mode I fracture toughness significantly. However, it did not contribute much in the case of mode III loadings. This behaviour is due to the inability of fibres to bridge across the wider crack paths in the case of tearing.
  • Significant microstructure refinement was observed in the SEM micrographs of GGBS modified RPC mixes. This ascertains the better filling of micropores and thereby the densification of matrices. Improved density will result in better strength characteristics.
The results of the experimental program revealed that the partial replacement of OPC with GGBS has a significant influence on the fracture toughness of RPC mixes. Hence, it can be summarized that GGBS is a potential SCM that can delay the failure process of RPCs under pure mode I, pure mode III, and mixed modes of loading. Fibre reinforcement also has a significant role in improving the fracture toughness of RPC mixes.

Author Contributions

Conceptualization, S.S. and K.S.R.M.; methodology, S.S. and K.S.R.M.; software, S.S. and K.S.R.M.; validation, S.S. and K.S.R.M.; formal analysis, S.S. and K.S.R.M.; investigation, S.S. and K.S.R.M.; resources, S.S. and K.S.R.M.; data curation, S.S. and K.S.R.M.; writing—original draft preparation, S.S., K.S.R.M. and G.M.; writing—review and editing, S.S., K.S.R.M. and G.M.; visualization, S.S. and K.S.R.M.; supervision, K.S.R.M.; project administration, S.S. and K.S.R.M.; funding acquisition, G.M. All authors have read and agreed to the published version of the manuscript.

Funding

This research received no external funding.

Institutional Review Board Statement

Not applicable.

Informed Consent Statement

Not applicable.

Data Availability Statement

Not applicable.

Acknowledgments

The authors are grateful to the School of Civil Engineering, SASTRA Deemed University, for the support.

Conflicts of Interest

The authors declare no conflict of interest.

References

  1. Alaloul, W.S.; Musarat, M.A.; Rabbani, M.B.A.; Iqbal, Q.; Maqsoom, A.; Farooq, W. Construction Sector Contribution to Economic Stability: Malaysian GDP Distribution. Sustainability 2021, 13, 5012. [Google Scholar] [CrossRef]
  2. Richard, P.; Cheyrezy, M.H. Reactive Powder Concrete with High Ductility and 200–800 MPa Compressive Strength. Mater. Sci. 1994, 144, 507–518. [Google Scholar] [CrossRef]
  3. Richard, P.; Cheyrezy, M.H. Composition of reactive powder concretes. Cem. Concr. Res. 1995, 25, 1501–1511. [Google Scholar] [CrossRef]
  4. Cooper, D. Energy Efficiency for Buildings; UNEP: Paris, France, 2015. [Google Scholar]
  5. Asrani, N.P.; Murali, G.; Parthiban, K.; Surya, K.; Prakash, A.; Rathika, K.; Chandru, U. A feasibility of enhancing the impact resistance of hybrid fibrous geopolymer composites: Experiments and modelling. Constr. Build. Mater. 2019, 203, 56–68. [Google Scholar] [CrossRef]
  6. Vasilca, I.-S.; Nen, M.; Chivu, O.; Radu, V.; Simion, C.-P.; Marinescu, N. The Management of Environmental Resources in the Construction Sector: An Empirical Model. Energies 2021, 14, 2489. [Google Scholar] [CrossRef]
  7. Monteiro, P.J.M.; Miller, S.A.; Horvath, A. Towards sustainable concrete. Nat. Mater. 2017, 16, 698–699. [Google Scholar] [CrossRef]
  8. Yazici, H.; Yardımcı, M.Y.; Yiğiter, H.; Aydın, S.; Türkel, S. Mechanical properties of reactive powder concrete containing high volumes of ground granulated blast furnace slag. Cem. Concr. Compos. 2010, 32, 639–648. [Google Scholar] [CrossRef]
  9. Cheyrezy, M.; Maret, V.; Frouin, L. Microstructural analysis of RPC (Reactive Powder Concrete). Cem. Concr. Res. 1995, 25, 1491–1500. [Google Scholar] [CrossRef]
  10. Yazıcı, H.; Yiğiter, H.; Karabulut, A.; Baradan, B. Utilization of fly ash and ground granulated blast furnace slag as an alternative silica source in reactive powder concrete. Fuel 2008, 87, 2401–2407. [Google Scholar] [CrossRef]
  11. Megat Johari, M.A.; Brooks, J.J.; Kabir, S.; Rivard, P. Influence of supplementary cementitious materials on engineering properties of high strength concrete. Constr. Build. Mater. 2011, 25, 2639–2648. [Google Scholar] [CrossRef]
  12. Zhao, H.; Sun, W.; Wu, X.; Gao, B. The properties of the self-compacting concrete with fly ash and ground granulated blast furnace slag mineral admixtures. J. Clean. Prod. 2015, 95, 66–74. [Google Scholar] [CrossRef]
  13. Yu, R.; Spiesz, P.; Brouwers, H.J.H. Development of an eco-friendly Ultra-High Performance Concrete (UHPC) with efficient cement and mineral admixtures uses. Cem. Concr. Compos. 2015, 55, 383–394. [Google Scholar] [CrossRef] [Green Version]
  14. Gholampour, A.; Ozbakkaloglu, T. Performance of sustainable concretes containing very high volume Class-F fly ash and ground granulated blast furnace slag. J. Clean. Prod. 2017, 162, 1407–1417. [Google Scholar] [CrossRef]
  15. Pal, S.C.; Mukherjee, A.; Pathak, S.R. Investigation of hydraulic activity of ground granulated blast furnace slag in concrete. Cem. Concr. Res. 2003, 33, 1481–1486. [Google Scholar] [CrossRef]
  16. Yeau, K.Y.; Kim, E.K. An experimental study on corrosion resistance of concrete with ground granulate blast-furnace slag. Cem. Concr. Res. 2005, 35, 1391–1399. [Google Scholar] [CrossRef]
  17. Teng, S.; Lim, T.Y.D.; Divsholi, B.S. Durability and mechanical properties of high strength concrete incorporating ultra fine Ground Granulated Blast-furnace Slag. Constr. Build. Mater. 2013, 40, 875–881. [Google Scholar] [CrossRef]
  18. Kim, H.; Koh, T.; Pyo, S. Enhancing flowability and sustainability of ultra high performance concrete incorporating high replacement levels of industrial slags. Constr. Build. Mater. 2016, 123, 153–160. [Google Scholar] [CrossRef]
  19. Golewski, G.; Sadowski, T. Fracture Toughness at Shear (Mode II) of Concretes Made of Natural and Broken Aggregates. In Brittle Matrix Composites 8; Brandt, A.M., Li, V.C., Marshall, I.H., Eds.; Woodhead Publishing: Cambridge, UK, 2006; pp. 537–546. [Google Scholar] [CrossRef]
  20. Sadowski, T.; Golewski, G. Effect of aggregate kind and graining on modelling of plain concrete under compression. Comput. Mater. Sci. 2008, 43, 119–126. [Google Scholar] [CrossRef]
  21. Chen, X.; Yan, J.J.; Yang, H.Q. Influence of Aggregates on Cracking Sensitivity of Concrete. Appl. Mech. Mater. 2012, 204–208, 3299–3302. [Google Scholar] [CrossRef]
  22. Meyer, C.; Peng, X. A comprehensive description for damage of concrete subjected to complex loading. Struct. Eng. Mech. 1997, 5, 679–689. [Google Scholar] [CrossRef]
  23. Wang, L.; Li, G.; Li, X.; Guo, F.; Tang, S.; Lu, X.; Hanif, A. Influence of reactivity and dosage of MgO expansive agent on shrinkage and crack resistance of face slab concrete. Cem. Concr. Compos. 2022, 126, 104333. [Google Scholar] [CrossRef]
  24. An, Q.; Chen, X.; Wang, H.; Yang, H.; Yang, Y.; Huang, W.; Wang, L. Segmentation of Concrete Cracks by Using Fractal Dimension and UHK-Net. Fractal Fract. 2022, 6, 95. [Google Scholar] [CrossRef]
  25. Santosh, M.; Ghosh, M.A. Multi-scale identification of concrete material parameters. Theor. Appl. Fract. Mech. 2014, 75, 8–15. [Google Scholar] [CrossRef]
  26. Di Prisco, M.; Ferrara, L.; Meftah, F.; Pamin, J.; De Borst, R.; Mazars, J.; Reynouard, J.M. Mixed mode fracture in plain and reinforced concrete: Some results on benchmark tests. Int. J. Fract. 2000, 103, 127–148. [Google Scholar] [CrossRef]
  27. Abid, S.R.; Murali, G.; Amran, M.; Vatin, N.; Fediuk, R.; Karelina, M. Evaluation of mode II fracture toughness of hybrid fibrous geopolymer composites. Materials 2021, 14, 349. [Google Scholar] [CrossRef]
  28. Aliha, M.R.M.; Ayatollahi, M.R. Brittle fracture evaluation of a fine grain cement mortar in combined tensile-shear deformation. Fatigue Fract. Eng. Mater. Struct. 2009, 32, 987–994. [Google Scholar] [CrossRef]
  29. Mirsayar, M.M.; Razmi, A.; Berto, F. Tangential strain-based criteria for mixed-mode I/II fracture toughness of cement concrete. Fatigue Fract. Eng. Mater. Struct. 2017, 41, 129–137. [Google Scholar] [CrossRef]
  30. Razmi, A.; Mirsayar, M.M. On the mixed mode I/II fracture properties of jute fiber-reinforced concrete. Constr. Build. Mater. 2017, 148, 512–520. [Google Scholar] [CrossRef]
  31. Lo, K.W.; Zhong, K.; Tamilselvan, T.; Ong, K.C.G.; Wee, T.H. Mixed mode I-III fracture testing of cement mortar. ACI Mater. J. 2002, 99, 435–440. [Google Scholar] [CrossRef]
  32. Golewski, G.L.; Sadowski, T. The fracture toughness the K IIIc of concretes with F fly ash (FA) additive. Constr. Build. Mater. 2017, 143, 444–454. [Google Scholar] [CrossRef]
  33. Song, L.; Huang, S.M.; Yang, S.C. Experimental investigation on criterion of three-dimensional mixed-mode fracture for concrete. Cem. Conc. Res. 2004, 34, 913–916. [Google Scholar] [CrossRef]
  34. Xu, S.; Guo, K.; Li, Q.; Yin, X.; Huang, B. Shear fracture performance of the interface between ultra-high toughness cementitious composites and reactive powder concrete. Compos. Struct. 2021, 275, 114403. [Google Scholar] [CrossRef]
  35. Aliha, M.R.M.; Bahmani, A.; Akhondi, S. Determination of mode III fracture toughness for different materials using a new designed test configuration. Mater. Des. 2015, 86, 863–871. [Google Scholar] [CrossRef]
  36. IS 12269; Ordinary Portland Cement, 53 Grade Specification. Bureau of Indian Standards: New Delhi, India, 2013.
  37. IS 383; Coarse and Fine Aggregate for Concrete—Specification. Bureau of Indian Standards: New Delhi, India, 2016.
  38. ASTM C1437-01; Standard Test Method for Flow of Hydraulic Cement Mortar. ASTM: Philadelphia, PA, USA, 2015.
  39. ASTM C230; Specification for Flow Table for Use in Tests of Hydraulic Cement. ASTM: Philadelphia, PA, USA, 2014.
  40. IS 516; Method of Tests for Strength of Concrete. Bureau of Indian Standards: New Delhi, India, 1959.
  41. ASTM C496; Standard Test Method for Splitting Tensile Strength of Cylindrical Concrete Specimens. ASTM: Philadelphia, PA, USA, 2001.
  42. Zappalorto, M.; Lazzarin, P. Three-dimensional elastic stress fields ahead of notches in thick plates under various loading conditions. Eng. Fract. Mech. 2013, 108, 75–88. [Google Scholar] [CrossRef]
  43. Kotousov, A.; Lazzarin, P.; Berto, F.; Pook, L.P. Three-dimensional stress states at crack tip induced by shear and anti-plane loading. Eng. Fract. Mech. 2013, 108, 65–74. [Google Scholar] [CrossRef]
  44. Lazzarin, P.; Zappalorto, M.; Berto, F. Three-dimensional stress fields due to notches in plates under linear elastic and elastic-plastic conditions. Fatigue Fract. Eng. Mater. Struct. 2014, 38, 140–153. [Google Scholar] [CrossRef]
  45. Pook, L.P.; Berto, F.; Campagnolo, A.; Lazzarin, P. Coupled fracture mode of a cracked disc under anti-plane loading. Eng. Fract. Mech. 2014, 128, 22–36. [Google Scholar] [CrossRef] [Green Version]
  46. Pook, L.P.; Campagnolo, A.; Berto, F.; Lazzarin, P. Coupled fracture mode of a cracked plate under anti-plane loading. Eng. Fract. Mech. 2015, 134, 391–403. [Google Scholar] [CrossRef]
  47. He, Z.; Kotousov, A.; Berto, F. Effect of vertex singularities on stress intensities near plate free surfaces. Fatigue Fract. Eng. Mater. Struct. 2015, 38, 860–869. [Google Scholar] [CrossRef]
  48. Lazzarin, P.; Zappalorto, M. A three-dimensional stress field solution for pointed and sharply radiused V-notches in plates of finite thickness. Fatigue Fract. Eng. Mater. Struct. 2012, 35, 1105–1119. [Google Scholar] [CrossRef]
  49. Mansourian, A.; Hashemi, S.; Aliha, M.R.M. Evaluation of pure and mixed modes (I/III) fracture toughness of Portland cement concrete mixtures containing reclaimed asphalt pavement. Constr. Build. Mater. 2018, 178, 10–18. [Google Scholar] [CrossRef]
  50. Özbay, E.; Erdemir, M.; Durmuş, H.I. Utilization and efficiency of ground granulated blast furnace slag on concrete properties—A review. Constr. Build. Mater. 2016, 105, 423–434. [Google Scholar] [CrossRef]
  51. Guerini, V.; Conforti, A.; Plizzari, G.; Kawashima, S. Influence of Steel and Macro-Synthetic Fibers on Concrete Properties. Fibers 2018, 6, 47. [Google Scholar] [CrossRef] [Green Version]
  52. Denneman, E.; Kearsley, E.P.; Visser, A.T. Splitting tensile test for fibre reinforced concrete. Mater. Struct. 2011, 44, 1441–1449. [Google Scholar] [CrossRef]
  53. Taerwe, L. Brittleness versus Ductility of High Strength Concrete. Struct. Eng. Int. 1991, 1, 40–45. [Google Scholar] [CrossRef]
  54. Honarvar Gheitanbaf, E. Fracture Toughness of Ultra High Performance Concrete. Master’s Thesis, University of New Mexico, Albuquerque, New Mexico, 2011. [Google Scholar]
  55. Aliha, M.R.M.; Razmi, A.; Mousavi, A. Fracture study of concrete composites with synthetic fibers additive under modes I and III using ENDB specimen. Constr. Build. Mater. 2018, 190, 612–622. [Google Scholar] [CrossRef]
  56. Yang, H.M.; Zhang, S.M.; Wang, L.; Chen, P.; Shao, D.K.; Tang, S.W.; Li, J.Z. High-ferrite Portland cement with slag: Hydration, microstructure, and resistance to sulfate attack at elevated temperature. Cem. Concr. Compos. 2022, 130, 104560. [Google Scholar] [CrossRef]
Figure 1. Material properties: (a) particle size distribution of constituent powders; (b) profile of crimped steel fibres; (c) SEM micrograph of GGBS at 3000× magnification; (d) SEM micrograph of GGBS at 5000× magnification.
Buildings 12 00599 g001
Figure 2. Scheme of the mixing program.
Buildings 12 00599 g002
Figure 3. Scheme of experimental setup: (a) geometry of ENDB specimens; (b) arrangement of supports and load spreader; (c) scheme of loading ENDB specimens for pure mode I; (d) scheme of loading ENDB specimens for pure mode III and mixed modes I/III.
Buildings 12 00599 g003
Figure 4. Experimental setup: (a) pure mode I (β = 0) specimen; (b) mixed mode I/III (β = 20°) specimen; (c) mixed mode I/III (β = 50°) specimen; (d) pure mode III (β = 63°) specimen; (e) experimental setup for testing ENDB specimens.
Buildings 12 00599 g004aBuildings 12 00599 g004b
Figure 5. Flow test results of RPC mixes: (a) non-fibrous mixes; (b) fibrous mixes.
Buildings 12 00599 g005
Figure 6. Compression test results of RPC mixes: (a) non-fibrous mixes; (b) fibrous mixes.
Buildings 12 00599 g006
Figure 7. Splitting tension test results of RPC mixes: (a) non-fibrous mixes; (b) fibrous mixes.
Buildings 12 00599 g007
Figure 8. Effect of GGBS addition on mode I fracture toughness of RPC mixes: (a) non-fibrous mixes; (b) fibrous mixes.
Buildings 12 00599 g008
Figure 9. Effect of GGBS addition on mode III fracture toughness of RPC mixes: (a) non-fibrous mixes; (b) fibrous mixes.
Buildings 12 00599 g009
Figure 10. Effect of GGBS addition on mixed mode fracture toughness of RPC mixes: (a) non-fibrous mixes at β = 20°; (b) fibrous mixes at β = 20°; (c) non-fibrous mixes at β = 50°; (d) fibrous mixes at β = 50°.
Buildings 12 00599 g010
Figure 11. Effect of addition of fibres on fracture toughness of RPC mixes: (a) mixes with 0% GGBS; (b) mixes with 10% GGBS; (c) mixes with 20% GGBS; (d) mixes with 30% GGBS; (e) mixes with 40% GGBS.
Buildings 12 00599 g011
Figure 12. Effect of loading mode on fracture toughness of RPC mixes: (a) mixity ratio vs. effective fracture toughness for non-fibrous mixes; (b) mixity ratio vs. effective fracture toughness for fibrous mixes.
Buildings 12 00599 g012
Figure 13. Typical failure patterns of tested specimens: (a) non-fibrous specimens at β = 0°; (b) non-fibrous specimens at β = 20°; (c) non-fibrous specimens at β = 50°; (d) non-fibrous specimens at β = 63°; (e) fibrous specimens at β = 0°; (f) fibrous specimen at mixed modes and pure mode III.
Buildings 12 00599 g013
Figure 14. SEM micrographs: (a) mix F0; (b) mix F30.
Buildings 12 00599 g014
Table 1. Chemical composition of constituent powders.
OxideOPC (%)GGBS (%)SF (%)QP (%)
Calcium oxide (CaO)63.2343.100.290.01
Silicon dioxide (SiO2)24.6332.4098.7099.50
Aluminium oxide (Al2O3)6.7615.700.290.08
Magnesium oxide (MgO)2.196.620.110.01
Sulfur trioxide (SO3)1.541.610.03-
Iron oxide (Fe2O3)0.530.480.030.04
Sodium oxide (Na2O)0.440.23--
Potassium oxide (K2O)0.680.5488 PPM 1-
1 PPM stands for parts per million.
Table 2. Mix proportions.
Mix IDOPC (kg/m3)SF (kg/m3)GGBS (kg/m3)RS (kg/m3)QP
(kg/m3)
Water
(L/m3)
SP
(L/m3)
Fibres (vol. %)
NF0 1960144-101711516334-
NF1086414496101711516334-
NF20768144192101711516334-
NF30672144288101711516334-
NF40576144384101711516334-
F0960144-1017115163342
F10864144961017115163342
F207681441921017115163342
F306721442881017115163342
F405761443841017115163342
1 In the mix ID NF represents non-fibrous mixes and 0 represents the percentage of GGBS in the mix.
Table 3. Geometry factors for different loading modes.
ModeII/IIII/IIIIII
β20°50°63°
YI0.3230.2690.10
YIII00.0560.0830.073
Publisher’s Note: MDPI stays neutral with regard to jurisdictional claims in published maps and institutional affiliations.

