Experimental Study on the Natural Dynamic Characteristics of Steel-Framed Modular Structures


 ,
, 
Abstract
:1. Introduction
2. Modal Test Methods
2.1. Peak-Picking (PP) Method
2.2. Enhanced Frequency-Domain Decomposition (EFDD)
2.3. Stochastic Subspace Identification (SSI)
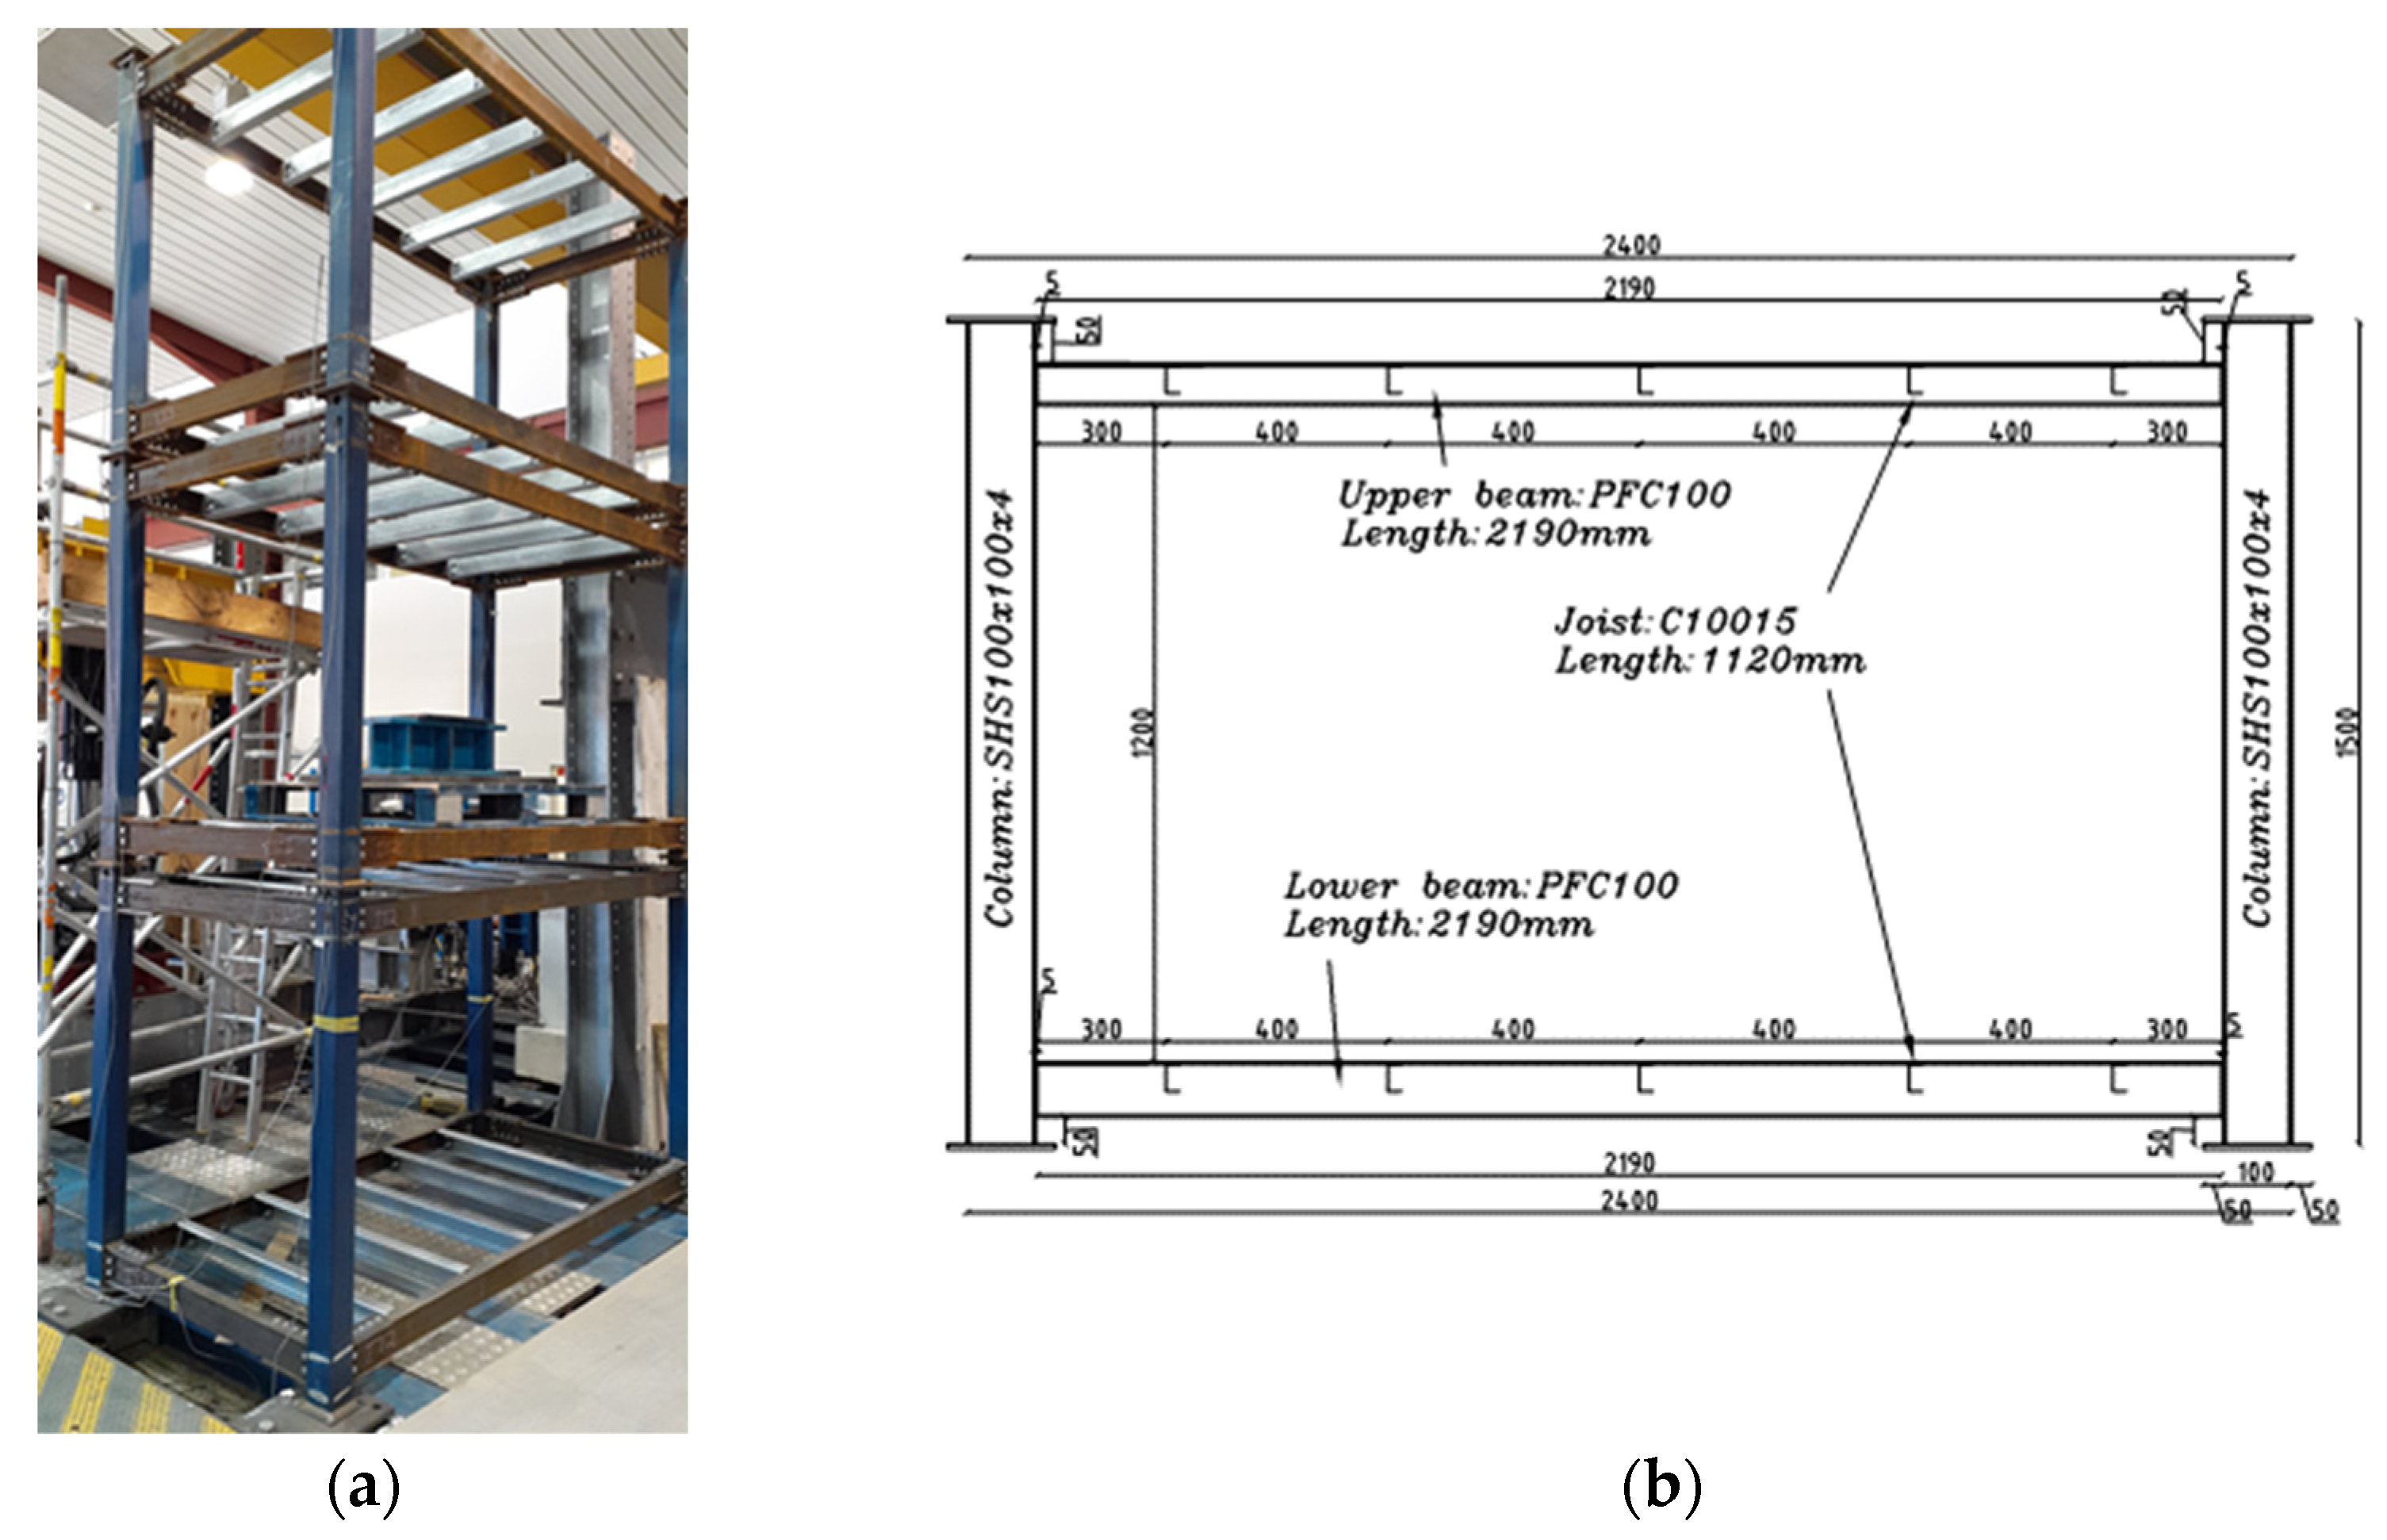
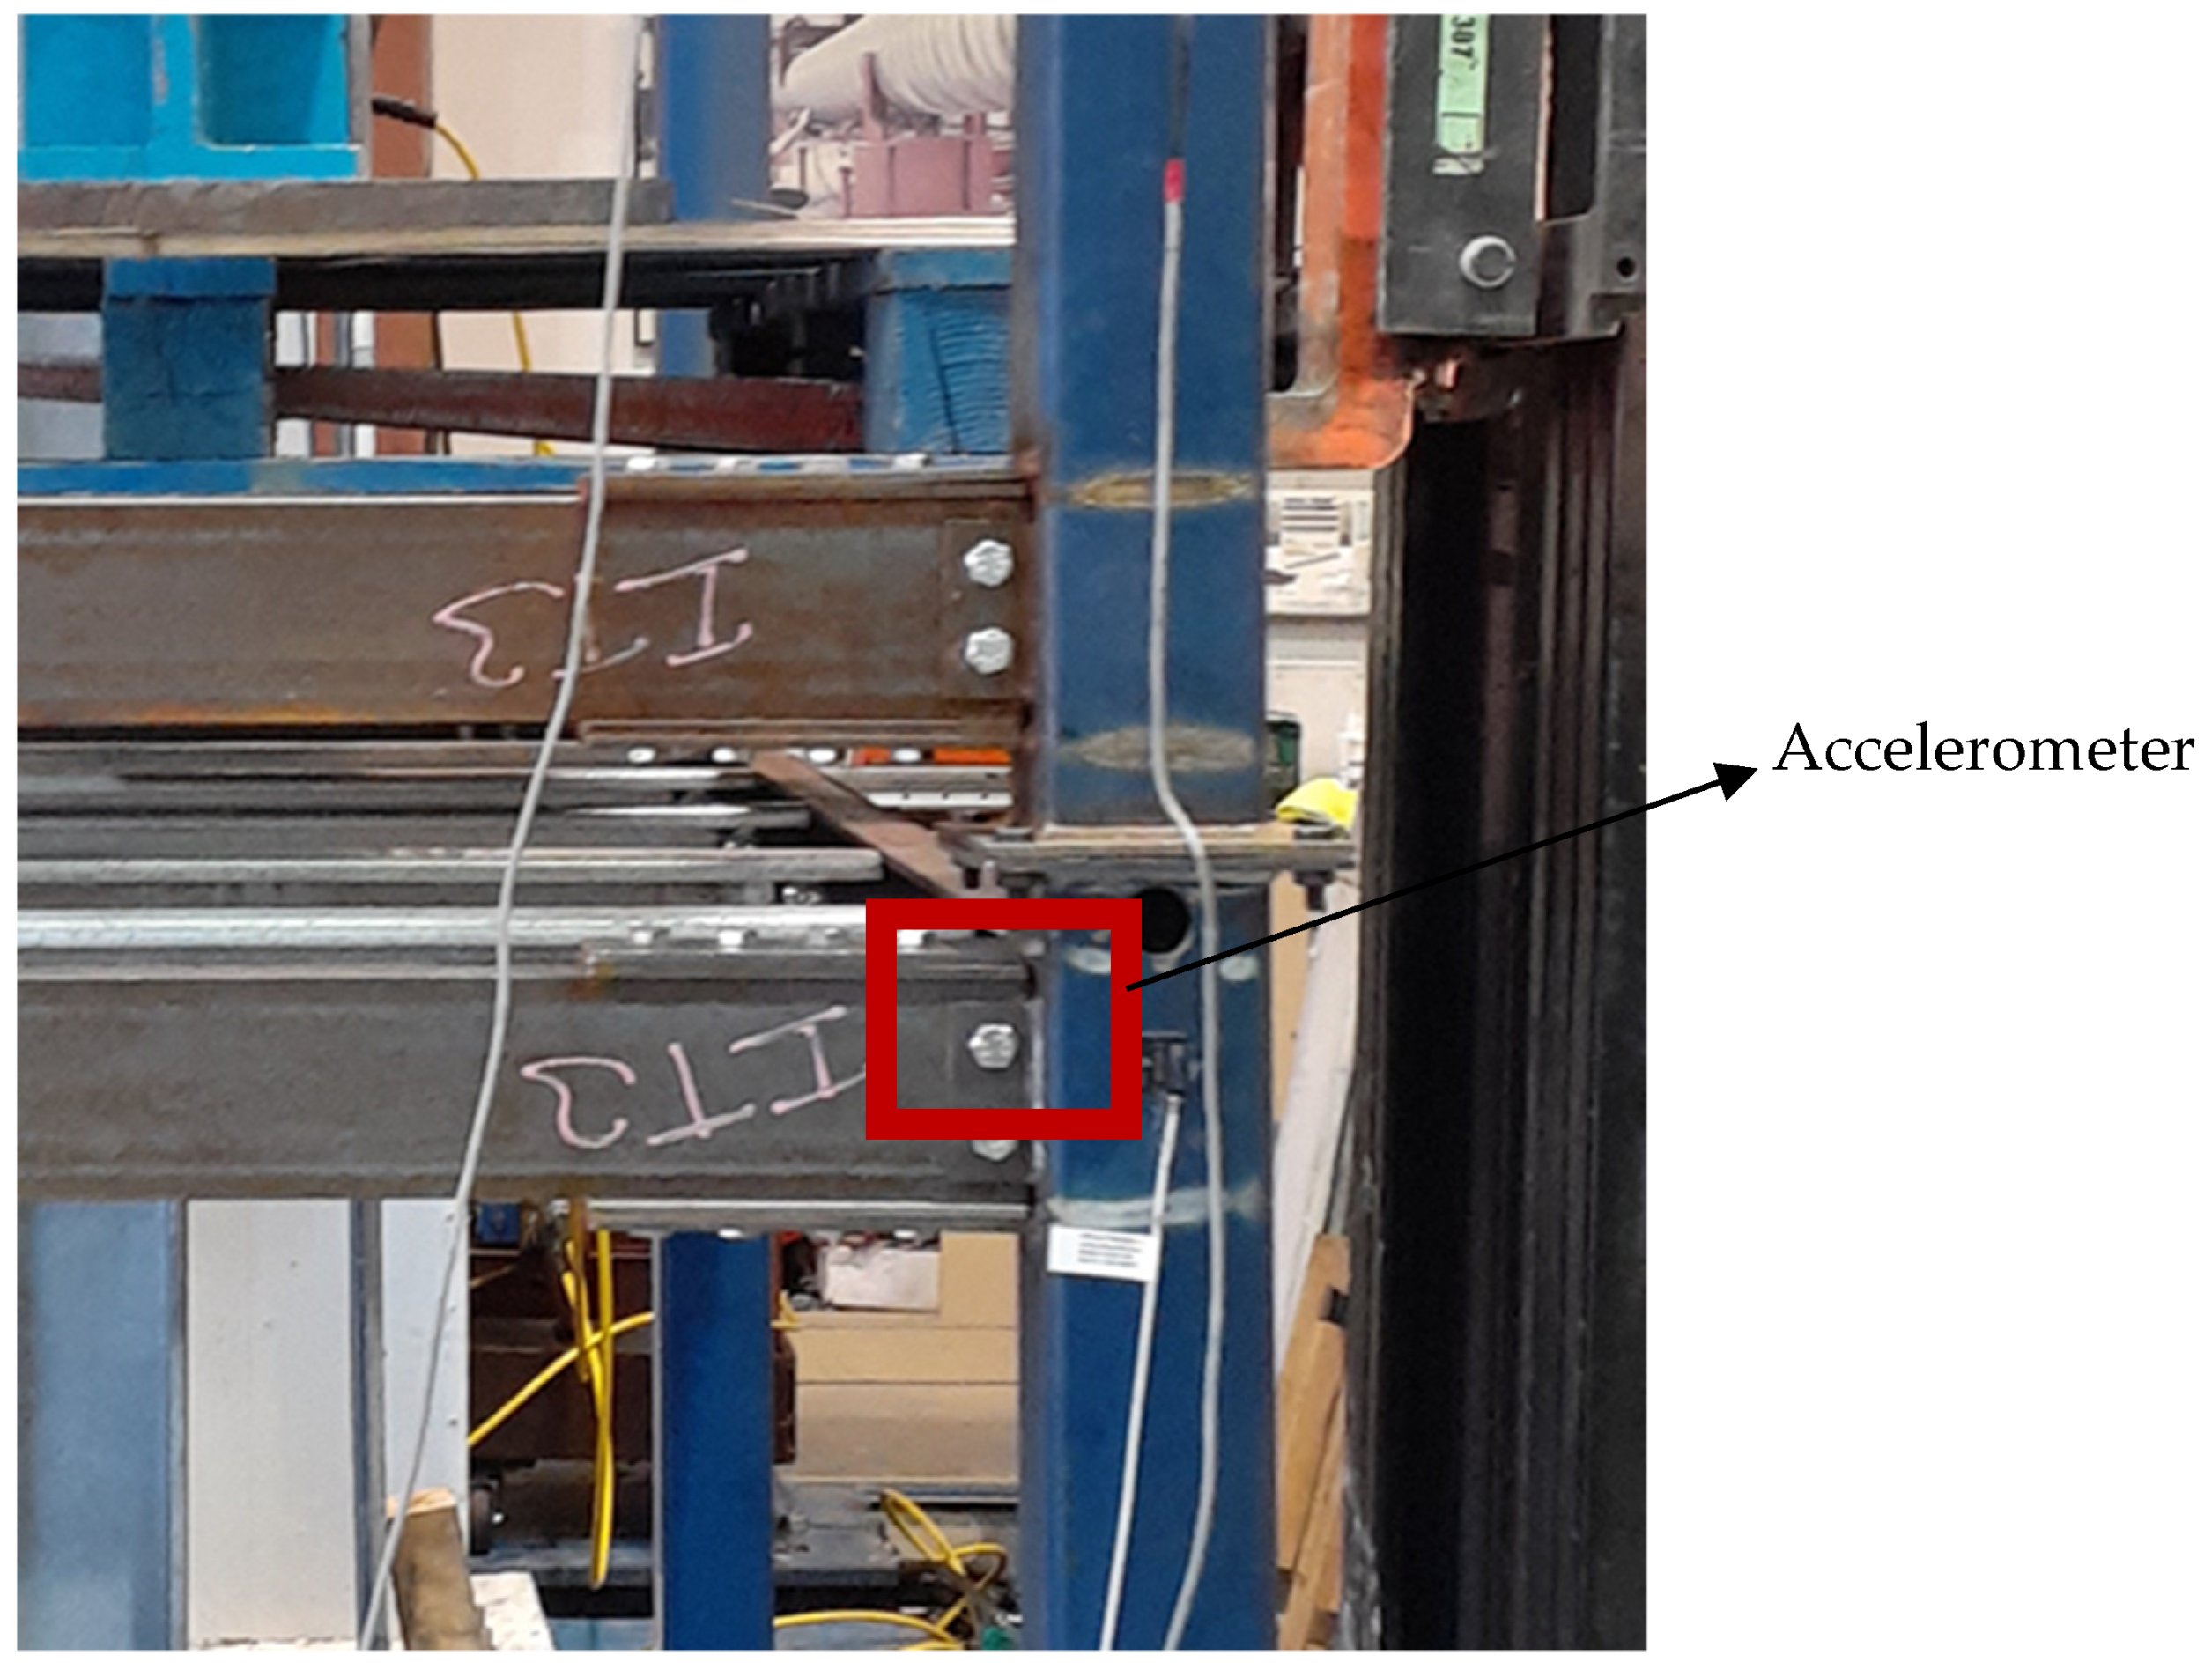
3. Description of Testing and Instrumentation
4. Results and Discussion
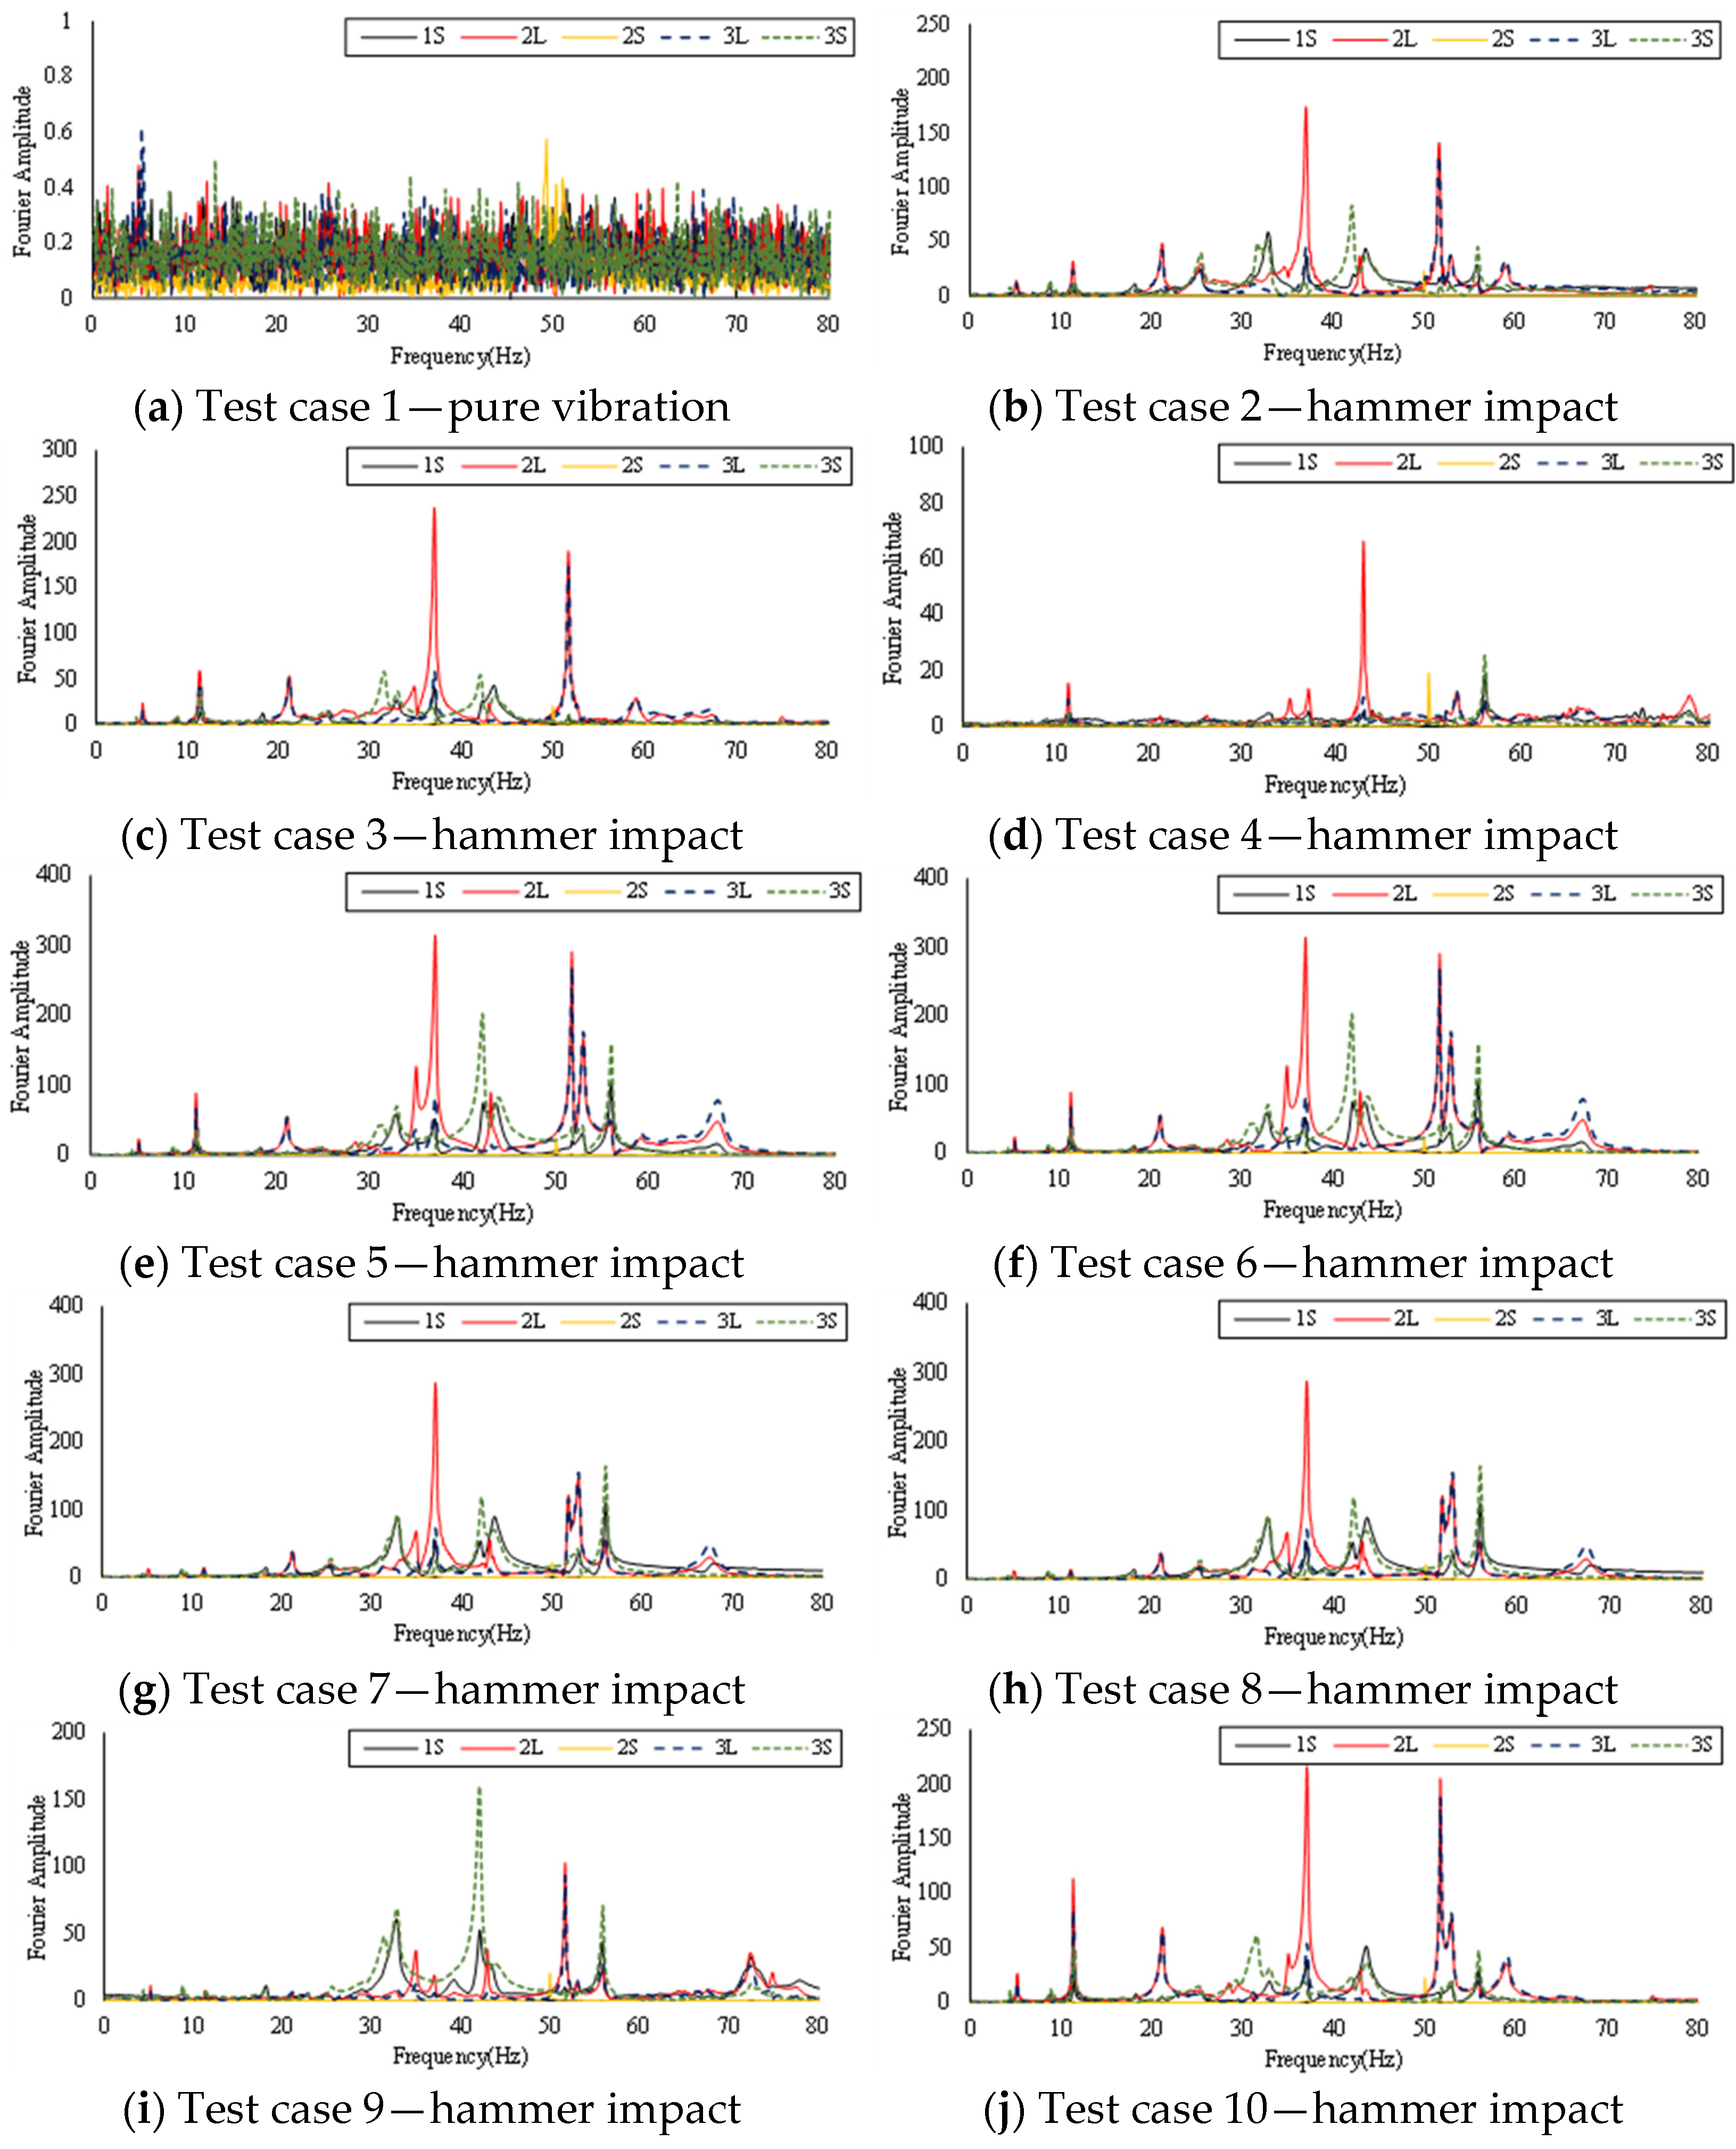
4.1. Peak-Picking Method
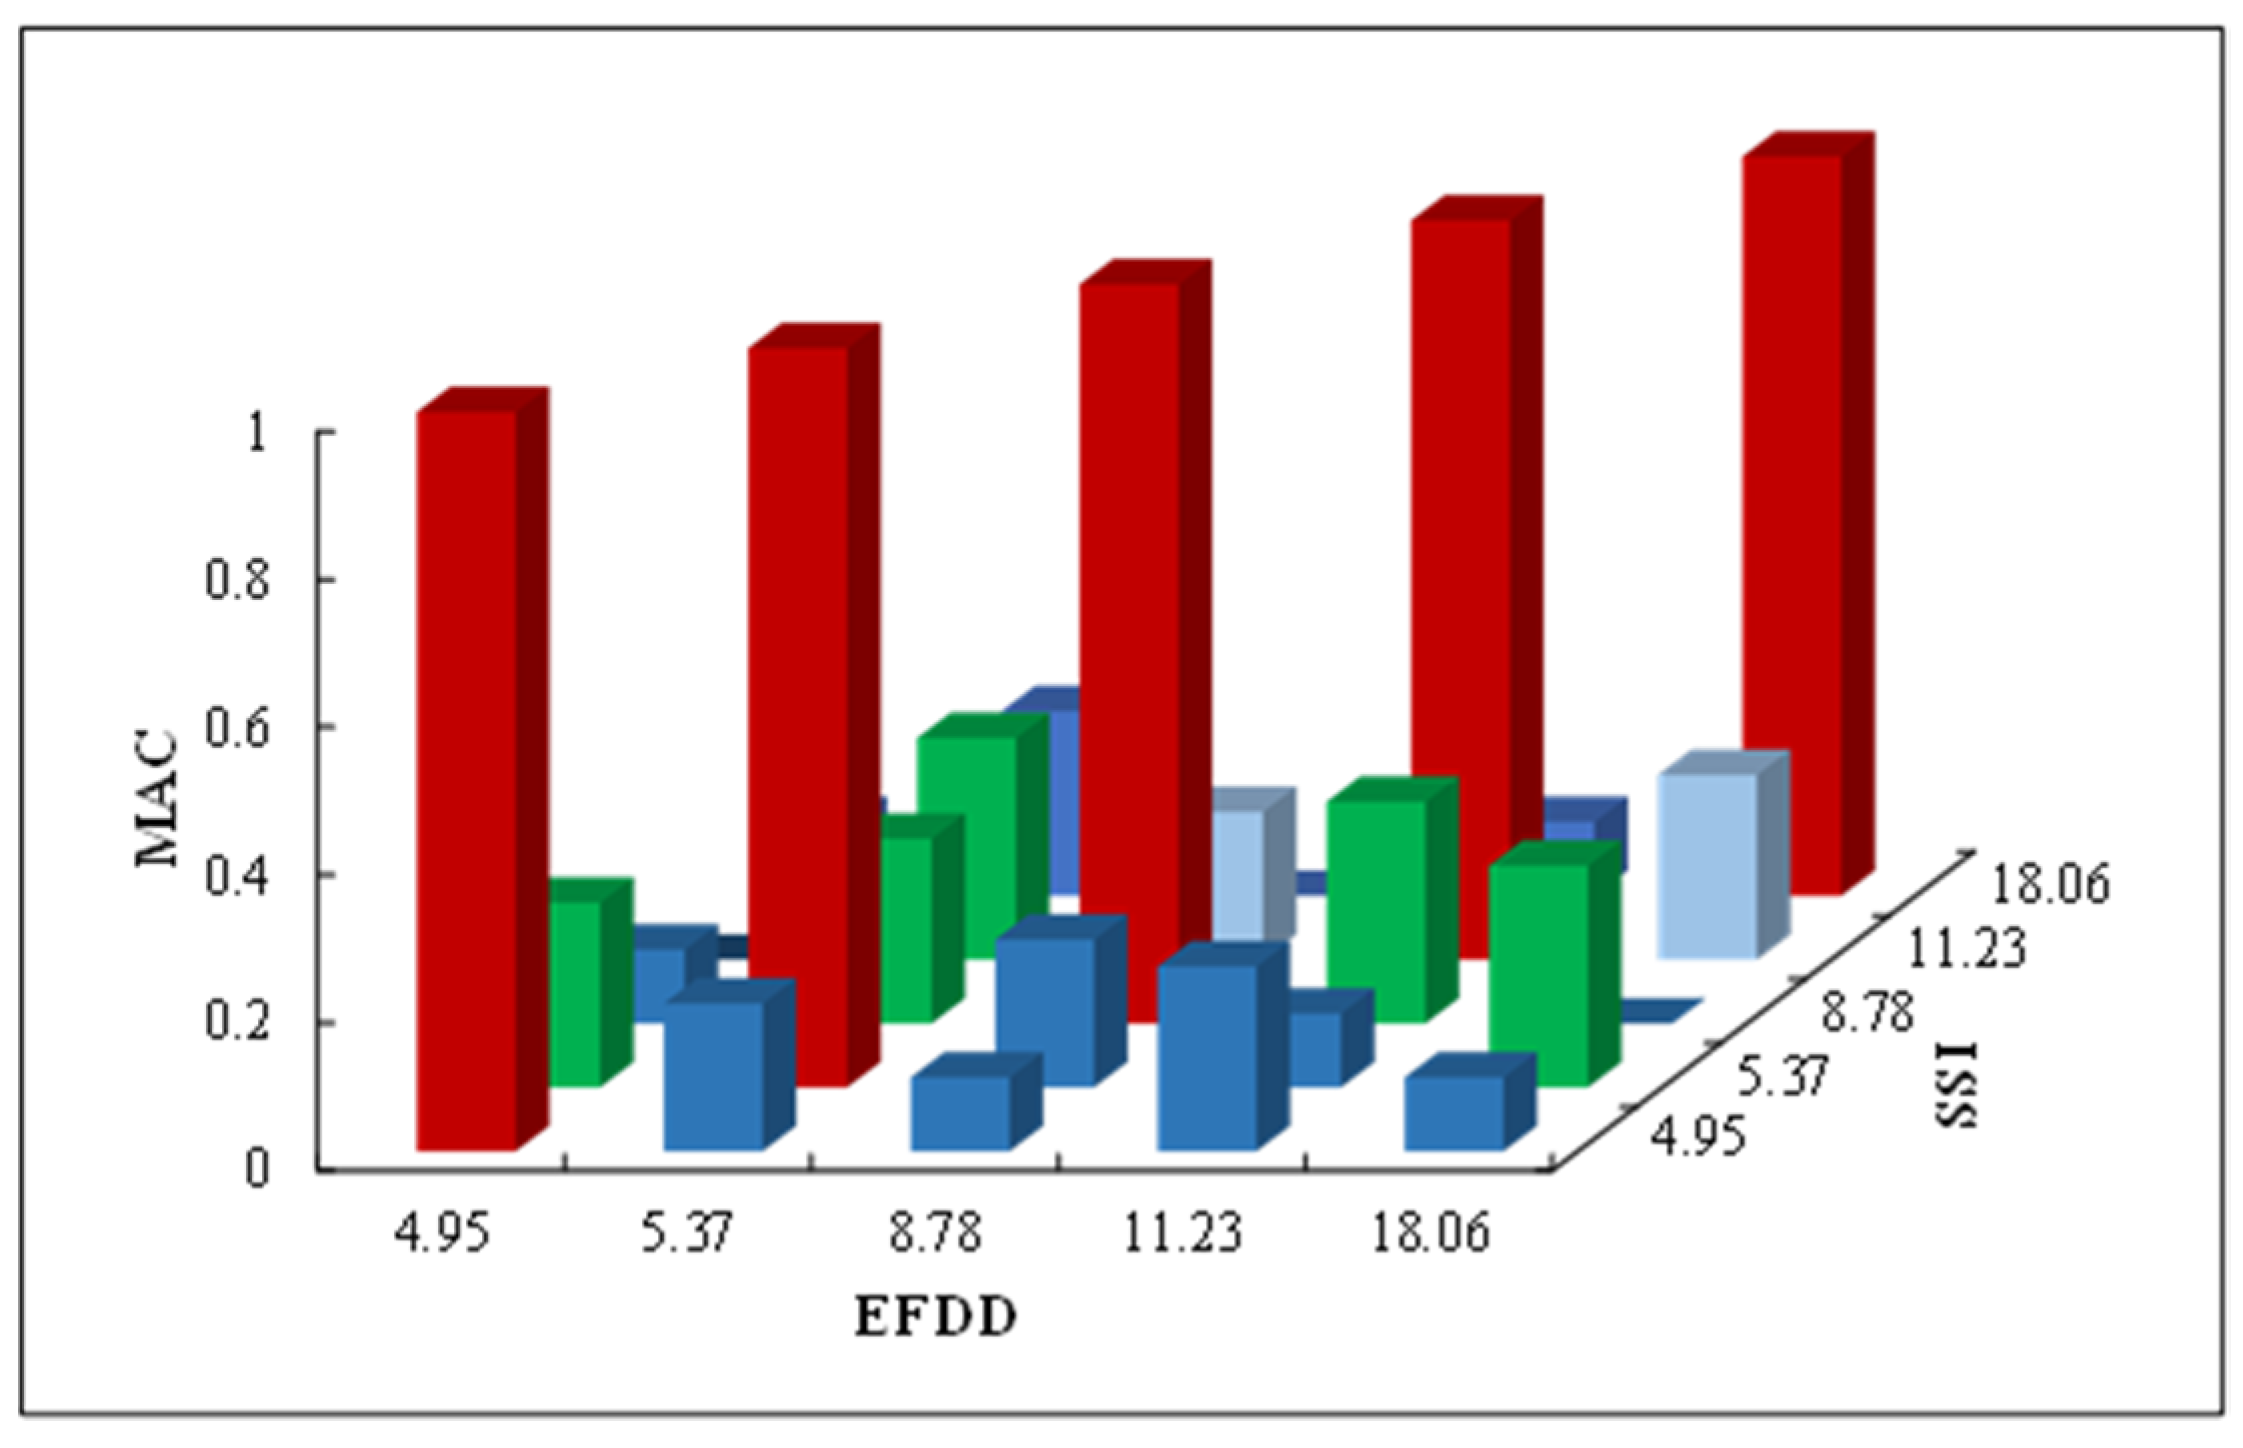
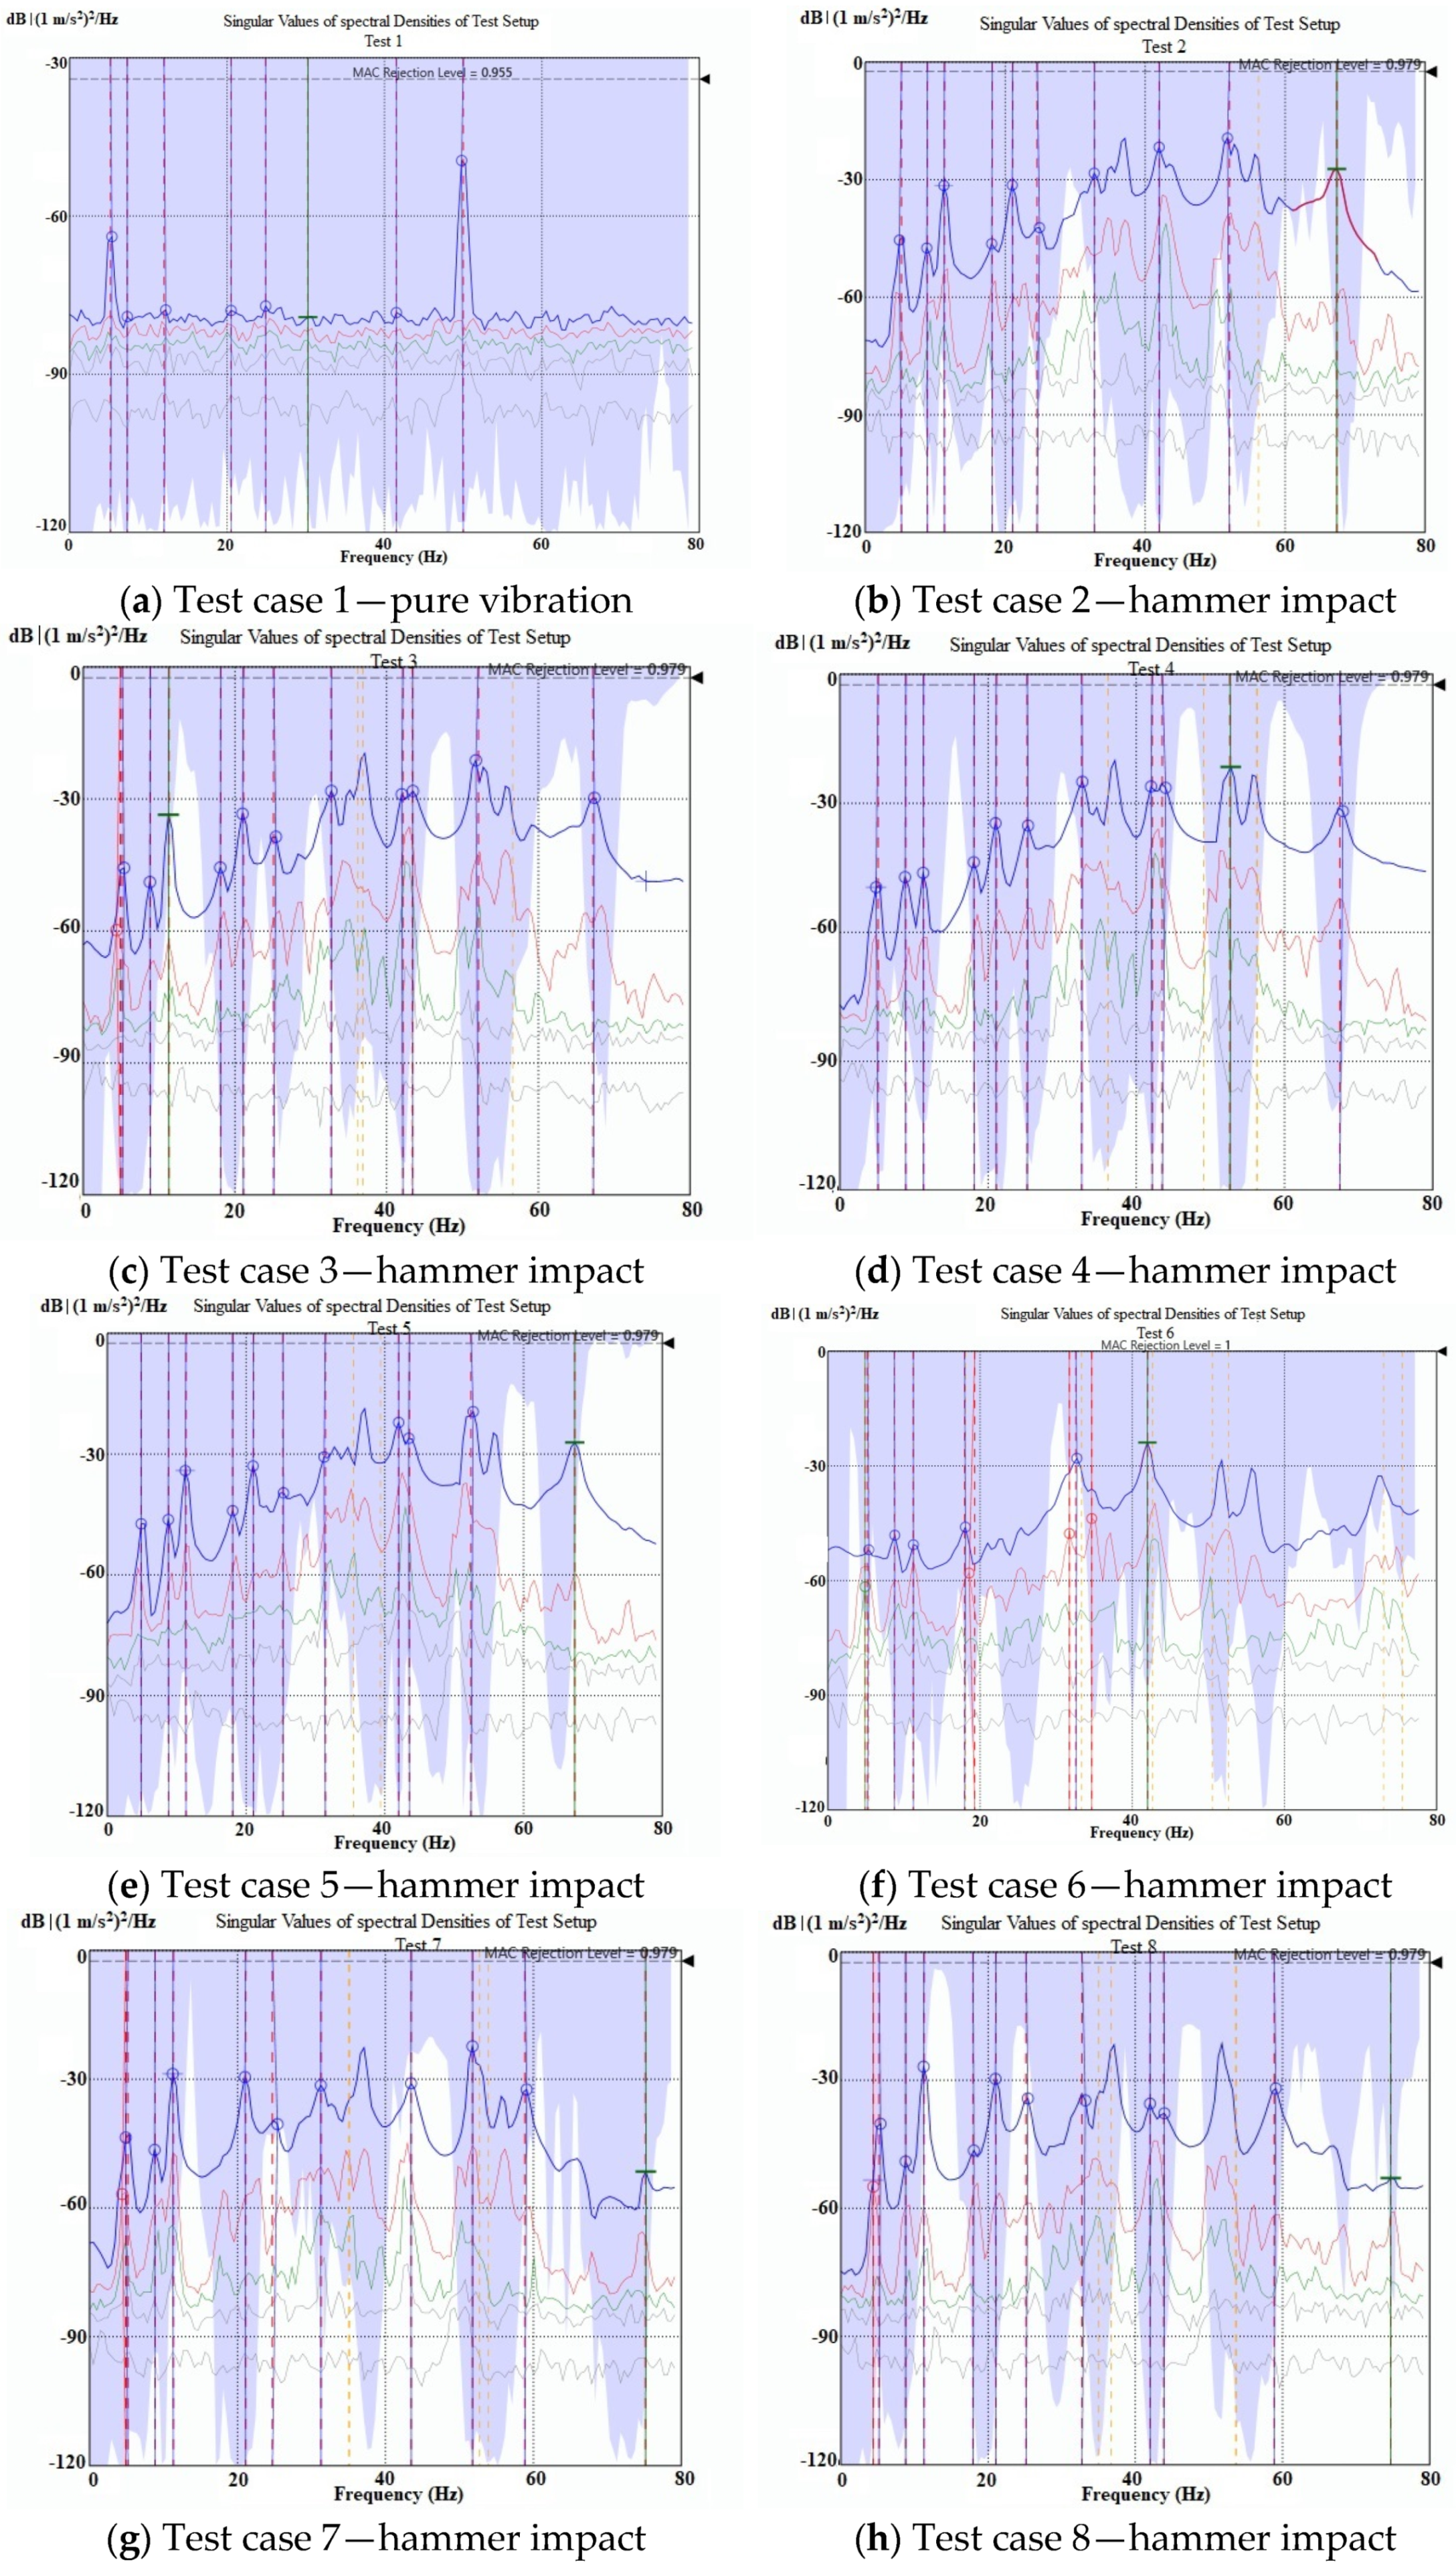
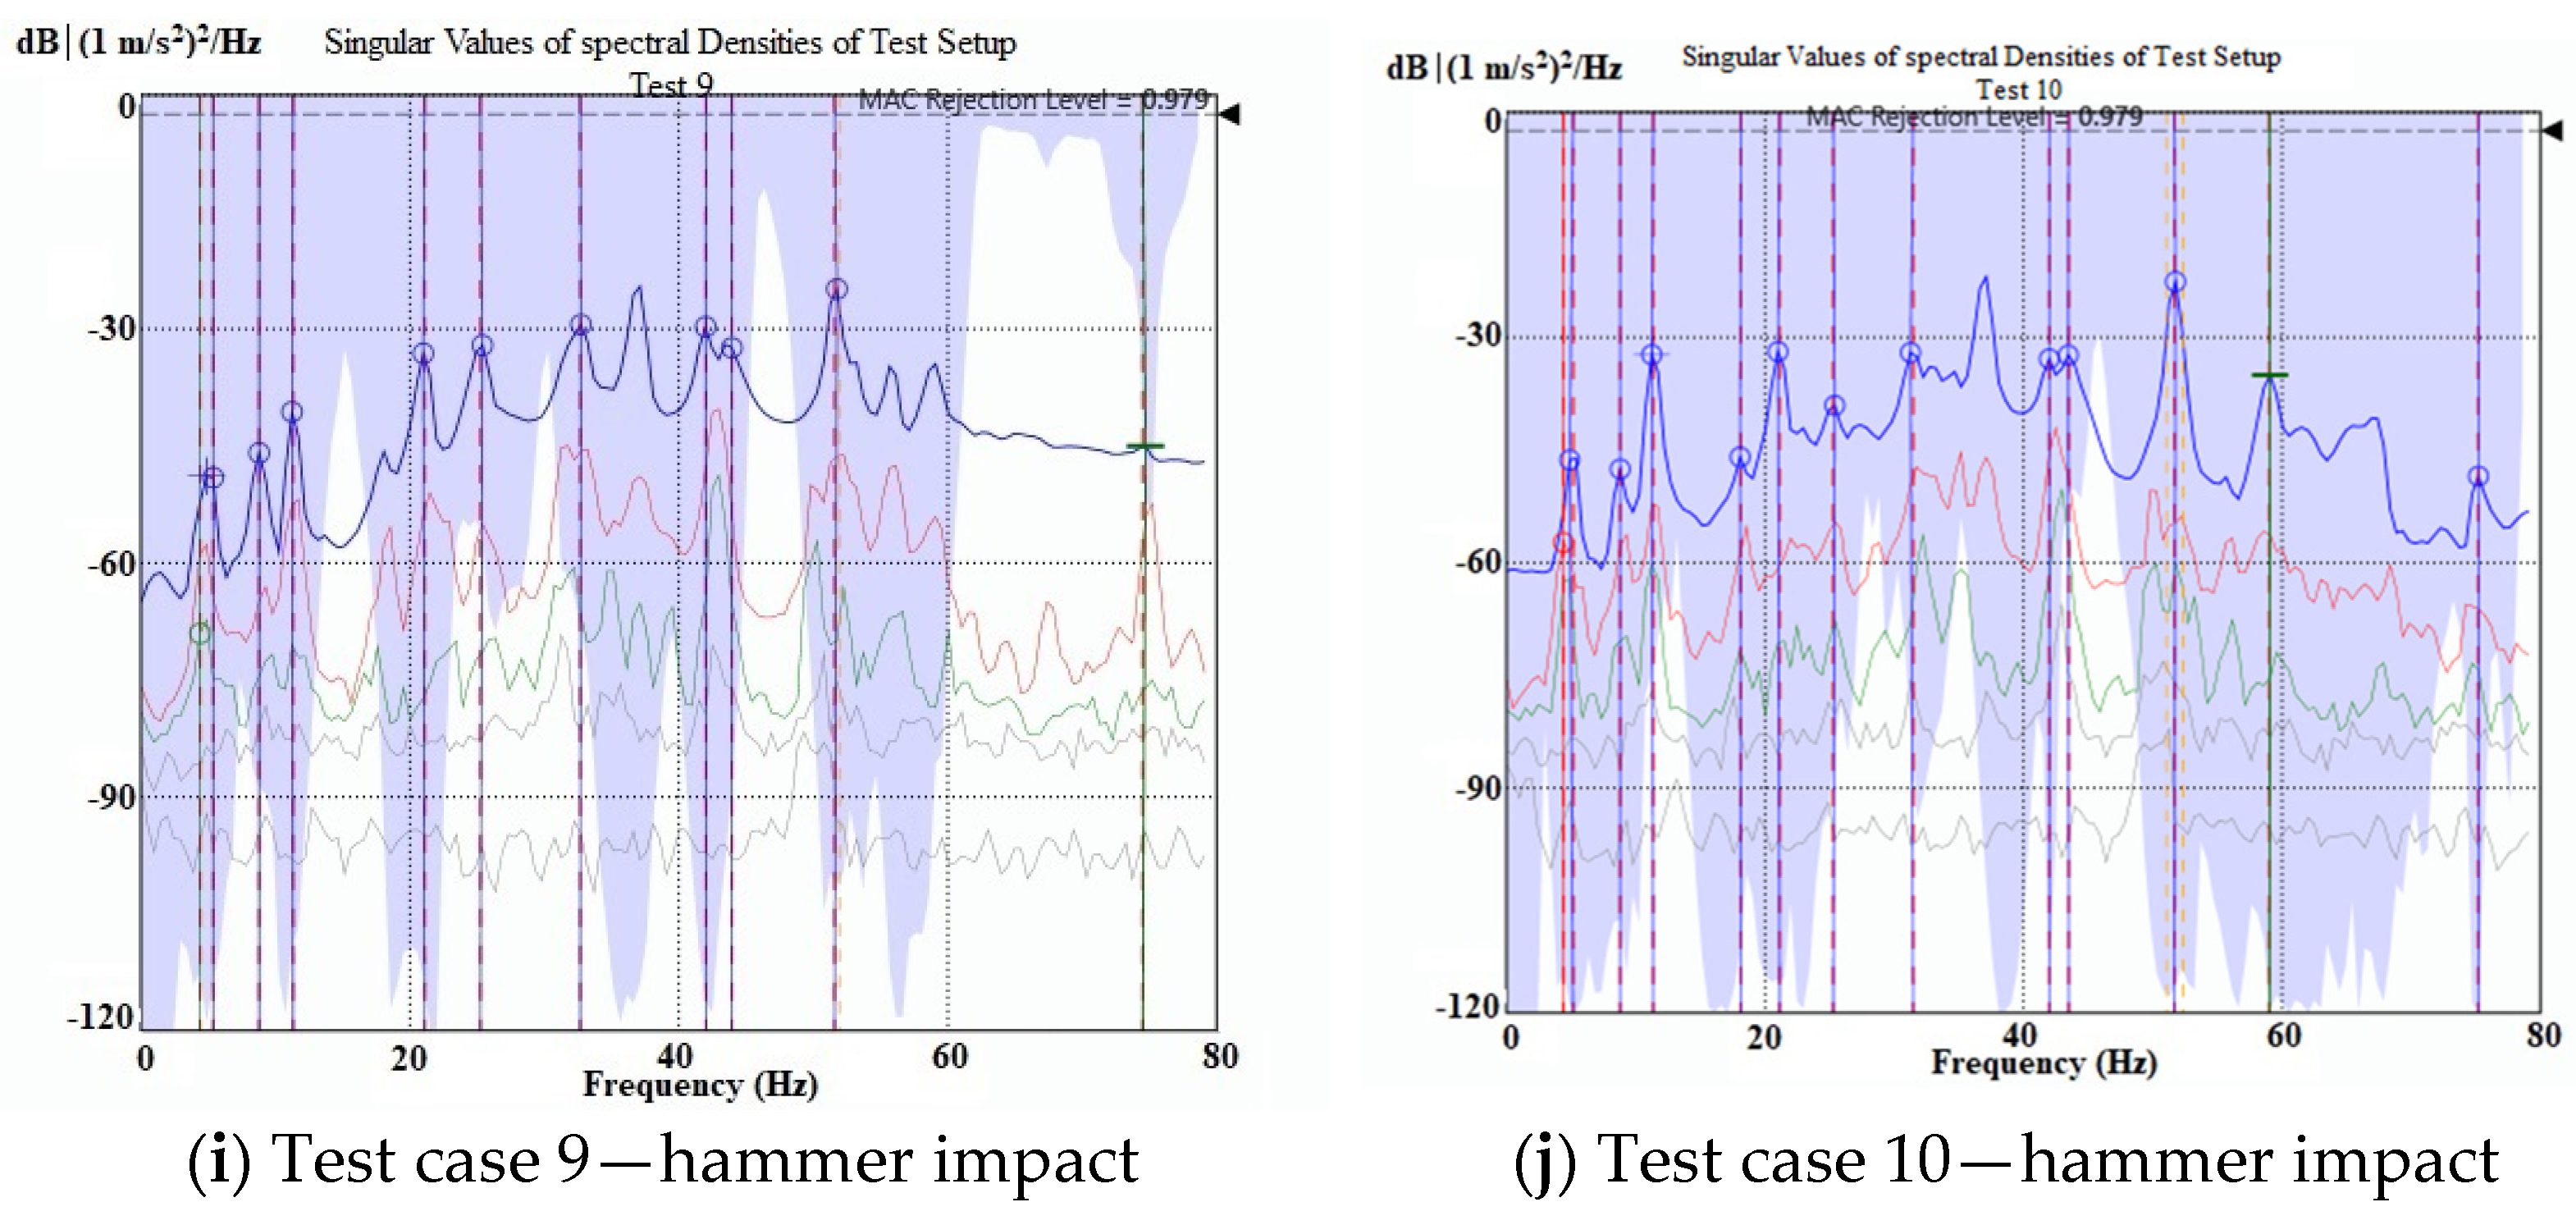
4.2. EFDD Method
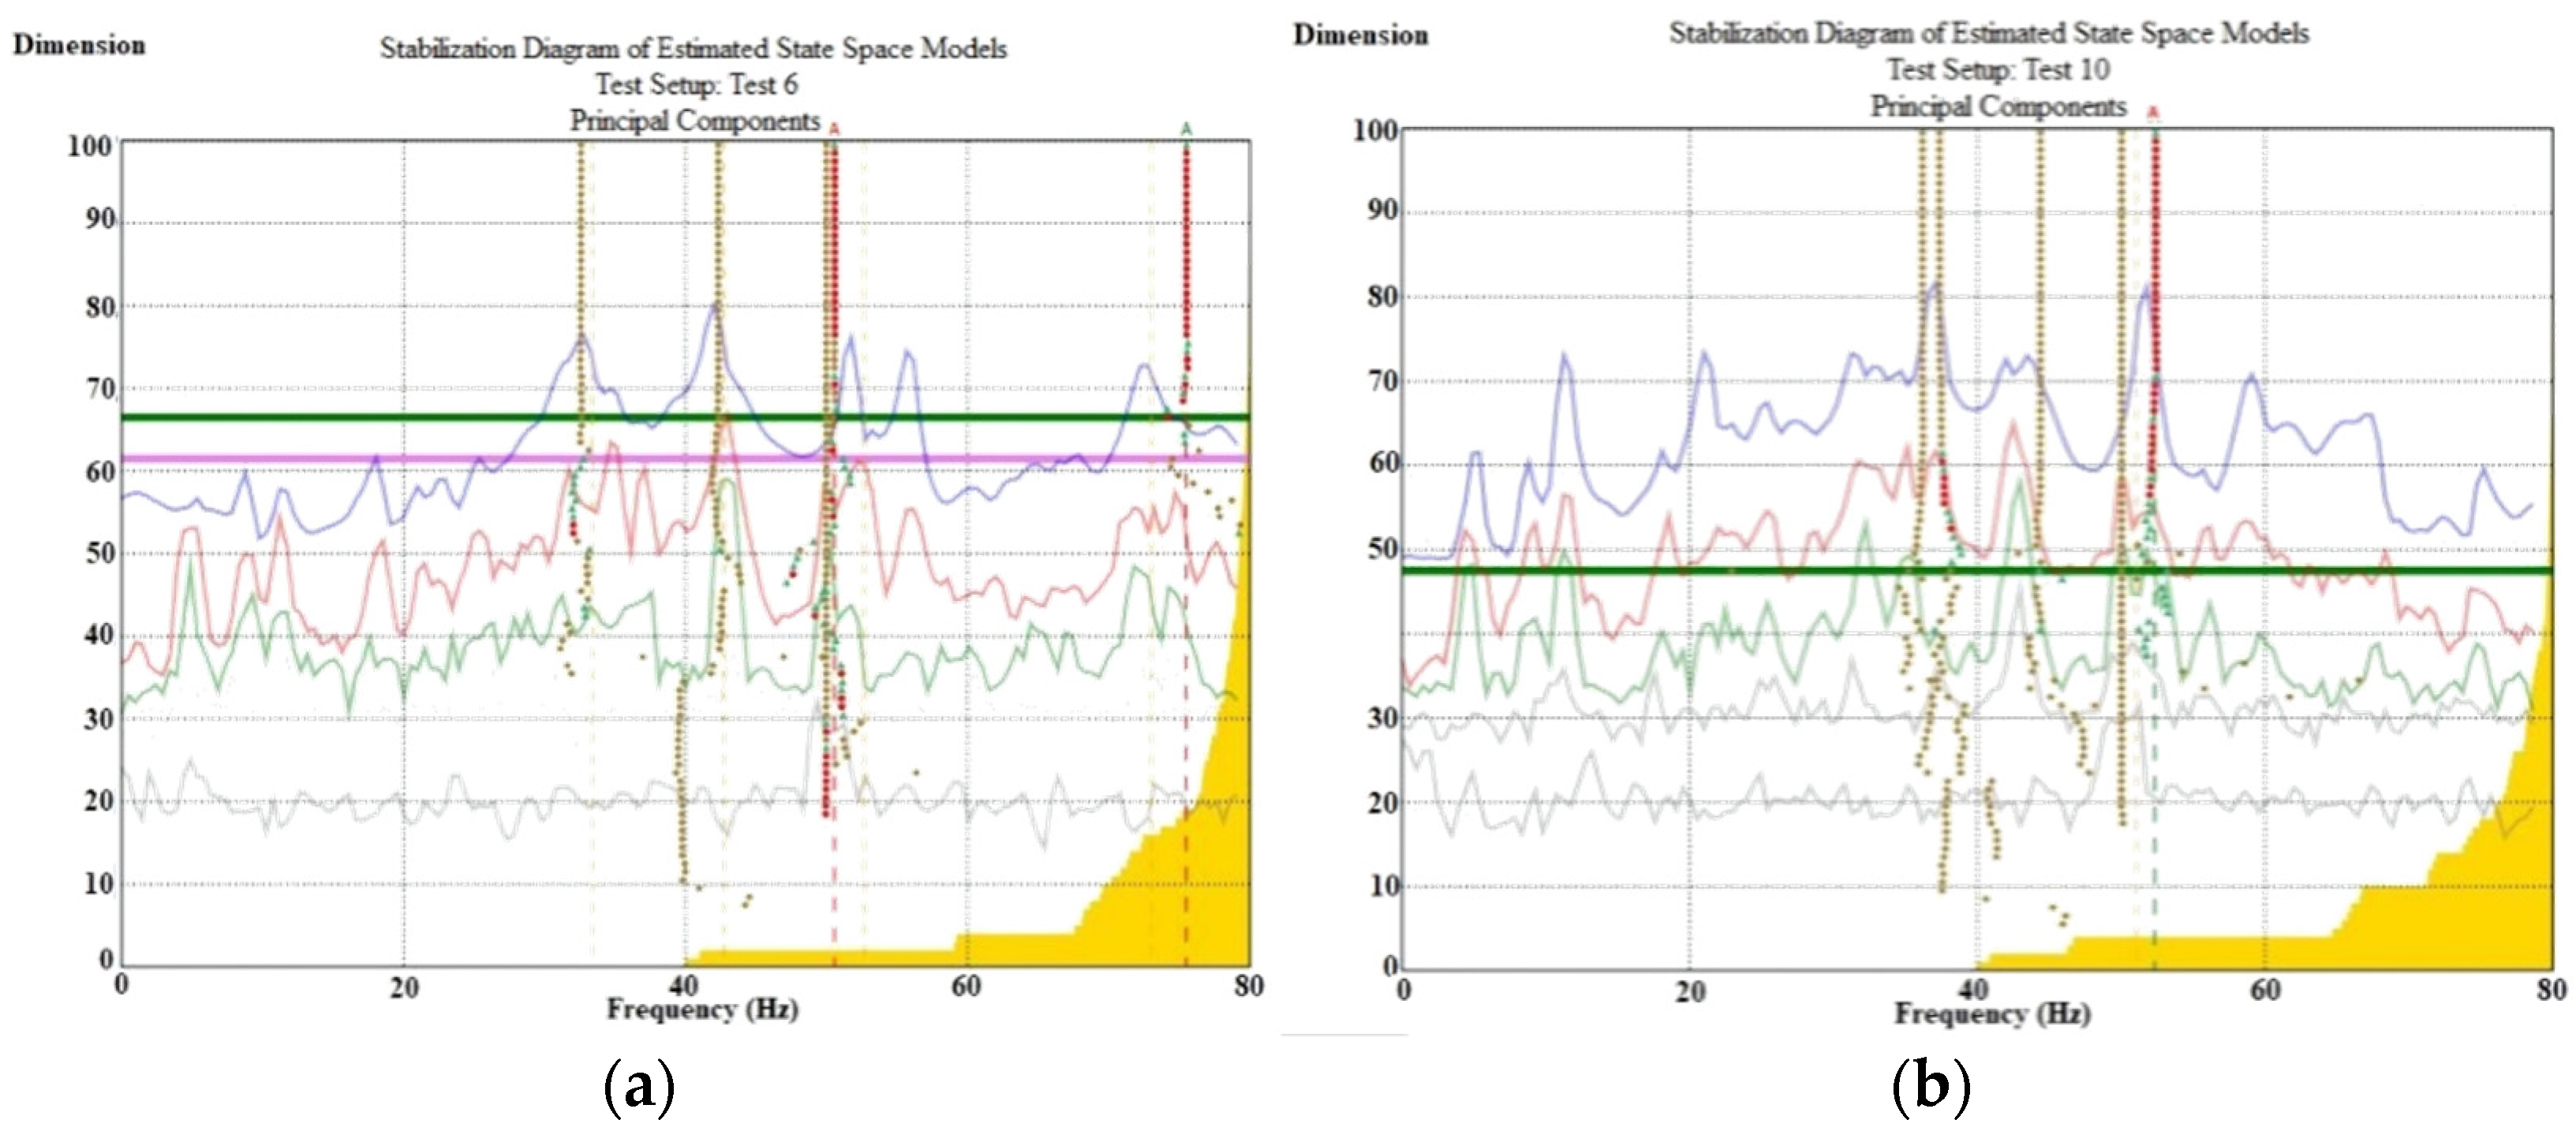
4.3. SSI Method
5. Conclusions
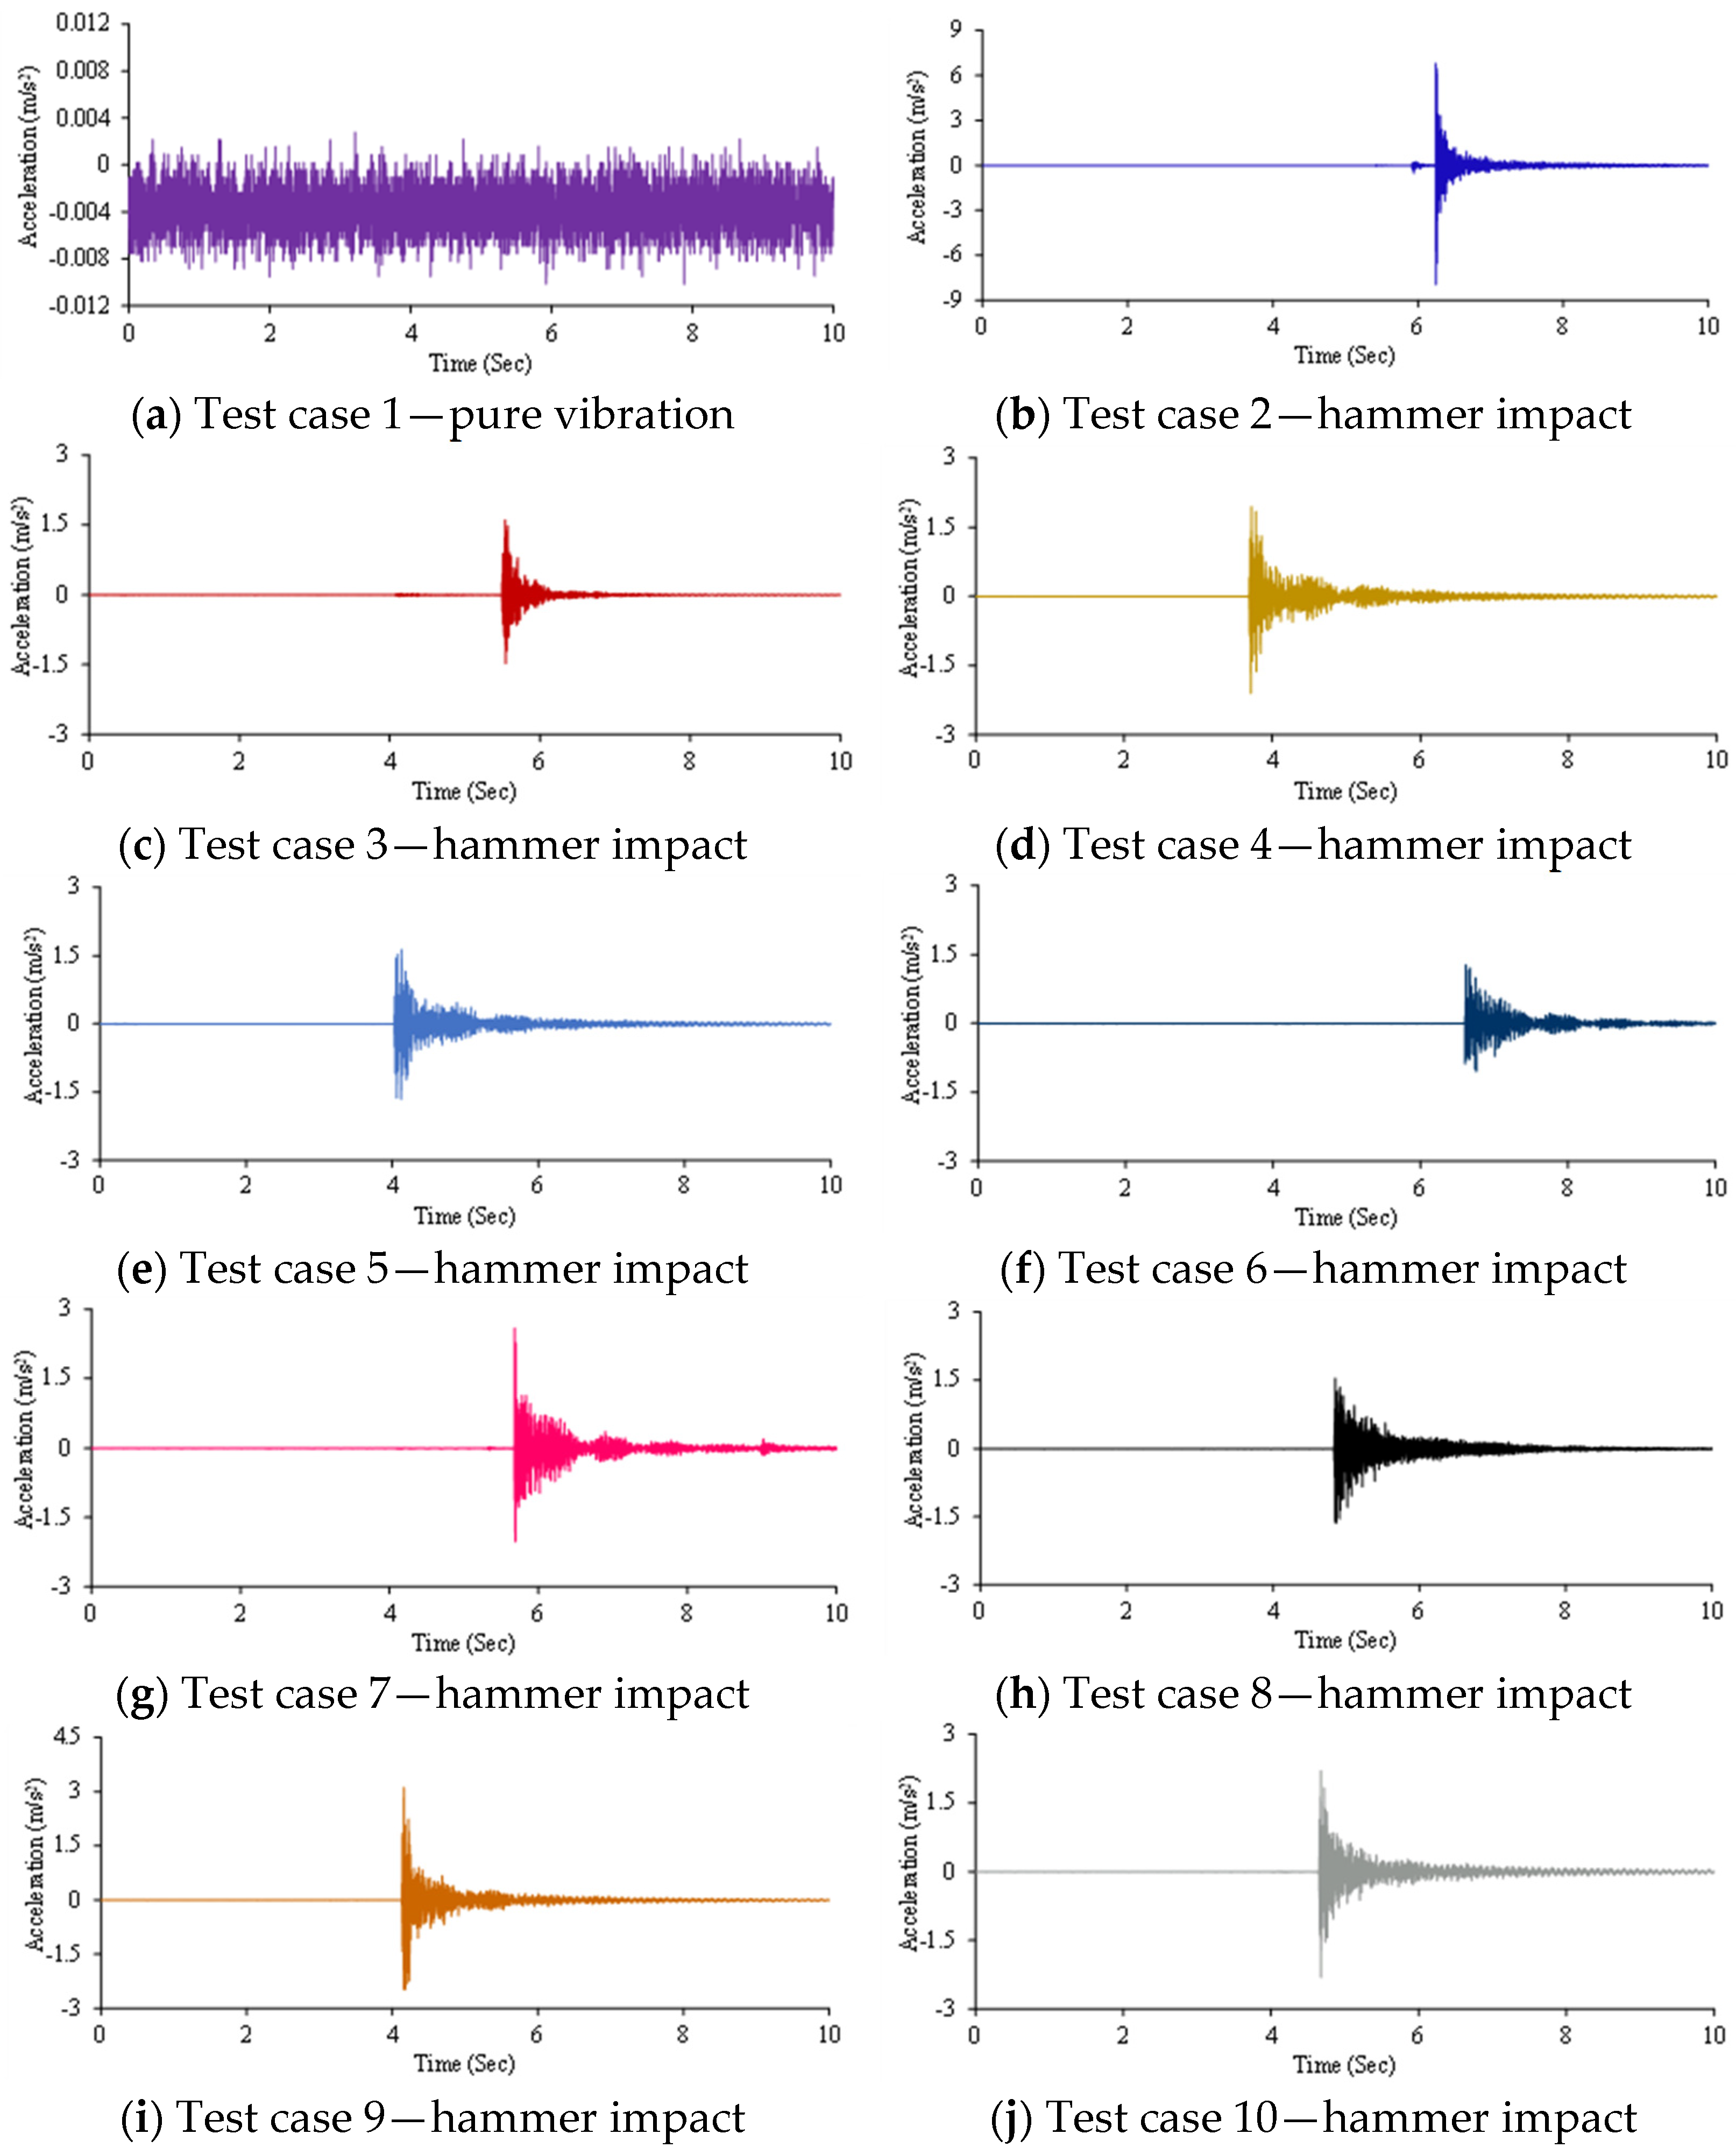
- Compared to pure vibration, the signal-to-noise ratio increased when inducing external excitation due to hammer impacts; therefore, the natural dynamic characteristics cannot be extracted from pure vibration.
- The direction, amplitude, and placement of the hammer impact significantly influenced the excited modes. Therefore, various tests should be conducted to completely identify the frequencies of the structure.
- Good agreement was observed between the results of the PP and EFDD methods.
- The SSI method, which is based on the time domain, could not identify all modes in different test cases. Hence, this method can be employed to control the frequencies obtained by the EFDD method.
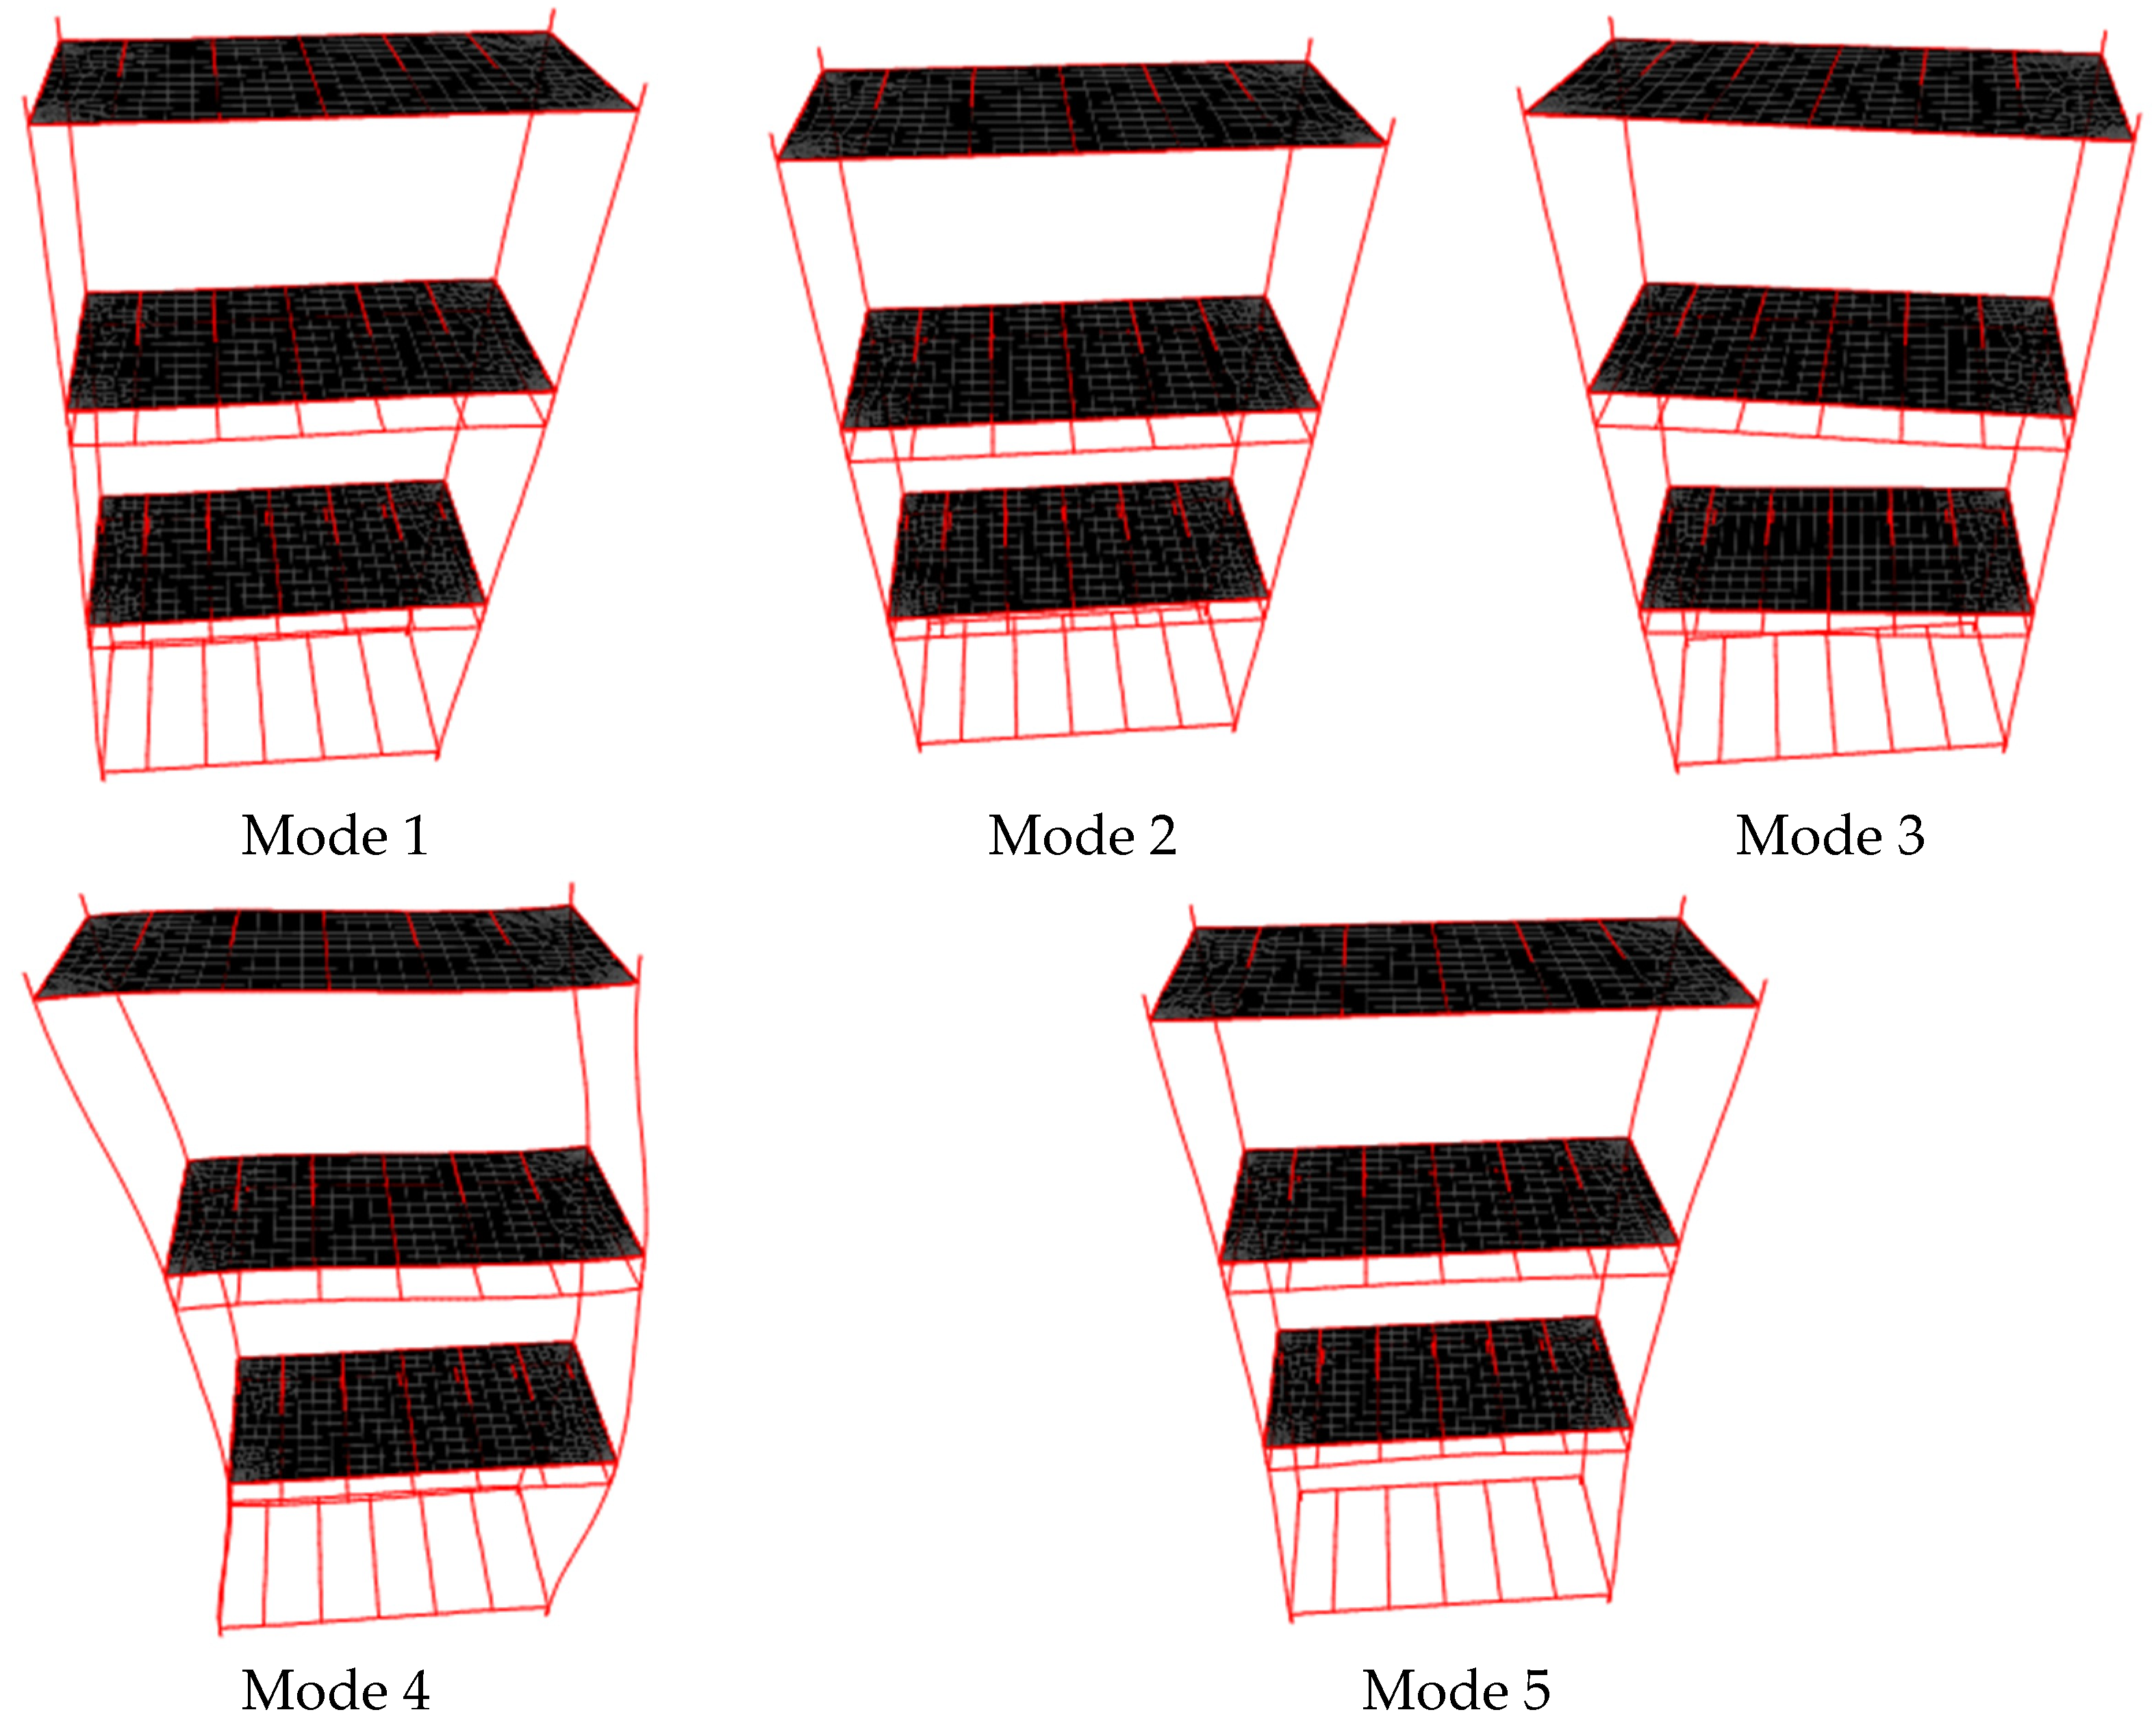
- A damping ratio of 5.4% corresponding to the first mode of the structure was determined through the use of the EFDD method.
- When moving to higher modes, the damping ratio of the structure decreased.
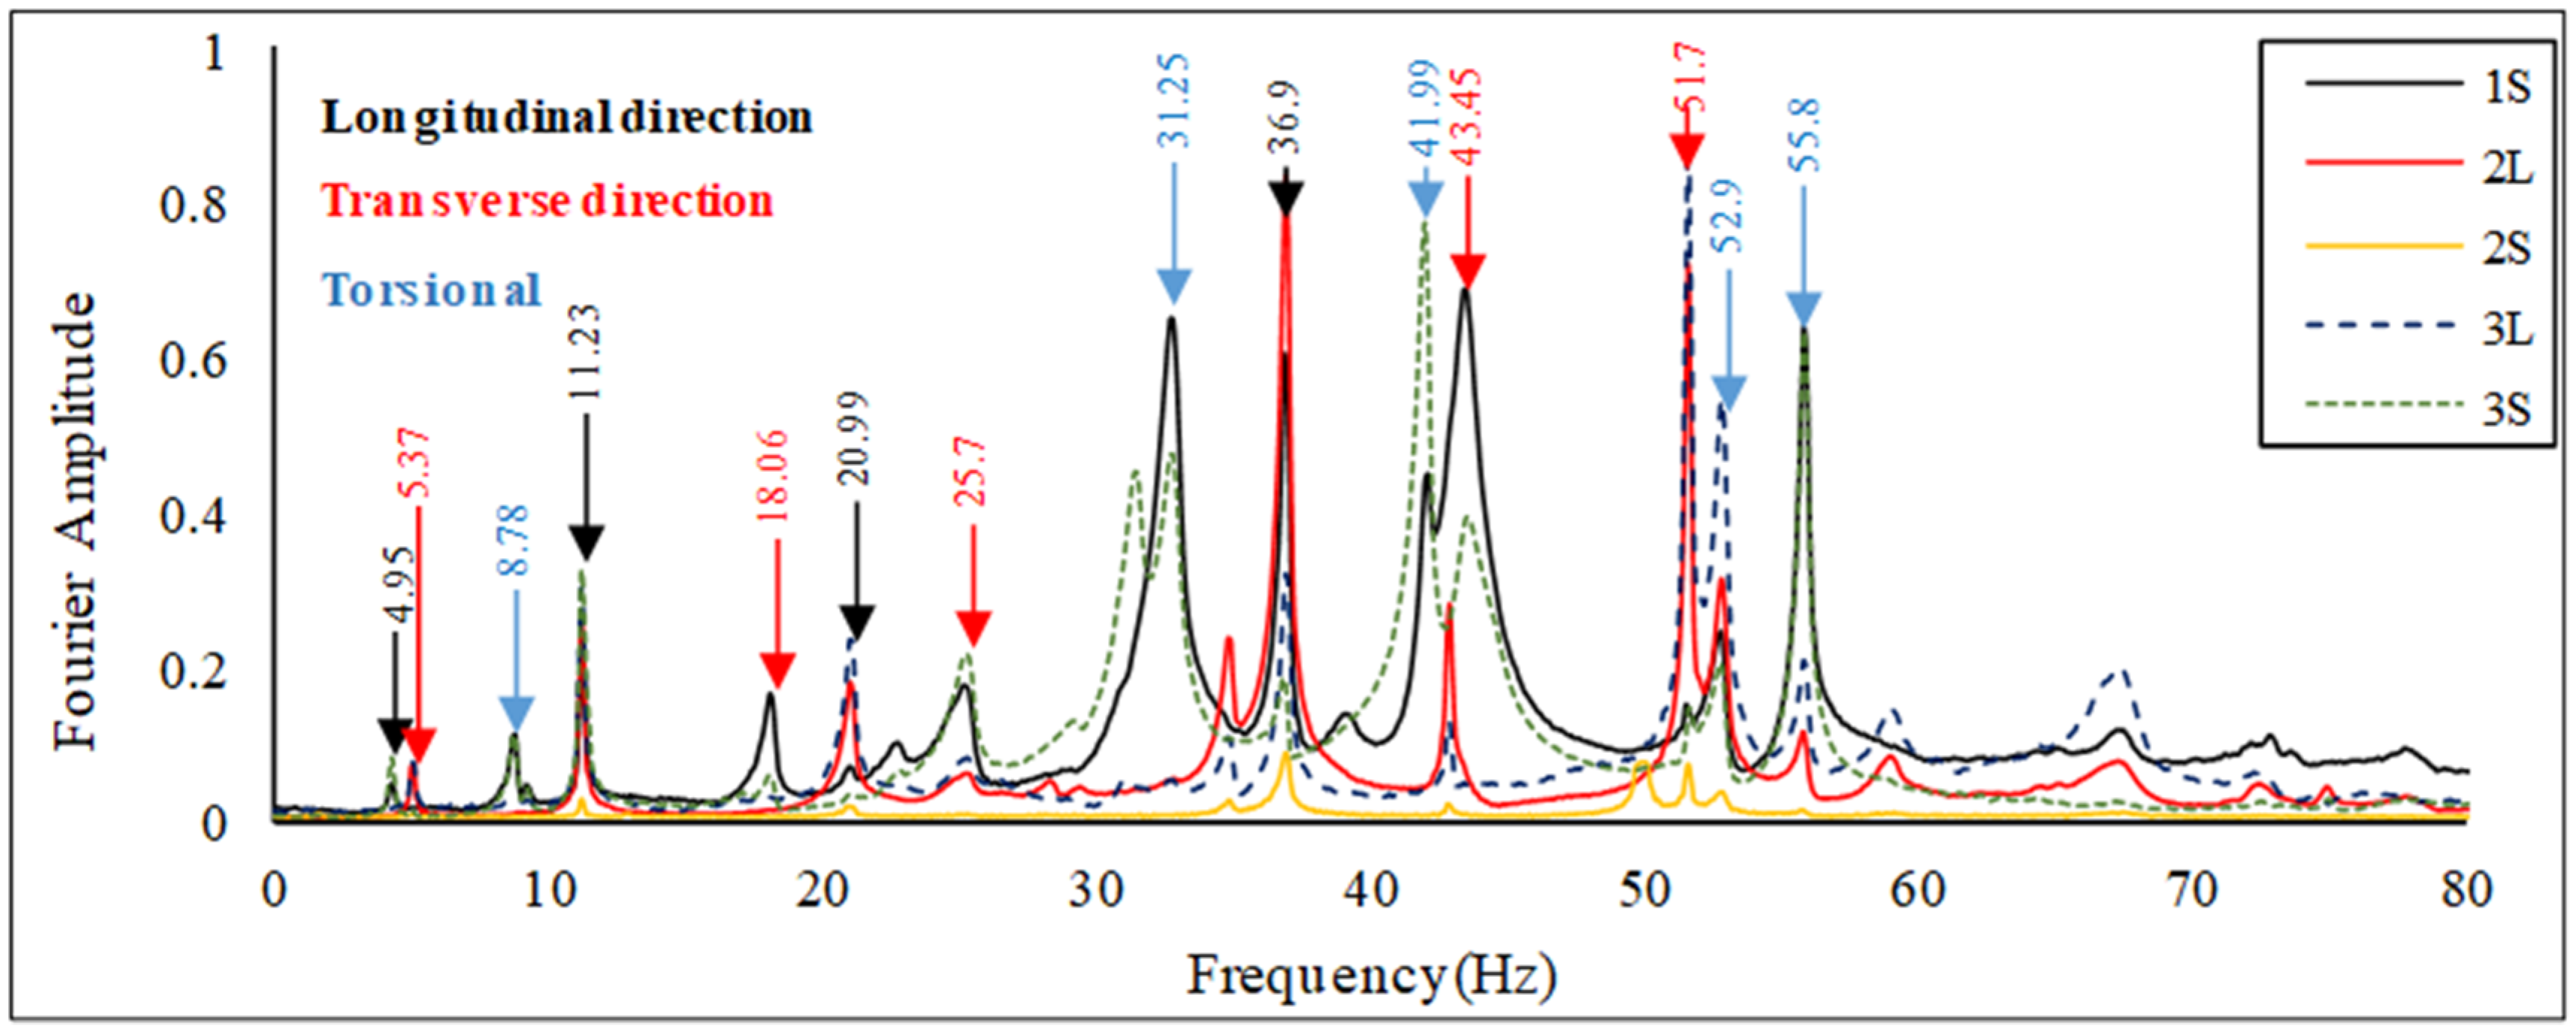
- The first frequency of the structure was observed at 4.95 Hz, and the second one was observed at 5.37 Hz, showing that the structure’s frequency increases when moving to higher modes.
Author Contributions
Funding
Institutional Review Board Statement
Informed Consent Statement
Data Availability Statement
Acknowledgments
Conflicts of Interest
References
- Srisangeerthanan, S.; Hashemi, M.J.; Rajeev, P.; Gad, E.; Fernando, S. Numerical study on the effects of diaphragm stiffness and strength on the seismic response of multi-story modular buildings. Eng. Struct. 2018, 163, 25–37. [Google Scholar] [CrossRef]
- Lawson, M.; Ogden, R.; Goodier, C.I. Design in Modular Construction; CRC Press: Boca Raton, FL, USA, 2014. [Google Scholar]
- Lawson, R.M.; Grubb, P.J.; Prewer, J.; Trebilcock, P.J. Modular Construction Using Light Steel Framing: An Architect’s Guide; Steel Construction Institute: Berkshire, UK, 1999. [Google Scholar]
- Farajian, M.; Sharafi, P.; Kildashti, K. The influence of inter-module connections on the effective length of columns in multi-story modular steel frames. J. Constr. Steel Res. 2021, 177, 106450. [Google Scholar] [CrossRef]
- WilliamLacey, A.; Chen, W.; Hao, H.; Bi, K. Effect of inter-module connection stiffness on structural response of a modular steel building subjected to wind and earthquake load. Eng. Struct. 2020, 213, 110628. [Google Scholar]
- Sharafi, P.; Hadi, M.N.; Teh, L.H. Optimum Column Layout Design of Reinforced Concrete Frames Under Wind Loading. In Topics on the Dynamics of Civil Structures; Springer: New York, NY, USA, 2012; Volume 1, pp. 327–340. [Google Scholar]
- Sharafi, P.; Hadi, M.N.; Teh, L.H. Optimum Spans’ Lengths of Multi-Span reinforced Concrete Beams Under Dynamic Loading. In Topics on the Dynamics of Civil Structures; Springer: New York, NY, USA, 2012; Volume 1, pp. 353–361. [Google Scholar]
- Kaveh, A.; Sharafi, P. Ant colony optimization for finding medians of weighted graphs. Eng. Comput. 2008, 25, 102–120. [Google Scholar] [CrossRef]
- Kaveh, A.; Sharafi, P. Nodal ordering for bandwidth reduction using ant system algorithm. Eng. Comput. 2009, 26, 313–323. [Google Scholar] [CrossRef]
- Kaveh, A. Ordering for bandwidth and profile minimization problems via charged system search algorithm. Iran. J. Sci. Technol. Trans. B Eng. 2012, 36, 39–52. [Google Scholar]
- Chen, Z.; Liu, J.; Yu, Y.; Zhou, C.; Yan, R. Experimental study of an innovative modular steel building connection. J. Constr. Steel Res. 2017, 139, 69–82. [Google Scholar] [CrossRef]
- Chen, Z.; Liu, J.; Yu, Y. Experimental study on interior connections in modular steel buildings. Eng. Struct. 2017, 147, 625–638. [Google Scholar] [CrossRef]
- Sanches, R.; Mercan, O.; Roberts, B. Experimental investigations of vertical post-tensioned connection for modular steel structures. Eng. Struct. 2018, 175, 776–789. [Google Scholar] [CrossRef]
- Lee, S.; Park, J.; Shon, S.; Kang, C. Seismic performance evaluation of the ceiling-bracket-type modular joint with various bracket parameters. J. Constr. Steel Res. 2018, 150, 298–325. [Google Scholar] [CrossRef]
- Gunawardena, T.; Ngo, T.; Mendis, P. Behaviour of multi-storey prefabricated modular buildings under seismic loads. Earthq. Struct. 2016, 11, 1061–1076. [Google Scholar] [CrossRef]
- Fathieh, A.; Mercan, O. Seismic evaluation of modular steel buildings. Eng. Struct. 2016, 122, 83–92. [Google Scholar] [CrossRef]
- Landolfo, R.; Iuorio, O.; Fiorino, L. Experimental seismic performance evaluation of modular lightweight steel buildings within the ELISSA project. Earthq. Eng. Struct. Dyn. 2018, 47, 2921–2943. [Google Scholar] [CrossRef]
- Sendanayake, S.V.; Thambiratnam, D.P.; Perera, N.; Chan, T.; Aghdamy, S. Seismic mitigation of steel modular building structures through innovative inter-modular connections. Heliyon 2019, 5, e02751. [Google Scholar] [CrossRef] [PubMed]
- Feng, R.; Shen, L.; Yun, Q. Seismic performance of multi-story modular box buildings. J. Constr. Steel Res. 2020, 168, 106002. [Google Scholar] [CrossRef]
- Sendanayake, S.V.; Thambiratnam, D.P.; Perera, N.J.; Chan, T.H.T.; Aghdamy, S. Enhancing the lateral performance of modular buildings through innovative inter-modular connections. Structures 2021, 29, 167–184. [Google Scholar] [CrossRef]
- Bagheri, S.; Farajian, M. The effects of input earthquake characteristics on the nonlinear dynamic behavior of FPS isolated liquid storage tanks. J. Vib. Control 2018, 24, 1264–1282. [Google Scholar] [CrossRef]
- Farajian, M.; Khodakarami, M.I.; Kontoni, D.P.N. Evaluation of Soil-Structure Interaction on the Seismic Response of Liquid Storage Tanks under Earthquake Ground Motions. Computation 2017, 5, 17. [Google Scholar] [CrossRef] [Green Version]
- Karkabadi, A.; Khodakarami, M.I.; Farajian, M. Seismic Response of Steel Frame by Considering Soil-Structure Interaction under Seismic Sequence. J. Struct. Constr. Eng. 2021, 8, 66–86. [Google Scholar]
- Farajian, M.; Khodakarami, M.I.; Sharafi, P. Effect of MetaFoundation on the Seismic Responses of Liquid Storage Tanks. Appl. Sci. 2022, 12, 2514. [Google Scholar] [CrossRef]
- Kawashima, S.; Fujimoto, T. Vibration analysis of frames with semi-rigid connections. Comput. Struct. 1984, 19, 85–92. [Google Scholar] [CrossRef]
- Goksu, C.; Inci, P.; Demir, U.; Yazgan, U.; Ilki, A. Field testing of substandard RC buildings through forced vibration tests. Bull. Earthq. Eng. 2017, 15, 3245–3263. [Google Scholar] [CrossRef]
- Memari, A.M.; Aghakouchak, A.A.; Ashtiany, M.G.; Tiv, M. Full-scale dynamic testing of a steel frame building during construction. Eng. Struct. 1999, 21, 1115–1127. [Google Scholar] [CrossRef]
- Sophianopoulos, D. The effect of joint flexibility on the free elastic vibration characteristics of steel plane frames. J. Constr. Steel Res. 2003, 59, 995–1008. [Google Scholar] [CrossRef]
- Türker, T.; Bayraktar, A. Finite element model calibration of steel frame buildings with and without brace. J. Constr. Steel Res. 2013, 90, 164–173. [Google Scholar] [CrossRef]
- Rothberg, S.J.; Allen, M.S.; Castellini, P.; Di Maio, D.; Dirckx, J.J.J.; Ewins, D.J.; Halkona, B.J.; Muyshondte, P.; Paonec, N.; Ryan, T.; et al. An international review of laser Doppler vibrometry: Making light work of vibration measurement. Opt. Lasers Eng. 2017, 99, 11–22. [Google Scholar] [CrossRef] [Green Version]
- Sriram, P.; Hanagud, S.; Craig, J. Mode Shape Measurement Using a Scanning Laser Doppler Vibrometer. “Vol. 1 Florence.”; Union Coll: Schenectady, NY, USA, 1991; pp. 176–181. [Google Scholar]
- Stanbridge, A.; Ewins, D. Modal testing using a scanning laser Doppler vibrometer. Mech. Syst. Signal Process. 1999, 13, 255–270. [Google Scholar] [CrossRef]
- Allen, M.S.; Sracic, M.W. A new method for processing impact excited continuous-scan laser Doppler vibrometer measurements. Mech. Syst. Signal Process. 2010, 24, 721–735. [Google Scholar] [CrossRef]
- Alembagheri, M.; Sharafi, P.; Rashidi, M.; Bigdeli, A.; Farajian, M. Natural dynamic characteristics of volumetric steel modules with gypsum sheathed LSF walls: Experimental study. Structures 2021, 33, 272–282. [Google Scholar] [CrossRef]
- Rashidi, M.; Sharafi, P.; Alembagheri, M.; Bigdeli, A.; Samali, B. Operational modal analysis, testing and modelling of prefabricated steel modules with different LSF composite walls. Materials 2020, 13, 5816. [Google Scholar] [CrossRef]
- Sharafi, P.; Rashidi, M.; Alembagheri, M.; Bigdeli, A. System Identification of a Volumetric Steel Modular Frame Using Experimental and Numerical Vibration Analysis. J. Archit. Eng. 2021, 27, 04021032. [Google Scholar] [CrossRef]
- Brownjohn, J.M. Ambient vibration studies for system identification of tall buildings. Earthq. Eng. Struct. Dyn. 2003, 32, 71–95. [Google Scholar] [CrossRef] [Green Version]
- Wilson, J.C.; Liu, T. Ambient vibration measurements on a cable-stayed bridge. Earthq. Eng. Struct. Dyn. 1991, 20, 723–747. [Google Scholar] [CrossRef]
- Gentile, C.; Martinez, Y.; Cabrera, F. Dynamic investigation of a repaired cable-stayed bridge. Earthq. Eng. Struct. Dyn. 1997, 26, 41–59. [Google Scholar] [CrossRef]
- Sevim, B.; Bayraktar, A.; Altunişik, A.C.; Atamtürktür, S.; Birinci, F. Assessment of nonlinear seismic performance of a restored historical arch bridge using ambient vibrations. Nonlinear Dyn. 2011, 63, 755–770. [Google Scholar] [CrossRef]
- Li, B.; Duffield, C.F.; Hutchinson, G.L. The influence of non-structural components on the serviceability performance of high-rise buildings. Aust. J. Struct. Eng. 2009, 10, 53–62. [Google Scholar] [CrossRef]
- Ewins, D.J. Modal Testing: Theory, Practice and Application; John Wiley & Sons: Hoboken, NJ, USA, 2009. [Google Scholar]
- Jacobsen, N.J.; Andersen, P.; Brincker, R. Using Enhanced Frequency Domain Decomposition as a Robust Technique to Harmonic Excitation in Operational Modal Analysis. In Proceedings of the ISMA2006: International Conference on Noise & Vibration Engineering, Leuven, Belgium, 18 September 2006; Katholieke Universiteit: Leuven, Belgium, 2006. [Google Scholar]
- Türker, T.; Kartal, M.E.; Bayraktar, A.; Muvafik, M. Assessment of semi-rigid connections in steel structures by modal testing. J. Constr. Steel Res. 2009, 65, 1538–1547. [Google Scholar] [CrossRef]
- Brincker, R.; Zhang, L.; Andersen, P. Modal Identification from Ambient Responses Using Frequency Domain Decomposition. In Proceedings of the 18*‘International Modal Analysis Conference (IMAC), San Antonio, TX, USA, 7 February 2000. [Google Scholar]
- Peeters, B.; De Roeck, G. Stochastic system identification for operational modal analysis: A review. J. Dyn. Syst. Meas. Control 2001, 123, 659–667. [Google Scholar] [CrossRef]
- Extractor, A. Structural Vibration Solutions; Aalborg University: Aalborg, Denmark, 1999. [Google Scholar]
- AS 4100:1998; AS, Steel Structures. Standards Australia: Sydney, Australia, 1998.
- AS/NZS 1170.2; Structural Design Actions, Part 2: Wind Actions. Standards Australia: Sydney, Australia, 2011.
- Brincker, R.; Zhang, L.; Andersen, P. Output-Only Modal Analysis by Frequency Domain Decomposition. In Proceedings of the ISMA25: 2000 International Conference on Noise and Vibration Engineering, Leuven, Belgium, 13 September 2000; Katholieke Universiteit: Leuven, Belgium, 2000. [Google Scholar]


| Operational Properties | Value |
|---|---|
| Output voltage | ±16 V |
| Full-scale range | 2 g |
| Cross-axis sensitivity | ±2% |
| Nonlinearity | ±0.15% |
| Bias calibration error | ±30 mV |
| Output noise (RMS, typical) | 10 μg/(root Hz) |
| Operating temperature | −55 to +125 °C |
| Test Case | ||||||||||
|---|---|---|---|---|---|---|---|---|---|---|
| Mode No. | Test1 (Hz) | Test2 (Hz) | Test3 (Hz) | Test4 (Hz) | Test5 (Hz) | Test6 (Hz) | Test7 (Hz) | Test8 (Hz) | Test9 (Hz) | Test10 (Hz) |
| 1 | 4.9 | 4.43 | 4.32 | 4.35 | 4.81 | 4.79 | 4.962 | 4.83 | 4.82 | 4.32 |
| 2 | 5.46 | 5.19 | 5.213 | 5.06 | 5.10 | 5.11 | 5.236 | 5.05 | 5.15 | 5.18 |
| 3 | 8.43 | 8.84 | 8.51 | 8.79 | 8.71 | 8.536 | 8.92 | 8.71 | 8.751 | 8.86 |
| 4 | 11.2 | 11.25 | 11.38 | 11.02 | 11.46 | 11.13 | 11.21 | 11.876 | 11.44 | 11.342 |
| 5 | 18.41 | 18.51 | 18.3 | 18.103 | 18.02 | 18.05 | - | 17.98 | 18.34 | 18.12 |
| Test Case | ||||||||||
|---|---|---|---|---|---|---|---|---|---|---|
| Mode No. | Test1 (%) | Test2 (%) | Test3 (%) | Test4 (%) | Test5 (%) | Test6 (%) | Test7 (%) | Test8 (%) | Test9 (%) | Test10 (%) |
| 1 | 5.31 | 5.41 | 5.35 | 5.42 | 5.39 | 5.43 | 5.36 | 5.38 | 5.40 | 5.17 |
| 2 | 5.12 | 5.15 | 5.25 | 5.28 | 5.11 | 5.17 | 5.23 | 5.2 | 5.16 | 5.22 |
| 3 | 4.12 | 4.09 | 4.1 | 4.11 | 4.13 | 4.08 | 4.07 | 4.15 | 4.07 | 4.14 |
| 4 | 2.81 | 2.79 | 2.76 | 2.83 | 2.82 | 2.75 | 2.7 | 2.89 | 2.71 | 2.73 |
| 5 | 2.12 | 2.14 | 2.1 | 2.09 | 2.11 | 2.15 | - | 2.13 | 2.05 | 2.07 |
| Test Case | ||||||||||
|---|---|---|---|---|---|---|---|---|---|---|
| Mode No. | Test1 (Hz) | Test2 (Hz) | Test3 (Hz) | Test4 (Hz) | Test5 (Hz) | Test6 (Hz) | Test7 (Hz) | Test8 (Hz) | Test9 (Hz) | Test10 (Hz) |
| 1 | - | 4.24 | - | 4.26 | 5.124 | - | - | - | - | - |
| 2 | - | - | 5.51 | - | - | - | 5.2 | - | 5.21 | - |
| 3 | - | 8.95 | - | 8.97 | - | - | 8.91 | 8.49 | 8.85 | - |
| 4 | - | - | - | - | - | 11.27 | 11.53 | 11.61 | - | - |
| 5 | 18.301 | 18.5 | - | 18.73 | 18.61 | - | - | - | 18.29 | 18.41 |
| Test Case | ||||||||||
|---|---|---|---|---|---|---|---|---|---|---|
| Mode No. | Test1 (%) | Test2 (%) | Test3 (%) | Test4 (%) | Test5 (%) | Test6 (%) | Test7 (%) | Test8 (%) | Test9 (%) | Test10 (%) |
| 1 | - | 5.21 | - | 5.65 | 5.54 | - | - | - | - | - |
| 2 | - | - | 5.28 | - | 5.21 | - | - | 5.13 | - | - |
| 3 | - | 2.41 | 2.4 | 2.16 | - | - | - | 2.58 | - | - |
| 4 | - | - | - | 1.55 | - | 1.43 | - | 1.2 | - | - |
| 5 | - | 1.05 | - | 1.23 | 0.91 | - | - | - | - | 1.07 |
Publisher’s Note: MDPI stays neutral with regard to jurisdictional claims in published maps and institutional affiliations. |
© 2022 by the authors. Licensee MDPI, Basel, Switzerland. This article is an open access article distributed under the terms and conditions of the Creative Commons Attribution (CC BY) license (https://creativecommons.org/licenses/by/4.0/).
Share and Cite
Farajian, M.; Sharafi, P.; Bigdeli, A.; Eslamnia, H.; Rahnamayiezekavat, P. Experimental Study on the Natural Dynamic Characteristics of Steel-Framed Modular Structures. Buildings 2022, 12, 587. https://doi.org/10.3390/buildings12050587
Farajian M, Sharafi P, Bigdeli A, Eslamnia H, Rahnamayiezekavat P. Experimental Study on the Natural Dynamic Characteristics of Steel-Framed Modular Structures. Buildings. 2022; 12(5):587. https://doi.org/10.3390/buildings12050587
Chicago/Turabian StyleFarajian, Mostafa, Pejman Sharafi, Ali Bigdeli, Hadi Eslamnia, and Payam Rahnamayiezekavat. 2022. "Experimental Study on the Natural Dynamic Characteristics of Steel-Framed Modular Structures" Buildings 12, no. 5: 587. https://doi.org/10.3390/buildings12050587
APA StyleFarajian, M., Sharafi, P., Bigdeli, A., Eslamnia, H., & Rahnamayiezekavat, P. (2022). Experimental Study on the Natural Dynamic Characteristics of Steel-Framed Modular Structures. Buildings, 12(5), 587. https://doi.org/10.3390/buildings12050587