
DEMSA Protocol: Deterioration Effect Modelling for Structural Assessment of RC Buildings


Abstract
:1. Introduction
2. The DEMSA Protocol
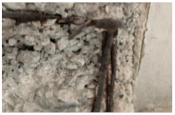
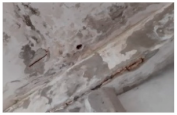
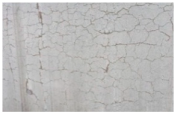
2.1. Step 1—Visual Inspection and Damage Detection

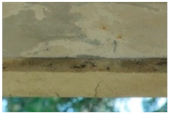
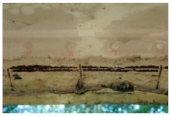
| A1 | A2, A3 | A4, A5 |
 |  |  |
 | 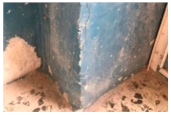 |  |
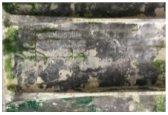
| B1, B2 | B3, B4 | C1, C2, C3 |
 |  |  |
 |  |  |
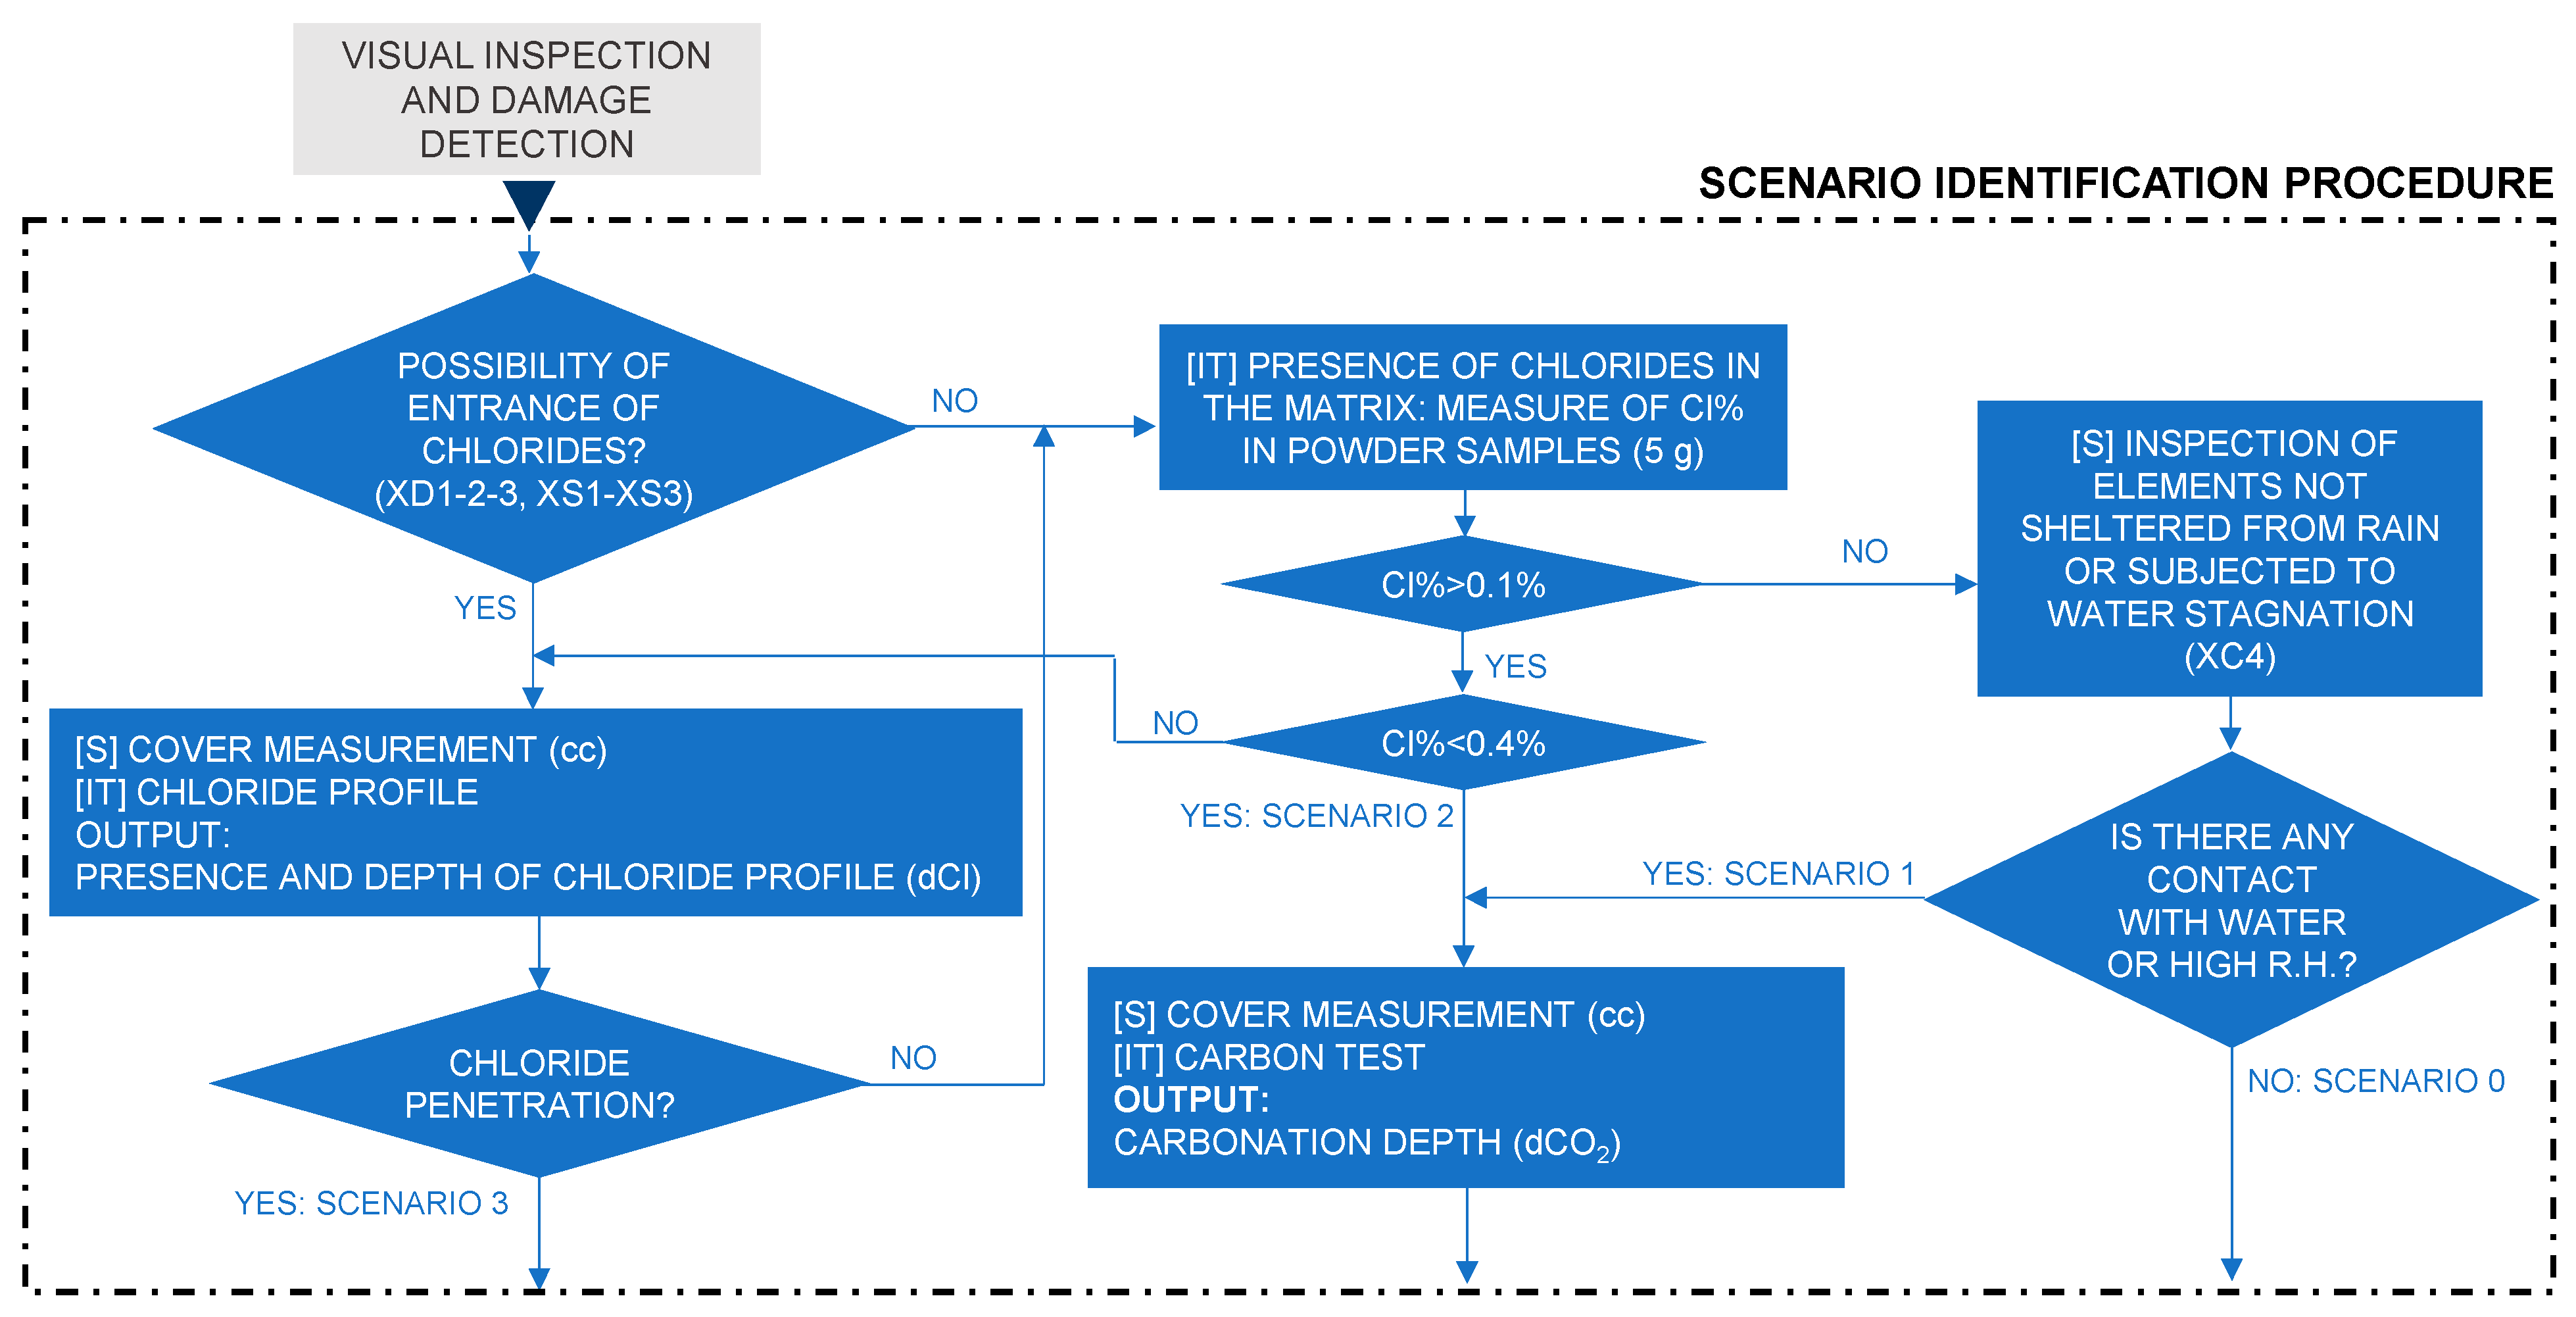
2.2. Step 2—Corrosion Risk Scenario Identification
2.3. Step 3—Calibration of the Equivalent Damage Parameters
2.3.1. Input Data
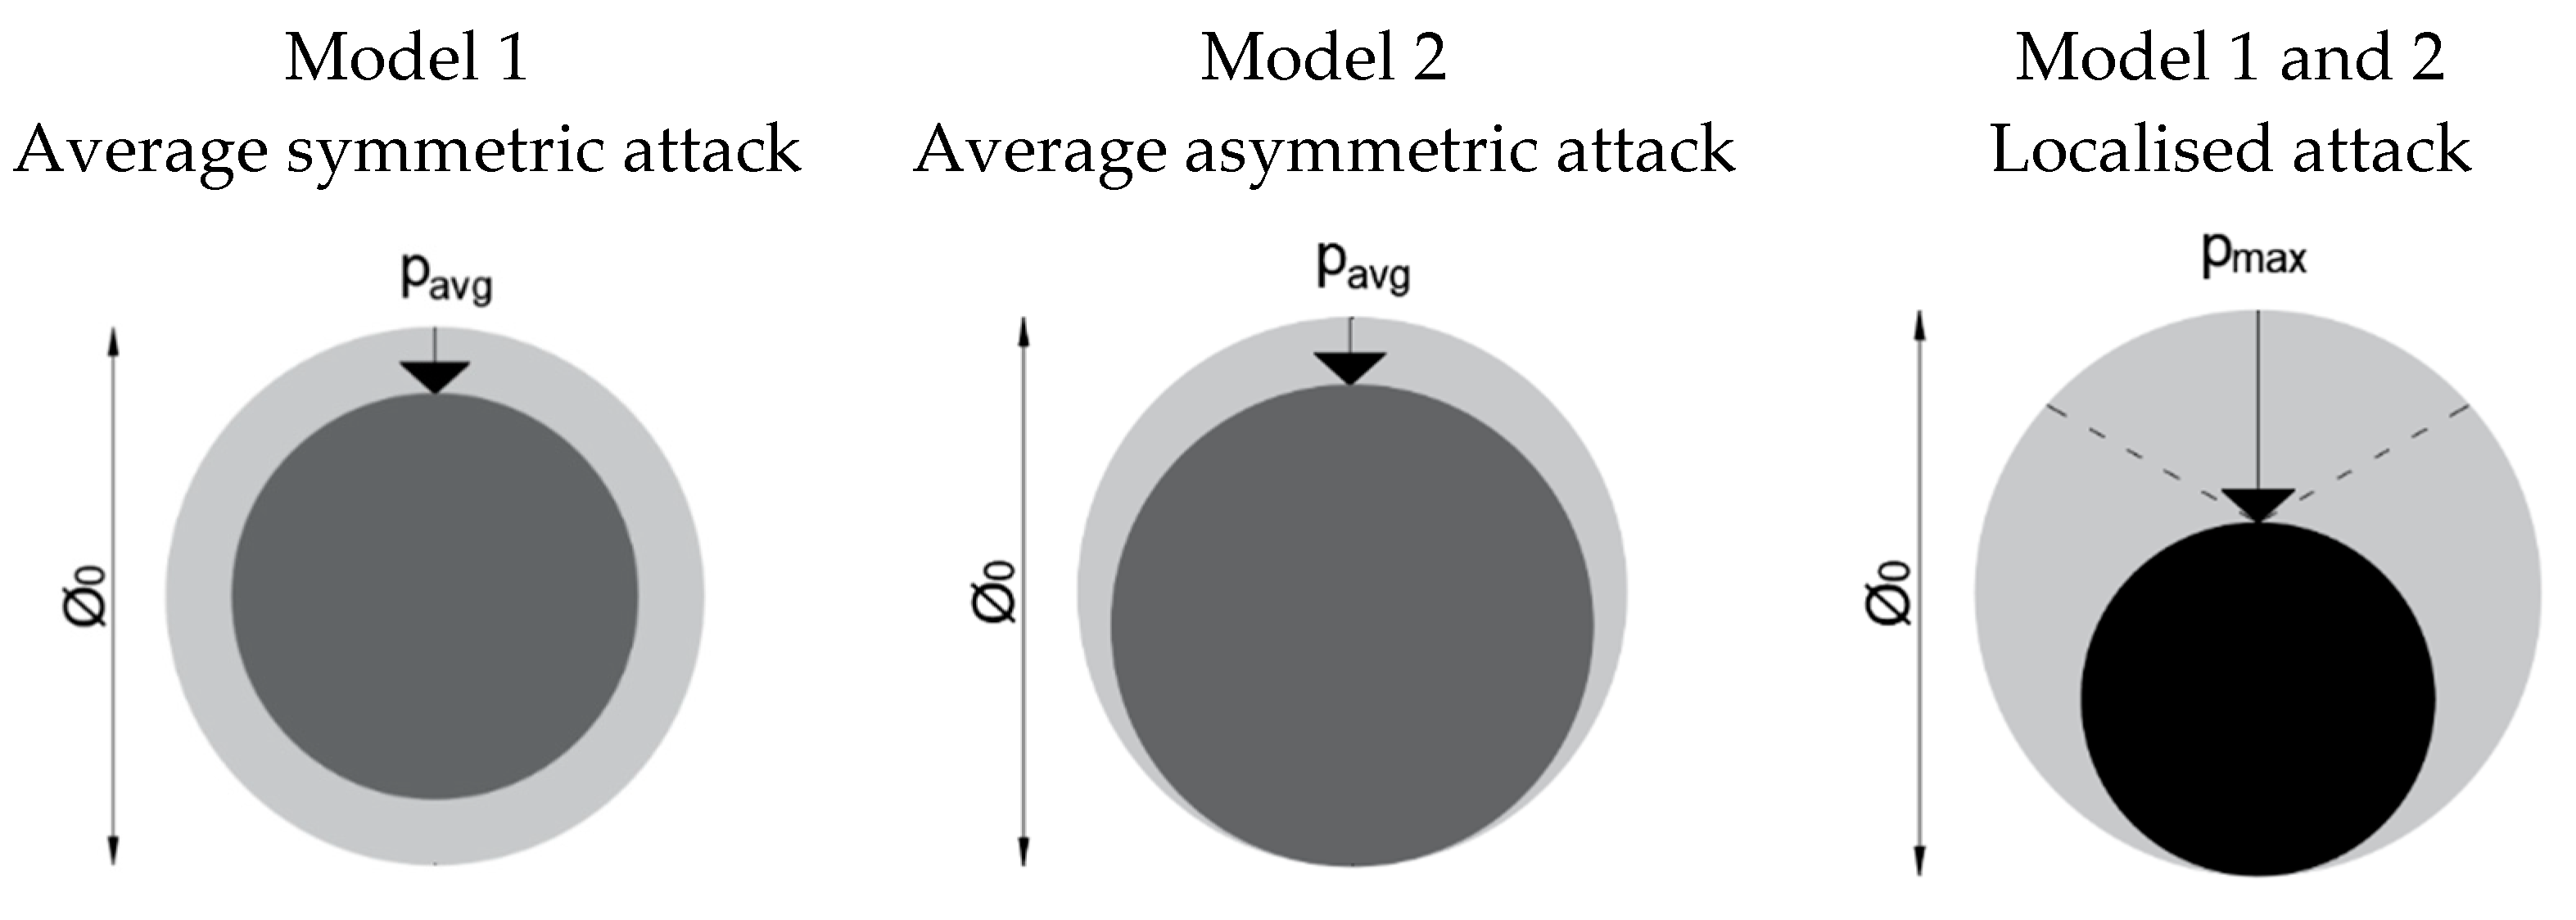
2.3.2. Corrosion Attack Characteristics
- Representative values of the average corrosion rate vavg
- 2.
- Maximum-to-average corrosion attack ratio Rp
- 3.
- Attack model on the bar section and attack distribution on the bar length
2.3.3. Equivalent Damage Parameters
- 1.
- Average and minimum bar residual cross-section
- 2.
- Steel bar strength
- 3.
- Concrete section properties
- 4.
- Residual available ductility
- 5.
- Residual bond strength and possible buckling of longitudinal reinforcement
2.4. Step 4—Evaluation of Corrosion Effects on the Structural Behaviour and Actions
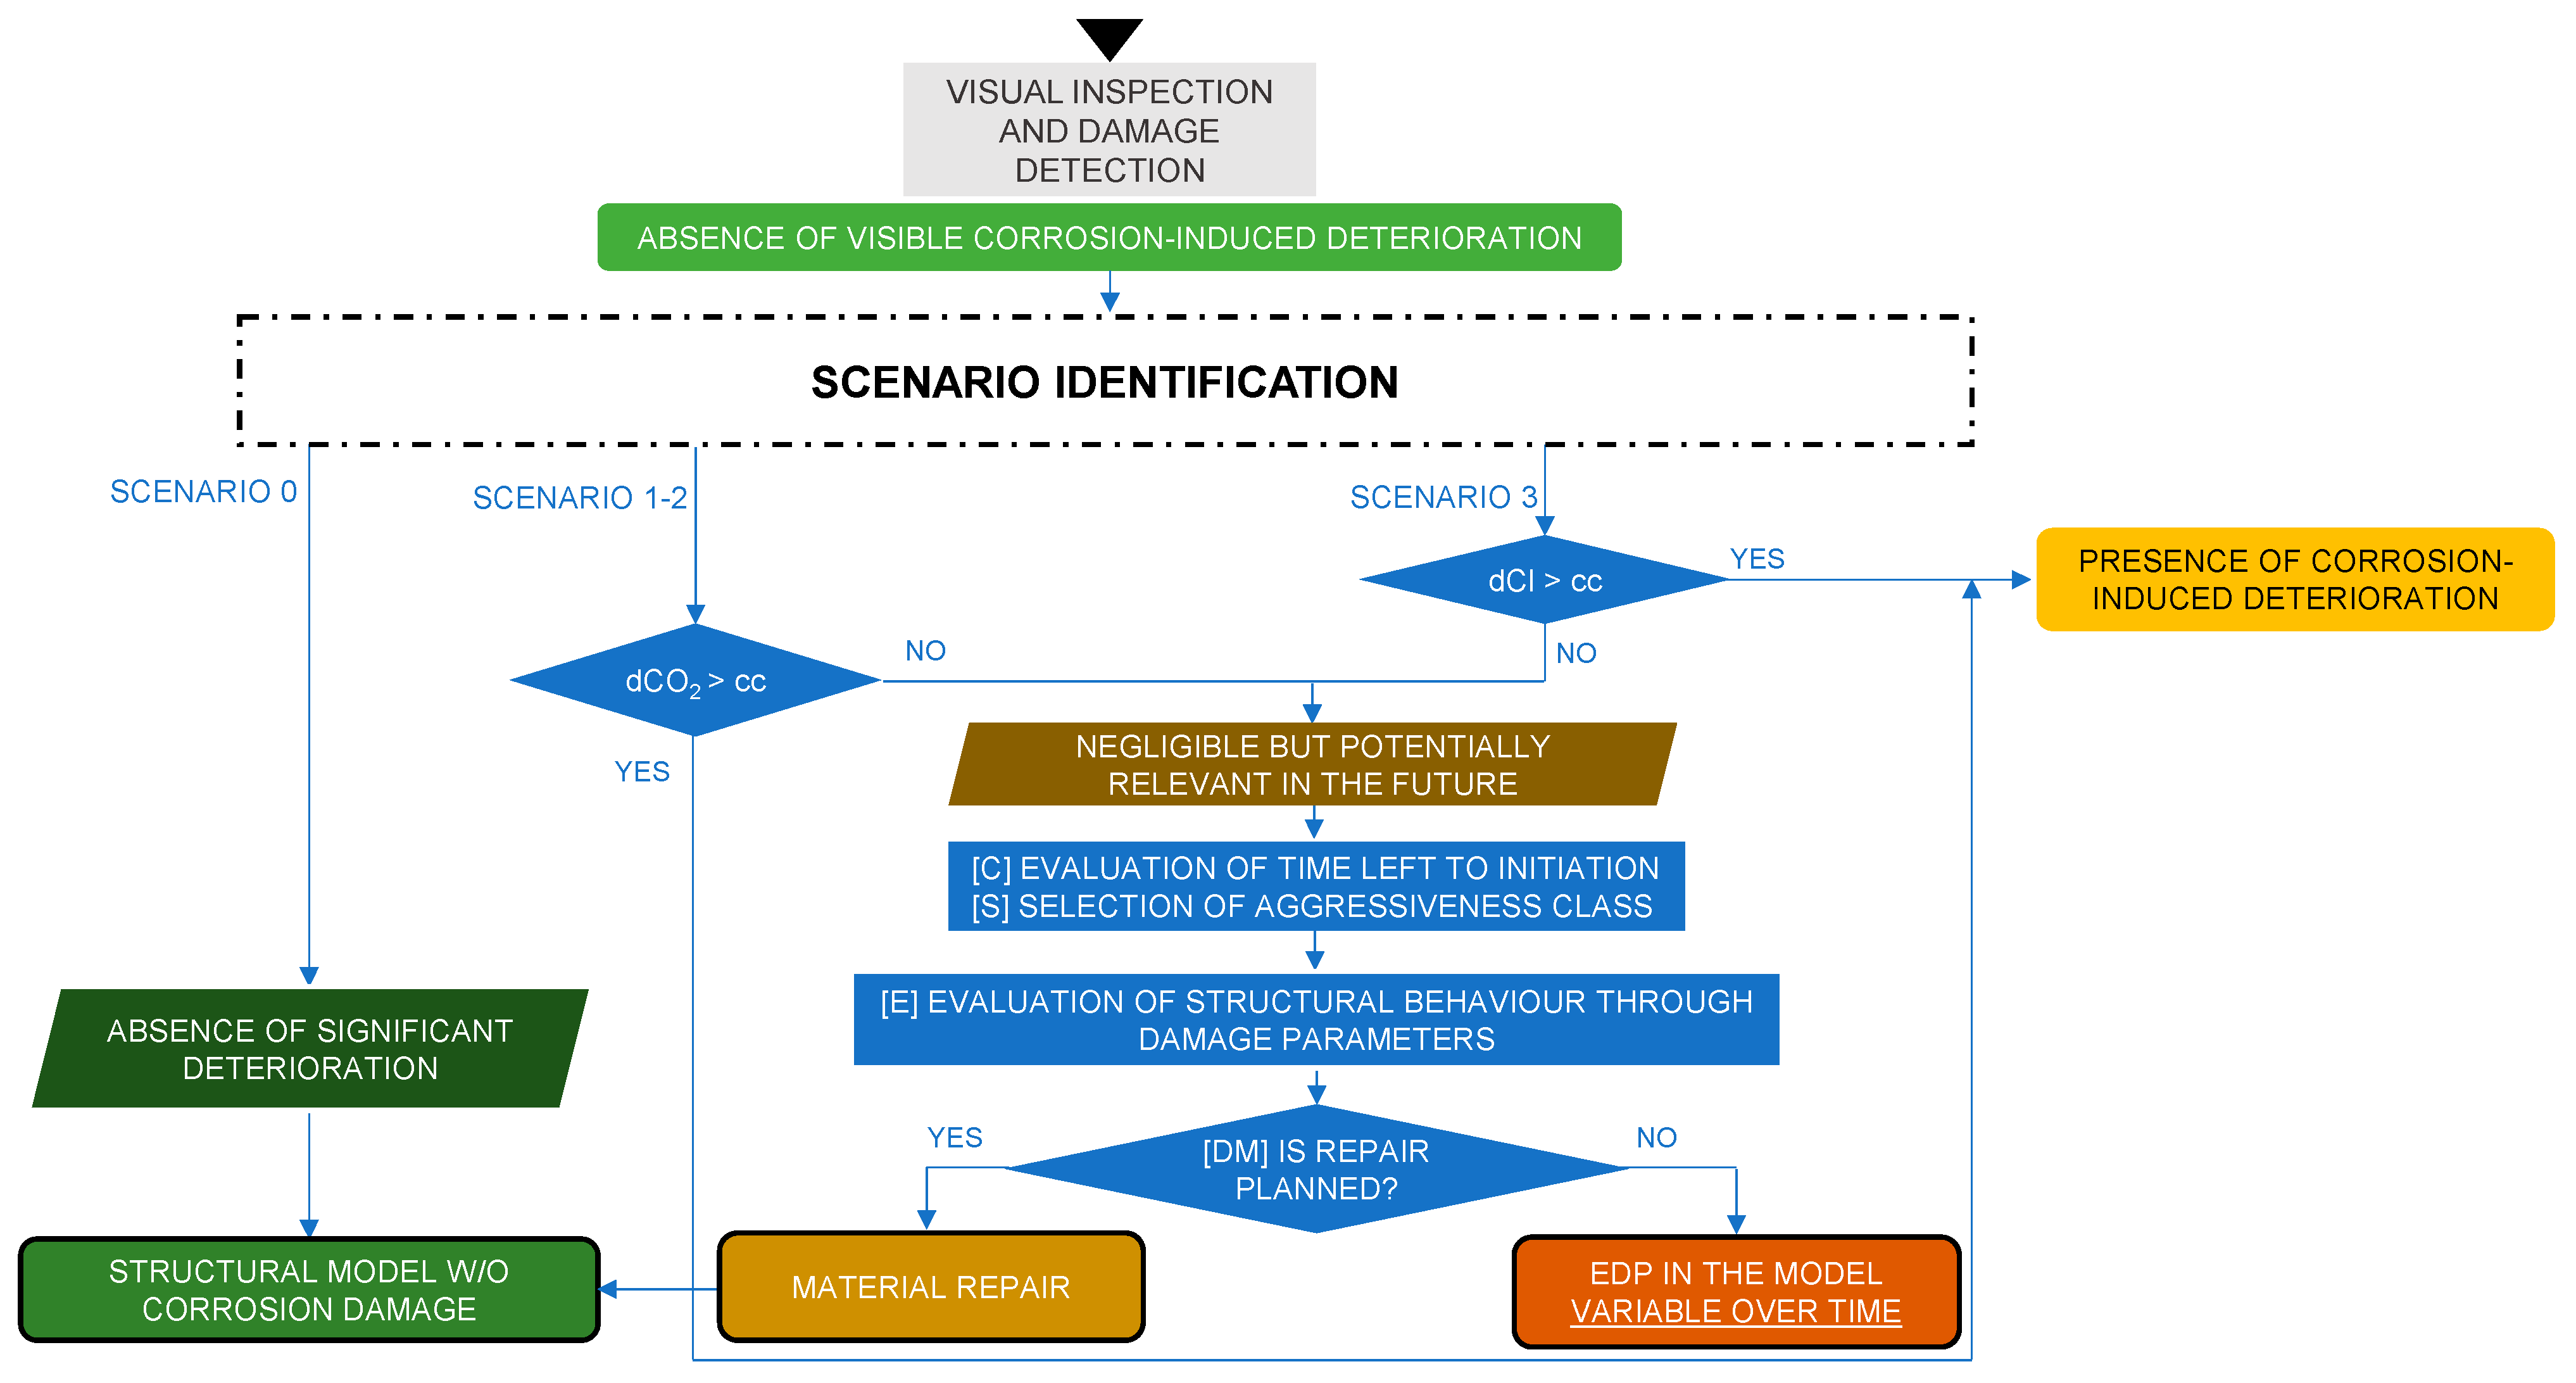
2.4.1. Flow Chart 1: Absence of Visible Corrosion-Induced Deterioration
- The penetration of aggressive substances is deeper than the concrete cover thickness; therefore, they have reached the rebar level (dCO2 (or dCl) > cc) and the corrosion is likely to be already active. In this case, the second flow chart, ‘presence of corrosion-induced deterioration’, is used (Figure 8);
- The penetration of aggressive substances has not reached the rebar level (dCO2 (or dCl) < cc); thus, the corrosion is not active at the time of the survey, but it could be in the future because the structure belongs to one of those scenarios (1–2–3) in which significant corrosion may occur (deterioration effects are ‘negligible but potentially relevant in the future’). In this case, it is possible to estimate the time left until the initiation of corrosion (Equations (1)–(3) and Figure 5), to select a possible aggressiveness class, and to carry out qualitative and/or quantitative evaluations on the expected future structural behaviour, based on the type of damage associated with the corresponding corrosion risk scenario. It is worth mentioning that the DEMSA protocol enables a preliminary evaluation of the corrosion effects, and most of all, of the influence of such effects on the structural behaviour, so that this aspect is not disregarded in the actual practice by structural engineers; if corrosion is then found to be relevant, the support of a corrosion expert is required to perform an accurate detection of the phenomenon and a more detailed definition of the corrosion attack characteristics. Finally, these evaluations can help the user in the decision-making process, to technically support the economic considerations and intervention planning and scheduling. If the action ‘material repair’, enabling the delay of corrosion initiation, is pursued, repair costs should be accounted for, and then ‘structural model without corrosion damage’ can be selected; if, instead, such an option is not possible in this phase, evaluations of the future behaviour of the structure should consider ‘equivalent damage parameters variable over time’ to be implemented in the structural models to plan maintenance operations.
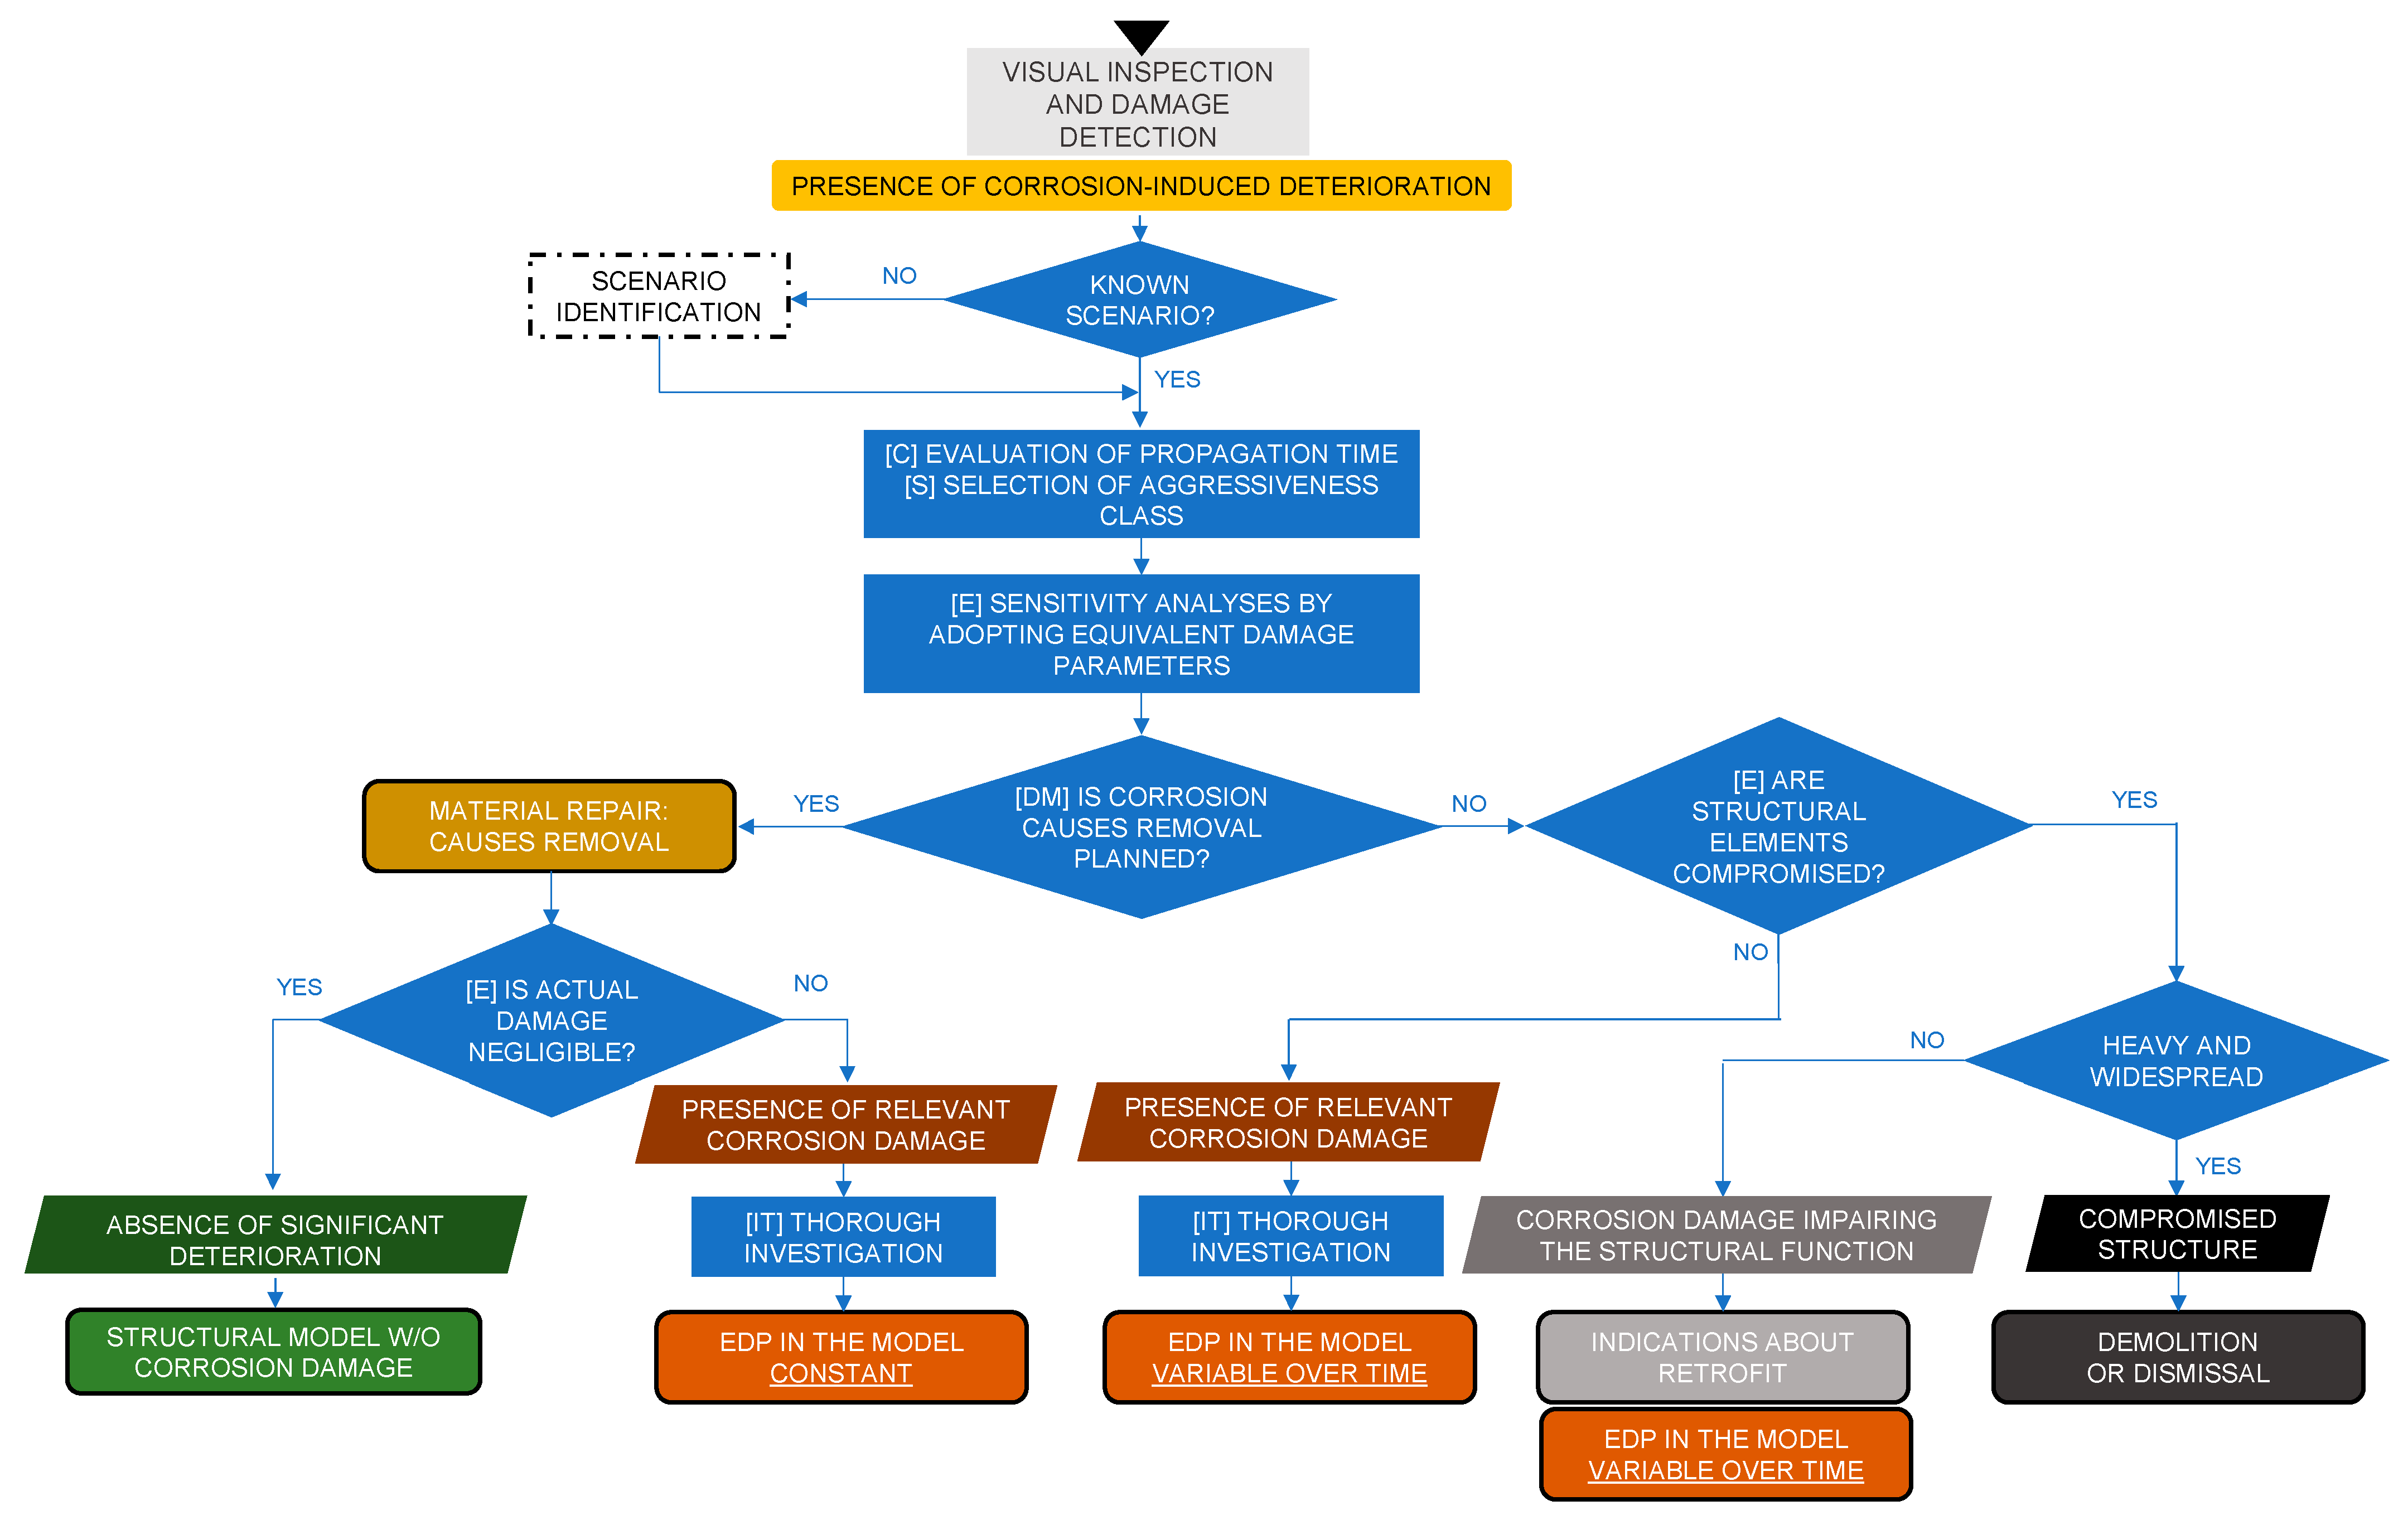
2.4.2. Flow Chart 2: Presence of Visible Corrosion-Induced Deterioration
- Structural elements may still be able to perform their structural function. ‘Presence of relevant corrosion damage’ should be considered in the structural evaluations, also considering its evolution in time. A thorough investigation of the attack characteristics is performed and the output ‘equivalent damage parameters variable over time’ is thus selected;
- Structural elements’ function is compromised. In this case, if the damage is localised in a few structural elements, those elements could be substituted or retrofitted; or, if damage affects a group of elements, an additional resisting system could be introduced in order to replace the function of the damaged elements, or the load on the structure could be reduced. For example, in the case of seismic retrofit, if a significant reduction in ductility may have occurred at the plastic hinge location on the columns, a new lateral resisting system with shear walls could be introduced, downgrading the columns to the sole role of resisting vertical loads. All these possible actions are grouped into the output ‘indications about retrofit’. If instead heavy damage is spread throughout most of the structural elements, ‘demolition or dismissal’ of the structure should be considered. It is worth noting that such a critical choice is usually also based on economic and social aspects. What needs to be highlighted here is when demolition should be considered because of extended, severe, and irreversible damage of the existing structure.
3. Application and Validation of the DEMSA Protocol
3.1. Outcomes 1: Absence of Significant Deterioration
3.2. Outcomes 2: Indications about Retrofit
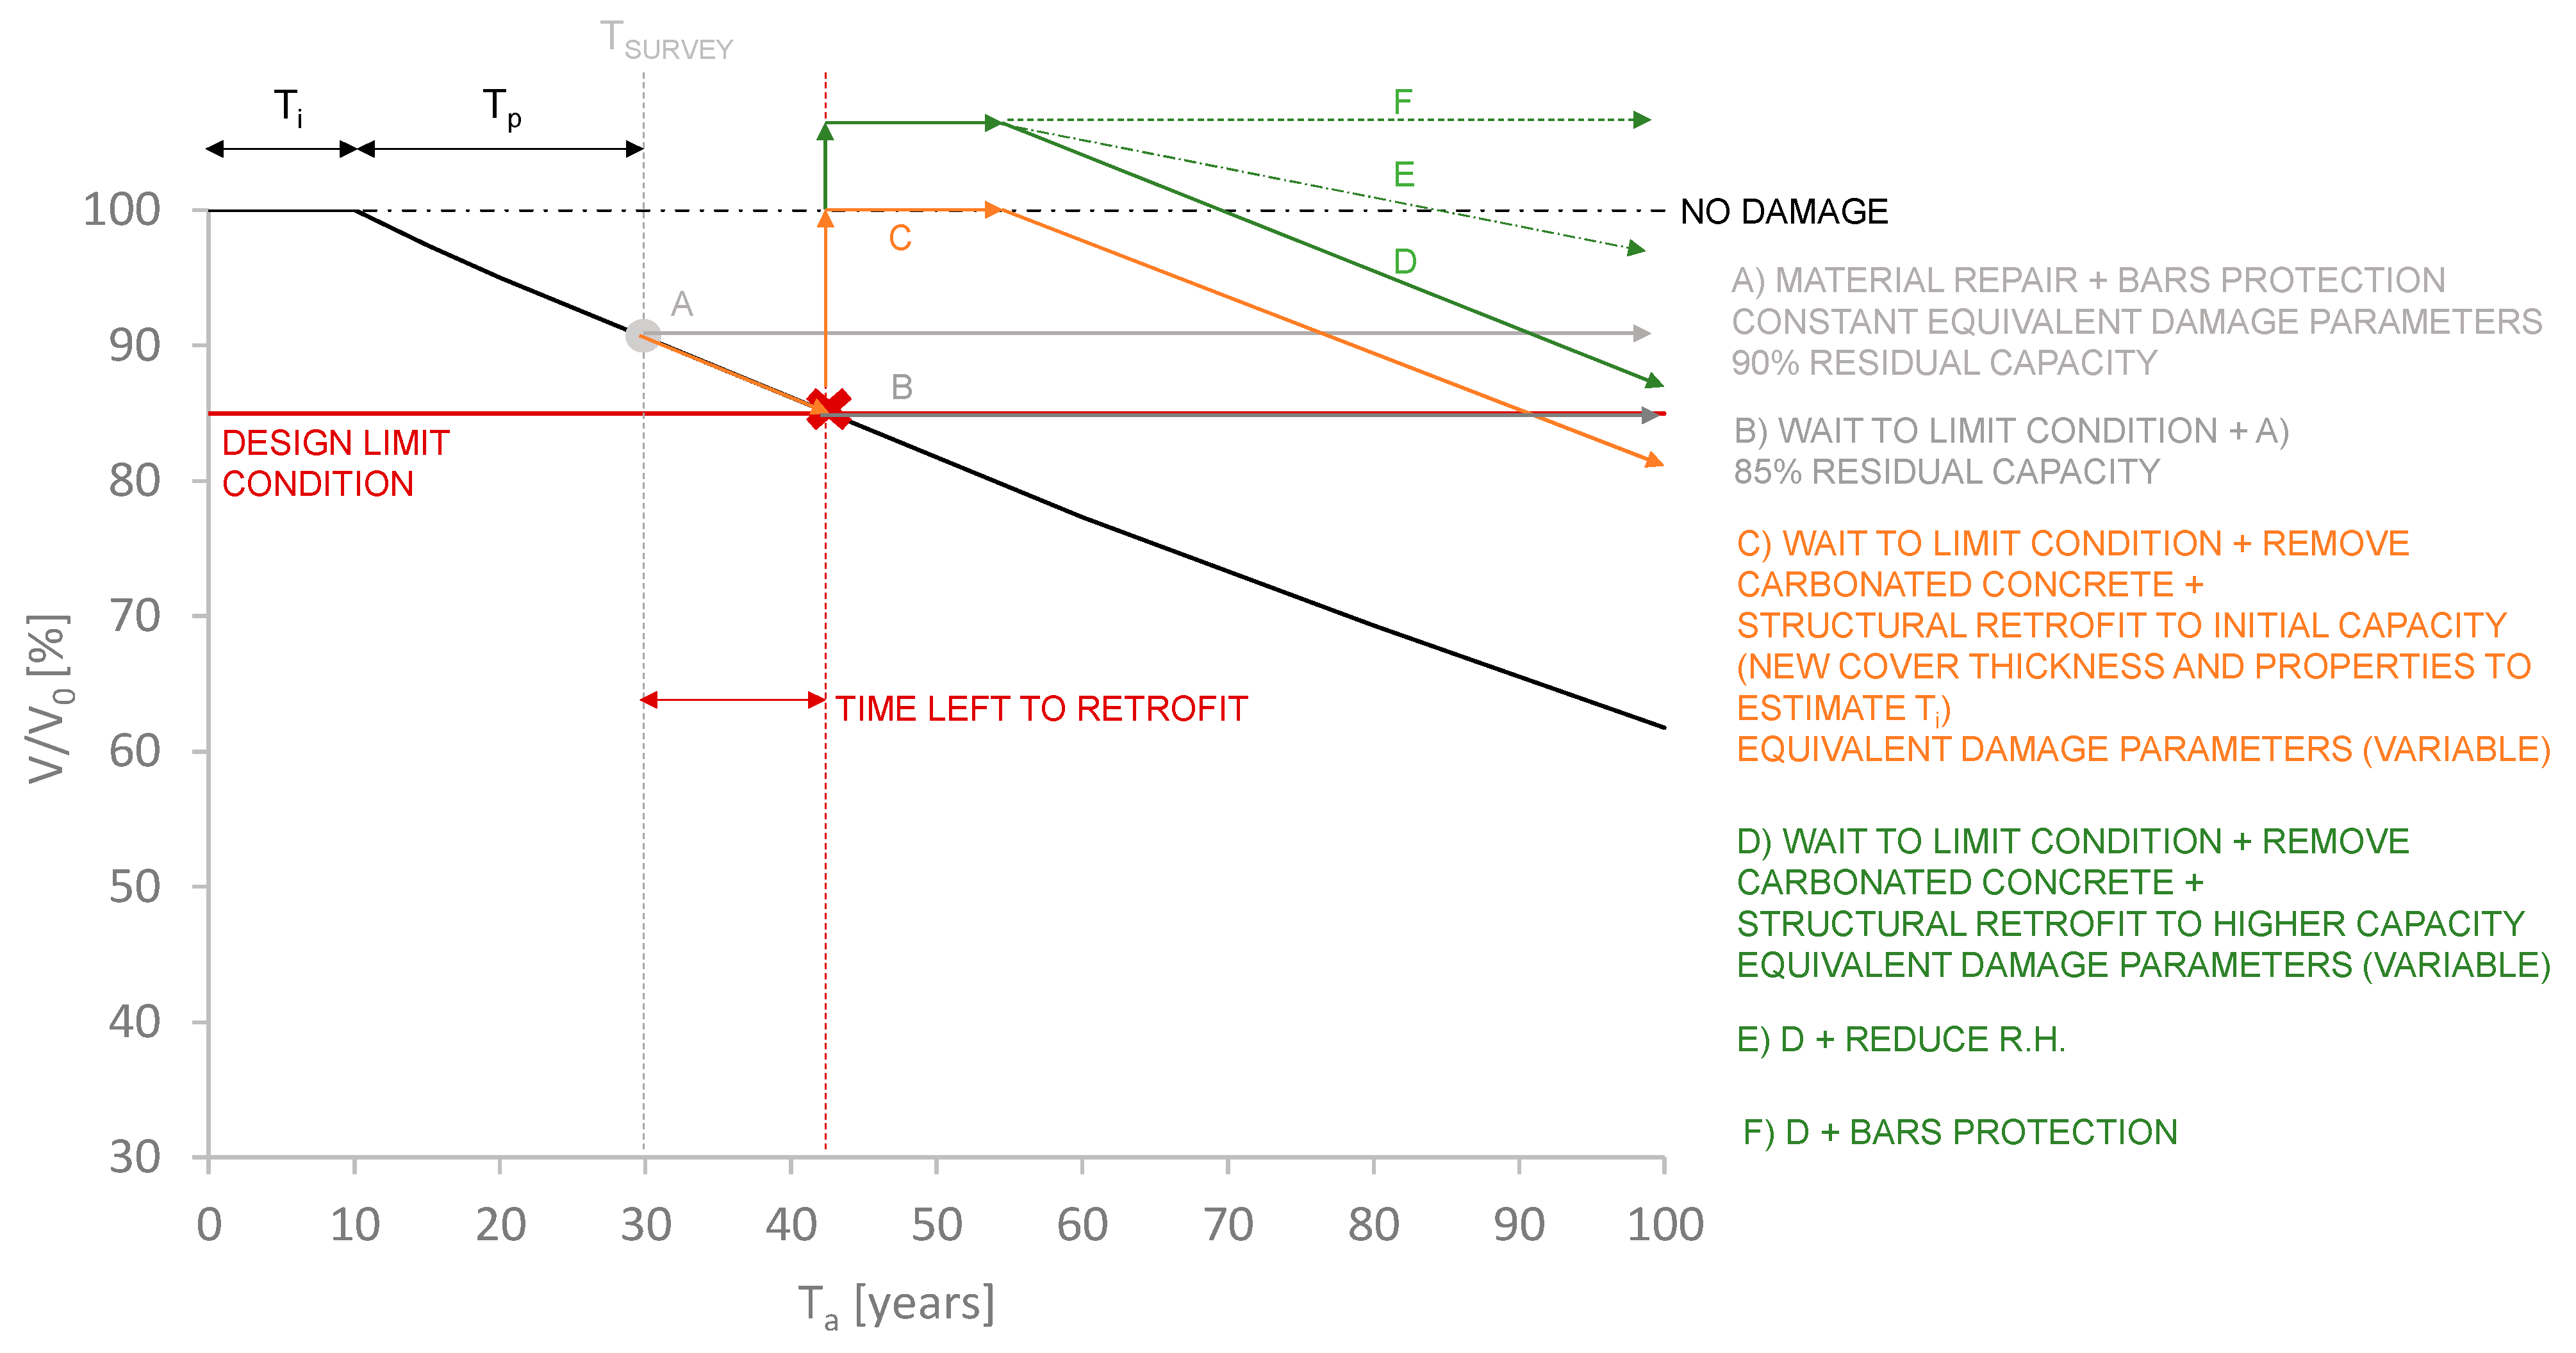
3.3. Outcomes 3: Definition of Equivalent Damage Parameters Variable over Time
4. Implementation of EDP in the Structural Modelling
5. Concluding Remarks and Research Needs
- The protocol user is guided through a series of consecutive steps which allow a simplified evaluation of whether corrosion damage may be present and which type of attack may be expected. To this end, the user is guided to the design of the diagnostic campaign, and to the definition of the suitable in situ measurements tests, which are necessary to detect the actual risk of corrosion. The already-available instrumental tests are integrated within the protocol; on the other hand, the need of developing a rapid test enabling the evaluation of the presence and amount of chloride in concrete is emphasised;
- Corrosion risk scenarios are introduced to group together all environmental conditions leading to similar corrosion attacks, described through the corrosion attack characteristics. Such characteristics, especially the average corrosion rate and the maximum-to-average attack ratio, should be further detailed to reduce the proposed ranges. More correlations among environmental aggressiveness conditions and effective corrosion damage are thus required;
- Simplified equivalent damage parameters are calibrated based on the previous collected input data. The models adopted in the protocol for the evaluation of the bar residual cross-section are those acknowledged as the most practical and straightforward; despite that more refined modelling of the localised attack is often proposed in the literature, it requires a level of accuracy which does not match the reduced feasibility of in-field measurements. As for the other parameters, also simplified attack pattern distributions along the bar length may be provided in the future in relation to each scenario;
- Along all its steps, the protocol maintains focus on the effects of deterioration on the structural behaviour of the building, in relation to the assessment of the structure and the choice of the suitable renovation strategy.
Author Contributions
Funding
Institutional Review Board Statement
Data Availability Statement
Acknowledgments
Conflicts of Interest
References
- Marini, A.; Passoni, C.; Belleri, A.; Feroldi, F.; Metelli, G.; Preti, M.; Giuriani, E.; Riva, P.; Plizzari, G. Combining seismic retrofit with energy refurbishment for the sustainable renovation of RC buildings: A proof of concept. Eur. J. Environ. Civ. Eng. 2017, 10, 1080. [Google Scholar] [CrossRef]
- Bertolini, L.; Elsener, B.; Pedeferri, P.; Redaelli, E.; Polder, R. Corrosion of Steel in Concrete—Prevention, Diagnosis, Repair; Wiley VCH: Weinheim, Germany, 2013. [Google Scholar]
- Coronelli, D.; Gambarova, P.G. Structural assessment of corroding R/C beams: Modelling guidelines. ASCE J. Struct. Eng. 2004, 130, 1214–1224. [Google Scholar] [CrossRef]
- IN30902I. CONTECVET. A Validated User Manual for Assessing the Residual Life of Concrete Structures. DG Enterprise, CEC. 2001. Available online: https://www.ietcc.csic.es/en/ (accessed on 26 April 2022).
- Coronelli, D. Resistance of corroded RC beams: Extending fib Model Code 2010 models. Struct. Concr. 2020, 21, 1747–1762. [Google Scholar] [CrossRef]
- EN 1998-3; Eurocode 8 Design of Structures for Earthquake Resistance. CEN: Brussels, Belgium, 2005.
- FIB. Fib Model Code for Concrete Structures, 2010; Wilhelm Ernst & Sohn, Wiley: Berlin, Germany, 2013. [Google Scholar]
- Passoni, C.; Marini, A.; Belleri, A.; Menna, C. Redefining the concept of sustainable renovation of buildings: State of the art and LCT-based design framework. Sustain. Cities Soc. 2021, 64, 102519. [Google Scholar]
- ACI Committee 222. ACI 222R-19: Guide to Protection of Reinforcing Steel in Concrete against Corrosion; ACI: Farmington Hills, MI, USA, 2019. [Google Scholar]
- Coppola, L.; Buoso, A. Il Restauro Dell’architettura Moderna in Cemento Armato; Ulrico Hoepli Editore: Milano, Italy, 2015. [Google Scholar]
- Andrade, C. Propagation of reinforcement corrosion: Principles, testing and modelling. Mater. Struct. 2019, 52, 2. [Google Scholar] [CrossRef] [Green Version]
- Casprini, E. A Protocol for the Assessment of Corrosion Effects in RC Structures in a Life Cycle Engineering Framework. Ph.D. Thesis, University of Bergamo, Dalmine, Italy, 2021. [Google Scholar]
- EN 206:2013; Concrete-Specification, Performance, Production and Conformity. CEN: Brussels, Belgium, 2013.
- Çağatay, I.H. Experimental evaluation of buildings damaged in recent earthquakes in Turkey. Eng. Fail. Anal. 2005, 12, 440–452. [Google Scholar] [CrossRef]
- EN 14630; Products and Systems for the Protection and Repair of Concrete Structures—Test Methods—Determination of Carbonation Depth in Hardened Concrete by the Phenolphtalein Method. CEN: Brussels, Belgium, 2006.
- Felicetti, R. Improved Procedure for the Analysis of Construction Materials and Device to Implement This Procedure. Italian Patent Application MI2009A 001073, 17 June 2009. [Google Scholar]
- EN 14629; Products and Systems for the Protection and Repair of Concrete Structures—Test Methods—Determination of Chloride Content in Hardened Concrete. CEN: Brussels, Belgium, 2007.
- Herald, S.E.; Henry, M.; Al-Qadi, I.L.; Weyers, R.E.; Feeny, M.A.; Howlum, S.F.; Cady, P.D. Condition Evaluation of Concrete Bridges Relative to Reinforcement Corrosion. Volume 6: Method for Field Determination of Total Chloride Content; Strategic Highway Research Program, National Research Council: Washington, DC, USA, 1993. [Google Scholar]
- Jackson, D.R.; Soh, F.W.; Scannel, W.T.; Sohanghpurwala, A.A.; Islam, M. Comparison of chloride content analysis results using the AASHTO T260 test method and two field test kits. In Proceedings of the Corrosion95. The NACE International Annual Conference and Corrosion Show, Houston, TX, USA, 1 September 1995. [Google Scholar]
- Collepardi, M.; Marcialis, A.; Turriziani, R. Penetration of chloride ions in cement pastes and in concretes. J. Am. Ceram. Soc. 1972, 55, 534–535. [Google Scholar] [CrossRef]
- Berto, L.; Saetta, A.; Simioni, P. Structural risk assessment of corroding RC structures under seismic excitation. Constr. Build. Mater. 2012, 30, 803–813. [Google Scholar] [CrossRef]
- Martínez, I.; Andrade, C. Examples of reinforcement corrosion monitoring by embedded sensors in concrete structures. Cem. Concr. Compos. 2009, 31, 545–554. [Google Scholar] [CrossRef]
- RILEM. Durability Design of Concrete Structures; Report No. 14; E & FN Spon: London, UK, 1996. [Google Scholar]
- Casprini, E.; Passoni, C.; Marini, A.; Bartoli, G.; Gastaldi, M.; Riva, P. Effects of corrosion on the structural behaviour of existing structures: Corrosion Risk Scenarios and equivalent parameters. In Capacity Assessment of Corroded Reinforced Concrete Structures, Proceedings of the Fib CACRCS Days 2020, Online Event, 1–4 December 2020; International Federation for Structural Concrete: Lausanne, Switzerland, 2020. [Google Scholar]
- Tuutti, K. Corrosion of Steel in Concrete; Swedish Cement and Concrete Research Institute: Stockholm, Sweden, 1982. [Google Scholar]
- Val, D.V.; Melchers, R.E. Reliability of deteriorating RC slab bridges. J. Struct. Eng. 1997, 123, 1638–1644. [Google Scholar] [CrossRef]
- UK Highways Agency BA 51/95. The Assessment of Concrete Structures Affected by Steel Corrosion; The Stationery Office Ltd.: London, UK, 1995. [Google Scholar]
- Chen, E.; Berrocal, C.G.; Fernandez, I.; Lofgren, I.; Lundgren, K. Assessment of the mechanical behaviour of reinforcement bars with localised pitting corrosion by Digital Image Correlation. Eng. Struct. 2020, 219, 110939. [Google Scholar] [CrossRef]
- Walrawen, J. Significance of reinforcement corrosion for modelling the behaviour of existing concrete structures. In Proceedings of the CACRCS Days 2020, Online Event, 1–4 December 2020. [Google Scholar]
- Verderame, G.M.; Ricci, P.; Esposito, M.; Sansiviero, F.C. Le Caratteristiche Meccaniche Degli Acciai Impiegati Nelle Strutture in C.A. Realizzate dal 1950 al 1980. In Proceedings of the Atti del XXVI Convegno Nazionale AICAP Le Prospettive di Sviluppo Delle Opere in Calcestruzzo Strutturale Nel Terzo Millennio, Padova, Italy, 19–21 May 2011. [Google Scholar]
- Andrade, C. Approach to the residual strength of steel bars due to corrosion. In Proceedings of the Fib CACRCS Days 2021, Online Event, 30 November–3 December 2021. [Google Scholar]
- Palsson, R.; Mirza, M.S. Mechanical response of corroded steel reinforcement of abandoned concrete bridge. ACI Struct. J. 2002, 99, 157–162. [Google Scholar]
- Imperatore, S.; Rinaldi, Z.; Drago, C. Degradation relationship for the mechanical properties of corroded steel rebars. Constr. Build. Mater. 2017, 148, 219–230. [Google Scholar] [CrossRef]
- Apostolopoulos, C.A. The influence of corrosion and cross-section diameter on the mechanical properties of B500C steel. J. Mater. Eng. Perform. 2008, 18, 190–195. [Google Scholar] [CrossRef]
- Du, Y.G.; Clark, L.A.; Chan, A.H.C. Residual capacity of corroded reinforcing bars. Mag. Concr. Res. 2005, 57, 135–147. [Google Scholar] [CrossRef]
- Cairns, J.; Plizzari, G.A.; Du, Y.; Law, D.W.; Franzoni, C. Mechanical properties of corrosion-damaged reinforcement. ACI Mater. J. 2005, 102, 256–264. [Google Scholar]
- Vecchio, F.; Collins, M.P. The modified compression field theory for reinforced concrete elements subjected to shear. Proc. ACI 1986, 83, 219–231. [Google Scholar]
- Molina, F.J.; Alonso, C.; Andrade, C. Cover cracking as a function of rebar corrosion. II: Numerical model. Mater. Struct. 1993, 26, 532–548. [Google Scholar] [CrossRef]
- Cairns, J.; Millard, S. Section 13:2: Reinforcement corrosion and its effect on residual strength of concrete structures. In Proceedings of the 8th International Conference on Structure Faults and Repair, Edinburgh, UK, 1 January 1999. [Google Scholar]
- Castel, A.; Francois, R.; Arliguie, G. Mechanical behavior of corroded reinforced concrete beams. II: Bond and notch effects. Mater. Struct. 2000, 33, 545–551. [Google Scholar] [CrossRef]
- Casprini, E.; Passoni, C.; Marini, A.; Bartoli, G. Modelling corrosion effects in reinforced concrete Structural members through equivalent damage parameters. In Capacity Assessment of Corroded Reinforced Concrete Structures, Proceedings of the Fib CACRCS Days 2021, Online Event, 30 November–3 December 2021; International Federation for Structural Concrete: Lausanne, Switzerland, 2021. [Google Scholar]
- Blomfors, M.; Zandi, K.; Lundgren, K.; Coronelli, D. Engineering bond model for corroded reinforcement. Eng. Struct. 2018, 156, 394–410. [Google Scholar] [CrossRef]
- Coronelli, D.; Francois, R.; Dang, H.; Zhu, W. Strength of corroded RC beams with bond deterioration. J. Struct. Eng. 2019, 145, 04019097. [Google Scholar] [CrossRef]
- Imperatore, S.; Rinaldi, Z. Experimental behavior and analytical modeling of corroded steel rebars under compression. Constr. Build. Mater. 2019, 226, 126–138. [Google Scholar] [CrossRef]
- Tapan, M.; Aboutaha, R.S. Effect of steel corrosion and loss of concrete cover on strength of deteriorated RC columns. Constr. Build. Mater. 2011, 25, 2596–2603. [Google Scholar] [CrossRef]
- Campione, G.; Cannella, F.; Cavaleri, L.; Ferrotto, M.F. Moment-axial force domain of corroded R.C. columns. Mater. Struct. 2017, 50, 21. [Google Scholar] [CrossRef]
- Dizaj, E.A.; Madandoust, R.; Kashani, M.M. Probabilistic seismic vulnerability analysis of corroded reinforced concrete frames including spatial variability of pitting corrosion. Soil Dyn. Earthq. Eng. 2018, 114, 97–112. [Google Scholar] [CrossRef] [Green Version]
- Berto, L.; Caprili, S.; Saetta, A.; Salvatore, W.; Talledo, D. Corrosion effects on the seismic response of existing RC frames designed according to different building codes. Eng. Struct. 2020, 216, 110397. [Google Scholar] [CrossRef]
- Midas GEN. Software User Manual; MIDASoft Inc.: New York, NY, USA, 2020. [Google Scholar]


| Corrosion Stage | Bars and Concrete Condition | External Evidence | |
|---|---|---|---|
| ST0 |  | Absence of aggressive agents (CO2 or Cl−) Sound concrete Protected bars | None |
| ST1 |  | Penetration of aggressive agents in the concrete cover Sound concrete Protected bars | |
| ST2 |  | Aggressive agents at or beyond rebar depth Sound concrete Unprotected bars | |
| ST3 |  | Corrosion initiation Formation of corrosion products around bars filling concrete pores Sound concrete Corroding bars | None or rust staining |
| ST4 |  | Active corrosion Corrosion product expansion Cracking of concrete Possible delamination Corroding bars | None or swelling or rust staining |
| ST5 |  | Active corrosion Cracking of concrete to the concrete surface Possible spalling Corroding bars | Cracking in connection with main bars and possible rust staining |
| Code | Condition Detected |
|---|---|
| category A—Corrosion-induced deterioration | |
| A1 | Rust staining, rust spots |
| A2 | Transversal cracking in correspondence with stirrups |
| A3 | Longitudinal cracking in correspondence with main reinforcing bars |
| A4 | Concrete cover spalling |
| A5 | Concrete cover delamination |
| category B—Other deterioration mechanisms | |
| B1 | Biological colonisation |
| B2 | Efflorescence |
| B3 | Honeycomb |
| B4 | Cracking or spalling caused by other concrete degradation phenomena |
| category C—Areas exposed to contact with water or high R.H. | |
| C1 | High R.H. at concrete surface |
| C2 | Wet areas |
| C3 | Water run-off, leakage, infiltration |
| Scenario | 0 | 1 | 2 | 3 |
|---|---|---|---|---|
| Environmental exposure Exposure classes EN 206, 2013 [13] | Atmospheric Exposure (X0, XC1-2-3) | Atmospheric exposure + wet/dry cycles (XC4) | Atmospheric Exposure (XC3-4) | Infrastructure and/or marine exposure or industrial brine (XS1, XS3, XD1-2-3) |
| Presence of aggressive condition on the reinforcement surface | Always saturated by water or always dry or Non-carbonated w/o chloride or Carbonated + R.H. < 70% or Chloride (Cl−) + R.H. < 40% | Carbonated + R.H. > 70% | Carbonated + 0.1% < Cl− < 0.4% (with respect to cement weight) + R.H. > 50% | Cl− > 0.4% (with respect to cement weight) + R.H. > 40% |
| Test | Code of Reference | Instructions | Instruments Required |
|---|---|---|---|
| Chloride Content Analysis | EN 14629 [17] | Collect concrete powder samples at the locations of interest and execute chemical laboratory test. | Concrete powder (drill) |
| Chloride Penetration Depth | EN 14629 [17] | Extract a core or collect concrete powder in separate depth increments from the outer surface to bar level, and execute chemical laboratory tests. | Concrete core or concrete powder (drill or core-drill) |
| Collepardi, 1972 [20] | Not codified—spray fluorescein on a freshly broken concrete surface, followed by silver nitrate. Chloride-containing zones turn dark pink, whereas free chloride zones turn dark brown. | Fluorescein (1 g/L in a 70% solution of ethyl alcohol in water) + silver nitrate (0.1 mol/L AgNO3 solution) | |
| Carbonation Depth | EN 14630 [15] | Extract the core or the powder according to the method adopted and spray the indicator phenolphthalein on fresh concrete. Carbonated concrete does not change its colour, while non-carbonated concrete turns purple. | Concrete core + phenolphthalein or CARBONTEST© kit [16] |
| Concrete Cover Measurement | ACI 222R-19 [9] | Measure concrete cover at different locations to obtain an average value. | Cover meter and/or calibre |
| Scenario | 1 | 2 | 3 | |
|---|---|---|---|---|
| Corrosion Phenomenon | Carbonation-Induced Corrosion | Carbonation-Induced Corrosion + Cl− | Critical Cl− Threshold at Rebar Level | |
| Average corrosion rate vavg (µm/year) | CLASS O Ordinary R.H. (S2) or marine atmosphere (S3) | B: 2–10 | B: 10–50 | |
| E: 7 (0.20% Cl) | M: 4 | |||
| 10 (0.34% Cl) | R: 9–40 | |||
| REF: 2–10 | REF: 10–50 | |||
| CLASS H High R.H. (S1–S2), chloride airborne (S3) | B: 2–10 | B: 10–100 | B: 50–100 | |
| M: 2 | E: 24 (0.27% Cl) | M: 30 | ||
| R: 1–12 | R: 40-80 | |||
| E: 7 | ||||
| REF: 2–10 | REF: 10–50 | REF: 50–100 | ||
| CLASS E Alternation of very wet/dry environment (S1–S2) or zones of water stagnation, splash/tidal zone (S3) | B: 10–100 | B: 100–200 | B: 100–1000 | |
| M: 5 | M: 70 | |||
| R: 12–50 | R: 80–120 | |||
| E: 22–30 | E: 220 | |||
| REF: 10–50 | REF: 100–200 | REF: 100–300 | ||
| Maximum-to-average attack ratio Rp | M: 1 | E: 3.9–6.2 | M: 10 | |
| E: 1.3–1.9 | Tuutti: 4–8 | |||
| E: 3.2 | ||||
| REF: 1–2 | REF: 3–7 | REF: 4–10 | ||
| Maximum attack type on the bar length | Portion of the bar | Localised deeper attacks | Pitting | |
| Column | Aavg/A0 (%) | Amin/A0 (%) | K (mm/years1/2) | Ti (years) | Tc (years) | vavg (µm/year) | Rp |
|---|---|---|---|---|---|---|---|
| SB1 | 86.8 | 72.3 | 12.8 | 7.5 | 53.5 | 6.6 | 6.12 |
| SB2 | 83.2 | 57.4 | 11.5 | 15.2 | 45.8 | 9.4 | 4.83 |
| Column | Aavg/A0 (%) | Amin/A0 (%) | K (mm/years1/2) | Ti (years) | Tc (years) | vavg (µm/year) | Rp |
|---|---|---|---|---|---|---|---|
| RB1 | 89.9 | 80.6 | 5.7 | 7 | 43 | 24 | 3.96 |
Publisher’s Note: MDPI stays neutral with regard to jurisdictional claims in published maps and institutional affiliations. |
© 2022 by the authors. Licensee MDPI, Basel, Switzerland. This article is an open access article distributed under the terms and conditions of the Creative Commons Attribution (CC BY) license (https://creativecommons.org/licenses/by/4.0/).
Share and Cite
Casprini, E.; Passoni, C.; Marini, A.; Bartoli, G. DEMSA Protocol: Deterioration Effect Modelling for Structural Assessment of RC Buildings. Buildings 2022, 12, 574. https://doi.org/10.3390/buildings12050574
Casprini E, Passoni C, Marini A, Bartoli G. DEMSA Protocol: Deterioration Effect Modelling for Structural Assessment of RC Buildings. Buildings. 2022; 12(5):574. https://doi.org/10.3390/buildings12050574
Chicago/Turabian StyleCasprini, Elena, Chiara Passoni, Alessandra Marini, and Gianni Bartoli. 2022. "DEMSA Protocol: Deterioration Effect Modelling for Structural Assessment of RC Buildings" Buildings 12, no. 5: 574. https://doi.org/10.3390/buildings12050574
APA StyleCasprini, E., Passoni, C., Marini, A., & Bartoli, G. (2022). DEMSA Protocol: Deterioration Effect Modelling for Structural Assessment of RC Buildings. Buildings, 12(5), 574. https://doi.org/10.3390/buildings12050574