Article

Experimental and Analytical Investigation of Bond Behavior of Deformed Steel Bar and Ultra-High Performance Concrete

1
College of Civil Engineering, Hunan University, Changsha 410082, China
2
School of Civil Engineering and Architecture, Xinjiang University, Urumqi 830000, China
3
Hunan Provincial Key Laboratory on Damage Diagnosis for Engineering Structures, College of Civil Engineering, Hunan University, Changsha 410082, China
*
Author to whom correspondence should be addressed.
Buildings 2022, 12(4), 460; https://doi.org/10.3390/buildings12040460
Submission received: 23 February 2022 / Revised: 22 March 2022 / Accepted: 30 March 2022 / Published: 8 April 2022
(This article belongs to the Special Issue Structural Health Monitoring of Buildings, Bridges and Dams)

Abstract

:
Ultra-high performance concrete (UHPC) has been demonstrated to be a realistic alternative to less maintenance and significantly longer service life due to its better mechanical properties and low permeability. The bond performance of the deformed steel bar embedded in UHPC is critically important for the safety of the UHPC structures. This paper conducted an experimental investigation on the bond behavior of deformed steel bars and UHPC. The impacts of loading method, UHPC strength, steel fiber type and content, rebar diameter, and cover thickness were studied. The testing results revealed that the specimens failed in three modes: pull-out, splitting + pull-out, and cone failure. The main factors affecting the bond strength are UHPC compressive strength, cover thickness, and fiber characteristics. The peak slip of rebar-UHPC increases with cover thickness and rebar diameter. Finally, an analytical model of the bond stress-slip relationship between the UHPC and deformed steel bar is obtained, which is in suitable agreement with the test results.

1. Introduction

Ultra-high performance concrete (UHPC) has ultra-high strength, toughness, and excellent durability [1], which is suitable for new construction, structural strengthening [2], and restoration projects such as high-rise buildings, long-span bridges [3], and ultra-thin building components [4,5]. The excellent impermeability and very high density of UHPC prevent the penetration of corrosive substances [6], providing better corrosion protection for steel reinforcement, extending the service life of concrete structures, and reducing maintenance costs [7]. With the development of precast concrete structures, UHPC is widely used in joints to improve the overall performance of the structures [8,9]. The bond property between rebar and UHPC is the premise of the two materials working together. It also has an essential influence on the structural load-bearing capacity, stiffness, and crack control.
Compared with normal-strength concrete and fiber reinforced concrete, the particular material properties of UHPC will inevitably lead to changes in the bond property between rebar and UHPC [10]. First of all, the UHPC component does not contain coarse aggregate, and the optimized particle gradation makes it have a compact internal structure. The interface with the rebar is contacted more closely, and the chemical bonding force between the two is enhanced. Secondly, the mechanical interlocking between rebar and UHPC is improved due to the material’s ultra-high compressive strength and elastic modulus. Finally, steel fibers in the UHPC restraint the crack development. When the steel fiber content reaches 1.5–2%, the UHPC shows strain hardening characteristics [11], which positively improves the mechanical interlocking and friction between the rebar and UHPC.
Bond strength and peak slip are the key parameters to study the bond behavior between rebar and UHPC. Fehling et al. [12] conducted a pull-out test on rebars with a diameter of 12 mm. They found that increasing the cover thickness would increase the bond strength of UHPC and discussed the influence of cover thickness on the bond failure mode. Yoo et al. [11] concluded that the compressive strength of UHPC was the critical factor determining the bond strength. Marchand et al. [13] studied the bond performance of rebar embedded in UHPC through monotonic and cyclic loading. They proposed a bond strength formula considering two main factors: compressive strength and cover thickness. Alkaysi et al. [14] found that when the fiber content changed from 1 to 2%, the bond strength increased by 36%. Sturm and Visintin [15] concluded that the bond property was insensitive to the types of the steel fiber, and the main factors were the compressive strength and the cover thickness. Hu et al. [16] showed that the rebar-UHPC bond strength only increased by 0.2% when the fiber volume content varied from 1 to 3%. In the existing studies on rebar-UHPC bond strength, there are no unified conclusions on the influence of fiber content, and there are few studies concerning the effect of fiber type on bond strength.
The bond strength will be affected by the diameter of the rebar, which is the “size effect” in bond performance [17,18,19,20,21]. Kook et al. [22] concluded that the bond strength of rebar-UHPC could be effectively improved by increasing the strength grade of rebar, while the bond strength decreased with the increase in rebar diameter (16–22 mm). Lagier et al. [23] conducted direct tension pull-out tests on specimens with large-diameter rebars (25 and 35 mm) and UHPC. They concluded that there was no noticeable size effect on bond strength. Most of the previous research on the bond performance of rebar-UHPC did not consider the size effect. Previous tests [16,24,25,26] provide a limited amount of data. Because the size of the specimen is not proportional to the diameter of the steel bar, these tests cannot clearly show the size effect.
The peak slip su has an essential effect on the stiffness of the rising segment of the bond-slip curve. Existing studies have shown that concrete compressive strength, cover thickness, stirrup, fiber content and type, rebar diameter, and rib spacing affect the peak slip [27]. Therefore, Murcia-Delso et al. [28] suggested determining the peak slip through specific tests. Still, it should be estimated through an empirical formula when the test data cannot be obtained. Based on the bond test between rebar and HPFRCC, Chao et al. [29] concluded that the peak slip was directly proportional to the peak bond stress but inversely proportional to the matrix material’s compressive strength and rebar diameter. Sturm and Visintin [15] conducted the pull-out test of UHPFRC. They found that the fiber content had no effect on the peak slip, and su was closely related to the cover thickness and compressive strength. Wu and Zhao [30] concluded that the peak slip is mainly related to the cover thickness and stirrup content through regression analysis of normal-strength reinforced concrete data. Xu [31] believed that the peak slip was associated with the rebar diameter based on many pull-out tests. Murcia-Delso et al. [28] found that the peak slip is related to the rebar diameter, which is about 0.07db, through the bond test of large-diameter rebars (36, 43, and 57 mm). Zhao and Zhu [32] proposed that the peak slip su is 0.07442db–0.00093db2. At present, most studies on the peak slip of rebars are focused on normal-strength concrete. Therefore, the survey on the peak slip of rebar-UHPC needs to be carried out.
Local bond-slip relationships significantly influence the bearing capacity, stiffness, and deformation capacity of reinforced concrete structures [27,30,33]. The bond stress-slip constitutive model is obtained based on the regression analysis of many test data. However, the bond stress-slip curves are also quite different due to the complex bonding mechanism and differences in test conditions [34,35,36,37,38,39,40]. According to the author’s knowledge, Marchand [13], Yoo [11], and Sturm and Visintin [15] studied the bond-slip relationship between rebar and UHPC. Zhou [41] analyzed the bond-slip behavior of epoxy-coated rebar embedded in UHPC. Marchand [13] and Yoo [11] proposed an ascending section of the bond-slip relationship between rebar and UHPC. Due to the discreteness of test data, the proposed bond-slip constitutive model did not discuss the descending branch. Sturm and Visintin [15] proposed two types of bond-slip models for pull-out and splitting failure modes, respectively. In conclusion, the descending branch of the bond-slip models for UHPC is unclear and needs to be investigated [41].
This study aims to conduct pull-out tests to provide the bond properties of deformed rebars in UHPC. Considering the influence of compressive strength, fiber content, fiber type, cover thickness, rebar diameter, and rebar yield strength, we quantified the bond strength and peak slip for deformed rebars in UHPC. We also compared the influence of the loading method on the bond property. In addition, we proposed the local bond stress-slip constitutive model of rebar in UHPC.

2. Experimental Program

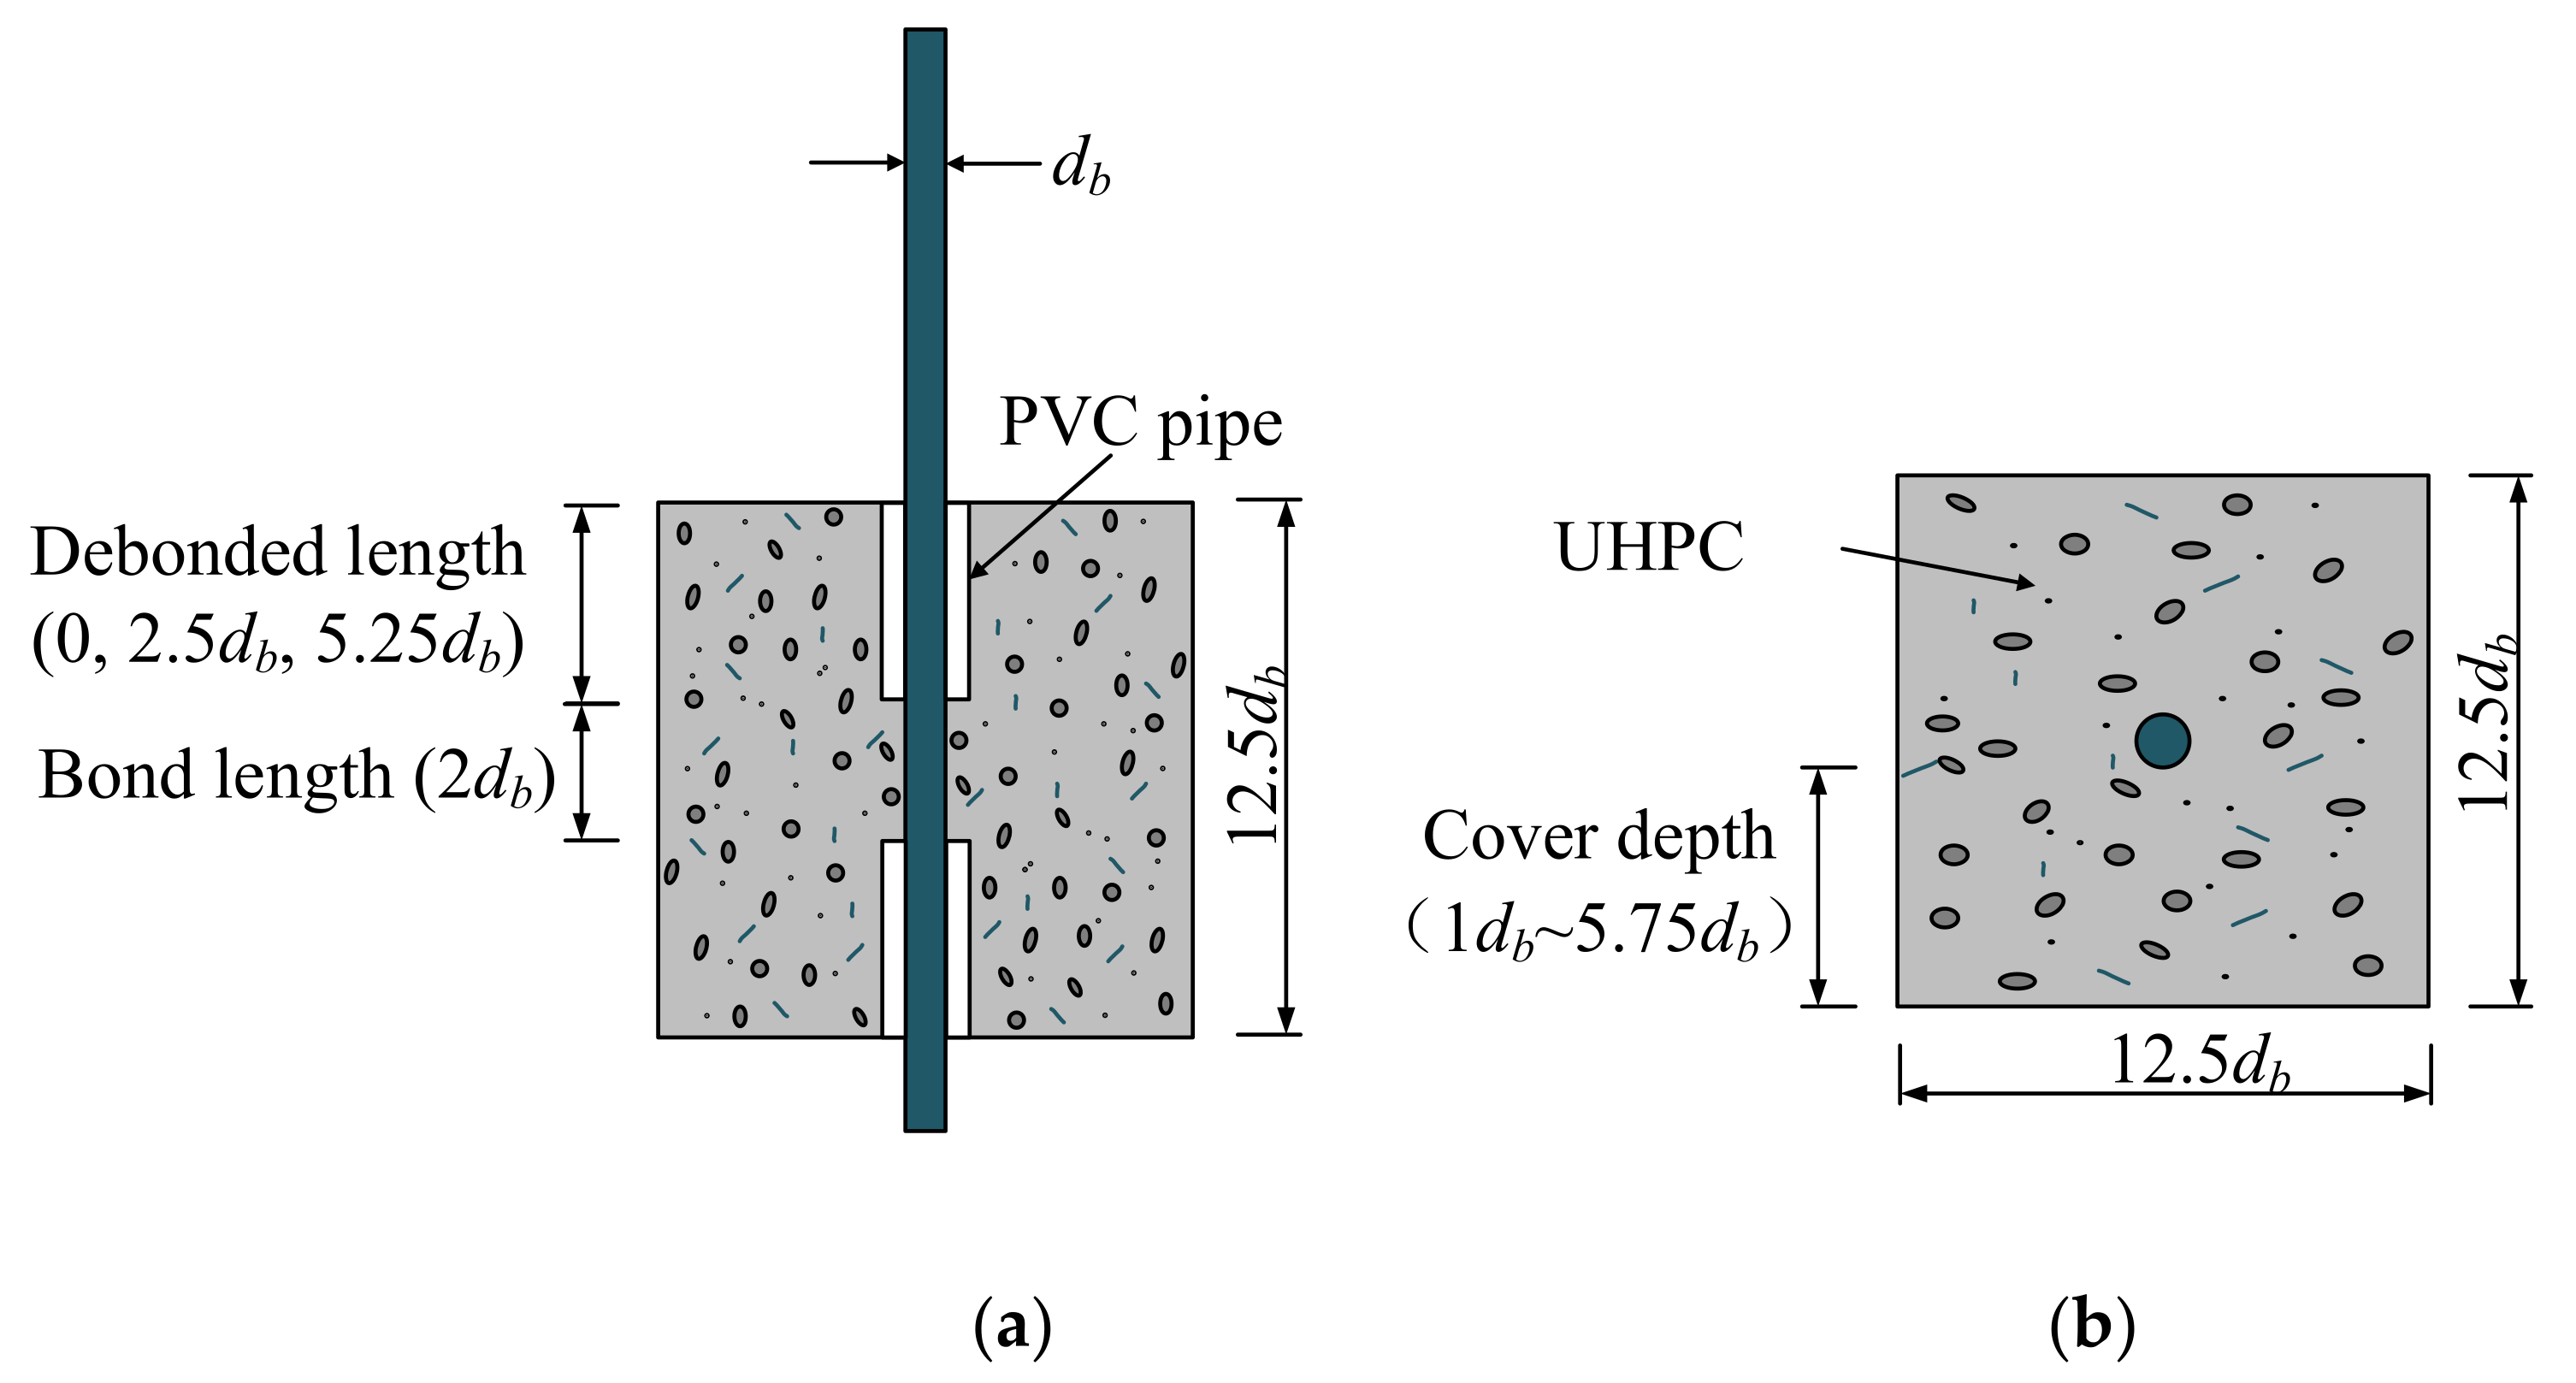
2.1. Specimen Details

A total of 69 pull-out specimens were tested in this research. The range of design variables and details of the specimens were listed in Table 1 and Table 2, respectively. The bond length was twice the rebar diameter to ensure the pull-out failure and obtain a relatively uniformly distributed bond stress [11,15]. The specimen geometry is shown in Figure 1. A PVC pipe at the loading end debonds the rebar from UHPC to avoid local failure.
All test parameters and specimen numbers are shown in Table 2.
The specimens are numbered according to the tested parameters. For example, UD-S02B-6D16C5-P5: UD represents the compressive strength of the UHPC curing period of 28 days. In S02B, S represents straight steel fiber, 02 represents fiber volume content of 2%. B represents the aspect ratio of 65. 6 in 6D16C5 means that the rebar yield strength is 680 MPa, D16 means that the rebar diameter is 16 mm, and C5 means that the cover thickness is 5.75 times the diameter of the rebar. P5 represents the traditional pull-out test, and the debonded length is 84 mm (5.25db).
According to GB/T 31387-2015 [42], the UHPC compressive strength was tested from a cubic block with a side length of 100 mm. The UHPC tensile strength was obtained from the dog-bone specimen shown in Figure 2b. The UHPC compressive and tensile strength are listed in Table 2.
Each result is the mean of three specimens. The first half of Table 2 (up to UD-H02B-6D16C5-P5) contains the test variables of compressive strength, fiber volume content, and fiber type related to the UHPC properties. Therefore, the UHPC compression and tensile strength results are different for these groups. The UHPC properties of the other test groups, including cover thickness, rebar diameter, rebar yield strength, loading method, and debonded length, were identical.

2.2. Materials Properties

The mix proportion design of UHPC is listed in Table 3. To improve the workability of the mixture, we used a polycarboxylic acid superplasticizer [43].
Four kinds of brass-coated steel fibers were used in the experiment (Hunan Guli Engineering New Materials Co., Ltd., Changsha, China), including three straight steel fibers and one hooked steel fiber. The straight steel fibers have different aspect ratios, which were identified as steel fiber A (SFA), steel fiber B (SFB), steel fiber C (SFC). The hooked steel fiber B was numbered as HFB. The steel fibers are pictured in Figure 3 (length of the fiber, Lf; diameter of the fiber, df). The fiber characteristic parameters are listed in Table 4.
Hot-rolled deformed steel bars (HRB) were used in the pull-out test. Rebar grades HRB400, HRB500, and HRB600 were used based on GB/T 1499.2-2018 [44]. The surface shape of the deformed rebar is shown in Figure 4. Table 5 summarizes the mechanical properties and geometric characteristics of the rebar.

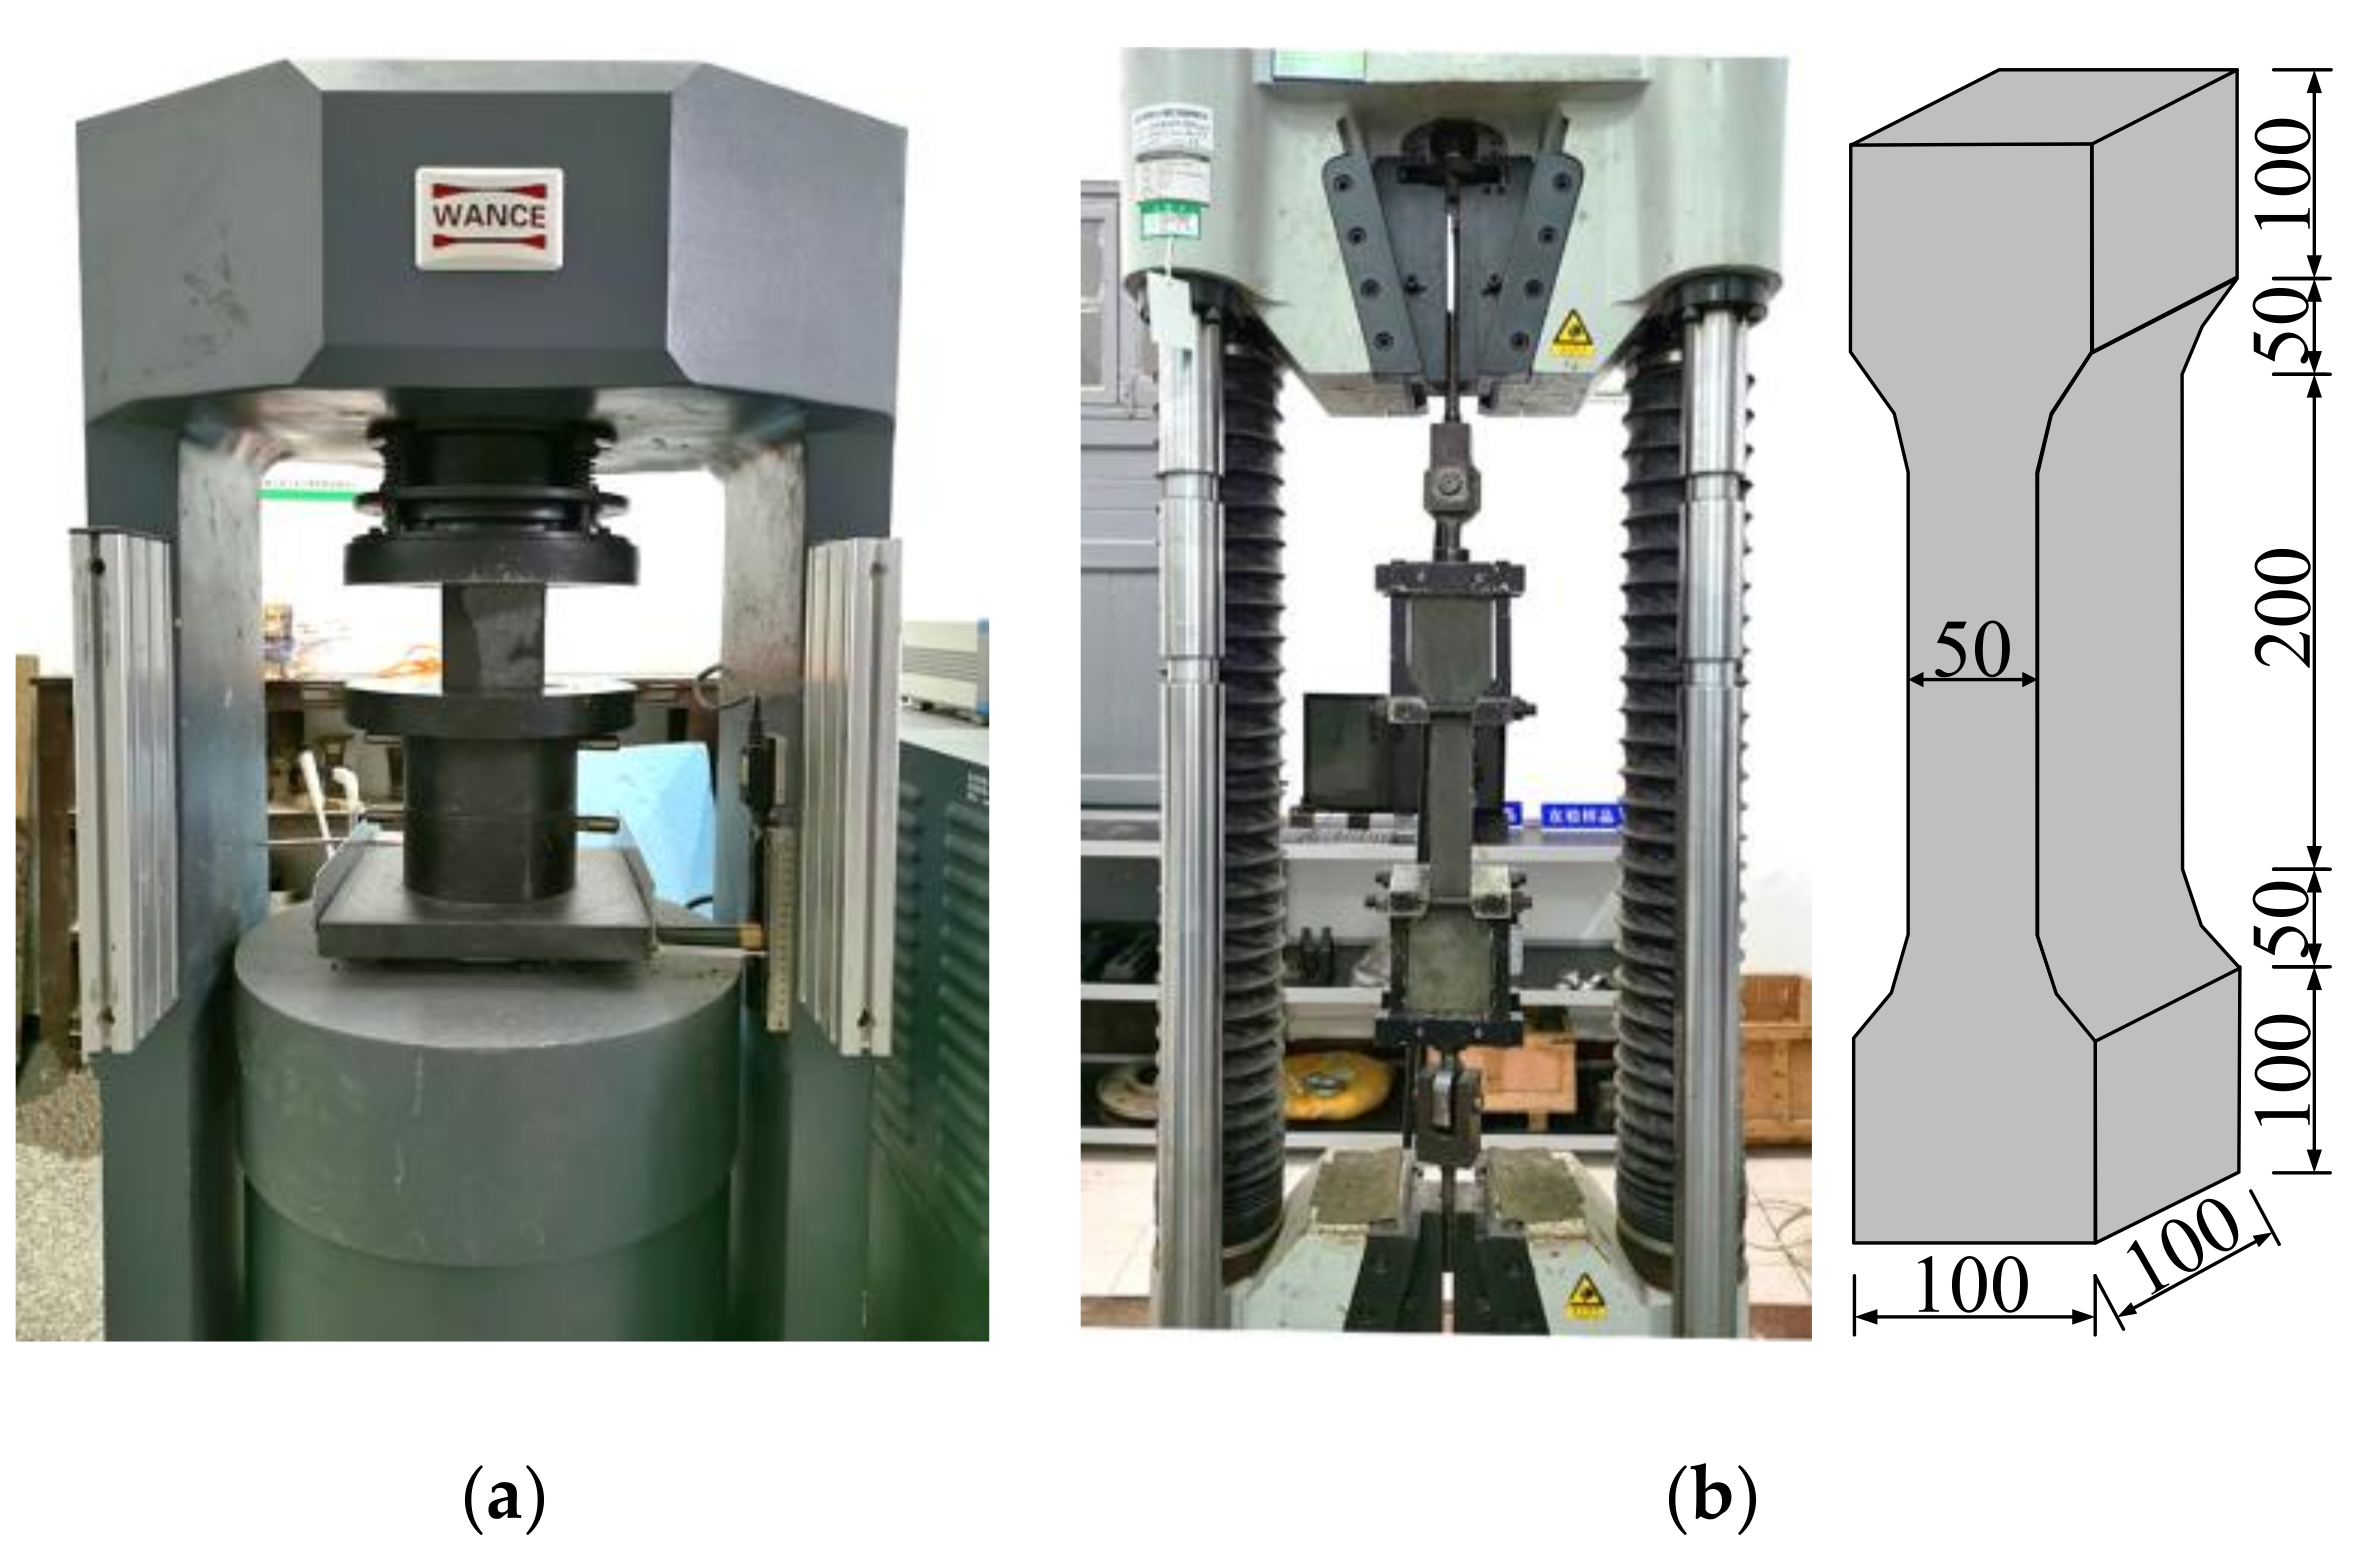
2.3. Test Setup and Loading Scheme

Two experimental setups were used in the study, namely the traditional pull-out setup and the revised pull-out test setup. The traditional pull-out test in Figure 5a [45] was used to investigate the effect of various factors on the bond performance of rebar-UHPC in this paper. A 20 mm-thick steel plate and a 5 mm-thick rubber plate were placed between the hydraulic jack and the specimen. The surrounding concrete behind the rubber plate forms compression struts while loading [46]. The revised pull-out test is shown in Figure 5b. A steel bracket was placed on the specimen to eliminate the compression strut reaction of the concrete. Both the rebar and the surrounding UHPC were in tension [14]. By changing the distance from the reinforcement bonded part to the loading end, namely the debonded length, the effects of the two loading methods on the bond performance of the rebar-UHPC interface were compared. Strain gauges were attached to the reinforcing bars near the loading end to monitor steel yielding. Two linear displacement transducers (LVDTs) were arranged at the free end of the specimen to measure the relative slip between the rebar and UHPC.
The tensile load was applied with a step of 2 kN until ultimate load, then a displacement load of 0.2 mm was applied per level until the slip reached 20 mm.

3. Results and Discussion

3.1. Bond Capacity Parameters
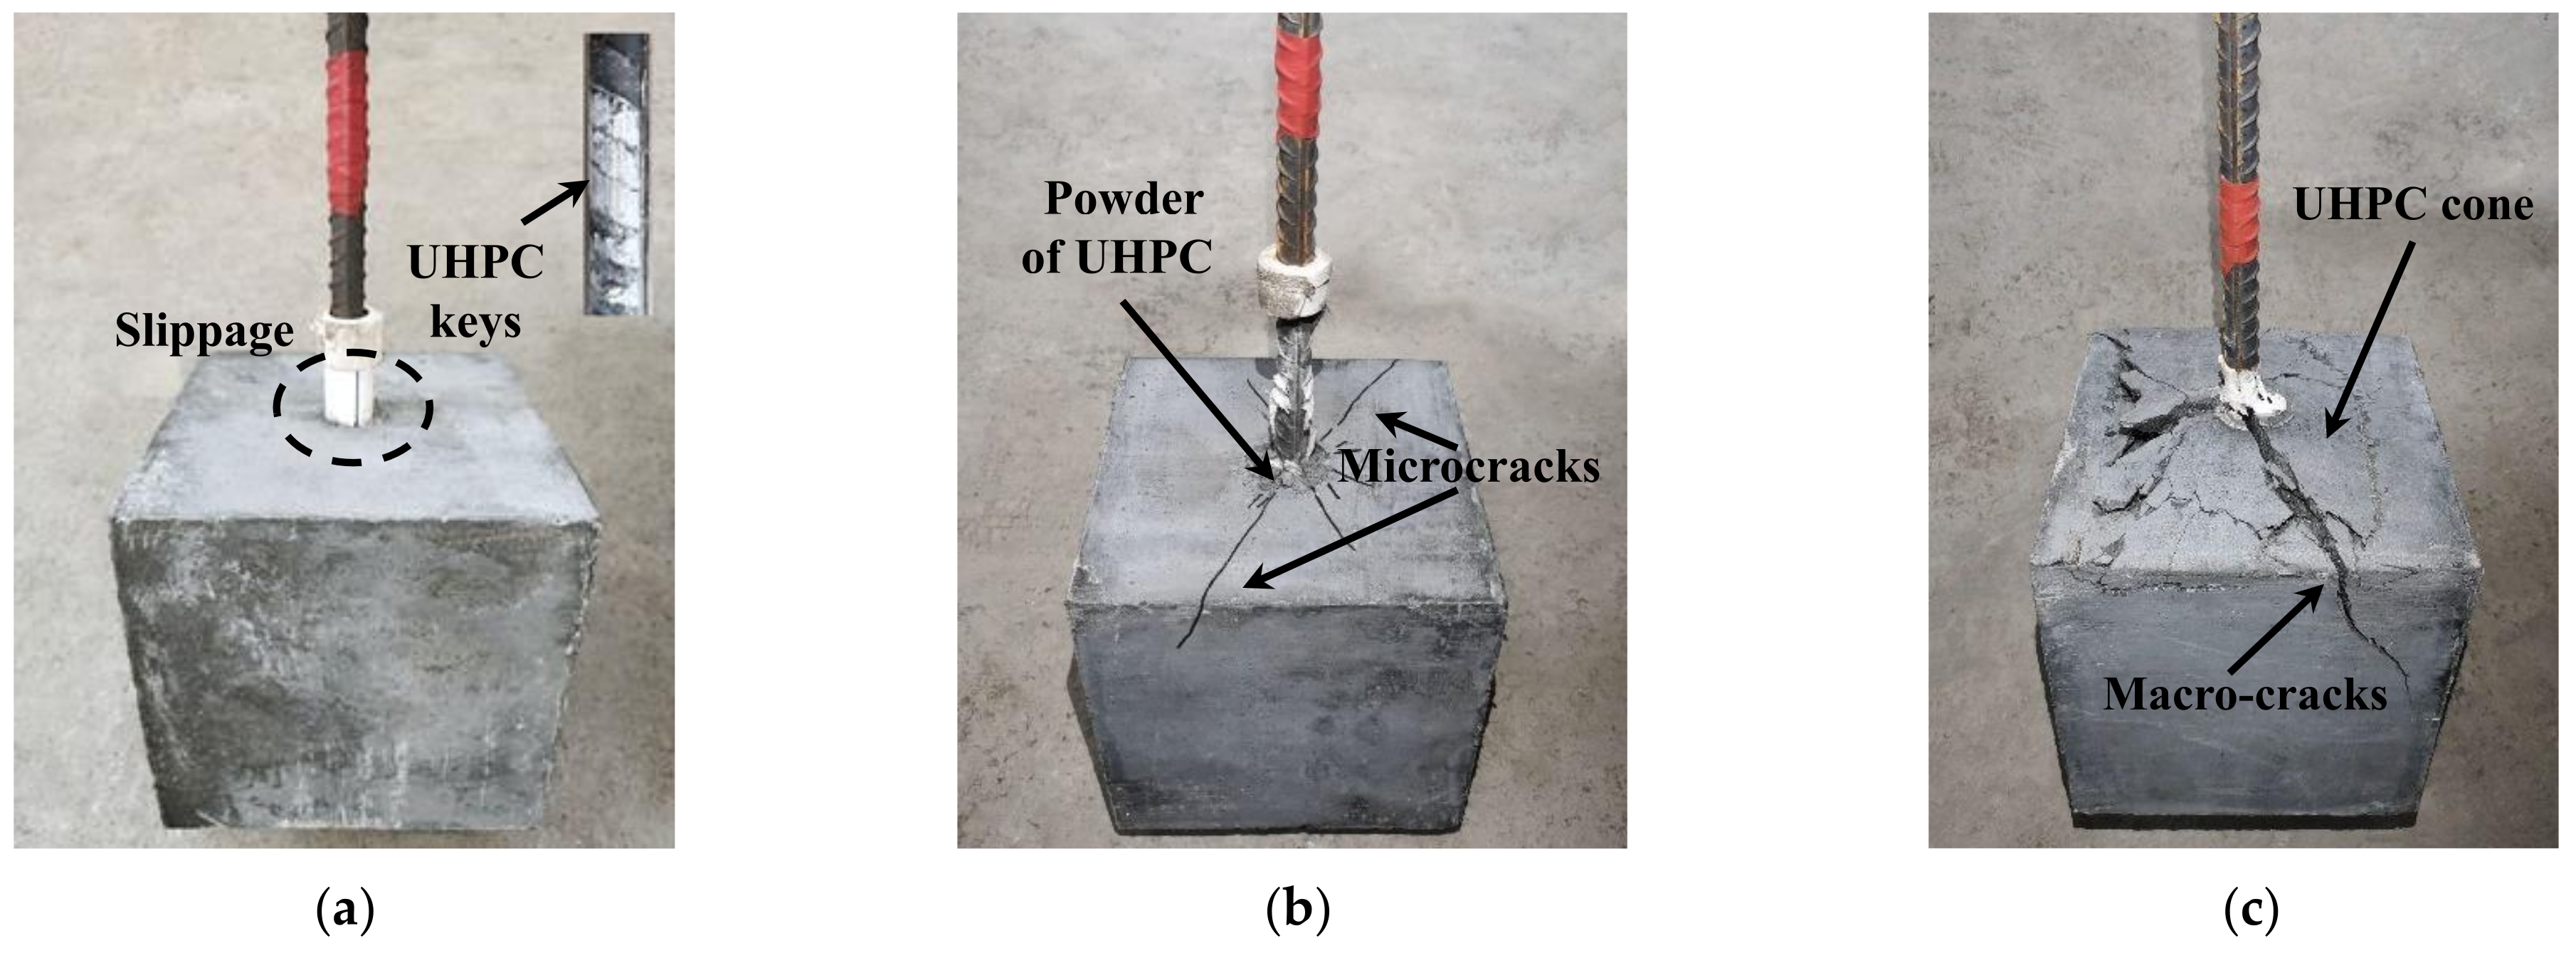
The average bond stress between the rebar and the UHPC interface was calculated as follows:
τ = F π d b l d
where τ is the average bond stress, F is the axial pull-out load, db is the rebar diameter, and ld is the bond length.
The relative slip s of the steel bar and UHPC interface was obtained as follows:
s = s 1 + s 2 2
where s1 and s2 are the slip measured by LVDT#1 and LVDT#2, respectively. Free end slip was measured to eliminate the effect of elastic deformation of the reinforcement.
Bond toughness is a measure of energy dissipation in the process of bond-slip, which was calculated as the area under the bond-slip curve corresponding to the target slip as follows:
A i = 0 s i τ d s
where si is the target slip, selected as the peak slip, and the slips corresponding to 80% and 50% of the post-peak bond stress.
The peak bond stress τu, peak slip su, peak bond toughness Ap, post-peak bond toughness A80 and A50 mean the areas under the bond stress-slip curves when post-peak stress drops to 80% and 50% of the peak bond stress, respectively, are listed in Table 6.

3.2. Failure Mode

Three prevailing types of bond failure can be observed in Figure 6. There were pull-out failure, splitting + pull-out failure, and concrete cone failure. Because the embedment length is only two times the bar’s diameter to prevent a rupture of the rebar before pull-out failure [11], there was no rebar fracture failure in this study. The failure modes of all specimens are listed in Table 6.
For the traditional loading specimens, the ribs of the tensile rebar cut the UHPC around, resulting in pull-out failure. No cracks were observed on the surface of the specimens, as shown in Figure 6a. However, when the bonded part closed to the loading end, radial splitting microcracks were observed on the surface of the specimen near the loading end, resulting in a slip of rebar followed by splitting of UHPC, as shown in Figure 6b. The specimens suffered cone failure, and a significant drop in bond resistance occurred for the revised pull-out specimens when the bonded part was located at the loading end, as shown in Figure 6c.

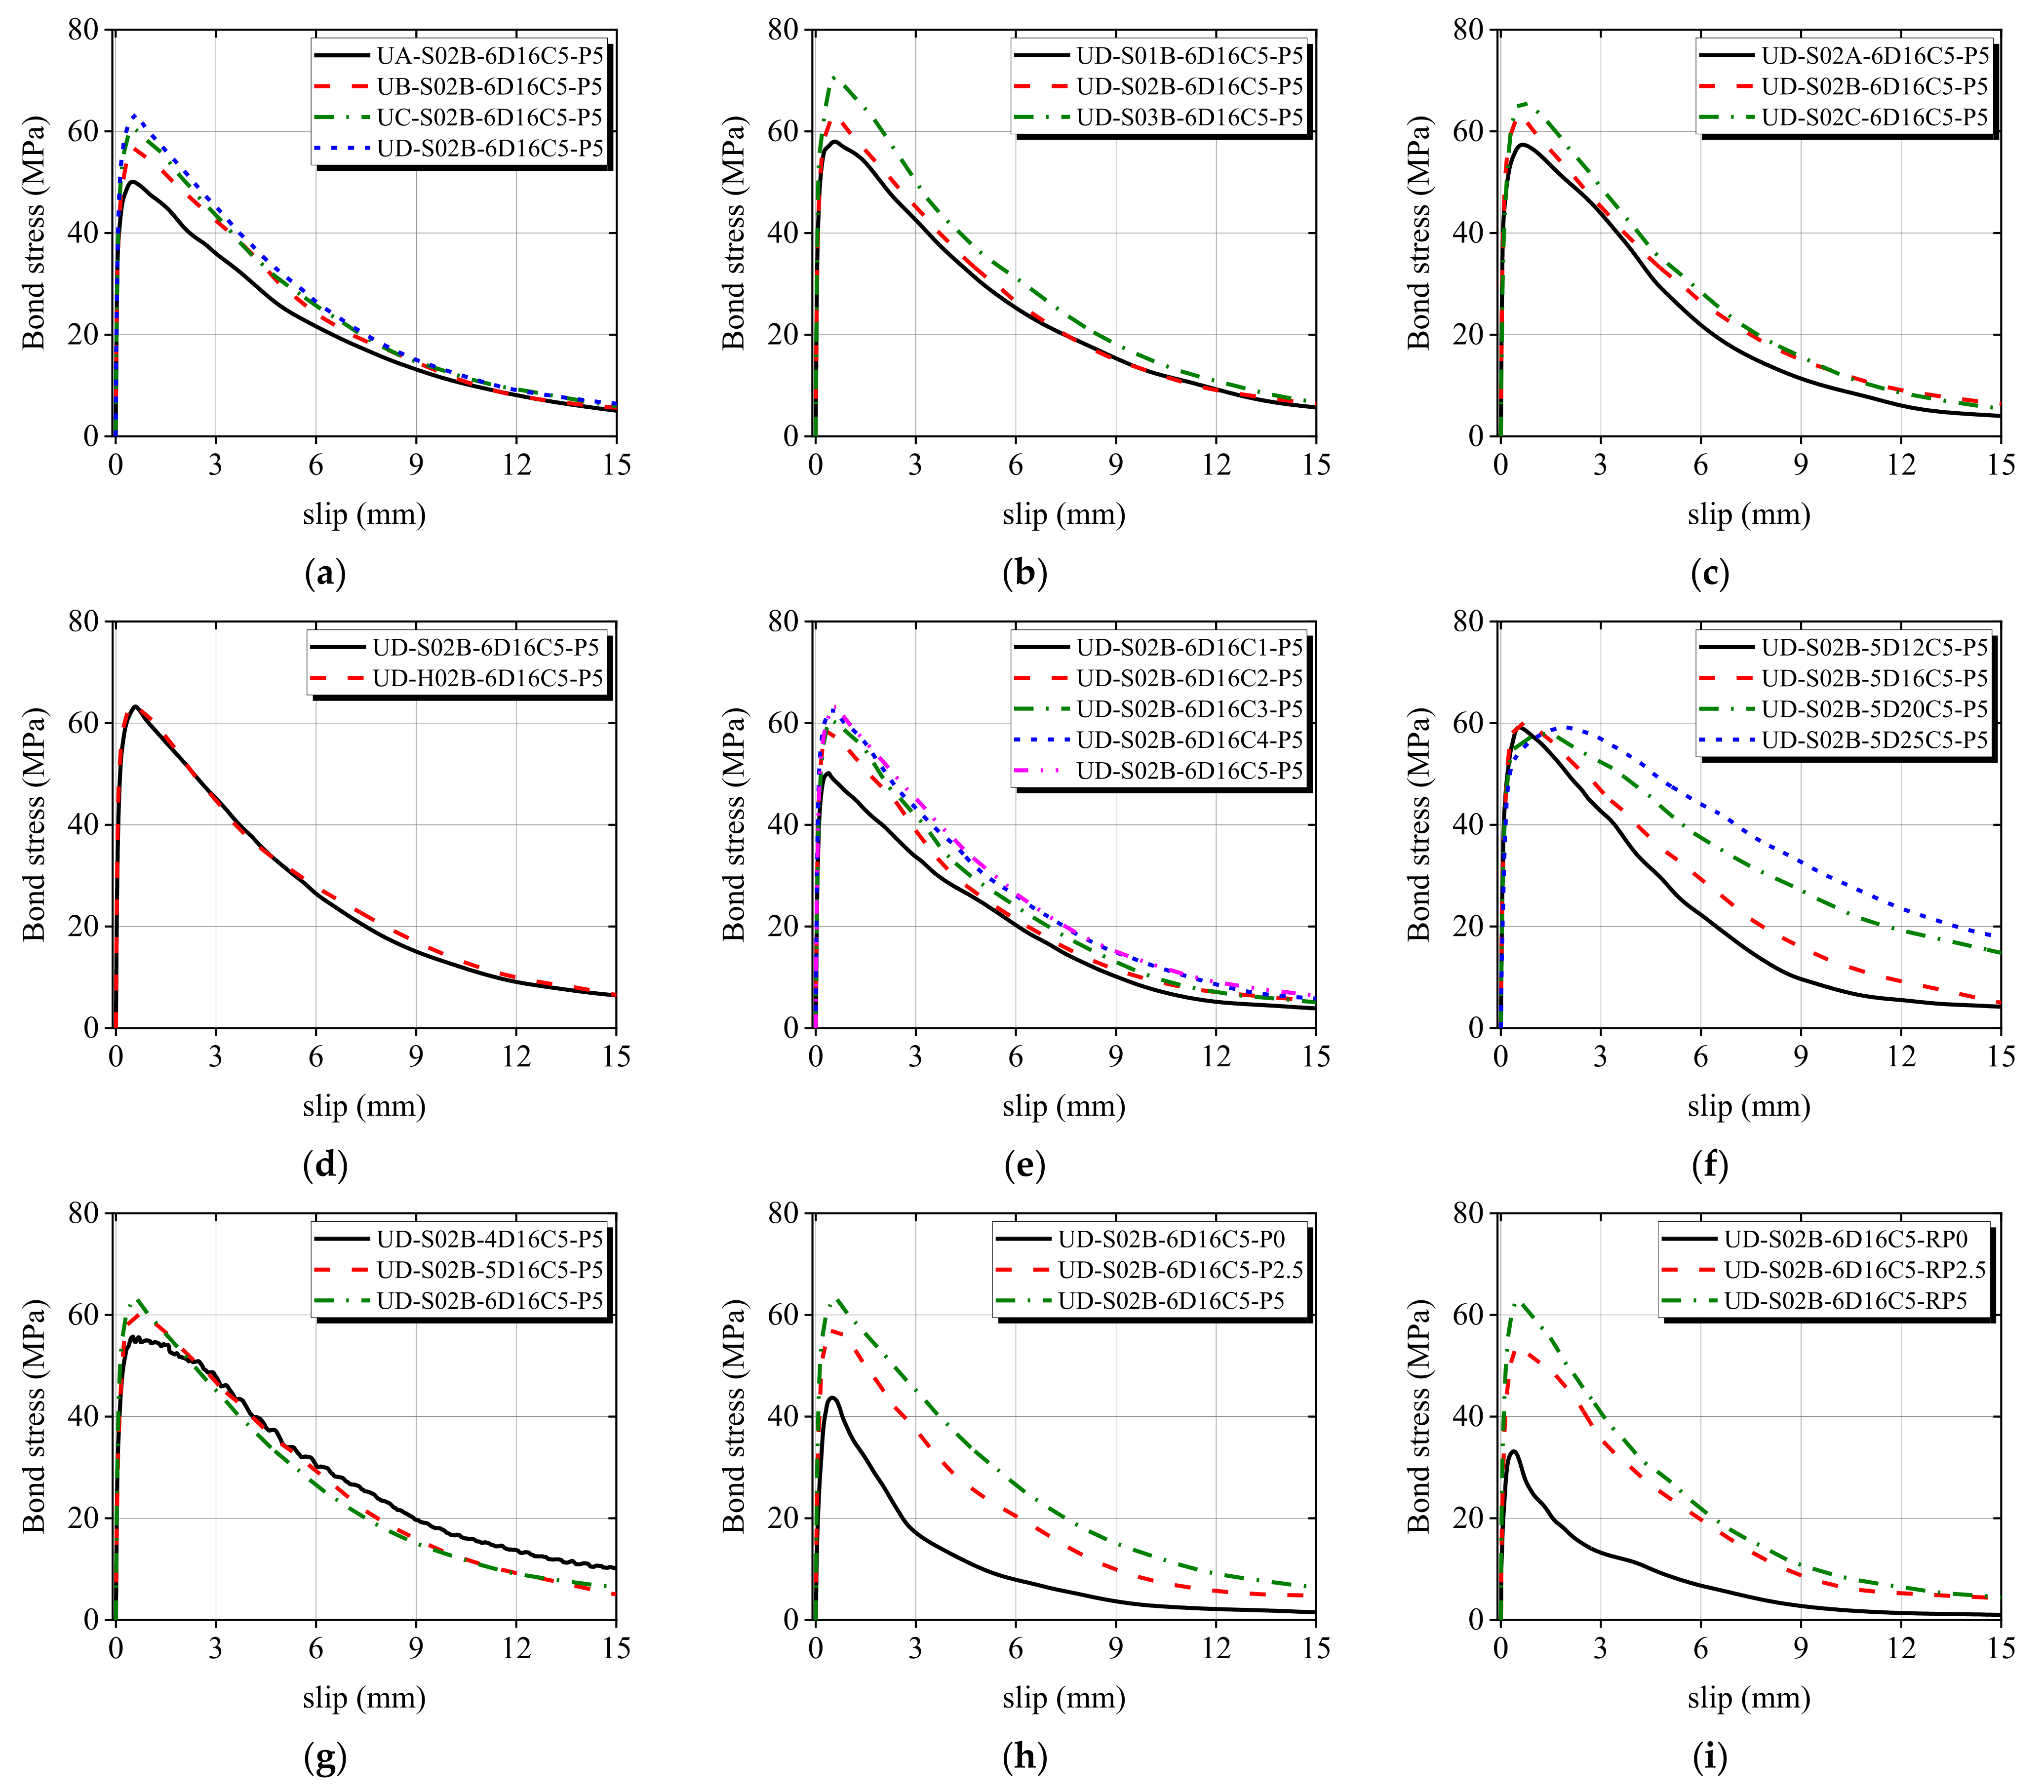
3.3. Bond Stress-Slip Curves

The bond-slip curves for steel rebar in UHPC are shown in Figure 7, divided into three stages: Firstly, the bond stress is gradually transferred from the loading end to the free end at the beginning of loading. At this stage, all specimens exhibit approximately linear bond-slip behavior. However, its practical application is restricted because this stage is limited compared to the entire bond-slip curve. Secondly, the mechanical interlocking force gradually replaced the chemical bonding force with the load increase. The interface near the loading end generates local debonding, which progresses to the free end, where the UHPC between the steel ribs is further squeezed, and sliding occurs. As a result, the stiffness of the ascending branch diminishes and exhibits nonlinear behavior until the peak load. Finally, the slip increases rapidly with the decrease in the load until the failure of the specimen. The resisting force mainly includes friction rather than aggregate interlocking forces because the UHPC has no coarse aggregate.

3.4. The Effects of Parameters on Bond Behavior

3.4.1. Compressive Strength
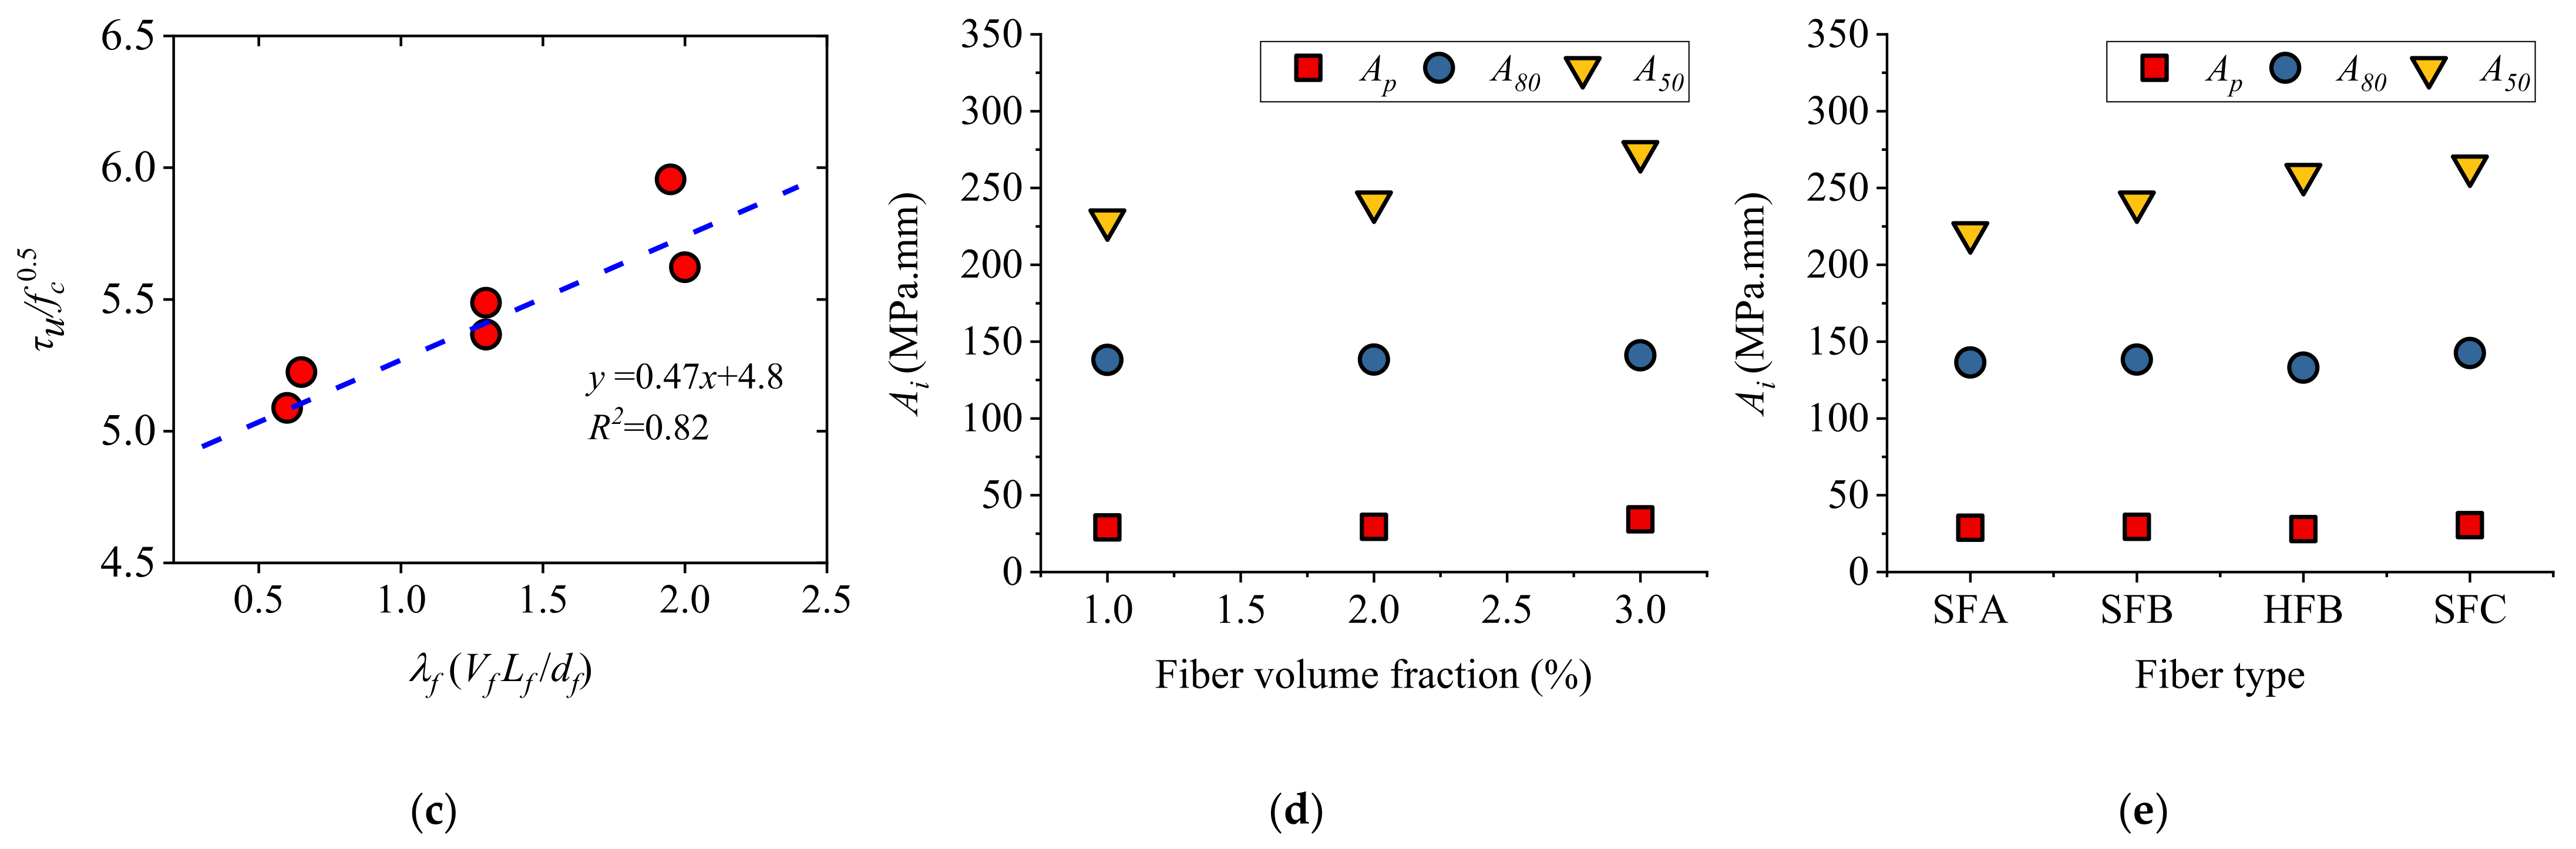
The influence of compressive strength on the rebar-UHPC bond property is shown in Figure 8. The most significant factor affecting the bond strength is the concrete compressive strength. The contribution of concrete to bond strength can be described as a power of compressive strength (fc0.25~0.75) [35,47]. Based on the test results, an excellent linear correlation between τu and fc0.5 (R2 = 0.99) was obtained, consistent with Alkaysi and El-Tawil’s findings [14].
Figure 8b shows that the increase in compressive strength of UHPC improves the bond toughness. When the compressive strength increased from 98.34 to 139.82 MPa, Ap, A80, and A50 increased by 27.6%, 37.6%, and 24.9%, respectively.

3.4.2. Steel Fiber

The influence of steel fiber on rebar-UHPC bond property is shown in Figure 9. The increase in fiber volume content can significantly improve the bond strength. When the fiber volume content increased from 1% to 3%, the bond strength increased by 22.7% (Figure 9a). The reason is that the increase in steel fiber can improve the compressive capacity of UHPC and inhibit the microcracks in the specimen to enhance the bond performance [48].
The bond strength also increased with the steel fiber aspect ratio. When the aspect ratio of steel fiber raised from 30 to 100, the bond strength increased by 15.5% (Figure 9b). The bond strength of the specimens with the hook steel fiber has no significant difference from the straight steel fiber.
A fiber characteristic factor λf (λf = Vf × Lf/df) was proposed to evaluate the effects of fiber volume content and aspect ratio [49]. The increase in fiber characteristic factors, such as fiber volume content or aspect ratio, can improve fiber bridging effectiveness and, consequently, bond strength [38,50]. The bond strength is plotted against the fiber characteristic factor λf in Figure 9c. The bond strength and the fiber characteristic factor have a linear relationship (R2 = 0.82).
As shown in Figure 9d, with fiber volume content from 1% to 3%, the bond toughness AP, A80, and A50 increased by 17.8%, 2.2%, and 19.4%, respectively. As shown in Figure 9e, the bond toughness AP, A80 were almost unchanged with the fiber aspect ratio. However, A50 grew with the fiber aspect ratio. The reason is that the larger fiber aspect ratio plays a more significant role in preventing microcracks.

3.4.3. Cover Thickness

The influence of cover thickness on the bond performance of rebar-UHPC is shown in Figure 10. The pull-out failure occurred in all specimens in the concrete cover group. The bond strength increased by 17.6% when the cover thickness increased from 16 to 32 mm. After that, the bond strength changed little. Marchand et al. [13] concluded that when the cover thickness is greater than 4db, its effect on bond strength can be ignored.
The peak slip raised with the increase in the cover thickness. The peak slip increased by 43.6% when the cover thickness increased from 1db to 5.75db. Wu and Zhao [30] demonstrated that increasing the cover thickness impacts the ascending branch of the bond-slip curve, resulting in increased peak slip by evaluating a database of plain concrete. The rise of Ap, A80, and A50 is 73.1%, 47.1%, and 34.5%, respectively, when the cover thickness increased from 1db to 5.75db. The reason is that increasing the cover thickness eliminates circumferential tensile stresses on the concrete surface, prevents the development of microcracks inside the specimen [51], and delays the premature concrete cracking, consequently improving the bond performance of the rebar-UHPC interface.

3.4.4. Rebar Diameter

The influence of rebar diameter on the bond performance is shown in Figure 11. The bond strength remained almost unchanged with the rebar diameter, indicating that the size effect of rebar on bond strength was negligible.
The peak slip increased with the rebar diameter. When the rebar diameter increased from 12 to 25 mm, the peak slip increased by 276.4%. The bond toughness also increased significantly with the rise of the rebar diameter. The Ap, A80, and A50 of the specimen with 25 mm rebar were 342.9%, 115.6%, and 112.0% higher than the 12 mm rebar, respectively.

3.4.5. Rebar Yield Strength

The influence of the rebar yield strength on the bond behavior is shown in Figure 12. The bond strength increased with the rebar yield strength, and the HRB400 (fy = 422 MPa) reinforcement has reached the yield stage. When the rebar yield strength increased from 422 to 680 MPa, the bond strength increased by 11.6%. This shows that the bond strength is reduced when the reinforcement yields [52]. When the rebar yields, the Poisson effect induces a radial contraction of the rebar, reducing the external pressure surrounding the rebar and causing a reduction in the bond strength [53]. However, with the yield strength of 680 MPa steel bars compared to 422 MPa steel bars, the post-peak toughness of A80 and A50 was 17.8% and 18.0% lower, respectively.

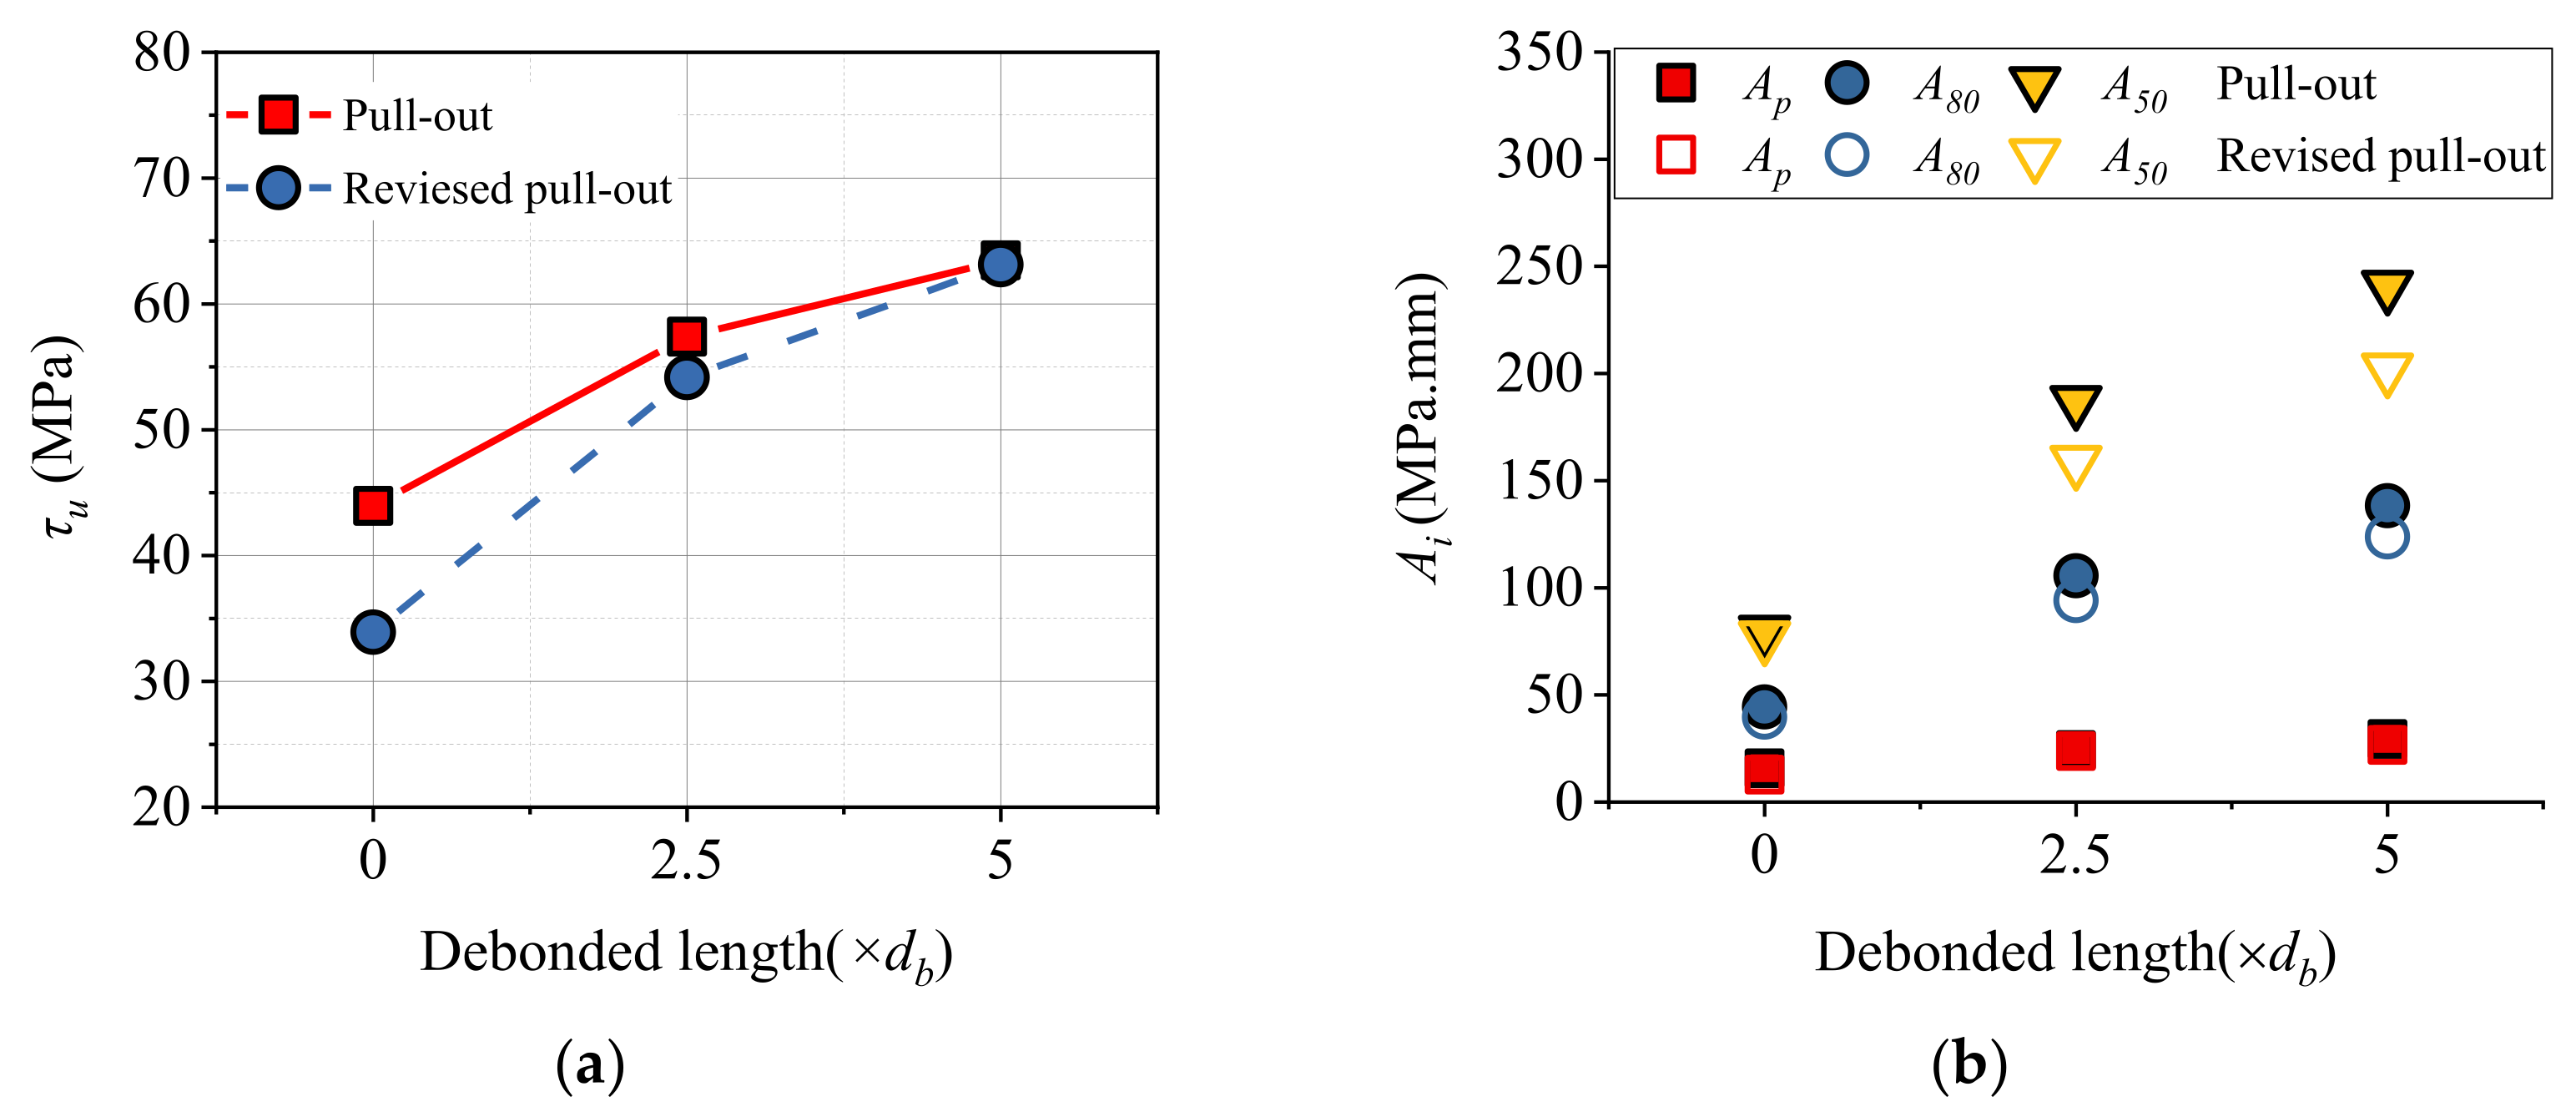
3.4.6. Loading Method and Debonded Length

The influence of the loading method and the debonded length on the bond property is shown in Figure 13. The formation of compression struts between the support and the surface of the reinforcing bar due to the support conditions, placing the surrounding concrete in compression [46]. The additional constraints increase the bond strength for the traditional pull-out test when the debonded length is less than the bond length (Figure 13a). The revised pull-out test bonded the reinforcement to the concrete at the loading surface, causing concrete spalling damage before the bars pull-out failure occurs [54], reducing the bond strength. UD-S02B-6D16C5-RP0 has 22.8% reduced bond strength compared to UD-S02B-6D16C5-P0. When the debonded length was 40 mm (2.5db), the influence of the loading method on the bond strength was reduced to 6%. The effects of the loading methods on the bond strength were less than 1% when the debonded length was 84 mm (5.25db).
In conclusion, when the compressive force is applied to the loading surface at a distance larger than the bond length (32 mm) to the traditional pull-out test reinforcement, the desired stress state for the steel and the surrounding UHPC is close to simultaneously in tension [47]. The impact of the loading methods on the bond strength can be neglected.
The bond toughness of the traditional pull-out test specimens was more significant than the revised pull-out test specimens, as shown in Figure 13b. Ap, A80, and A50 improved by 23.6%, 11.9%, and 3.5%, respectively, when the bonded part was located at the loading surface. Ap, A80, and A50 improved by 2.2%, 12.3%, and 17.6%, respectively, when the debonded length was 40 mm. Ap, A80, and A50 improved by 10.6%, 11.8%, and 19.1%, respectively, when the debonded length was 84 mm. According to the findings, the traditional pull-out test setup provided better energy-absorbing capabilities during the bond failure process than the revised pull-out test setup.

4. Analytical Model

4.1. Bond Strength Model

The existing bond strength models are reviewed, as listed in Table 7. The calculated results are compared with the experimental results [11,16,22,24,55,56], as shown in Figure 14. The existing models underestimate the actual bond strength.
According to the test results and the existing formula, the main influencing factors are UHPC compressive strength fc, cover thickness to rebar diameter ratio c/db, and fiber characteristic factor λf (Vf × Lf/df). Using the least square method, we obtain the bond strength expression of rebar-UHPC as follows:
τ u = f c ( 0.13 c / d b + 0.47 λ f + 3.91 )
The proposed formula fits well with the test results in this paper and the collected results from previous literature [11,16,22,24,55,56], as shown in Figure 15. The average ratio of the calculated value to the experimental value is 1.010. The coefficient of variation is 0.080.

4.2. Bond Stress-Slip Relationship Model

4.2.1. The Peak Slip su

According to the test results, the compressive strength, fiber content, and fiber type of UHPC have little influence on the peak slip. The cover thickness and rebar diameter are the significant factors affecting the peak slip. The expression for peak slip is obtained by regression analysis.
s u = 0.04 c / d b + 0.0036 d b 2 0.569
where su is the peak slip, c is the concrete cover thickness, db is the rebar diameter.
The calculated peak slips by Equation (5) are compared with the test results [9,11,24,56,61] in Figure 16. The average value and coefficient of variation of the predicted value to the test value are 1.006 and 0.185. Equation (5) provides suitable predictions.

4.2.2. Bond-Slip Relationship Model

According to the test results and the previous literature [11,15], a two-stage local bond stress-slip constitutive model of rebar-UHPC is proposed, which is in the form of an exponential function:
Ascending τ = τ u ( 1 e s / s r ) a s s u
Descending τ = τ u e β ( s s u ) s > s u
where τ is the local bond stress, s is the relative slip between rebar and concrete, τu is the bond strength corresponding to the peak load, and su is the peak slip, which Equation (4) and Equation (5) determine, respectively. sr, a, and β are obtained by regression analysis of experimental results.
The characteristic parameters of sr, a, and β in the formula are determined as 0.112, 0.805, and 0.157, respectively, by the least square error method. The statistical results of fitting coefficients are listed in Table 8. The test results in this paper and performed by other researchers [11,24,62,63] are compared with analysis models, as shown in Figure 17 and Figure 18, respectively. The proposed model can reasonably predict the bond stress-slip curve of rebar-UHPC.

5. Conclusions

Sixty-nine rebar-UHPC pull-out specimens were designed and tested under monotonic loading. The variables include UHPC compressive strength, steel fiber volume content, steel fiber types, cover thickness, rebar diameter, yield strength, loading method, and the debonded length. Based on the results and discussions above, the main conclusions are as follows:
(1)
The UHPC effectively increases the bond strength of the rebars. The bond strength is linearly related to the square root of UHPC compressive strength in MPa;
(2)
Increasing the fiber volume content and aspect ratio can increase the bond strength. A fiber characteristic factor λf (λf =Vf × Lf/df) is used to evaluate the effects of fiber volume content and aspect ratio. The bond strength of the specimens with the hook steel fiber has no significant difference from the straight steel fiber;
(3)
As the cover thickness increases from 1db to 2db, the bond strength increases by 17.6%. The bond strength remains unchanged when the cover thickness is greater than 2db. The peak slip increases by 43.6% when the cover thickness changes from 1db to 5.75db;
(4)
The influence of rebar diameter on bond strength is negligible since bond strength remains almost constant as rebar diameter increases. When the rebar diameter raises from 12 to 25 mm, the peak slips improve by 276.4%. The bond strength increases with the rebar grade;
(5)
The impact of the loading methods on the bond strength can be neglected when the debonded length is greater than the bond length;
(6)
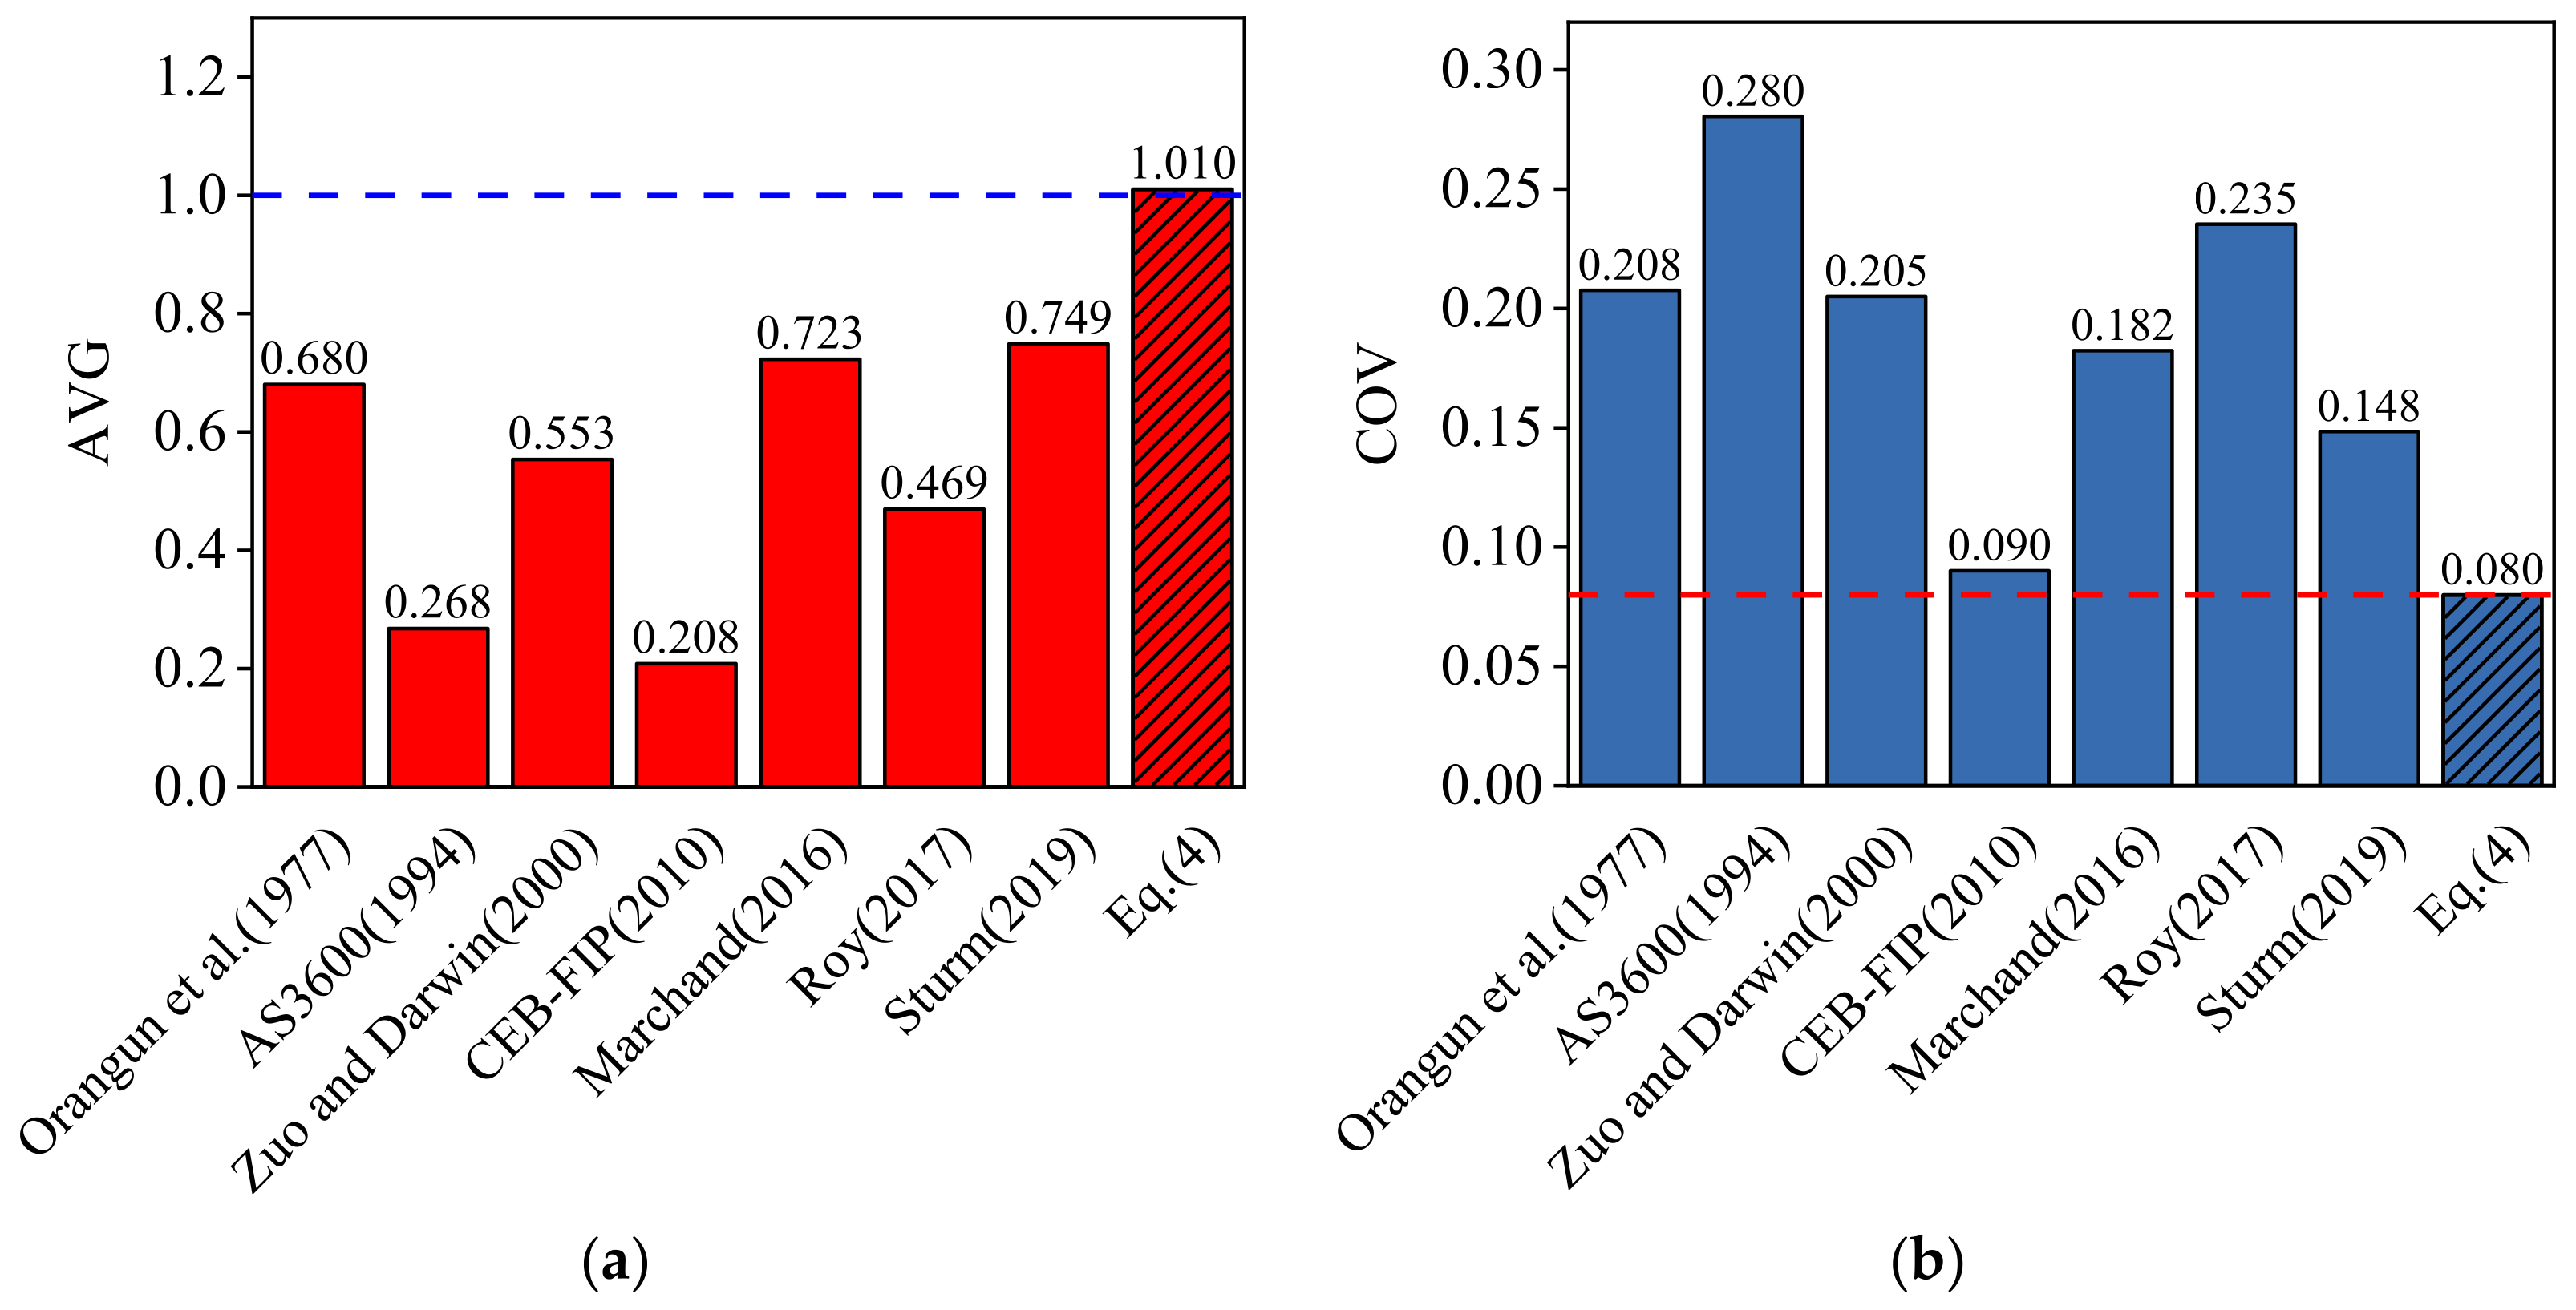
A simplified bond strength formula is suggested, fitting well with the test results in this paper and the collected results from previous literature. The average ratio of the calculated value to the experimental value is 1.010, with the coefficient of variation being 0.080. The peak slip expression is developed for the rebar-UHPC interface, which has significant consequences for cover thickness and rebar diameter;
(7)
A two-branch bond stress-slip constitutive model is proposed to describe the bond behavior of rebar in UHPC. The predicted bond-slip curves are in suitable agreement with the test curves.

Author Contributions

Methodology, R.L. and Y.H.; data curation, investigation, and writing—original draft, R.L.; writing—review and editing, Y.H. and Z.X.; funding acquisition, Y.H. All authors have read and agreed to the published version of the manuscript.

Funding

This research was funded by the National Natural Science Foundation of China (no. 51890901) and the Natural Science Foundation for Distinguished Young Scholars of Hunan Province, China (no. 2020JJ2003).

Institutional Review Board Statement

Not applicable.

Informed Consent Statement

Not applicable.

Data Availability Statement

The data presented in this study are available on request from the corresponding author.

Conflicts of Interest

The authors declare no conflict of interest.

References

  1. Shafieifar, M.; Farzad, M.; Azizinamini, A. Experimental and numerical study on mechanical properties of Ultra High Performance Concrete (UHPC). Constr. Build. Mater. 2017, 156, 402–411. [Google Scholar] [CrossRef]
  2. Zhang, Y.; Yang, J.; Li, T.; Deng, M. Mechanical behavior of RC columns strengthened with thin UHPC jacket under cyclic loads. J. Build. Eng. 2022, 49, 104065. [Google Scholar] [CrossRef]
  3. Wang, Y.; Shao, X.; Chen, J.; Cao, J.; Deng, S. UHPC-based strengthening technique for orthotropic steel decks with significant fatigue cracking issues. J. Constr. Steel Res. 2021, 176, 106393. [Google Scholar] [CrossRef]
  4. Graybeal, B.; Crane, C.K.; Perry, V.; Corvez, D.; Ahlborn, T.M. Advancing Ultra-High-Performance Concrete. Concr. Int. 2019, 41, 41–45. [Google Scholar]
  5. Kim, J.J.; Yoo, D.Y. Effects of fiber shape and distance on the pullout behavior of steel fibers embedded in ultra-high-performance concrete. Cem. Concr. Compos. 2019, 103, 213–223. [Google Scholar] [CrossRef]
  6. Fan, L.; Meng, W.; Teng, L.; Khayat, K.H. Effects of lightweight sand and steel fiber contents on the corrosion performance of steel rebar embedded in UHPC. Constr. Build. Mater. 2020, 238, 117709. [Google Scholar] [CrossRef]
  7. El-Joukhadar, N.; Pantazopoulou, S.J. Effectiveness of UHPFRC cover in delaying bar corrosion. Constr. Build. Mater. 2021, 269, 121288. [Google Scholar] [CrossRef]
  8. Ma, F.; Deng, M.; Ma, Y.; Lue, H.; Yang, Y.; Sun, H. Experimental study on interior precast concrete beam-column connections with lap-spliced steel bars in field-cast RPC. Eng. Struct. 2021, 228, 111481. [Google Scholar] [CrossRef]
  9. Bae, B.I.; Choi, H.K.; Choi, C.S. Bond stress between conventional reinforcement and steel fibre reinforced reactive powder concrete. Constr. Build. Mater. 2016, 112, 825–835. [Google Scholar] [CrossRef]
  10. Holschemacher, K.; Weiße, D.; Klotz, S. Bond of reinforcement in ultra high strength concrete. In Proceedings of the International Symposium on Ultra High Performance Concrete, Kassel, Germany, 13–15 September 2004; pp. 375–387. [Google Scholar]
  11. Yoo, D.Y.; Shin, H.O.; Yang, J.M.; Yoon, Y.S. Material and bond properties of ultra high performance fiber reinforced concrete with micro steel fibers. Compos. Part B 2014, 58, 122–133. [Google Scholar] [CrossRef]
  12. Fehling, E.; Lorenz, P.; Leutbecher, T. Experimental Investigations on Anchorage of Rebars in UHPC. In Proceedings of the Hipermat 2012 3rd International Symposium on UHPC and Nanotechnology for High Performance Construction Materials, Kassel, Germany, 7–9 March 2012; pp. 533–540. [Google Scholar]
  13. Marchand, P.; Baby, F.; Khadour, A.; Battesti, T.; Rivillon, P.; Quiertant, M.; Nguyen, H.H.; Généreux, G.; Deveaud, J.P.; Simon, A. Bond behaviour of reinforcing bars in UHPFRC. Mater. Struct. 2016, 49, 1979–1995. [Google Scholar] [CrossRef]
  14. Alkaysi, M.; El-Tawil, S. Factors affecting bond development between Ultra High Performance Concrete (UHPC) and steel bar reinforcement. Constr. Build. Mater. 2017, 144, 412–422. [Google Scholar] [CrossRef]
  15. Sturm, A.B.; Visintin, P. Local bond slip behavior of steel reinforcing bars embedded in ultra high performance fibre reinforced concrete. Struct. Concr. 2019, 20, 108–122. [Google Scholar] [CrossRef]
  16. Hu, A.X.; Liang, X.W.; Shi, Q.X. Bond Characteristics between High-Strength Bars and Ultrahigh-Performance Concrete. J. Mater. Civ. Eng. 2020, 32, 1–14. [Google Scholar] [CrossRef]
  17. Lee, J.Y.; Lim, A.R.; Kim, J.; Kim, J. Bond behaviour of GFRP bars in high-strength concrete: Bar diameter effect. Mag. Concr. Res. 2017, 69, 541–554. [Google Scholar] [CrossRef]
  18. Metelli, G.; Plizzari, G.A. Influence of the relative rib area on bond behaviour. Mag. Concr. Res. 2014, 66, 277–294. [Google Scholar] [CrossRef] [Green Version]
  19. Bamonte, P.F.; Gambarova, P.G. High-bond bars in NSC and HPC: Study on size effect and on the local bond stress-slip law. J. Struct. Eng. 2007, 133, 225–234. [Google Scholar] [CrossRef]
  20. Bazant, Z.P.; Sener, S. Size effect in pull-out tests. ACI Mater. J. 1988, 85, 347–351. [Google Scholar]
  21. Seo, J.; Lee, G.C.; Liang, Z.; Dargush, G.F. Configuration and Size Effects on Bond Stress-Slip and Failure Modes of RC Connections. J. Eng. Mech. 2014, 140, 04014082. [Google Scholar] [CrossRef]
  22. Kook, K.H.; Shin, H.O.; Kwahk, I.J.; Yoon, Y.S. Bond Characteristics of Ultra High Performance Concrete. J. Korea Concr. Inst. 2010, 22, 753–760. [Google Scholar] [CrossRef] [Green Version]
  23. Lagier, F.; Massicotte, B.; Charron, J.P. Bond strength of tension lap splice specimens in UHPFRC. Constr. Build. Mater. 2015, 93, 84–94. [Google Scholar] [CrossRef]
  24. Yoo, D.Y.; Kwon, K.Y.; Park, J.J.; Yoon, Y.S. Local bond-slip response of GFRP rebar in ultra-high-performance fiber-reinforced concrete. Compos. Struct. 2015, 120, 53–64. [Google Scholar] [CrossRef]
  25. Yuan, J.; Graybeal, B.A. Bond Behavior of Reinforcing Steel in Ultra-High Performance Concrete; US Department of Transportation, Federal Hifhway Administartion: McLean, VA, USA, 2014.
  26. Firas, S.A.; Gilles, F.; Robert, L. Bond between carbon fibre-reinforced polymer (CFRP) bars and ultra high performance fibre reinforced concrete (UHPFRC): Experimental study. Constr. Build. Mater. 2011, 25, 479–485. [Google Scholar] [CrossRef]
  27. Lin, H.W.; Zhao, Y.X.; Ozbolt, J.; Feng, P.; Jiang, C.; Eligehausen, R. Analytical model for the bond stress-slip relationship of deformed bars in normal strength concrete. Constr. Build. Mater. 2019, 198, 570–586. [Google Scholar] [CrossRef]
  28. Delso, J.M.; Stavridis, A.; Shing, P. Bond Strength and Cyclic Bond Deterioration of Large-Diameter Bars. ACI Struct. J. 2013, 110, 659–670. [Google Scholar]
  29. Chao, S.-H.; Naaman, A.E.; Parra-Montesinos, G.J. Local Bond Stress-Slip Models for Reinforcing Bars and Prestressing Strands in High-Peformance Fiber-Reinforced Cement Composites. ACI Special Publication 2010, 272, 151–172. [Google Scholar]
  30. Wu, Y.F.; Zhao, X.M. Unified Bond Stress-Slip Model for Reinforced Concrete. J. Struct. Eng. 2013, 139, 1951–1962. [Google Scholar] [CrossRef]
  31. Xu, Y.L. Experimental Study of Anchorage Properties for Deformed Bars in Concrete; Tsinghua University: Beijing, China, 1990. (In Chinese) [Google Scholar]
  32. Zhao, W.P.; Zhu, B.R. Theoretical model for the bond-slip relationship between ribbed steel bars and confined concrete. Struct. Concr. 2018, 19, 548–558. [Google Scholar] [CrossRef]
  33. Lee, Y.H.; Joo, Y.T.; Lee, T.; Ha, D.H. Mechanical properties of constitutive parameters in steel–concrete interface. Eng. Struct. 2011, 33, 1277–1290. [Google Scholar] [CrossRef]
  34. Chao, S.-H. Bond Characterization Of Reinforcing Bars and Prestressing Strands in High Performance Fiber Reinforced Cementitious Composites under Monotonic and Cyclic Loading. Ph.D. Thesis, University of Michigan, Ann Arbor, MI, USA, 2005. [Google Scholar]
  35. CEB-FIP. Fib Model Code for Concrete Structures 2010; Comité Euro international du Béton/Federation Internationale de la Precontrainte: Lausanne, Switzerland, 2013. [Google Scholar]
  36. GB 50010-2010; Code for Design of Concrete Structures. China Architecture & Building Press: Beijing, China, 2015.
  37. Harajli, M.H.; Hamad, B.S.; Rteil, A.A. Effect of confinement of bond strength between steel bars and concrete. ACI Struct. J. 2004, 101, 595–603. [Google Scholar]
  38. Huang, L.; Chi, Y.; Xu, L.; Chen, P.; Zhang, A. Local bond performance of rebar embedded in steel-polypropylene hybrid fiber reinforced concrete under monotonic and cyclic loading. Constr. Build. Mater. 2016, 103, 77–92. [Google Scholar] [CrossRef]
  39. Gao, X.L.; Li, N.K.; Ren, X.D. Analytic solution for the bond stress-slip relationship between rebar and concrete. Constr. Build. Mater. 2019, 197, 385–397. [Google Scholar] [CrossRef]
  40. Bravo, M.; Duarte, A.P.C.; de Brito, J.; Evangelista, L. Tests and Simulation of the Bond-Slip between Steel and Concrete with Recycled Aggregates from CDW. Buildings 2021, 11, 40. [Google Scholar] [CrossRef]
  41. Zhou, Z.D.; Qiao, P.Z. Bond behavior of epoxy-coated rebar in ultra-high performance concrete. Constr. Build. Mater. 2018, 182, 406–417. [Google Scholar] [CrossRef]
  42. GB/T 31387-2015; Reactive Powder Concrete. China Standard Press: Beijing, China, 2015.
  43. Li, W.; Huang, Z.; Hu, G.; Hui Duan, W.; Shah, S.P. Early-age shrinkage development of ultra-high-performance concrete under heat curing treatment. Constr. Build. Mater. 2017, 131, 767–774. [Google Scholar] [CrossRef]
  44. GB/T 1499.2-2018; Steel for the Reinforcement of Concrete-Part 2: Hot Rolled Ribbed Bars. China Standard Press: Beijing, China, 2018.
  45. RILEM TC. RC6: Bond Test for Reinforcement Steel: 2: Pull-Out Test, 1983. In RILEM Recommendations for the Testing and Use of Construction Materials; E & FN SPON: London, UK, 1994; pp. 218–220. [Google Scholar]
  46. Saikali, E.R. Bond Behaviour of Steel Reinforcing Bars Embedded in Ultra-High-Performance Steel Fiber Reinforced Concrete. Master’s Thesis, York University, Toronto, ON, Canada, 2019. [Google Scholar]
  47. ACI Committee 408. ACI 408R-03: Bond and Development of Straight Reinforcing Bars in Tension; American Concrete Institute: Farmington Hills, MI, USA, 2003. [Google Scholar]
  48. Yao, Y.; Zhang, H.; Zhang, X.; Ren, F.; Li, Y.; Yang, Z. Experimental, Analytical and Numerical Studies of Interfacial Bonding Properties between Silane-Coated Steel Fibres and Mortar. Buildings 2021, 11, 398. [Google Scholar] [CrossRef]
  49. Harajli, M.H.; Mabsout, M.E. Evaluation of Bond Strength of Steel Reinforcing Bars in Plain and Fiber-Reinforced Concrete. ACI Struct. J. 2002, 99, 509–517. [Google Scholar]
  50. Zhao, M.; Liu, G.; Liu, L.; Zhang, Y.; Shi, K.; Zhao, S. Bond of Ribbed Steel Bar in High-Performance Steel Fiber Reinforced Expanded-Shale Lightweight Concrete. Buildings 2021, 11, 582. [Google Scholar] [CrossRef]
  51. Qi, J.; Cheng, Z.; John Ma, Z.; Wang, J.; Liu, J. Bond strength of reinforcing bars in ultra-high performance concrete: Experimental study and fiber–matrix discrete model. Eng. Struct. 2021, 248, 113290. [Google Scholar] [CrossRef]
  52. Bonacci, J.F. Bar Yield Penetration in Monotonically Loaded Anchorages. J. Struct. Eng. 1994, 120, 965–986. [Google Scholar] [CrossRef]
  53. Ma, F.; Deng, M.; Fan, H.; Yang, Y.; Sun, H. Study on the lap-splice behavior of post-yield deformed steel bars in ultra high performance concrete. Constr. Build. Mater. 2020, 262, 120611. [Google Scholar] [CrossRef]
  54. Chu, S.H.; Kwan, A.K.H. A new method for pull out test of reinforcing bars in plain and fibre reinforced concrete. Eng. Struct. 2018, 164, 82–91. [Google Scholar] [CrossRef]
  55. Deng, Z.C.; Cheng, S.K. HRB 500 high-strength reinforced and reactive power concrete bond-slip constitutive relations research. Concrete 2015, 303, 25–31. (In Chinese) [Google Scholar]
  56. Jungwirth, J.; Muttoni, A. Structural behavior of tension members in Ultra High Performance Concrete. In Proceedings of the International Symposium on Ultra High Performance Concrete, Kassel, Germany, 13–15 September 2004. [Google Scholar]
  57. Orangun, C.; Jirsa, J.O.; Breen, J. The Strength of Anchor Bars: A Reevaluation of Test Data on Development Length and Splices; University of Texas: Austin, Texas, USA, 1975. [Google Scholar]
  58. AS3600; Australian Standard for Concrete Structures. Standards Australia Limited: Sydney, Australia, 1994.
  59. Zuo, J.; Darwin, D. Bond slip of high relative rib area bars under cyclic loading. ACI Struct. J. 2000, 97, 331–334. [Google Scholar]
  60. Roy, M.; Hollmann, C.; Wille, K. Influence of volume fraction and orientation of fibers on the pullout behavior of reinforcement bar embedded in ultra high performance concrete. Constr. Build. Mater. 2017, 146, 582–593. [Google Scholar] [CrossRef]
  61. Wang, D.; Han, L.; Ju, Y.; Zeng, C.; Li, Z. Bond behavior between reinforcing bar and reactive powder concrete. Struct. Concr. 2021, 1–13. [Google Scholar] [CrossRef]
  62. Khaksefidi, S.; Ghalehnovi, M.; de Brito, J. Bond behaviour of high-strength steel rebars in normal (NSC) and ultra-high performance concrete (UHPC). J. Build. Eng. 2021, 33, 101592. [Google Scholar] [CrossRef]
  63. Amini Pishro, A.; Feng, X.; Ping, Y.; Dengshi, H.; Shirazinejad, R.S. Comprehensive equation of local bond stress between UHPC and reinforcing steel bars. Constr. Build. Mater. 2020, 262, 119942. [Google Scholar] [CrossRef]
Figure 1. Dimension of specimens: (a) profile view; (b) plan view.
Buildings 12 00460 g001
Figure 2. Test setup for UHPC mechanical properties: (a) compressive test; (b) direct tension test.
Buildings 12 00460 g002
Figure 3. Different types of steel fibers: (a) SFA; (b) SFB; (c) SFC; (d) HFB.
Buildings 12 00460 g003
Figure 4. The surface configuration of deformed bars: (a) schematic diagram; (b) photo of deformed bars.
Buildings 12 00460 g004
Figure 5. Pull-out test setup: (a) traditional pull-out; (b) revised pull-out.
Buildings 12 00460 g005
Figure 6. Typical failure modes: (a) pull-out failure; (b) splitting + pull-out failure; (c) cone failure.
Buildings 12 00460 g006
Figure 7. Bond-slip curves of specimens: (a) compressive strength; (b) fiber volume content; (c) fiber aspect ratio; (d) fiber type; (e) cover thickness; (f) rebar diameter; (g) rebar yield strength; (h) traditional pull-out test; (i) revised pull-out test.
Buildings 12 00460 g007
Figure 8. Effect of compressive strength on bond performance: (a) bond strength; (b) bond toughness.
Buildings 12 00460 g008
Figure 9. Effect of steel fiber on bond performance: (a) bond strength-fiber volume fraction; (b) bond strength-fiber type; (c) bond strength-fiber characteristic factor; (d) bond toughness-fiber volume fraction; (e) bond toughness-fiber type.
Buildings 12 00460 g009aBuildings 12 00460 g009b
Figure 10. Effect of cover thickness on bond performance: (a) bond strength; (b) peak slip; (c) bond toughness.
Buildings 12 00460 g010
Figure 11. Effect of rebar diameter on bond performance: (a) bond strength; (b) peak slip; (c) bond toughness.
Buildings 12 00460 g011
Figure 12. Effect of rebar yield strength on bond performance: (a) bond strength; (b) bond toughness.
Buildings 12 00460 g012
Figure 13. Effect of loading method and debonded length on bond performance: (a) bond strength; (b) bond toughness.
Buildings 12 00460 g013
Figure 14. Comparative the calculated bond strength of steel bar in UHPC: (a) the average ratio; (b) the coefficient of variation.
Buildings 12 00460 g014
Figure 15. Comparative measured and predicted bond strength of UHPC.
Buildings 12 00460 g015
Figure 16. Comparative measured and predicted results: (a) the peak slip su; (b) histogram.
Buildings 12 00460 g016
Figure 17. Comparison of the model predictions with the tested bond-slip curves: (a) UA-S02B-6D16C5-P5; (b) UB-S02B-6D16C5-P5; (c) UC-S02B-6D16C5-P5; (d) UD-S02B-6D16C5-P5; (e) UD-S01B-6D16C5-P5; (f) UD-S03B-6D16C5-P5; (g) UD-S02C-6D16C5-P5; (h) UD-H02B-6D16C5-P5; (i) UD-S02B-6D16C2-P5; (j) UD-S02B-5D16C5-P5; (k) UD-S02B-6D16C5-P2.5; (l) UD-S02B-6D16C5-RP5.
Buildings 12 00460 g017aBuildings 12 00460 g017b
Figure 18. Comparison of the model predictions with the tested bond-slip curves by other researchers: (a) U3-16-2d; (b) R16C2L2N6.5-2; (c) R16C2L3N6.5-2; (d) R18C2L1N6.5-2; (e) D16-1.5d-1; (f) D16-2d-1; (g) 1-2d-1; (h) 3-1d-2; (i) 3-2d-2.
Buildings 12 00460 g018
Table 1. Range of design variables.
Design VariablesVariation Range
Compressive strength fcUA, UB, UC, UD
Fiber volume content Vf1%, 2%, 3%
Fiber typeSFA, SFB, SFC, HFB
Cover thickness c1db, 2db, 3db, 4db, 5.75db
Rebar diameter db12 mm, 16 mm, 20 mm, 25 mm
Rebar yield strength fy422 MPa, 542 MPa, 680 MPa
Loading methodP, RP
Debonded length
(The distance between the bonded part and the specimen loading surface)
0, 2.5db, 5.25db
Note: UA: compressive strength of UHPC at 3 days cure time; UB: compressive strength of UHPC at 7 days cure time; UC: compressive strength of UHPC at 14 days cure time; UD: compressive strength of UHPC at 28 days cure time. SFA: straight steel fiber with an aspect ratio of 30; SFB: straight steel fiber with an aspect ratio of 65; SFC: straight steel fiber with an aspect ratio of 100; HFB: hooked steel fiber with an aspect ratio of 65. P: traditional pull-out test; RP: revised pull-out test.
Table 2. Details of specimens.
Test VariableSpecimenfc (MPa)ft (MPa)c
(mm)
db
(mm)
Vf (%)Fiber TypeLoading MethodDebonded Length
(mm)
Rebar Yield Strength (MPa)
Control groupUD-S02B-6D16C5-P5139.829.3892162SFBPull-out84680
Compressive strengthUA-S02B-6D16C5-P598.346.8692162SFBPull-out84680
UB-S02B-6D16C5-P5109.647.2492162SFBPull-out84680
UC-S02B-6D16C5-P5116.108.5092162SFBPull-out84680
Fiber volume contentUD-S01B-6D16C5-P5125.188.2492161SFBPull-out84680
UD-S03B-6D16C5-P5144.979.5792163SFBPull-out84680
Fiber typeUD-S02A-6D16C5-P5129.938.2792162SFAPull-out84680
UD-S02C-6D16C5-P5141.899.7292162SFCPull-out84680
UD-H02B-6D16C5-P5133.829.0592162HFBPull-out84680
Cover thicknessUD-S02B-6D16C1-P5139.829.3816162SFBPull-out84680
UD-S02B-6D16C2-P5139.829.3832162SFBPull-out84680
UD-S02B-6D16C3-P5139.829.3848162SFBPull-out84680
UD-S02B-6D16C4-P5139.829.3864162SFBPull-out84680
Rebar diameterUD-S02B-5D12C5-P5139.829.3892122SFBPull-out84520
UD-S02B-5D16C5-P5139.829.3892162SFBPull-out84542
UD-S02B-5D20C5-P5139.829.3892202SFBPull-out84539
UD-S02B-5D25C5-P5139.829.3892252SFBPull-out84534
Rebar yield strengthUD-S02B-4D16C5-P5139.829.3892162SFBPull-out84422
Loading method and debonded lengthUD-S02B-6D16C5-P0139.829.3892162SFBPull-out0680
UD-S02B-6D16C5-P2.5139.829.3892162SFBPull-out40680
UD-S02B-6D16C5-RP0139.829.3892162SFBRevised pull-out0680
UD-S02B-6D16C5-RP2.5139.829.3892162SFBRevised pull-out40680
UD-S02B-6D16C5-RP5139.829.3892162SFBRevised pull-out84680
Note: fc: compressive strength of concrete cubes; ft: tensile strength of dog-bone specimens. The reported strength values are the average of the measurements of three nominally identical specimens.
Table 3. Mix proportion design of UHPC (mass/cement mass ratio) [43].
CementQuartz SandSilica FlourSilica FumeFly AshWater/Binder Ratio
1.01.10.30.250.10.18
Note: Steel fiber is 1~3% by volume fraction. Superplasticizer is 0.2% of binder by mass.
Table 4. Properties of high-strength steel fibers.
Steel Fiber IDFormLf (mm)df (mm)Lf/dfTensile Strength (MPa)
SFAStraight60.230≥2850
SFBStraight130.265≥2850
SFCStraight200.2100≥2850
HFBHooked130.265≥2850
Note: Lf: length of the fiber; df: diameter of the fiber.
Table 5. Geometric and mechanical properties of steel bars.
Type of Steel BarsHRB400-D16HRB500-D12HRB500-D16HRB500-D20HRB500-D25HRB600-D16
Nominal diameter db (mm)161216202516
Core diameter d1 (mm)15.411.515.419.324.215.4
Average rib depth h1 (mm)1.51.01.51.72.01.5
Rib inclination β (°)60.56060.565.276.360.5
Rib spacing C (mm)107.910.011.012.510
Yield strength fy (MPa)422520542539534680
Ultimate strength fu (MPa)583695716714708861
Table 6. Experimental results.
Specimenτu
(MPa)
Meansu
(mm)
MeanAp
(MPa.mm)
MeanA80
(MPa.mm)
MeanA50
(MPa.mm)
MeanFailure Modes
UD-S02B-6D16C5-P5-161.3663.460.520.5623.3929.45141.02138.26238.40240.72PO
UD-S02B-6D16C5-P5-261.72 0.61 34.58 143.09 257.13 PO
UD-S02B-6D16C5-P5-367.31 0.54 30.37 130.66 226.65 PO
UA-S02B-6D16C5-P5-152.7250.450.550.5320.6323.08109.46100.47214.63192.66PO
UA-S02B-6D16C5-P5-251.17 0.42 19.43 89.54 183.30 PO
UA-S02B-6D16C5-P5-347.44 0.61 29.19 102.41 180.04 PO
UB-S02B-6D16C5-P5-160.8257.210.570.5629.2927.07122.92131.42213.38236.70PO
UB-S02B-6D16C5-P5-259.61 0.53 27.56 131.70 244.02 PO
UB-S02B-6D16C5-P5-351.20 0.57 24.37 139.63 252.70 PO
UC-S02B-6D16C5-P5-160.2461.120.550.5428.1227.71129.25132.21212.37231.20PO
UC-S02B-6D16C5-P5-264.80 0.53 27.39 128.37 230.00 PO
UC-S02B-6D16C5-P5-358.31 0.53 27.63 139.01 251.23 PO
UD-S01B-6D16C5-P5-159.4858.450.600.5632.8629.07135.03138.05223.88229.08PO
UD-S01B-6D16C5-P5-258.18 0.47 23.36 148.28 249.11 PO
UD-S01B-6D16C5-P5-357.69 0.62 30.99 130.85 214.24 PO
UD-S03B-6D16C5-P5-174.5771.710.580.5538.4834.25149.06141.09294.69273.54PO
UD-S03B-6D16C5-P5-267.92 0.48 26.18 143.51 274.47 PO
UD-S03B-6D16C5-P5-372.63 0.60 38.09 130.70 251.46 PO
UD-S02A-6D16C5-P5-160.3758.000.560.5827.4628.82135.71136.43226.62220.71PO
UD-S02A-6D16C5-P5-258.85 0.68 35.87 127.27 202.79 PO
UD-S02A-6D16C5-P5-354.78 0.49 23.13 146.29 232.73 PO
UD-S02C-6D16C5-P5-163.2366.970.580.5733.6730.48142.19142.54245.16264.08PO
UD-S02C-6D16C5-P5-267.67 0.50 23.52 139.04 261.71 PO
UD-S02C-6D16C5-P5-370.00 0.62 34.25 146.38 285.38 PO
UD-H02B-6D16C5-P5-162.7463.470.640.5134.8027.98138.50133.05283.90258.65PO
UD-H02B-6D16C5-P5-263.33 0.46 25.62 129.01 243.27 PO
UD-H02B-6D16C5-P5-364.35 0.42 23.51 131.64 248.78 PO
UD-S02B-6D16C1-P5-149.6350.320.400.3917.2917.01102.0394.02194.66179.02PO
UD-S02B-6D16C1-P5-254.46 0.43 19.42 85.17 157.38 PO
UD-S02B-6D16C1-P5-346.86 0.35 14.31 94.85 185.02 PO
UD-S02B-6D16C2-P5-159.7959.160.400.4420.5522.6198.98109.40187.73197.50PO
UD-S02B-6D16C2-P5-258.54 0.48 23.67 121.03 204.28 PO
UD-S02B-6D16C2-P5-359.14 0.43 23.61 108.20 200.50 PO
UD-S02B-6D16C3-P5-160.1560.730.390.4620.0922.94120.69112.88210.43206.13PO
UD-S02B-6D16C3-P5-261.36 0.43 20.71 106.01 216.18 PO
UD-S02B-6D16C3-P5-360.68 0.55 28.01 111.95 191.77 PO
UD-S02B-6D16C4-P5-162.6663.160.450.5222.3928.72107.15115.87225.69218.61PO
UD-S02B-6D16C4-P5-267.71 0.60 36.54 128.52 216.01 PO
UD-S02B-6D16C4-P5-359.12 0.50 27.22 111.92 214.11 PO
UD-S02B-5D12C5-P5-162.8559.590.480.5121.1023.26123.47128.19204.27216.46PO
UD-S02B-5D12C5-P5-260.54 0.56 29.48 126.43 226.02 PO
UD-S02B-5D12C5-P5-355.38 0.48 19.20 134.68 219.10 PO
UD-S02B-5D16C5-P5-159.4260.420.540.5426.1627.16135.51137.82268.31270.49PO
UD-S02B-5D16C5-P5-258.51 0.54 26.43 130.40 262.15 PO
UD-S02B-5D16C5-P5-363.33 0.55 28.88 147.54 281.00 PO
UD-S02B-5D20C5-P5-159.7858.021.311.3270.9770.28253.84256.72394.06399.93PO
UD-S02B-5D20C5-P5-257.25 1.34 69.70 261.77 404.21 PO
UD-S02B-5D20C5-P5-357.02 1.31 70.18 254.56 401.52 PO
UD-S02B-5D25C5-P5-156.0659.311.801.9296.62103.04286.18276.36478.71458.97PO
UD-S02B-5D25C5-P5-260.41 1.98 103.95 269.87 441.41 PO
UD-S02B-5D25C5-P5-361.46 2.00 108.55 273.02 456.78 PO
UD-S02B-4D16C5-P5-157.7856.850.520.5424.7125.35165.72167.97295.26293.59PO
UD-S02B-4D16C5-P5-255.58 0.65 30.65 162.79 277.03 PO
UD-S02B-4D16C5-P5-357.19 0.44 20.69 175.39 308.49 PO
UD-S02B-6D16C5-P0-145.0443.950.470.4715.3015.7833.1444.3662.0379.73SP + PO
UD-S02B-6D16C5-P0-247.73 0.43 16.48 57.12 99.32 SP + PO
UD-S02B-6D16C5-P0-339.07 0.52 15.57 42.83 77.86 SP + PO
UD-S02B-6D16C5-P2.5-154.1057.400.610.5121.5424.3094.49105.60170.10186.90PO
UD-S02B-6D16C5-P2.5-257.37 0.48 27.47 115.83 208.87 PO
UD-S02B-6D16C5-P2.5-360.72 0.43 23.91 106.47 181.73 PO
UD-S02B-6D16C5-RP0-136.8833.910.440.4513.1512.7749.5539.6592.4177.04Cone
UD-S02B-6D16C5-RP0-232.26 0.52 14.30 40.67 73.01 Cone
UD-S02B-6D16C5-RP0-332.58 0.40 10.86 28.73 65.70 Cone
UD-S02B-6D16C5-RP2.5-149.5054.150.550.5525.3923.7894.9494.00136.41158.96PO
UD-S02B-6D16C5-RP2.5-255.28 0.57 19.37 86.55 166.65 PO
UD-S02B-6D16C5-RP2.5-357.67 0.52 26.58 100.52 173.82 PO
UD-S02B-6D16C5-RP5-164.1763.120.440.5122.1626.62111.18123.69177.08202.12PO
UD-S02B-6D16C5-RP5-260.73 0.60 30.71 125.76 211.36 PO
UD-S02B-6D16C5-RP5-364.45 0.51 27.00 134.13 217.92 PO
Note: PO for pull-out of rebar from the UHPC; SP + PO for combined concrete cover splitting and rebar pull-out; cone for UHPC cone failure.
Table 7. Summary of typical bond strength equations (SI units).
TypeReferenceEquations
NCOrangun et al. [57] τ u = f c 0.10 + 0.25 ( c / d b ) + 4.15 d b / l d + A s v f s v / 41.5 s n d b
AS3600 [58] τ u = 0.265 f c ( c / d b + 0.5 )
CEB-FIP [35] τ u = 2.5 f c
Zuo and Darwin [59] τ u = f c 1 / 4 ( 0.23 + 0.46 c min / d b + 14.05 d b / l d ) ( 0.1 c max / c min + 0.9 )
UHPCMarchand [13] τ u = 0.875 f c ( c / d b )   c / d b 4   ;   τ u = 3.9 f c   c / d b 4
Roy [60] τ u = ( 0.45 c / d b + 38.5 / l d + 0.23 V f ) f t
Sturm [15] τ u = ( 0.0018 c + 0.186 ) f c
Note: fc: compressive strength of concrete cylinder; ft: tensile strength of concrete; c: concrete cover; db: diameter of bar; ld: embedment length; Asv: area of transverse reinforcement; fsv: yield strength of transverse reinforcement; s: spacing of transverse reinforcement; n: number of bars developed at the same location; cmax, cmin: maximum and minimum concrete cover.
Table 8. Statistical results of fitting coefficients.
CoefficientMeanStandard DeviationCoefficient of Variation
sr0.1120.0340.301
α0.8050.1780.221
β0.1570.0290.183
Publisher’s Note: MDPI stays neutral with regard to jurisdictional claims in published maps and institutional affiliations.

