1. Introduction
Cities emit 70% of CO
2 emissions and consume two-thirds of the energy produced in the world [
1], while buildings consume more than one-third of the final energy consumption globally [
2]; therefore, there are more opportunities to develop sustainably by increasing energy use efficiency in buildings. Such opportunities are particularly important for China, as a result of its exponential rate of urbanisation. The global data platform of Statista has shown that China has achieved a 64.72% population urbanisation rate at the end of 2021 [
3]. This means that there will be a higher energy demand for buildings, resulting in higher carbon emissions. Therefore, it is significant to have a detailed knowledge of the dynamic energy consumption of the buildings in particular cities with compact urban environments.
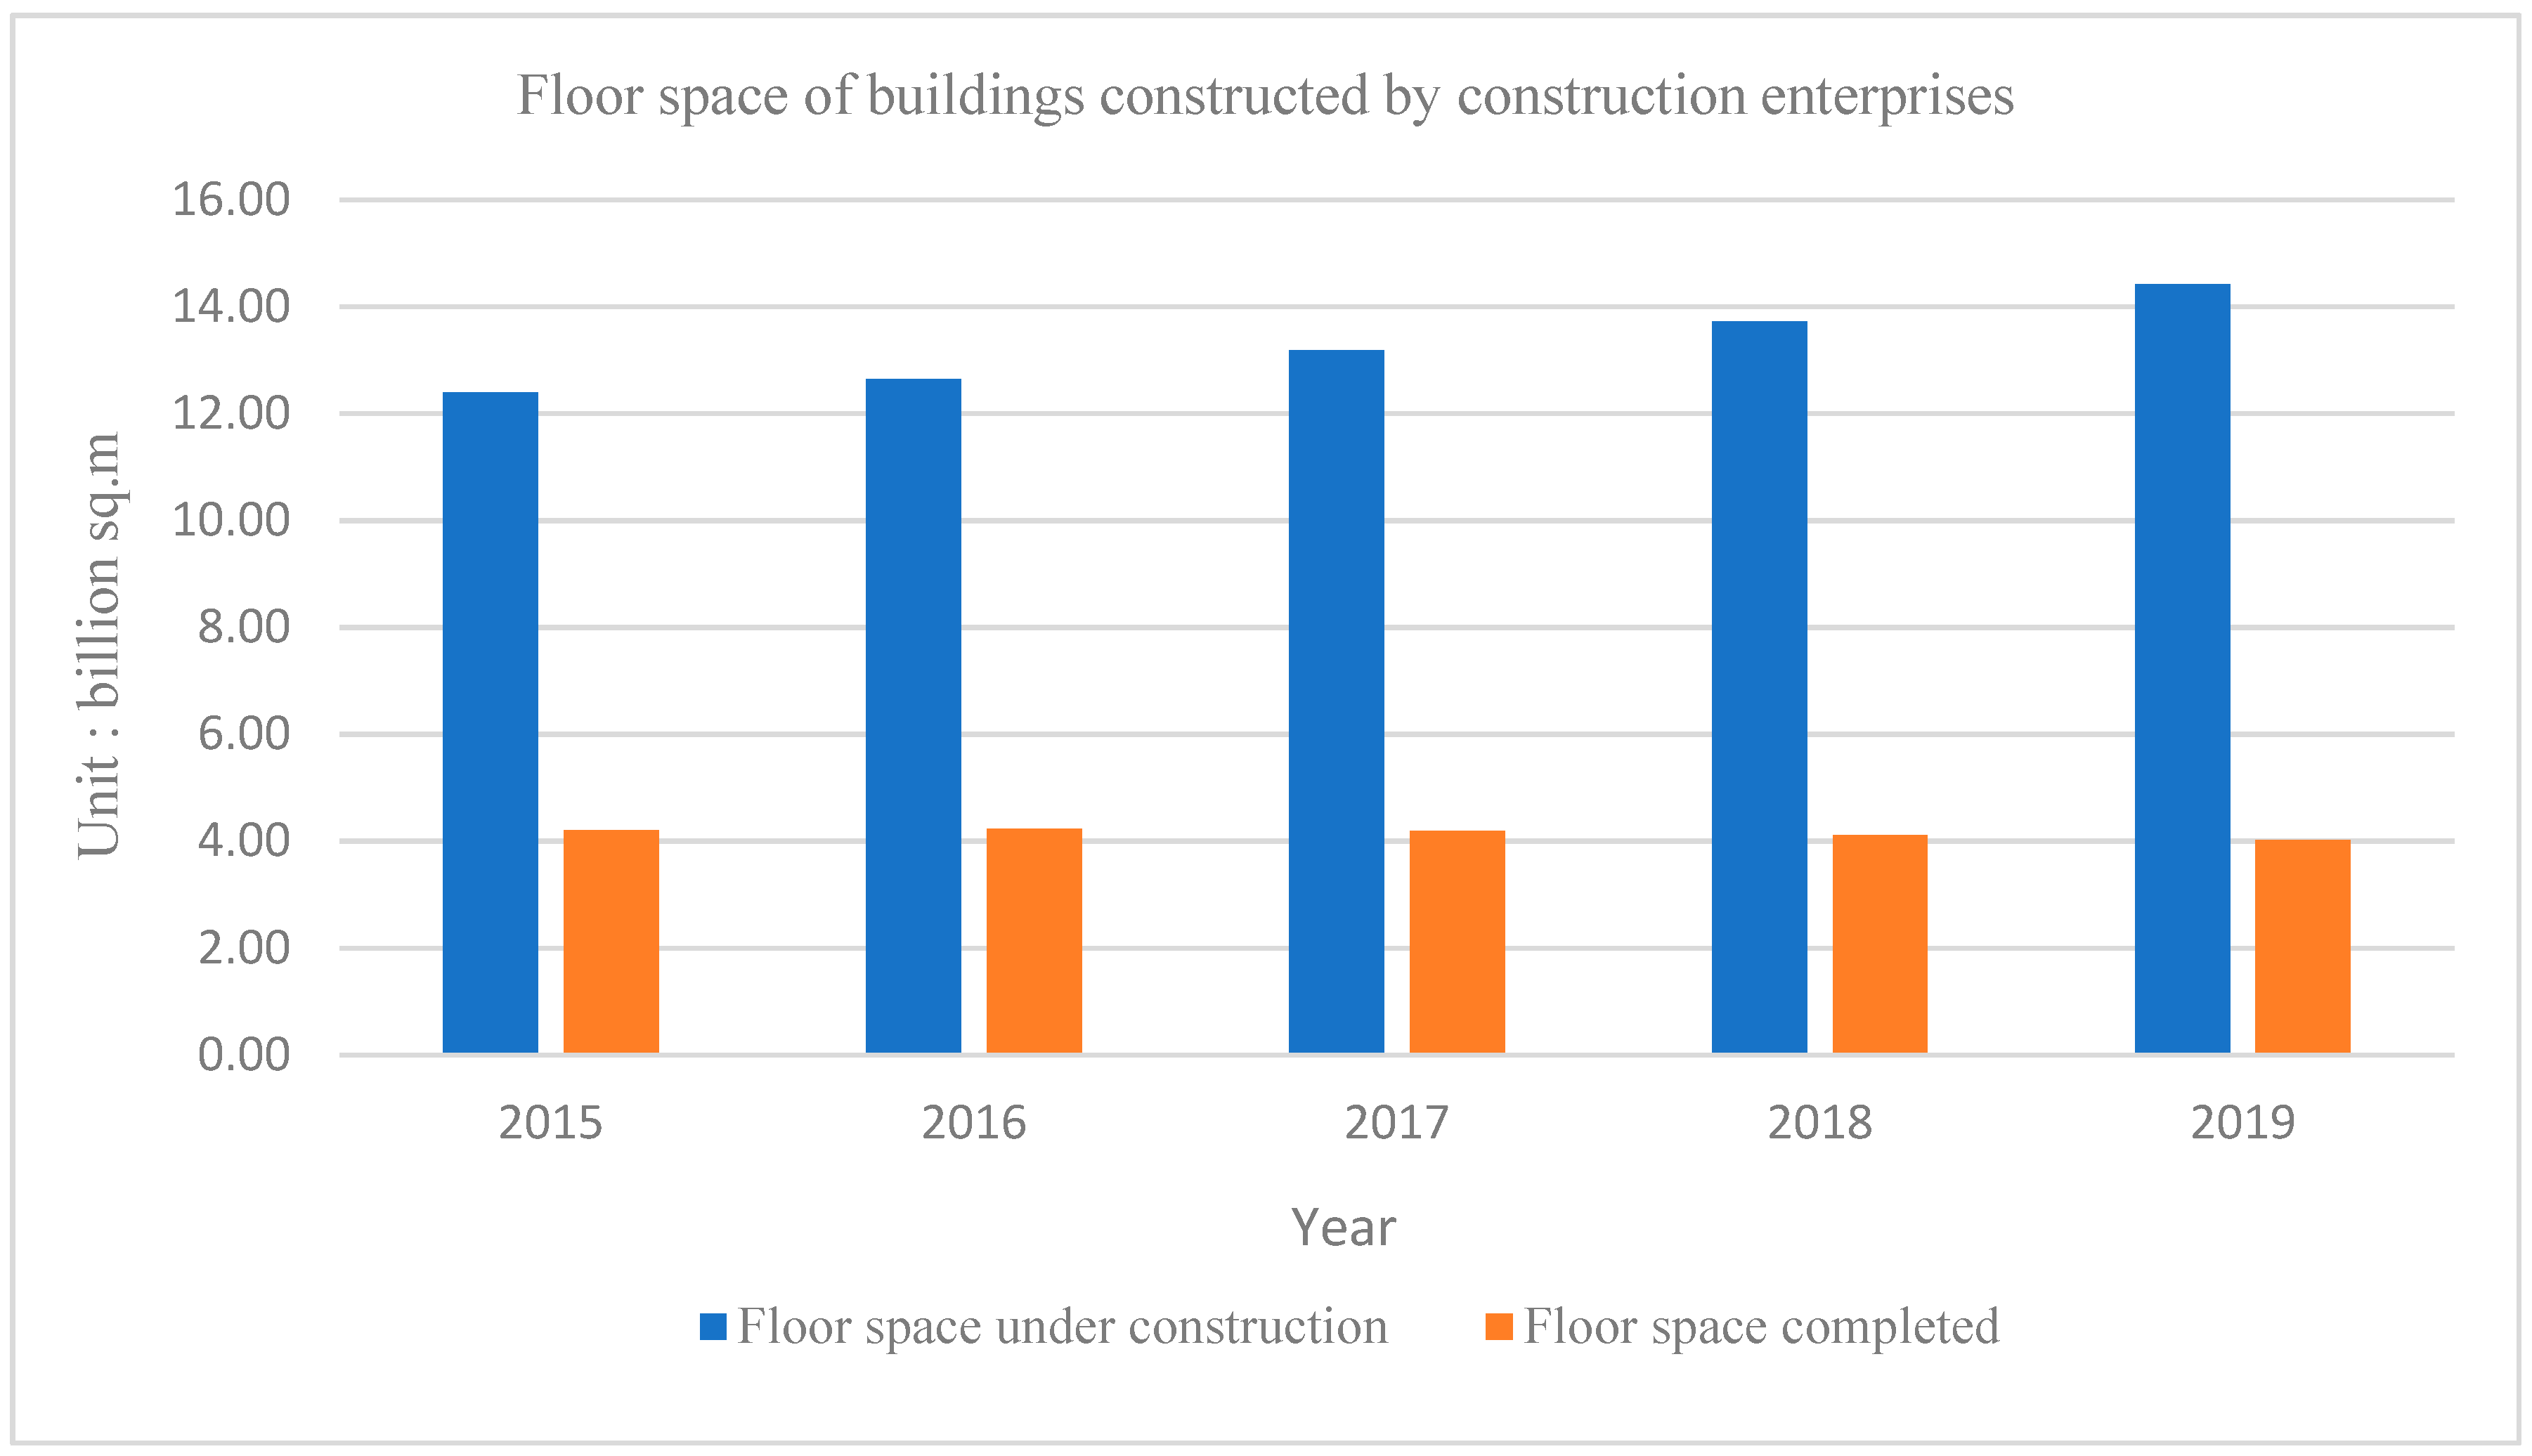
Figure 1 shows the amount of floor space, both under construction and to be completed, from 2015 and 2019, and the yearly increase is evident [
4].
Quantifying urban-scale energy use in buildings is a complex, cross-sectoral, and multi-scale task, with the entire process highly dependent on the urban environment [
5]. Hong et al. (2018) mention that the emergent of building energy modelling is one of the optimum supports available for energy efficiency, resilience, and sustainability [
6], and the model extensively improves energy performance rating, energy-efficient design, code compliance, and optimised operations. Reinhart and Cerezo Davila (2016) explain that the urban building energy model could accommodate many spatial scale sizes from a block, district, and, ultimately, an entire city [
7]. Ferrando et al. (2020) use a user-oriented overview to present the physics-based urban scale energy models’ tools, balancing complexity, usability, accuracy, and computing requirements [
8]. These scholars’ generic modelling theory findings are relevant and significant for urban-scale energy modelling in its processes and applications. However, most urban building energy modelling has mainly disregarded the impacts of the urban environment around buildings. For example, some have even wholly overlooked shading and the exchange of long-wave radiation of the environment and buildings.
This paper reviews approaches to urban building energy models and then presents a simple method to predict building energy consumption from the diverse functions of building stock, as an example, by an archetypal physical-based, bottom-up approach. The urban building energy model in this study considers the impacts of the urban environment (e.g., overshadowing between buildings) on the simulation, which can fill the research gap in the previous study. Moreover, this study also presents all the processes that can be replicated, with minimal difficulties, to additional research references.
2. Literature Review of Urban Building Energy Modelling
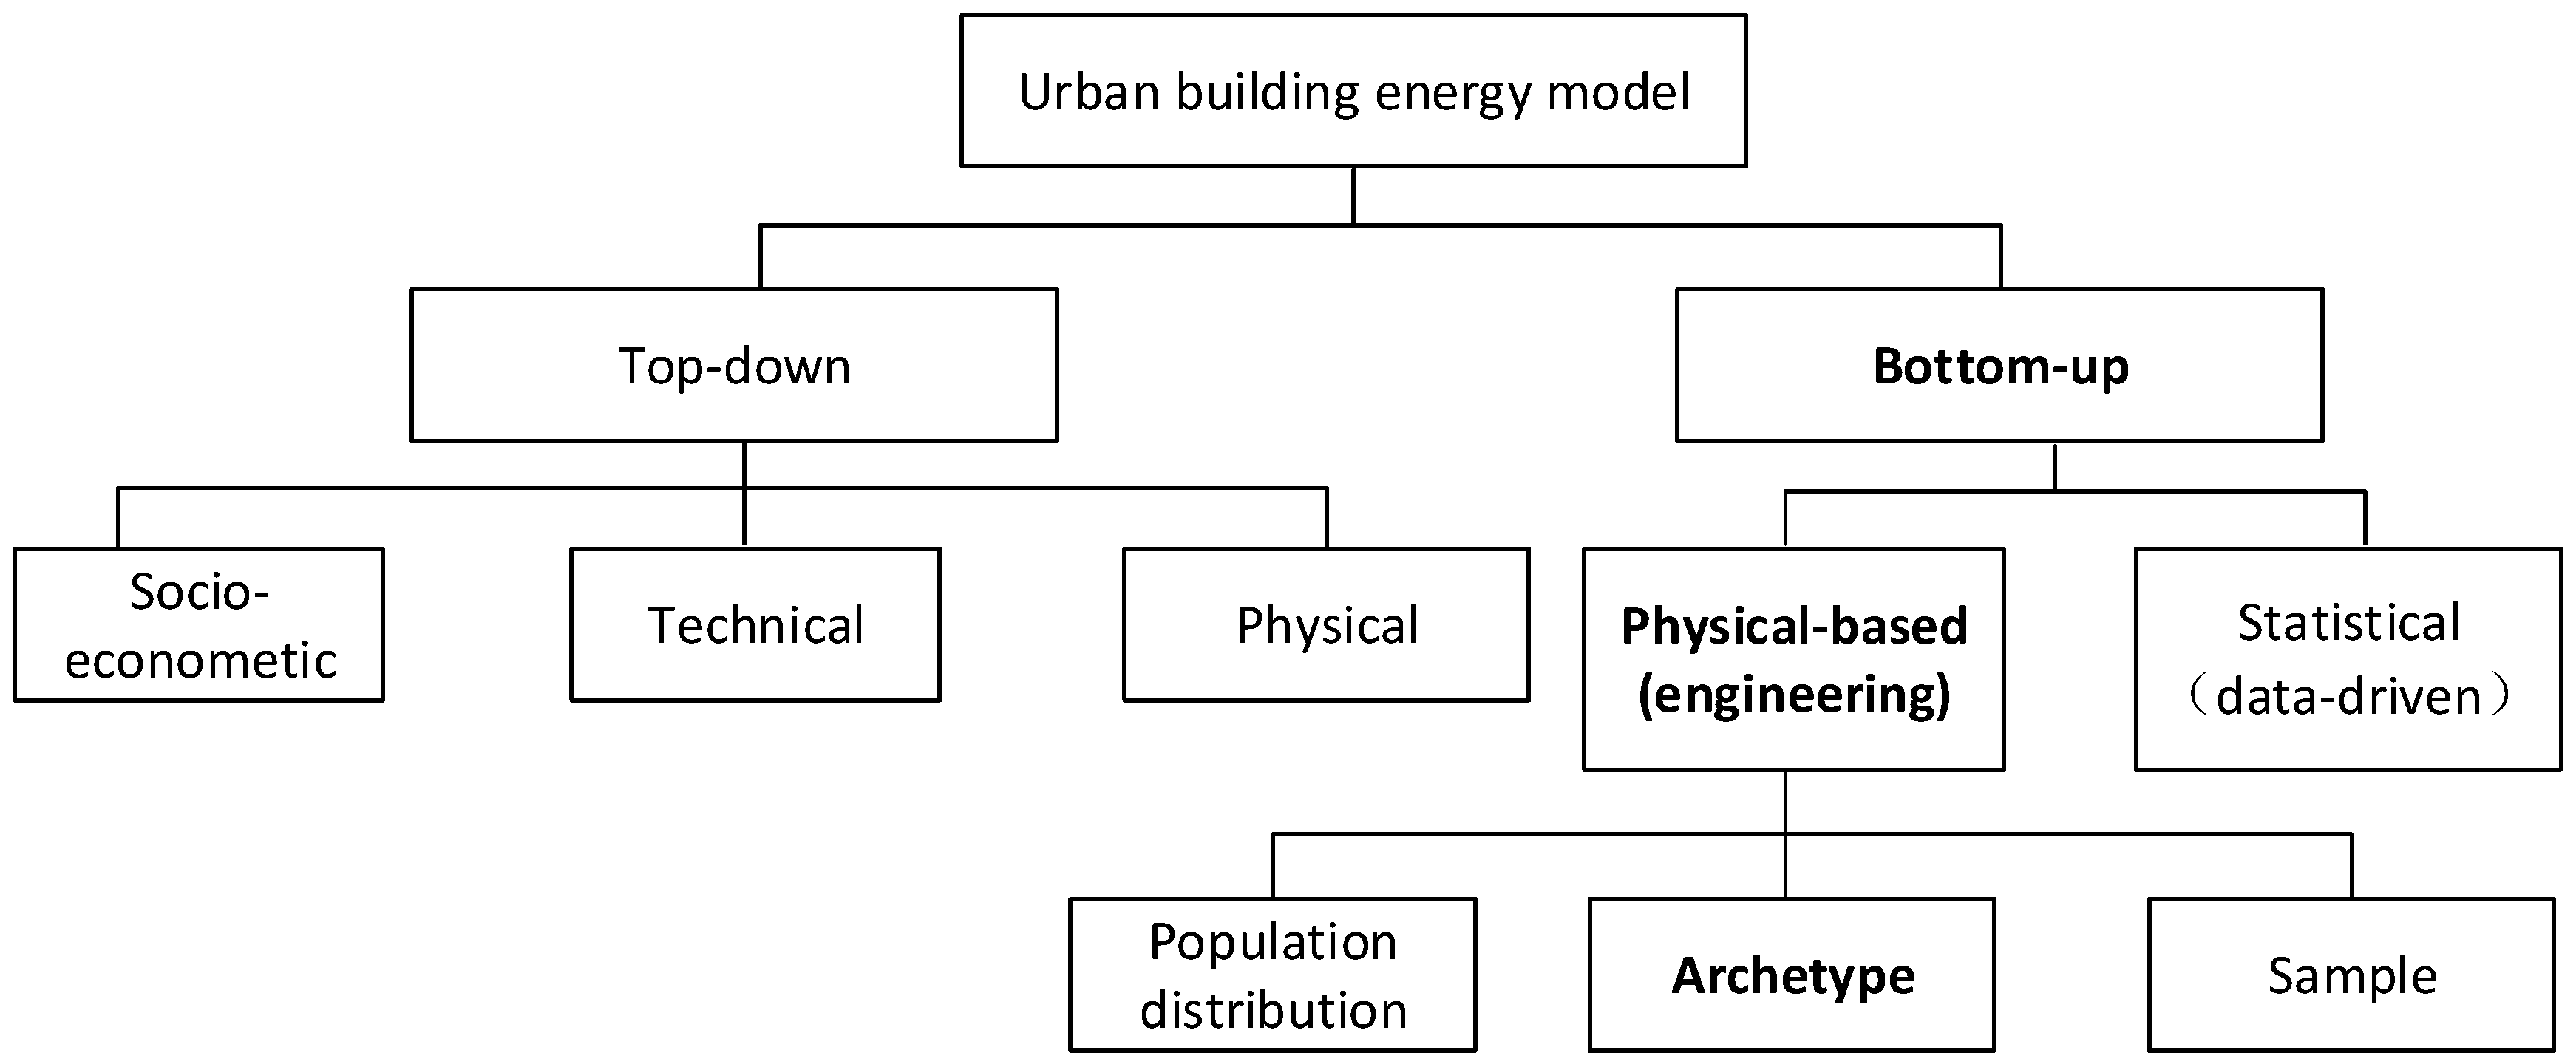
Two approaches are fundamental to modelling urban building energy consumption: top-down or bottom-up. Prior scholars have used such approaches to modelling urban building energy for the study [
1,
5,
9,
10,
11]. Top-down approaches treat a group of buildings as a single entity by estimating energy use at the sectoral building level, without considering differences between individual buildings. By contrast, based on bottom-up approaches, the energy consumption in individual buildings can be modelled, which can then be aggregated to the urban area.
Figure 2 presents the approaches’ outline of the urban building energy modelling.
2.1. Top-Down Model
The top-down model forecast of building consumption in urban areas is based on historical aggregate energy data; it also forecasts the long-term correlations between energy use within an urban area with different types of variables, such as the economy [
12], overall climate conditions [
13], and technical features, such as system or envelopes [
14]. Such an approach is applicable on an aggregated level, divided into various physical, technological, and socio-econometric classifications. Therefore, top-down models do not provide details for current and future technological options, as they concentrate on macroeconomic trends, instead of individual physical factors that consume energy in the buildings.
2.2. Bottom-Up Model
Compared to the top-down model, bottom-up models focus on two types of disaggregated levels: physical-based and statistical models [
15]. This necessitates a vast amount of empirical data to validate each component’s description [
16]. The statistical models utilise machine learning to determine energy demands from buildings; on the other hand, physics-based models use detailed modelling and simulation approaches that originated from building energy models [
17].
Bottom-up models forecast energy demands within individual buildings, before scaling up to neighbourhoods or entire cities. Such models are robust in determining the optimum cost-effective measures to reduce carbon dioxide emissions, through the use of available technologies. Energy consumption from each building can be calculated using the models, up to an hourly basis, before scalability to the whole city is applied [
18]. However, these models necessitate a vast amount of quantitative data, with limited accessibility, due to privacy and security.
Table 1 summarises the advantages and disadvantages of top-down and bottom-up approaches.
The above table indicates that top-down models cannot distinguish energy consumption, due to individual end-uses. Commonly used variables include macroeconomic indicators, such as economy, price indices, and climatic conditions. Similarly, the reliance on historical data is a drawback, since top-down models cannot be used to model discontinuous technological advancements. In addition, the lack of detail of the energy consumption of individual end-uses makes it impossible to identify critical areas for improving energy efficiency. On the other hand, top-down models have the advantage of using only aggregate data, which is widely available, simplicity, and reliance on historical national energy values that provide “inertia” to the model.
Bottom-up models can determine how much energy is consumed by each end-use and identify areas where improvements can be made. This approach can determine total energy consumption, without using historical data to calculate energy consumption. The primary drawback of this approach is that the input data required is greater than that of top-down models, and the bottom-up models are more complex, in terms of calculation or simulation techniques.
2.3. Data Input and Output
These data are derived from various sources, including the geometry of the building, thermophysical characteristics of its components (e.g., walls, roofs, and glazing), use of equipment, weather data, and occupancy frequency. A simplified building prototype can be used to observe the overall effects from an individual building to a group of buildings [
20].
Outputs from a simulation usually includes energy demands, efficiency, and the use of renewable energy in some cases [
17]. These outputs could be presented both spatially or statistically. Data on individual buildings could be used to scale up, according to the requirements for statistical presentation.
However, the spatial distribution of energy demand in urban areas could not be represented within the statistical presentation, thus having less relevance in policies about urban planning. Conversely, geospatial techniques are used to determine large-scale energy demands in spatial presentation; thus, its main advantage is that it could precisely locate areas with high energy demand. Such information could assist in energy planning and conservation and guide policy-makers who may not be specialists in complex energy systems. Furthermore, the spatial presentation can include spatial variation, according to climate conditions.
2.4. Model Calibration
Recently, there has been much progress in calibrating energy models. Such progress includes pattern-based [
21], Bayesian calibration [
22], and optimisation-based methods [
23,
24]. There are mainly three approaches that have been widely used for calibration of energy models: manual calibration accompanied by a computer program or graphic representation, special testing and analytical approaches, and mathematical approaches [
25].
Studies have demonstrated limitations for the calibration of urban building energy modelling, due to the vast number of simulations involving vast amounts of data, high levels of uncertainty, and interaction between buildings nearby. There is no consensus on conducting such a calibration, and previous studies have demonstrated these limitations. For example, Fonseca and Schlueter (2015) have conducted modelling around 1400 buildings, based on different archetypes, and the model error rate is at 1% to 19% by the energy service category at the neighbourhood scale [
26]. Sokol et al. (2017) validated the method on a set of 2263 residential buildings, using monthly and annual measured energy data to calibrate [
27]. However, the methods are only tested for residential buildings; they do not apply to other climate zones or building types.
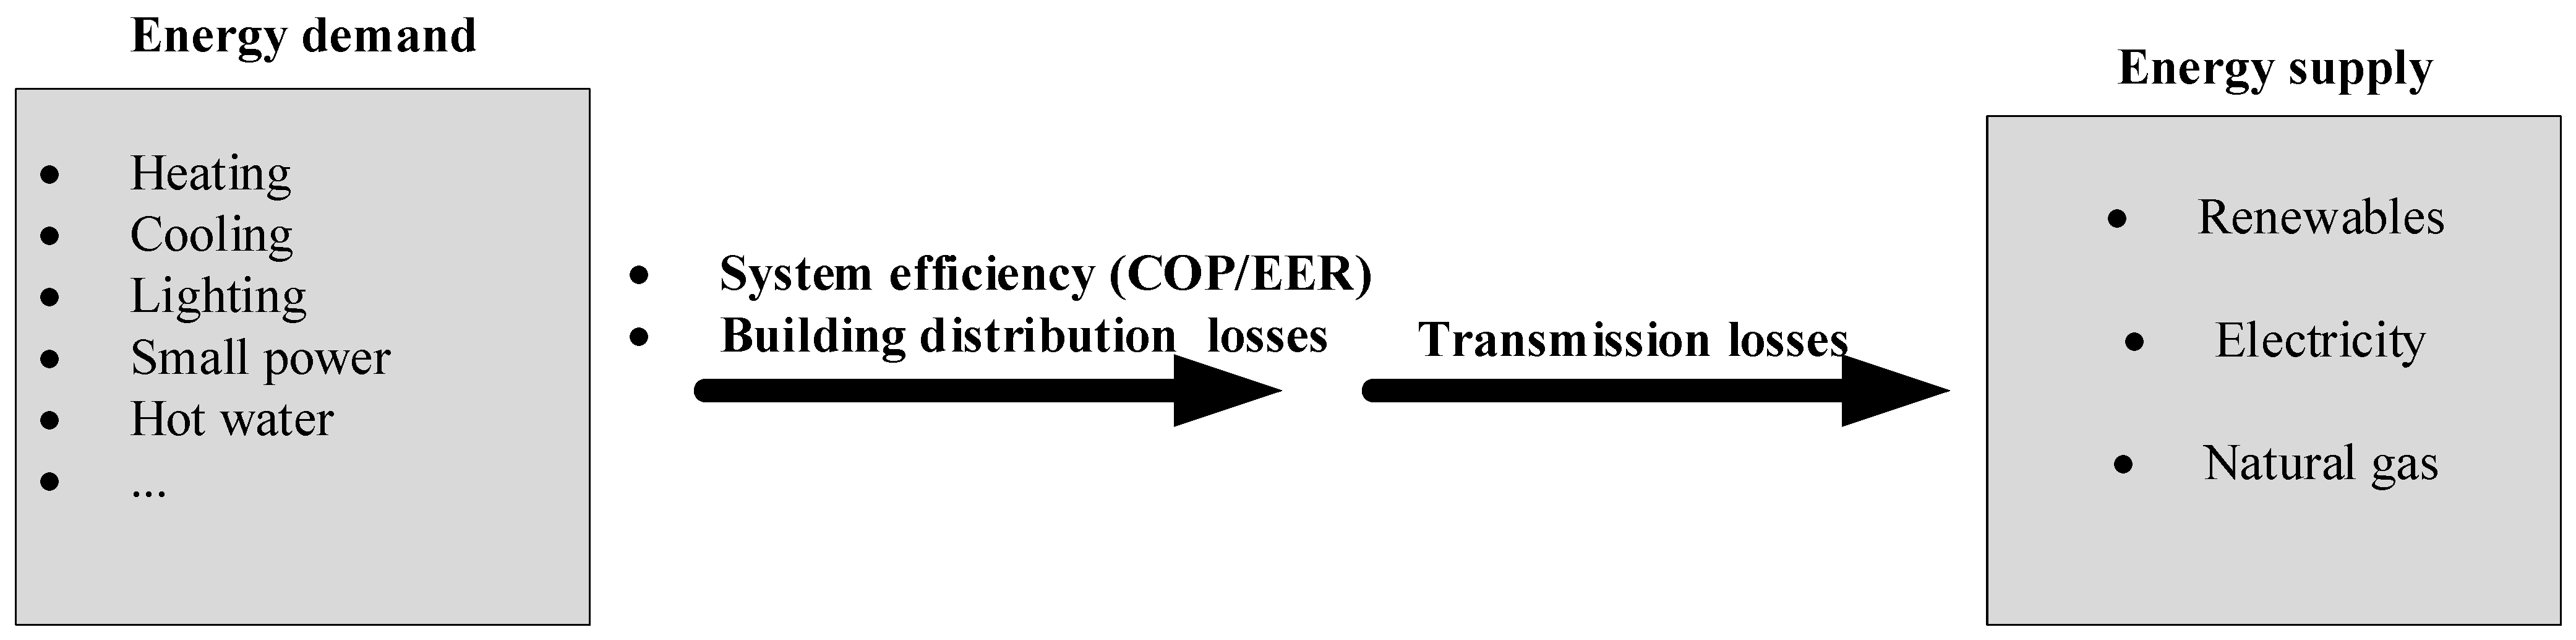
3. Method
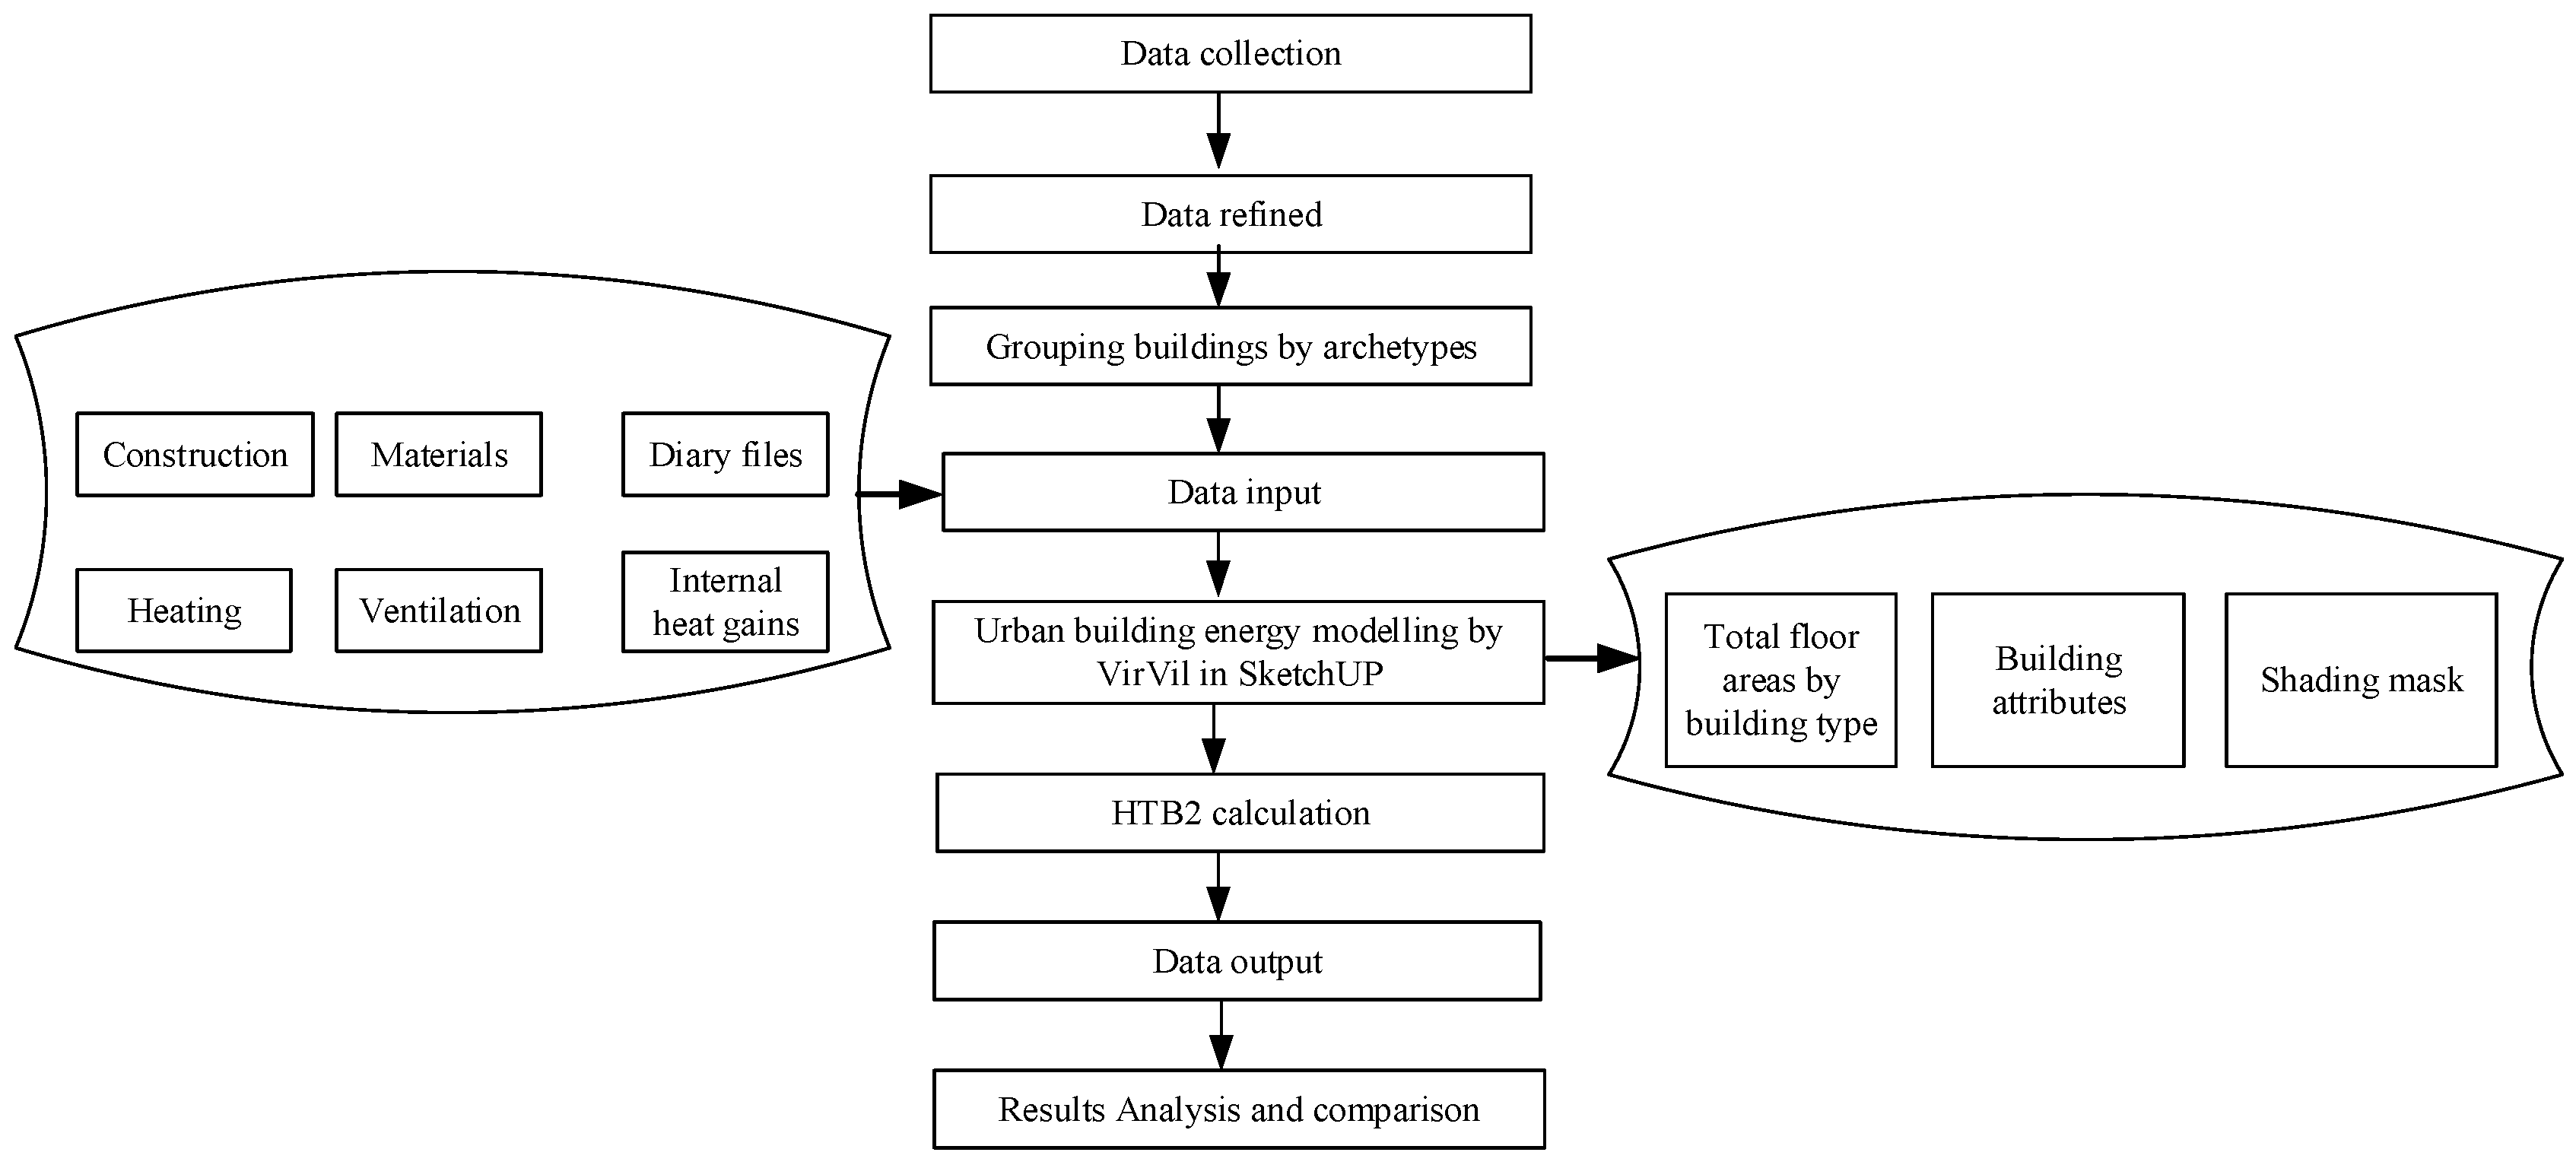
Figure 3 illustrates the process flow of the study, which can be broken down into three main steps. In step 1, data were collected, refined, and input. Buildings are also grouped based on their similar functions in this step. The second step involved urban building energy modelling by VirVil SketchUp plug-in and HTB2 calculation. The monthly calculation was used to calculate energy demand, and the results were output and compared with the benchmark level in step 3.
3.1. Model Assumption and Principles
Data input and simulation were based on several assumptions. For example, each type of urban building energy model was viewed as a single function, regardless of its multifunctional. Although some of the buildings we investigated were mixed-use, they were still classified as single-use for simulation. A second problem was the lack of fabric construction data for residential buildings; therefore, we used local design standards (The design standard for energy efficiency of residential buildings in hot summer and cold winter zone (2010); the design standard for energy efficiency of public buildings (2015)) for some parametric settings. Building energy modelling was based on two principles:
- (1)
Topography, imported to consider its shading influence on the buildings, thus modelling urban building clusters in the actual urban geometry from Google Earth, which can simulate how the urban environments influence urban building energy consumption.
- (2)
Group buildings as archetypes, based on their functions for the simulation.
Categorising buildings into archetypes highly depends on the functions of buildings. VirVil plug-in developed by the welsh school of architecture, Cardiff University, is used to quantify energy consumption from building stock in this study [
28]. It is based upon the calculation engineering of HTB2 (heat transfer in buildings) by modelling energy building stock [
29]. This study only focuses on predicting operational energy consumption.
3.2. Data Description and Collection
This study used data collected, between 2015 and 2016, from the on-site survey, literature, local and national regulations, and websites.
Table 2 illustrates the ways to collect these data. Data collected via on-site surveys are building information (their functions and floor areas), thermal properties (U values) (shown in
Table 3), fabric constructions (materials, construction, and glazing type), internal gains, and diary files.
3.3. Building Energy Modelling
3.3.1. The Software Used in This Research
The software adopted in this research includes HTB2 and VirVil SketchUp plug-in. Both of them are developed at the Welsh School of Architecture, Cardiff University.
HTB2 is a computer program designed for simulating the energy and environmental performance of buildings. It is also able to carry out dynamic thermal simulation and apply it to the field of low carbon design and energy efficiency of buildings. It has been developed for thirty years and extensively tested and validated [
30].
The VirVil SketchUp plug-in is an extension development of HTB2 for urban scale modelling. By linking SketchUp with HTB2, it can effectively simulate the energy demand for multiple buildings on a community or urban scale, considering the shading effects from adjacent buildings.
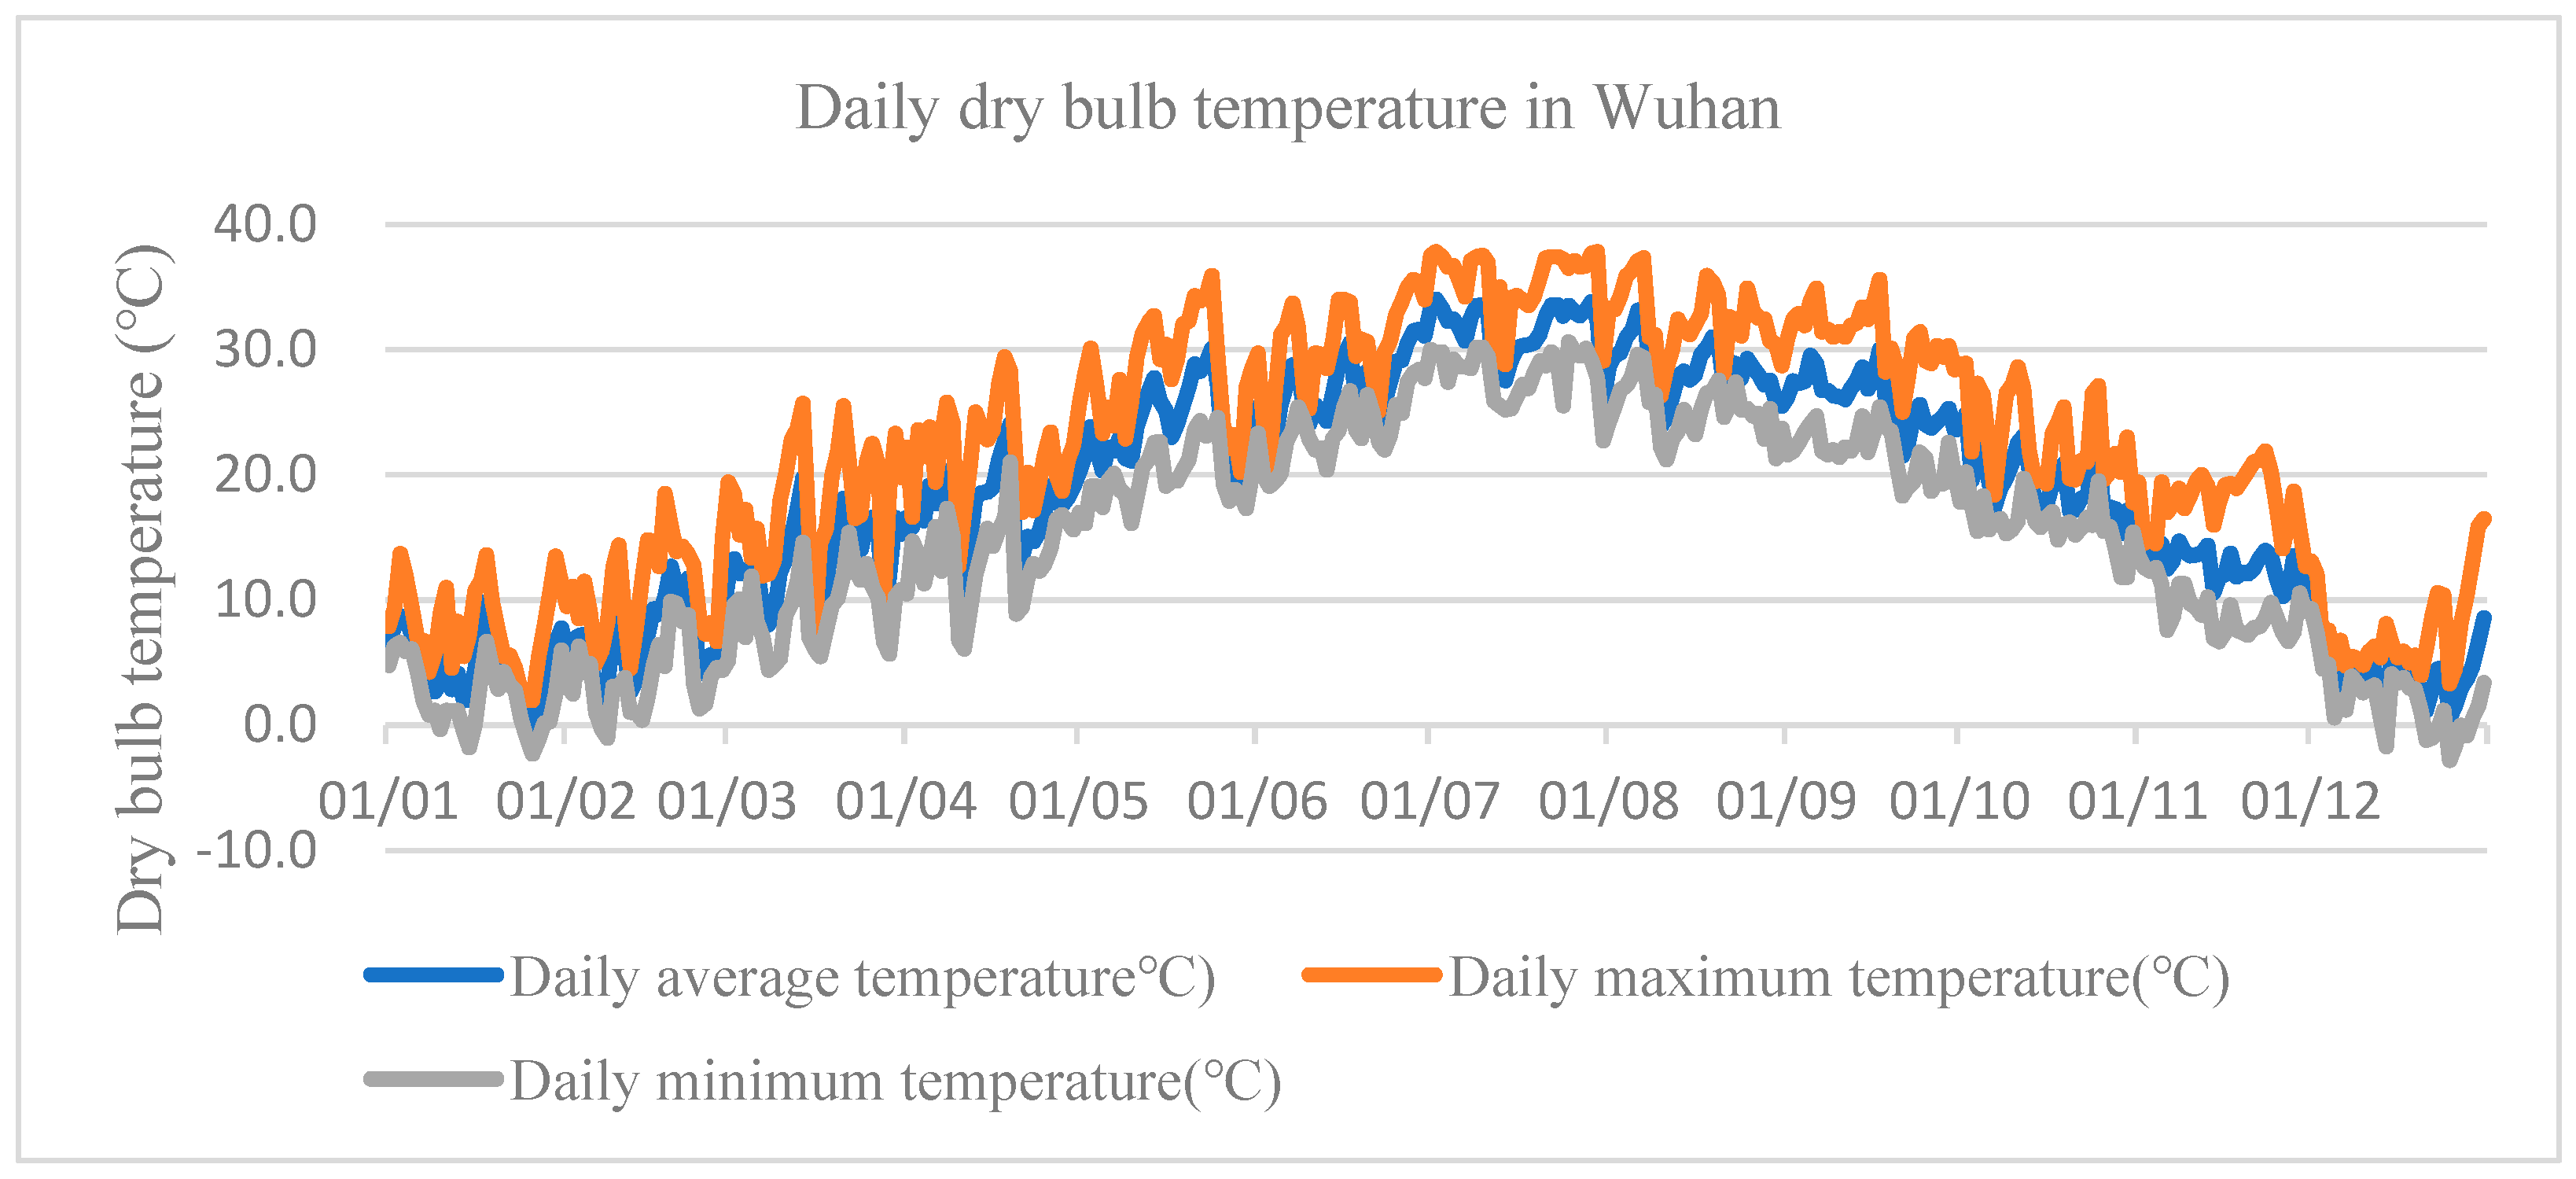
3.3.2. Climatic Characteristics in Wuhan
Wuhan is in the hot summer and cold winter zones and experiences a severe climate in summer and winter periods. It is extremely hot in July and August and freezing during the cold winter period in January. Temperatures in the city average around 18 °C throughout the year. January is the coldest month, with an average temperature of minus 10 °C. Without the effect of direct solar radiation, the temperature can reach almost 40 °C in July and August, as shown in
Figure 4.
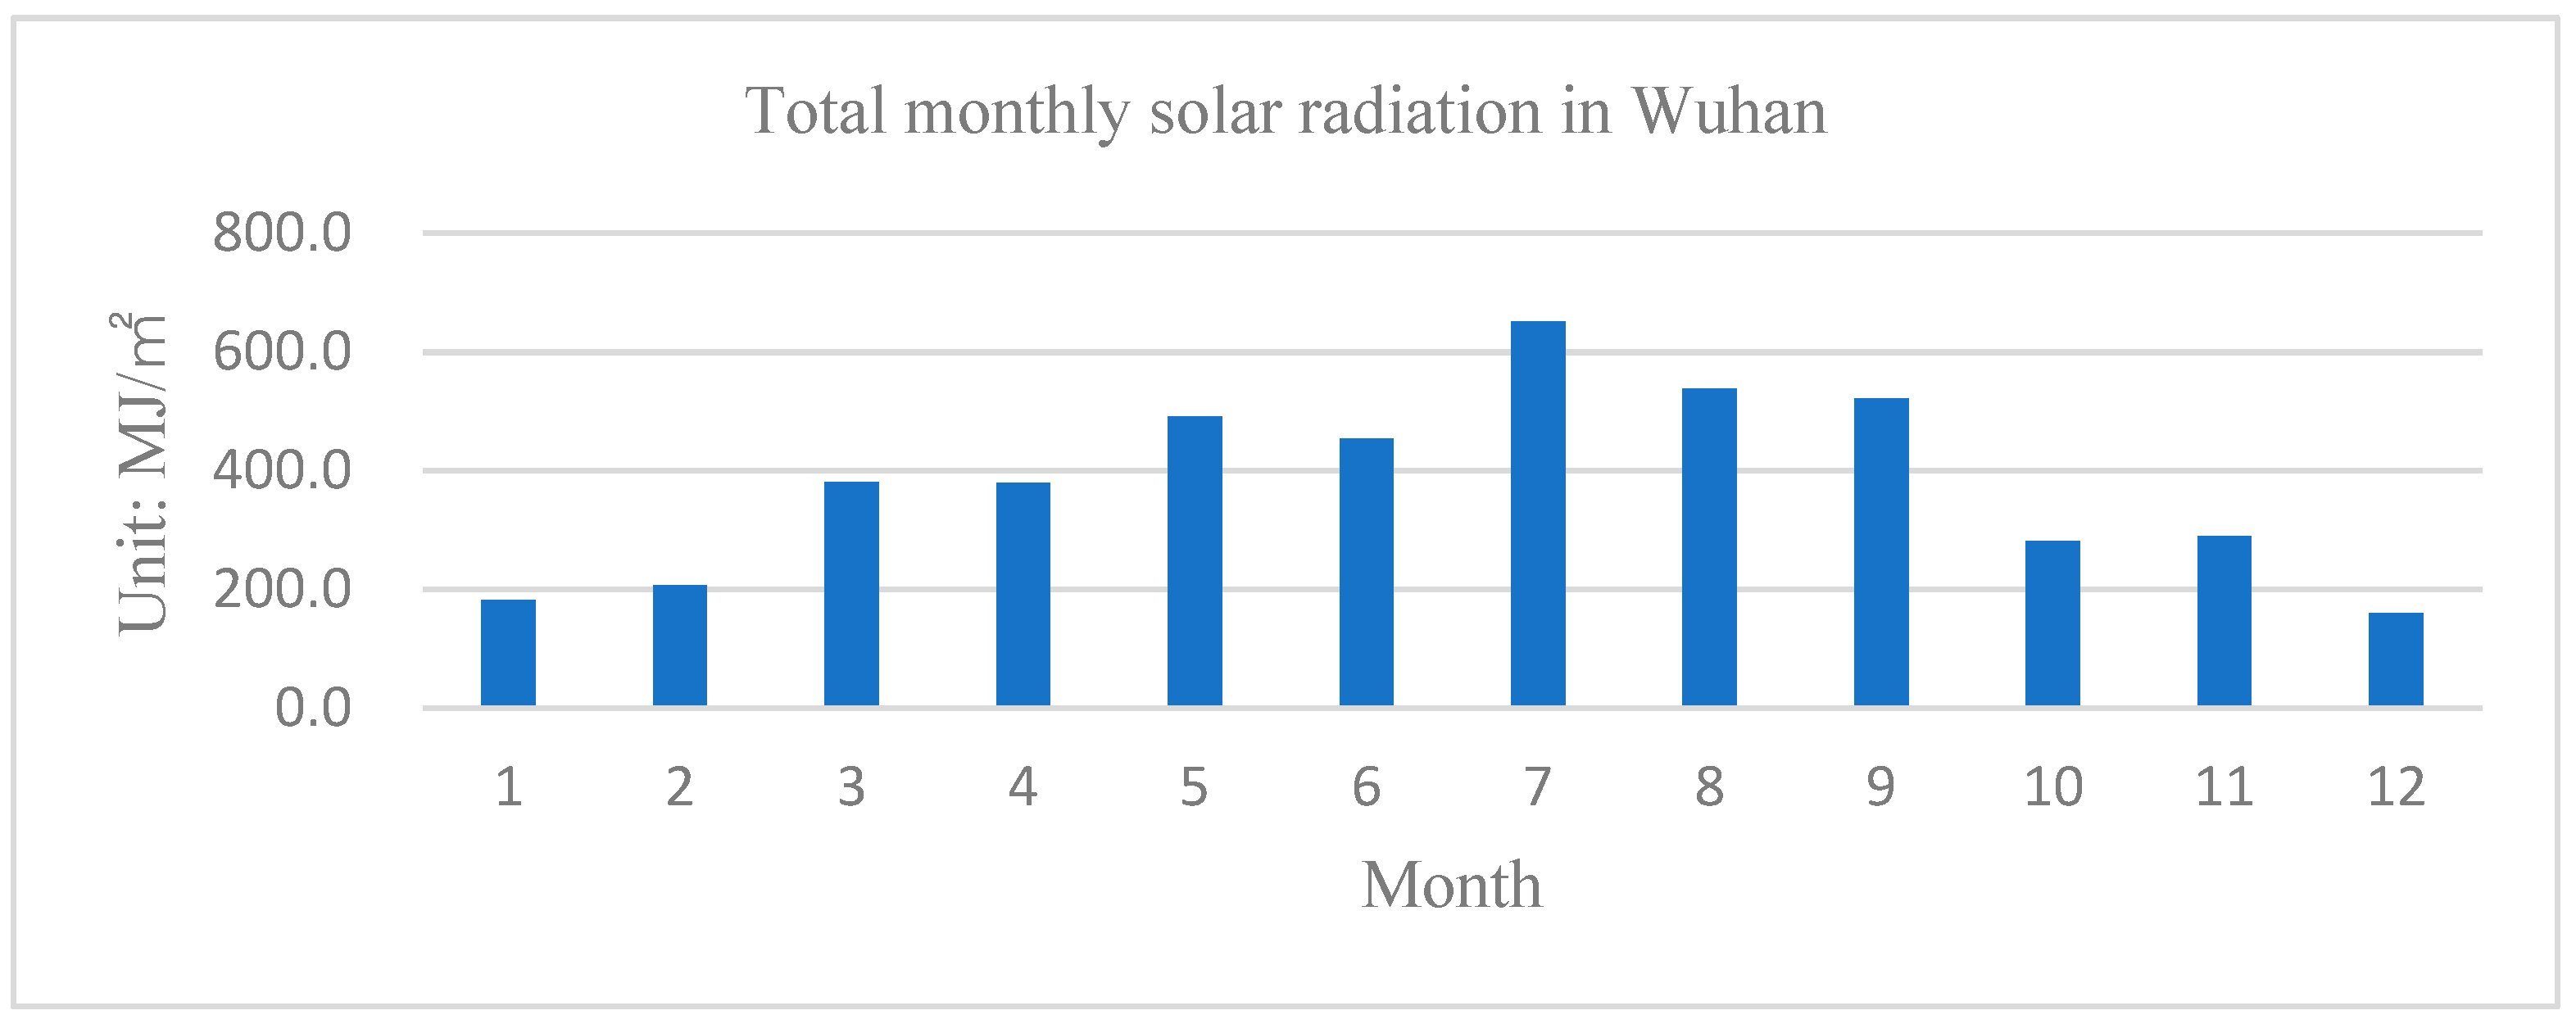
In July, solar radiation peaks, with 650 MJ/m
2, as shown in
Figure 5, for total monthly solar radiation.
The meteorological parameters are derived from Wuhan city’s typical meteorological year (TMY) and used for energy simulations with HTB2. Meteorological data is available from the weather data of the EnergyPlus website (
https://energyplus.net/weather-location/asia_wmo_region_2/CHN/CHN_Hubei.Wuhan.574940_CSWD (accessed on 16 March 2022)), which was extracted and converted from a “. epw” format into a “. met” format by using the HTB2 Weather File Software.
3.4. Simulation and Comparison
Simulation of the urban environment is complex, but the methodology simplifies it by using simple energy prediction tools and grouping similar buildings. Buildings are typically grouped according to their functions, such as residential, commercial, or office, which is reasonable for simple problems. The best way to group buildings in this study is based on their size and construction date. In order to achieve this, several building types are surveyed, and the results of these surveys are pooled together to produce groups of buildings with similar energy predictions. The time step for the calculation is set for 60 s, and the total run length is 365 days, as is the annual energy demand. After the simulation, outcomes are compared with the benchmark levels of the literature to validate the accuracy of the simulation.
4. Case Study
4.1. General Introduction to the Study Area
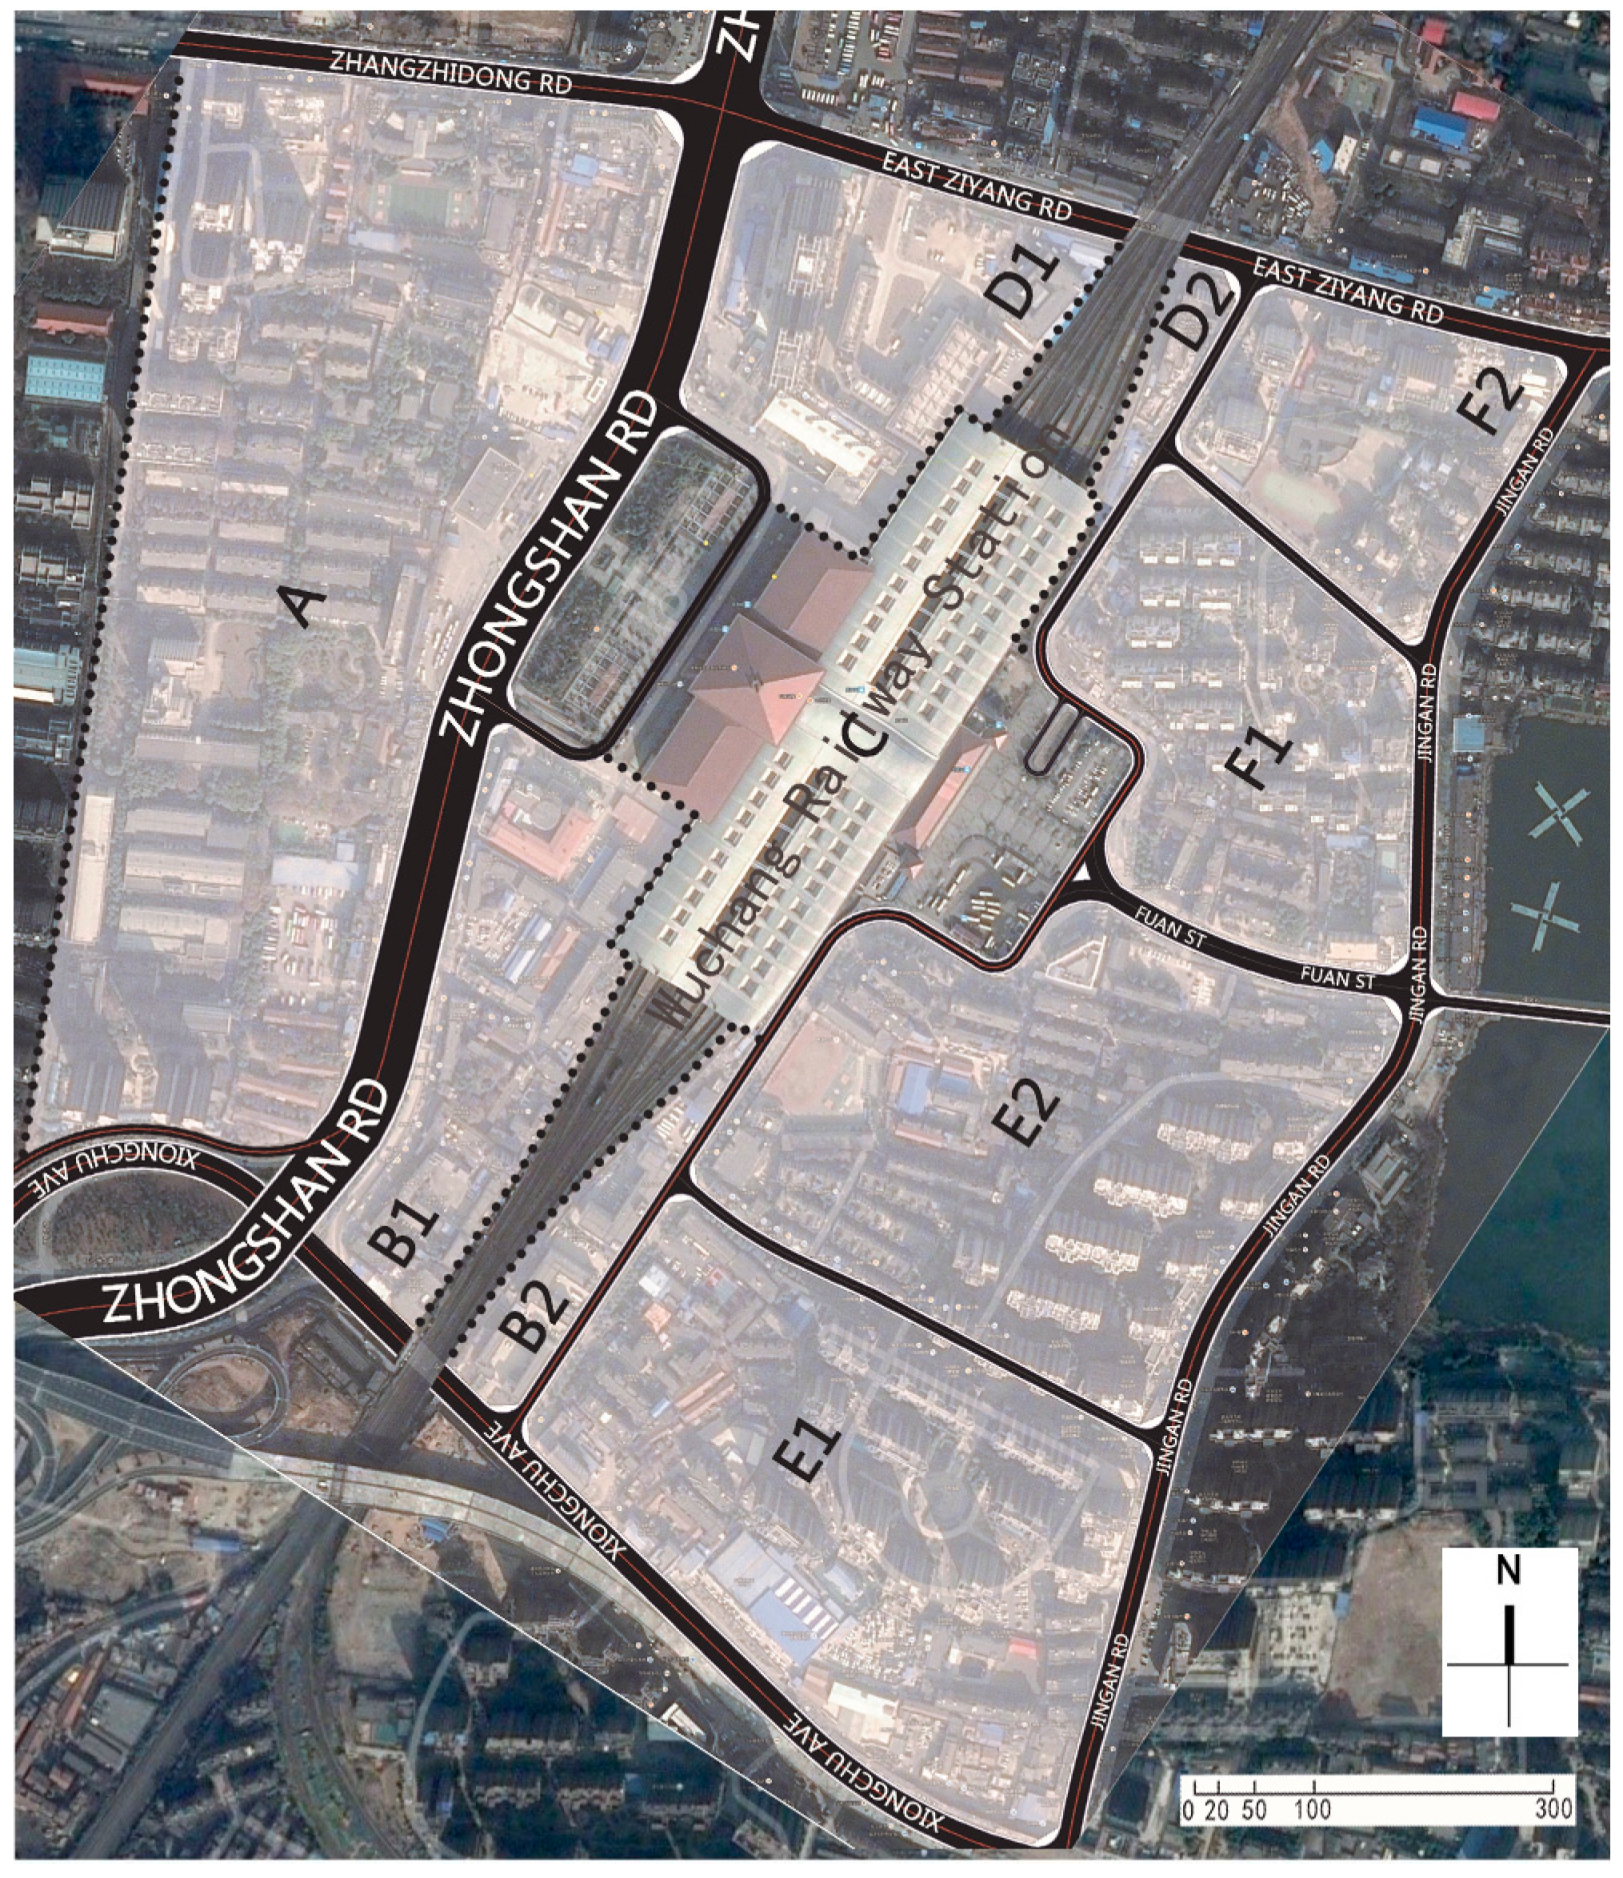
The city of Wuhan is regarded as a city representative of hot summer and cold winter climatic zone in China. The urban building energy modelling consists of ten typical block zones near Wuchang railway station, at a radius of 1km, with an estimated area of 1.92 km
2, as displayed in
Figure 6.
The majority of selected building blocks within the Wuchang district were built from the 1960 to the 2000s, with a wide range of building types, such as commercial, residential, hotels, and offices.
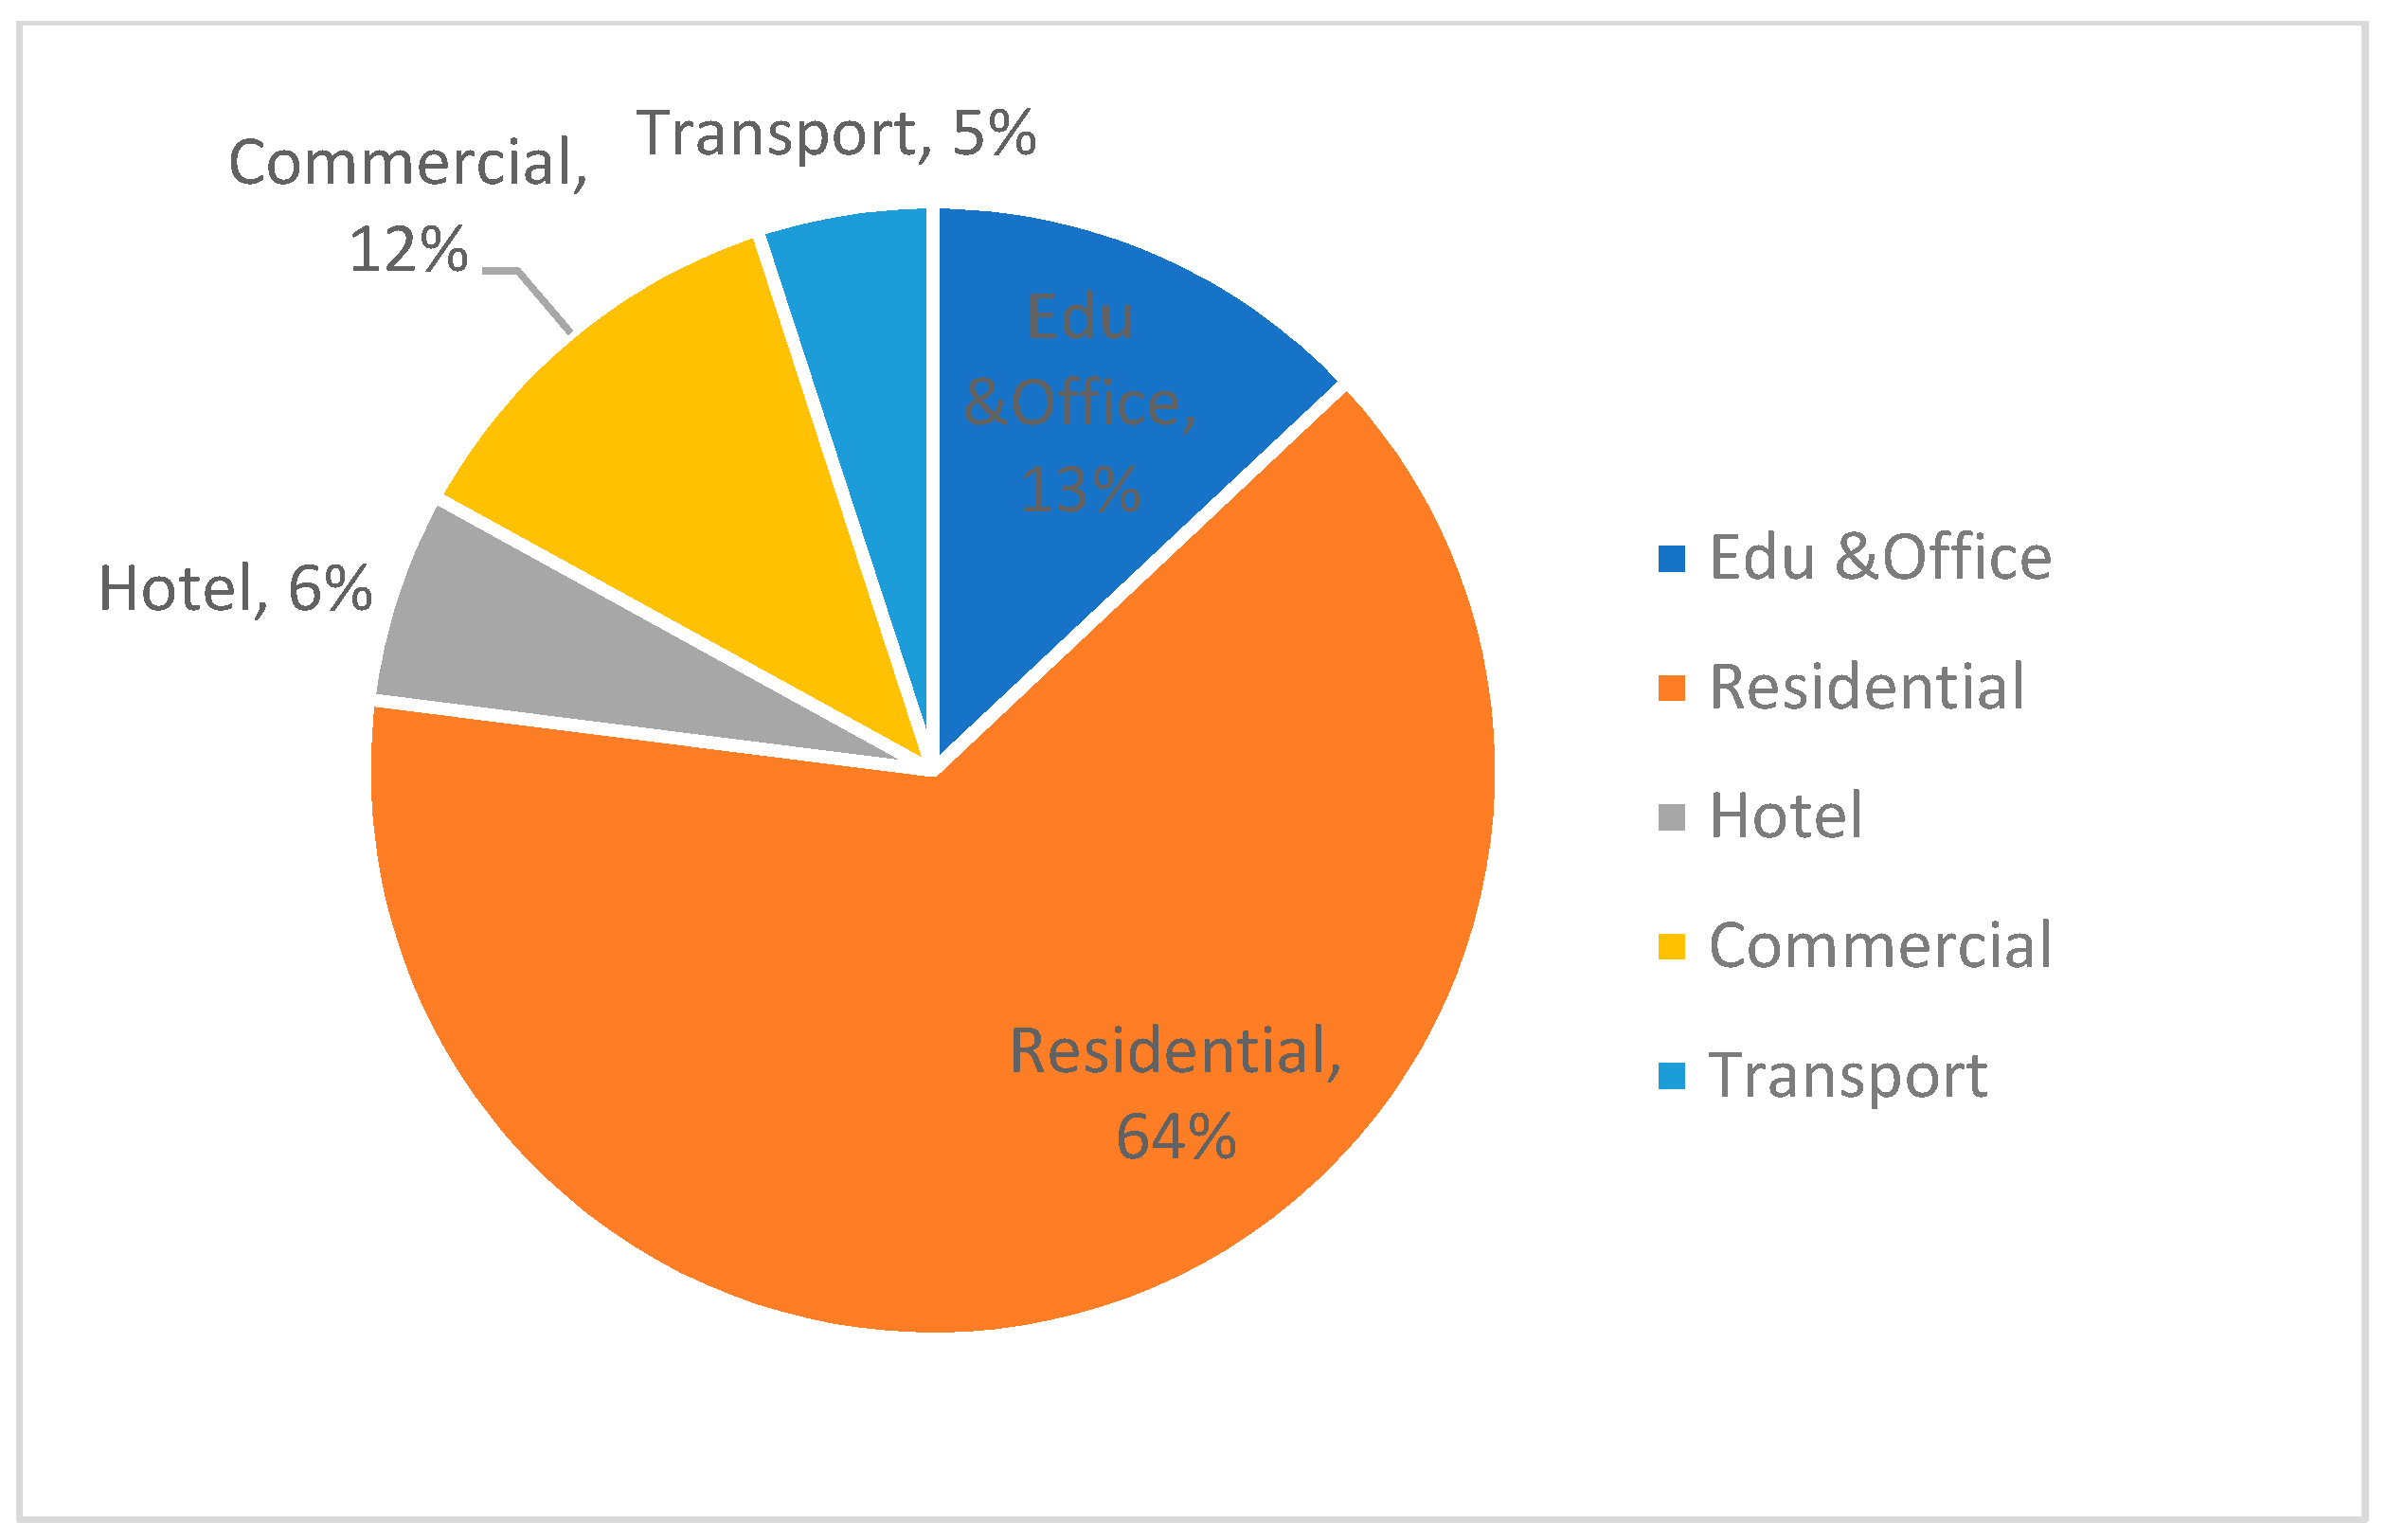
Table 4 shows in-depth information for every block zone. As shown in
Figure 7, 64%, 13%, and 12% of the buildings are residential, educational, offices, and commercial. Apart from the west square of the railway station, residential dwelling is the main building category in the eastern part of the station.
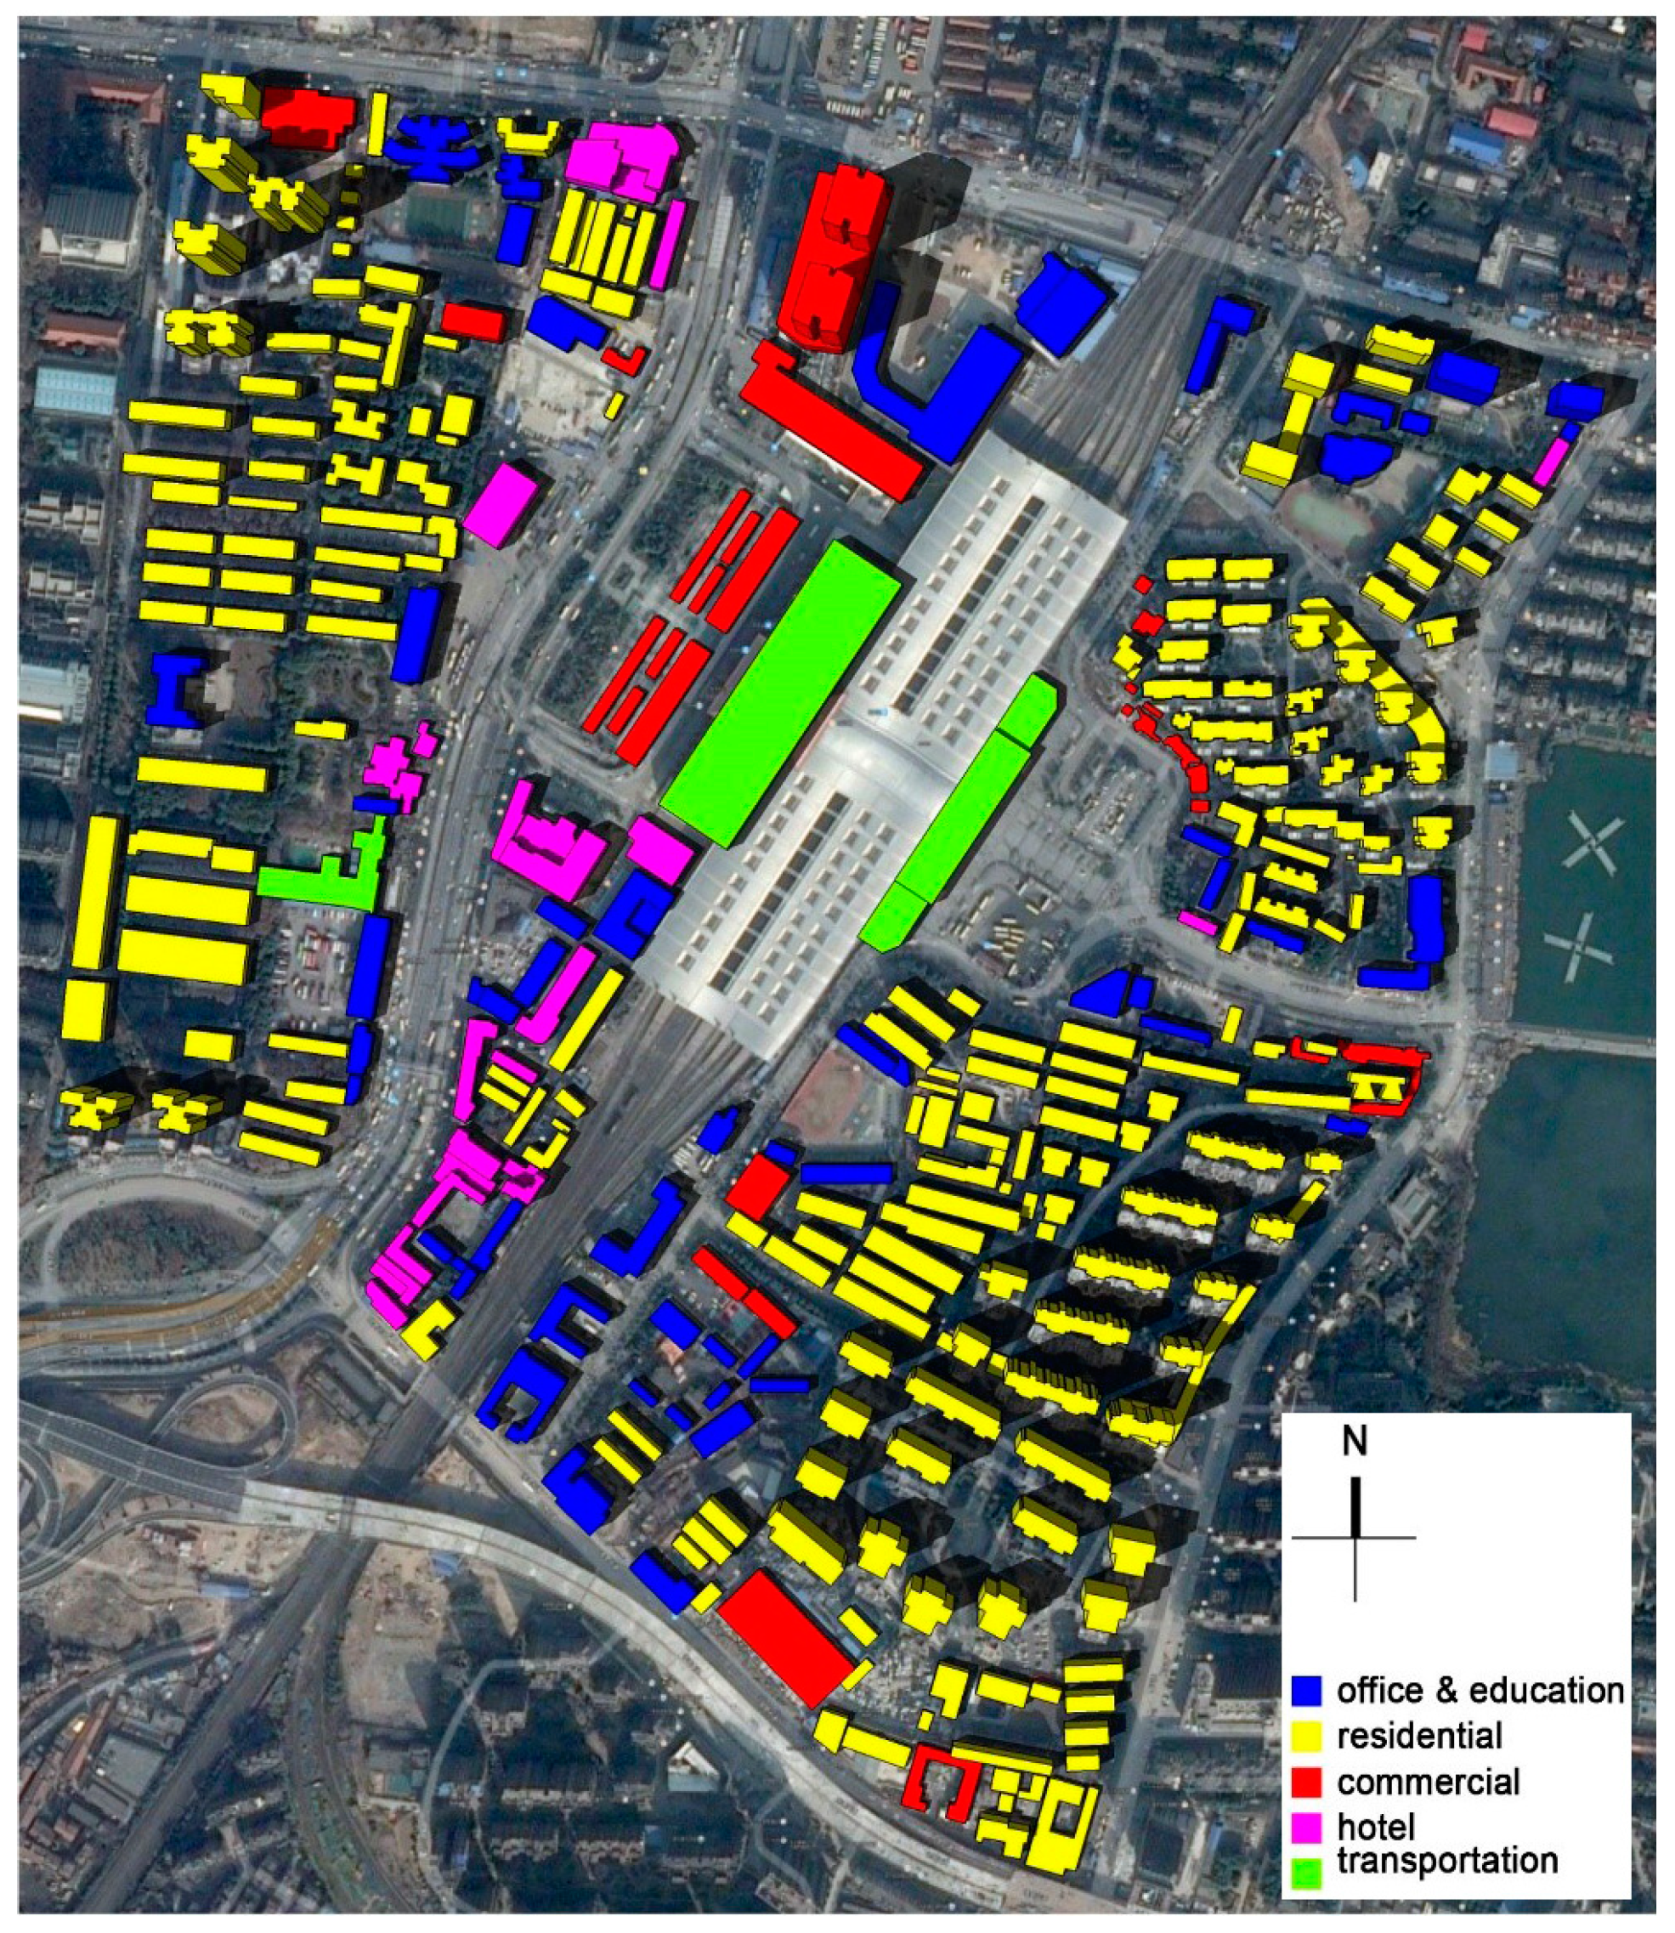
4.2. Modelling Building Stock Energy Consumption
The most effective method of predicting the energy consumption of building blocks is modelling simulation. All the building archetypes will be modelled by SketchUp and calculated using the VirVil plug-in, which simulates the dynamic thermal performance of building stock. The plug-in was developed by Cardiff University and established a platform-linked calculation tool, HTB2, and a modelling tool, SketchUp.
The difference between VirVil with other simulation tools is that it could identify the interaction upon the buildings and their surroundings [
32]. In addition, VirVil is a plug-in, which means it can be used conveniently with the SketchUp tool for modelling at the urban scale.
The buildings are designated into five categories for modelling purposes, as shown in
Figure 8. They are education and office, commercial, residential, transport, and hotel. A few detailed building characteristics (e.g., building shape) were simplified as they pose little significance to energy consumption. The accuracy of this method was validated by comparing the simulation results with a benchmark level from the literature.
4.3. Simulation Conditions
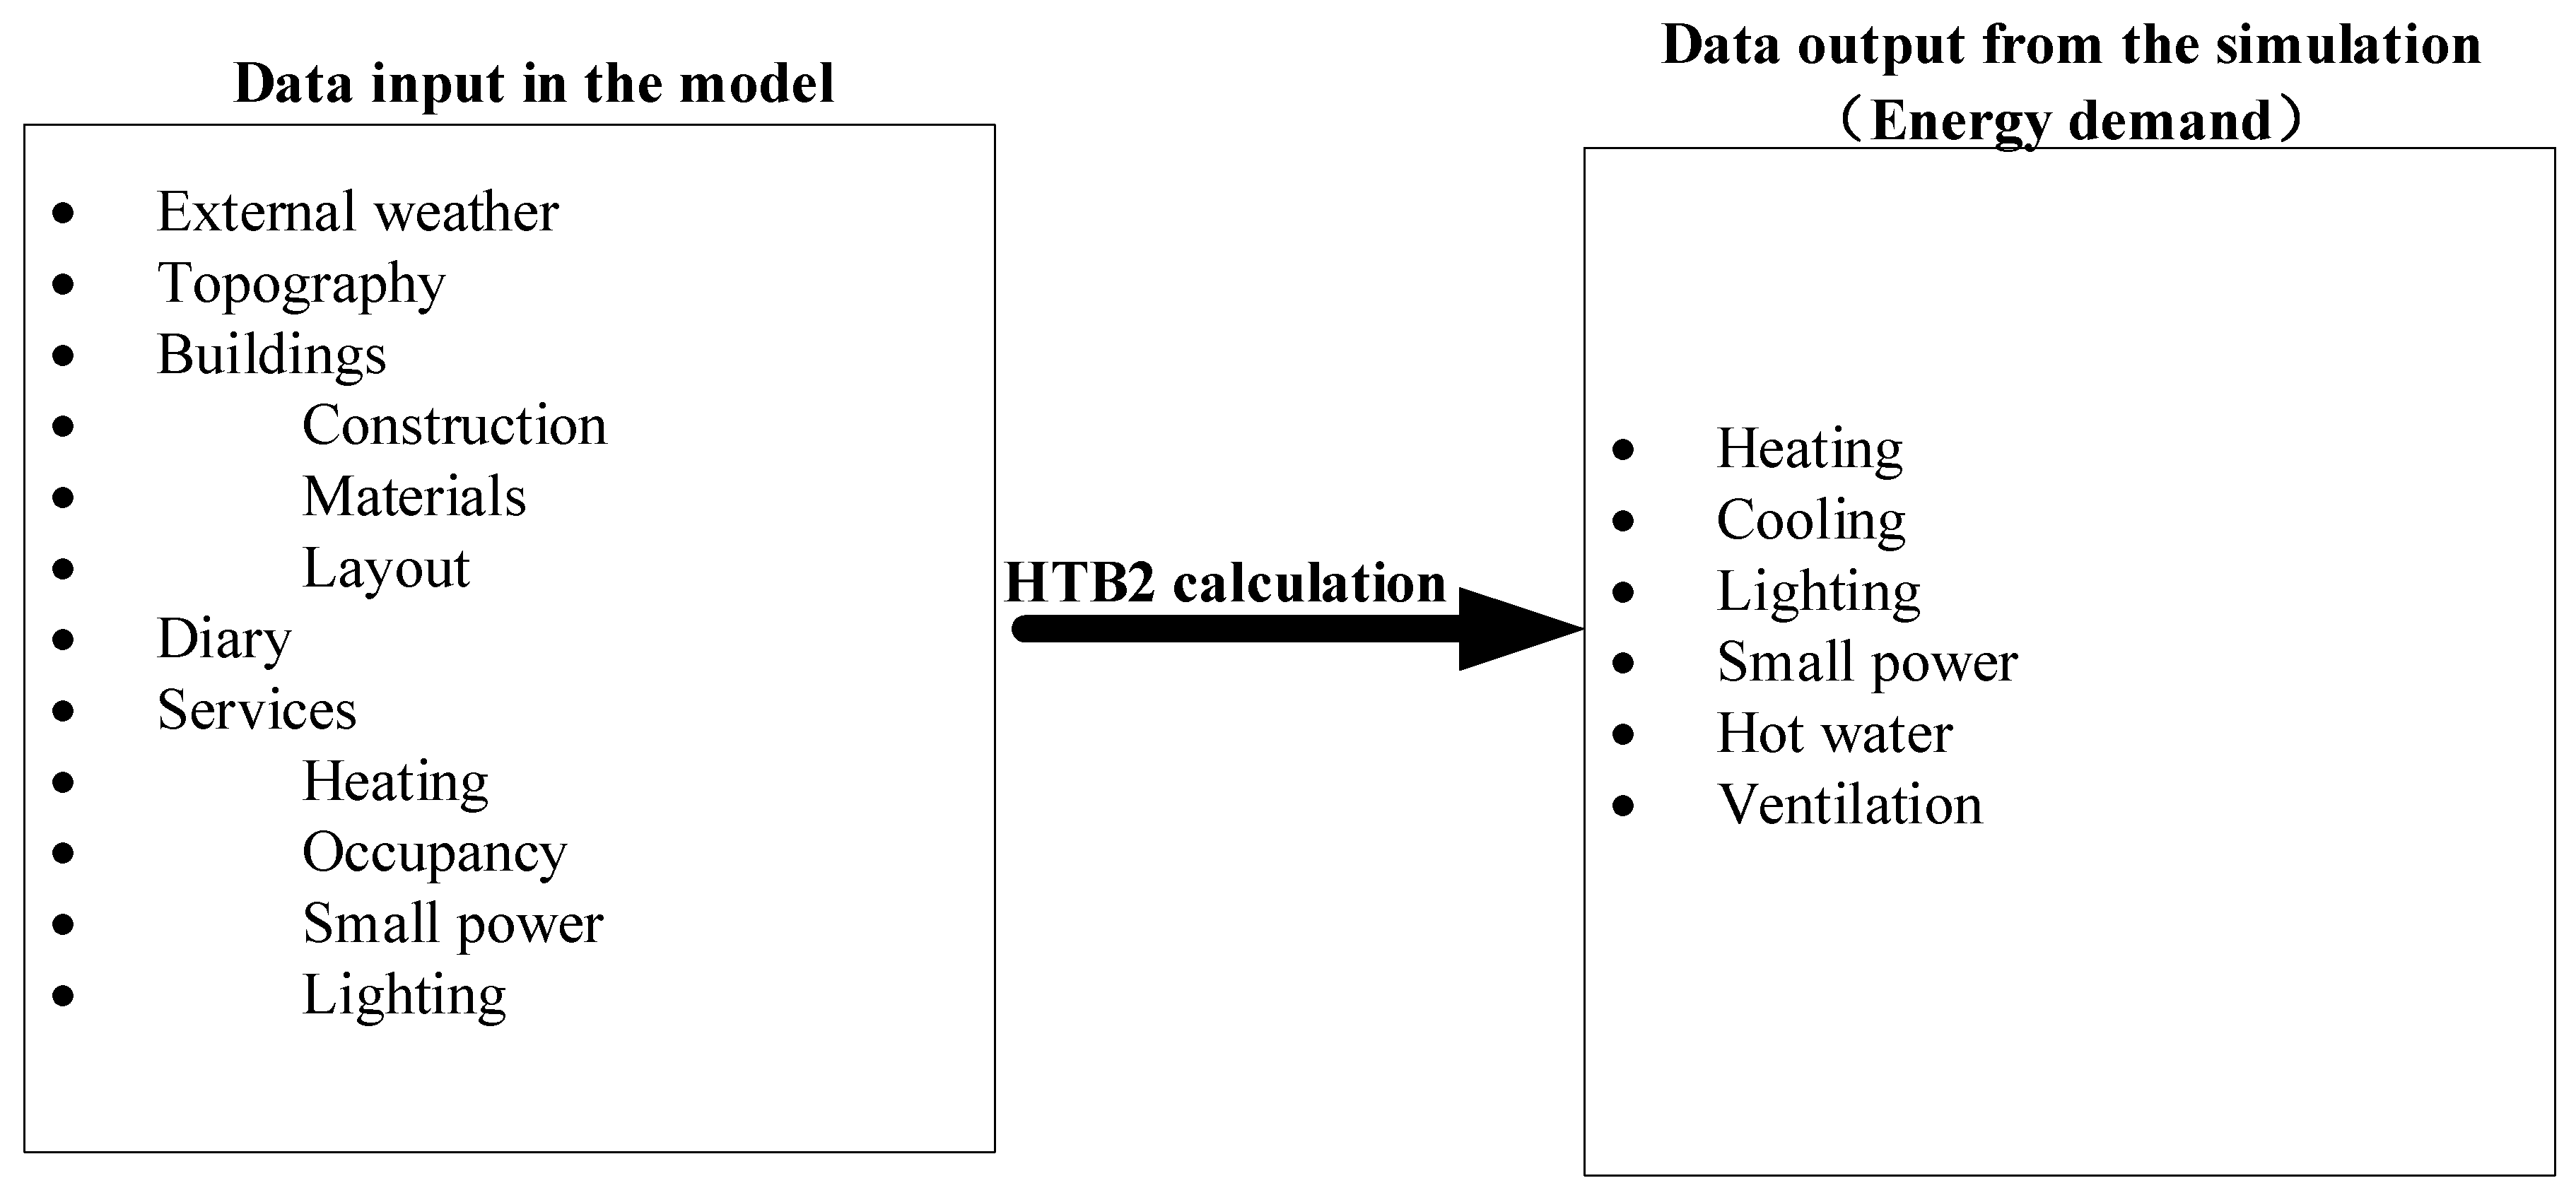
Data need to be input into the model to predict the energy demand of building stocks. Such data include fabric construction (ceiling, roof, walls, and floor), U value (thermal properties), climate conditions, the efficiency of space heating systems, and occupants. Simulations for heating and cooling demand are set under both local and national design standards with spatial data, such as building geometry, obtained through Google Earth. The details of the simulation setting, relating to building constructions, can be referenced from previous research [
31]; data input and output are shown in
Figure 9, and the operational schedule is set in
Table 5.
5. Results Analysis and Validation
5.1. Results Analysis
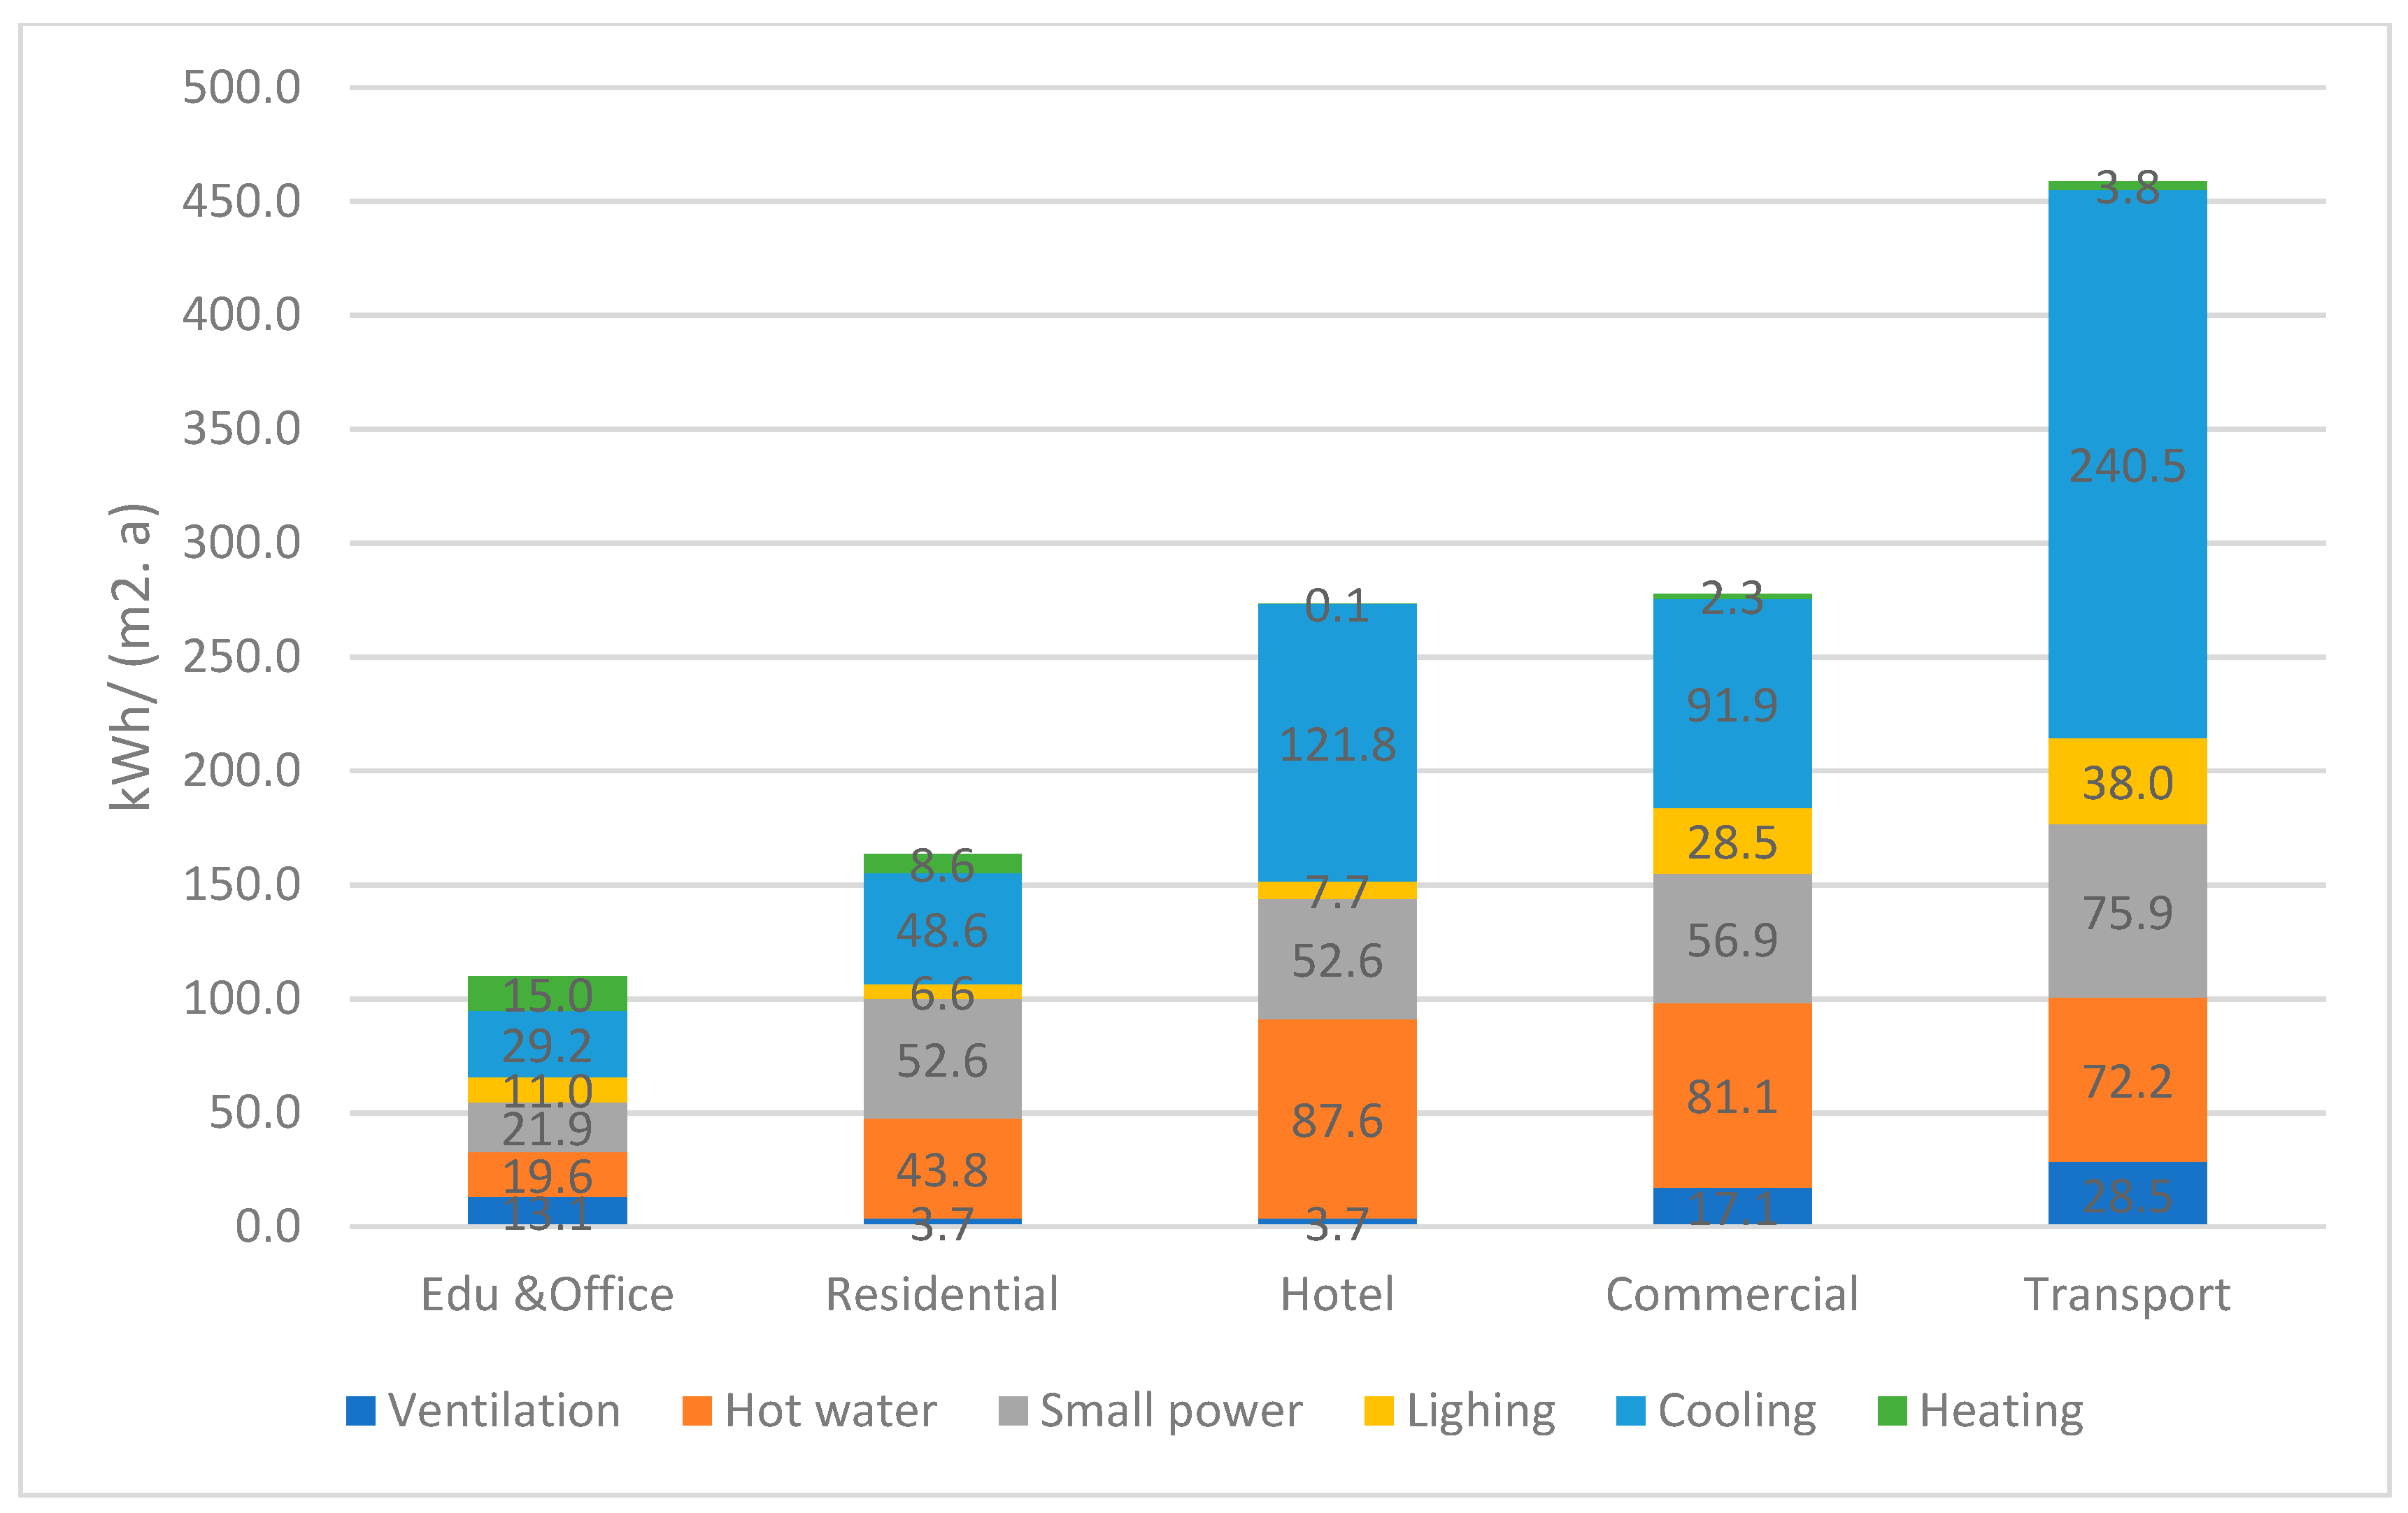
Results of the simulation are operational energy demands from cooling and heating and other components, such as lighting, hot water, and small power, as depicted in
Figure 10. Building types influence energy consumption, and electricity and natural gas are major contributors to carbon dioxide emissions.
Table 6 shows the annual energy demand for heating and cooling among five building types. There is a noticeable difference between the energy demand for cooling and heating in the study area. In terms of cooling energy demand, residential buildings consume 45 GWh per year, followed by transport and commercial buildings. This may be because these types of buildings have the largest floor areas, therefore requiring the most cooling energy. While the areas occupied by transport buildings are not as large as other buildings, they consume more energy, as they are open 24 h a day, especially during extreme weather conditions.
Figure 11 depicts the energy demand of five types of buildings. These are cooling, hot water, SPW (small power), lighting, ventilation, and heating, with negligible proportions. Despite having the smallest floor area, transport buildings consume the most energy, followed by hotels and commercial buildings. Based on their functions and operational schedule, these features demonstrate high potential for energy savings in commercial and transportation buildings.
Figure 11 also shows that the energy intensity (kWh/m
2/a) from transport and commercial buildings is higher than that from residential and office buildings, clearly visible. It may be attributed to two factors: the longer time spent in daily operation in these two types of buildings and large number of people inside, which results in greater cooling demand in summer.
5.2. Results Validation
Table 7 compares the benchmark of energy use intensity, with the modelling prediction results for transport, commercial, hotels, office, and educational buildings; it clearly shows that the prediction results are in line with the benchmark, apart from residential buildings, which are more than the benchmark. There are several possible reasons for this. Firstly, the investigation does not provide data on the façade of residential buildings, so the simulation is based on local building design standards. As such, this differs from actual situations, which would result in a discrepancy in energy demand for residential buildings.
Moreover, since most residential buildings date back to the 1990s, while public buildings were constructed around 2005, the heating systems in most of them are inefficient and outdated. Additionally, central cooling systems were not used in Wuhan at that time, contributing to the high energy use intensity of the residential buildings. These factors would significantly affect the difference between the predicted energy use intensity and benchmark level of residential buildings.
6. Discussion and Conclusions
This study employs physical-based, bottom-up models to predict urban building operational energy demand, and the modelling process involves data inputs, modelling, and validation. However, physical-based, bottom-up models are based on calculating every building’s energy consumption, and they can deal with the interconnections between the buildings and the surrounding environment, e.g., shading effects. These models need a vast amount of data to characterise every building and require significant computational effort. Therefore, they are typically used for highly technical purposes, such as providing high-quality data for energy planning, large-scale community retrofitting, and optimisation.
For urban building energy model simulations, the largest uncertainty is associated with the definition and detailed description of archetypes that represent a building stock reliably. In most cases, it is impossible to estimate simulation uncertainty or calibrate an urban building energy model to reduce errors, because there is a tight restriction on access to measured building energy use and general lack of knowledge about the thermal properties of buildings.
The validation studies of urban building energy models for larger groups of buildings showed good agreement with measurements, but simulation errors were significantly higher for individual buildings [
7,
34].
This research made the building operational energy demand forecast based on hot summer and cold winter climatic zones, as an example, not considering other climate zones. However, energy demand from buildings is highly correlated with climate conditions particularly used for heating and cooling. Additionally, there were assumptions during the modelling of the building stock. For example, commercial buildings may have a mixed-function purpose. VirVil treats each type of building as a single function and the whole individual building as a thermal zone for calculation.
Furthermore, buildings consume energy from the whole life cycle. This research only focuses on operational energy consumption, while disregarding other processes, such as materials production and transport (embody energy).
This research successfully uses an archetype physical-based, bottom-up method to forecast the energy demand from building stock at the urban level. It concludes:
An archetypal physics-based, bottom-up approach is feasible to predict urban energy consumption from building stock. Compared with the predicted outcome, the benchmark level proves that this is a feasible and reproducible approach.
Findings indicate that transport and commercial buildings used the most energy, significantly more than office and residential buildings. Consequently, these two types of buildings would receive more attention for energy efficiency.
The cooling demand far outweighs the heating demand across all building types in Wuhan. Hence, improving system cooling efficiency is a priority for energy savings.
Author Contributions
Methodology, Q.D.; conceptualisation, C.L.; formal analysis, Q.J., M.M. and Y.B.; investigation, M.M. and Y.B.; resources, Q.D. and C.L.; data curation, M.M. and Y.B.; writing—original draft, Q.J.; writing—review and editing, Q.J.; supervision, C.L.; project administration, X.Z.; funding acquisition, X.Z. All authors have read and agreed to the published version of the manuscript.
Funding
This study was funded by the Fundamental Research Funds for the Central Universities (WUT: 2021IVA006B; 2021IVA034) and Hubei Provincial Natural Science Foundation (grant no. 2021CFB005).
Informed Consent Statement
Not applicable.
Conflicts of Interest
The authors declare no conflict of interest.
References
- Hong, T.; Chen, Y.; Luo, X.; Luo, N.; Lee, S.H. Ten Questions on Urban Building Energy Modeling. Build. Environ. 2020, 168, 106508. [Google Scholar] [CrossRef] [Green Version]
- Ding, C.; Feng, W.; Li, X.; Zhou, N. Urban-Scale Building Energy Consumption Database: A Case Study for Wuhan, China. Energy Procedia 2019, 158, 6551–6556. [Google Scholar] [CrossRef]
- Statista China: Urbanisation. 2021. Available online: https://www.statista.com/statistics/270162/urbanization-in-china/ (accessed on 20 February 2022).
- National Bureau of Statistics of China China Statistical Yearbook; China Statistics Press: Beijing, China, 2020.
- Wong, C.H.H.; Cai, M.; Ren, C.; Huang, Y.; Liao, C.; Yin, S. Modelling Building Energy Use at Urban Scale: A Review on Their Account for the Urban Environment. Build. Environ. 2021, 205, 108235. [Google Scholar] [CrossRef]
- Hong, T.; Langevin, J.; Sun, K. Building Simulation: Ten Challenges. Build. Simul. 2018, 11, 871–898. [Google Scholar] [CrossRef] [Green Version]
- Reinhart, C.F.; Cerezo Davila, C. Urban Building Energy Modeling—A Review of a Nascent Field. Build. Environ. 2016, 97, 196–202. [Google Scholar] [CrossRef] [Green Version]
- Ferrando, M.; Causone, F.; Hong, T.; Chen, Y. Urban Building Energy Modeling (UBEM) Tools: A State-of-the-Art Review of Bottom-up Physics-Based Approaches. Sustain. Cities Soc. 2020, 62, 102408. [Google Scholar] [CrossRef]
- Kavgic, M.; Mavrogianni, A.; Mumovic, D.; Summerfield, A.; Stevanovic, Z.; Djurovic-Petrovic, M. A Review of Bottom-up Building Stock Models for Energy Consumption in the Residential Sector. Build. Environ. 2010, 45, 1683–1697. [Google Scholar] [CrossRef]
- Swan, L.G.; Ugursal, V.I. Modeling of End-Use Energy Consumption in the Residential Sector: A Review of Modeling Techniques. Renew. Sustain. Energy Rev. 2009, 13, 1819–1835. [Google Scholar] [CrossRef]
- Zhao, H.; Magoulès, F. A Review on the Prediction of Building Energy Consumption. Renew. Sustain. Energy Rev. 2012, 16, 3586–3592. [Google Scholar] [CrossRef]
- Bentzen, J.; Engsted, T. A Revival of the Autoregressive Distributed Lag Model in Estimating Energy Demand Relationships. Energy 2001, 26, 45–55. [Google Scholar] [CrossRef]
- Ali, U.; Shamsi, M.H.; Hoare, C.; Mangina, E.; O’Donnell, J. Review of Urban Building Energy Modeling (UBEM) Approaches, Methods and Tools Using Qualitative and Quantitative Analysis. Energy Build. 2021, 246, 111073. [Google Scholar] [CrossRef]
- Huo, T.; Ren, H.; Cai, W. Estimating Urban Residential Building-Related Energy Consumption and Energy Intensity in China Based on Improved Building Stock Turnover Model. Sci. Total Environ. 2019, 650, 427–437. [Google Scholar] [CrossRef] [PubMed]
- Li, W.; Zhou, Y.; Cetin, K.; Eom, J.; Wang, Y.; Chen, G.; Zhang, X. Modeling Urban Building Energy Use: A Review of Modeling Approaches and Procedures. Energy 2017, 141, 2445–2457. [Google Scholar] [CrossRef]
- Shorrock, L.D.; Dunster, J.E. The Physically-Based Model BREHOMES and Its Use in Deriving Scenarios for the Energy Use and Carbon Dioxide Emissions of the U.K. Housing Stock. Energy Policy 1997, 25, 1027–1037. [Google Scholar] [CrossRef]
- Ferrando, M.; Causone, F. An Overview of Urban Building Energy Modelling (UBEM) Tools. Build. Simul. 2020, 16, 3452–3459. [Google Scholar]
- Heiple, S.; Sailor, D.J. Using Building Energy Simulation and Geospatial Modeling Techniques to Determine High Resolution Building Sector Energy Consumption Profiles. Energy Build. 2008, 40, 1426–1436. [Google Scholar] [CrossRef] [Green Version]
- Lim, H.; Zhai, Z.J. Review on Stochastic Modeling Methods for Building Stock Energy Prediction. Build. Simul. 2017, 10, 607–624. [Google Scholar] [CrossRef] [Green Version]
- Foliente, G.; Seo, S. Modelling Building Stock Energy Use and Carbon Emission Scenarios. Smart Sustain. Built Environ. 2012, 1, 118–138. [Google Scholar] [CrossRef]
- Sun, K.; Hong, T.; Taylor-Lange, S.C.; Piette, M.A. A Pattern-Based Automated Approach to Building Energy Model Calibration. Appl. Energy 2016, 165, 214–224. [Google Scholar] [CrossRef] [Green Version]
- Chong, A.; Lam, K.P.; Pozzi, M.; Yang, J. Bayesian Calibration of Building Energy Models with Large Datasets. Energy Build. 2017, 154, 343–355. [Google Scholar] [CrossRef] [Green Version]
- O’Neill, Z.; Eisenhower, B. Leveraging the Analysis of Parametric Uncertainty for Building Energy Model Calibration. Build. Simul. 2013, 6, 365–377. [Google Scholar] [CrossRef]
- Yang, T.; Pan, Y.; Mao, J.; Wang, Y.; Huang, Z. An Automated Optimisation Method for Calibrating Building Energy Simulation Models with Measured Data: Orientation and a Case Study. Appl. Energy 2016, 179, 1220–1231. [Google Scholar] [CrossRef]
- Monetti, V.; Davin, E.; Fabrizio, E.; André, P.; Filippi, M. Calibration of Building Energy Simulation Models Based on Optimisation: A Case Study. Energy Procedia 2015, 78, 2971–2976. [Google Scholar] [CrossRef] [Green Version]
- Fonseca, J.A.; Schlueter, A. Integrated Model for Characterisation of Spatiotemporal Building Energy Consumption Patterns in Neighborhoods and City Districts. Appl. Energy 2015, 142, 247–265. [Google Scholar] [CrossRef]
- Sokol, J.; Cerezo Davila, C.; Reinhart, C.F. Validation of a Bayesian-Based Method for Defining Residential Archetypes in Urban Building Energy Models. Energy Build. 2017, 134, 11–24. [Google Scholar] [CrossRef]
- Cardiff University VirVil SketchUp Extension. Available online: http://u001.arch.cf.ac.uk/Plug-in/ (accessed on 16 January 2022).
- Jones, P.; Patterson, J.; Lannon, S. Modelling the Built Environment at an Urban Scale—Energy and Health Impacts in Relation to Housing. Landsc. Urban Plan. 2007, 83, 39–49. [Google Scholar] [CrossRef]
- Huang, J.; Jones, P.; Peng, R.; Li, X.; Hou, S. An Integrated Model for Urban Microclimate and Building Energy in High-Density Cities for Early Stage Design. In Proceedings of the 15th Conference of International Building Performance Simulation Association, San Francisco, CA, USA, 7–9 August 2017. [Google Scholar]
- Ji, Q. Investigating Low Carbon Development of High-Density Building Clusters Located around Railway Passenger Transport Hubs in China. Ph.D. Thesis, Cardiff University, Cardiff, UK, 2018. [Google Scholar]
- Bassett, T.; Lannon, S.C.; Waldron, D.; Jones, P.J. Calculating the Solar Potential of the Urban Fabric with SketchUp and HTB2. Presented at Solar Building Skins [Online]. Bressanone, Italy, 6–7 December 2012, Cardiff University, ORCA Website. Available online: https://orca.cardiff.ac.uk/41395/(accessed on 16 March 2022).
- Yu, Y.; Li, Y.; Xiang, D.; Jiang, X. Study on energy consumption quota of civil buildings in Wuhan. Build. Sci. 2014, 30, 106–112. (In Chinese) [Google Scholar]
- Dall’O’, G.; Galante, A.; Torri, M. A Methodology for the Energy Performance Classification of Residential Building Stock on an Urban Scale. Energy Build. 2012, 48, 211–219. [Google Scholar] [CrossRef]
| Publisher’s Note: MDPI stays neutral with regard to jurisdictional claims in published maps and institutional affiliations. |
© 2022 by the authors. Licensee MDPI, Basel, Switzerland. This article is an open access article distributed under the terms and conditions of the Creative Commons Attribution (CC BY) license (https://creativecommons.org/licenses/by/4.0/).


