Abstract
Structural frame systems that consists of concrete-encased-steel-embedded composite columns and reinforced concrete beams are typically used in mid-rise to tall buildings. In order to understand their overall structural behavior, a total of 12 frame models with high and low ductility features were constructed and analyzed using LS-DYNA software. Two of these models were validated using the results of previously tested frames. The remaining 10 models were studied to predict the behavior of frames with varying concrete strengths, reinforcement configurations, and structural steel sections under vertical and lateral loads. The results were investigated in terms of cracks and failure patterns, load-deflection relationships, energy dissipation, and stiffness degradation. The analytical results indicated that the high ductile frame models showed slightly better lateral load carrying performances compared to low ductility frame models. Moreover, the analytical studies demonstrated that the existence of structural steel in a column, regardless of its cross-sectional shape, was the most important parameter in improving the lateral load carrying capacity of a frame.
1. Introduction
A reinforced concrete (RC) frame, which is an assembly consisting of RC columns and beams, should resist and transfer loads to the ground safely without exceeding the allowable strengths of its members. These frames have a wide range of use in building construction. However, due to excess loading conditions and limitations on column sizes, a composite column may be needed, consisting of a structural steel shape combined with concrete and steel reinforcements [1]. Depending on need and preference, a composite column may be formed either by using a steel-encased RC column (SRC) or an RC-encased-steel-embedded column (RCS).
Since the mid-1960s, a great deal of experimental work has been conducted on these frame members or assemblies to evaluate their structural performances under various loading conditions [2,3]. However, these tests exhibited deficiencies, since the specimens did not include the impact of test parameters, such as varying concrete compressive strengths, rebar configurations, and structural shapes. The inclusion of these parameters in a test matrix presents a challenge due to the increase in the number of test variations. Therefore, sound analytical models must be produced and calibrated based on the test data available in the literature. These analytical studies can then be used to eliminate the deficiencies stated above and used to predict the behavior of composite column and beam assemblies.
Many experimental and analytical studies have been conducted on composite columns to determine their structural behavior under various loading conditions. In these studies, the following parameters were investigated: the effect of concrete confinement, the presence of various structural steel sections with high strength steel, the usage of concrete with steel fibers, different column lengths, and eccentric loading conditions. Covering a time span of almost 20 years, some of these studies are listed chronologically below. In 2004, the existing American and Eurocode code requirements (ACI 318-02 and Eurocode 4) were compared to each other through test results, representing a total of 150 composite columns, compiled from the literature [4]. In 2014, the effects of stirrups and embedded-steel section depth ratios on composite columns, subjected to low cyclic reversed loading, were tested in order to evaluate an existing guideline for designing tall buildings in China [5]. In 2015, the structural behavior of composite columns with normal and high strength concrete features were experimentally investigated [6]. The impact of concrete confinement on the structural behavior of composite columns with wide-flange structural steel shapes, subjected to cyclic loading, was also examined through a series of experimental tests in 2016 [7]. In the same year, another experimental study was conducted on steel-reinforced high strength concrete composite columns to determine their seismic behaviors, under simulated earthquake loads, by focusing on the axial load level, stirrup arrangement, structural steel details, and the presence of shear studs welded on these columns [8]. In 2018, an analytical study was conducted on a composite column with a welded H-shaped steel section using an FE software package, ADINA. The aim of this work was to determine the stress distribution in the steel section, the steel reinforcement, and in the concrete elements [9]. In experimental work conducted the same year, a total of 12 composite columns, with high encased steel ratios subjected to biaxial bending and axial loading, were studied to determine the impact of design parameters (such as the encased steel ratio, axial compression ratio, and shape distribution of the encased steel section) on the static behavior of composite columns [10]. In 2019, short composite columns subjected to concentric and eccentric loadings were studied analytically by incorporating a proposed method that included the effect of concrete confinement on these columns’ strength interaction diagrams [11]. Further analyses were performed for short composite columns in the following years. In one of these studies from 2019, the axial compressive behavior of high strength composite short columns under monotonic pure compression was investigated experimentally, using parameters such as concrete strength, the spacing of transverse reinforcement bars, and the inclusion of steel fibers in high strength concrete, in order to determine their ultimate strength [12]. In a similar study from 2020, the axial load capacity of composite stub columns with high strength concrete and steel materials under a concentric compression load was examined experimentally in order to evaluate an existing design method by considering their axial load capacities with varying material strengths, steel contribution ratios, reinforcement ratios, section slenderness ratios, confined concrete area ratios, and concrete confinement efficiency [13]. One of the latest studies in this area, conducted in 2021, involved both analytical and experimental work with composite columns under combined axial and lateral cyclic loading to predict their flexural capacities, based on varying axial loads [14]. However, these studies did not examine the interaction between beam-to-column connections or the impact of a full frame on joint behavior.
Recent analytical and experimental research (conducted over the past 10 years) has focused on the joint behavior of columns and beams in order to provide a more realistic assessment of the behavior of a composite column-beam joint. In one of these studies, the mechanical behavior of the cracked resistance of an SRC column to an RC beam located at an exterior joint was examined [15]. Similarly, in another study, the stress behavior of an SRC column to an RC beam joint and an SRC column to SRC beam joint, which were both subjected to monotonic and cyclic loadings, were also investigated [16]. The results indicated that increasing the area of the structural steel section increased the bearing capacity of the connection, and the seismic resistance performance of the SRC column to an SRC beam joint was much better than that of the SRC column to an RC beam joint. More robust joint details with ring beams were also explored to determine their impact on the overall structural behavior of an SRC column to RC beam joint subjected to cyclic loading [17]. The study concluded that the strong column–weak beam analogy can be achieved if an adequate arrangement of reinforcement in the ring beam is provided. Recently, more emphasis has been placed on the behavior of SRC columns with various structural steel shapes [18]. The experimental results of this study indicated that the vertical bearing capacity of SRC columns with a new type of SRC member detail improved the overall stability of such connections. The specimens in this study were able to resist loads and prevent collapse in an elastic-plastic phase, even though the longitudinal reinforcing bars yielded and local bucking occurred at the flanges of the steel section used in the column. The study concluded that steel reinforcement and structural steel assembly played a significant role in determining the seismic behavior of a new-type of SRC member.
Over the past year, the structural behavior of beam-to-column joint details constructed with various structural steel shapes have also also investigated. In one of these studies, the structural behavior of a truss shaped steel-reinforced concrete beam to SRC column subjected to lateral cyclic loading was examined both experimentally and analytically [19]. The results indicated that all the specimens experienced shear failure at the core area, and subjecting columns to a higher axial compression ratio of 0.2 to 0.4f’cAg increased joint strength while decreasing ductility. One of the most recent studies in this area was an analytical one that focused on the structural performance of hybrid precast steel-reinforced concrete column-to-H shaped steel beam connections subjected to cyclic loading [20]. According to this study, all the connections failed through bending and that the connection type had a significant influence on the seismic performance of a joint.
The use of composite column-to-beam connections has also required the urgent development and investigation of strengthening methods in existing buildings. There are a number of studies in the literature focusing on these methods and their impact on the overall behavior of existing structures. In one of these studies, a finite element (FE) program of ABAQUS was used to assess the structural behavior of composite steel columns strengthened by carbon fiber-reinforced polymer (CFRP) under cyclic loading [21]. The results verified that carbon fiber sheets improved the ductility of composite columns, increased their load carrying capacity, and helped repair the severely damaged specimen to a level that exceeded its original strength level. The study also suggested another type of strengthening method: the use of enveloped steel jackets (ESJ) around SRC column-to-RC beam connections. The seismic behavior of these connections, which were strengthened by ESJ and CFRP sheets, were examined in [22]. The test results indicated that CFRP strengthening increased the load carrying capacity of the SRC frame by 25% and its ductility by 29%, while ESJ strengthening increased the load carrying capacity by 48% and ductility by 26%.
In this article, RCS column to RC beam connections that are commonly used in the construction of mid-rise to tall buildings were investigated analytically. The purpose of this study was to furnish the details of constructing FE models that will accurately predict the seismic behavior of these types of frames with varying concrete compressive strengths, reinforcement configurations, and structural steel sections. For this purpose, frame models were generated using LS-DYNA, an FE software package, to conduct nonlinear static analysis [23]. The models were verified through the results of a benchmark experimental study, previously conducted at Atilim University on two 1/4 scale frame specimens, one with low (LD) and the other with high ductility (HD) features [24]. The model performances were calibrated through the behavior of the tested frames based on their cracks and failure patterns, load-deflection envelopes, energy dissipation, and stiffness degradation. After confirming that the two FE models and test results matched, an additional 10 FE models were generated to predict the effect of two concrete strengths with 25 and 40 MPa, reinforcement configurations with low and high ductile features, and structural steel sections with I and square shaped sections on the behavior of RC frames with composite columns.
2. Finite Element Analysis
2.1. General Layout
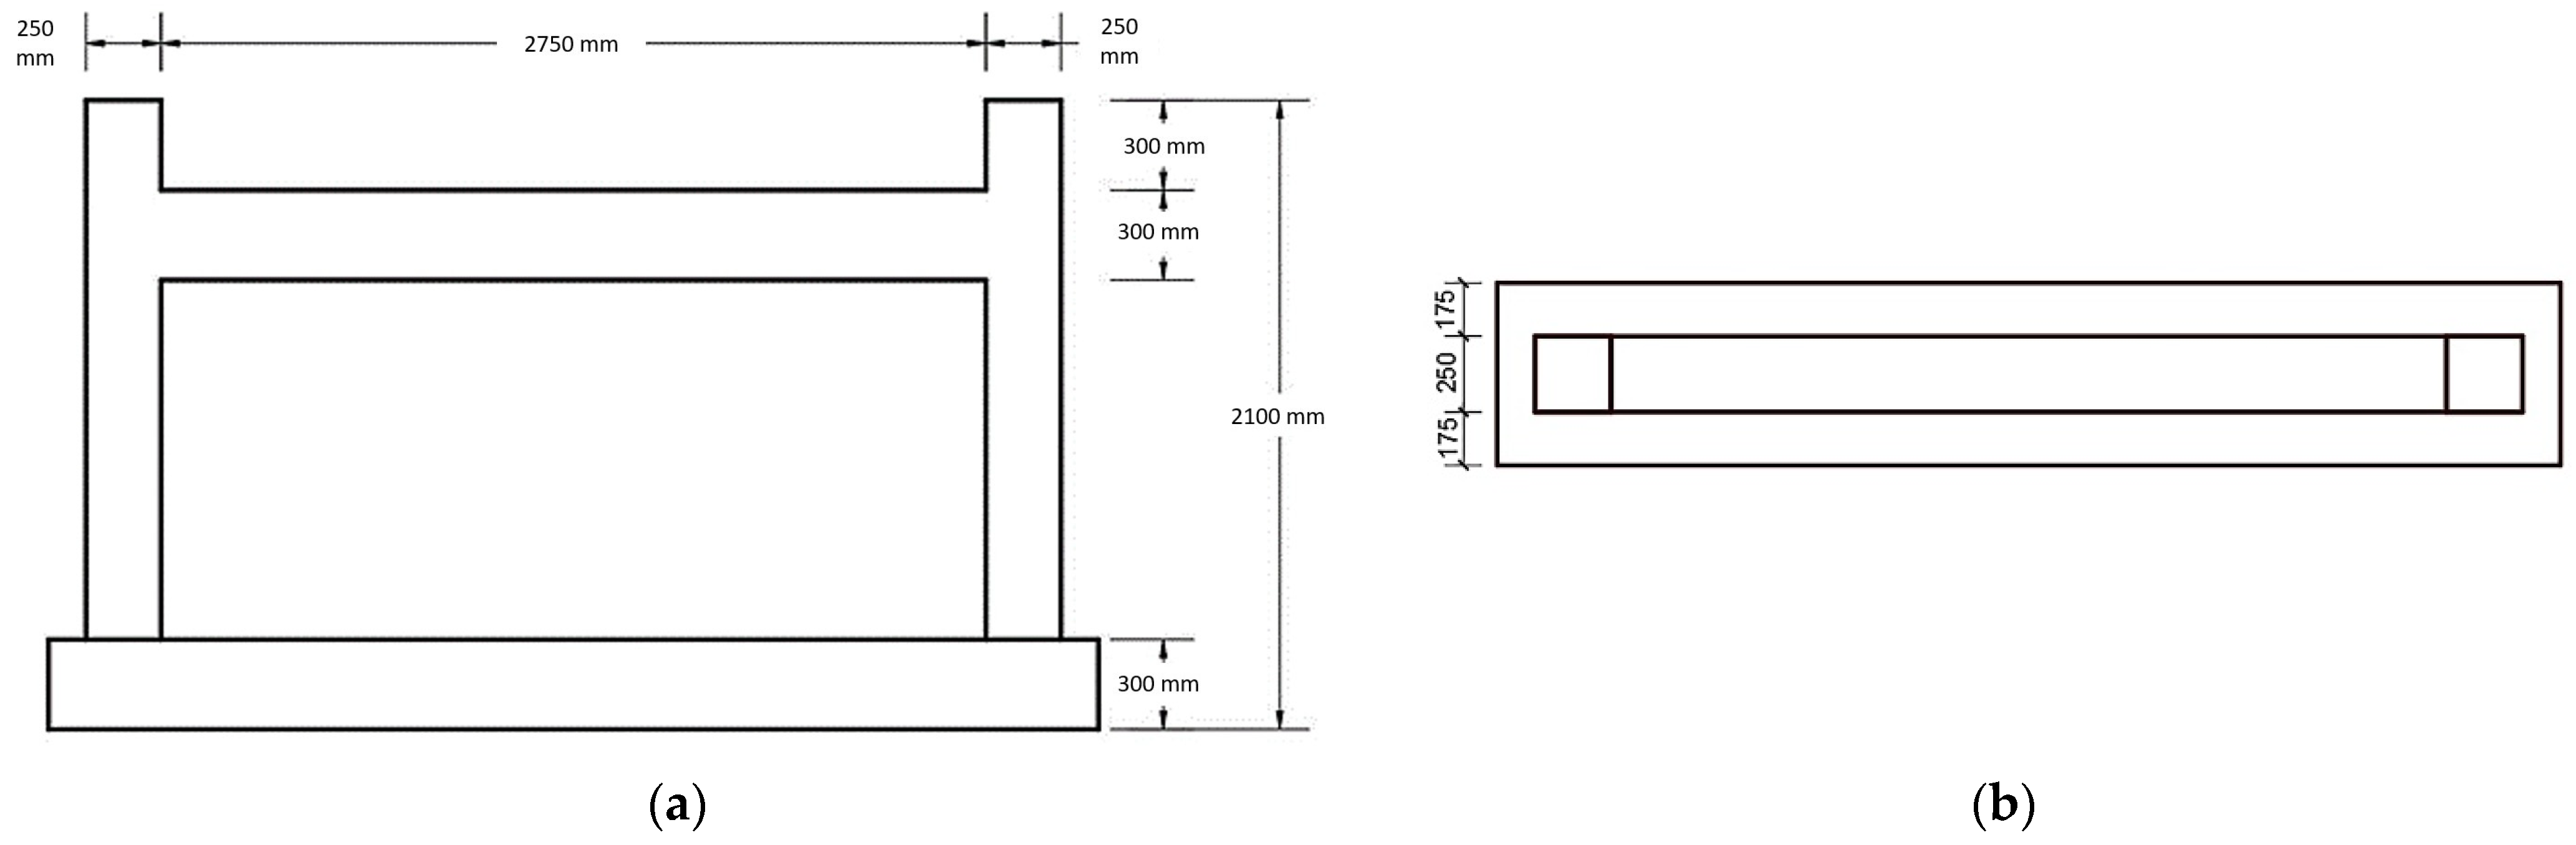
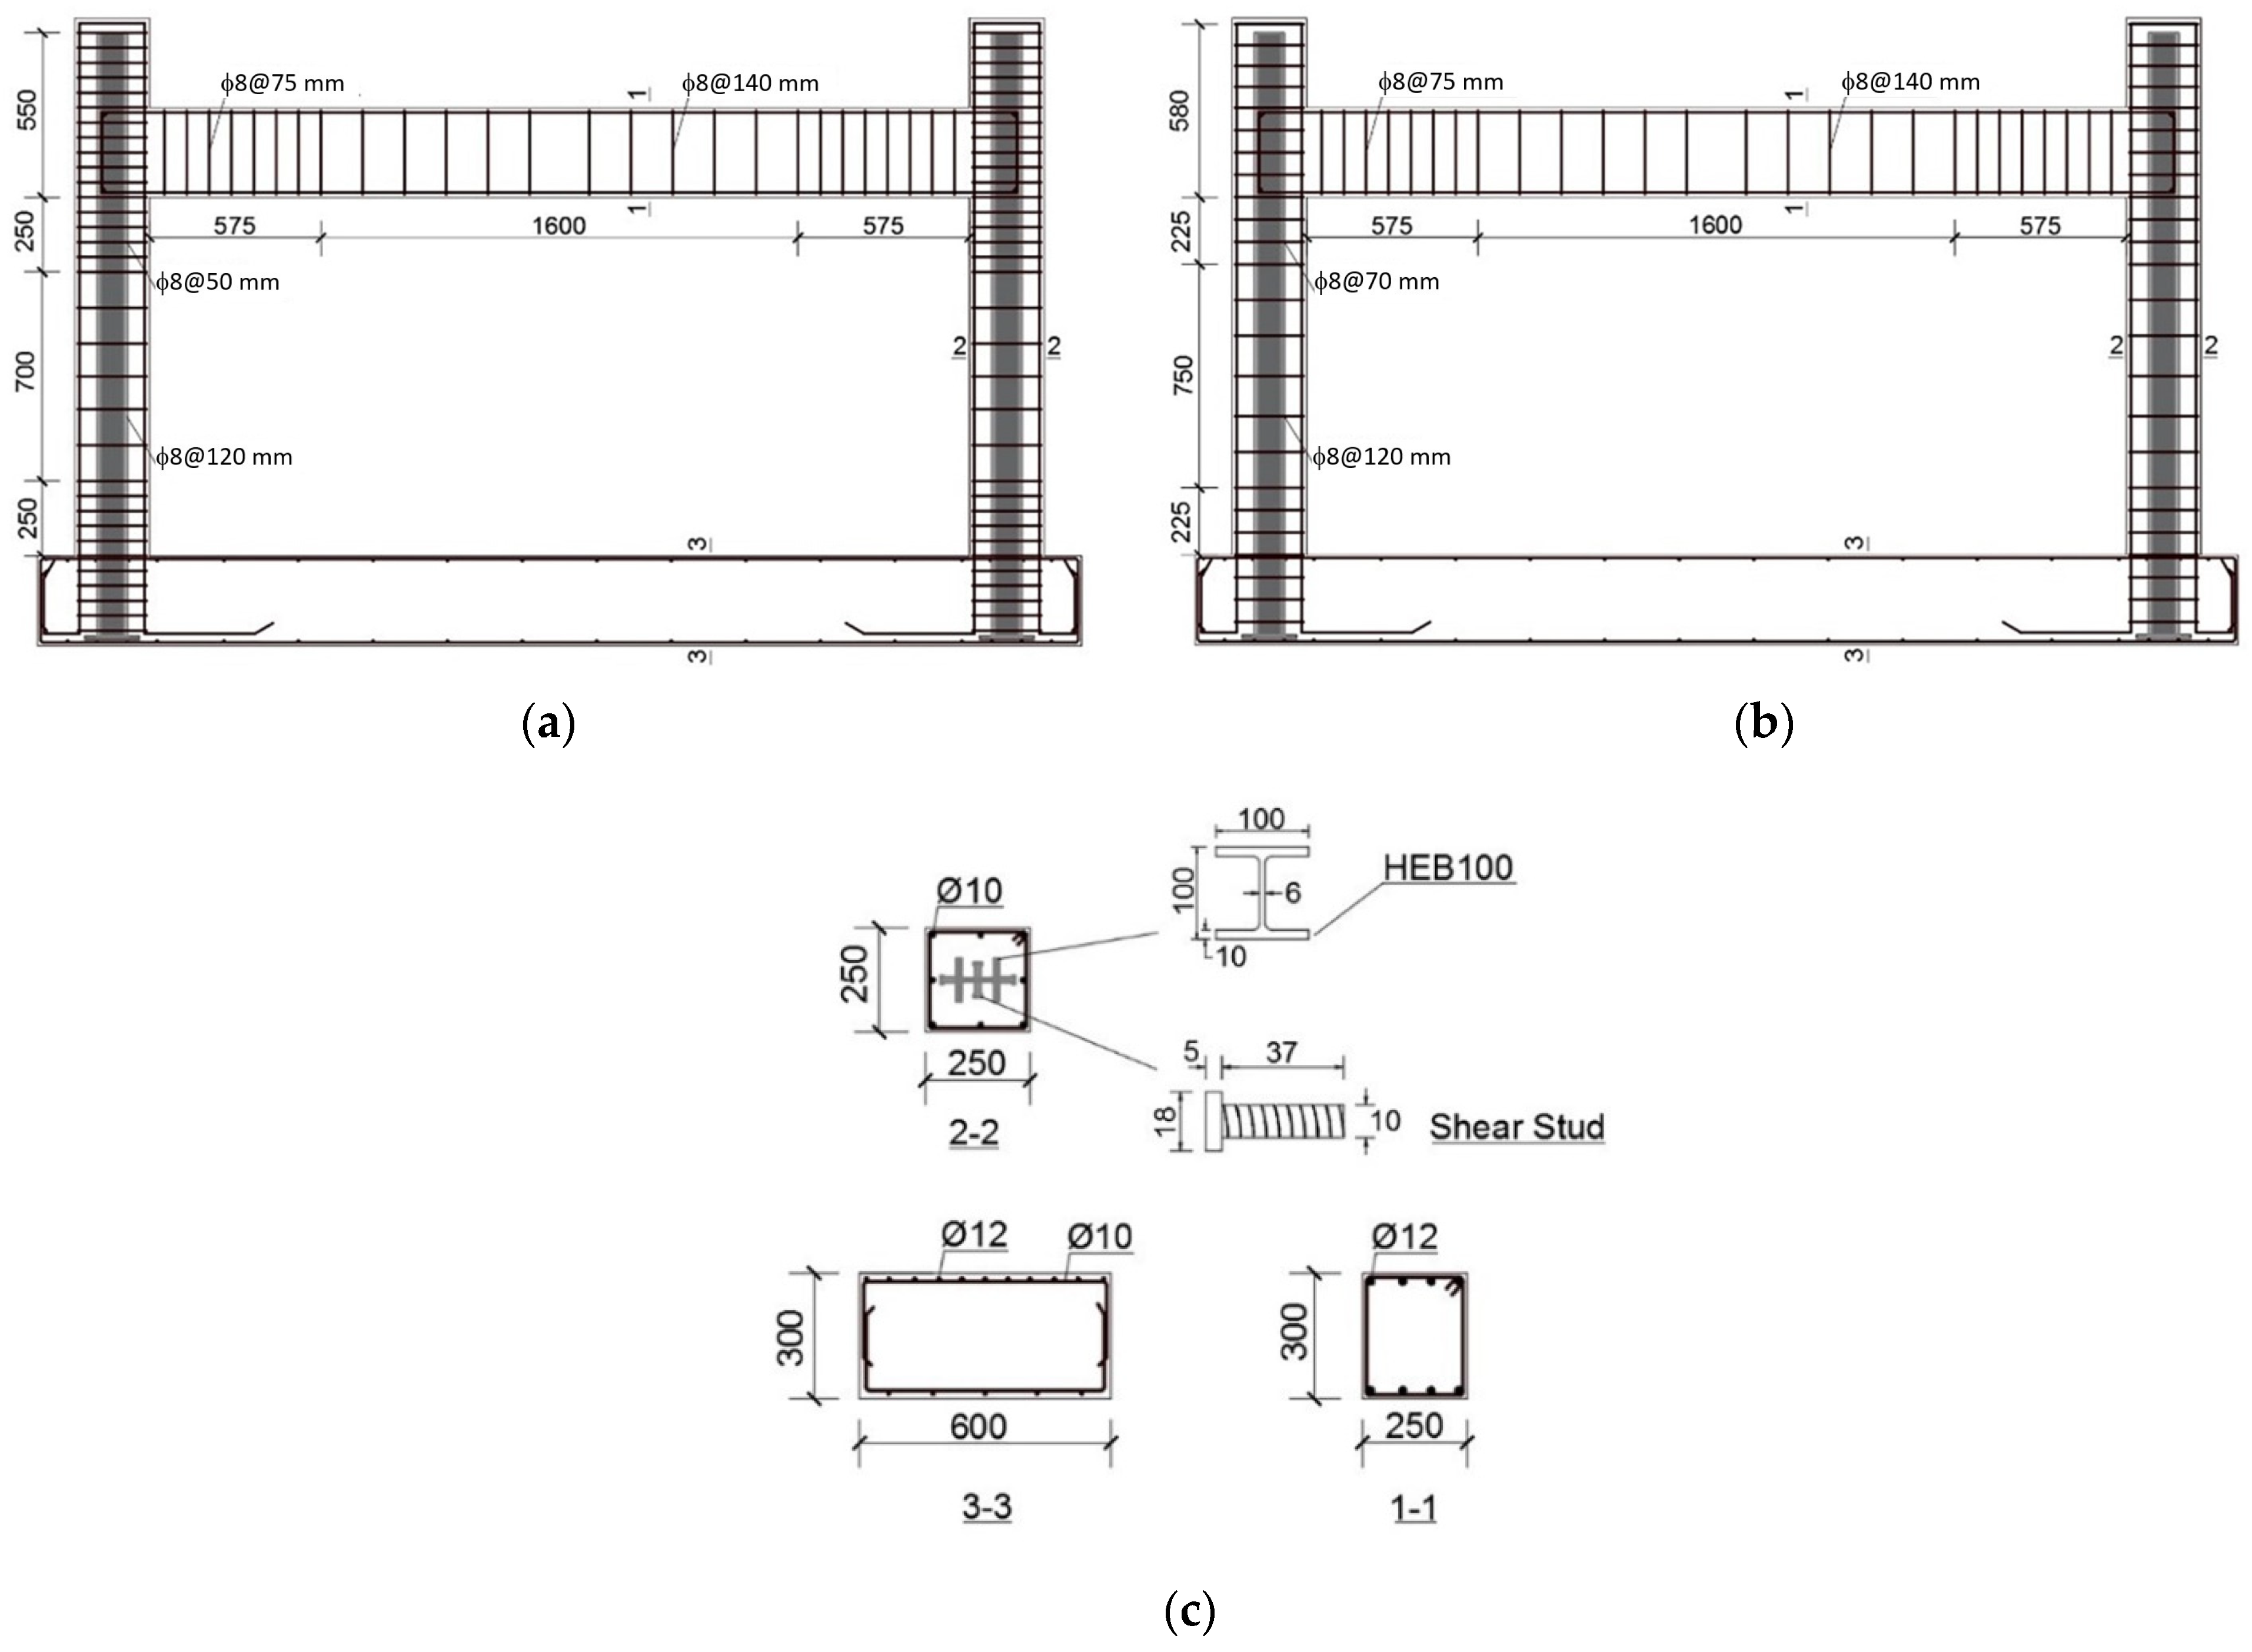
The FE models were based on an experimental study conducted at the Structural Mechanics Laboratory at Atilim University [24]. The experimental study included the testing of two frames with an RC beam connected to RCS columns, one with high ductile (HD) and the other with low ductile (LD) features. As illustrated in Figure 1 and Figure 2, the cross-sectional area of the columns was 250 by 250 mm. The diameters of the main transverse and longitudinal reinforcements in these columns were 8 and 10 mm, respectively. The column with a low ductile design was constructed with a stirrup spacing of 70 mm at the confinement zone (250 mm length) and 120 mm at the mid-zone (700 mm length). The high ductile column was constructed with a stirrup spacing of 50 mm at the confinement zone (250 mm length) and 120 mm at the mid-zone (700 mm length). These RCS columns included HEB100, I shaped steel sections with headed shear studs that were welded to their flanges and web at every 200 mm. The use of headed shear studs is a very common practice for creating composite action between the structural steel and surrounding concrete [1,25]. Table 1 lists the details of the steel reinforcement used in these frames (see also Figure 2). The beams had a cross-sectional area of 250 by 300 mm, with main transverse and longitudinal reinforcement diameters of 8 and 12 mm, respectively. The stirrup spacing of the beams used in the frames was 75 mm at the confinement zone (575 mm length) and 140 mm at the mid-zone (1600 mm length). As per the guidelines in the current Turkish Earthquake Code, TEC 2018, there was no difference in the rebar configuration of the low and high ductile beams due to their cross sections and span lengths [26]. Therefore, the same reinforcement configuration was used for the beams of both frame types. The reinforcement details and their layouts complied with the requirements of TEC 2018 and the Turkish standards for reinforced concrete structures, TS 500 [27].
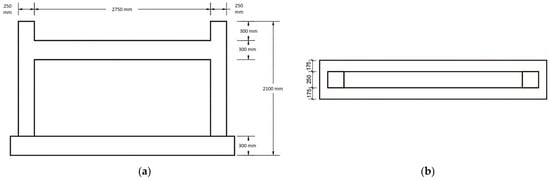
Figure 1.
General layout of tested frames: (a) Side view; (b) top view [24].
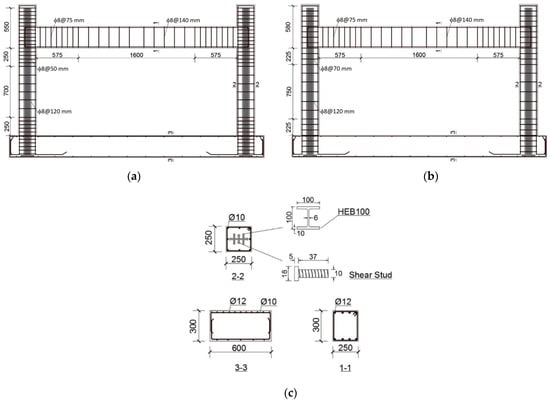
Figure 2.
Reinforcement and steel section details of the tested frames: (a) HD; (b) LD; (c) cross-sections [24].

Table 1.
Reinforcement details of tested specimens [24].
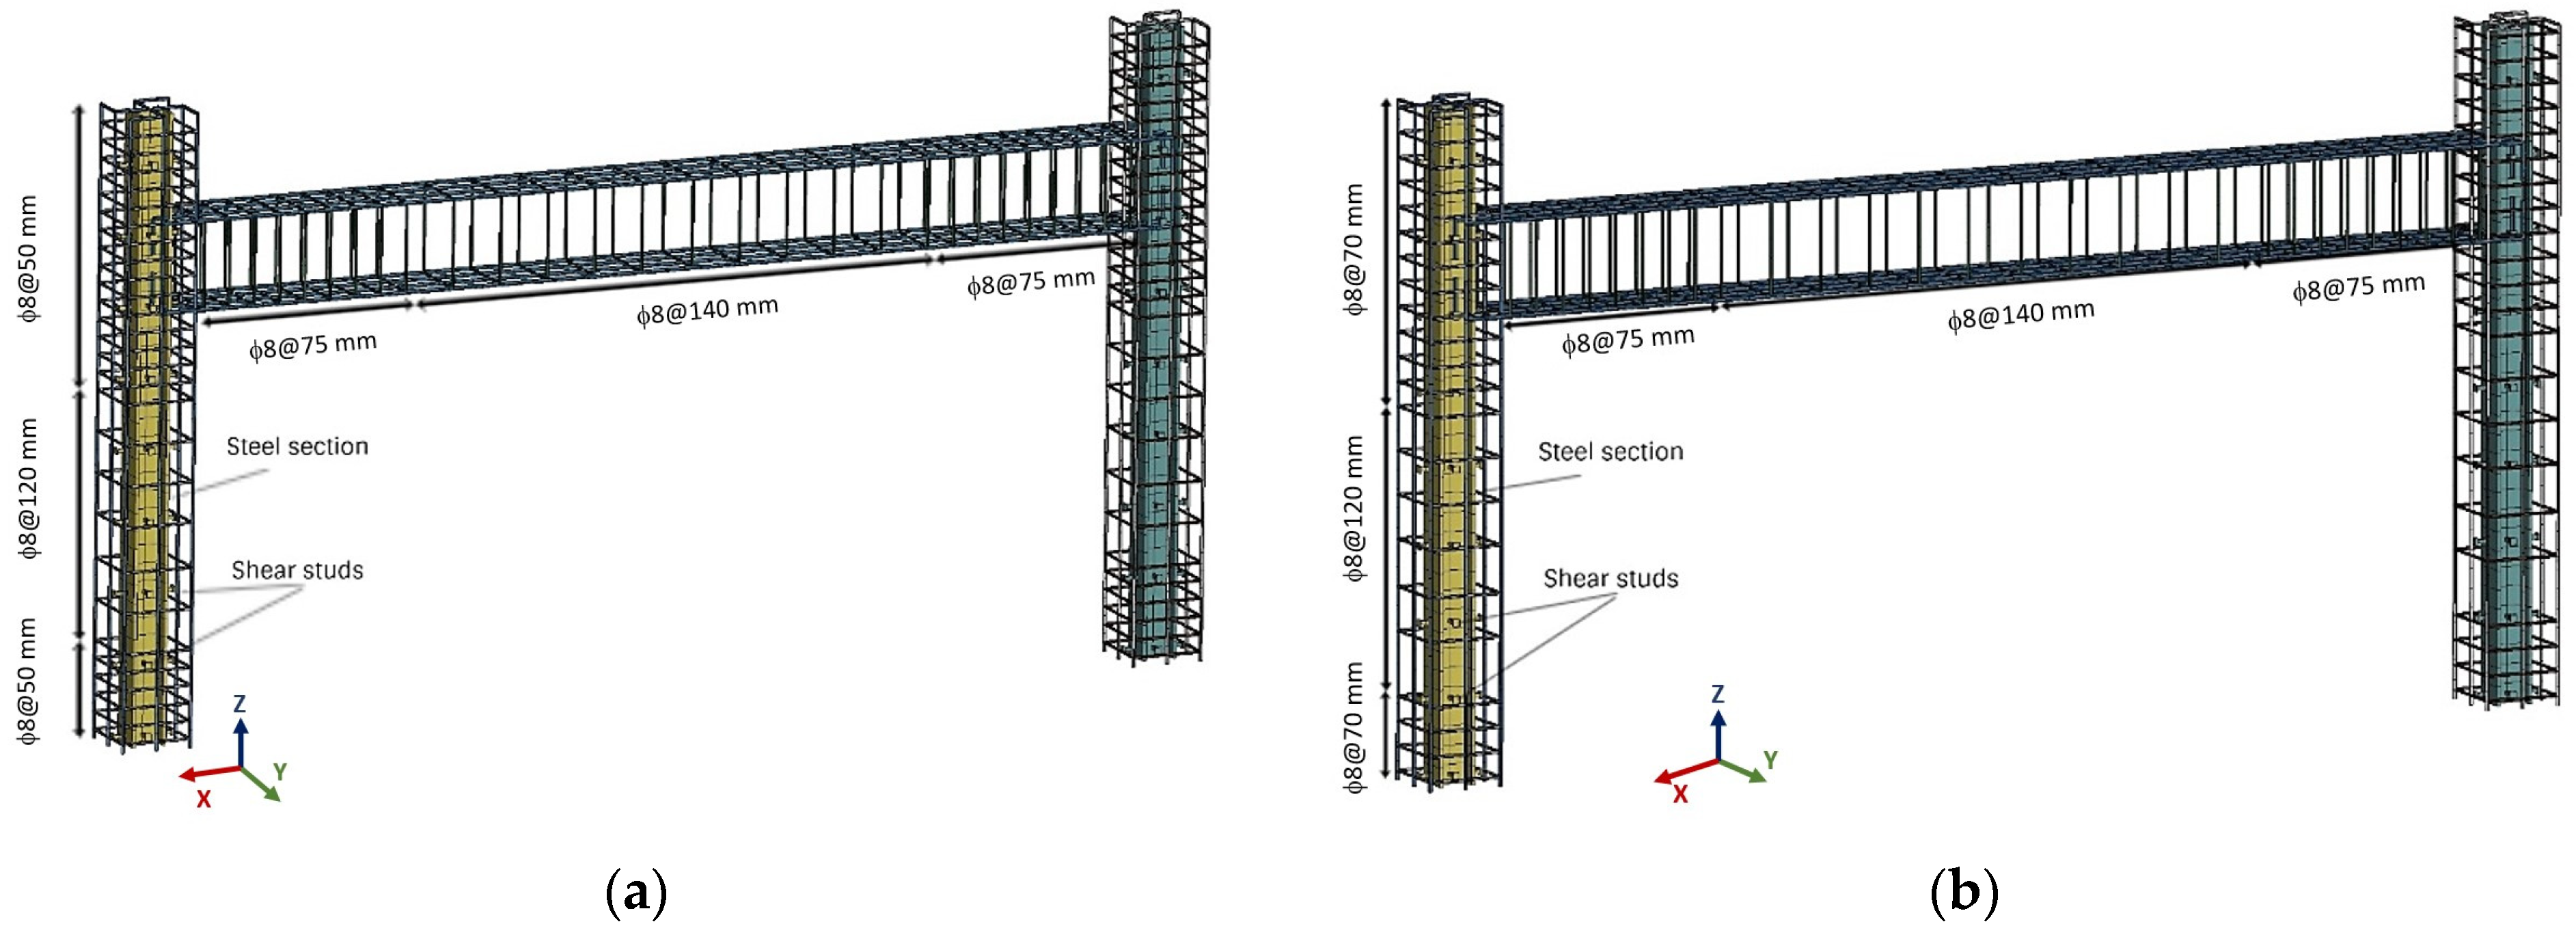
The FE analyses were carried out on a total of 12 models (Figure 3). The first two models were used to calibrate the model parameters based on the results of the two frame tests, and the remaining 10 models were used to predict the behavior of frames with two different concrete strengths, reinforcement configurations, and structural steel sections under vertical and lateral loads. Table 2 lists the details of these 12 frame models. The specimens were labelled according to their high and low ductility features using the letters “H” and “L”. The second letter in the notation was used to describe the steel section shape: the letter “I” was used for an I-shaped and “SQ” for a hollow square-shaped section. The thickness of the SQ shaped section was denoted by “T”. T6 and T8 were used for a square-shaped section with a thickness of 6 and 8 mm, respectively. The concrete class was represented using C25 and C40 to define their compressive strength in MPa. If no steel section was used in the column, the notation lacked the letter “I” for an I-shaped steel section or “SQ” for a hollow square-shaped steel section.
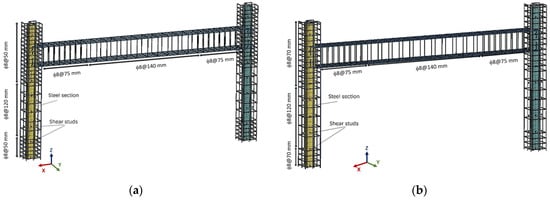
Figure 3.
Reinforcement and steel section details of the frames in LS-DYNA: (a) HD; (b) LD.
Table 2.
Details of 12 frame models.
2.2. Analytical Parameters
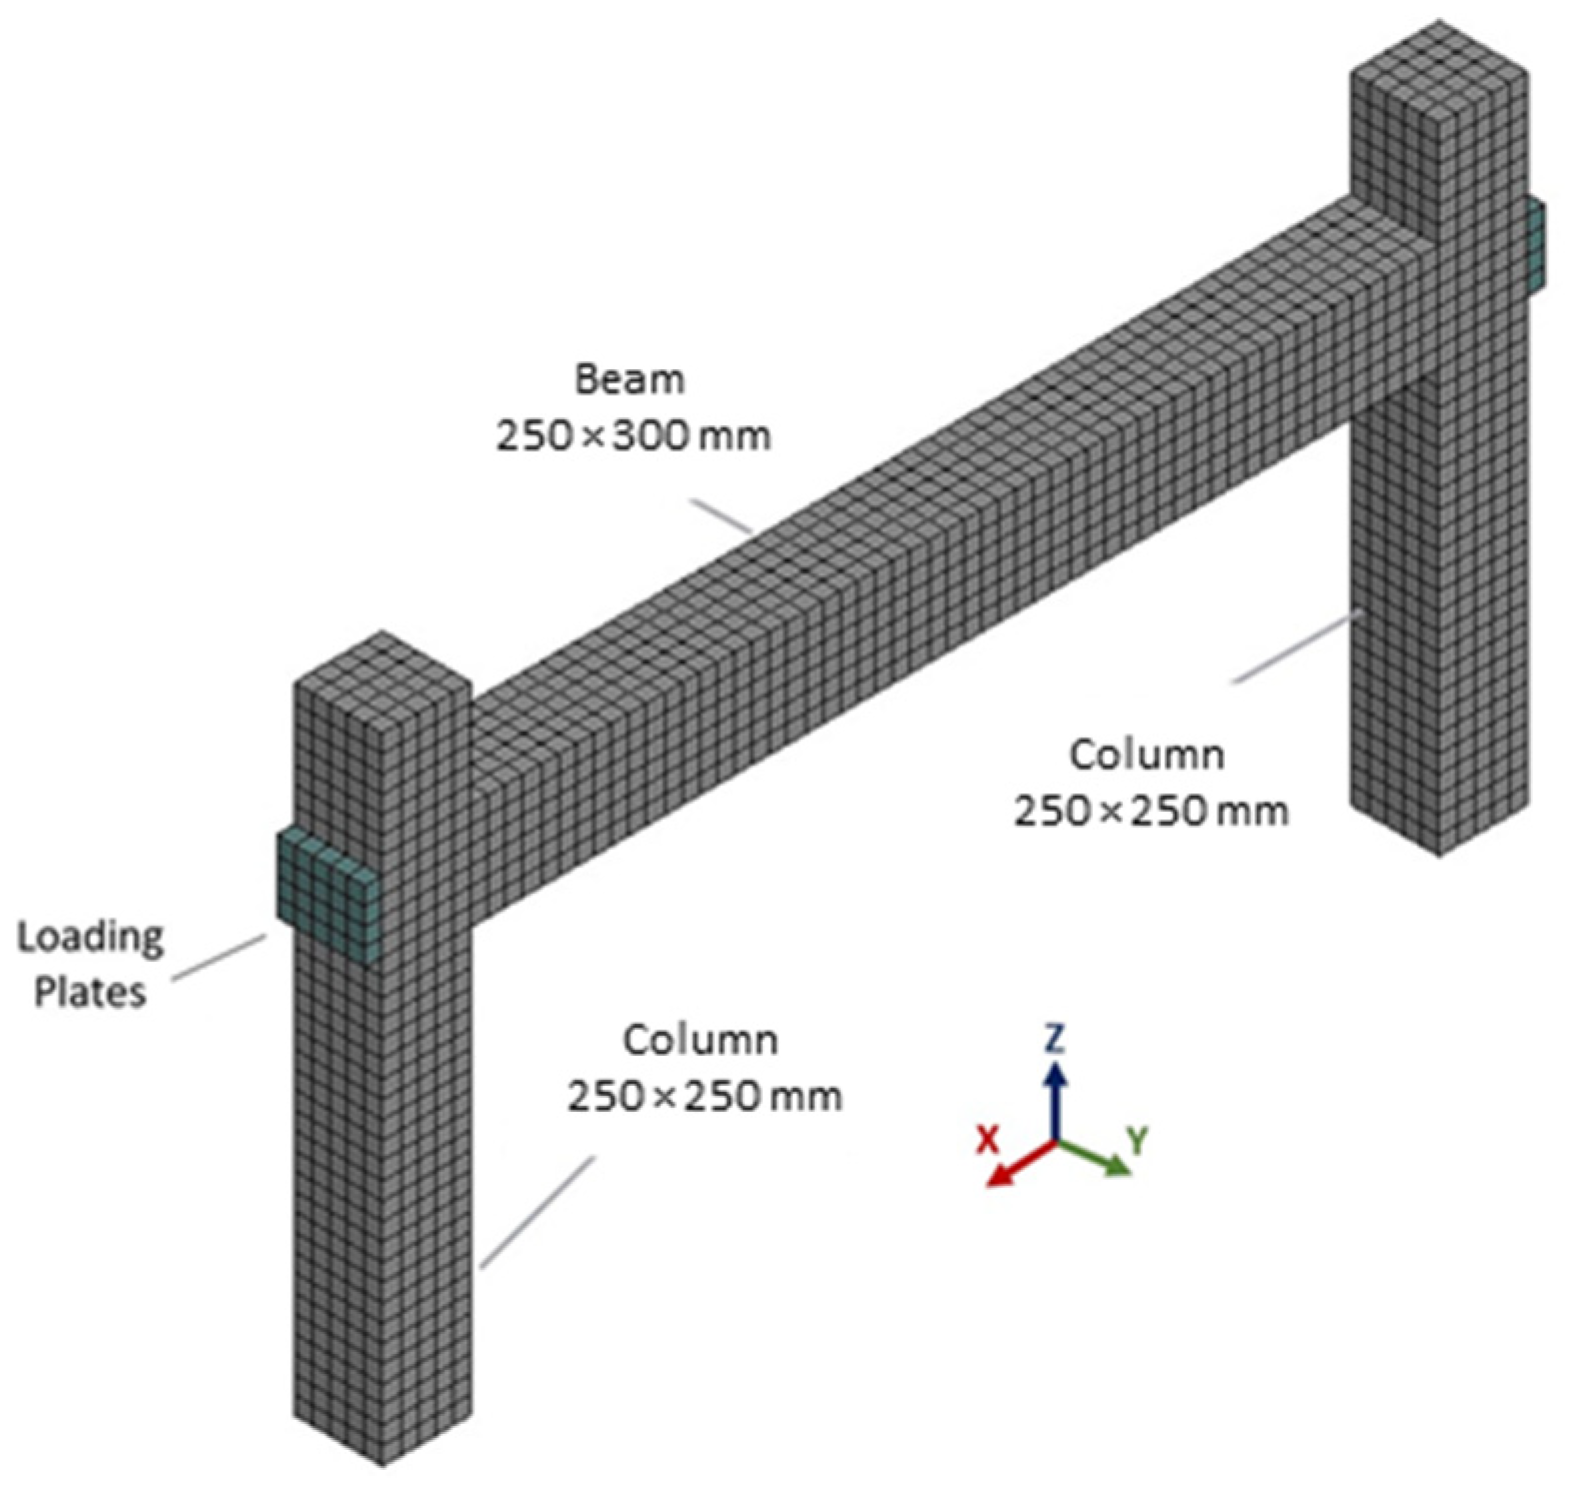
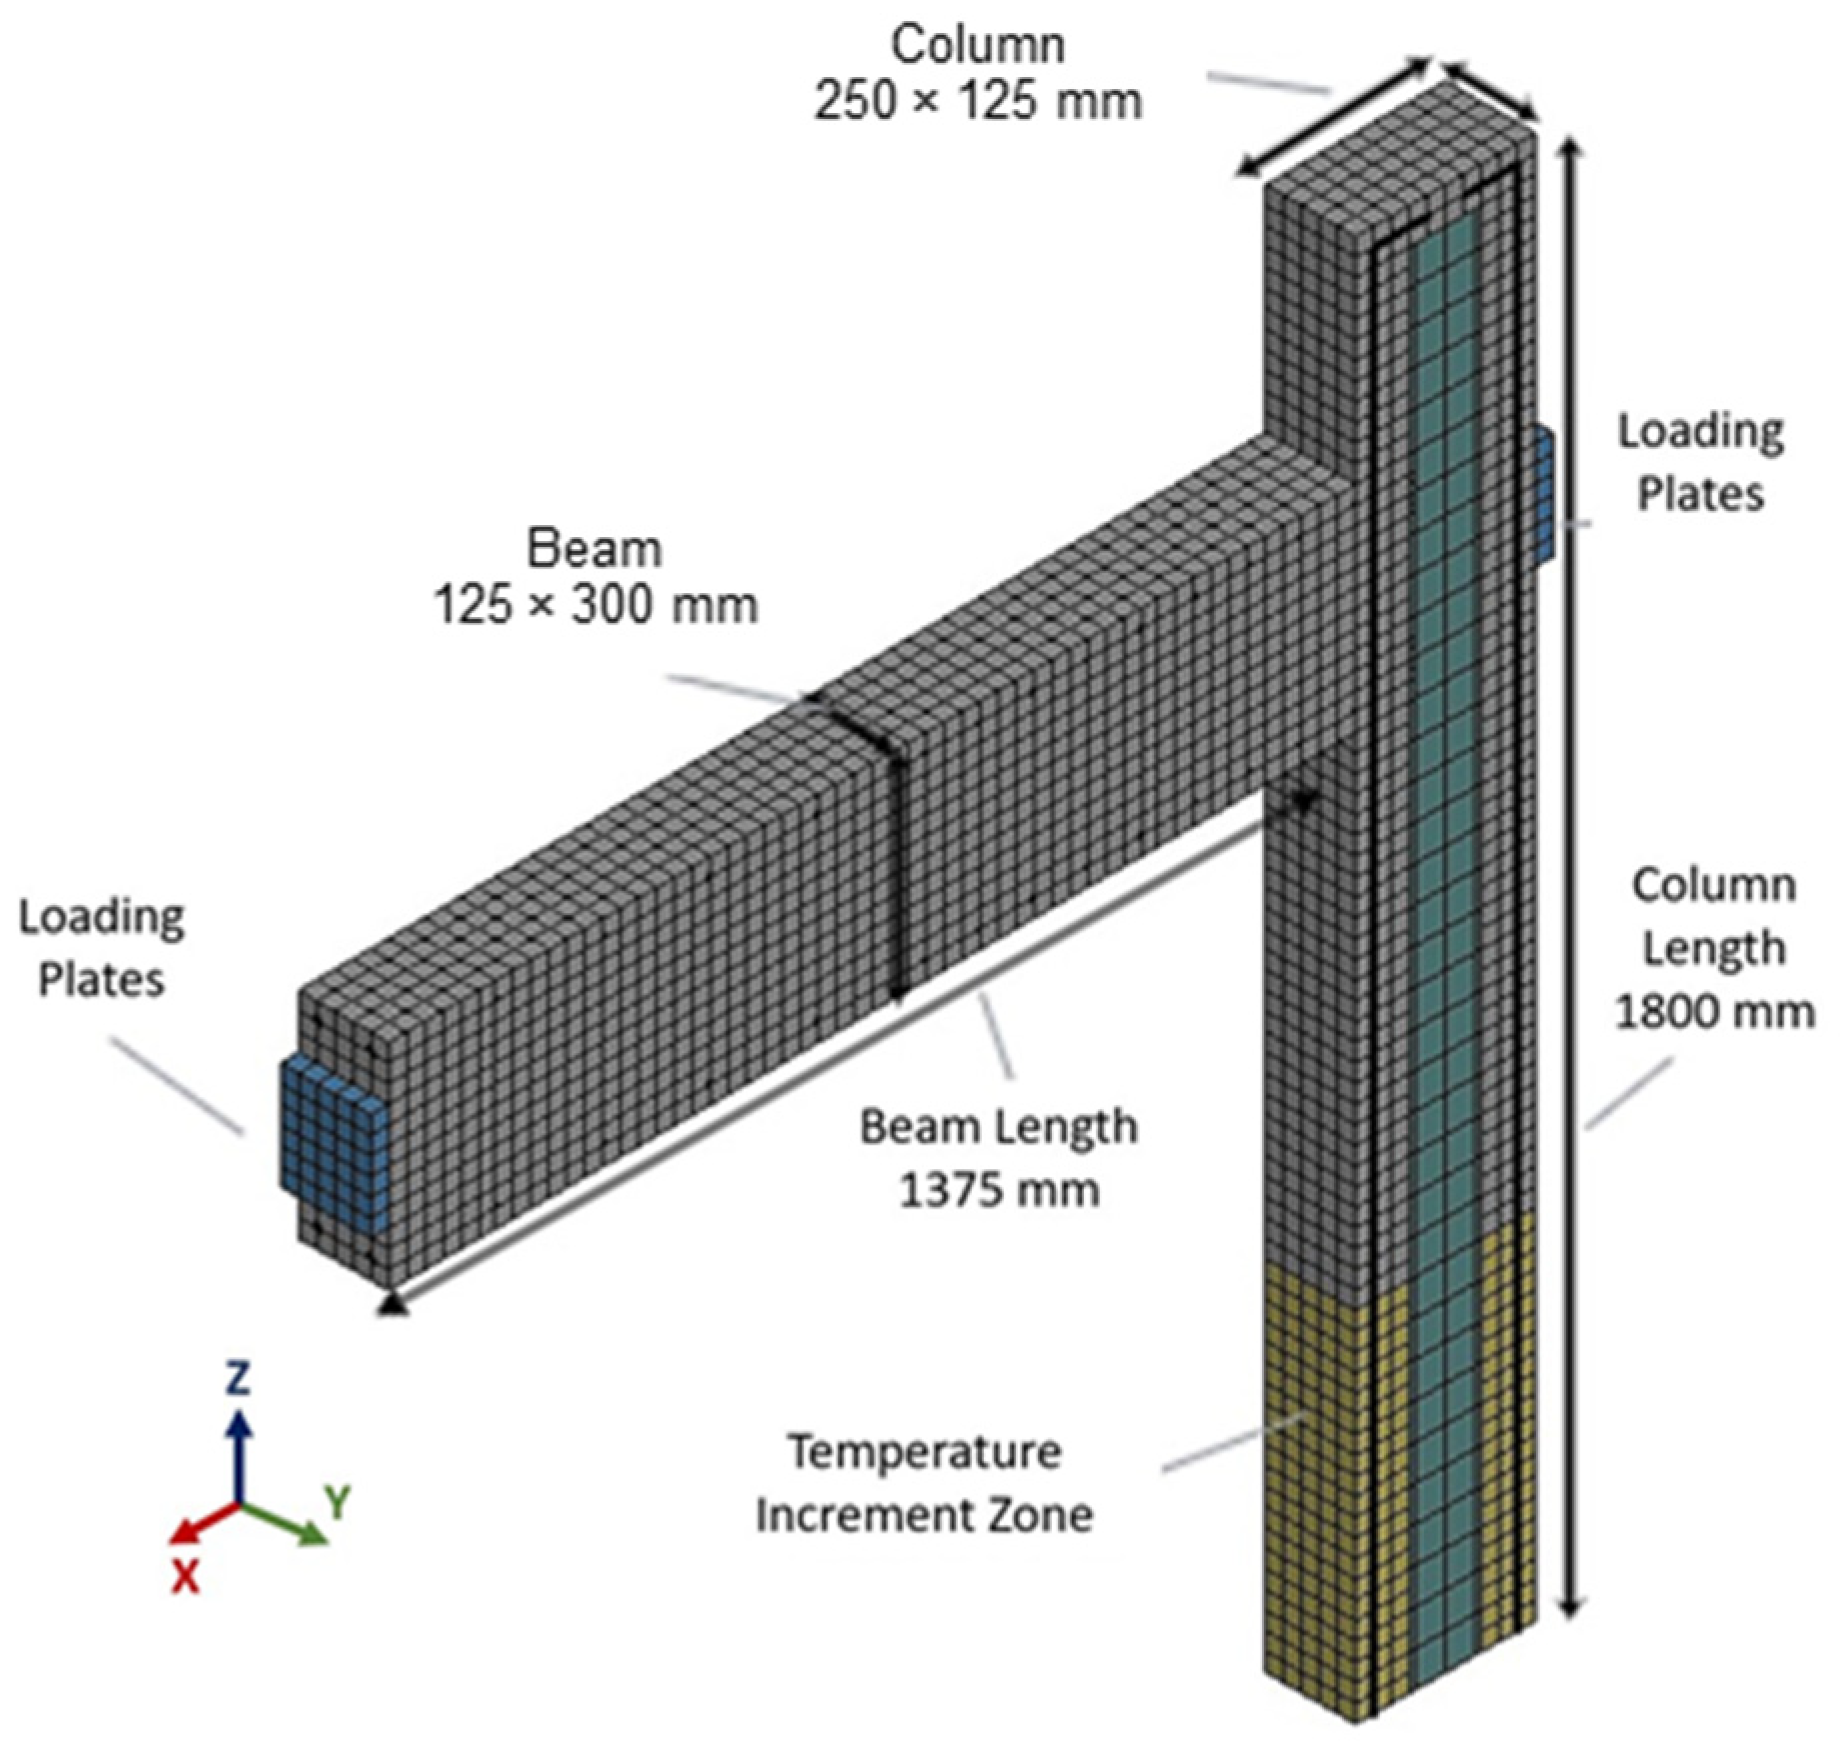
Figure 4 illustrates the general layout of the FE model of the two frames, one with LD and the other with HD features. In order to reduce the processing time required for the FE simulations, analytical models had to be optimized while ensuring the convergence of the analytical results.
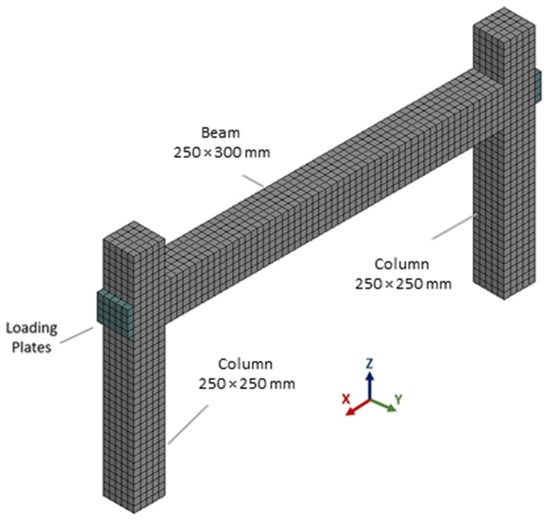
Figure 4.
General layout of initial model in LS-DYNA.
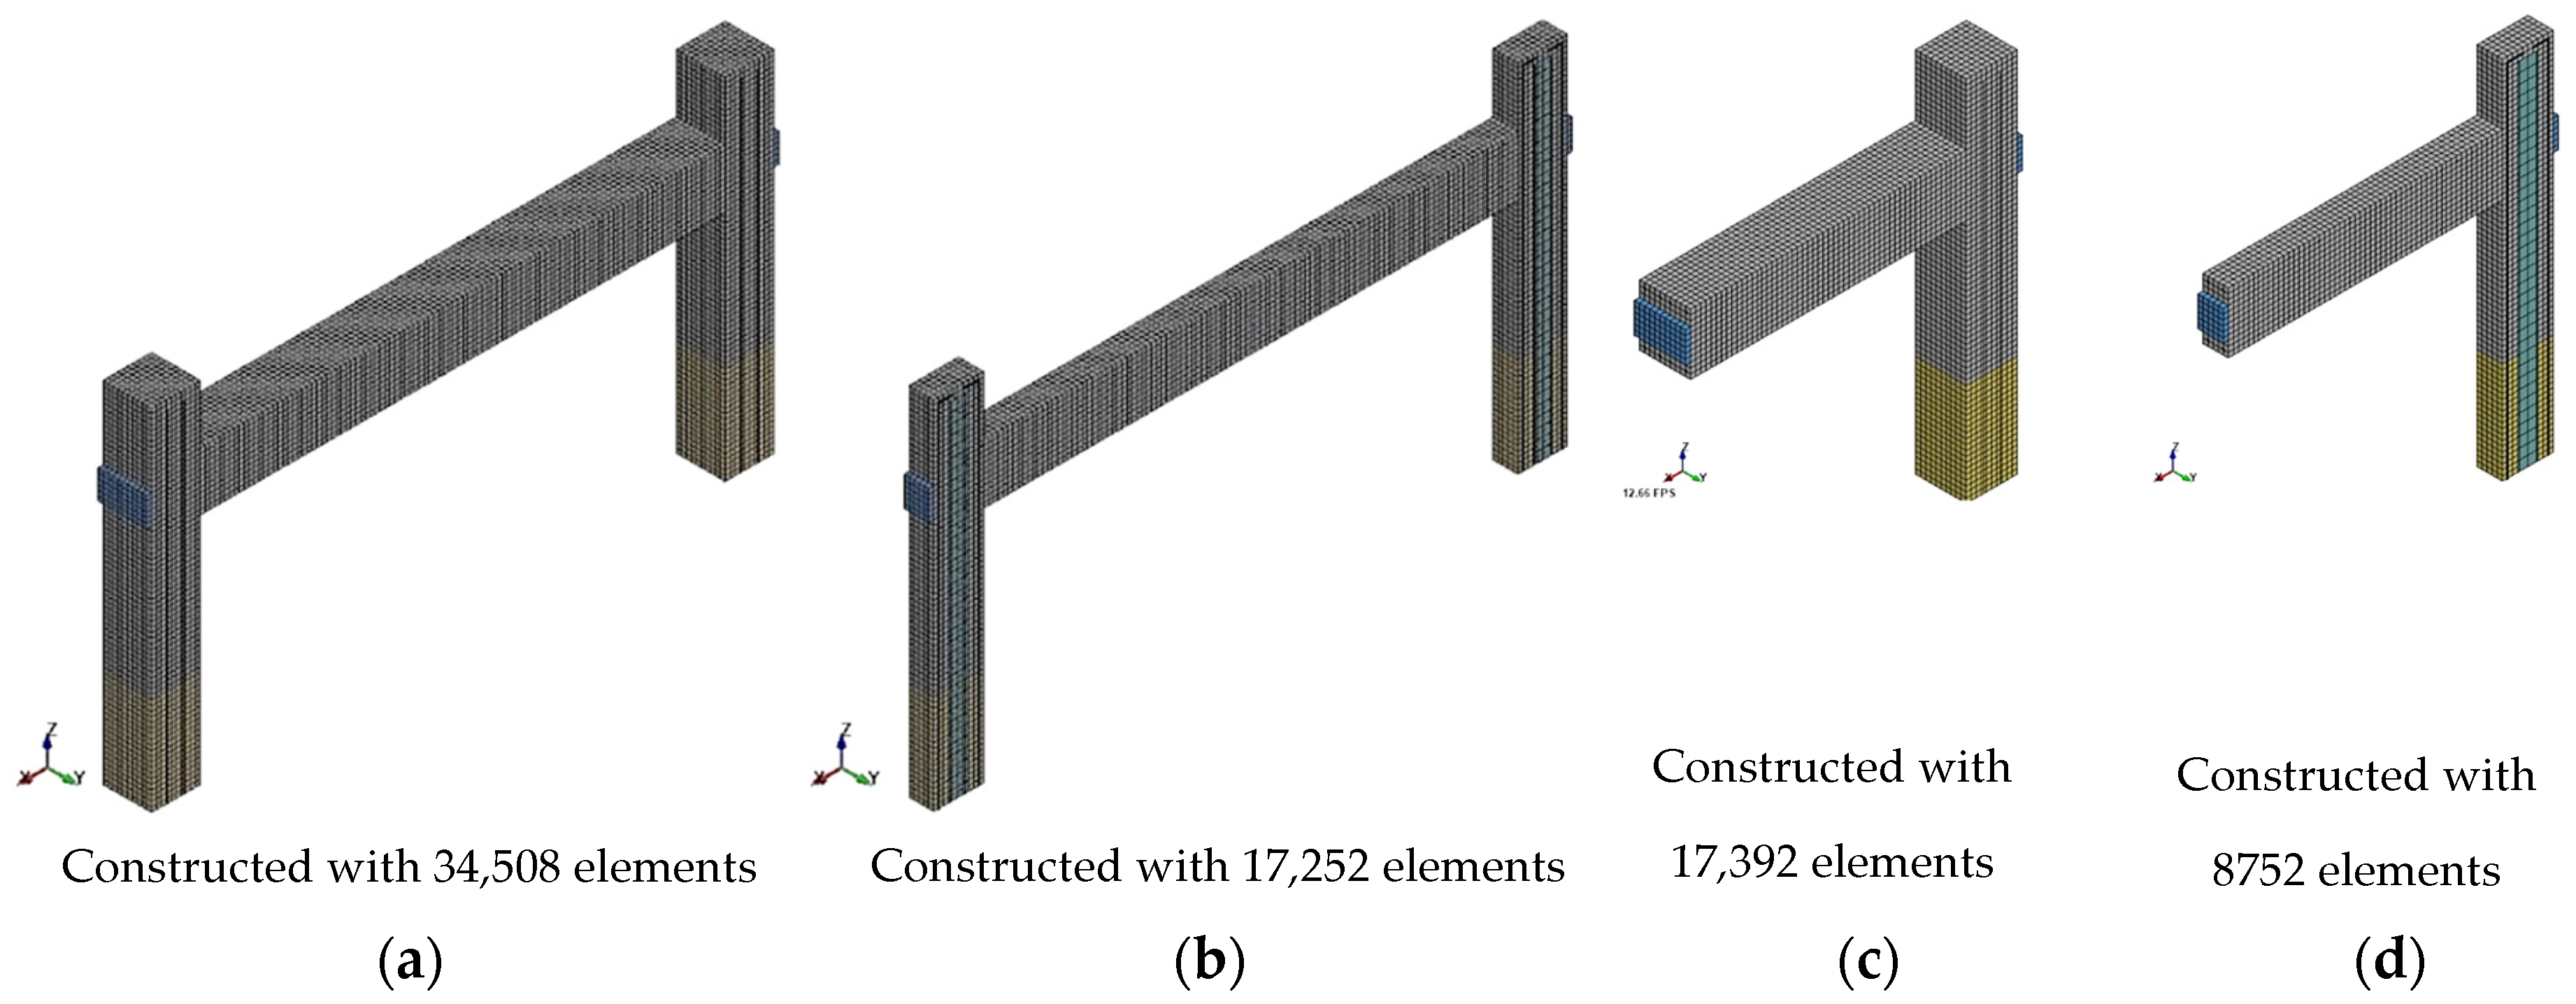
Therefore, the frame was investigated using four individual models: (a) full frame, (b) half the full frame cut along the x-direction, (c) half the full frame cut along the y-direction, and (d) a quarter of the full frame cut in both the x and y-directions (Figure 5). The results of these four models were compared to each other and no significant differences were observed with respect to cracks and failure patterns, load-deflection envelopes, energy dissipation, and stiffness degradation. As a result of these studies, the quarter model, which had the least number of elements, was used in this study for all 12 models since it required the least processing time (Figure 6).
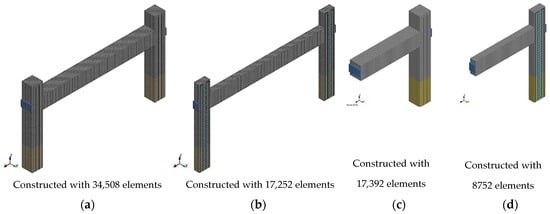
Figure 5.
Specimen evolution: (a) Full frame; (b) half frame along x-dir.; (c) half frame along y-dir.; (d) quarter frame both in x- and y-dir.

Figure 6.
Quarter frame model.
In the two frame tests, headed shear studs spaced at 200 mm were used to create composite action between the section and the surrounding concrete. For the shear studs, a special constraint defined as a Lagrangian solid was used to establish a solid link between the studs and the surrounding concrete. The models were first constructed using these headed studs. However, this modeling approach required significant time to analyze (Figure 7). In order to reduce processing time, the models were constructed without these shear studs. This new approach was achieved in LS-DYNA by utilizing a duplication keyword between the nodes of the steel section element and the surrounding concrete. A duplication keyword allowed for merging between the two nodes of two different materials so that a perfect bond between these materials was achieved. Since the results of both the models (with and without shear studs) were consistent, the model without the shear studs was used in further analyses.
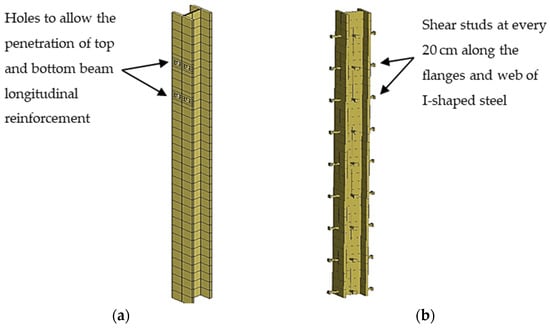
Figure 7.
Structural steel section models: (a) Without shear studs; (b) with shear studs.
2.2.1. Concrete
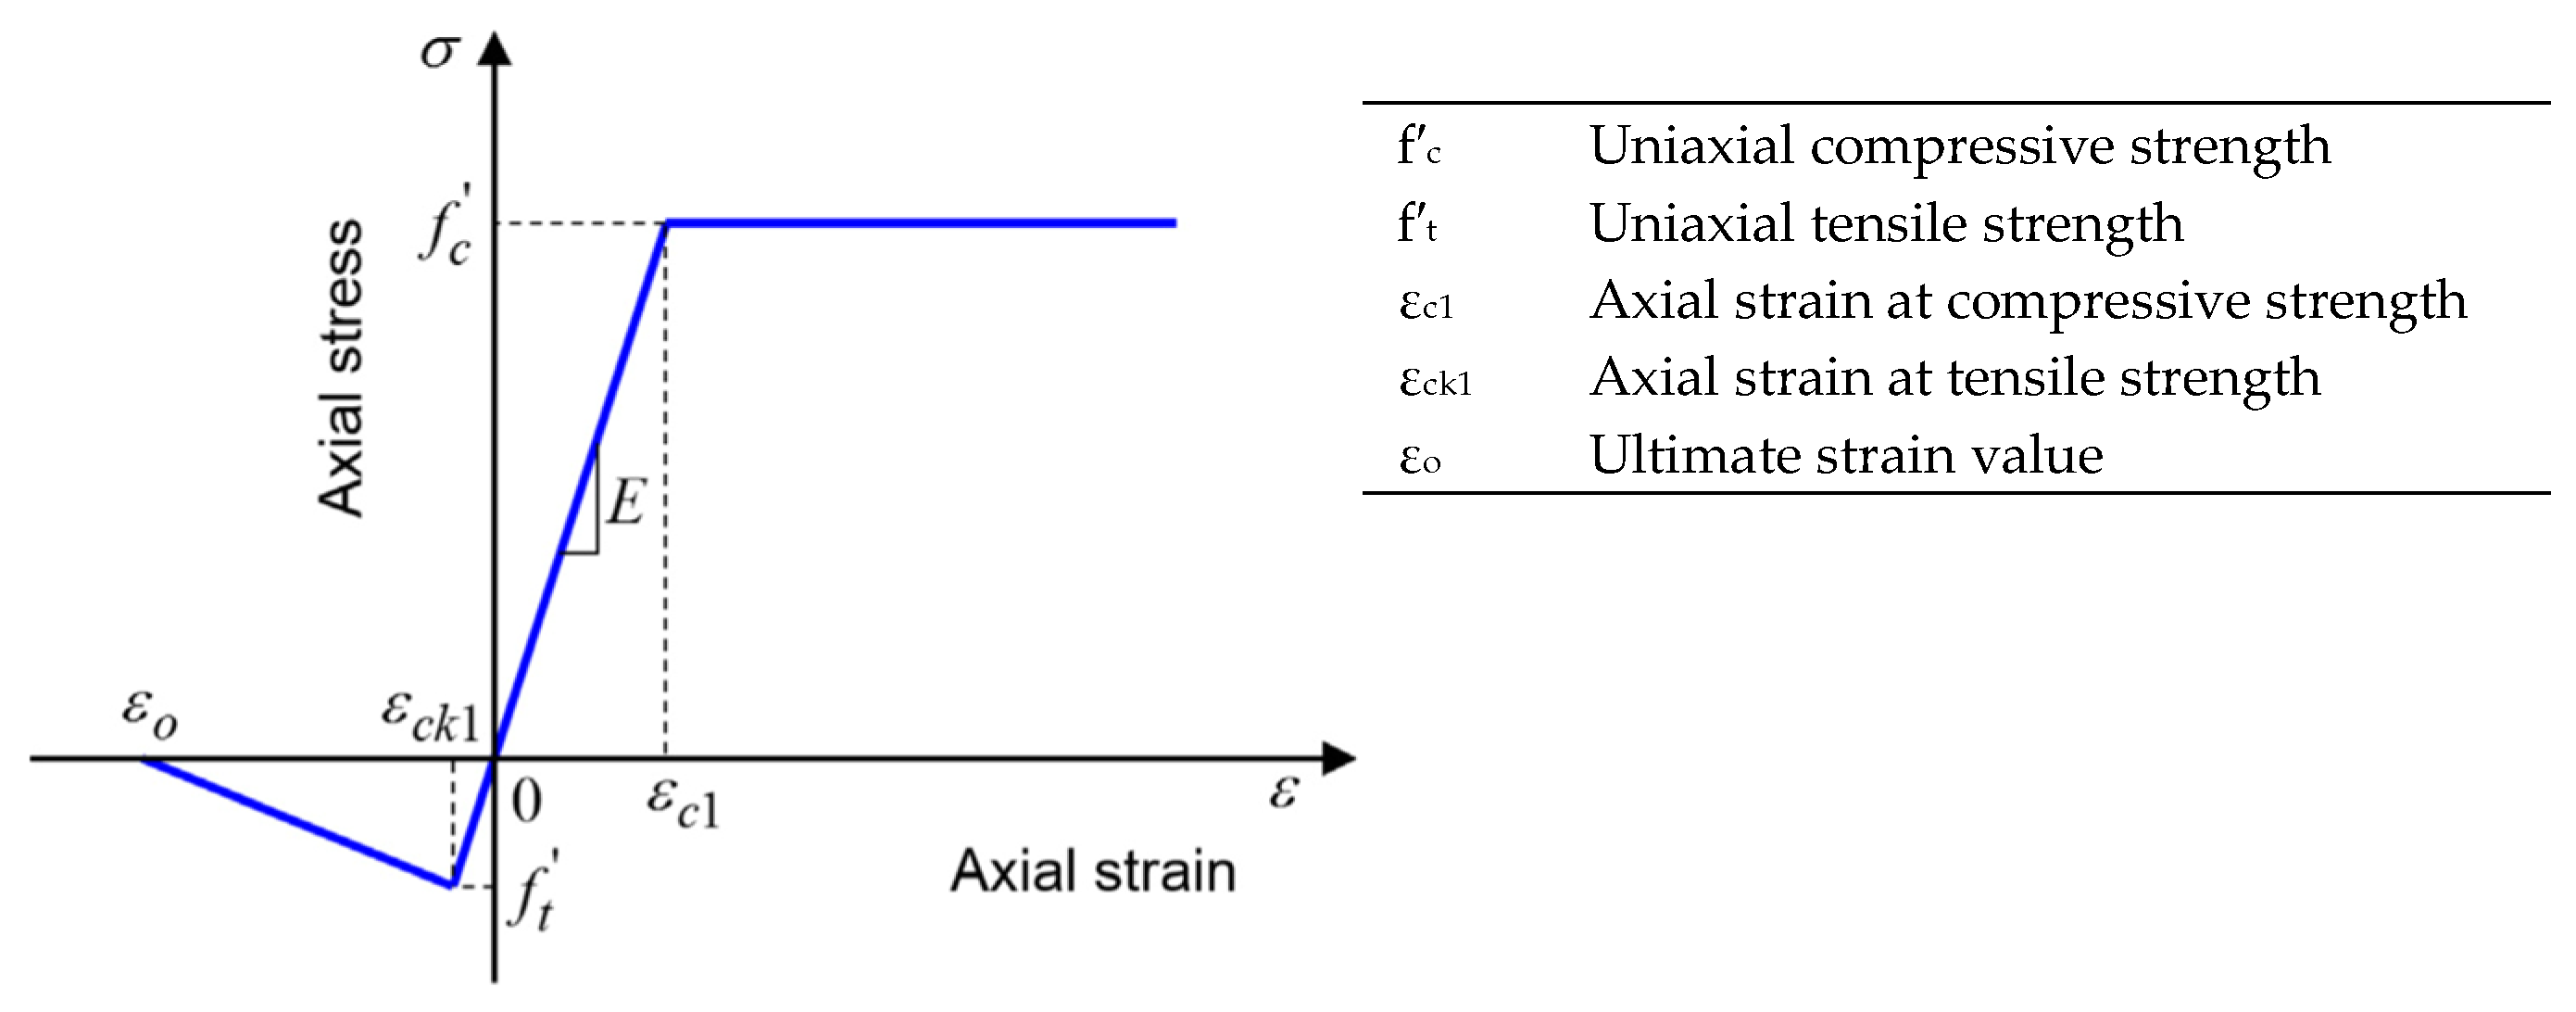
The Winfrith Concrete Model (WCM) was used in the FE analyses (Figure 8). This model involves a smeared crack concrete behavior that propagates forces through crack openings and stores crack openings in concrete while the element is under successive compressive and tensile forces [28,29,30,31].
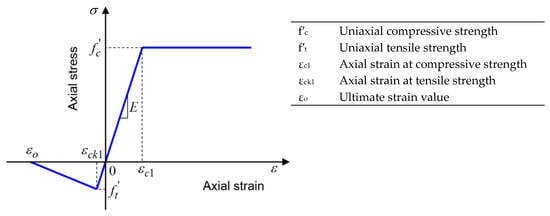
Figure 8.
Winfrith Concrete Model.
In LS-DYNA, the WCM provides the option to take the strain-rate effect into account by selecting a value equal to 0, 1 or 2. The strain-rate effect is considered when the rate is equal to 0 (zero), and is not considered when the rate is either 1 or 2 (2 is for a more advanced effect that allows the accumulation of cracks throughout the simulation). Since the loading mechanism in the tested frames was quasi-static, the strain rate effect was neglected by setting the rate value equal to 2. Table 3 presents the properties of the concrete in the tested frames, which were also adopted in the FE models.
Table 3.
Winfrith concrete model input data in LS-DYNA.
The WCM overestimated the experimental results due to the higher initial concrete stiffness anticipated in the early loading stages. In order to overcome this issue, a solution proposed by Epackachi and Whittaker was used in the FE models [32,33]. In these studies, the researchers identified the problem as the shrinkage strain of concrete specified at a location above the foundation. They proposed the following solution to revise the ultimate shrinkage strain of concrete by decreasing the temperature of the column member to a limited length measured away from the foundation using a definition called zone height, HT. The temperature increment in this limited part of the column was obtained using Equation (1) [34].
where αc is the coefficient of thermal expansion and εsh is the ultimate drying shrinkage strain of concrete. During the analysis, three distinct shrinkage strain values were used: 400, 800, and 1600. Two different values of wall thickness, Tw (250 mm) and 2Tw (500 mm), were considered in the HT zone above the foundation, where Tw is the thickness of the column. The HT and the shrinkage strain values that best predicted the test results were 500 mm and 1600 microstrains, respectively [35]. For the tangent modulus, a constant value of 0.5Ec was used in the WCM, where Ec refers to the concrete’s modulus of elasticity [36]. A 25 mm cubic element was used to model the concrete. The concrete elements were assumed to experience erosion and were eliminated from the model when their minimum principle strain of 4% at failure was exceeded [33]. Erosion is a definition used for failed concrete elements to indicate that they are no longer active and therefore should be deleted from the structural model.
∆T = εsh/αc
2.2.2. Reinforcement Steel
The reinforcing steel bars were modelled using a plastic kinematic model, which considered the Bauschinger Effect (BE) as a quasi-static cyclic behavior [37,38]. The BE refers to a material property in which the stress–strain characteristics of the material change due to the microscopic stress distribution throughout the material [39]. The modulus of elasticity and yield strength of the steel reinforcement were obtained from the tested frames as 215 GPa and 428 MPa, respectively (Table 4).
Table 4.
Steel reinforcement and structural steel section properties.
The steel elements were assumed to erode and were eliminated from the model when their principal strain values at failure exceeded 20% [40,41]. For the reinforcing steel, a mesh size of 25 mm was used. The reinforcing steel bars and concrete were defined as having perfect bonding at the intersecting nodes using constraints in the Lagrangian solid [42].
2.2.3. I-Shaped and Square-Shaped Steel Sections
The composite columns were created using an I-shaped steel section of HEB 100 and two square-shaped steel sections of 100 mm × 100 mm with 6 and 8 mm thicknesses. The I and square-shaped steel sections were modelled using an elastic and perfectly plastic material model with a yield strength of 317 MPa and a modulus of elasticity of 215 GPa. No erosion property in any steel section was defined since the steel sections were not expected to yield during the analysis, as verified by the results of the tested frames [24]. The element mesh size for the steel section was 25 mm. Similar to the assumption made for the reinforcing steel bars and concrete, the steel sections and concrete elements sharing the same nodes were constrained together to achieve perfect bonding [42].
2.3. Loading Mechanism
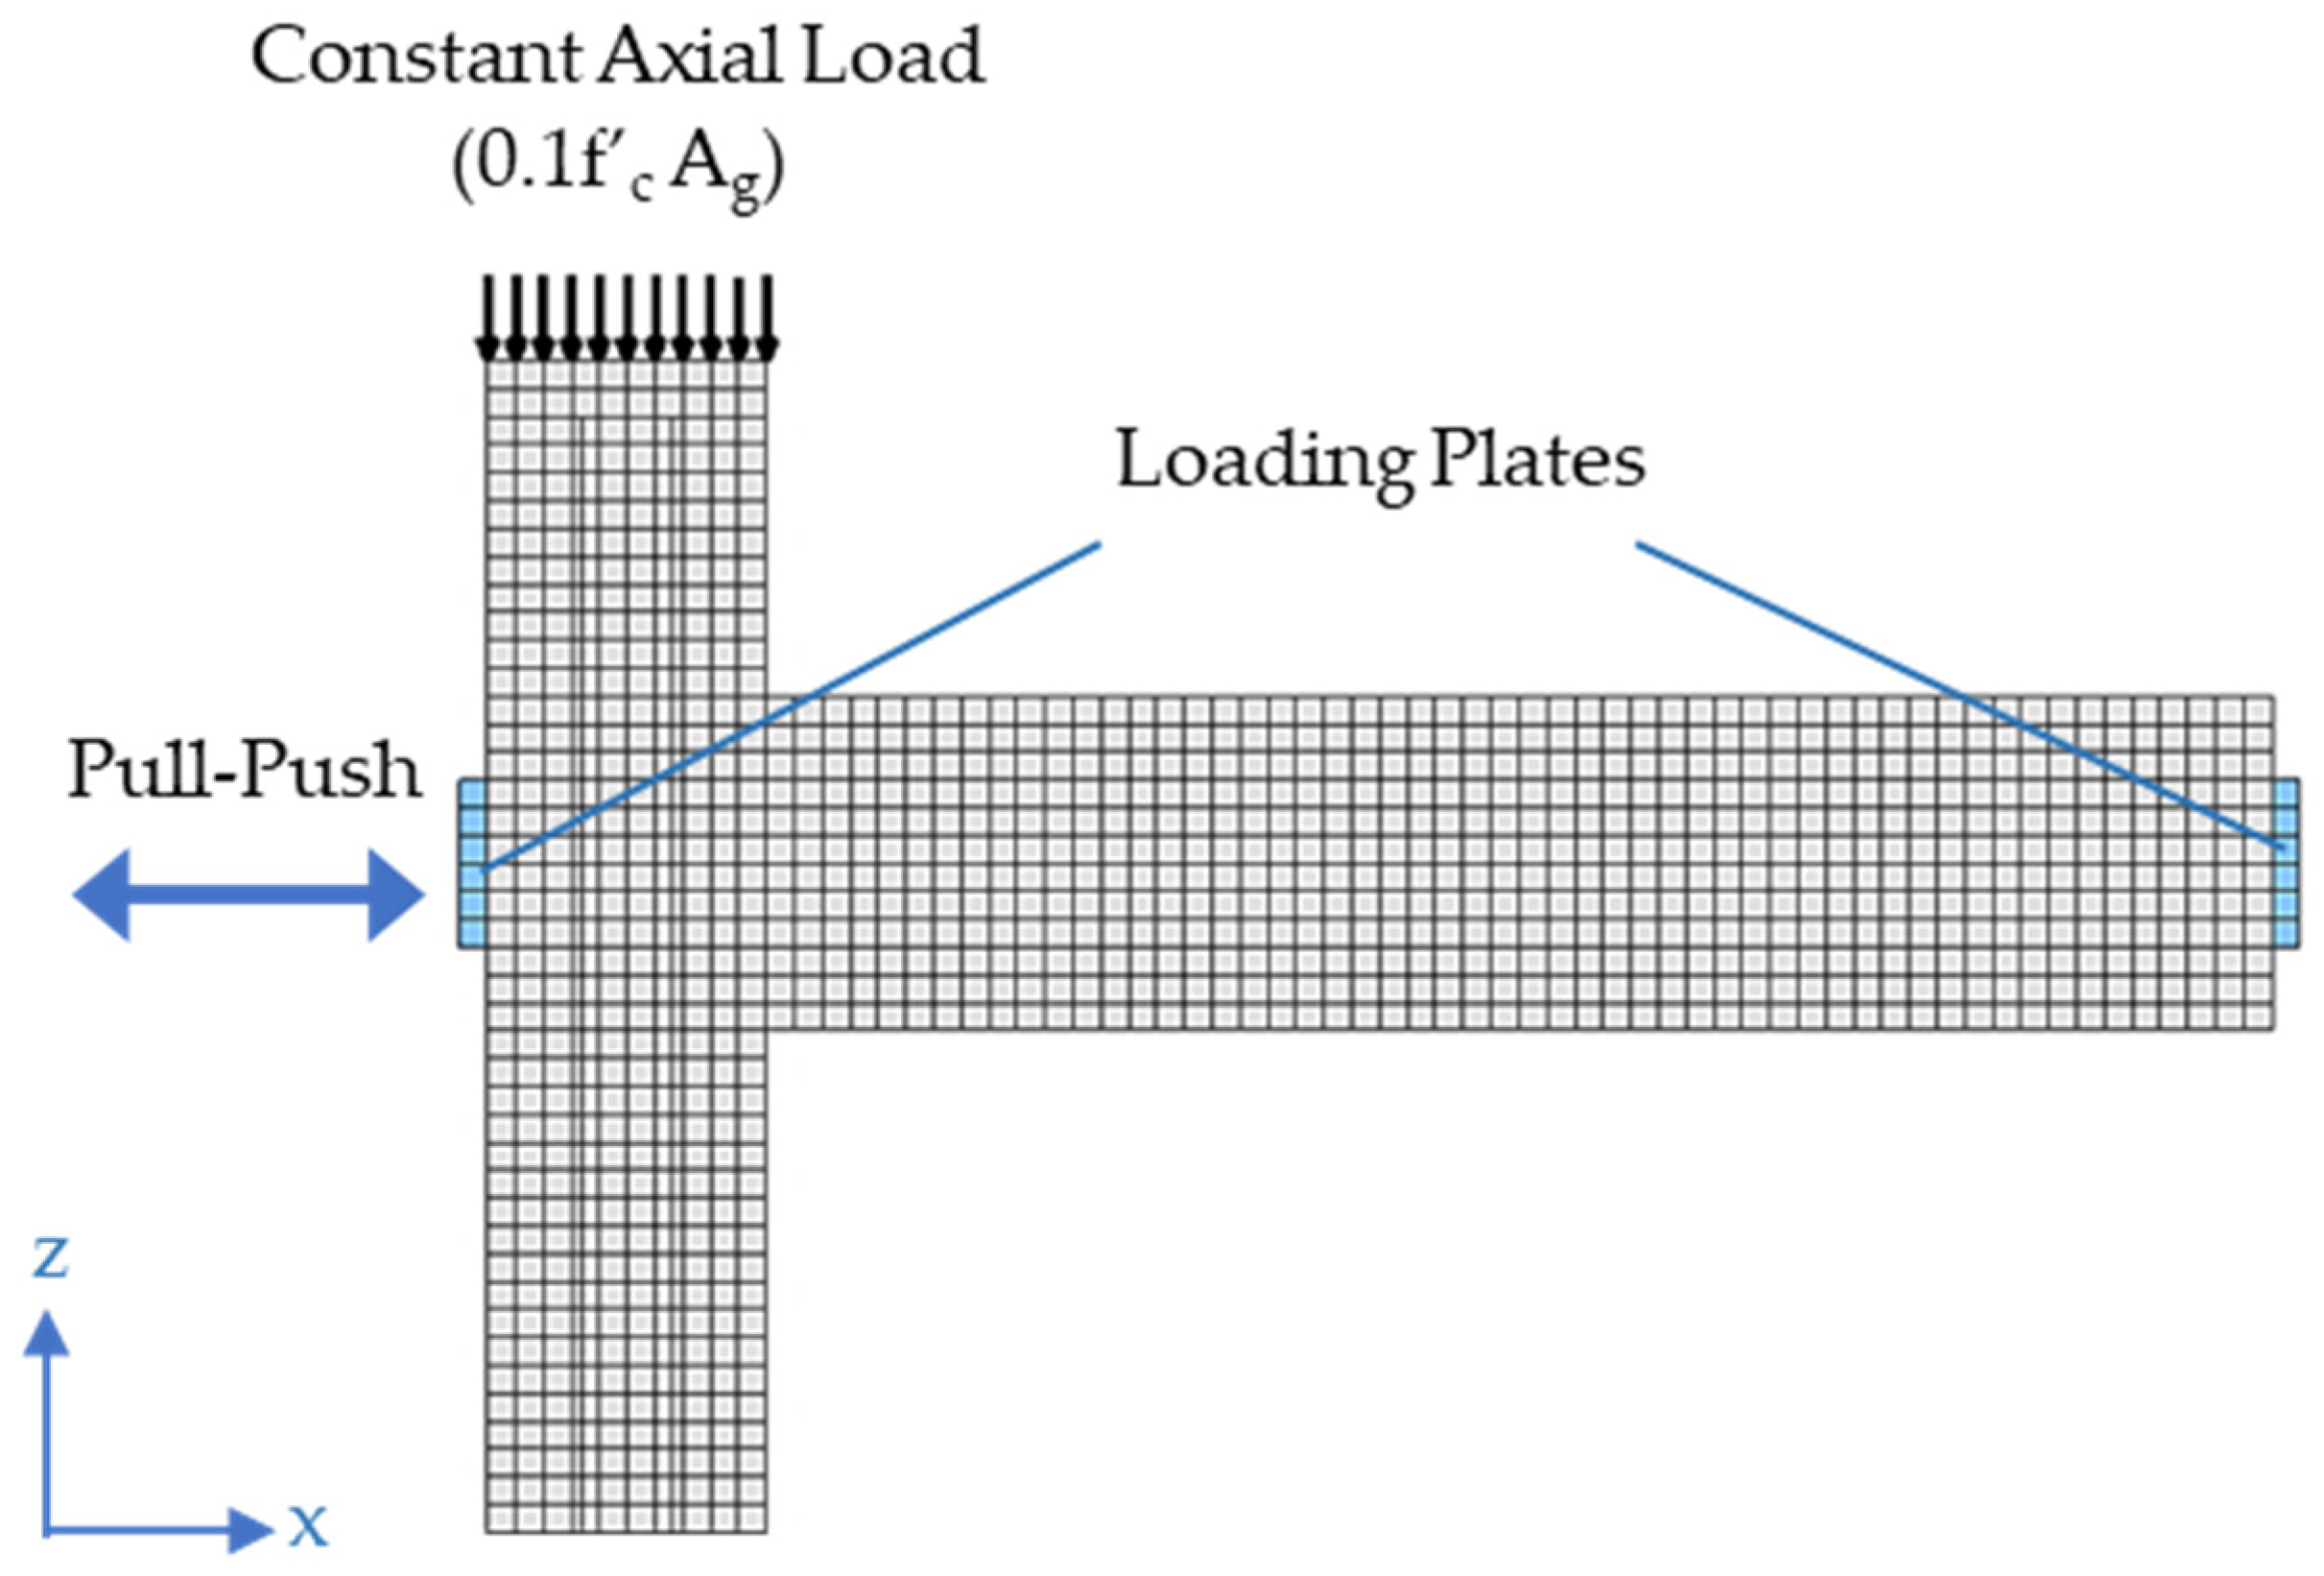
The tested frames were subjected to lateral and gravity loads. Therefore, the same loading pattern was maintained for the analytical study as well. Lateral loads were applied to the frames by using solid rigid plates which were attached to the joints and the midpoint of the beam (Figure 9). Plate deformations that might initiate from this loading were prevented by assigning a rigid material property to the loading plates. The movements of these plates were also restrained so that they would translate in the “x” and rotate around the “y” directions. The contact surface between the plate and the structural frame was modelled using a surface-to-surface contact property by employing a high friction coefficient of 0.9 [23,38].
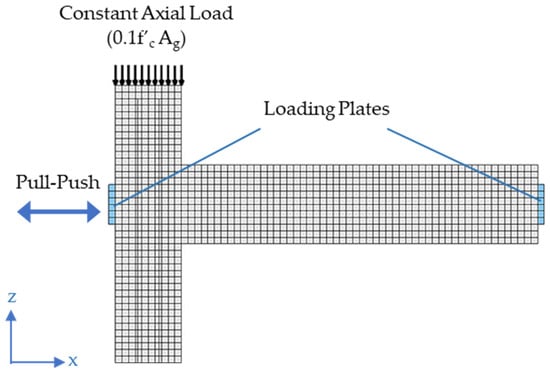
Figure 9.
Loading scheme.
In the experimental part of this study, the frames were subjected to lateral loads using a displacement control loading mechanism. The drift ratios and corresponding lateral displacement values applied to the frames are given in Table 5. The lateral displacements were determined by multiplying the correspondent drift ratios by the total height of the frame, which was 1500 mm as illustrated in Figure 1.
Table 5.
Drift ratios and corresponding displacements applied to the tested specimens.
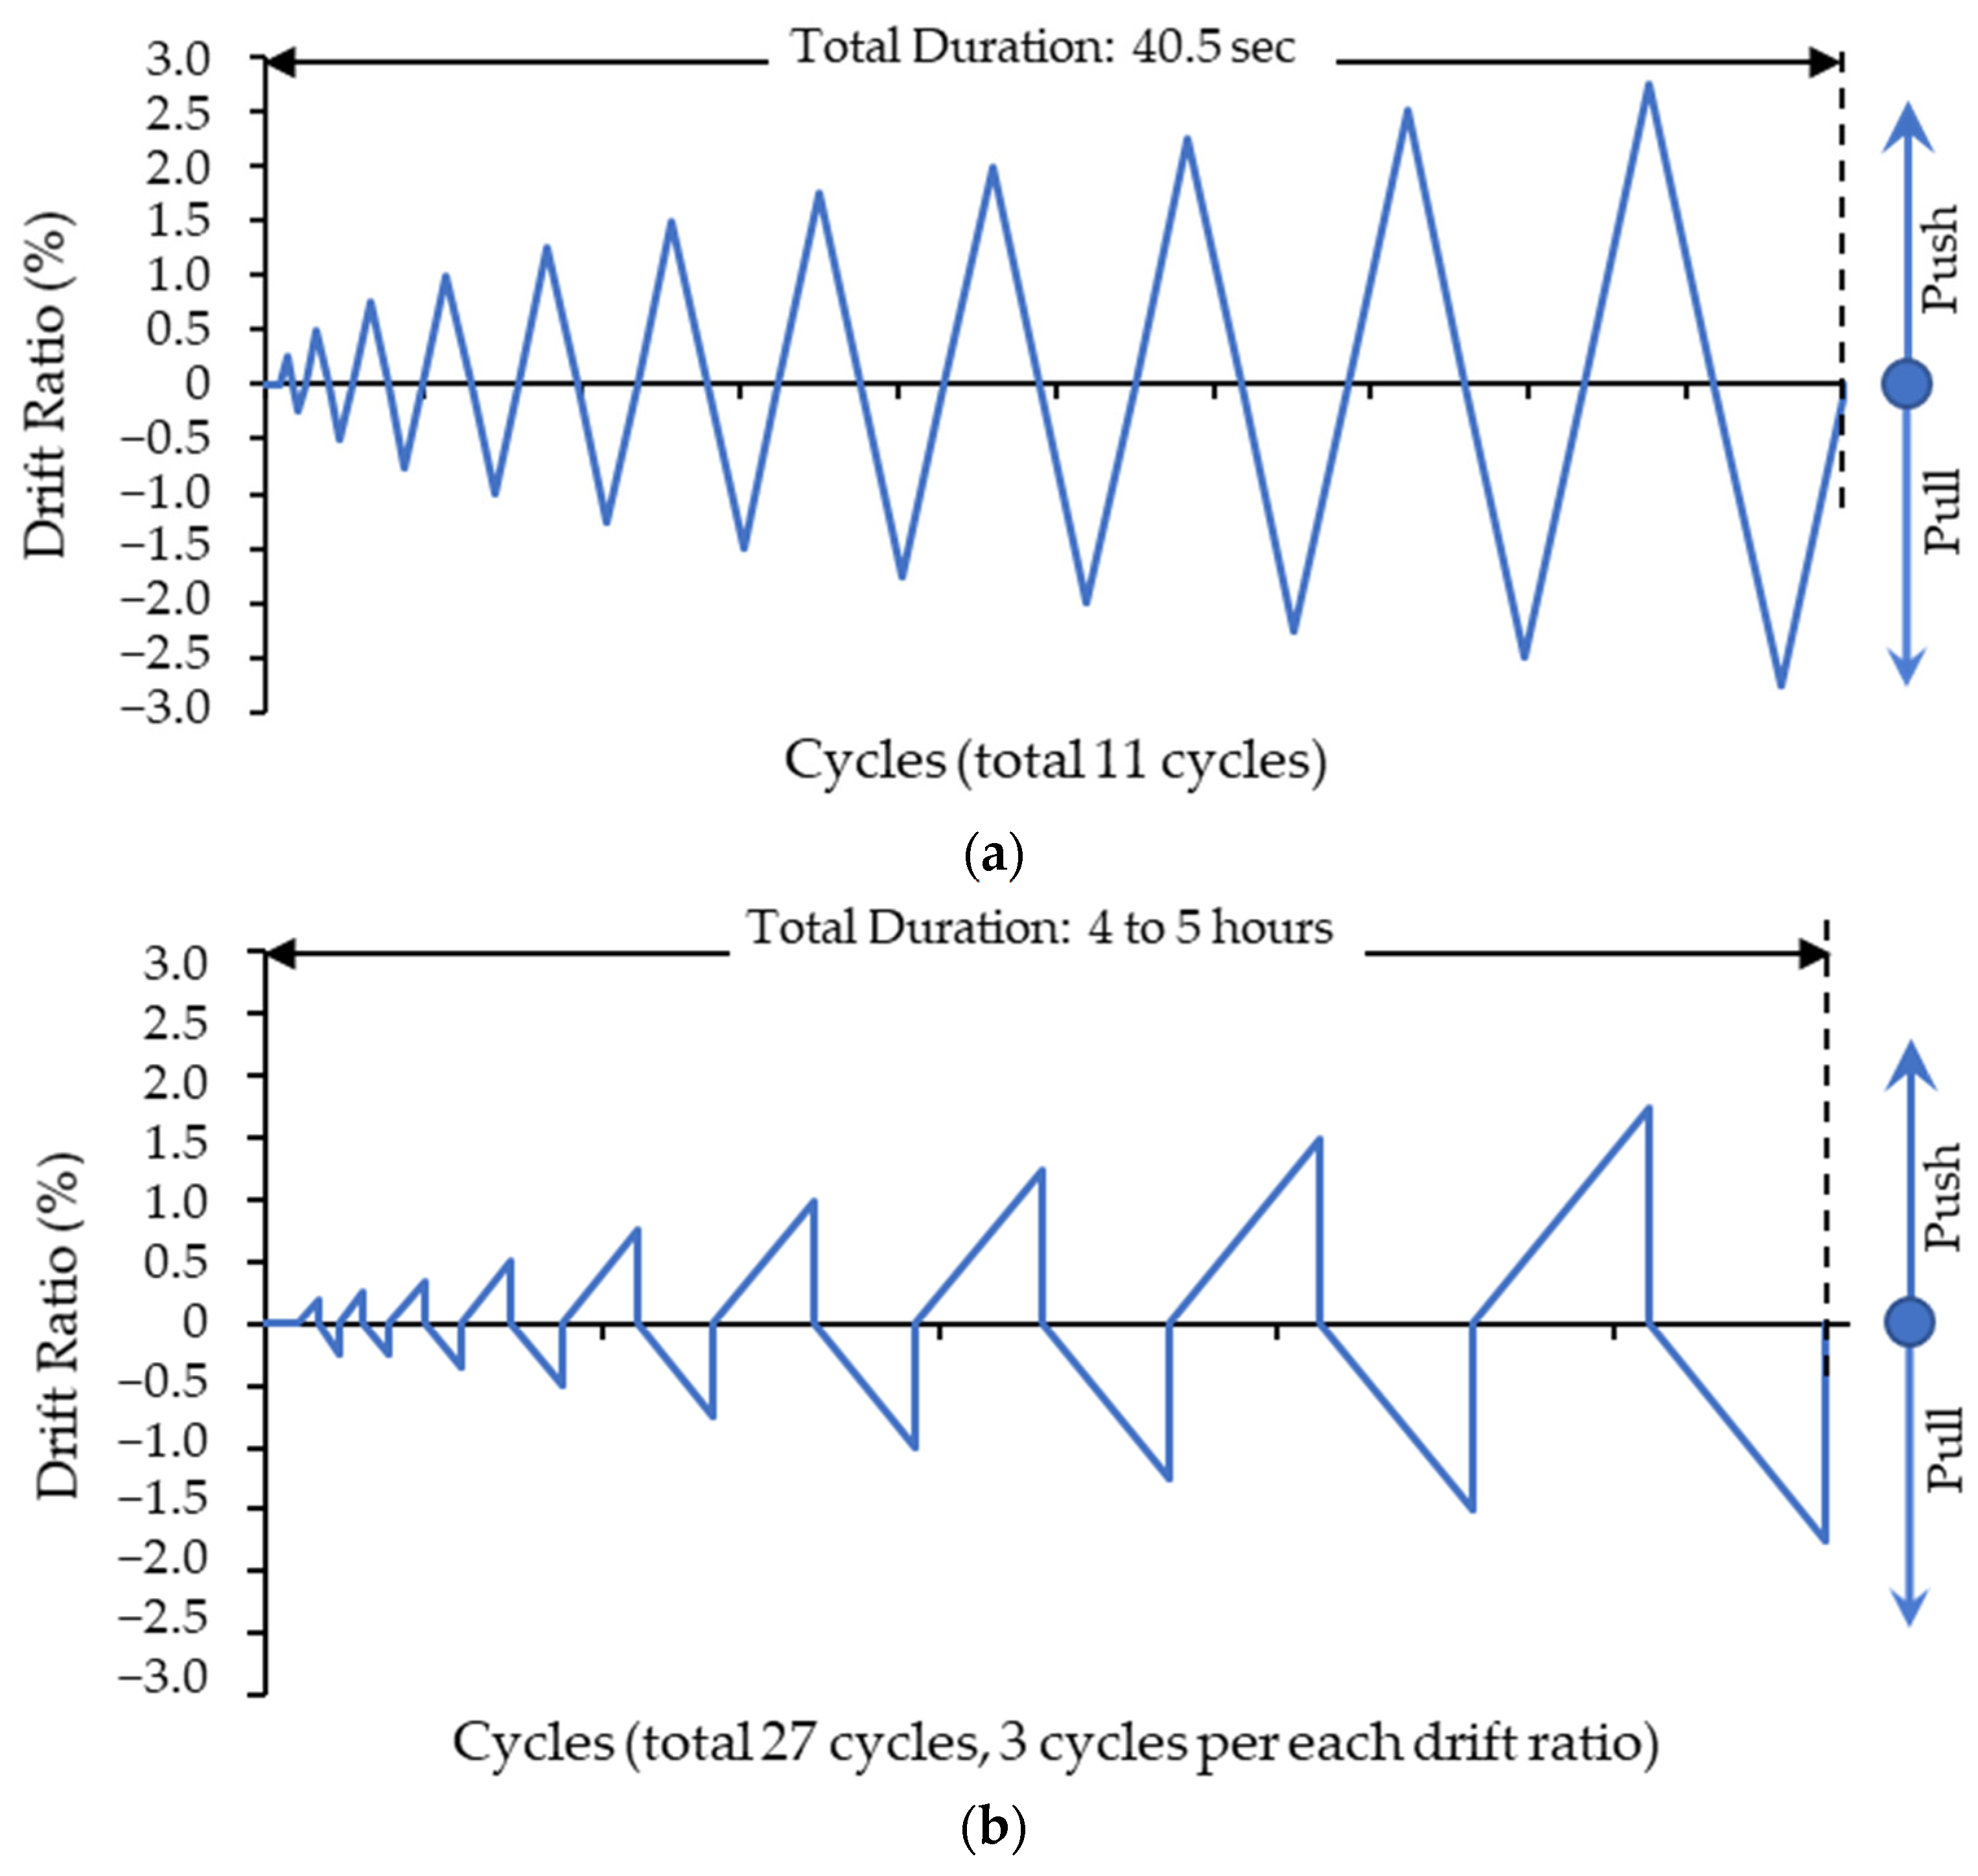
The tested frames were subjected to a maximum drift ratio of 1.75% due to laboratory limitations [24]. However, in the FE analyses, the models were analyzed up to a maximum drift ratio of 2.75%, which was defined as a substantial ratio that could cause severe damages and failures in buildings [43,44]. The total duration of the FE analysis up to the 1.75% drift ratio was 17.5 s; however, this duration was between 4 to 5 h in the tested frames due to the loading scheme followed and the time needed to mark up the cracks after each drift cycle. The total duration the FE models was achieved in 40.5 s.
As illustrated in Figure 10, there was some degree of difference between the loading schemes of the FE analyses and the frame tests. During the FE analyses and the testing stage, the frames were pushed slowly until they reached their maximum drift ratios (positive drift ratios were used to define the push in the frames). Unlike the loading protocol that was followed during frame pushing, the lateral loads on the tested frames were released suddenly in order to bring them back to their initial positions at rest before any further lateral loads were applied to pull these frames. However, this act of sudden load release was not used in the FE models since the frames were slowly brought back to their initial positions by applying a lateral load in the opposite direction (negative drift ratios were used to define the opposite direction or pull in the frames). The sudden load release in the experimental tests is believed to have caused some degree of negligible difference in the damage patterns and structural behavior of the connections when they are compared to those from the FE models. The possible impact of this difference in the loading scheme is also addressed in the following sections, where the detailed comparative damage patterns and the structural behaviors of the connections are discussed. The second type of loading acting on the columns were gravity loads. Like the axial loads applied to the tested frames, a constant value of 150 kN vertical loads were applied concentrically to each column, simulating 10% of the column capacity (0.1f’c Ag, where f’c is the specified concrete compressive strength and Ag is the gross cross-sectional area of the column).
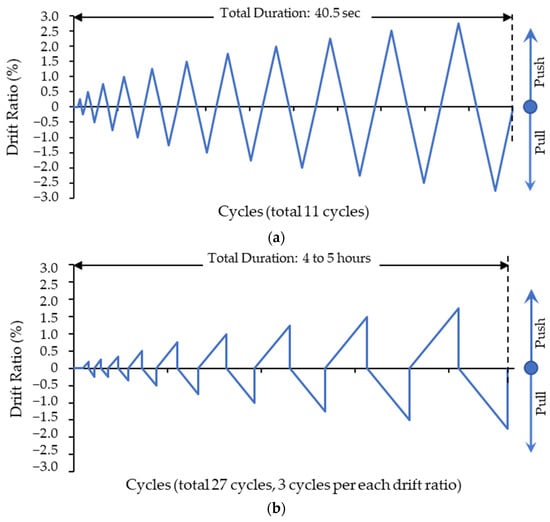
Figure 10.
Loading scheme: (a) Analytical model; (b) tested specimen.
2.4. Boundary Conditions
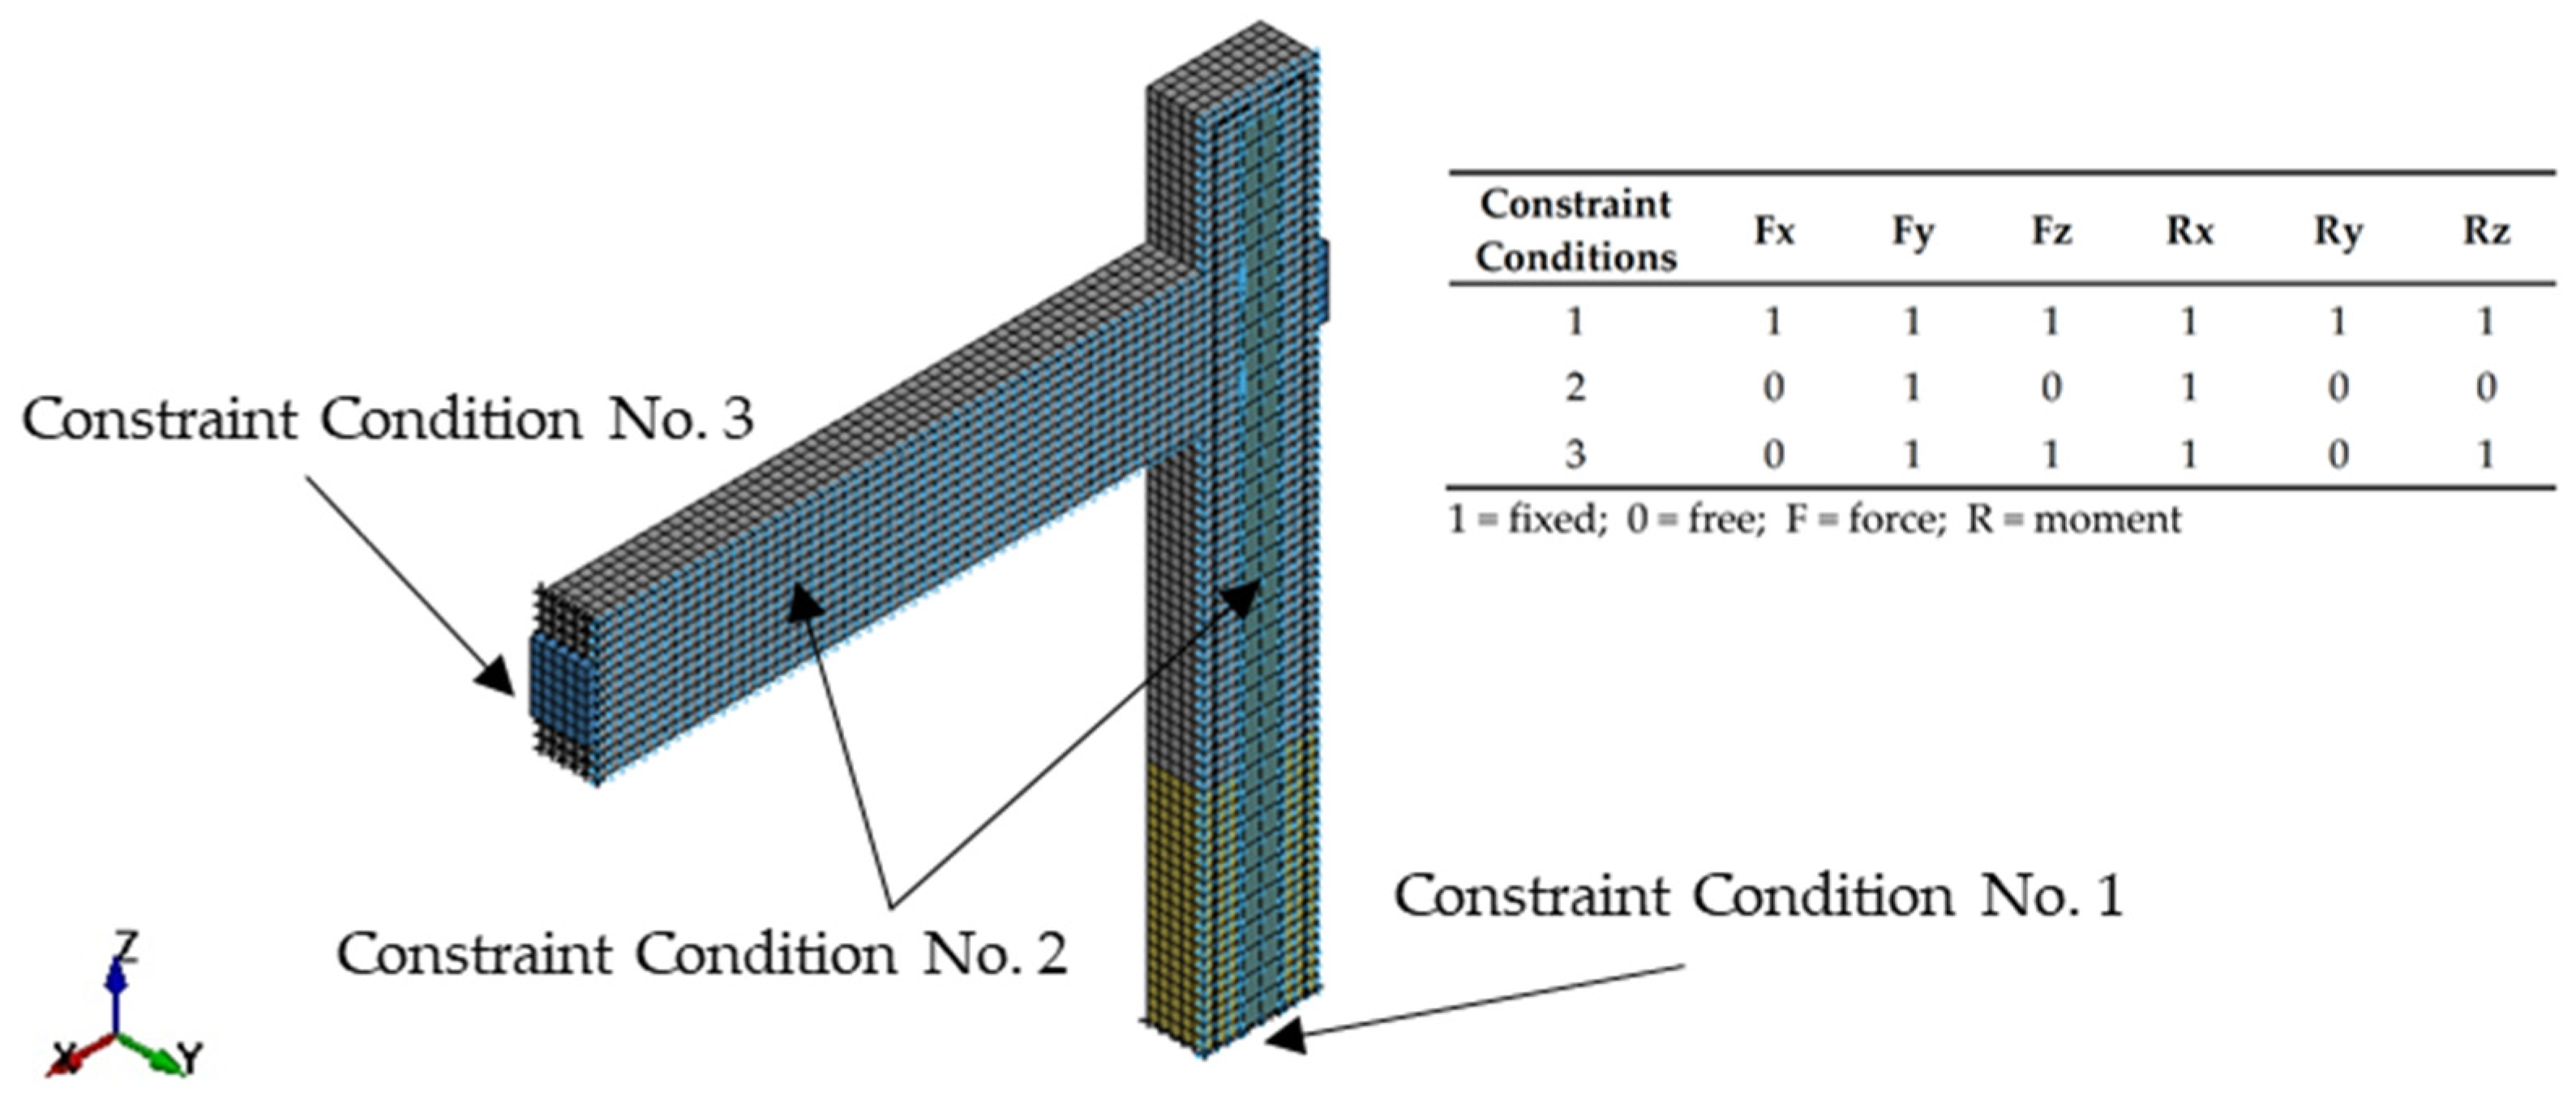
As illustrated in Figure 11, a total of three constraint conditions were used. The first was employed at the bottom of each column by restraining their displacements and rotations in all directions. The second was used at the cut surface of the beam along the “x” direction by restraining the beam’s displacement in the “y” direction and its rotation around the “x” direction. The third constraint condition was applied at the half length of the beam along the “y” direction. This restrained the beam displacements in both the “y” and “z” directions and its rotation around the “x” and “z” directions.

Figure 11.
Constraint conditions.
3. Verification of the First Two Models’ Benchmark Results
The first two quarter models (HI-C25 and LI-C25) were used to validate the behavior of the frames based on the results of the two previously tested frames [24]. The frame behaviors were compared to those of the tested frames up to a drift ratio of 1.75%, which was the maximum ratio achieved in the laboratory tests. The results of the FE analyses indicated that the behavior of both quarter models were consistent with those of the tested frames. In the following subsections, comparisons of the results between the models and tested frames will be explained in detail using parameters such as cracks and failure patterns, hysteresis loops, energy dissipation, and stiffness degradation.
3.1. Cracks and Failure Patterns
The first concrete cracks occurred in the HD model (HI-C25) when the drift ratio was 0.25%. These cracks were located at the upper and lower corners of the beam–column joint, and extended towards the centerline of the beam in subsequent drift cycles. Inclined shear cracks were also observed at the 0.75% drift ratio and became more noticeable at the 1.25% drift ratio, with an apparent extension towards the core zone of the joint. The horizontal cracks on the outer part of the joint began at the 0.25% drift ratio, where the load was applied in the negative x-direction (pull). The vertical cracks in the beam occurred at the 0.75% drift ratio. These cracks became larger as the drift ratio increased and became more prominent at the corners of the joint. The concrete elements were eroded (eliminated) from the model due to the tension failure that occurred at the lower corner of the joint when the drift ratio was 2% (Figure 12, Figure 13a,b and Figure 14a).
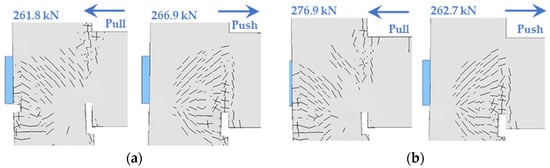
Figure 12.
Failure patterns at the column–beam joints of the first two models at a drift ratio of 2.75%: (a) HI-C25 model; (b) LI-C25 model.
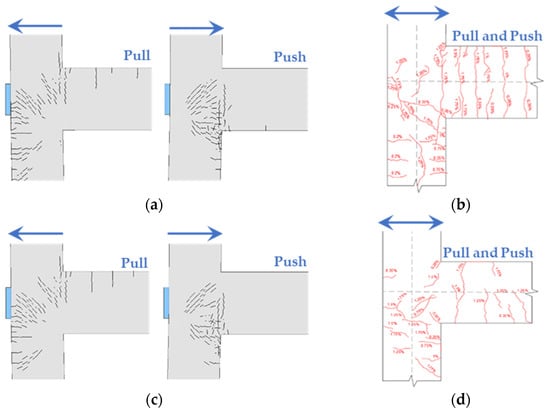
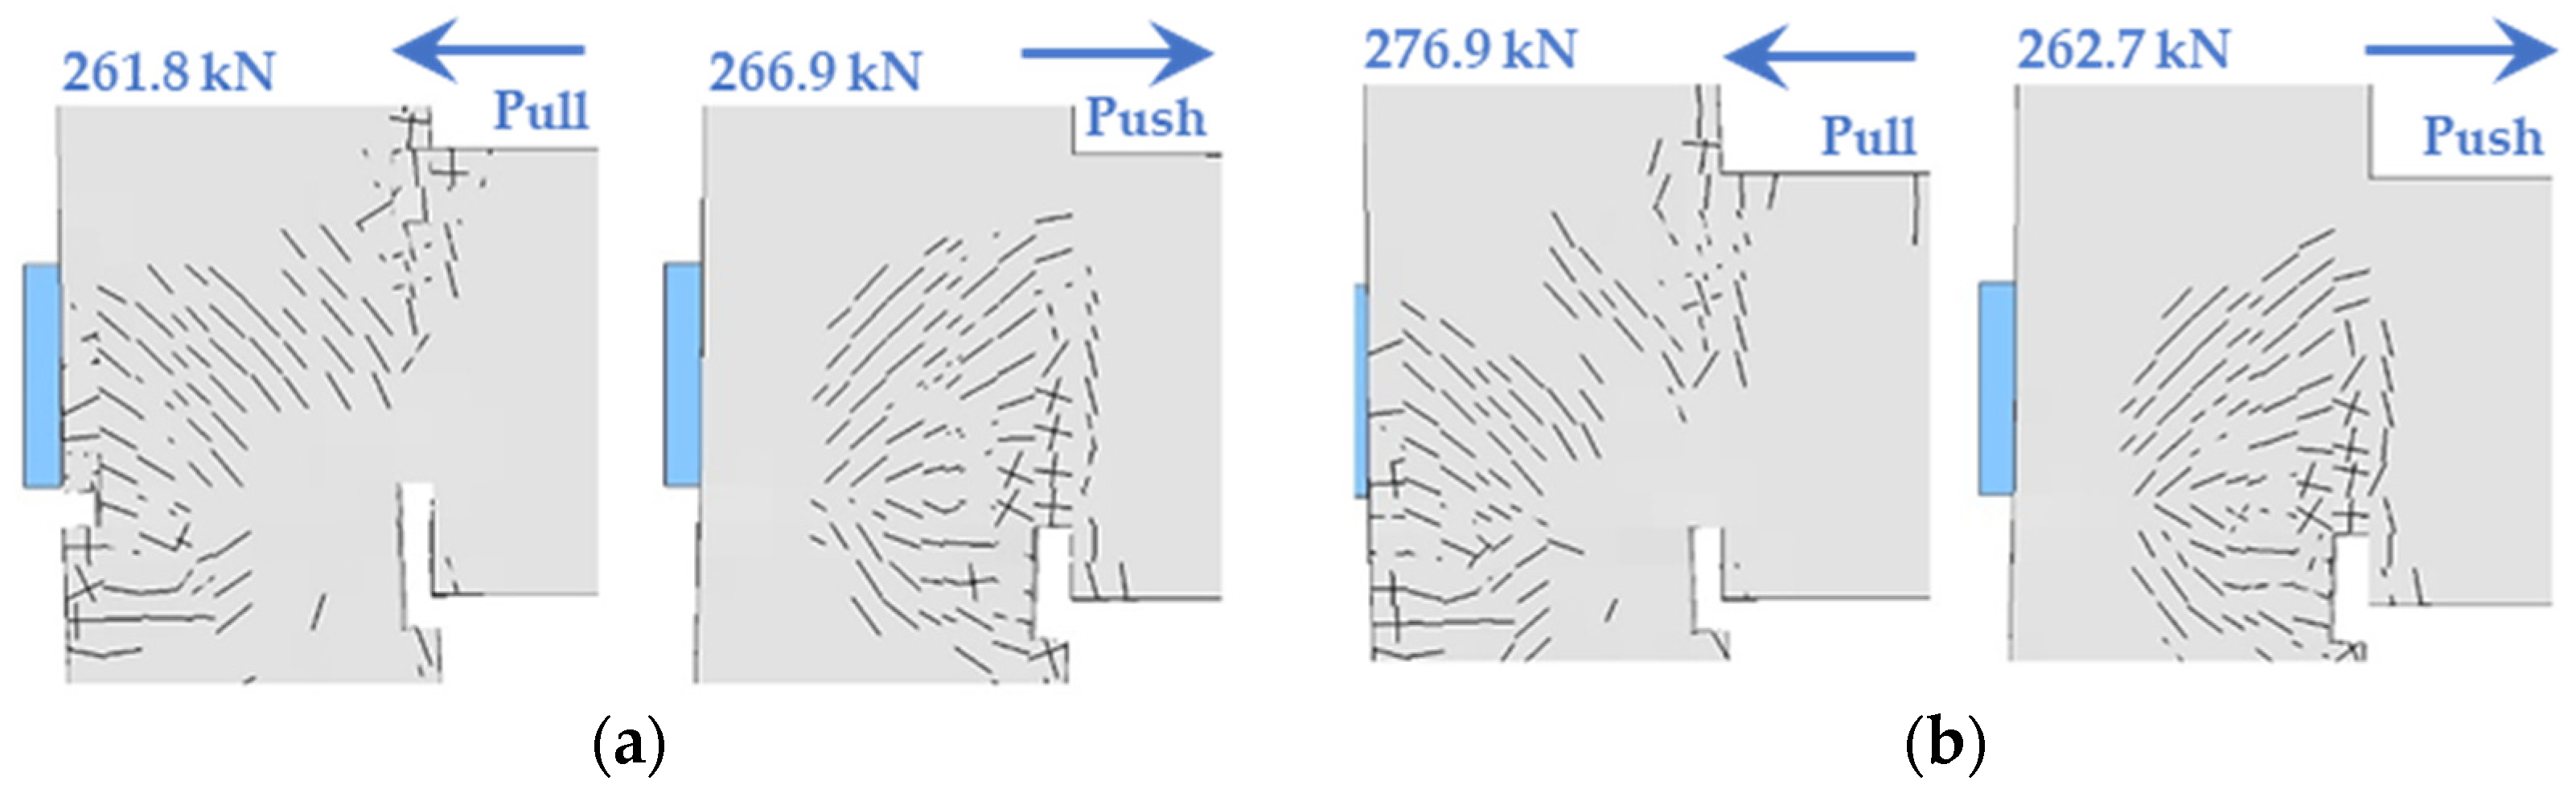
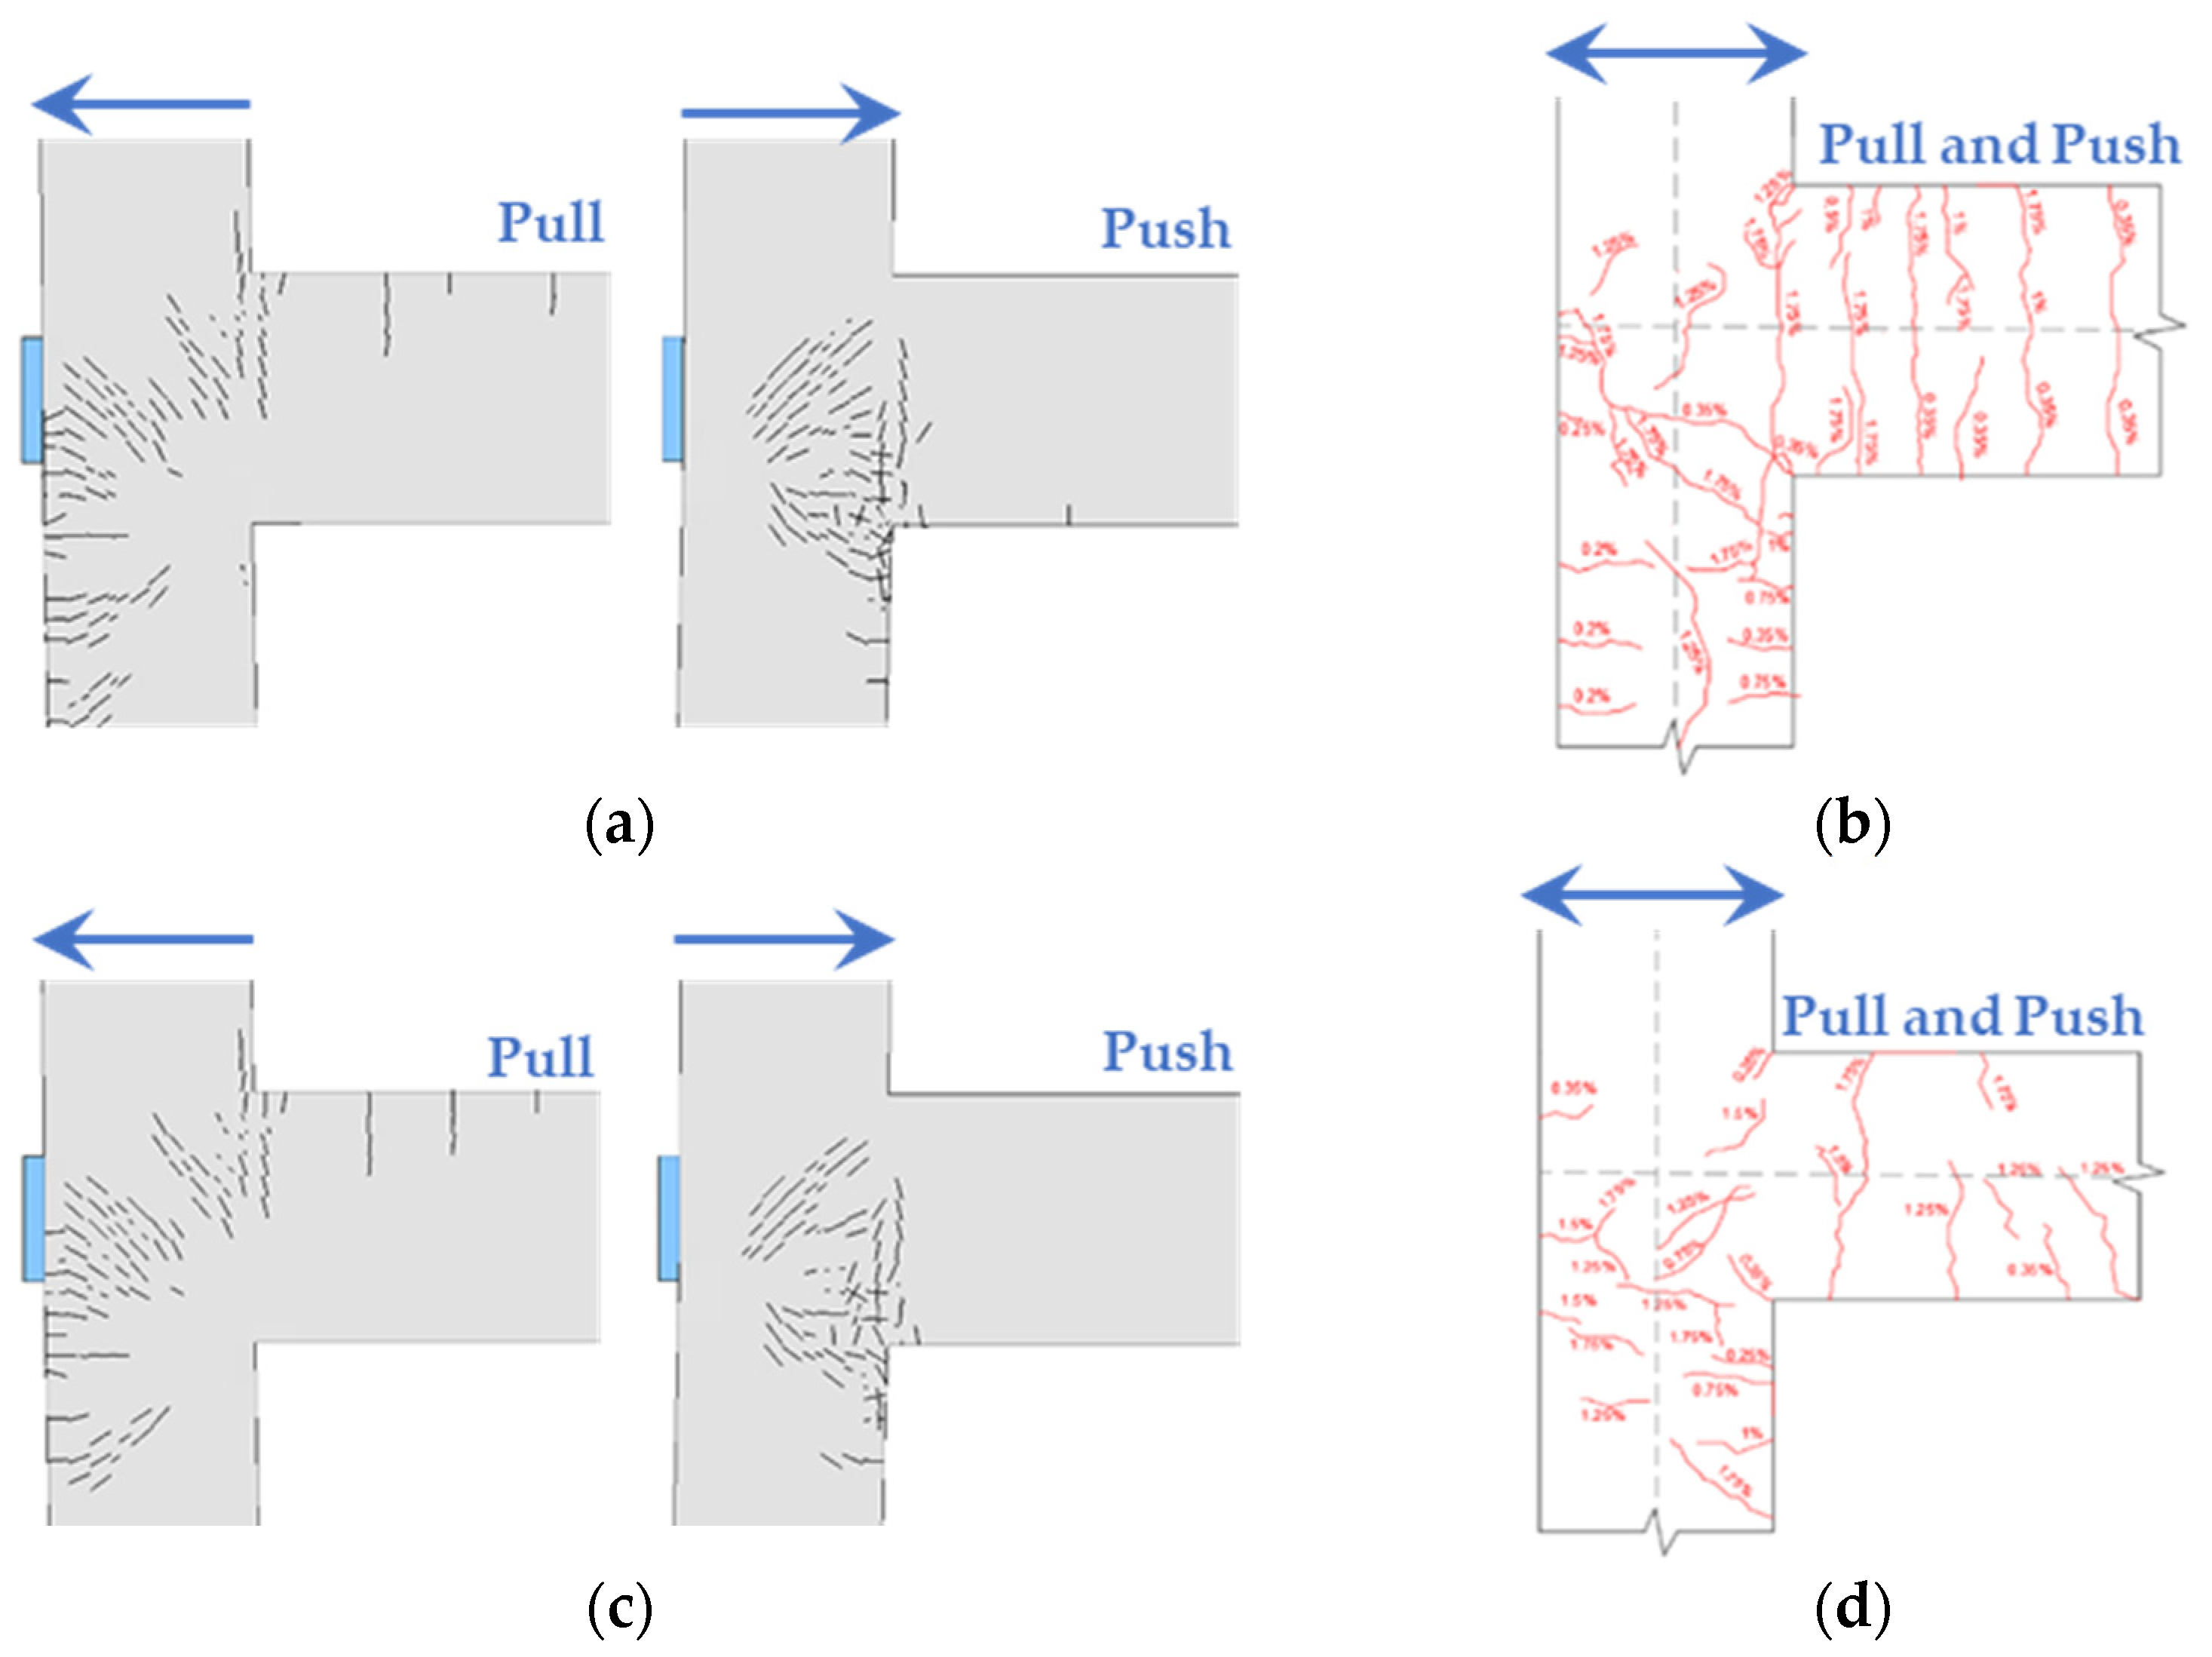
Figure 13.
Crack patterns of frames at drift ratio of 1.75%: (a) HI-C25 model; (b) tested HD frame; (c) LI-C25 model; (d) tested LD frame.
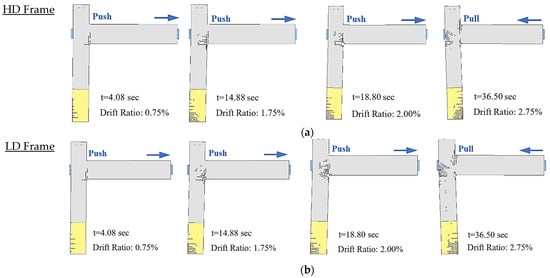
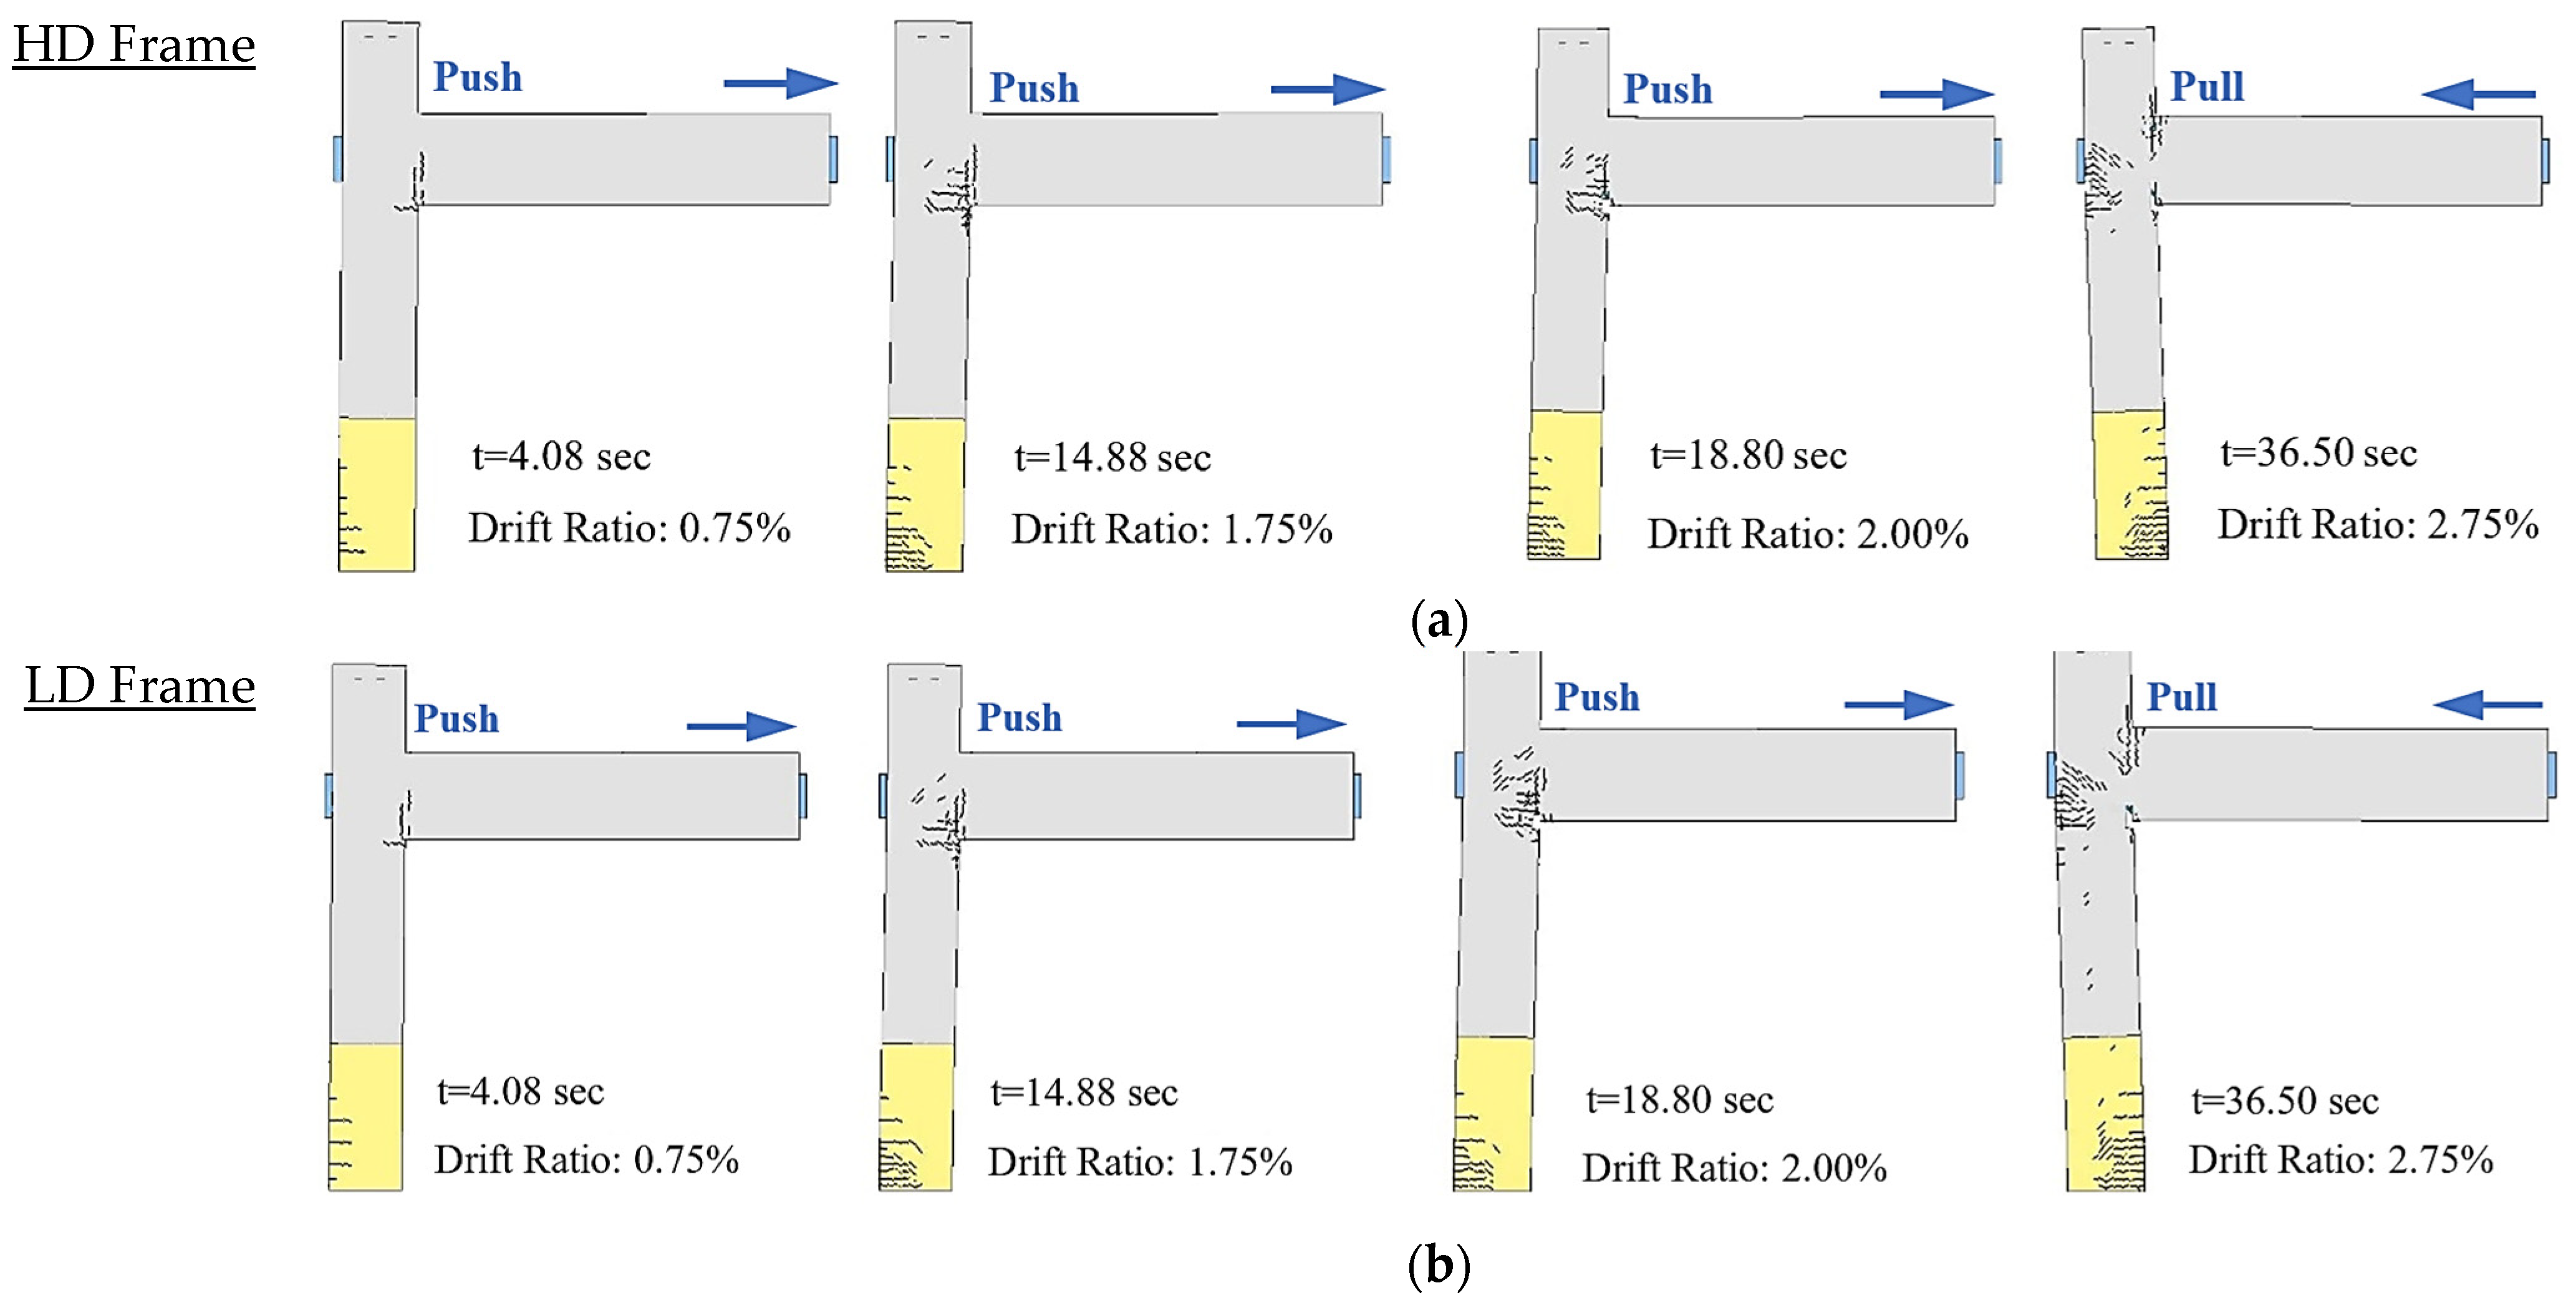
Figure 14.
Crack patterns of the frames at varying drift ratios: (a) HI-C25 model; (b) LI-C25 model.
The removal of these elements indicated steady progress in the cracks and led to larger cracks. As the drift ratio increased, concrete spalling occurred at these crack locations when the lower principal failure strain of the element exceeded the 4% limit stated by Epackachi and Whittaker [32,33]. The analytical results of the HI-C25 model showed that the erosion of concrete elements continued at the lower corner (throughout the full column width) and upper corner (only on the outer surface of the joint). These cracks vertically extended towards the centerline of the beam and also occurred at the exterior faces of the joint under the loading plate (Figure 12).
In the LD model (LI-C25), slightly fewer cracks were observed. The initial cracks occurred at the corners of the joint when the drift ratio was 0.25%. At the 0.75% drift ratio, horizontal cracks appeared on the beam. The concrete elements were removed from the model at the eighth cycle, when the drift ratio was 2%, due to a similar failure mode observed for the HI-C25 model (Figure 12, Figure 13c,d and Figure 14b).
A comparison of the crack patterns of the tested frames and the FE models is shown in Figure 13 and Figure 14, when a maximum drift ratio of 1.75% was achieved. Based on these results, it was determined that the number of cracks in the models was slightly more elevated at the joint and beams than in those of the tested frames. However, in general, the results from the tested frames were consistent with those from the FE models. The difference in crack patterns is associated with the crack mark-up method that was used in the experimental phase. The cracks in the experimental phase were marked after each lateral load was released (the frame was at full rest) while the columns were still under constant axial load. Therefore, some of the minor cracks that developed in the frames when the target drift ratios were achieved were not marked. Thus, fewer crack patterns were marked on the frames than expected. However, since the crack patterns of the FE models were captured when the maximum drift ratios were achieved, they were noticeably greater in number.
Unlike the cracks of the joints and columns, the concrete damage observed in the RC beams of the tested frames at the 1.75% drift ratio were more severe than those recorded in the beams of the FE models (Figure 13) In fact, during their push cycles, the beams in the FE models exhibited only a few cracks at the bottom surface near the column joint area (i.e., not extending further into the beam). This damage pattern was attributed to the number of extensive cracks occurring specifically in the lower corner of the column beam joint due to the energy dissipation concentrated on the joint. This prevented the occurrence of further cracks in the beam. However, when the FE model was subjected to pull, the cracks in the column beam joint were noticeably fewer and therefore more energy dissipated into the beam causing more cracks. These results clearly indicate that frame failure was initiated by the cracks in the lower corner of the column–beam joint when the frame was subjected to push. Therefore, it is important to pay close attention to the details of the lower column–beam joint, since it would be more efficient to strengthen the lower joint if the lateral load capacity of the frame had to be increased.
The cracks in the beams of the tested frames are the sum of the cracks occurring during their pull and push cycles (in the FE models, the beam cracks are given separately for each pull and push cycle). The reason why the beams of the tested frames had more cracks was mostly because of the loading protocol of these frames, since they were subjected to three times more cyclic loading than the frames in the FE models [24]. Also, it is believed that during the construction of the tested frames, some minor problems with concrete pouring and/or compaction may have contributed to the cracking of the beams.
The overall crack patterns of the HD and LD frames were also plotted, as displayed in Figure 14. The crack patterns were captured from the models at varying drift ratios under consequent pull and push forces. The results indicate that the extensive cracks and member erosion (elimination) occurred around the lower and upper column–beam joints.
3.2. Hysteresis Loops
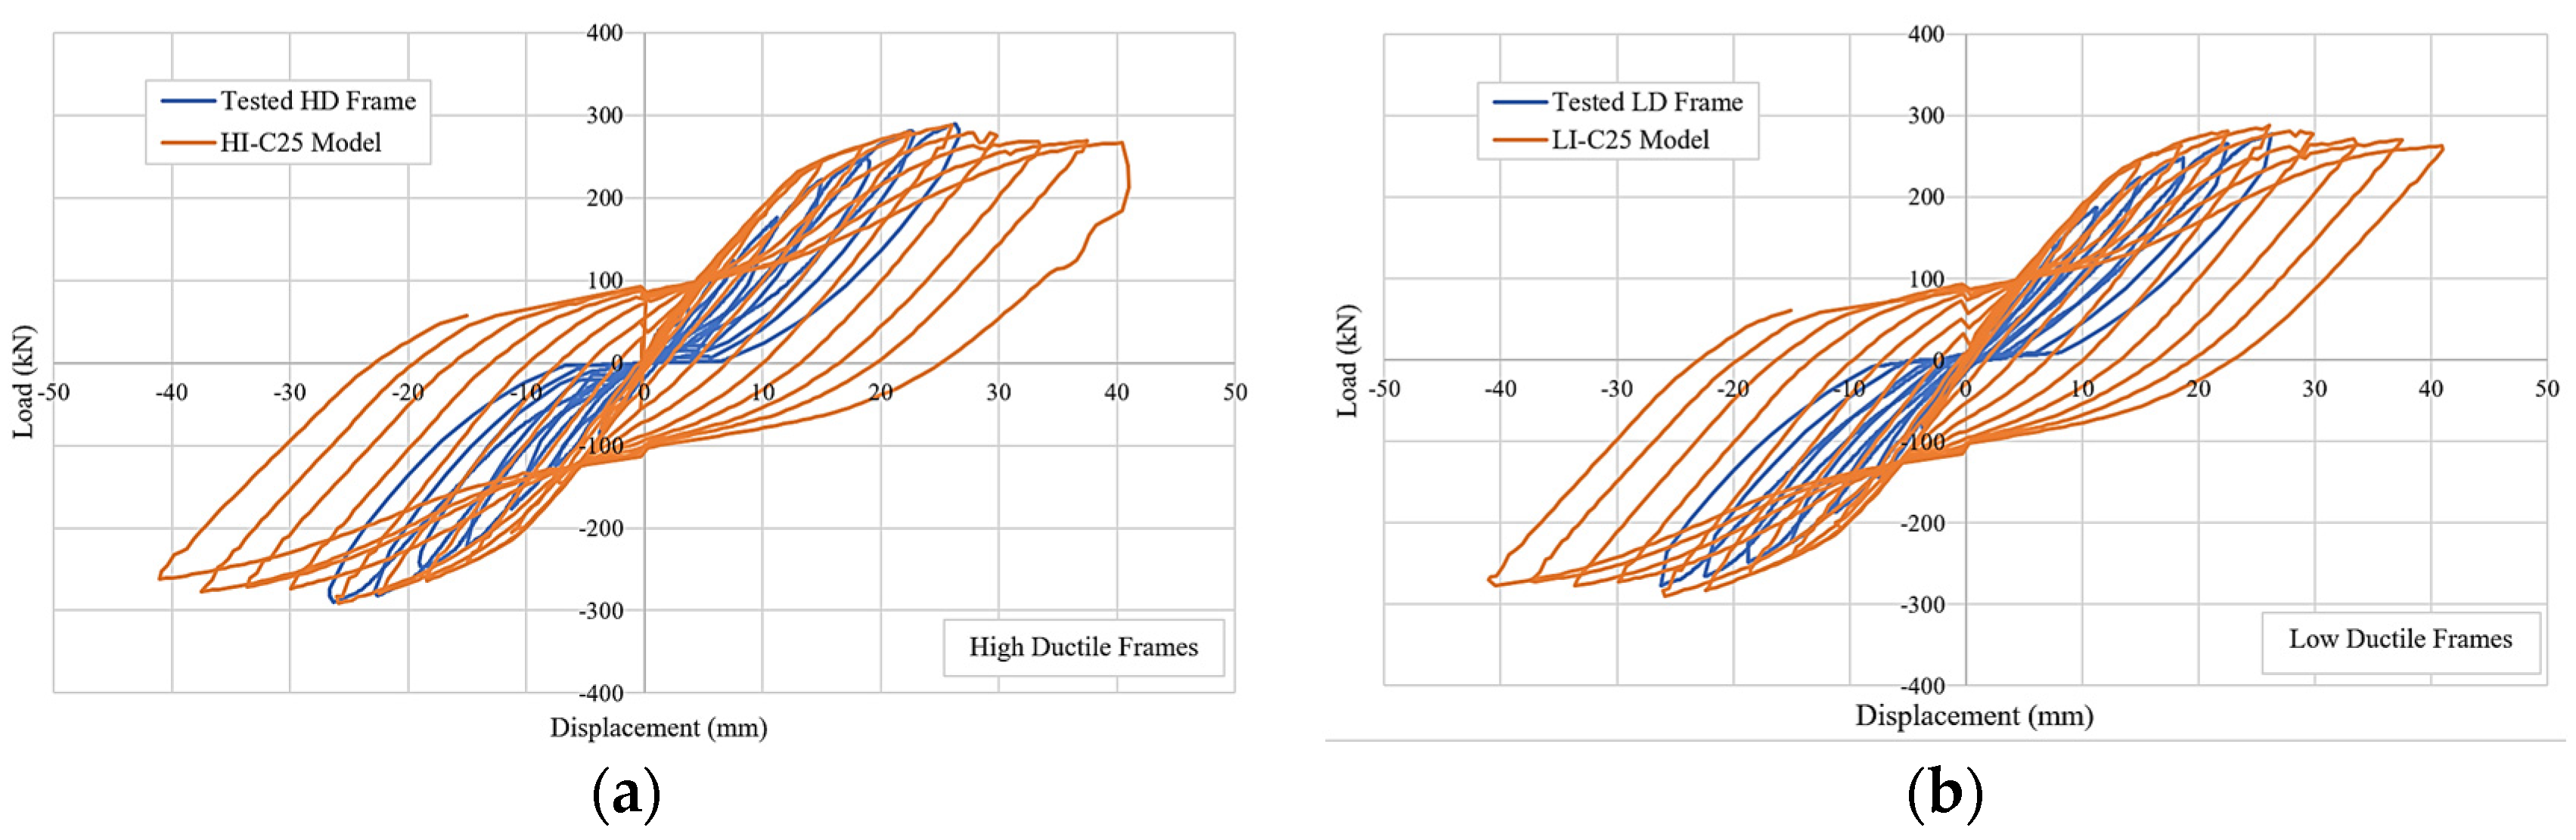
Hysteresis loops illustrate the change in the lateral load versus displacement relationship. The load versus displacement relationships of the HI-C25 and LI-C25 models were compared to those of the tested frames (Figure 15a,b). The hysteresis curves indicated that there was a very good correlation at the peak loads of each loading cycle between the tested frames and FE models. However, pinching behavior led to some variation in the hysteresis loops, which was one of the phenomena observed during frame testing [24]. Pinching had a severe impact beyond the 0.5% drift ratio, which was the result of the continuous widening and propagation of cracks at the column–beam joints during subsequent pull and push cycles. After each of these cycles, the cracks followed a pattern of widening and tightening, since the frames were eventually brought back to their initial condition at rest (the stage where the applied latter load was zero). It is believed that the continuous widening and closing of the crack cycles caused severe pinching in the tested frames once the cracks were formed at the 0.5% drift ratio. As previously studied, pinching is heavily dependent upon structural system characteristics (such as material and connection types) and the loading protocol (the number of loading cycles, the total test duration, and the sequence of loading cycles) [45]. However, the models in the FE analyses lacked this pinching behavior. This resulted in a noticeable difference in their hysteresis loops, specifically beyond the 0.5% drift ratio.
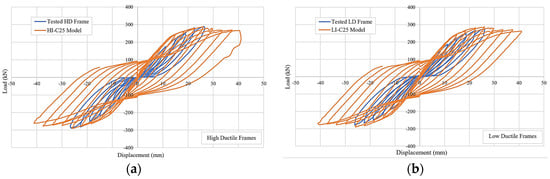
Figure 15.
Load-deflection responses of the tested frames and models: (a) HD frames; (b) LD frames.
The percentage differences for the maximum applied lateral forces of the tested frames and the models are given in Table 6. The results indicate that both the HI-C25 and LI-C25 models had very close force values with small differences. These small differences were attributed to the total duration of the loading scheme, since this duration at the 1.75% drift ratio was 17.5 s in the FE analyses and 4 to 5 h in the experimental phase (refer to Section 2.3 for the reason behind the longer test duration in the experimental phase). Based on the results, it can be stated that the magnitude of the lateral load started to decrease after approaching the maximum lateral load value at the 2% drift ratio. This resulted from the weakness in the joints due to the increased cracks.
Table 6.
Maximum applied lateral forces of tested frames, HI-C25 and LI-C25.
3.3. Energy Dissipation
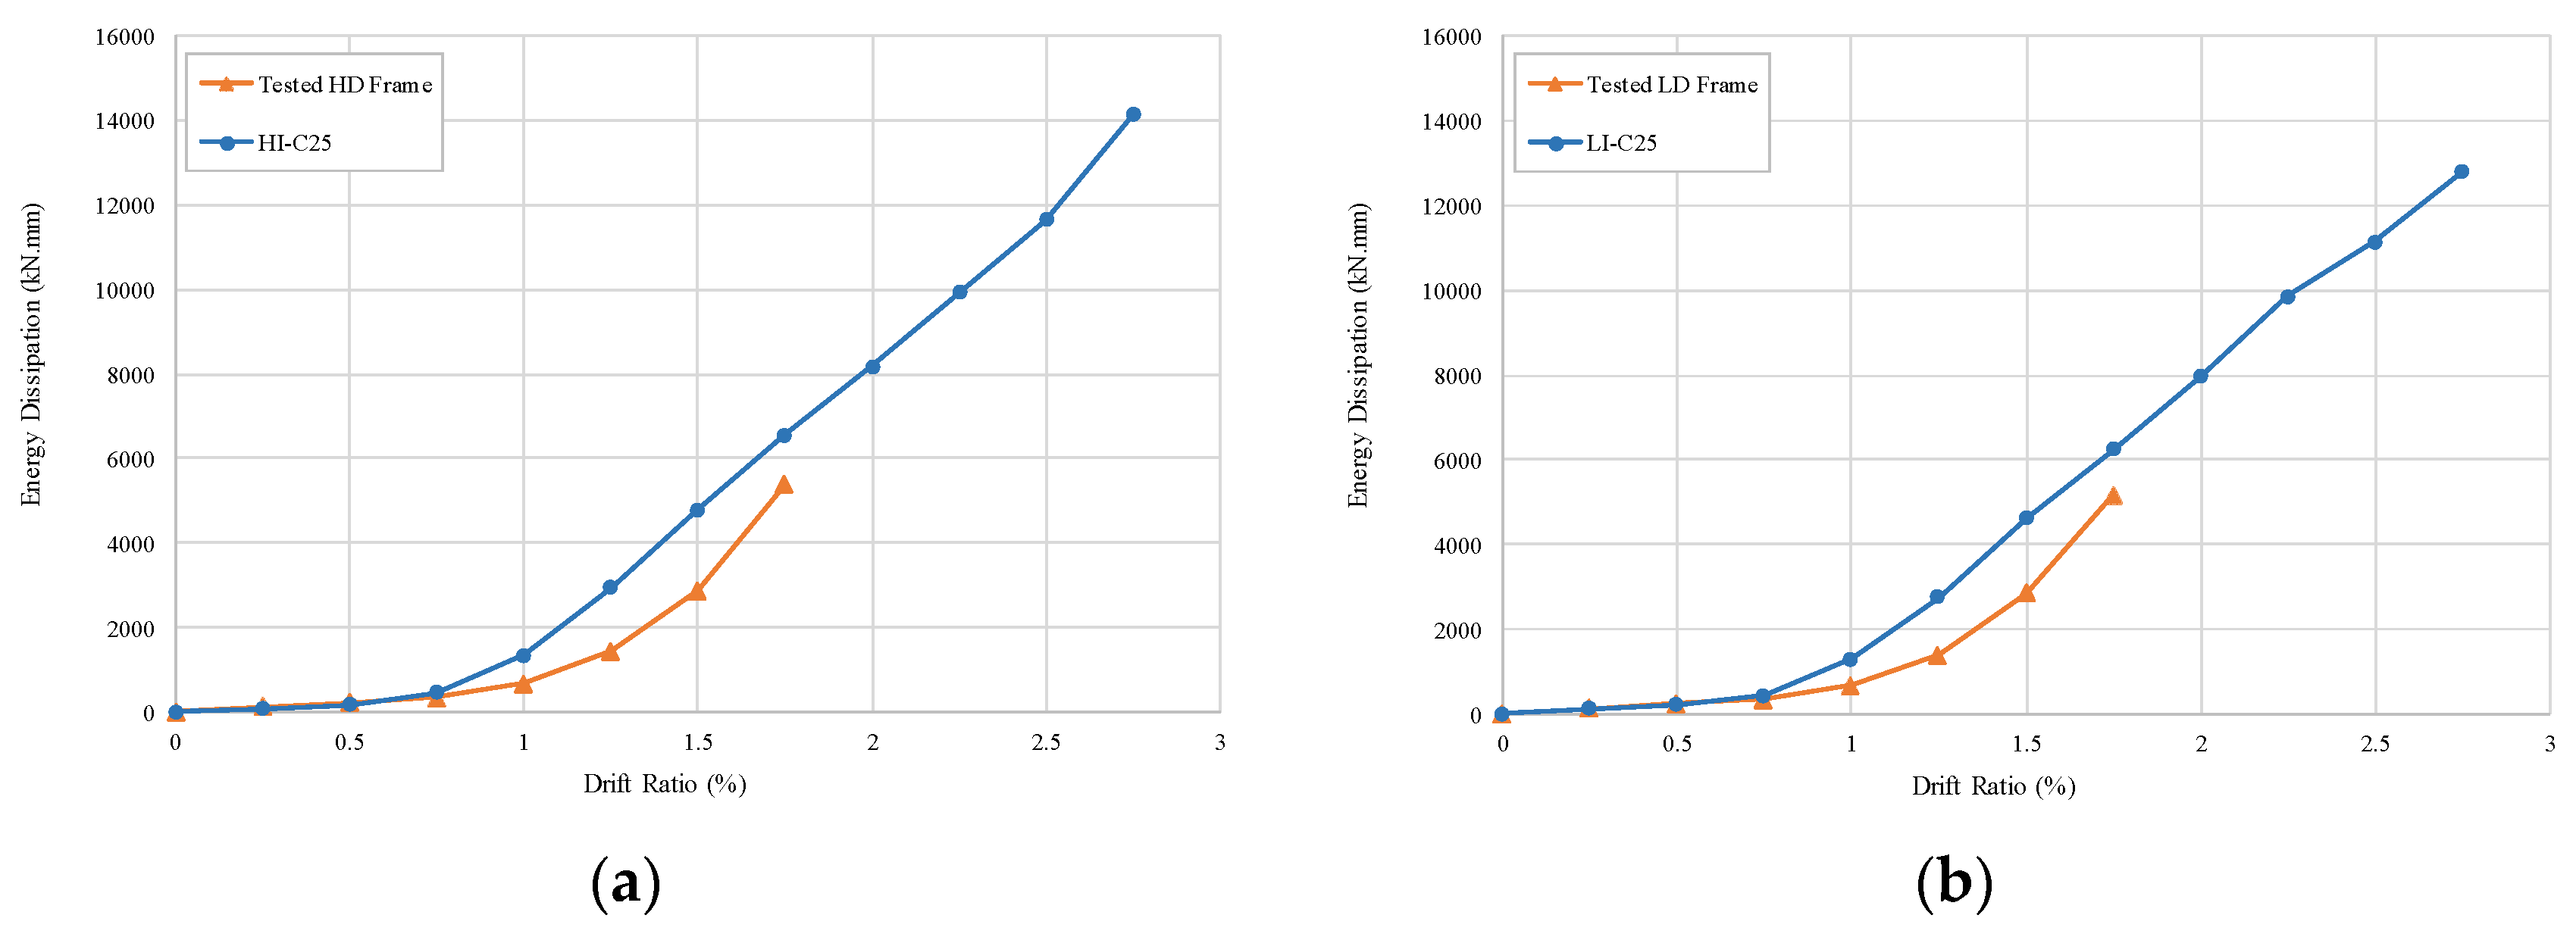
The cumulative energy dissipation graphs are shown in Figure 16. As the drift ratio increased, the energy dissipations of the HI-C25 and LI-C25 models increased. However, the LI-C25 model showed slightly lower energy dissipation characteristics compared to the HI-C25 model beyond the 2.25% drift ratio. A slightly higher energy dissipation capacity was observed in the HI-C25 model, since the columns in the frame had closely-spaced transverse steel reinforcement compared to the LI-C25 model. When the energy dissipations of the FE models were compared to those of the tested frames, the values were consistent with each other until the drift ratio of 1.0%. However, beyond this drift ratio, the gap between the FE and tested models widened due to the higher energy dissipation abilities that the model frames exhibited. This outcome was in line with the observations that were made in reference to the hysteresis loops, as discussed in Section 3.2 (Figure 15).
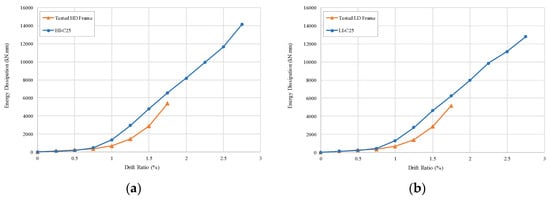
Figure 16.
Energy dissipation of the tested frames and models: (a) HI-C25; (b) LI-C25.
3.4. Stiffness Degradation
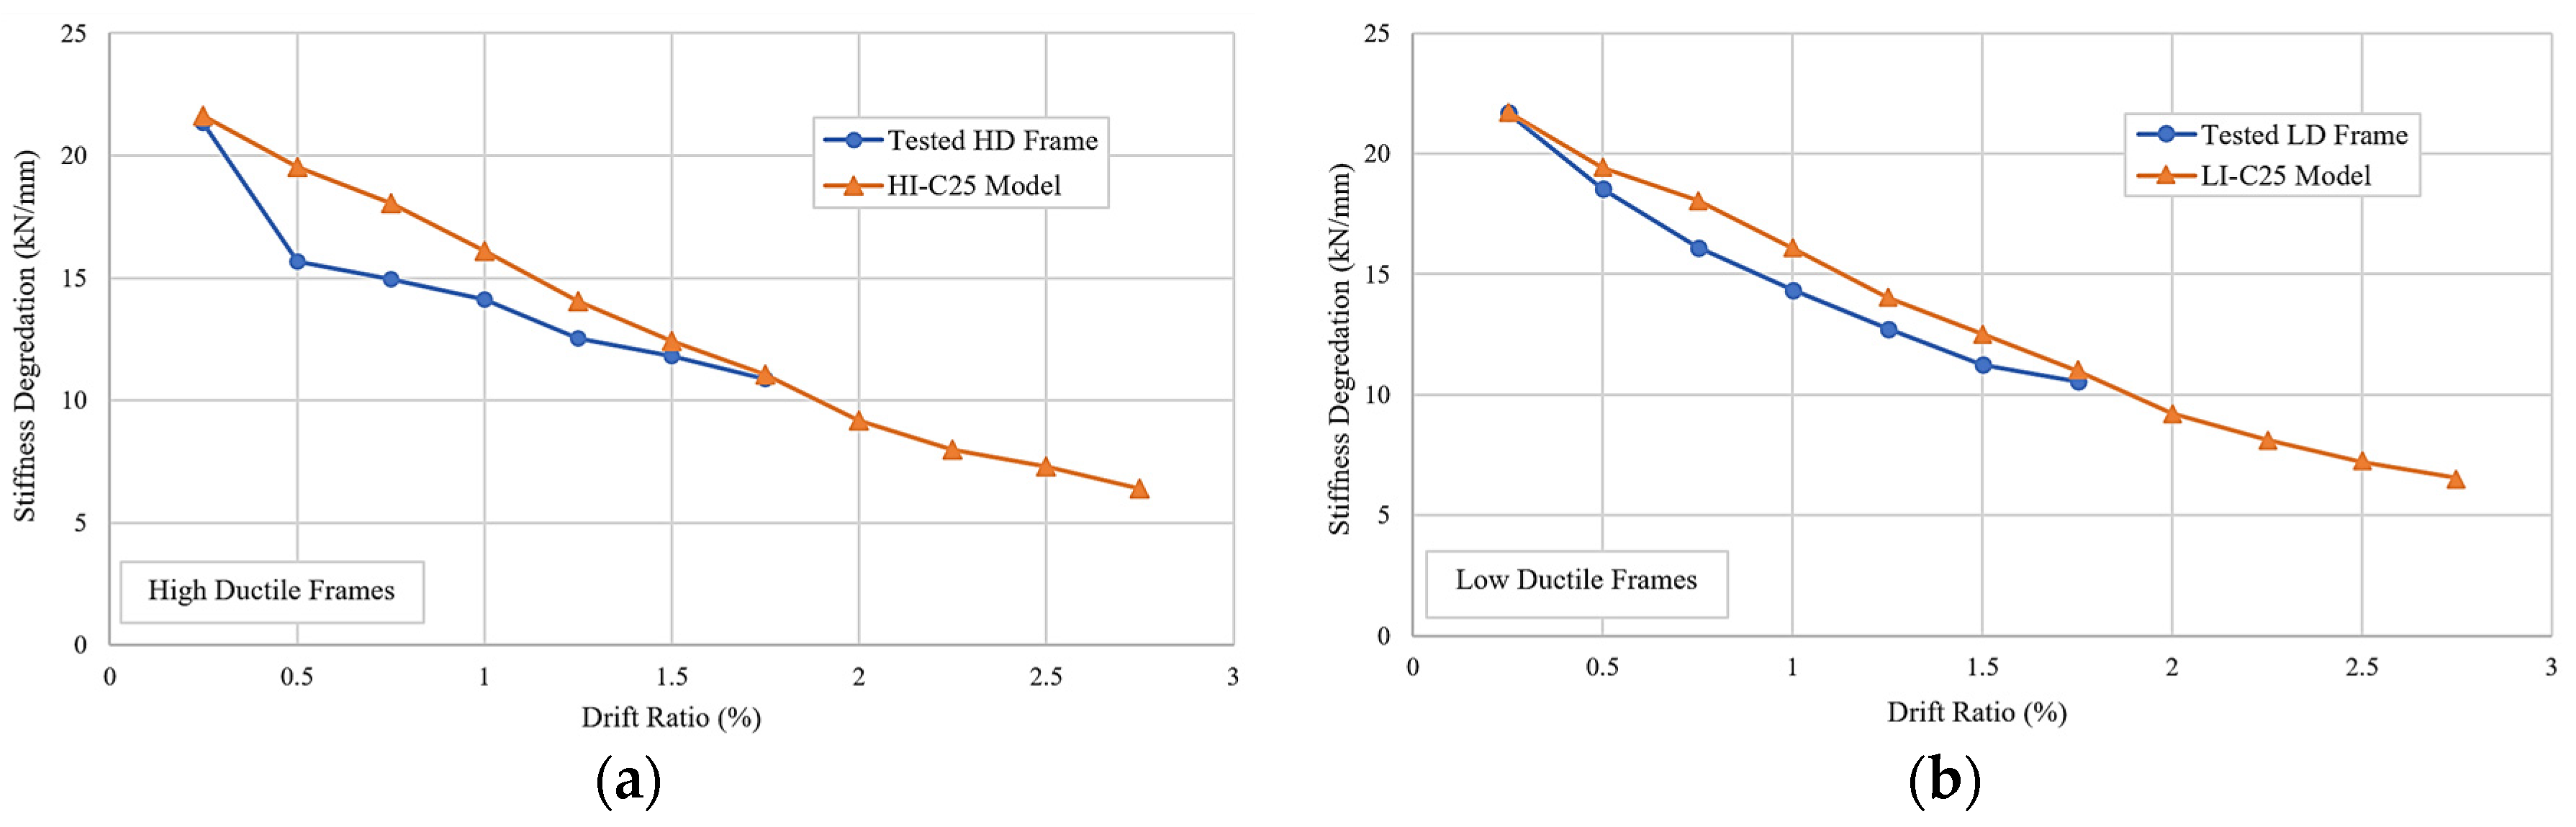
The stiffness degradations of the tested frames and analytical models is shown in Figure 17. The figures indicate that the analytical models exhibited higher stiffness degradation compared to the tested frames, particularly in the case of the HI-C25 model. The difference in the degradation curves of the tested frames and analytical models was much less at the initial drift ratios, specifically in the case of the LI-C25 model. As the drift ratios increased to 0.5% for the HI-C25 model and 0.75% for the LI-C25 model, the difference became more apparent. However, at the 1.75% drift ratio, which was the maximum for the test specimens, these differences became less significant. Both the LI-C25 and HI-C25 models exhibited similar stiffness degradation values throughout the analysis up to the maximum drift ratio of 2.75%.
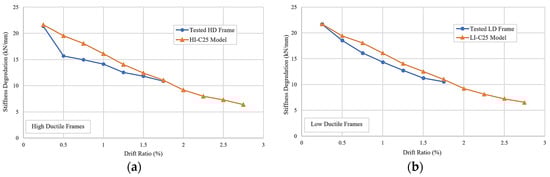
Figure 17.
Stiffness degradations of the tested frames and models: (a) HD frames; (b) LD frames.
4. Prediction of Frame Behaviors with Various Parameters
After the results of the first two models were validated, the remaining 10 models were used to predict the behavior of frames with varying concrete strengths, reinforcement configurations, and structural steel sections under vertical and lateral loads.
4.1. Cracks and Failure Patterns
Concrete cracks in all 12 models were initially observed at the lower and upper corners of the beam–column joints, starting at the 0.25% drift ratio. In general, the HD frame models exhibited more cracks than the LD frame models. The cracks and failure patterns of the 10 models are shown in Figure 18a–j. The crack patterns of the frame models with (HI-C25 and LI-C25) and without (H-C25 and L-C25) composite columns were similar to each other, even though the composite columns’ (HI-C25 and LI-C25) lateral load capacities were approximately 40% greater (Figure 12 and Figure 18a,b). As expected, at failure, the models with non-composite columns suffered more concrete spalling (or element erosion) at the lower corner of the column–beam joint.
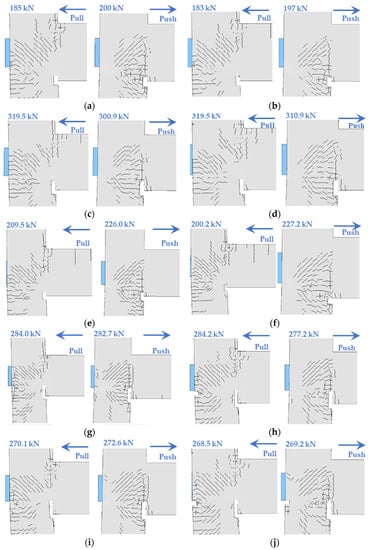
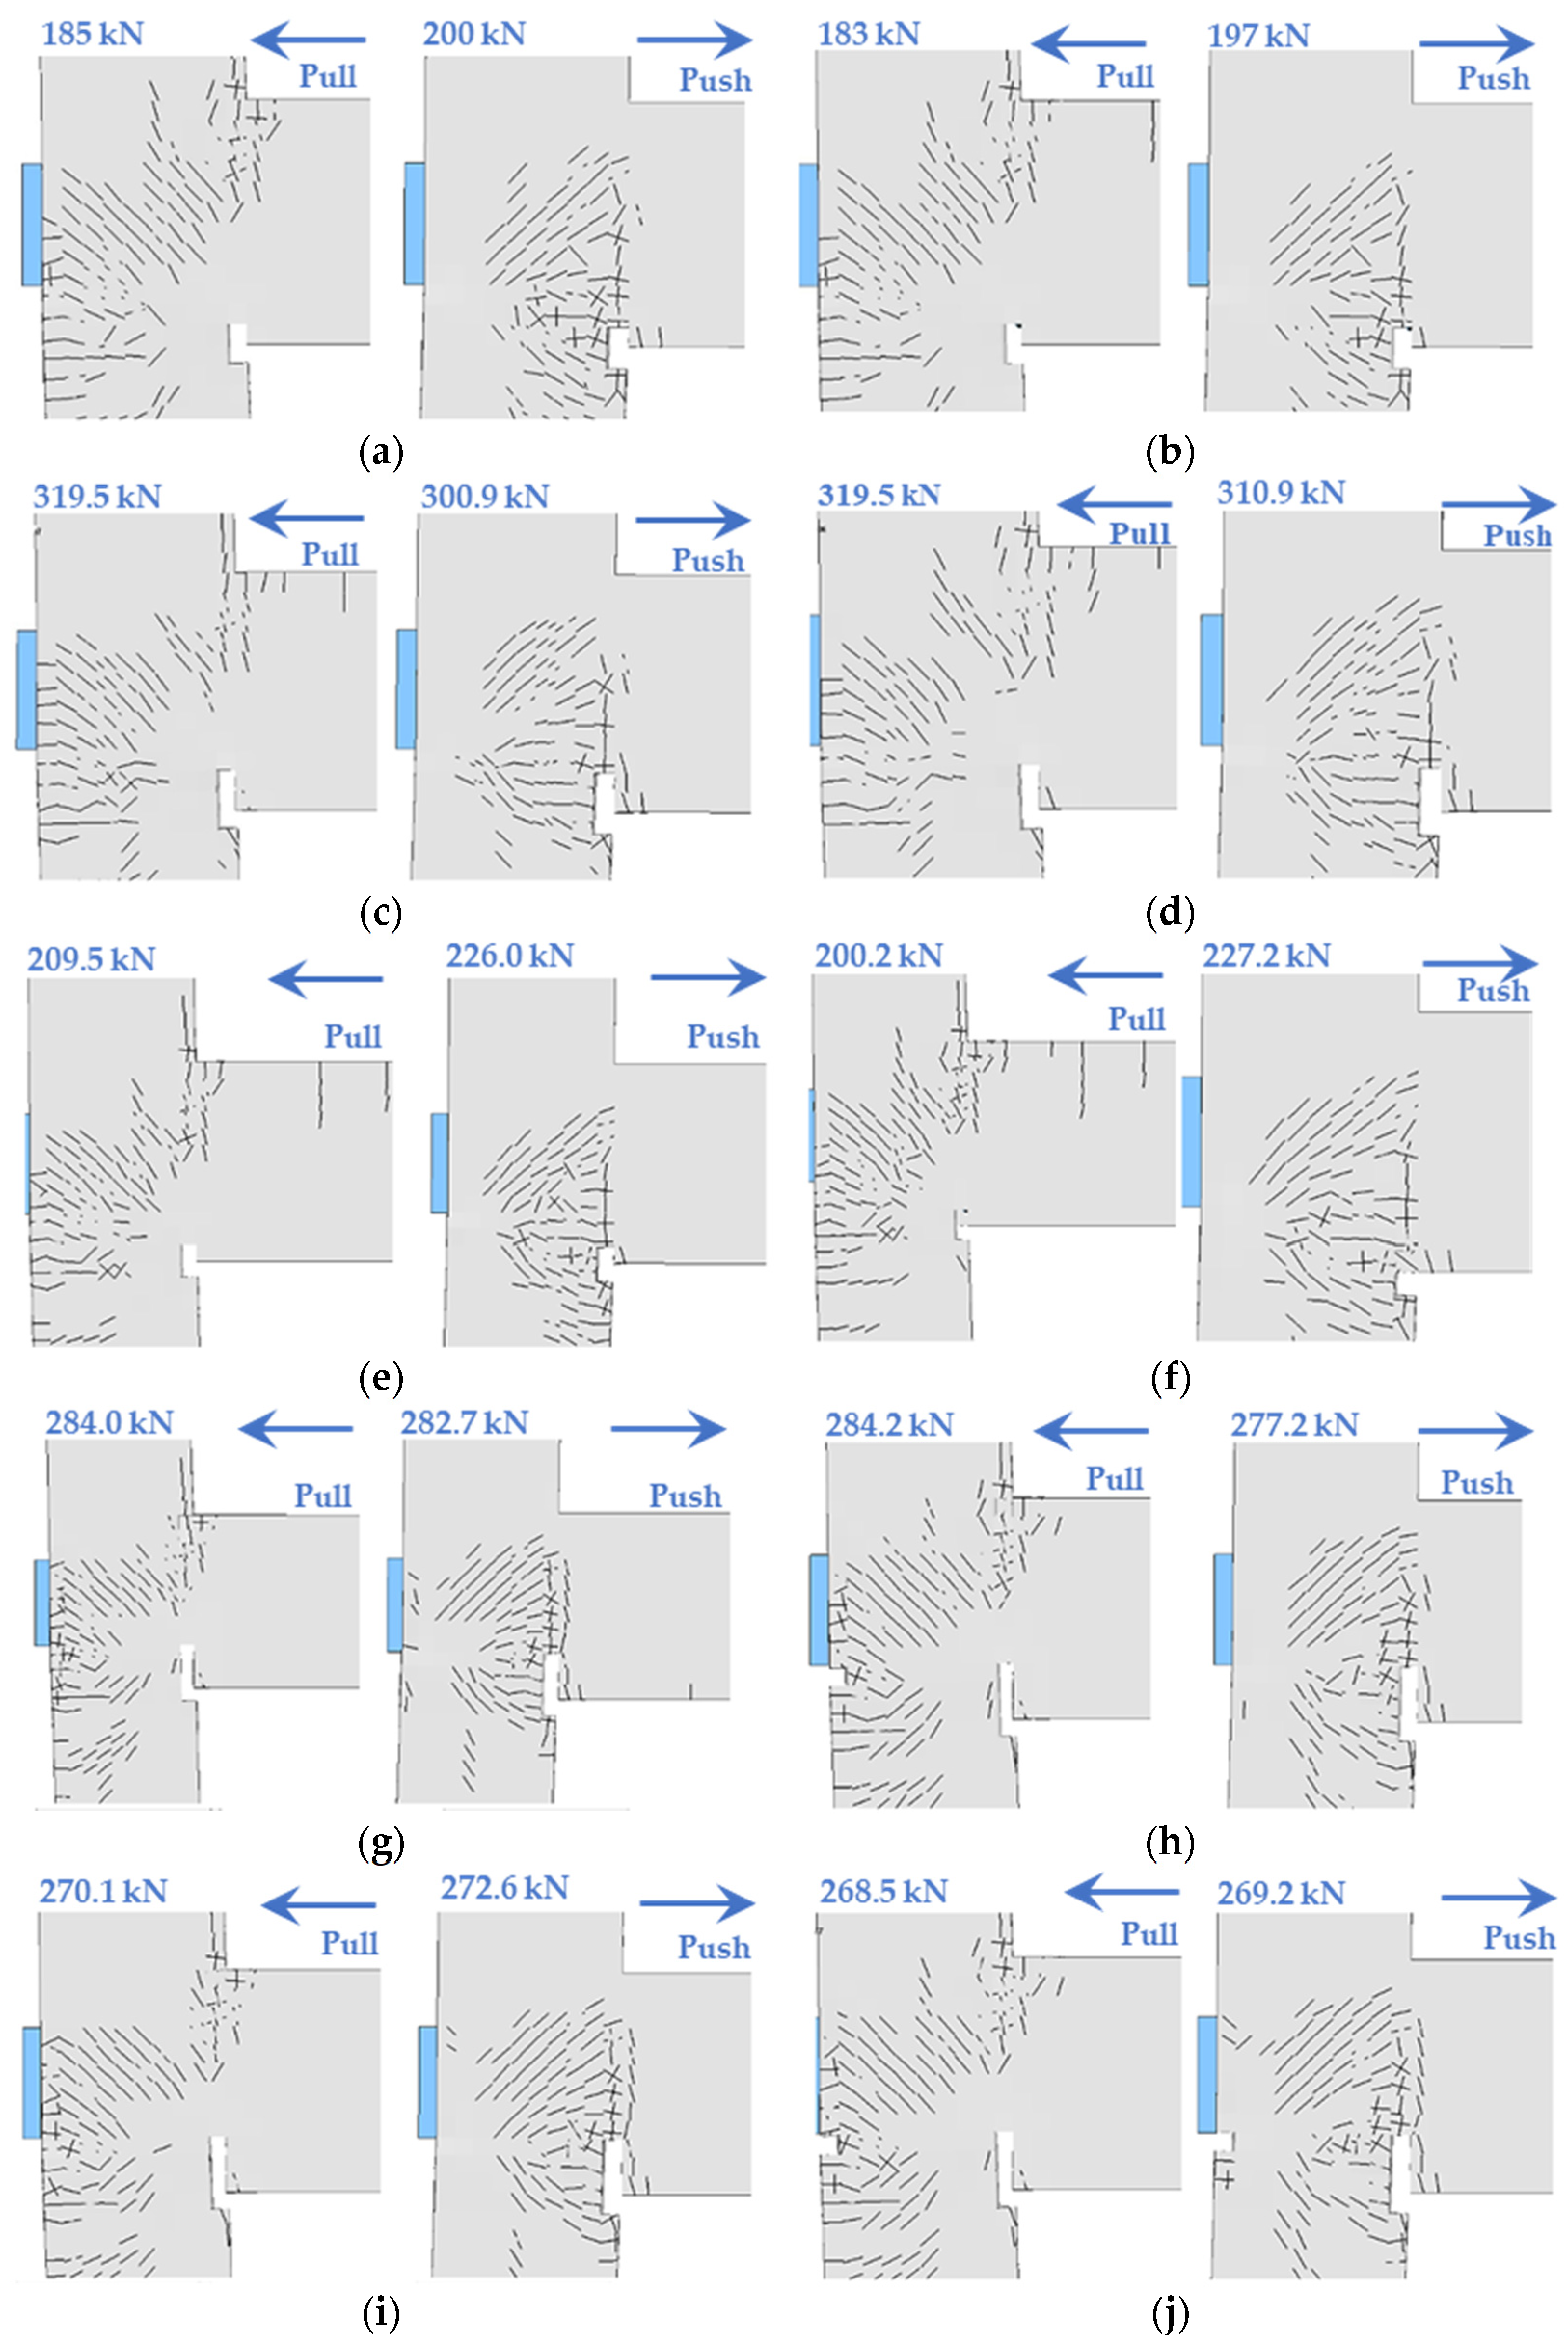
Figure 18.
Crack and failure patterns of frame models: (a) H-C25; (b) L-C25; (c) HI-C40; (d) LI-C40; (e) H-C40; (f) L-C40; (g) HSQ-C25-T8; (h) LSQ-C25-T8; (i) HSQ-C25-T6; (j) LSQ-C25-T6.
The minimum failure load of the models with non-composite columns and C25 concrete in both their HD and LD frames (H-C25 and L-C25) was approximately 185 kN. The value for the models with non-composite columns and C40 concrete (H-C40 and L-C40) was 200 kN. In other words, by increasing the concrete strength from 25 to 40 MPa, the lateral load carrying capacity of the models with non-composite columns increased by 8%. This increase was approximately 20% when the lateral load capacities of the models with I-shaped composite columns having C25 or C40 were compared to each other. This result indicated that the increase in concrete strength is a lot more beneficial if used in composite columns.
The crack patterns of the models with hollow square-shaped structural steel and a thickness of 6 and 8 mm (HSQ-C25-T8, LSQ-C25-T8, HSQ-C25-T6, and LSQ-C25-T6) were also compared to those with I-shaped steel (HI-C25 and LI-C25). The crack patterns were found to be similar to each other, exhibiting no apparent differences. However, the lateral load carrying capacities of these composite columns showed some variance. The average increases in the lateral load carrying capacities of the models with 6 mm and 8 mm thick square-shaped steel composite columns from that of those with I-shaped steel ones were approximately in the range of 2 to 4%, respectively. These results indicated that the use of a square-shaped steel composite column with a greater thickness was not very effective in increasing the lateral load capacity of a frame.
4.2. Envelope Curves
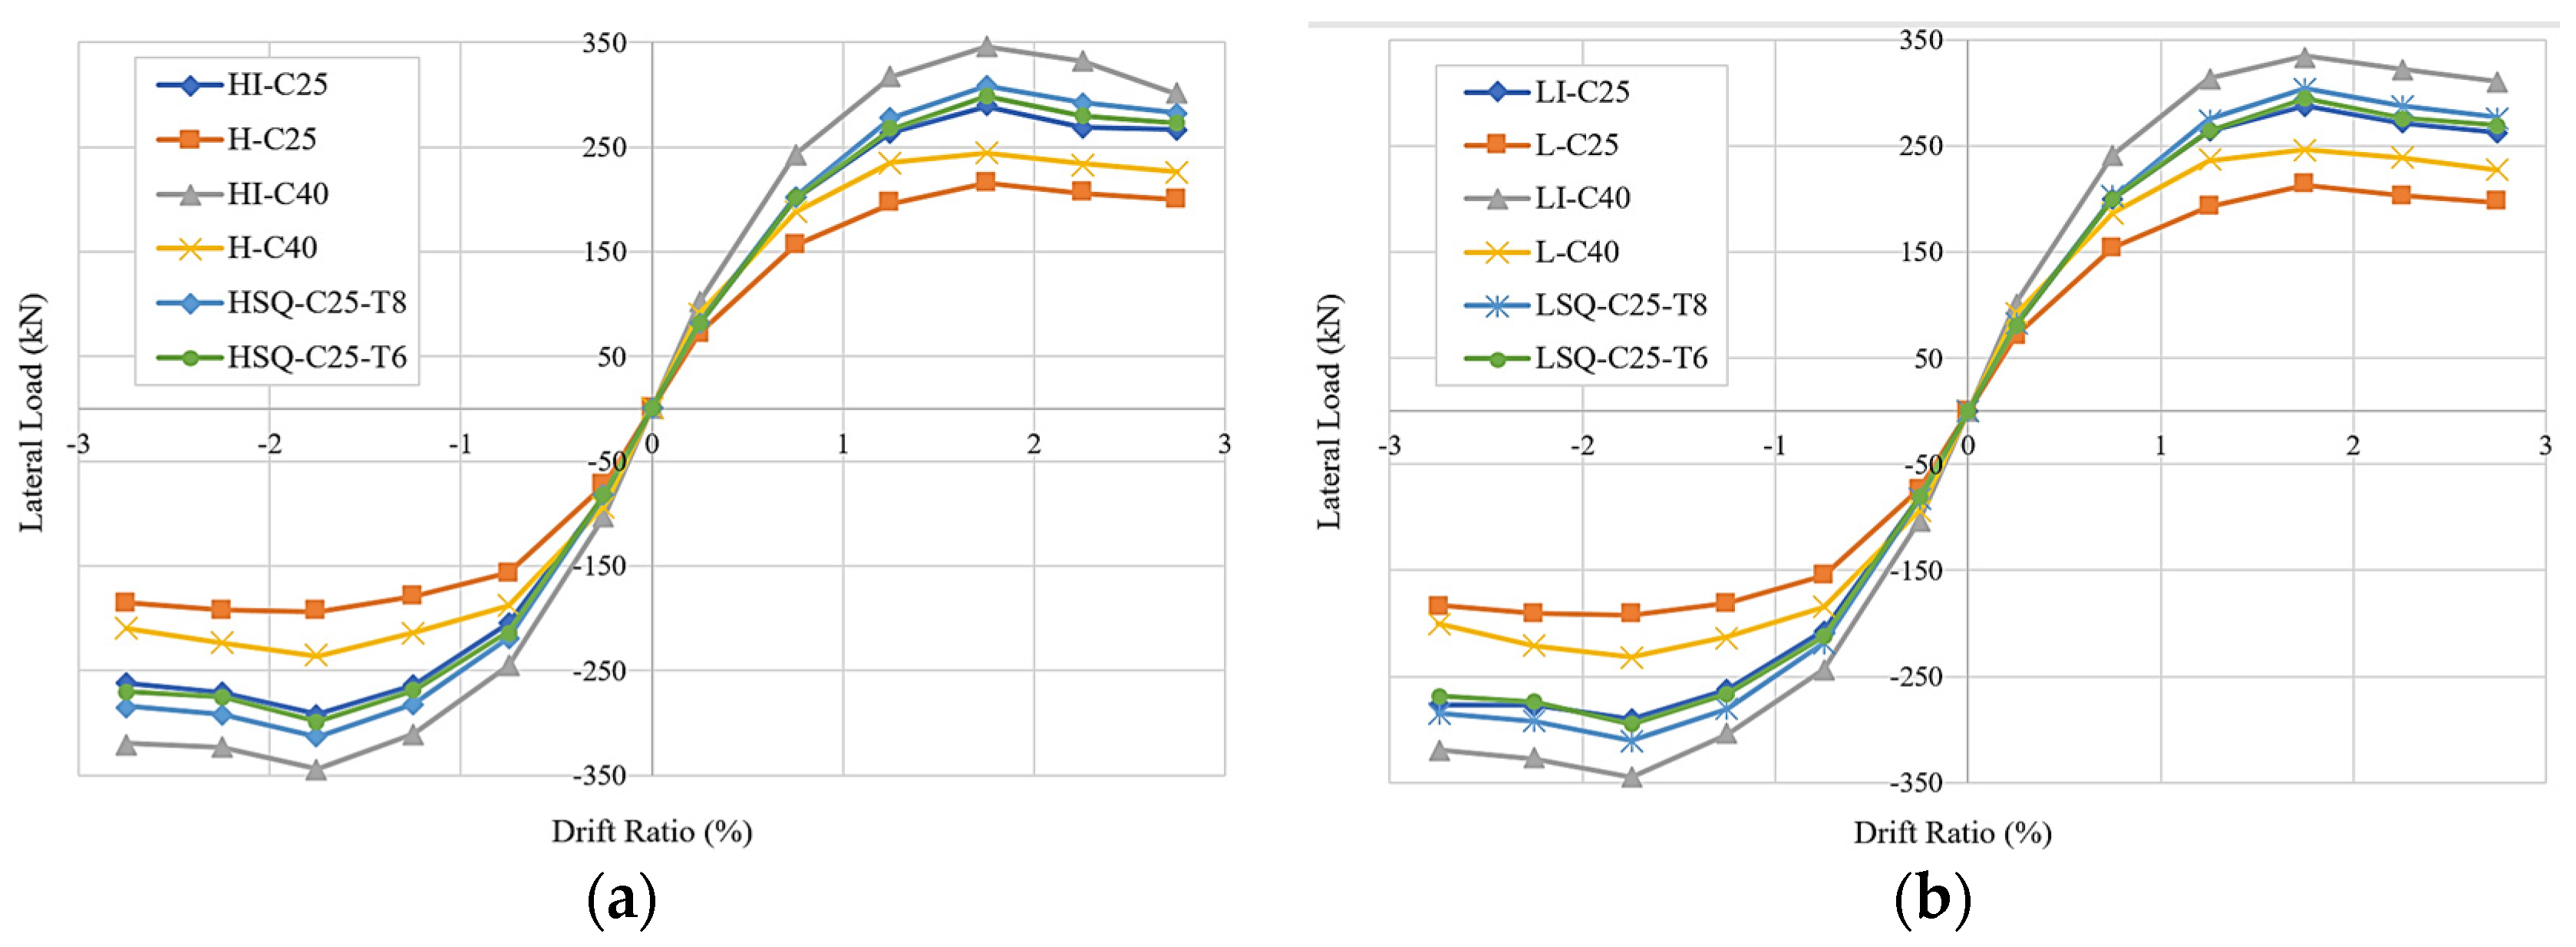
Envelope curves were plotted using the data from the peak load values of the hysteresis curves of the models (see Figure 19 and Table 7). The details of these envelope curves are summarized below:
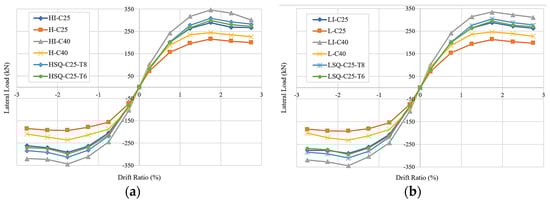
Figure 19.
Envelope curves of frame models: (a) HD; (b) LD.
Table 7.
Lateral load capacities of 12 frame models.
- The models HI-C40 and LI-C40 with C40 concrete showed similar patterns compared to the HI-C25 and LI-C25 models with C25 concrete. The higher strength of concrete resulted in an average increase in their peak load values by 18.9 and 17.5% for the HD and LD models, respectively. These results were very similar to those of non-composite columns with C25 and C40 concrete. The average increase in the peak load values of the HD and LD models was 17.3 and 18%, respectively.
- The existence of a steel section substantially increased the lateral load carrying capacity of the frame models. The lateral load capacities of the HI-C25 and LI-C25 models with composite columns were approximately 41.5 and 42.0% greater than those of the H-C25 and L-C25 models with non-composite columns, respectively. In the frame models with C40 concrete, the lateral load capacities of the HI-C40 and LI-C40 models increased by approximately 43.5 and 42.0% compared to models with non-composite columns.
- When compared to LD frame models, HD models showed a slight increase in their ultimate lateral load carrying capacities due to the existence of closely spaced transverse reinforcements. This increase was in the range of 0.1 to 1.75% compared to the LD models.
- Hollow square-shaped structural steel section models with 6 and 8 mm thicknesses resulted in increases in lateral load carrying capacity of 3.5 and 7.0%, on average, compared to models with an I-shaped steel section.
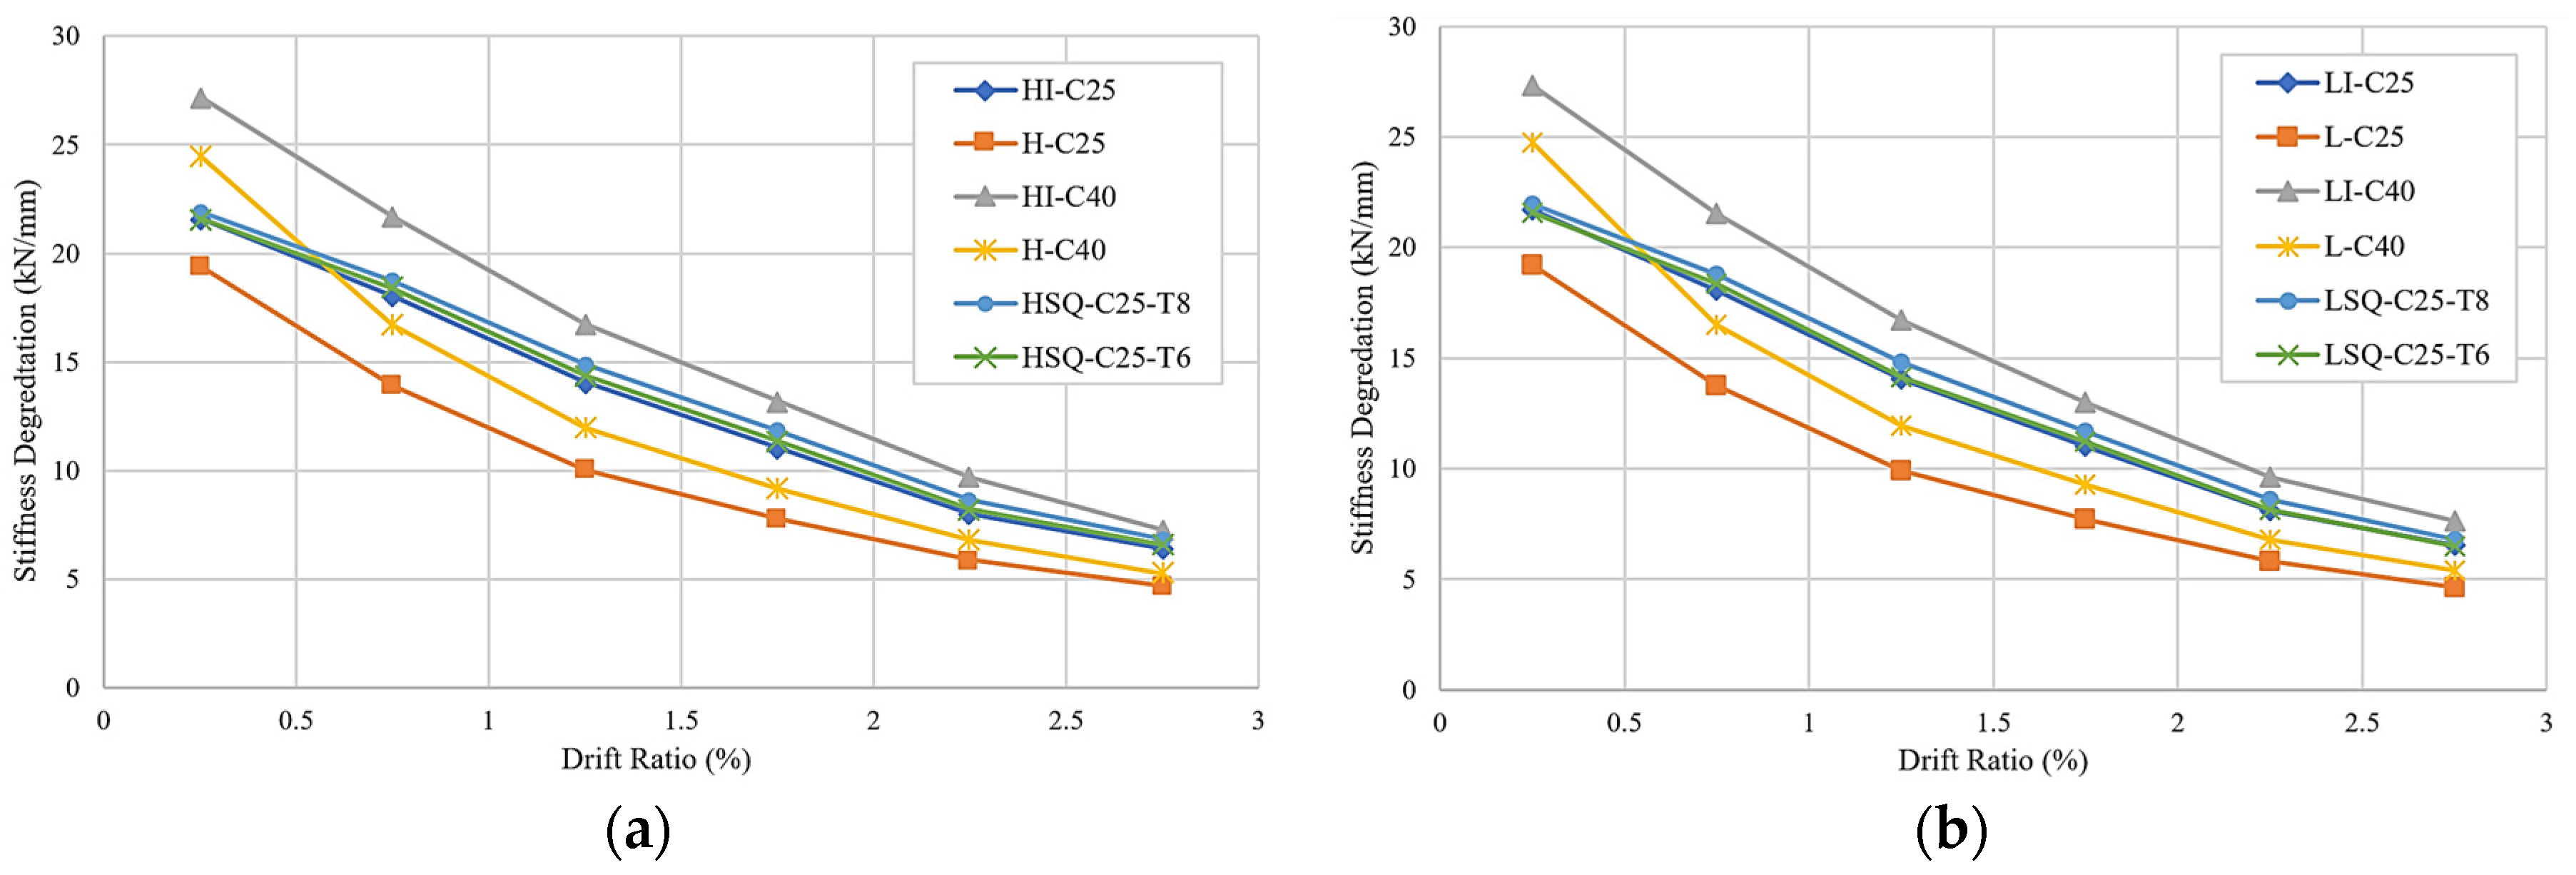
4.3. Stiffness Degradation
Compared to C25, the concrete class of C40 provided a higher stiffness degradation value at the initial drift ratio of 0.25% (Figure 20). However, as the drift ratio increased to 2.75%, the separation in the stiffness degradation curves of these two materials for both the HD and LD frame models became less noticeable. Out of all the models, the HI-C40 and LI-C40 models provided the greatest stiffness. The models with square-shaped structural steel columns exhibited very similar stiffness degradation patterns to those with I-shaped steel ones.
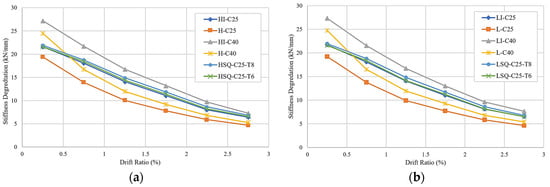
Figure 20.
Stiffness degradation curves of frame models: (a) HD; (b) LD.
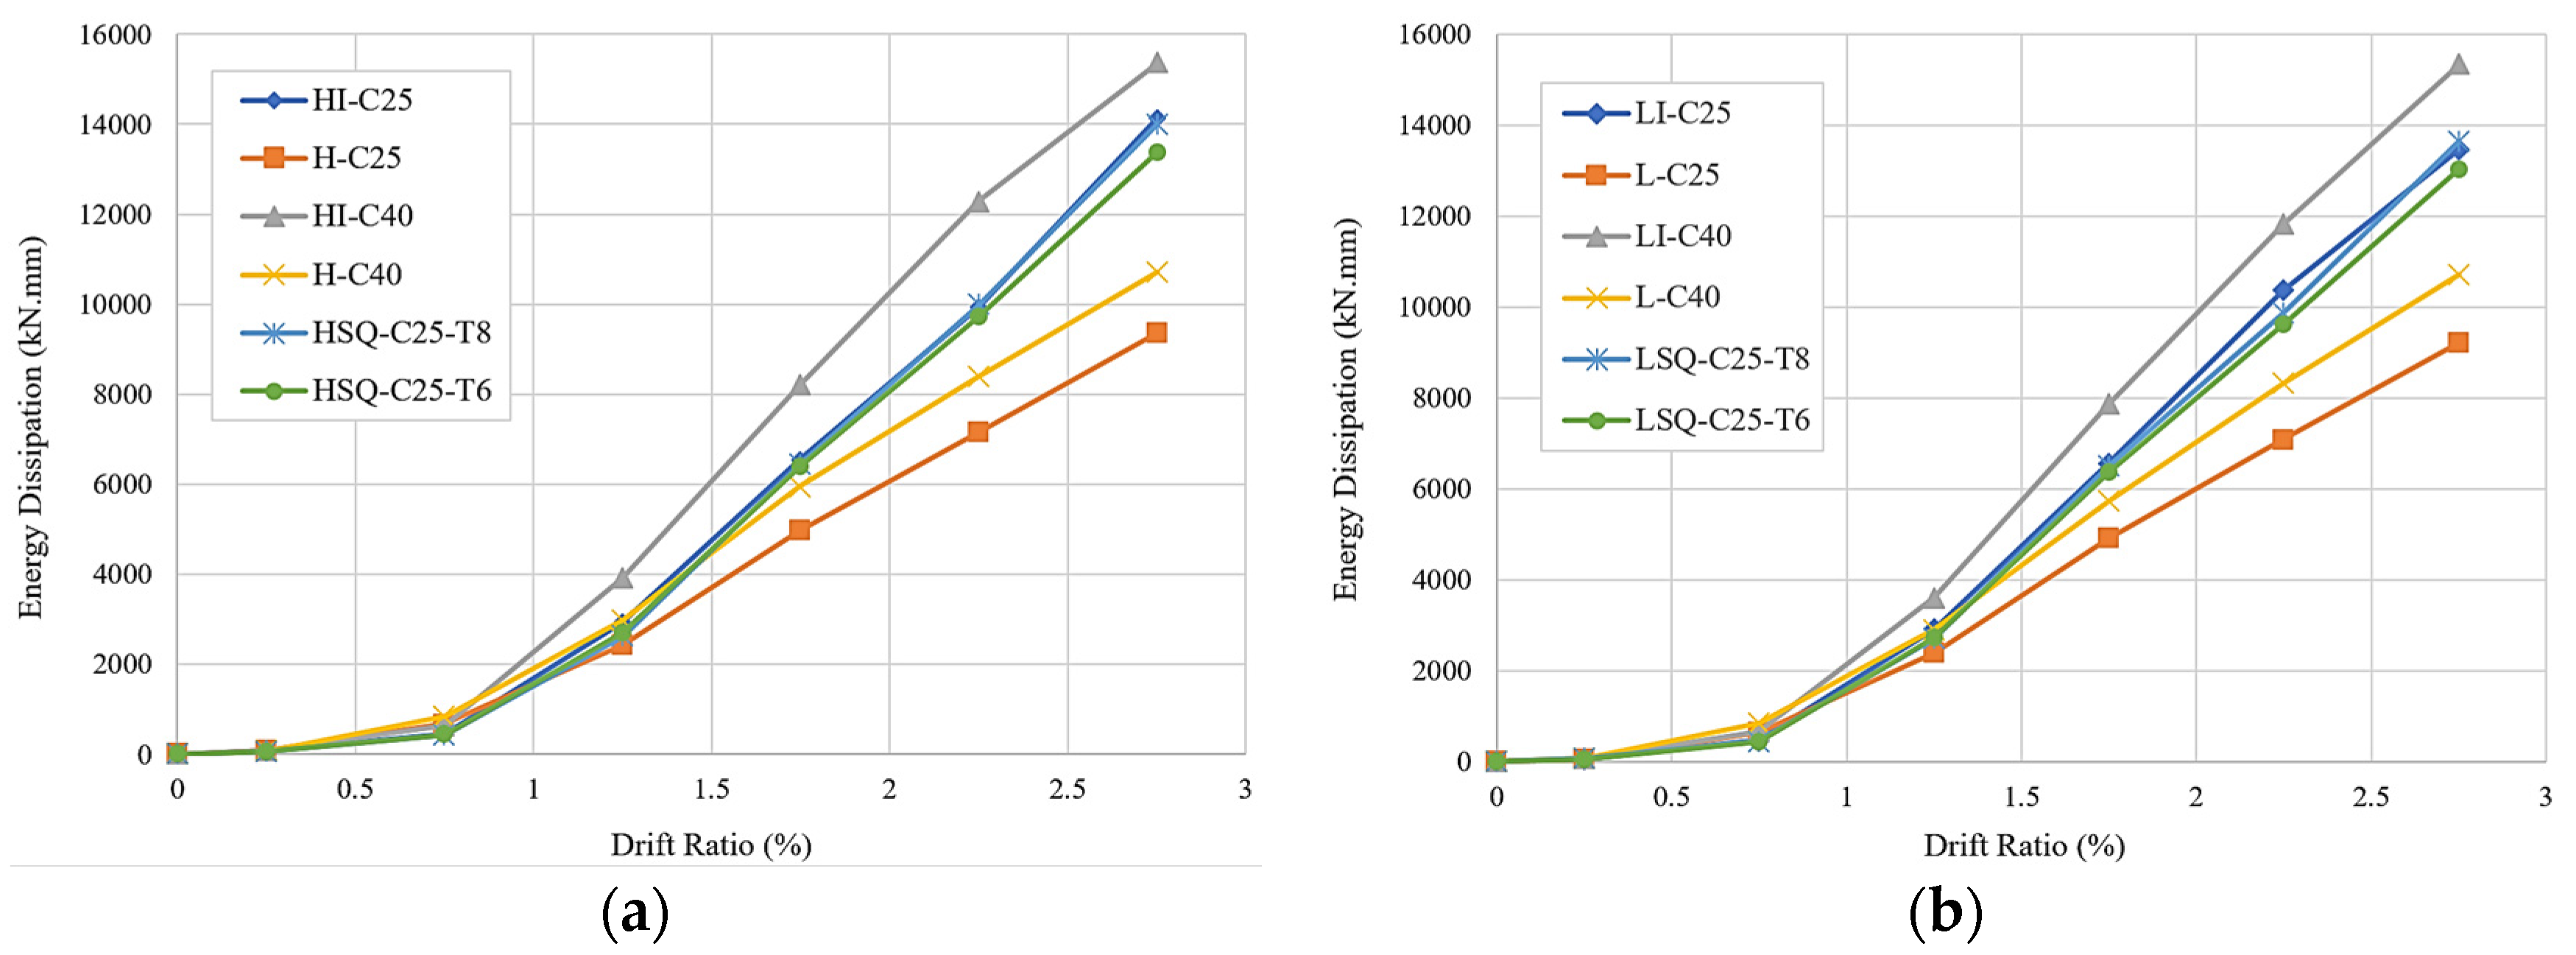
4.4. Energy Dissipation
The frame models showed similar energy dissipation patterns at initial drift ratios up to 0.75%. Beyond this drift ratio, the HI-C40 and LI-C40 models displayed higher energy dissipation abilities when compared to the others (Figure 21). The lowest energy dissipation abilities were observed in the H-C25 and L-C25 models with non-composite columns. The results indicated that the presence of structural steel section in a column, regardless of its shape, had a positive impact on the energy dissipation characteristics of a frame.
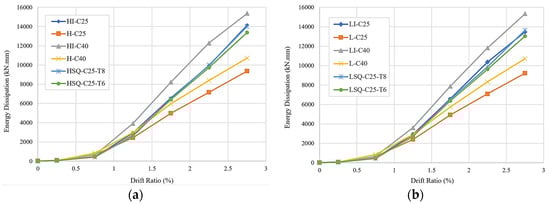
Figure 21.
Energy dissipation curves of frame models: (a) HD; (b) LD.
5. Conclusions and Recommendations
This research mainly focuses on the seismic behavior and vulnerability of composite column-to-beam joints in a frame member by subjecting them to both shear and axial forces. It also investigates the modeling difficulties experienced in LS-DYNA while conducting quasi-static loading, extracting failure patterns, and utilizing the most related keywords for constructing finite element (FE) models to generate more realistic and accurate results. The results of the analytical studies were evaluated and the following conclusions and recommendations can be drawn based on the findings of this study.
- The analytical results were quite consistent with the test results when characteristic parameters, such as the peak loads at each cycle, crack patterns, failure modes, and stiffness degradation, were compared. However, as discussed in Section 2.3, the loading schemes that was used in the FE analyses and testing had minor differences, which is believed to have lead to some negligible discrepancies between the FE and test results. Nevertheless, the most apparent difference was observed in the hysteresis loop cycles. The loop cycle areas of the models were greater than those obtained from the tested frames. As discussed in Section 3.2, the pinching behavior that was experienced during the tests was the cause of these discrepancies.
- The concrete surface cracks of the high ductile (HD) and low ductile (LD) frame models exhibited very similar patterns. The HD and LD frame models with composite columns failed at a drift ratio of 2% due to the element erosion at the lower corner of the beam–column joint.
- Compared to the models with I-shaped steel sections, the high and low ductile models with hollow square-shaped structural steel with C25 concrete (the HSQ-C25 and LSQ-C25 models) and 6 and 8 mm thicknesses experienced more concrete element erosion and failure at the lower corner of the column–beam joint. Similar types of failures were also observed for the models with composite columns and C40 concrete. The frame models with composite columns had no failure near the column base due to the additional stiffness that was provided by the structural steel.
- Compared to the frames with non-composite columns, the lateral load capacity of the frame with composite columns increased by an average of 42%. When the concrete class was increased from C25 to C40, the lateral load capacity of the frame increased by an average of 18%.
- Using a square-shaped steel section in a column instead of an I-shaped one increased the models’ lateral load carrying capacity by 3.5% for the square-shaped steel with a 6 mm thickness and 7% in case of an 8 mm thickness. The increase in the ultimate load carrying capacity of the HD frame models compared to the LD frame models with square-shaped steel and 6 and 8 mm wall thicknesses was in the range of 0.1% to 1.75%. These small increments indicated that thicker square shaped steel was not effective in increasing the lateral load capacity of a frame.
- The stiffness degradation of the high and low ductile models with composite columns and an I-shaped steel section of HEB 100 with C40 concrete (HI-C40 and LI-C40 models) displayed the best structural performance out of all other models, while the models with non-composite columns exhibited a less desirable structural performance. The existence of a steel section in a column had the highest impact on a model’s stiffness degradation. Increasing the concrete class had the second largest impact.
- Greater energy dissipation was observed in the HI-C40 and LI-C40 models with composite columns. The energy dissipation capacities of the same models with non-composite columns were fairly close to those with the composite columns, until the drift ratio of 1.75%. The difference in the energy dissipation became more apparent beyond this drift ratio, reaching a maximum of 30% at the final drift ratio of 2.75%.
- There was a distinct difference between the hysteresis of the tested frames and the FE models. This difference was attributed to pinching behavior observed in the tested frames beyond the 0.5% drift ratio due to the continuous widening and propagation of cracks at their column–beam joints during subsequent pull and push cycles. Following the closure of these cracks, the frames were brought back to their initial conditions at rest. However, the models in the FE analyses lacked this pinching behavior. Therefore, their hysteresis loops exhibited a somewhat different pattern specifically beyond the 0.5% drift ratio.
- The results of the analyses indicate that frame failure was triggered by cracks in the lower corner of the column–beam joint. During the subsequent pull and push cycles, these cracks widened and eventually resulted in a failure in the concrete member at the lower corner of the column–beam joint. This eventually led to the failure of the frame.
- The lateral load carrying capacities of the models with square-shaped steel sections were slightly better than the models with I-shaped sections.
- Using a higher transverse steel reinforcement ratio near the column–beam joints resulted in a very slight increase in ductility and bearing capacities.
- Frame models with non-composite columns were the only ones that exhibited concrete element erosion near the base, leading to failure coupled with member erosion at the column-beam joint.
- Using structural steel while constructing a composite column is recommended since it is an effective way to achieve a higher capacity in a column–beam joint.
- Based on the analytical results, it was determined that the shape of a steel section did not have a significant impact on the lateral load carrying capacity of a frame, as long as equal cross-sectional areas were used.
- Increasing the concrete class alone did not have a significant impact on the lateral load carrying capacity of a frame. Therefore, in order to increase the lateral load capacity of a frame, it is highly recommended to construct them with composite columns.
- Since frame failure was triggered by the cracks occurring in the lower corner of the column–beam joint, it is important to pay close attention to the reinforcement details at this location. It is recommended to strengthen this lower corner joint if the lateral load capacity of the frame must be increased.
- In this study, some challenges were encountered during the FE analyses of the frames. These challenges can be grouped into two categories: (a) duration and (b) the inadequate number of studies conducted on this research topic. The total duration of the simulation was the main challenge of this study. The study initially had the goal of examining the impact of many more cyclic loads on frame behavior, the varying of lateral loads acting at different velocities, and the structural behaviors of multiple floors (two or more) constructed with the same frame. However, the challenge with respect to duration prevented attempts to pursue further FE analyses. Another challenge, as indicated in Section 1, was related to the inadequate number of past studies conducted in this field using LS-DYNA. This was clearly one of this study’s goals, since more feedback was needed to efficiently address the issues related to the FE modeling of the frames, as discussed in this article.
Author Contributions
Conceptualization, G.T. and H.C.M.; methodology, G.T. and H.C.M.; software, M.M.O.; validation, M.M.O., G.T. and H.C.M.; investigation, G.T. and H.C.M.; writing—original draft preparation, M.M.O.; writing—review and editing, G.T. and H.C.M. All authors have read and agreed to the published version of the manuscript.
Funding
This research received no external funding.
Institutional Review Board Statement
Not applicable.
Informed Consent Statement
Not applicable.
Data Availability Statement
Not applicable.
Conflicts of Interest
The authors declare no conflict of interest.
References
- Taranath, B.S. Steel, Concrete & Composite Design of Tall Buildings, 2nd ed.; McGraw Hill: New York, NY, USA, 1997. [Google Scholar]
- Kim, J.; LaFave, J.M. Joint Shear Behavior of Reinforced Concrete Beam-Column Connections Subjected to Seismic Lateral Loading; NSEL Report Series; Report No. NSEL-020; Department of Civil and Environmental Engineering, University of Illinois at Urbana-Champaign: Urbana, IL, USA, 2009. [Google Scholar]
- Najafgholipour, M.A.; Dehghan, S.M.; Dooshabi, A.; Niroomandi, A. Finite element analysis of reinforced concrete beam-column connections with governing joint shear failure mode. Lat. Am. J. Solids Struct. 2017, 14, 1200–1225. [Google Scholar] [CrossRef] [Green Version]
- Mirza, S.; Lacroix, E. Comparative strength analyses of concrete-encased steel composite columns. J. Struct. Eng. 2004, 130, 1941–1953. [Google Scholar] [CrossRef]
- Chen, C.; Wang, C.; Sun, H. Experimental study on seismic behavior of full-encased steel-concrete composite columns. J. Struct. Eng. 2014, 140, 04014024. [Google Scholar] [CrossRef]
- Campian, C.; Nagy, Z.; Pop, M. Behavior of fully encased steel-concrete composite columns subjected to monotonic and cyclic loading. Procedia Eng. 2015, 117, 444–456. [Google Scholar] [CrossRef]
- Chen, C.C.; Chen, C.C.; Hoang, T.T. Role of concrete confinement of wide-flange structural steel shape in steel reinforced concrete columns under cyclic loading. Eng. Struct. 2016, 110, 79–87. [Google Scholar] [CrossRef]
- Zhu, W.; Jia, J.; Gao, J.; Zhang, F. Experimental study on steel reinforced high-strength concrete columns under cyclic lateral force and constant axial load. Eng. Struct. 2016, 125, 191–204. [Google Scholar] [CrossRef]
- Lacki, P.; Derlatka, A.; Kasza, P. Comparison of steel-concrete composite column and steel column. Compos. Struct. 2018, 202, 82–88. [Google Scholar] [CrossRef]
- Zhao, X.; Wen, F.; Chen, Y.; Hu, J.; Yang, X.; Dai, L.; Cao, S. Experimental study on the static performance of steel reinforced concrete columns with high encased steel ratios. Struct. Des. Tall Spec. Build. 2018, 27, e1536. [Google Scholar] [CrossRef]
- Anuntasena, W.; Lenwari, A.; Thepchatri, T. Finite element modelling of concrete—Encased steel columns subjected to eccentric loadings. Eng. J. 2019, 23, 299–310. [Google Scholar] [CrossRef]
- Lai, B.; Richard Liew, J.Y.; Hoang, A.N.; Xiong, M. Experimental study on high strength concrete encased steel composite short columns. Eng. Struct. 2019, 201, 109841. [Google Scholar] [CrossRef]
- Lai, B.; Richard Liew, J.Y.; Venkateshwaran, A.; Li, S.; Xiong, M.J. Assessment of high-strength concrete encased steel composite columns subject to axial compression. J. Constr. Steel Res. 2020, 164, 105765. [Google Scholar] [CrossRef]
- Gautham, A.; Sahoo, D.R. Behavior of steel-reinforced composite concrete columns under combined axial and lateral cyclic loading. J. Build. Eng. 2021, 39, 102305. [Google Scholar] [CrossRef]
- Zhu, J.N.; Yang, K.J.; Li, X.W.; Li, R.W. Finite element analysis on crack resistance behavior of the abnormal joint of SRC column and RC Beam. Appl. Mech. Mater. 2013, 351–352, 61–66. [Google Scholar] [CrossRef]
- Kong, J.; Zou, Y.; Li, C.; Wan, Z.W. Nonlinear numerical analysis of SRC frame end joint. Adv. Mater. Res. 2013, 753–755, 1151–1155. [Google Scholar] [CrossRef]
- Pan, P.; Lam, A.; Lin, X.; Li, Y.; Ye, L. Cyclic loading tests and finite element analyses on performance of ring beam connections. Eng. Struct. 2013, 56, 682–690. [Google Scholar] [CrossRef]
- Wang, Q.; Shi, Q.; Tao, Y. Experimental and numerical studies on the seismic behavior of steel reinforced concrete compression-bending members with new-type section steel. Adv. Struct. Eng. 2016, 19, 255–269. [Google Scholar] [CrossRef]
- Deng, Z.; Xu, C.; Zeng, J.; Wang, H.; Wu, X.; Xiang, P. Seismic performance and shear bearing-capacity of truss SRC beam-column frame joints. Adv. Struct. Eng. 2020, 24, 1311–1325. [Google Scholar] [CrossRef]
- Wu, C.; Yu, S.; Liu, J.; Chen, G. Development and testing of hybrid precast steel-reinforced concrete column-to- H shape steel beam connections under cyclic loading. Eng. Struct. 2020, 211, 110460. [Google Scholar] [CrossRef]
- Peng, S.; Xu, C.; Lu, M.; Yang, J. Experimental research and finite element analysis on seismic behavior of CFRP-strengthened seismic-damaged composite steel-concrete frame columns. Eng. Struct. 2018, 155, 50–60. [Google Scholar] [CrossRef]
- Xu, C.; Peng, S.; Wang, C.; Ma, Z. Influence of the degree of damage and confinement materials on the seismic behavior of RC beam-SRC column composite joints. Compos. Struct. 2020, 231, 111002. [Google Scholar] [CrossRef]
- LS-DYNA Keyword User’s Manual; Livermore Software Technology Corporation: Livermore, CA, USA, 2020; Volumes I–III.
- Tunc, G.; Dakhil, A.; Mertol, H.C. Experimental Analysis of the Behavior of Composite Column-Reinforced Concrete Beam Joints. Arab. J. Sci. Eng. 2021, 46, 10785–10801. [Google Scholar] [CrossRef]
- Degée, H.; Plumier, A.; Mihaylov, B.; Dragan, D.; Bogdan, T.; Popa, N. Smart Composite Components—Concrete Structures Reinforced by Steel Profiles, SmartCoCo; Research Programme of the Research Funds for Coal and Steel, TGS8, RFSR-CT-2012-00031; European Commission: Brussels, Belgium, 2016. [Google Scholar]
- TEC 2018; Turkish Earthquake Code for Buildings. AFAD, Ministry of Interior, Disaster and Emergency Management Presidency: Ankara, Turkey, 2018. (In Turkish)
- TS 500; Requirements for Design and Construction of Reinforced Concrete Structures. Turkish Standards Institution: Ankara, Turkey, 2000. (In Turkish)
- Schwer, L. The Winfrith concrete model: Beauty or beast? Insights into the Winfrith concrete model. In Proceedings of the 8th European LS-DYNA Users Conference, Strasbourg, France, 23–24 May 2011; pp. 23–24. [Google Scholar]
- Syed, M. Flexural Behavior of High-Strength Concrete Slender Walls—Analytical Study. Master’s Thesis, State University of New York at Buffalo, Buffalo, NY, USA, 2019. [Google Scholar]
- Haghi, N.; Epackachi, S.; Kazemi, M.T. Cyclic performance of composite shear walls with boundary elements. Structures 2020, 27, 102–117. [Google Scholar] [CrossRef]
- Asgarpoor, M.; Gharavi, A.; Epackachi, S. Investigation of various concrete materials to simulate seismic response of RC structures. Structures 2021, 29, 1322–1351. [Google Scholar] [CrossRef]
- Epackachi, S.; Whittaker, A.S. Experimental, Numerical, and Analytical Studies on the Seismic Response of Steel-Plate Concrete (SC) Composite Shear Walls; Technical Report MCEER-16-0001; State University of New York at Buffalo: Buffalo, NY, USA, 2016. [Google Scholar]
- Epackachi, S.; Whittaker, A.S. A validated numerical model for predicting the in-plane seismic response of lightly reinforced, low-aspect ratio reinforced concrete shear walls. Eng. Struct. 2018, 168, 589–611. [Google Scholar] [CrossRef]
- Comité Euro-International du Béton. CEB-FIP Model Code 1990: Design Code; Thomas Telford Publishing: London, UK, 1993. [Google Scholar]
- Epackachi, S.; Luna, B.; Whittaker, A.S. Numerical investigation of the in-plane behavior of low-aspect ratio reinforced concrete shear walls. In Proceedings of the 23rd International Conference on Structural Mechanics in Reactor Technology (SMiRT 23), Manchester, UK, 10–14 August 2015. [Google Scholar]
- Polat, E.; Bruneau, M. Modeling cyclic inelastic in-plane flexural behavior of concrete filled sandwich steel panel walls. Eng. Struct. 2017, 148, 63–80. [Google Scholar] [CrossRef]
- Schwer, L. Modeling rebar: The forgotten sister in reinforced concrete modeling. In Proceedings of the 13th International LS-DYNA® Users Conference, Detroit, MI, USA, 8–10 June 2014. [Google Scholar]
- Sadraie, H.; Khaloo, A.; Soltani, H. Dynamic performance of concrete slabs reinforced with steel and GFRP bars under impact loading. Eng. Struct. 2019, 191, 62–81. [Google Scholar] [CrossRef]
- Soboyejo, W. Mechanical Properties of Engineered Materials; CRC Press: Boca Raton, FL, USA, 2002. [Google Scholar]
- Nguyen, V.Q.; Nizamani, Z.A.; Park, D.; Kwon, O.S. Numerical simulation of damage evolution of Daikai station during the 1995 Kobe earthquake. Eng. Struct. 2020, 206, 110180. [Google Scholar] [CrossRef]
- Omran, M.E.; Mollaei, S. Assessment of empirical formulas for estimating residual axial capacity of blast damaged RC columns. Eur. J. Sustain. Dev. 2017, 6, 383–396. [Google Scholar] [CrossRef]
- Coleman, D.K. Evaluation of Concrete Modeling in LS-DYNA for Seismic Application. Master’s Thesis, The University of Texas at Austin, Austin, TX, USA, 2016. [Google Scholar]
- Moehle, J.P. Displacement-based design of RC structures subjected to earthquakes. Earthq. Spectra 1992, 8, 403–428. [Google Scholar] [CrossRef]
- Rodriguez, M.E.; Aristizabal, J.C. Evaluation of a seismic damage parameter. Earthq. Eng. Struct. Dyn. 1999, 28, 463–477. [Google Scholar] [CrossRef]
- FEMA P440A. Effects of Strength and Stiffness Degradation on Seismic Response; FEMA: Washington, DC, USA, 2009.

Publisher’s Note: MDPI stays neutral with regard to jurisdictional claims in published maps and institutional affiliations. |
© 2022 by the authors. Licensee MDPI, Basel, Switzerland. This article is an open access article distributed under the terms and conditions of the Creative Commons Attribution (CC BY) license (https://creativecommons.org/licenses/by/4.0/).