Article

Printable and Mechanical Performance of 3D Printed Concrete Employing Multiple Industrial Wastes

1
CCCC First Highway Consultants Co., Ltd., Xi’an 710075, China
2
CCCC High-Tech Science and Technology Industry Development Co., Ltd., Xi’an 710000, China
3
School of Design and Built Environment, Curtin University, Perth 6102, Australia
4
College of Civil Engineering, Fuzhou University, Fuzhou 350116, China
5
Institute for Smart City of Chongqing University in Liyang, Chongqing University, Changzhou 213300, China
*
Authors to whom correspondence should be addressed.
Buildings 2022, 12(3), 374; https://doi.org/10.3390/buildings12030374
Submission received: 10 February 2022 / Revised: 13 March 2022 / Accepted: 14 March 2022 / Published: 17 March 2022
(This article belongs to the Special Issue The Impact of Building Materials on Construction Sustainability)

Abstract

:
Three-dimensional concrete printing is a promising technology and attracts the significant attention of research and industry. However, printable and mechanical capacities are required for 3D printable cementitious materials. Moreover, the quantitative analysis methods of printable performance are limited and have low sensitivity. In this study, the orthogonal experiment through samples combining 3D concrete printing method with fly ash, silica fume, and ground granulated blast furnace slag was designed to obtain the printable and mechanical property influence of various mix proportions. Furthermore, multiple industrial wastes were utilized to improve material sustainability. Meanwhile, the static and dynamic extrusion pressure measured by the original 3D printing extrudability tester were verified to achieve a high-sensitivity evaluating indicator. Thereby, a novel high-sensitivity quantitative analysis method of printable capacity was established to explore the influence of industrial wastes usage on the printability of 3D printable mortars. The optimum dosage of fly ash, silica fume, and ground granulated blast furnace slag was 20 wt.%, 15 wt.%, and 10 wt.%, respectively, based on printable and mechanical property experiments. Furthermore, the optimum dosage was employed to print the sample and achieved a higher compressive strength (56.3 MPa) than the control cast.

1. Introduction

Additive manufacturing is a method exhibiting the characteristics of material saving, economic, high construction speed, and flexible design, hence having been employed in various fields [1,2]. In the last decade, the interest of additive manufacturing in the building industry has significantly enhanced [3]. The rapid growth and elaborate research in this field indicate that additive manufactured construction structures are possible in the near future although still in their nascent stage [4,5]. Meanwhile, 3D concrete printing (3DCP) that is one of the additive manufacturing technologies of construction has attracted most attention from both academia and industry in the additive manufacturing areas [6]. Concrete 3D printing is the cementitious composites deposited in layer-by-layer shapes by the coordination between computer design and the help of a printer [7]. Advantages of 3DCP have been verified on no formwork, waste reduction, materials saving, and labor dependence reduction [8].
However, desirable materials using the 3DCP method ought to demand high flowable performance from the printer pump to the nozzle [9,10,11]. Simultaneously, the printable materials should reveal high buildability to ensure the maintenance of printed shape as well as printable layers without flowing and collapse [8,12]. Besides, the printable property of the composite and mix proportions ought to be coordinated with print process parameters [13,14]. Furthermore, conventional concrete by 3DCP methodology generally uses fine aggregates, leading to more cement usage, CO2 emissions, and energy consumption than traditional casting concrete due to the higher cement content [15,16].
The rapid development of industrial production has led to the huge amount of various wastes [17]. Meanwhile, most industrial wastes are directly landfilled, thus impacting the health of humans and the environment [18]. As a result, the effective improvement of reuse for industrial wastes is urgent to further obtain sustainability. Fly ash (FA), silica fume (SF), and ground granulated blast furnace slag (GGBS) are industrial wastes in the by-product of the energy and smelting industry, which need to be resolved at a considerable cost [19]. However, FA, SF, and GGBS are used in cementitious composites to reduce cement dependence and improve sustainability, as well as influence printable properties of materials [20]. Simultaneously, the addition of industrial mineral wastes can improve hydration products and pore structure, thereby enhancing the mechanical property and interlayer bond of 3D printed cement-based materials [21]. The polyvinyl alcohol (PVA) fiber is one of the most suitable polymeric fibers to reinforce cementitious composites, enabling the crack resistance and the early strength of printed material [22]. Moreover, hydroxypropyl methylcellulose can benefit the buildability and green strength of printable mortar [23].
The plastic viscosity and yield stress reduction can improve extrudable and pumpable properties but negate the buildable performance for 3DCP [24]. Printability is therefore a property requiring a balance of buildability, pumpability, and extrudability [25]. Simultaneously, the composites used in 3DCP demand sufficient rheological and thixotropic properties, which are differed from traditional cast concrete [26]. Rheological and thixotropic properties are conventionally evaluated by the parameters containing the rheology spanning, slump deformation, and setting behavior [27]. Additionally, printable parameters can influence the printing process comprising nozzle moving velocity, and pumping pressure [28]. Nevertheless, the traditional experimental methods in the field of cast cement-based materials or other 3D printing fields are applied due to no criterion in the 3DCP area [29]. Meanwhile, the extrudability and buildability of the printable cementitious materials are commonly described by the Bingham model using static yield stress, dynamic yield stress, and viscosity as shown in Equations (1) and (2) [30,31]:
τ t = τ d + k γ ˙
H b = δ ρ g τ s
where τt (Pa) is shear stress, τd (Pa) means dynamic shear stress, τs (Pa) demonstrates the static shear yield stress, k (Pa.s) describes plastic viscosity, γ ˙ (1/s) symbols shear rate, Hb (m) denotes element buildability height, δ means the geometric factor, g (m/s2) describes the gravitational constant, and ρ (g/cm3) symbols density.
The printing process is not properly simulated by the conventional evaluation criterion of printability for materials using 3DCP technology [32,33]. Besides, the traditional rheology experiment methods, such as slump tests and rheometers are not sensitive for early-strength concretes [34]. The Sliper is concrete testing equipment and has advantages, which are extremely close to the practical pumping process and relatively simple for robust settings [35,36]. However, the printing process cannot be accurately simulated by the assessment of conventional Sliper because the section size of outlet using 3DCP technology is commonly smaller than the section size of the pumping line. Moreover, the evaluation methods applying rheometers are restricted in practical applications of 3DCP due to the high cost [37,38]. Thereby, research on determining appropriate test and evaluation methods of printable property for 3DCP is urgent [39,40].
This study aims to investigate the influence on printable and mechanical performance when multiple industrial wastes are incorporated into the concrete using 3DCP technology. The original 3D printing extrudability tester and orthogonal experiment are conducted to reduce the experimental workload and obtain high-sensitivity evaluating indicators. Simultaneously, the mechanical and printable performance influences of FA, GGBS, and SF are discovered for multiple industrial wastes incorporated composites using 3DCP technology. Thereby, the optimum mixture design combining the printable and mechanical performance of concrete using 3DCP technology is acquired.

2. Materials and Methods
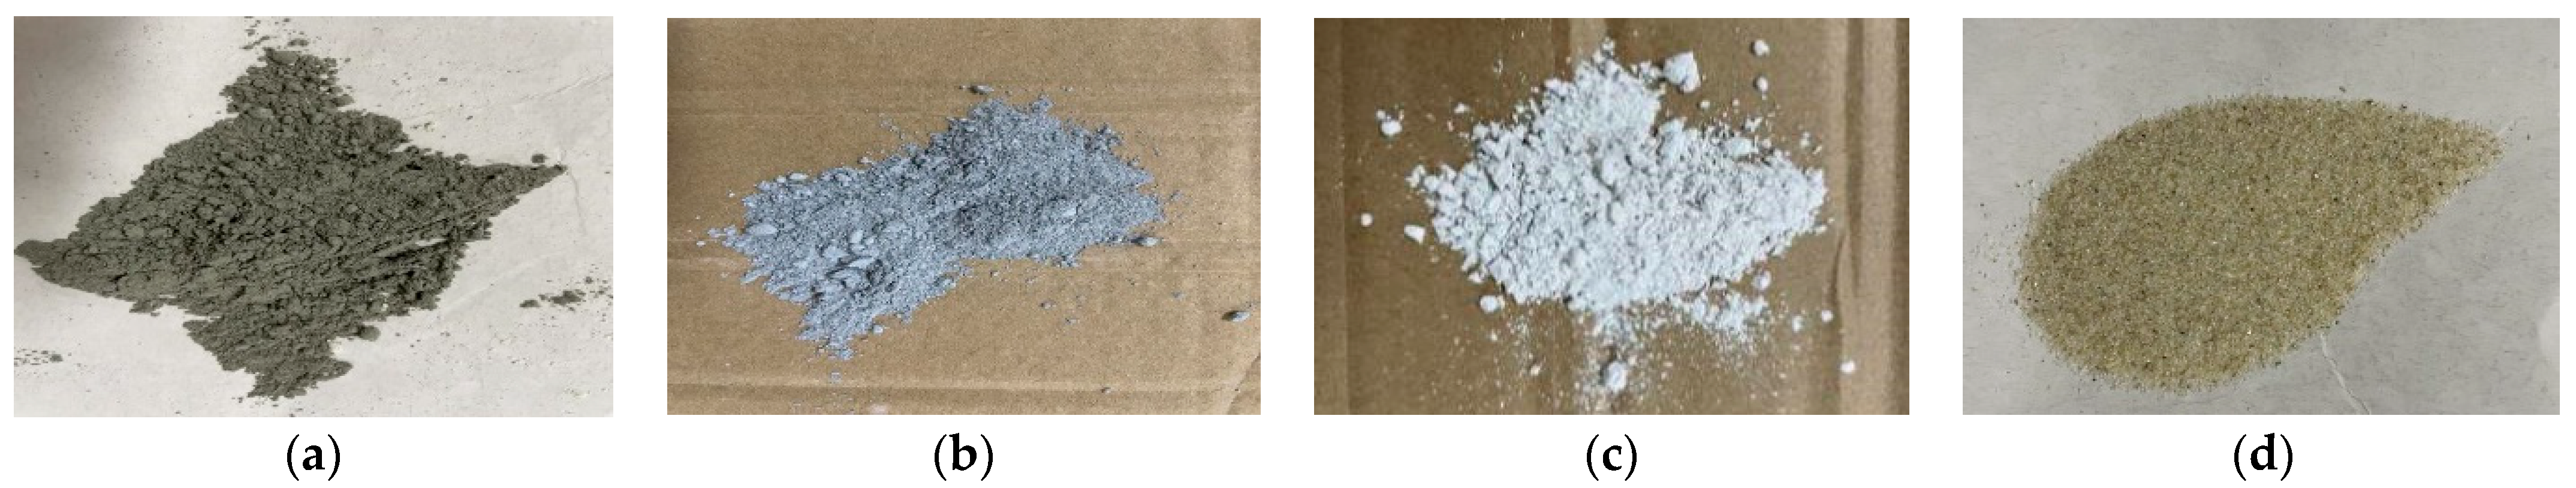
2.1. Raw Materials

The raw materials of sample in this study were 42.5R Portland cement (conformed to Chinese national standard GB175-2007 [41]), FA (Class F, conformed to Chinese national standard GB/T 1596-2017 [42]), GGBS (S95, conformed to Chinese national standard [43]), and SF (conformed to Chinese national standard [44]), as shown in Figure 1. The chemical compositions of the precursor materials are shown in Table 1. The quartz sand of particle grading range between 40 mesh and 70 mesh was proposed to be used, conforming to Chinese national standard GB/T 14684-2011 [45]. The physical and mechanical properties of PVA fibers utilized in this study are shown in Table 2. Additionally, the high-efficiency polycarboxylic acid type water reducer and hydroxypropyl methylcellulose (viscosity at 40000 Cp) was employed to improve the working performance of 3D printing concrete.

2.2. Orthogonal Experimental Design of Mix Proportion

The mixing proportion of 3D printing concretes mainly includes water binder ratio, sand binder ratio, high-efficiency polycarboxylic acid water reducer, PVA fiber, hydroxypropyl methylcellulose, etc. The water binder ratio of this experiment was 0.36 based on the trial test by the comprehensive consideration of printable fluidity and mechanical strength. Additionally, the sand binder ratio at 1.3 was verified to prove smooth extrusion and reasonable cost. Subsequently, an orthogonal experiment on components of FA, SF, and GGBS in the cementitious materials was designed when the total calculation percentage of binder materials was 100 wt.%. Additionally, the PVA fiber, polycarboxylate superplasticizer and hydroxypropyl methylcellulose content were 0.21 wt.%, 0.23 wt.%, and 0.016 wt.%, respectively, to improve the flowable and water-retaining property of mortar. The mix proportion of the control sample and tested samples in orthogonal experiment is shown in Table 3. The orthogonal experiment can effectively explore the influence degree of various industrial wastes on mechanical and printable performance although they cannot detect information about mutual effects of the components. Furthermore, this study utilized range value to analyze the influence of various industrial wastes for more intuitive results and convenient calculation compared with variance analysis. The range value is that subtracts the minimum level average from the maximum level average. The influence degree of three industrial wastes (FA, SF, and GGBS) is determined by the range value.

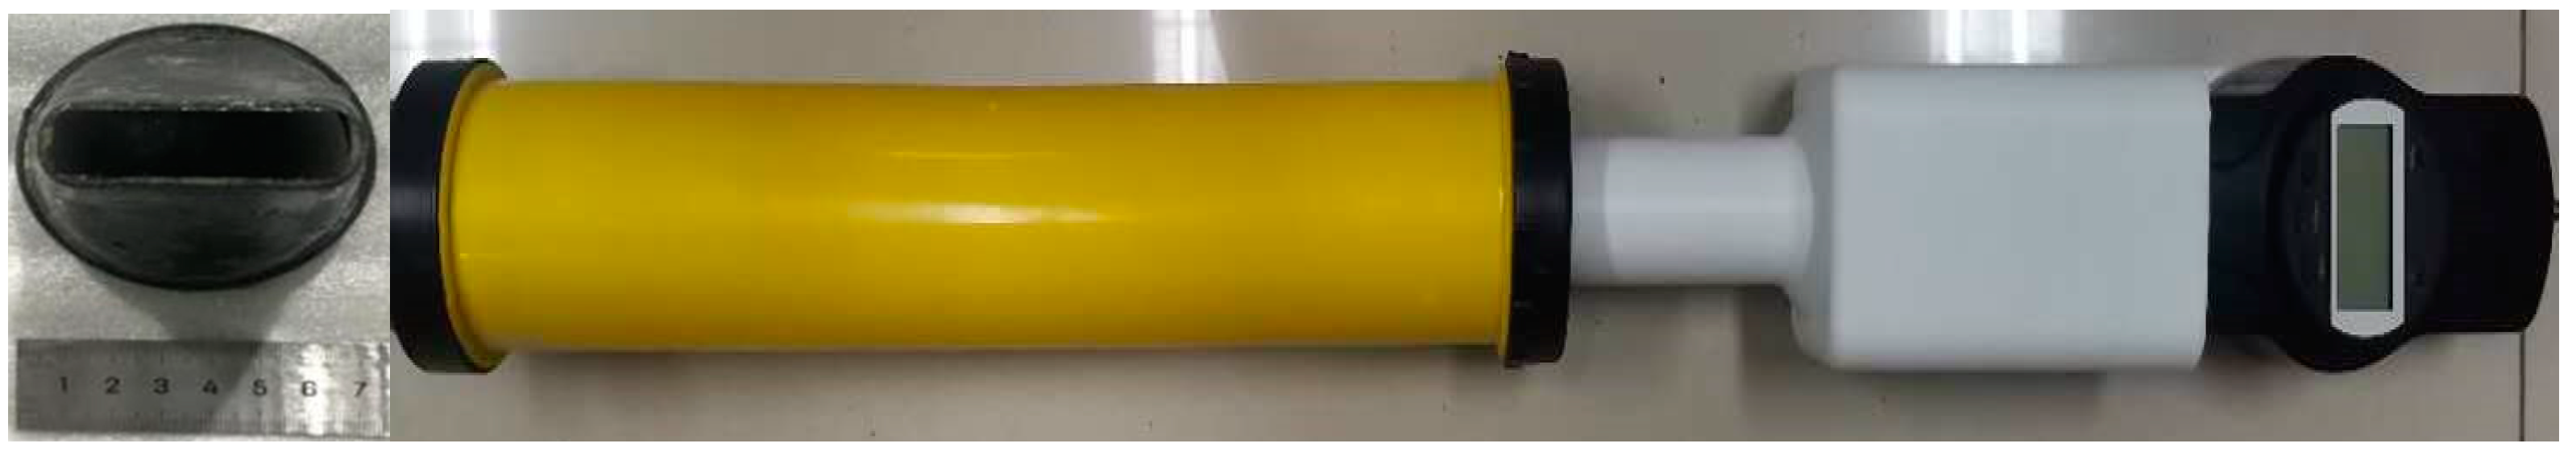
2.3. Flowability and Slump Test

The flowability and slump test adopted the Chinese national standard GB/T2419-2005 [46]. The flowability test was that the average diameter of the bottom extension of samples was measured after the sample was placed on the truncated cone mold vertically agitated up and down, as shown in Figure 2a. The flowability test was immediately started when 25 beats were accomplished within 25 ± 1 s at a frequency of one per second. After agitating, a diameter measure method of two mutually vertical directions on the bottom surface of the mortar was applied and the average value was in mm calculated. The slump test can evaluate the buildability of 3D printable mortar. The specimens were poured into the slump cone (65 mm height) and slowly lifted the slump cone, measuring the average value in mm calculated, as shown in Figure 2b.

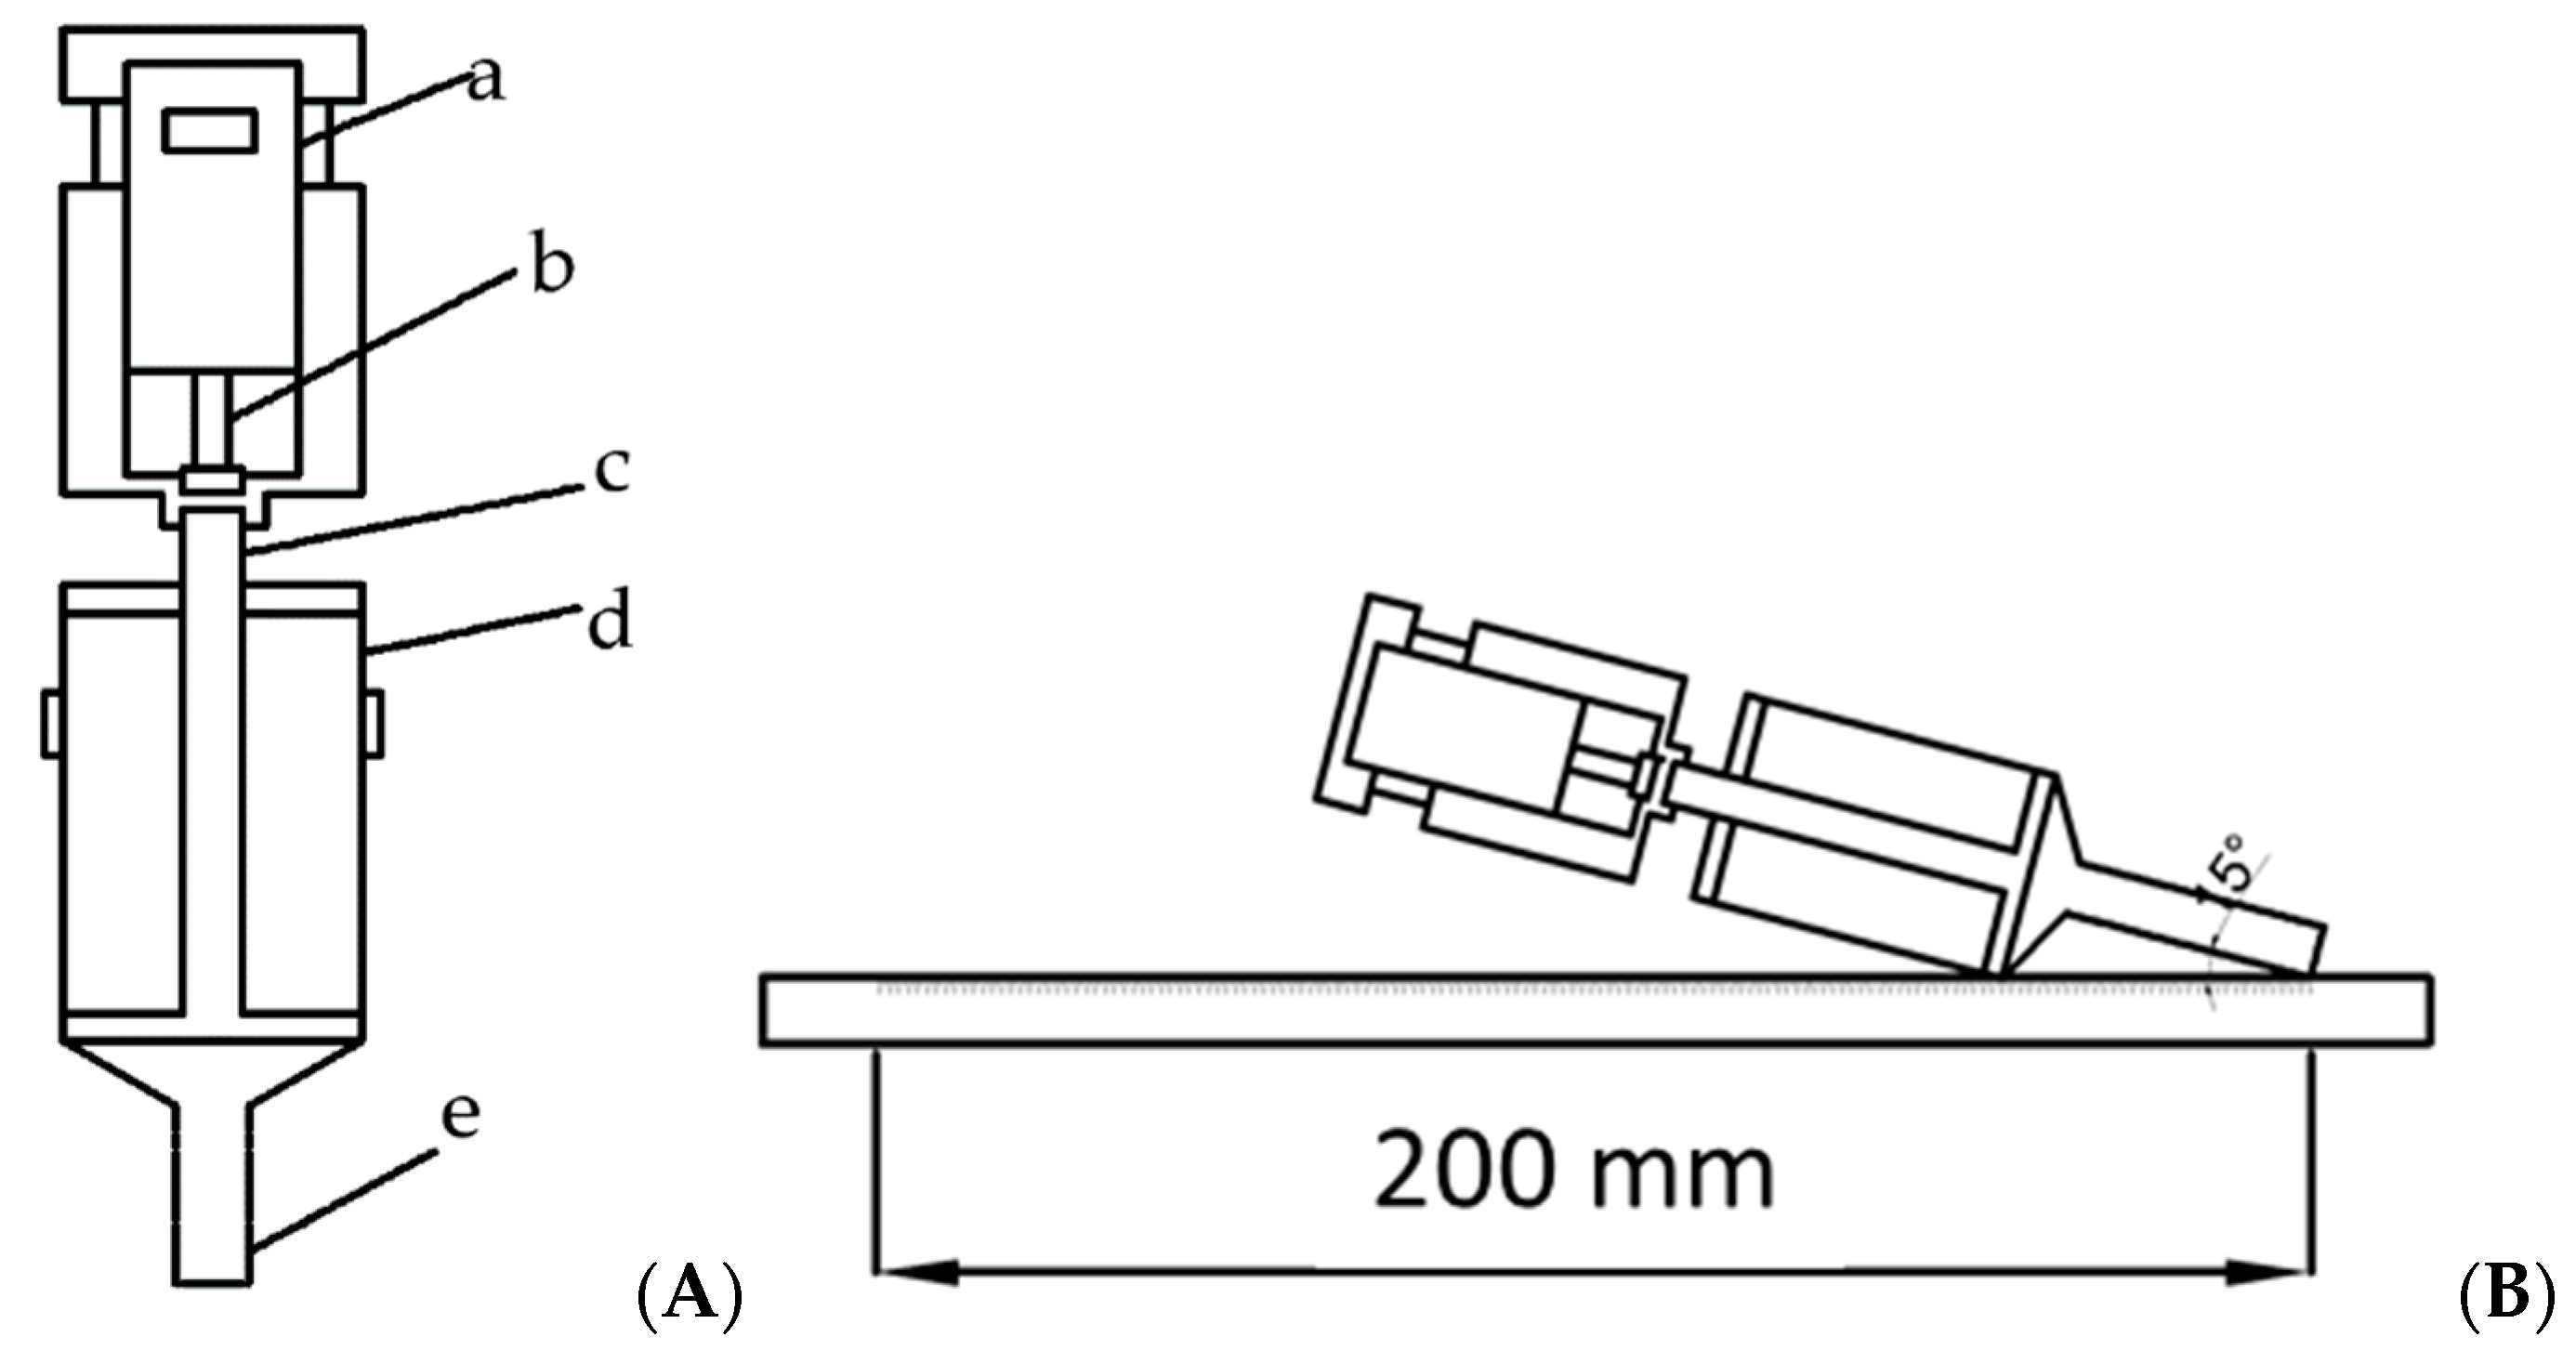
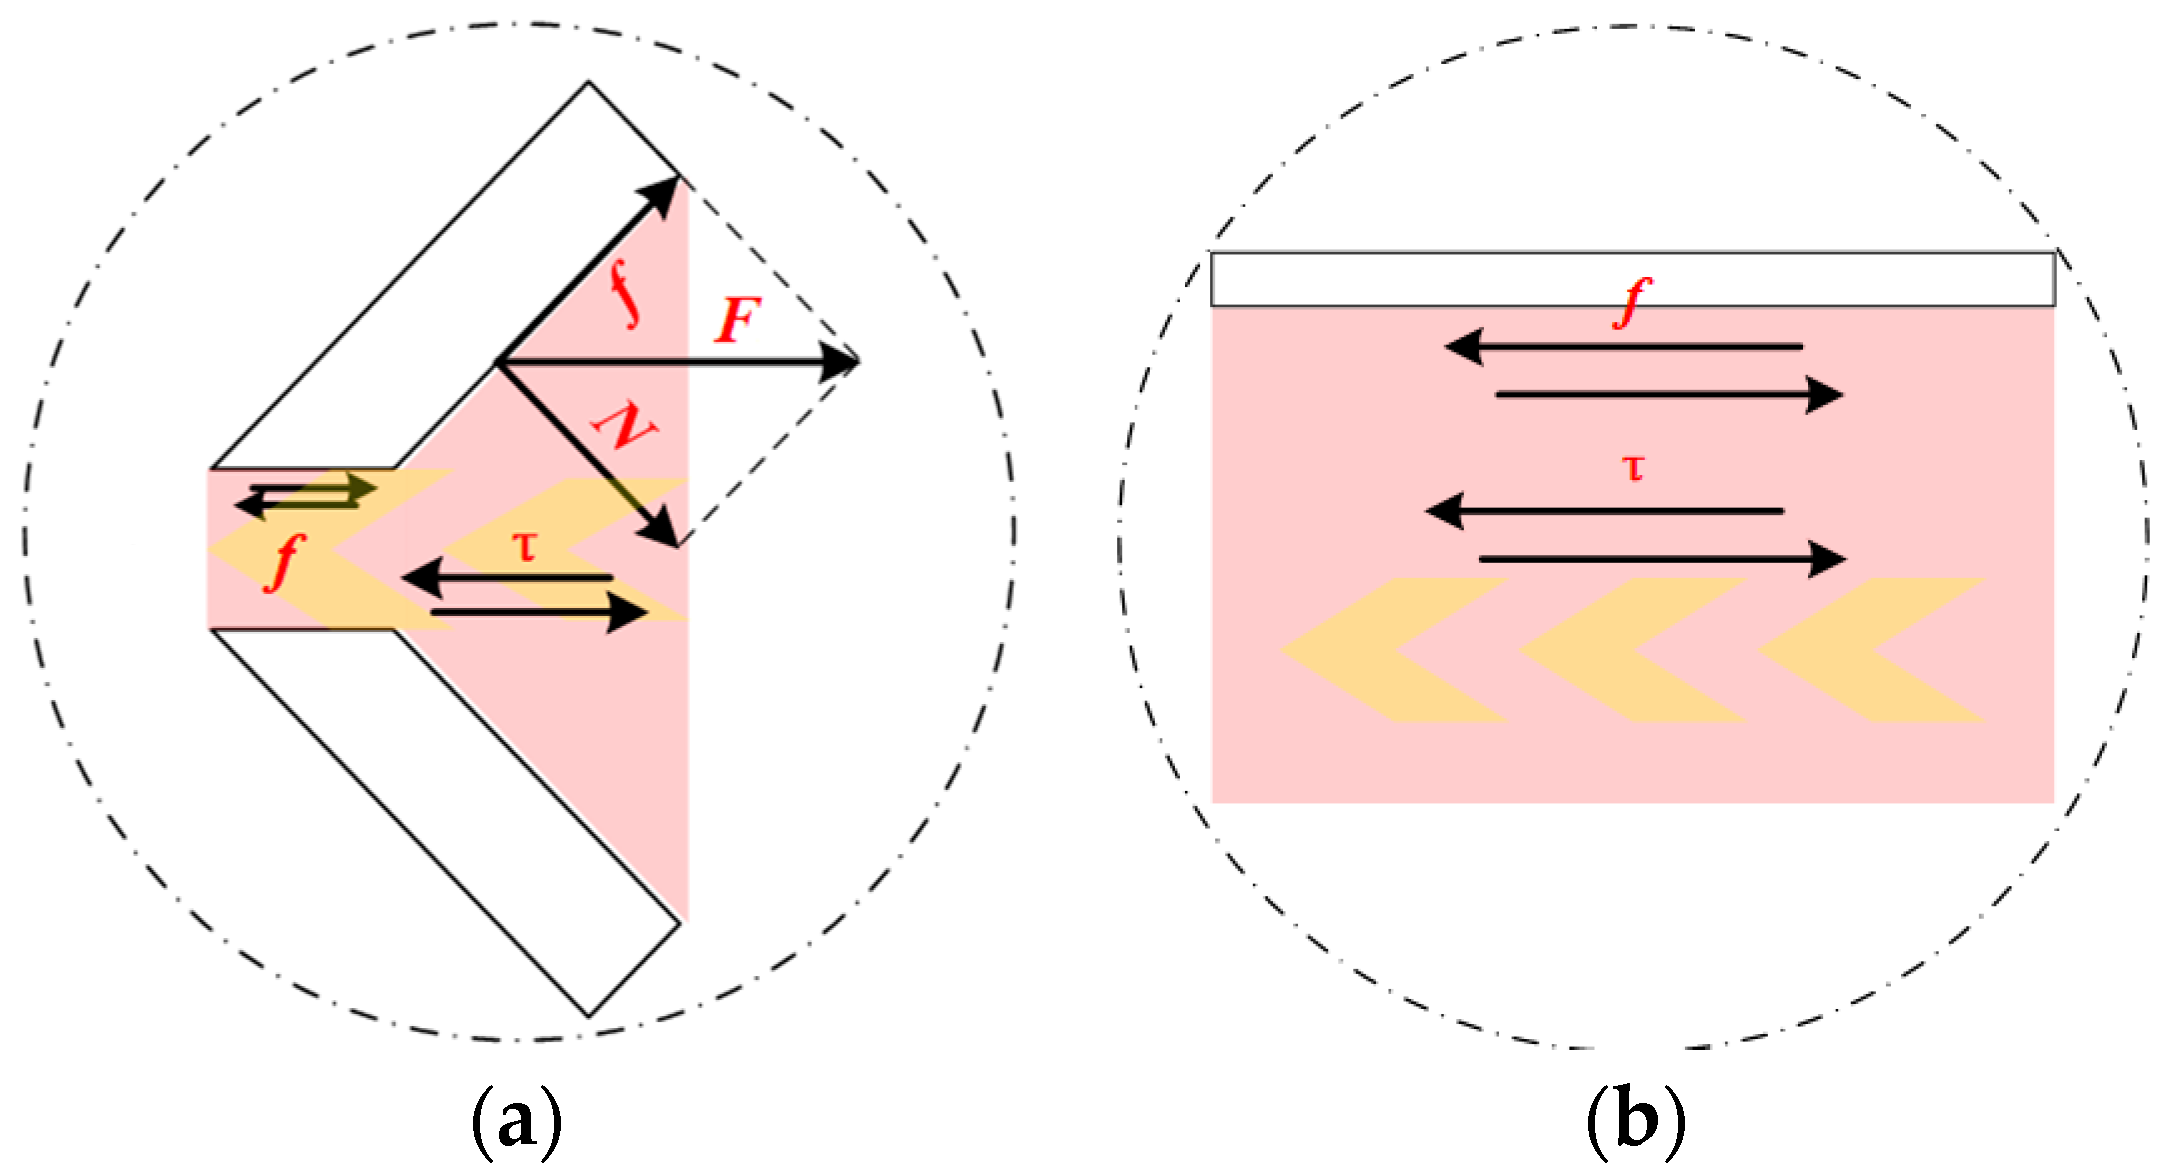
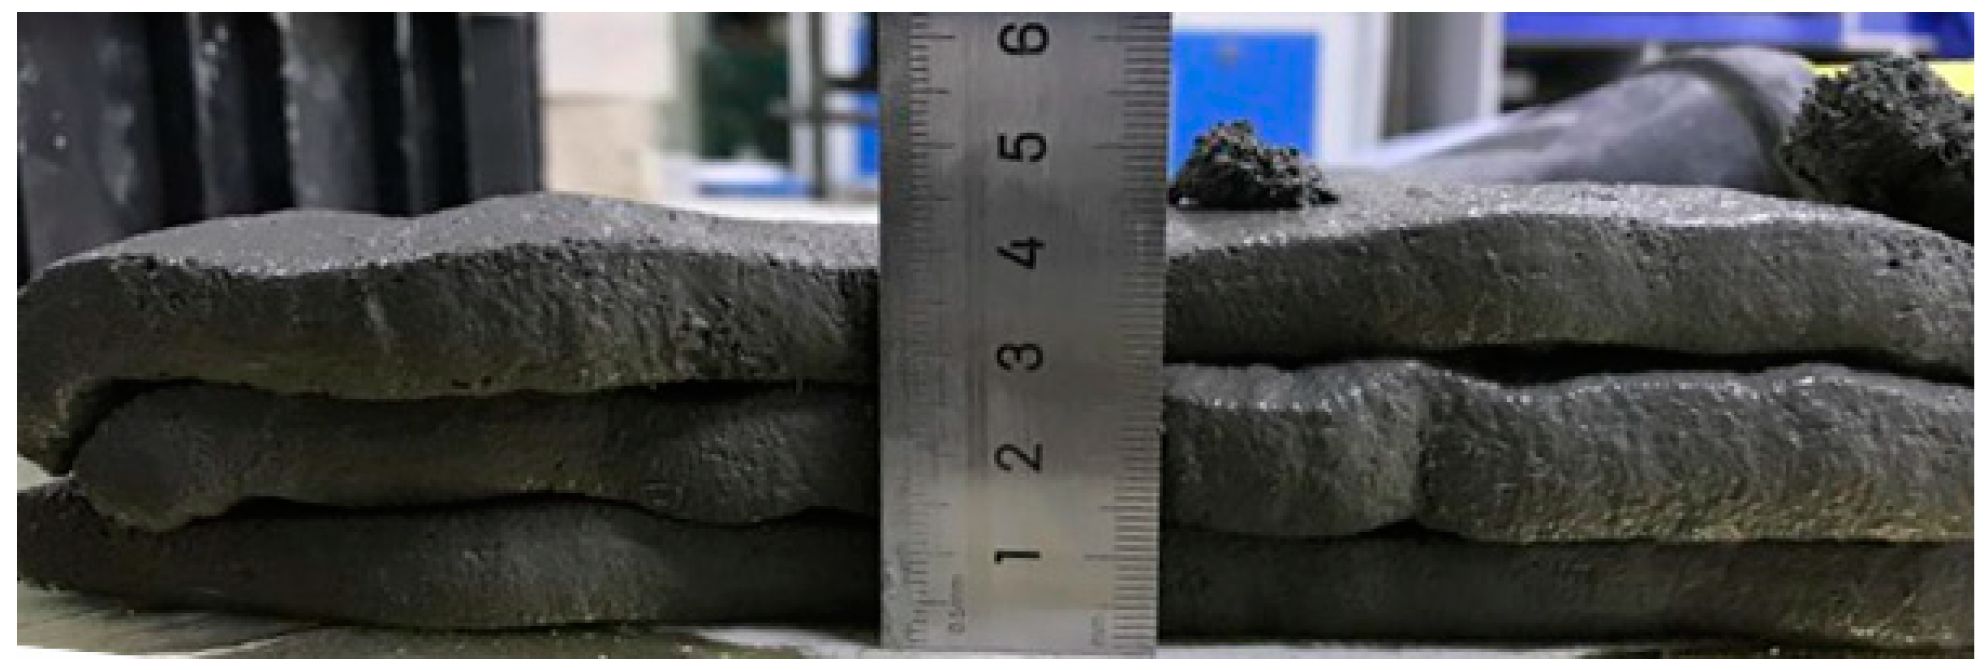
2.4. Printable Performance Evaluation Method

In contrast with conventional equipment of independent pumping and extrusion, this test applied pumping and extrusion integrated printing equipment to eliminate the phenomenon in which extrusion and pumping speed could not be coordinated. Through the rotation of the single screw stem in the pumping pipeline, the material was continuously extruded from the variable-section nozzle. The reacting force was produced because the size of outlet section of printer was smaller than the size of constant pumping section; thereby, a test method was proposed to determine the difficult degree of continuous and stable materials extrusion based on extrusion pressure. Furthermore, this study applied a digital-display 3D printing extrudability tester in which the section size (length: 38 mm, width: 14 mm) of its extruding outlet was the same as the nozzle of the printer, as shown in Figure 3. The elastic connecting rod of extrudability tester deformation changes electric resistance, which leads to the pressure value variety in the display, as shown in Figure 4A.
This tester was employed to simulate the printing process by pushing the pull rod by hand to extrude the material. To ensure stable extrusion speed and repeatable experiment, extrusion length of mortar from the barrel was the same when extrusion time of 0.2-L material (the volume of piston barrel) was 10 s, as shown in Figure 4B. The 1-time constant extrusion filament length, nozzle speed, and angle were 200 mm, 20 mm/s, and 15°, respectively. The printing nozzle is close to the printing platform to prevent vertical error. Simultaneously, the rectangular tester nozzle can improve the consistency of width and deposition height of the extrusion filament, thus ensuring the stable width and deposition height of the filament. The final result employed the average to enhance the accuracy of the test. Moreover, the average was obtained by a respective 3-time measure using every group sample of Table 3. The repeated measure would be conducted when the standard deviation of a single result was greater than 5% of the average value.
Before the material was extruded from the printing nozzle, the friction (between material and pipe as well as between material and nozzle) and the shear yield stress (mortar was conveyed to the internal extended pipe and the cross-section of nozzle) were produced in the extrudability tester, as shown in Figure 5. After the material was transported and extruded at a constant rate, the material bore relatively stable shear stress to destroy the network flocculation structure inside the fresh mortar. Thereby, the extrusion pressure to block material was reduced to turn into dynamic extrusion pressure after the material broke through the yield shear stress. FB1 represented static extrusion pressure (sum of the friction and shear yield stress) before the material was extruded from the printing nozzle. Meanwhile, FB1 was the maximum pressure value through slow extrusion from the tester nozzle. The dynamic extrusion pressure was demonstrated by FB2, which is a stable pressure value under the condition of rapid extrusion rate. Moreover, FB1 and FB2 were successively noted by the digital display tester when the mortar was extruded at one time.
FB1 is influenced by the static yield stress and has a positive correlation to depositing capacity. FB2 is impacted by the dynamic yield stress and is a negative correlation with pumpable capacity. Moreover, index FJ (%) represented the extrusion shaping capacity based on FB1 (N) and FB2 (N) is the positive correlation to the thixotropy, as described in Equation (3).
F J = F B 1 F B 2 F B 2
In this study, the extrudability of concrete referred to the method of Le et al. [47]. The method employed the relation coefficient of extruded filament width (N) and nozzle width (38 mm) to calculate extrudable index (J) shown in Equation (4) and Figure 6. J represents extrudable property of printable composites. Additionally, J was a negative correlation to the extrudability of mortar. To ensure the accuracy of N, the part (height higher than 14 mm or width less than 38 mm) of 1-time extrusion material was not employed. Subsequently, N1MAX, N2MAX (respective maximum width), and N1MIN, N2MIN (respective minimum width) of two-part extrusion filaments, which meet the requirement, were utilized to determine N in a single test demonstrated in Equation (5). Moreover, L1 and L2 represent the length of the selected two-part extrusion filaments, respectively.
J = N 38 38
N = ( N 1 M A X + N 1 M I N ) L 1 + ( N 2 M A X + N 2 M I N ) L 2 2 ( L 1 + L 2 )
Figure 7 shows that the mortar was extruded from the nozzle of the 3D printing extrudability tester to form a layered structure. Meanwhile, the structure of 100 mm length, 42 mm height, and 3-layer vertical deposition was fabricated by using three barrels of material of extrudability tester. Additionally, the interval time between upper and lower layers is 0. Subsequently, the buildable index Q (mm) was described by 3 times the height of extrusion diameter (42 mm) and the total height W (mm) of extruded filament shown in Equation (6) [48]. To ensure the accuracy of W, the part (deposition height higher than 42 mm) of a single extrusion test was not employed. Subsequently, maximum width (WMAX) and minimum width (WMIN) of one part of extrusion filaments, that meets the requirement, were utilized to determine W in the one-time test shown in Equation (7).
Q = 42 W 42
W = ( W M A X + W M I N ) 2

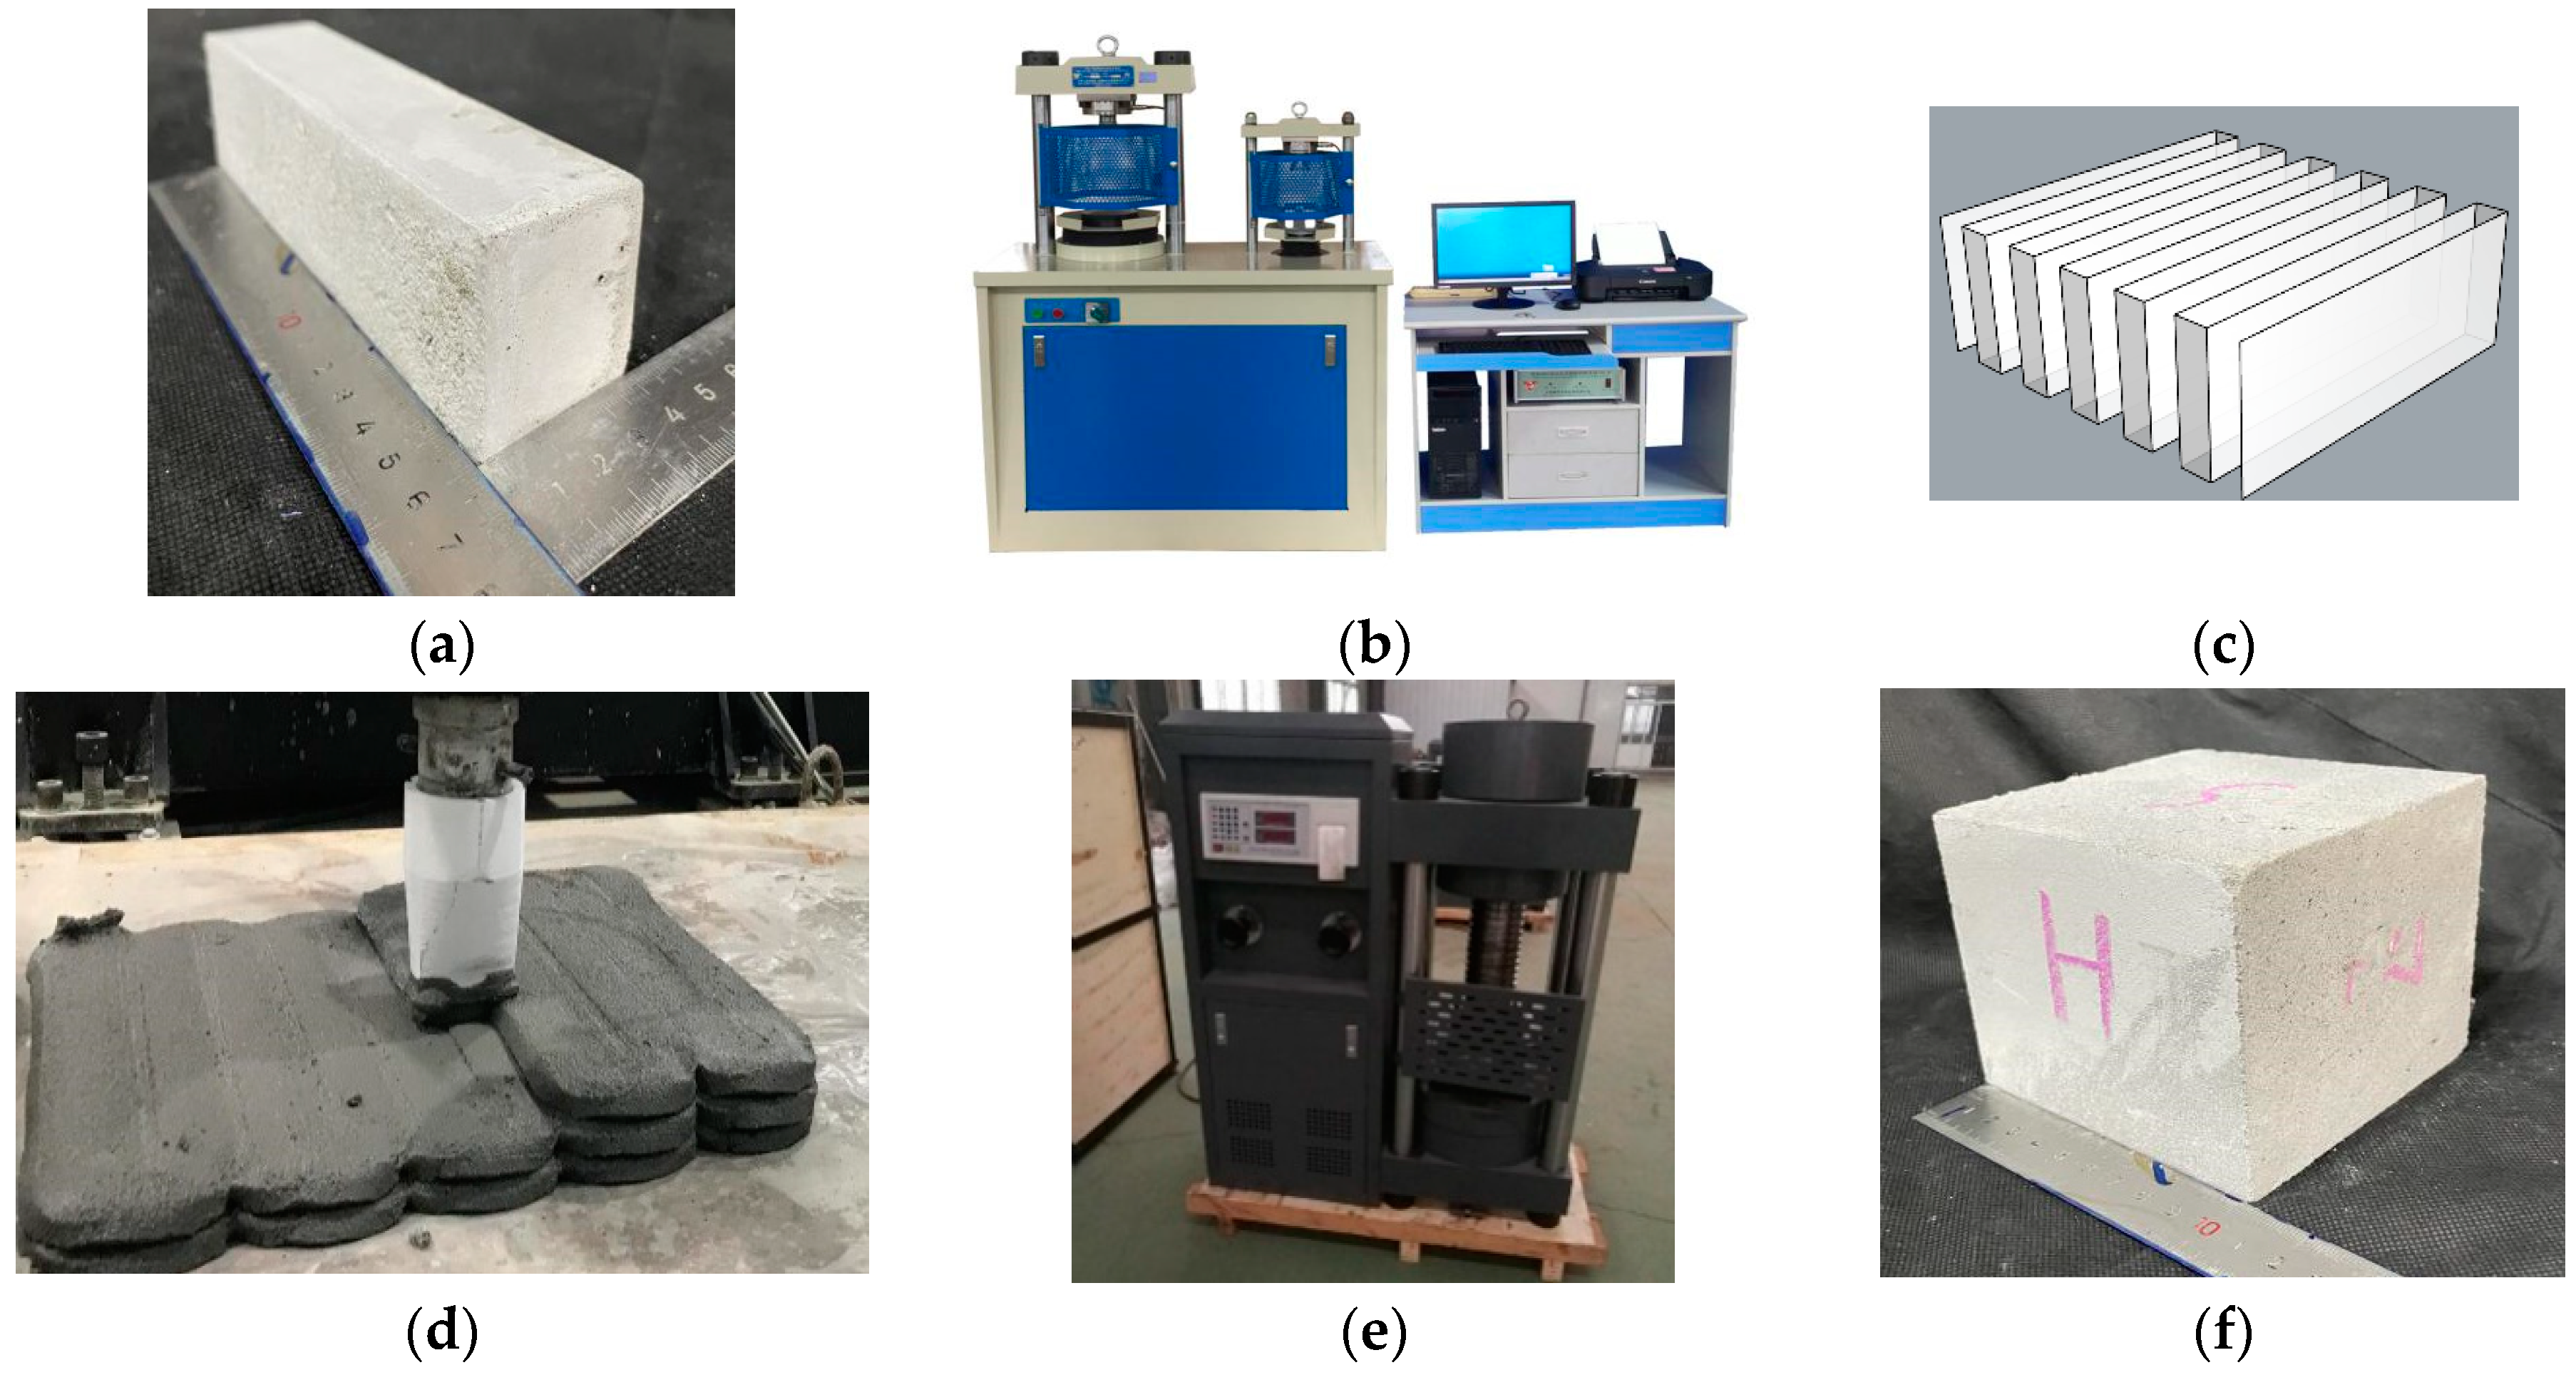
2.5. Mechanical Performance Test

The mechanical performance test adopted the standard ISO 679-2009 [49]. The tests of flexural strength utilized 9 groups, 40 mm × 40 mm × 160 mm of prismatic sample of concrete using various mix proportions of orthogonal experimental to cure 28 days in standard conditions. Meanwhile, the test of compressive strength employed the sample in which a prismatic specimen was divided into two after the flexural experiment. The flexural and compressive tests were employed to evaluate the flexural performance influence of various industrial waste proportions by testing machine (TYE-300E, manufactured by Wuxi Jianyi Instrument & Machinery Co., Ltd., Wuxi, China). Consequently, the optimum mix proportion of composite integrating printable and mechanical capacity was printed to respectively fabricate cast and printed samples of the compressive test, as shown in Figure 8. Moreover, the printed cube samples were obtained through cutting the printed structure (430 mm × 420 mm × 130 mm size). To print structure, the moving velocity of printer nozzle was 12 cm/s. Besides, each layer was manufactured with 12 round-trip continuous paths and the number of vertical deposition layers was 20 for printed structure, as shown in Figure 8c. By adopting the Chinese national standard GB/T 50081-2002 [50], the cast and printed sample (100 mm × 100 mm × 100 mm size and 28-days standard condition) of compressive test were conducted by TYE-2000B (manufactured by Wuxi Jianyi Instrument & Machinery Co., Ltd., Wuxi, China) to compare.

3. Results and Discussion

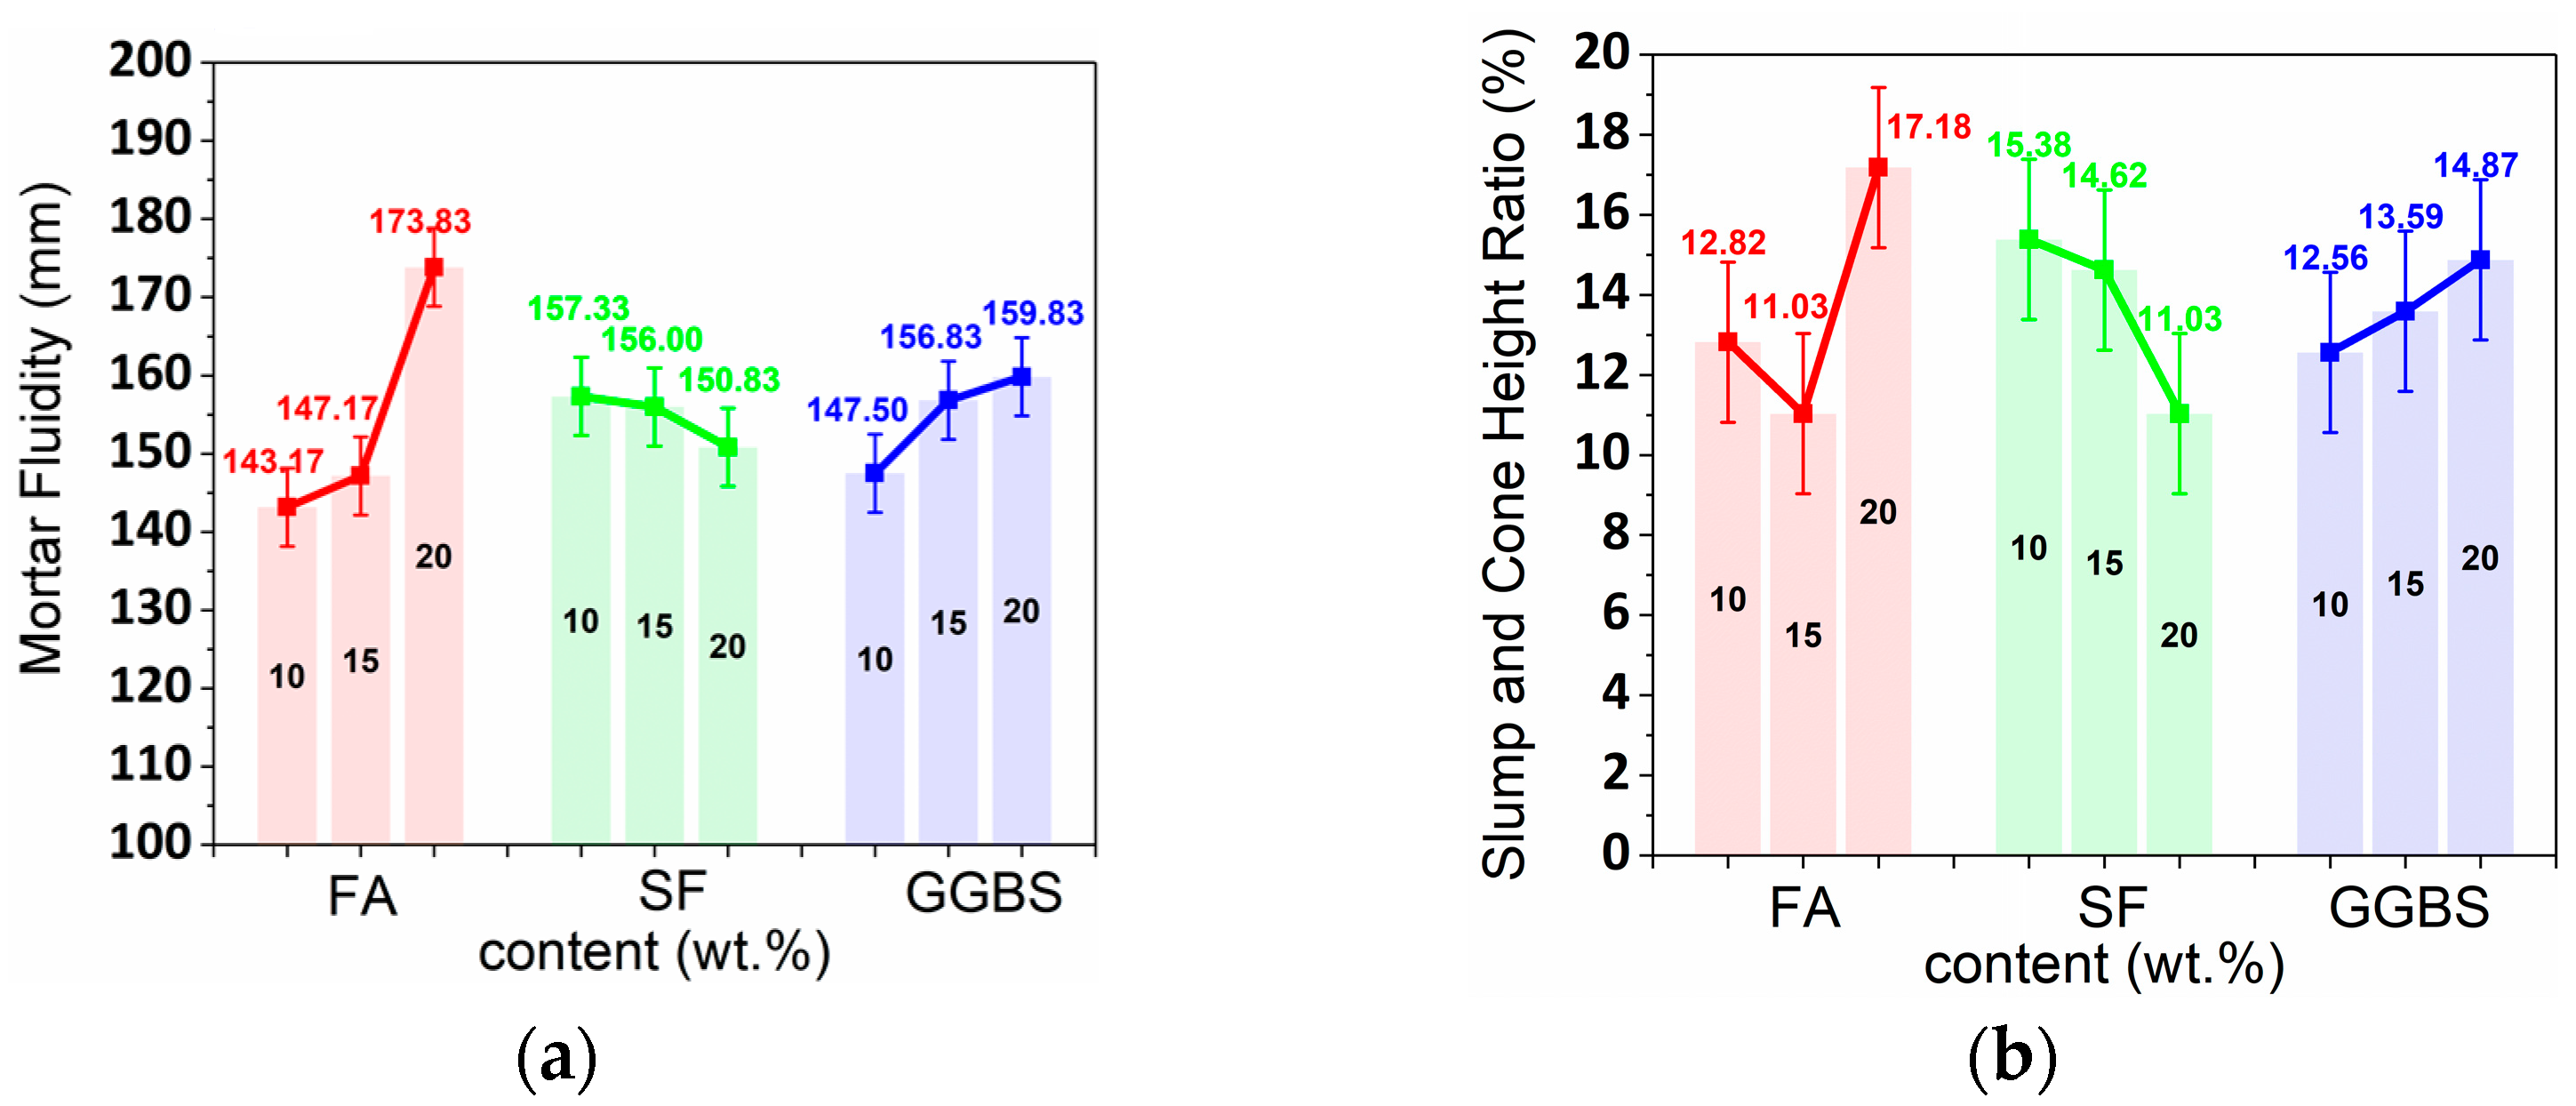
3.1. Analysis of Flowability and Slump

The fluidity (D) and slump (H) test data of samples using various industrial wastes content were summarized in the L9 (33) orthogonal experimental table (Table 4). The average values of fluidity and slump cone height ratio were obtained by results and calculation of orthogonal test, as shown in Figure 9. The fluidity range values of varying content of FA, SF, and GGBS are 30.67 mm, 6.50 mm, and 12.33 mm, respectively, obtaining the influence degree of three industrial wastes on fluidity (FA > GGBS > SF). Meanwhile, the slump range values of varying content of FA, SF, and GGBS are 4.00 mm, 2.83 mm, and 1.50 mm, respectively, obtaining the influence degree of FA > SF > GGBS. Furthermore, Figure 9a shows that the fluidity was the positive correlation, negative correlation, and negative correlation with the content of SF, GGBS, and SF, respectively. Figure 9b shows that parabolic correlation, negative correlation, and positive correlation were achieved on the slump with the content of SF, GGBS, and SF, respectively. However, the test sensitivities of fluidity and slump were insufficient when the contents of SF, GGBS, and SF were transformed. The above results were acquired by more tests than expected, especially slump.

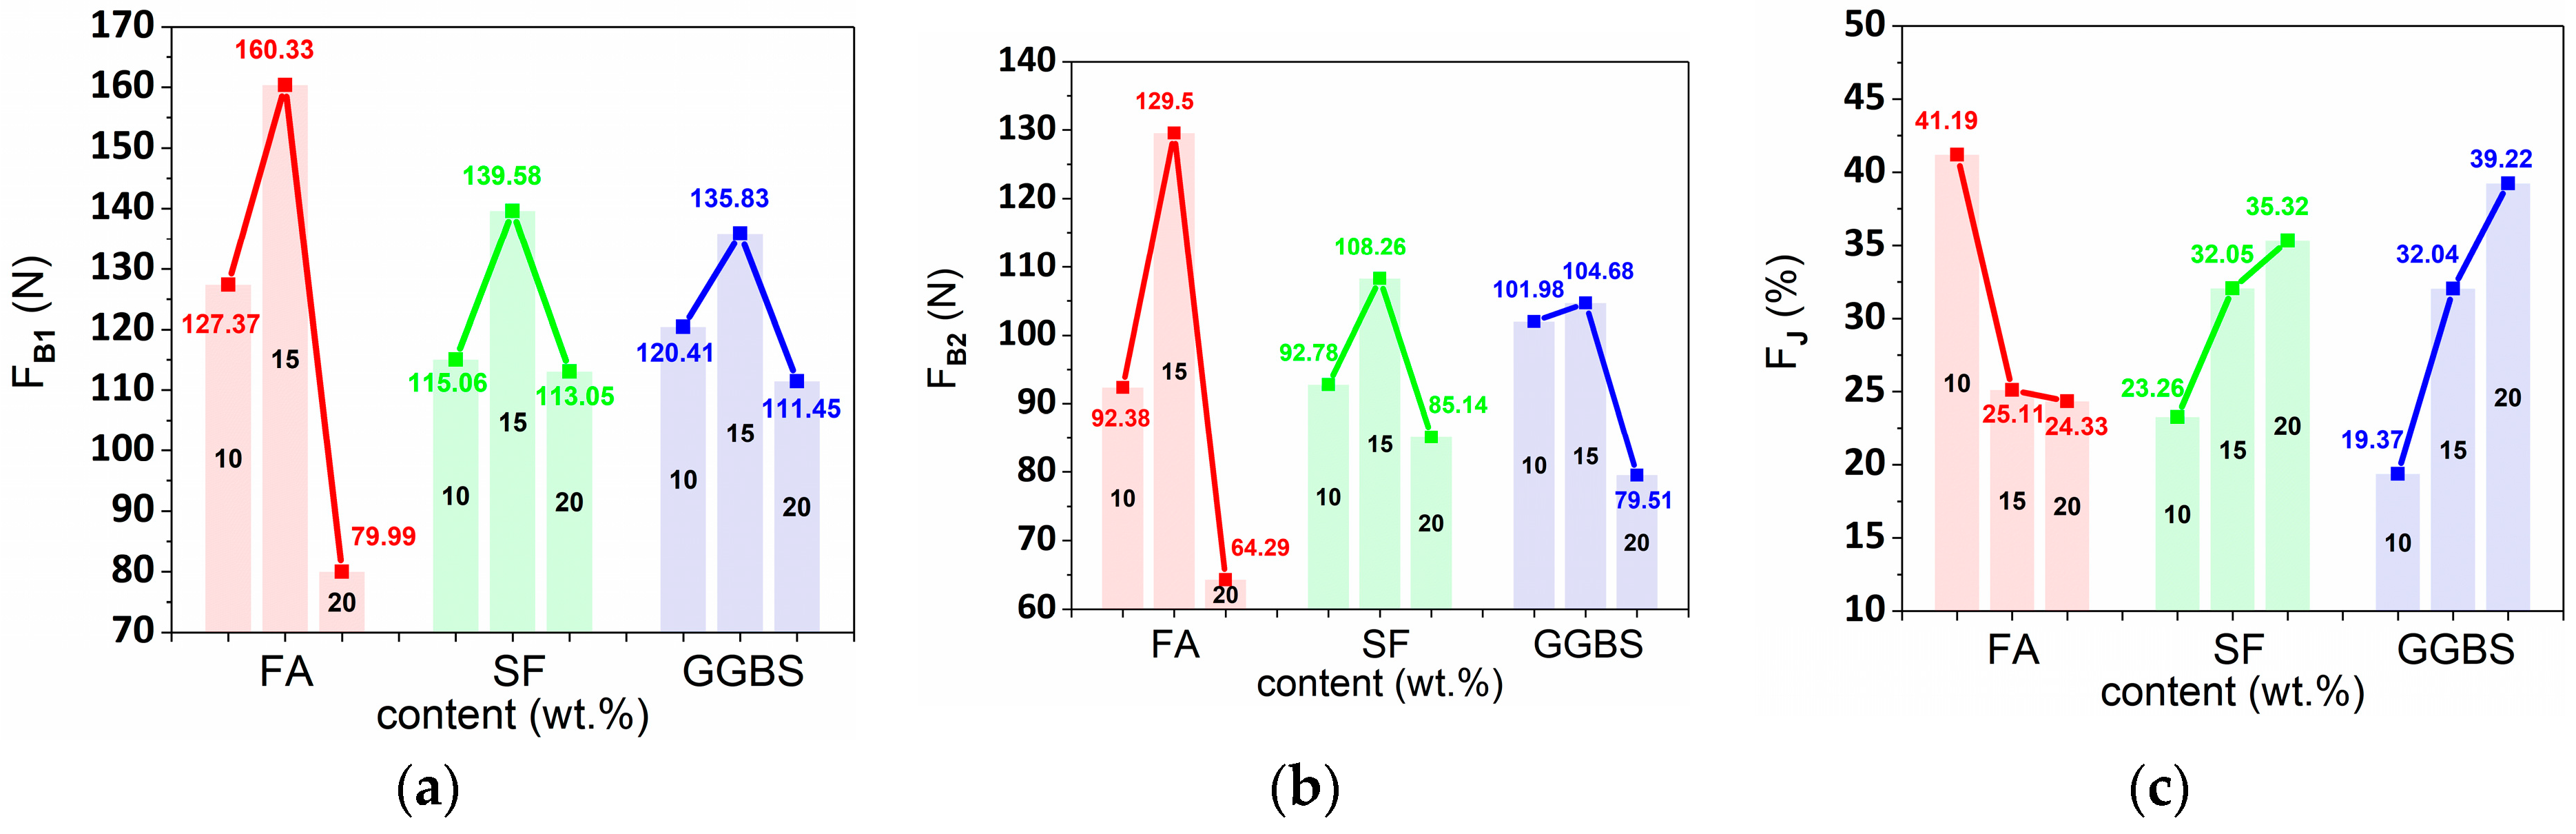
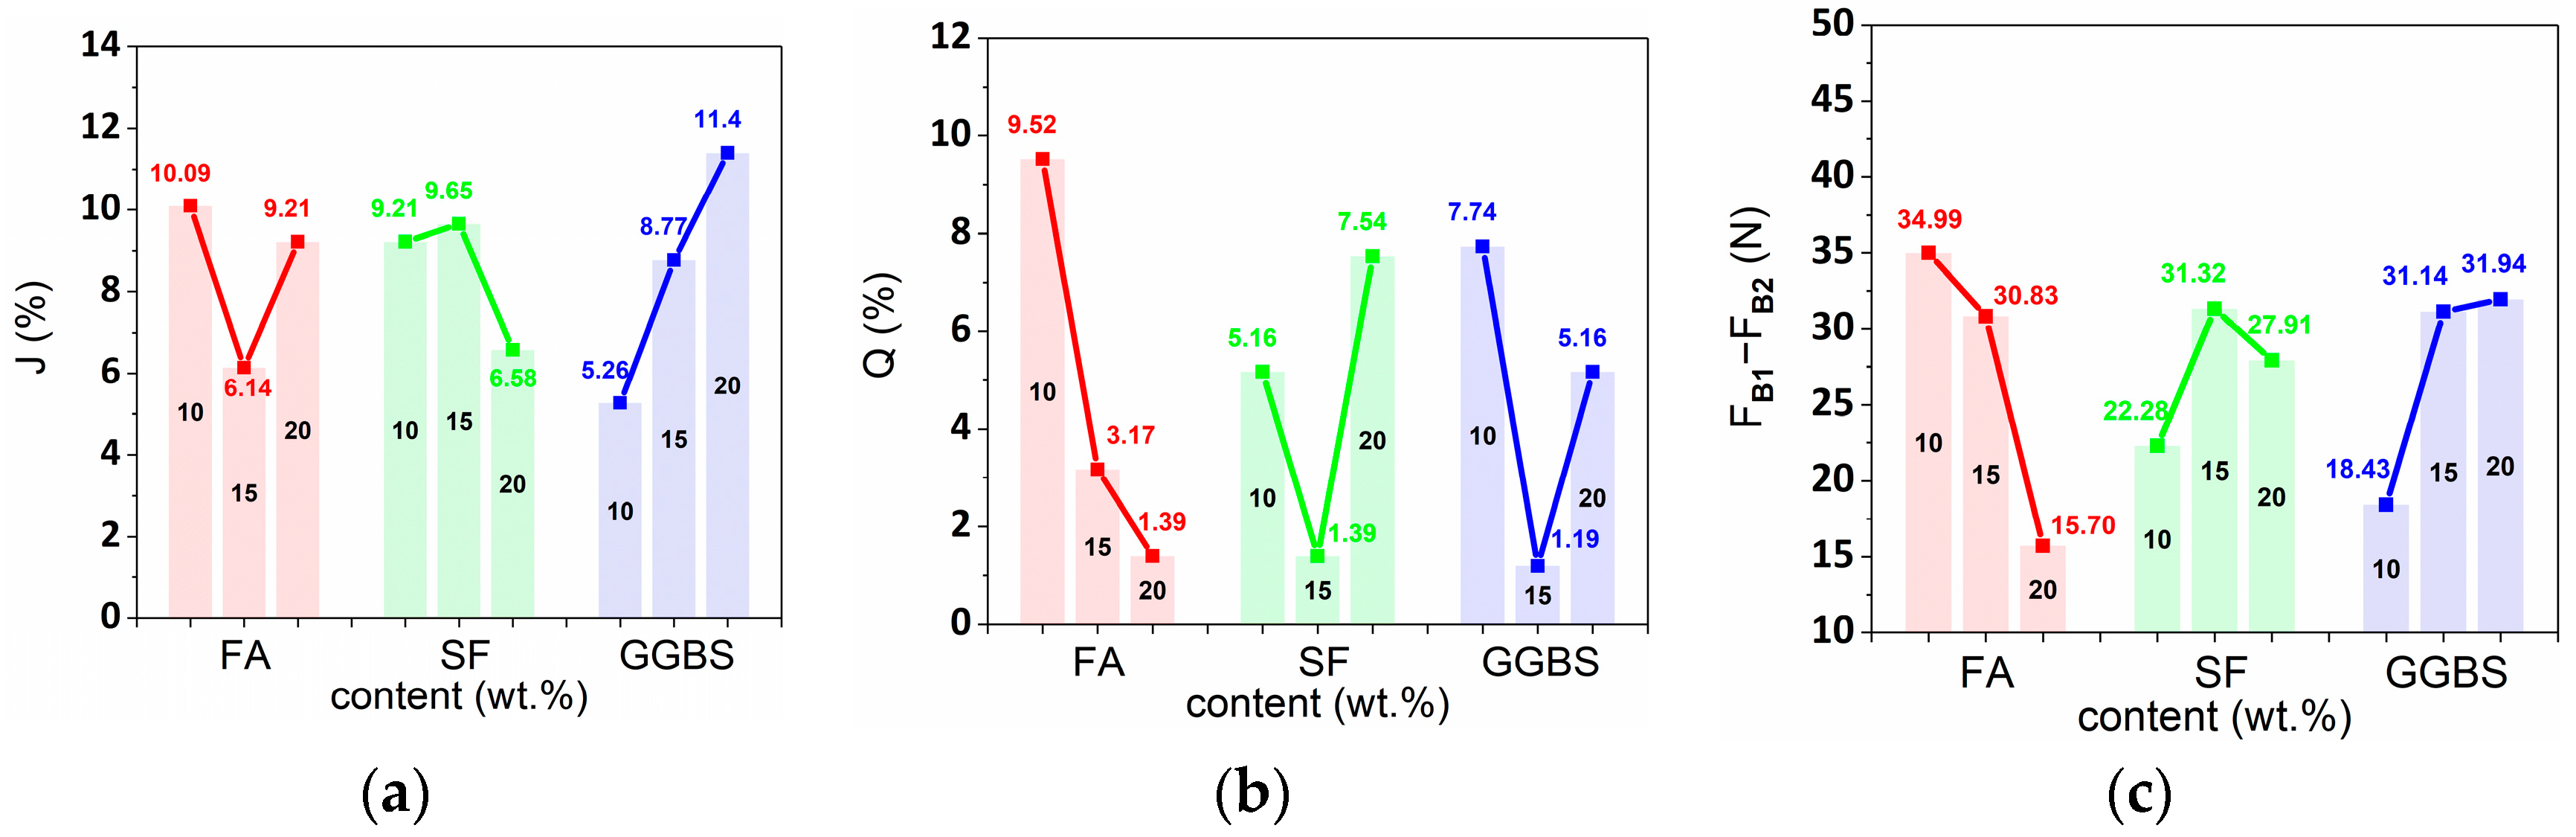
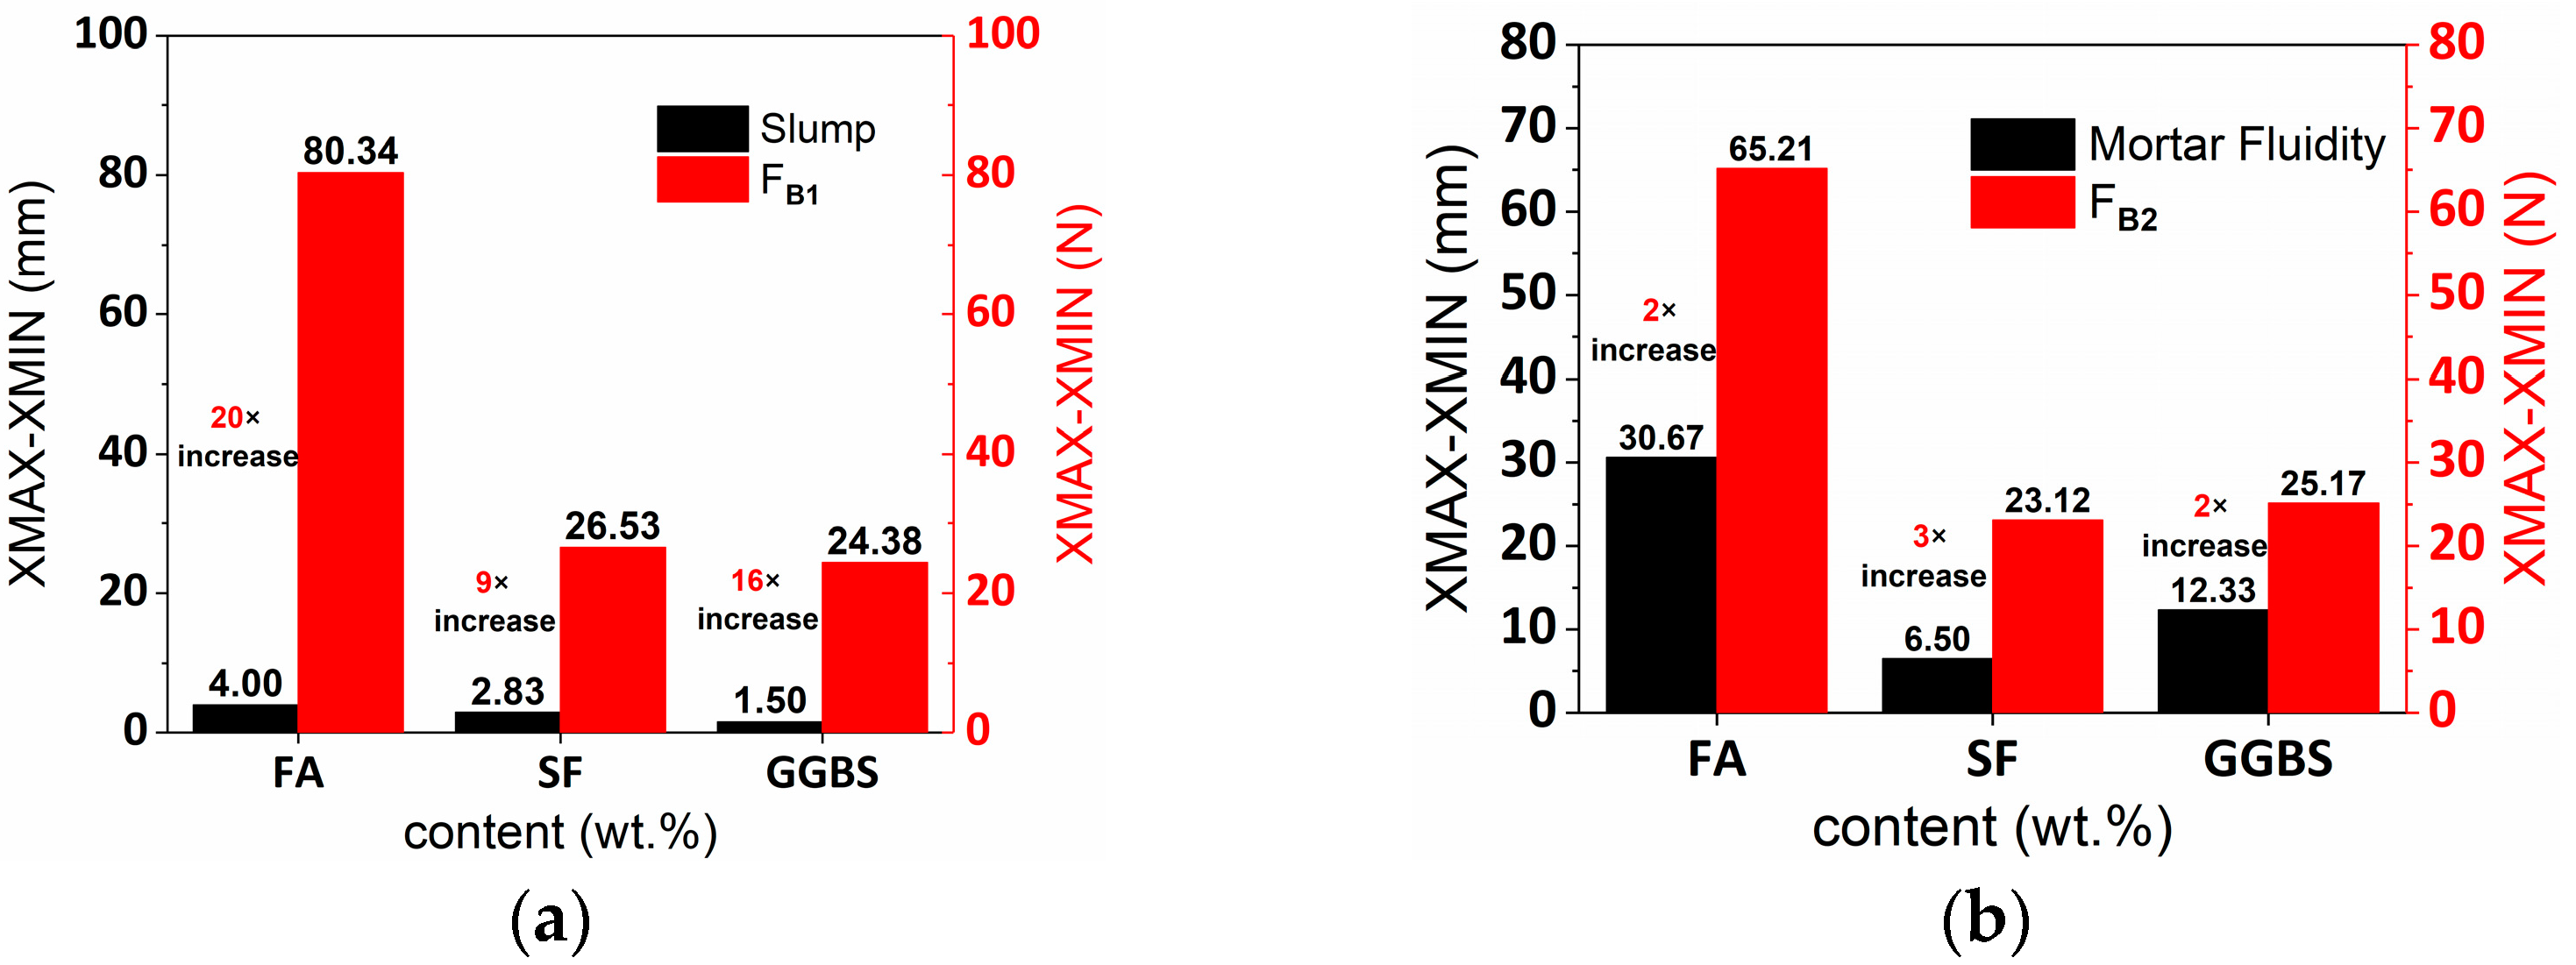
3.2. Analysis of Printable Performance

The printable index of test data and calculation results for this study is summarized in the L9 (33) orthogonal experimental table (Table 5). The average values of FB1, FB2, and FJ were obtained by orthogonal test results and calculation with various FA, SF, and GGBS content, as shown in Figure 10. The FB1 range values of varying content of FA, SF, and GGBS are 80.34 N, 26.53 N, and 24.38 N, respectively, obtaining the influence degree of three industrial wastes on FB1 (FA > SF > GGBS). Meanwhile, the FB2 range values of varying content of FA, SF, and GGBS are 65.21 N, 23.12 N, and 25.17 N, respectively, obtaining the influence degree of FA > GGBS > SF. Furthermore, the FJ range values of varying content of FA, SF, and GGBS are 16.85%, 12.06%, and 19.85%, respectively, achieving the influence degree of GGBS > FA > SF.
Figure 10a,b shows that FB1 and FB2 are primarily influenced by FA and enhanced by 25.88% and 40.18%, respectively, when FA content improves from 10 wt.% to 15 wt.%. Using the FA with low fineness enhances the water demand, thereby enabling yield stress up of material. However, FB1 and FB2 reduce by 50.11% and 50.36%, respectively, when FA content improves from 15 wt.% to 20 wt.% because particles of FA possess smooth surfaces to reduce internal friction between particles. Besides, FA filled the particle voids of materials and revealed the micro-aggregate effect, improving the fluidity of the mortar and reducing the yield stress of the composites when the FA content further increases. The influences of SF and GGBS content are similar to FA for FB1 and FB2. Moreover, the combination of FA, SF, and GGBS leads to water demand reduction, thus reducing the dynamic yield stress of materials and the loss of material fluidity.
Extrusion shaping properties influence the printing parameters design, printable quality, and mechanical capacity of material. The relation of FJ with FA, SF, and GGBS content are negative correlation, positive correlation, and positive correlation, as presented in Figure 10c. Simultaneously, the FJ is up by 38% and 65% when SF and GGBS content enhances from 10 wt.% to 15 wt.%, respectively. For GGBS, its irregular particles, rough surface, and similar average particle size to cement particles improve the viscosity; therefore, enhancing the buildability of mortar. Moreover, the addition of SF enables the viscosity because its high SiO2 content and pozzolanic activity improve heat release and water demand of hydration.
FA content improves from 10 wt.% to 15 wt.% to enable FJ down by 39%, enhancing the extrusion shaping capacity of mortar. However, the variation trends of FJ are slowed with the increase in FA, SF, and GGBS dosage from 15 wt.% to 20 wt.% (reduction by 3%, improvement by 10%, improvement by 22%, respectively).
The average values of J, Q, and FB1FB2 of varying industrial wastes proportions were obtained by orthogonal test results and calculation, as shown in Figure 11. The J range values of varying content of FA, SF, and GGBS are 3.95%, 3.07%, and 6.14%, respectively, obtaining the degree of influence of three industrial wastes on J (GGBS > FA > SF). Simultaneously, the Q range values of varying content of FA, SF, and GGBS are 8.13%, 6.15%, and 6.55%, respectively, gaining the influence degree of FA > GGBS > SF. Consequently, the sequence of influence degree of various industrial wastes on J is the same as FJ because their influence degree depends on the thixotropy of mortar. Meanwhile, the width of extruded material is closely related to the subtract between static and dynamic yield stress. Similarly, the sequence of influence degree of various industrial wastes of Q and FB2 is the same when the rest time between printing layers is almost 0. The deposit height is thus determined by the dynamic yield stress of the printable composites to support the over-layer material of self-weight.
Figure 11a shows that the primary influence of industrial wastes for J is GGBS. Moreover, FJ and J exhibit the same growth trend when GGBS content increase from 10 wt.% to 20 wt.%. The extrusion shaping properties reduce through GGBS content improvement. Thereby, FA, SF, and GGBS contents of the optimal extrudable performance are 15 wt.%, 20 wt.%, and 10 wt.%, respectively, based on the average values of J. Figure 11b shows that the relations between Q and industrial wastes (FA, SF, and GGBS) content are negative correlation, parabola correlation, and parabola correlation, respectively. Additionally, the negative correlation, parabolic correlation, and positive correlation are demonstrated through the relation of FB1FB2 with FA, SF, and GGBS, respectively, as shown in Figure 11c. A positive correlation is achieved by FB1FB2 and Q when the value is within a range of 0 ≤ FB1FB2 ≤ 16N. Q is related to both the FB2 and FB1FB2 of the material. Thereby, printable mortar exhibits the optimum buildability when FA, SF, and GGBS contents are 20 wt.%, 15 wt.%, and 15 wt.%, respectively.

3.3. Sensitivity Comparison Analysis

Figure 12a,b demonstrate that range values between FB1 and slump as well as between FB2 and fluidity have the same influence degree (FA > GGBS > SF and FA > SF > GGBS, respectively). However, the sensitivity of FB1 and FB2 are 9 to 20 times of slump and 2 to 3 times of fluidity, respectively. Furthermore, the accuracy of the digital display instrument is two orders of magnitude higher than the conventional scale. Moreover, FB1 and FB2 tests are more reasonable measurement methods than slump and fluidity tests because they can simulate extrusion processes and reveal high accuracy and sensibility.

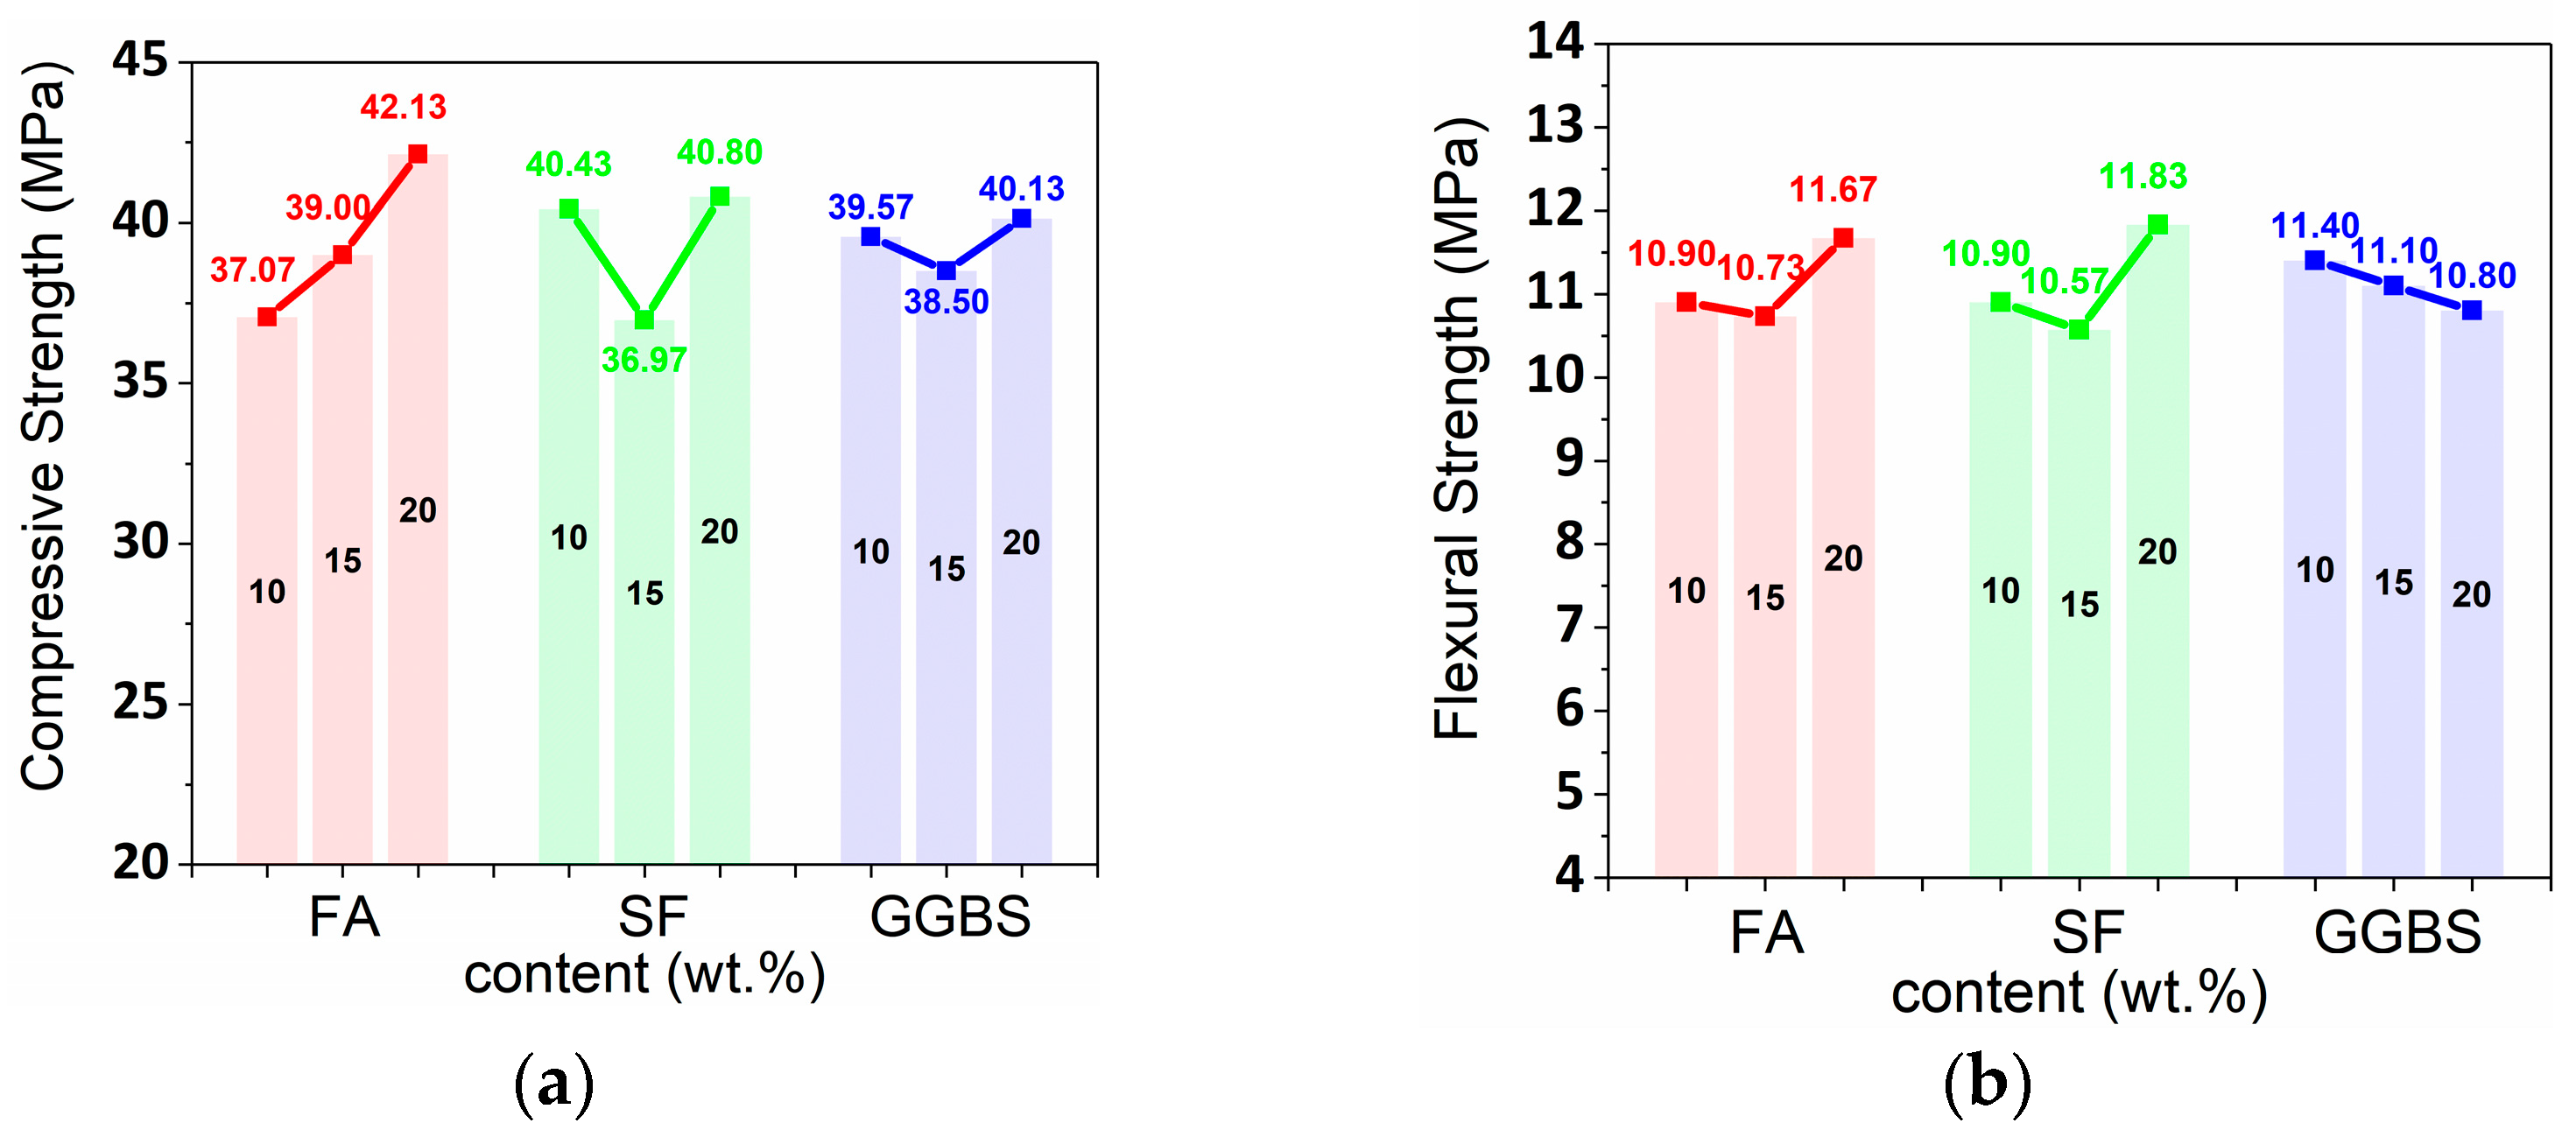
3.4. Analysis of Mechanical Performance

Table 6 shows that the mechanical properties of test data and calculation results for the L9 (33) orthogonal experiment are summarized. The average values of compressive performance and flexural capacity are obtained by orthogonal test results and calculation with various FA, SF, and GGBS content, as shown in Figure 13. The compressive strength range values of various content of FA, SF, and GGBS are 5.07 MPa, 3.83 MPa, and 1.63 MPa, respectively, obtaining the degree of influence of three industrial wastes on FB1 (FA > SF > GGBS). Meanwhile, the flexural strength range values of varying content of FA, SF, and GGBS are 0.93 MPa, 1.27 MPa, and 0.60 MPa, respectively, obtaining the influence degree of SF > FA > GGBS. Figure 13a shows that the relations between compressive strength and industrial wastes (FA, SF, and GGBS) content are positive correlation, parabola correlation, and parabola correlation, respectively. Moreover, the flexural strength is parabola correlation, parabola correlation, and negative correlation with FA, SF, and GGBS contents, respectively, as shown in Figure 13b. Hence, the optimal industrial waste incorporation proportion used in 3DCP is 20 wt.% FA, 15 wt.% SF, and 10 wt.% GGBS, combining extrudable, buildable, mechanical properties. Subsequently, the optimal incorporation proportion of industrial wastes was employed to fabricate samples using 3DCP technology, creating 28-day compressive strength of 56.3 MPa. Therefore, the compressive strength of printed specimens is higher than the cast sample (45.0 MPa) because the deposition impact of 3DCP improves void structure in concrete, exhibiting the homogeneous distribution of air voids and reducing dimensions of the air bubbles. Besides, the flexural strength of printed specimens decreases because the layering effect of printed concrete may influence cracking mode compared with cast samples.

4. Conclusions

This study proposed that a novel method and orthogonal experiment were applied to evaluate the printability of concrete using 3DCP technology when various industrial wastes content were incorporated in materials. Subsequently, the optimum mix proportion combining mechanical and printable capacity was determined to investigate the mechanical properties of printed samples. The following conclusions can be drawn:
(1) The influence degreed of industrial wastes for fluidity and slump are FA > GGBS > SF and FA > SF > GGBS, respectively. The most influential industrial waste (FA) is a positive correlation with both fluidity and slump. However, fluidity and slump as printable evaluation indexes are low sensitivity;
(2) The range values between FB1 and slump as well as between FB2 and fluidity have the same influence degree of FA, SF, and GGBS, respectively. Printable evaluation result exhibits higher sensitivity when FB1 and FB2 replace slump and fluidity, respectively;
(3) Adopting FB1 and FB2 as printability evaluation parameters, an evaluation index of printable performance (FJ, J, and Q) is proposed to investigate the influence of multiple industrial wastes contents. Meanwhile, FA reveals the most influence for FB1, FB2, and Q by applying the range value analysis of the orthogonal experiment. GGBS is the most influential industrial waste for FJ and J;
(4) FA and SF have major influences on the compressive and flexural property of the material, respectively. Consequently, the optimum dosage of FA, SF, and GGBS were 20 wt.%, 15 wt.%, and 10 wt.%, respectively, based on rheological and mechanical property experiments. This was employed to manufacture the sample using 3DCP method, creating a higher compressive strength (56.3 MPa) than cast.

Author Contributions

Conceptualization, B.W. and M.Z.; methodology, B.W. and M.Y.; software, M.Z.; validation, H.Z.; formal analysis, Q.W. and J.H.; investigation, M.Y. and Q.W.; writing—original draft preparation, H.Z. and X.Y.; writing—review and editing, B.W. and H.Z.; visualization, J.H.; supervision, X.W. and M.Y.; project administration, X.Y. and X.W.; funding acquisition, B.W. and M.Y. All authors have read and agreed to the published version of the manuscript.

Funding

The research is supported by Key industry science and technology project of Ministry of Transport in 2020 “Development of Concrete 3D Printing Materials, Equipment and System” (2020-MS1-062).

Institutional Review Board Statement

Not applicable.

Informed Consent Statement

Not applicable.

Data Availability Statement

The data presented in this study are openly available.

Conflicts of Interest

The authors declare no conflict of interest.

References

  1. Zhang, W.; Tang, Z. Numerical modeling of response of CFRP–Concrete interfaces subjected to fatigue loading. J. Compos. Constr. 2021, 25, 04021043. [Google Scholar] [CrossRef]
  2. Huang, H.; Huang, M.; Zhang, W.; Yang, S. Experimental study of predamaged columns strengthened by HPFL and BSP under combined load cases. Struct. Infrastruct. Eng. 2021, 17, 1210–1227. [Google Scholar] [CrossRef]
  3. Zhu, J.; Chen, Y.; Zhang, L.; Guo, B.; Fan, G.; Guan, X.; Zhao, R. Revealing the doping mechanism of barium in sulfoaluminate cement clinker phases. J. Clean. Prod. 2021, 295, 126405. [Google Scholar] [CrossRef]
  4. Sun, J.; Wang, X.; Zhang, J.; Xiao, F.; Sun, Y.; Ren, Z.; Zhang, G.; Liu, S.; Wang, Y. Multi-objective optimisation of a graphite-slag conductive composite applying a BAS-SVR based model. J. Build. Eng. 2021, 44, 103223. [Google Scholar] [CrossRef]
  5. Zhang, C.; Ali, A. The advancement of seismic isolation and energy dissipation mechanisms based on friction. Soil Dyn. Earthq. Eng. 2021, 146, 106746. [Google Scholar] [CrossRef]
  6. Zhao, R.; Zhang, L.; Guo, B.; Chen, Y.; Fan, G.; Jin, Z.; Guan, X.; Zhu, J. Unveiling substitution preference of chromium ions in sulphoaluminate cement clinker phases. Compos. Part B Eng. 2021, 222, 109092. [Google Scholar] [CrossRef]
  7. Xu, D.; Liu, Q.; Qin, Y.; Chen, B. Analytical Approach for Crack Identification of Glass Fiber Reinforced Polymer–Sea Sand Concrete Composite Structures Based on Strain Dissipations. Struct. Health Monit. 2020. Available online: https://journals.sagepub.com/doi/abs/10.1177/1475921720974290 (accessed on 9 February 2022). [CrossRef]
  8. Mou, B.; Bai, Y. Experimental investigation on shear behavior of steel beam-to-CFST column connections with irregular panel zone. Eng. Struct. 2018, 168, 487–504. [Google Scholar] [CrossRef]
  9. Wu, C.; Wu, P.; Wang, J.; Jiang, R.; Chen, M.; Wang, X. Ontological knowledge base for concrete bridge rehabilitation project management. Autom. Constr. 2021, 121, 103428. [Google Scholar] [CrossRef]
  10. Wu, C.; Wu, P.; Wang, J.; Jiang, R.; Chen, M.; Wang, X. Critical review of data-driven decision-making in bridge operation and maintenance. Struct. Infrastruct. Eng. 2020, 18, 47–70. [Google Scholar] [CrossRef]
  11. Hou, L.; Wu, S.; Zhang, G.; Tan, Y.; Wang, X. Literature review of digital twins applications in construction workforce safety. Appl. Sci. 2020, 11, 339. [Google Scholar] [CrossRef]
  12. Liu, J.; Wu, C.; Wu, G.; Wang, X. A novel differential search algorithm and applications for structure design. Appl. Math. Comput. 2015, 268, 246–269. [Google Scholar] [CrossRef]
  13. Wang, L.; Yuan, J.; Wu, C.; Wang, X. Practical algorithm for stochastic optimal control problem about microbial fermentation in batch culture. Optim. Lett. 2019, 13, 527–541. [Google Scholar] [CrossRef]
  14. Xu, S.; Wang, J.; Shou, W.; Ngo, T.; Sadick, A.-M.; Wang, X. Computer vision techniques in construction: A critical review. Arch. Comput. Methods Eng. 2021, 28, 3383–3397. [Google Scholar] [CrossRef]
  15. Singh, V.; Gu, N.; Wang, X. A theoretical framework of a BIM-based multi-disciplinary collaboration platform. Autom. Constr. 2011, 20, 134–144. [Google Scholar] [CrossRef]
  16. Tsai, Y.-H.; Wang, J.; Chien, W.-T.; Wei, C.-Y.; Wang, X.; Hsieh, S.-H. A BIM-based approach for predicting corrosion under insulation. Autom. Constr. 2019, 107, 102923. [Google Scholar] [CrossRef]
  17. Sun, J.; Ma, Y.; Li, J.; Zhang, J.; Ren, Z.; Wang, X. Machine learning-aided design and prediction of cementitious composites containing graphite and slag powder. J. Build. Eng. 2021, 43, 102544. [Google Scholar] [CrossRef]
  18. Sun, J.; Wang, F.; Yao, X.; Ren, Z.; Zhang, G.; Zhang, C.; Chen, X.; Ma, W.; Wang, X. Machine-Learning-Aided Prediction of Flexural Strength and ASR Expansion for Waste Glass Cementitious Composite. Appl. Sci. 2021, 11, 6686. [Google Scholar] [CrossRef]
  19. Sun, Y.; Li, G.; Zhang, J.; Sun, J.; Huang, J.; Taherdangkoo, R. New Insights of Grouting in Coal Mass: From Small-Scale Experiments to Microstructures. Sustainability 2021, 13, 9315. [Google Scholar] [CrossRef]
  20. Ma, W.; Wang, X.; Wang, J.; Xiang, X.; Sun, J. Generative Design in Building Information Modelling (BIM): Approaches and Requirements. Sensors 2021, 21, 5439. [Google Scholar] [CrossRef]
  21. Sun, J.; Wang, Y.; Liu, S.; Dehghani, A.; Xiang, X.; Wei, J.; Wang, X. Mechanical, chemical and hydrothermal activation for waste glass reinforced cement. Constr. Build. Mater. 2021, 301, 124361. [Google Scholar] [CrossRef]
  22. Tang, Y.; Feng, W.; Chen, Z.; Nong, Y.; Guan, S.; Sun, J. Fracture behavior of a sustainable material: Recycled concrete with waste crumb rubber subjected to elevated temperatures. J. Clean. Prod. 2021, 318, 128553. [Google Scholar] [CrossRef]
  23. Sun, J.; Lin, S.; Zhang, G.; Sun, Y.; Zhang, J.; Chen, C.; Morsy, A.M.; Wang, X. The effect of graphite and slag on electrical and mechanical properties of electrically conductive cementitious composites. Constr. Build. Mater. 2021, 281, 122606. [Google Scholar] [CrossRef]
  24. Sun, J.; Huang, Y.; Aslani, F.; Wang, X.; Ma, G. Mechanical enhancement for EMW-absorbing cementitious material using 3D concrete printing. J. Build. Eng. 2021, 41, 102763. [Google Scholar] [CrossRef]
  25. Sun, J.; Aslani, F.; Wei, J.; Wang, X. Electromagnetic absorption of copper fiber oriented composite using 3D printing. Constr. Build. Mater. 2021, 300, 124026. [Google Scholar] [CrossRef]
  26. Sun, J.; Aslani, F.; Lu, J.; Wang, L.; Huang, Y.; Ma, G. Fibre-reinforced lightweight engineered cementitious composites for 3D concrete printing. Ceram. Int. 2021, 47, 27107–27121. [Google Scholar] [CrossRef]
  27. Li, J.; Qin, Q.; Sun, J.; Ma, Y.; Li, Q. Mechanical and conductive performance of electrically conductive cementitious composite using graphite, steel slag, and GGBS. Struct. Concr. 2020, 23, 533–547. [Google Scholar] [CrossRef]
  28. Zhang, J.; Sun, Y.; Li, G.; Wang, Y.; Sun, J.; Li, J. Machine-Learning-Assisted Shear Strength Prediction of Reinforced Concrete Beams with and without Stirrups. Eng. Comput. 2020. Available online: https://link.springer.com/article/10.1007/s00366-020-01076-x (accessed on 9 February 2022). [CrossRef]
  29. Sun, Y.; Li, G.; Zhang, J.; Sun, J.; Xu, J. Development of an ensemble intelligent model for assessing the strength of cemented paste backfill. Adv. Civ. Eng. 2020, 2020, 1643529. [Google Scholar] [CrossRef]
  30. Aslani, F.; Sun, J.; Huang, G. Mechanical behavior of fiber-reinforced self-compacting rubberized concrete exposed to elevated temperatures. J. Mater. Civ. Eng. 2019, 31, 04019302. [Google Scholar] [CrossRef]
  31. Perrot, A.; Rangeard, D.; Pierre, A. Structural built-up of cement-based materials used for 3D-printing extrusion techniques. Mater. Struct. 2016, 49, 1213–1220. [Google Scholar] [CrossRef]
  32. Aslani, F.; Sun, J.; Bromley, D.; Ma, G. Fiber-reinforced lightweight self-compacting concrete incorporating scoria aggregates at elevated temperatures. Struct. Concr. 2019, 20, 1022–1035. [Google Scholar] [CrossRef]
  33. Aslani, F.; Hou, L.; Nejadi, S.; Sun, J.; Abbasi, S. Experimental analysis of fiber-reinforced recycled aggregate self-compacting concrete using waste recycled concrete aggregates, polypropylene, and steel fibers. Struct. Concr. 2019, 20, 1670–1683. [Google Scholar] [CrossRef]
  34. Sun, J.; Huang, Y.; Aslani, F.; Ma, G. Properties of a double-layer EMW-absorbing structure containing a graded nano-sized absorbent combing extruded and sprayed 3D printing. Constr. Build. Mater. 2020, 261, 120031. [Google Scholar] [CrossRef]
  35. Sun, J.; Huang, Y.; Aslani, F.; Ma, G. Electromagnetic wave absorbing performance of 3D printed wave-shape copper solid cementitious element. Cem. Concr. Compos. 2020, 114, 103789. [Google Scholar] [CrossRef]
  36. Arabshahi, M.; Wang, D.; Wang, Y.; Rahnamayiezekavat, P.; Tang, W.; Wang, X. A Governance Framework to Assist with the Adoption of Sensing Technologies in Construction. Sensors 2022, 22, 260. [Google Scholar] [CrossRef] [PubMed]
  37. Ma, G.; Sun, J.; Aslani, F.; Huang, Y.; Jiao, F. Review on electromagnetic wave absorbing capacity improvement of cementitious material. Constr. Build. Mater. 2020, 262, 120907. [Google Scholar] [CrossRef]
  38. Feng, W.; Wang, Y.; Sun, J.; Tang, Y.; Wu, D.; Jiang, Z.; Wang, J.; Wang, X. Prediction of thermo-mechanical properties of rubber-modified recycled aggregate concrete. Constr. Build. Mater. 2022, 318, 125970. [Google Scholar] [CrossRef]
  39. Zhang, G.; Chen, C.; Li, K.; Xiao, F.; Sun, J.; Wang, Y.; Wang, X. Multi-objective optimisation design for GFRP tendon reinforced cemented soil. Constr. Build. Mater. 2022, 320, 126297. [Google Scholar] [CrossRef]
  40. Arabshahi, M.; Wang, D.; Sun, J.; Rahnamayiezekavat, P.; Tang, W.; Wang, Y.; Wang, X. Review on Sensing Technology Adoption in the Construction Industry. Sensors 2021, 21, 8307. [Google Scholar] [CrossRef]
  41. GB175-2007; Common Portland Cement. China Standards Press: Beijing, China, 2007.
  42. GB/T 1596-2017; Fly Ash Used for Cement and Concrete. China Standards Press: Beijing, China, 2017.
  43. GB/T18046-2017; Granulated Blast Furnace Slag Powder for Cement, Mortar and Concrete. China Standards Press: Beijing, China, 2017.
  44. GB/T 18736-2002; Mineral Admixtures for High Strength and High Performance Concrete. China Standards Press: Beijing, China, 2002.
  45. GB/T 14684-2011; Sand for Construction. China Standards Press: Beijing, China, 2011.
  46. GB/T2419-2005; Chinese Standards, Test Method for Fluidity of Cement Mortar. Chinese Standards Association: Beijing, China, 2005.
  47. Le, T.T.; Austin, S.A.; Lim, S.; Buswell, R.A.; Gibb, A.G.F.; Thorpe, T. Mix design and fresh properties for high-performance printing concrete. Mater. Struct. 2012, 45, 1221–1232. [Google Scholar] [CrossRef] [Green Version]
  48. Le, T.T.; Austin, S.A.; Lim, S.; Buswell, R.A.; Law, R.; Gibb, A.G.F.; Thorpe, T. Hardened properties of high-performance printing concrete. Cem. Concr. Res. 2012, 42, 558–566. [Google Scholar] [CrossRef] [Green Version]
  49. ISO 679:2009; Cement-Test Methods—Determination of Strength. International Organization for Standardization (ISO): Geneva, Switzerland, 2009.
  50. GB/T 50082-2009; Standard for Test Methods of Long-term Performance and Durability of Ordinary Concrete. China Standards Press: Beijing, China, 2009.
Figure 1. (a) FA, (b) SF, (c) GGBS, and (d) quartz sand used in specimens of this experiment.
Buildings 12 00374 g001
Figure 2. (a) Flowability experiment, (b) slump test.
Buildings 12 00374 g002
Figure 3. The digital display 3D printing extrudability tester.
Buildings 12 00374 g003
Figure 4. (A) The schematic of digital display 3D printing extrudability tester (a: sensor, b: elastic connecting rod, c: piston rod, d: piston barrel, e: rectangular extrusion nozzle) and (B) the test procedure of printable performance.
Buildings 12 00374 g004
Figure 5. Pumping and extrusion process: (a) the friction of material between the pipe and nozzle, (b) the internal extended shear yield stress. Where f (N) is friction between the material and the inner wall, τ (N) means shear stress of the material, N (N) demonstrates the stress given from instrument inner wall during the extrusion process, F (N) notes resultant of N and f.
Buildings 12 00374 g005
Figure 6. Measure printable filament width.
Buildings 12 00374 g006
Figure 7. Measure deposit height of printable filament.
Buildings 12 00374 g007
Figure 8. (a) Cast sample, (b) compression and flexure integrated testing machine (TYE-300E), (c) printing path model, (d) printing process, (e) compression testing machine (TYE-2000B), (f) printed sample.
Buildings 12 00374 g008
Figure 9. The average values of (a) fluidity and (b) slump cone height ratio with the various content (10%, 15%, and 20%) of FA, SF, GGBS, respectively.
Buildings 12 00374 g009
Figure 10. The FB1 (a), FB2 (b), FJ (c) average values with the various content (10%, 15%, and 20%) of FA, SF, and GGBS, respectively.
Buildings 12 00374 g010
Figure 11. The J (a), Q (b), and FB1FB2 (c) average values with the various content (10%, 15%, and 20%) of FA, SF, and GGBS, respectively.
Buildings 12 00374 g011
Figure 12. (a) FB1 and slump range value comparison, (b) FB2 and mortar fluidity range value comparison.
Buildings 12 00374 g012
Figure 13. The compressive strength (a) and flexural strength (b) average values with the various content (10%, 15%, and 20%) of FA, SF, and GGBS, respectively.
Buildings 12 00374 g013
Table 1. Chemical compositions, specific surface area, fineness of 45 μm sieve residue, and density of the cement, FA, SF, and GGBS (wt.%).
PrecursorsContent (wt.%)Specific
Surface
Area
(m2/kg)
Fineness of 45 μm Sieve Residue (%)Density
(kg/m3)
SiO2Al2O3Fe2O3CaOLossMgOSO3K2ONa2OCl
cement19.4–21.54.1–4.92.8–2.961.9–64.21.9–2.01.1–1.23.0–3.20.6–0.70.1–0.20.01–0.02350–400-2800–3200
FA43–5428–348–130.4–0.51.6–4.71.1–2.30.5–1.22–40.8–1.50.01–0.02-6.7–7.32400–2500
SF93–97--0.26–0.281.0–1.1----0.01–0.0220,000–27,0002.2–4.1320–380
GGBS34.7–38.29.1–10.20.5–0.738.8–40.50.6–0.89.9–11.10.1–1.80.12–0.140.24–0.290.01–0.04420–4805.8–7.52800–2900
Table 2. Main properties of the PVA fibers.
Diameter (μm)Length (mm)Density (kg/m3)Elastic Modulus (GPa)Tensile Strength (MPa)Elongation (%)
3061.2–1.340–421600–16404–6
Table 3. Sample mix proportion of this test.
NumberComponents (wt.%)
CementFASFGGBSSandWaterPolycarboxylate SuperplasticizerPVA FiberHydroxypropyl Methylcellulose
0100000130360.230.210.016
170101010130360.230.210.016
255101520130360.230.210.016
355102015130360.230.210.016
455151020130360.230.210.016
555151515130360.230.210.016
655152010130360.230.210.016
755201015130360.230.210.016
855201510130360.230.210.016
940202020130360.230.210.016
Table 4. Orthogonal experimental table of various test group designs, flow expansion, and slump test data.
Test GroupComponents (wt.%)D (mm)H (mm)
FASFGGBS
1101010130.57.5
210152015811.5
31020151416
4151020154.58.5
5151515142.56.5
6152010144.56.5
720101518714
8201510167.510.5
92020201679
Control00017210.5
Table 5. Summary of printable performance test and calculation results.
Test GroupComponents (wt.%)FB1 (N)FB2 (N)FJ (%)J (%)Q (%)
FASFGGBS
1101010133.5115.915.19%5.26%10.71%
2101520118.880.747.21%18.42%9.52%
3102015129.880.561.24%6.58%8.33%
4151020140.4100.140.26%7.89%3.57%
5151515206.4171.220.56%5.26%−5.95%
6152010134.2117.214.51%5.26%11.90%
720101571.362.314.45%14.47%1.19%
820151093.572.828.43%5.26%0.60%
920202075.257.730.33%7.89%2.38%
Control000233.0185.925.34%13.16%0.00%
Table 6. Summary of mechanical performance test and calculation results.
Test GroupComponents (wt.%)Compressive Strength
(MPa)
Flexural Strength (MPa)
FASFGGBS
110101032.811.1
210152035.710.1
310201542.711.5
415102045.910.1
515151530.210.3
615201040.911.8
720101542.611.5
820151045.011.3
920202038.812.2
Control00025.99.6
Publisher’s Note: MDPI stays neutral with regard to jurisdictional claims in published maps and institutional affiliations.

