1. Introduction
Productivity in the Architecture, Engineering and Construction (AEC) industry has lagged behind other industry sectors for decades [
1]. To address this issue, the AEC industry is increasingly shifting from traditional onsite methods towards modular construction, i.e., the process in which building components are prefabricated offsite, in controlled factory conditions, and subsequently transported and assembled onsite [
2]. The benefits of offsite fabrication have been extensively documented and include faster, safer, and more productive construction processes, as well as higher-quality products with lower risks [
3]. Bertram et al. [
4] reported modular construction savings to range between 20 and 50% for construction duration and more than 20% for construction cost. Moreover, repeatability in modular construction increases material recycling and reuse potential after disassembly. Combined with the higher coordination of processes within the construction facility and the optimised logistics of just-in-time delivery, this results in less waste and more sustainable projects [
5,
6].
Modular construction dates back to centuries ago [
7], even though, only recently, modularity has been receiving a new wave of attention and investment due to recent technological advances in the AEC industry, which allow for the delivery of more sophisticated and complex projects. Among them, the rise of Building Information Modelling (BIM) has been enabling the increased use of prefabrication and modular construction by providing better opportunities for collaboration and coordination, potentiating the integration between design and construction [
8].
Nevertheless, despite the potential advantages of modular construction, it is still unpopular among many clients due to the relatively high degree of standardisation and repetition that is often required to achieve economies of scope and, thus, sufficiently reduce costs [
9]. One solution for this problem is to adapt modular strategies to an existing design instead of adjusting the design to modularity—also known as modularisation.
The term modularisation is used here to refer to the process of decomposing a building’s design into standardised units for offsite fabrication while preserving the essence of the original design. This process is usually heuristic in the AEC industry, where modules are identified on a project basis derived from the designer’s or engineer’s experience [
10]. This is not a trivial task since each architectural project is unique and usually requires custom modularisation solutions. Moreover, the identification of modules can be highly subjective and dependent on the goal of the modularisation (e.g., functionality, manufacturing, costs).
Modularisation is often driven by contractor companies, which gain from the increased productivity. However, since these entities are frequently brought into a project at the end of the design process [
11], they have limited input in the design, which constitutes a significant handicap regarding the successful implementation of modularisation techniques. Most notably, the post-design modularisation of non-modular projects may require complex and time-consuming rationalisation processes, leading to construction/delivery delays and increased costs, something that can be significantly improved by combining automation with the modularisation process [
12].
To tackle this, the present article proposes a machine learning-based methodology, which was developed and applied to a case study of 233 bathrooms on a residential complex building. A requirement for this project was for the user to have control over the automated procedure and be able to establish the goals and rules for the modularisation. To address this requirement, a semi-supervised clustering algorithm, COP-KMEANS [
13], was implemented to group individual rooms with similar characteristics, using user feedback over the results to guide the algorithm and ultimately improve its overall accuracy. In the end, the methodology returns the original rooms classified by the obtained clusters while identifying a base module to represent each cluster. The proposed methodology can be applied during the pre-construction phase, thus reaping the benefits of modular construction while preserving the essence of the design of the building.
Apart from this introductory section, this research is organised as follows:
Section 2 provides the theoretical background needed to contextualise the paper, focusing on modularisation techniques;
Section 3 explains the developed semi-supervised methodology;
Section 4 presents a case study where both the manual modularisation process and the proposed methodology are applied;
Section 5 discusses both approaches, comparing them while examining the acquired results; and, finally,
Section 6 presents the conclusions.
2. Literature Review
2.1. Modularisation in the AEC Industry
While modularisation has been thoroughly researched and successfully incorporated in various industries, including automotive [
14], aerospace [
15], product design [
16,
17] and systems design [
18], studies on modularisation in the AEC industries are rare to find.
In [
9,
19], Isaac et al. developed a graph-based hierarchical clustering methodology for decomposing a building’s design into modules according to their relative replacement rates. Although this study addresses module interchangeability and ease of replacement, its main focus is on standardising interfaces between modules rather than the modules themselves.
In another study, Mohamad et al. [
20] proposed a modularisation method for one-off projects. It is based on the subdivision of the building into a grid, which aligns the building’s geometry and components, subsequently using the grid boundaries to extract and standardise modules—reducing the variety of building components. While flexible and adaptable to multiple projects, the proposed method is entirely manual and, thus, laborious to implement.
Regarding the modularisation of Mechanical, Electrical and Plumbing (MEP) systems, Tserng et al. [
21] applied a rule-based processing technique to decompose MEP systems into smaller constructible modular components. Further focusing on these systems, Samarasinghea et al. [
10] combined a Dependency Structure Matrix with hierarchical clustering to identify the optimal number of modules and module division points based on the assembly and handling cost of each module. Finally, Medjdoub et al. [
22] proposed an interactive user interface that uses Constraint Logic Programming to generate 3D variational piping solutions for low-pressure hot water plant rooms. Their interface is based on a topological solution, refined to form a compatible geometrical solution.
Of the above studies, only Isaac et al. [
9,
19] present a systematic and automated procedure for the modularisation of building designs. However, as previously stated, the authors focus on the interface between modules rather than the modules themselves. The methodology presented in this paper seeks to address this gap by targeting the modularisation of room modules.
2.2. Constrained Clustering
As seen throughout the cited articles in
Section 2.1, a popular approach to modularisation is clustering.
Clustering attempts to group data instances into subsets according to a defined distance measure so that similar instances are grouped while dissimilar instances are arranged into different groups [
23]. This efficient process of organising instances is multi-disciplinary, ranging from mathematics and statistics to biology and genetics [
24].
Within the fields of machine learning, data mining, and pattern recognition, to cite a few, clustering is considered an unsupervised learning method that involves training an algorithm to identify similarities and patterns in unlabelled data [
25,
26]. A popular approach is to identify these similarities by minimising intra- and inter-cluster distances [
27]. However, this may not always be the preferred and better result from a user’s point of view.
To this end, semi-supervised learning is an approach that combines labelled and unlabelled data in order to improve the learning accuracy significantly [
28]. This labelled data may take the form of user feedback during the labelling process.
An example of this approach is constrained clustering, a semi-supervised extension to clustering where domain knowledge is introduced through constraints to guide the algorithm into convergence [
29]. These constraints are usually expressed as pairwise statements indicating that two items must (ML), or cannot (CL), be linked and placed into the same cluster. Constrained clustering algorithms can be integrated into six categories: K-means, Metric Learning, Spectral Graph Theory, Declarative, Ensemble, and Collaborative. Each of these categories and its comprised algorithms, suitable metrics, and challenges were thoroughly reviewed by Gançarski et al. [
30].
Concerning K-means [
31] approaches, the objective function can be modified to either enforce pairwise constraints or define preferential constraints associated with penalties. An example of the former is COP-KMEANS, an algorithm introduced by Wagstaff et al. [
12], which is a variation of K-means with the additional incorporation of instance-level constraints provided by the user. An example of the latter is Constrained Vector Quantisation Error (CVQE), an algorithm introduced by Davidson et al. [
32] that attempts to minimise constraints by modifying the error function, making it more costly to violate the constraint than to satisfy it.
3. Methodology
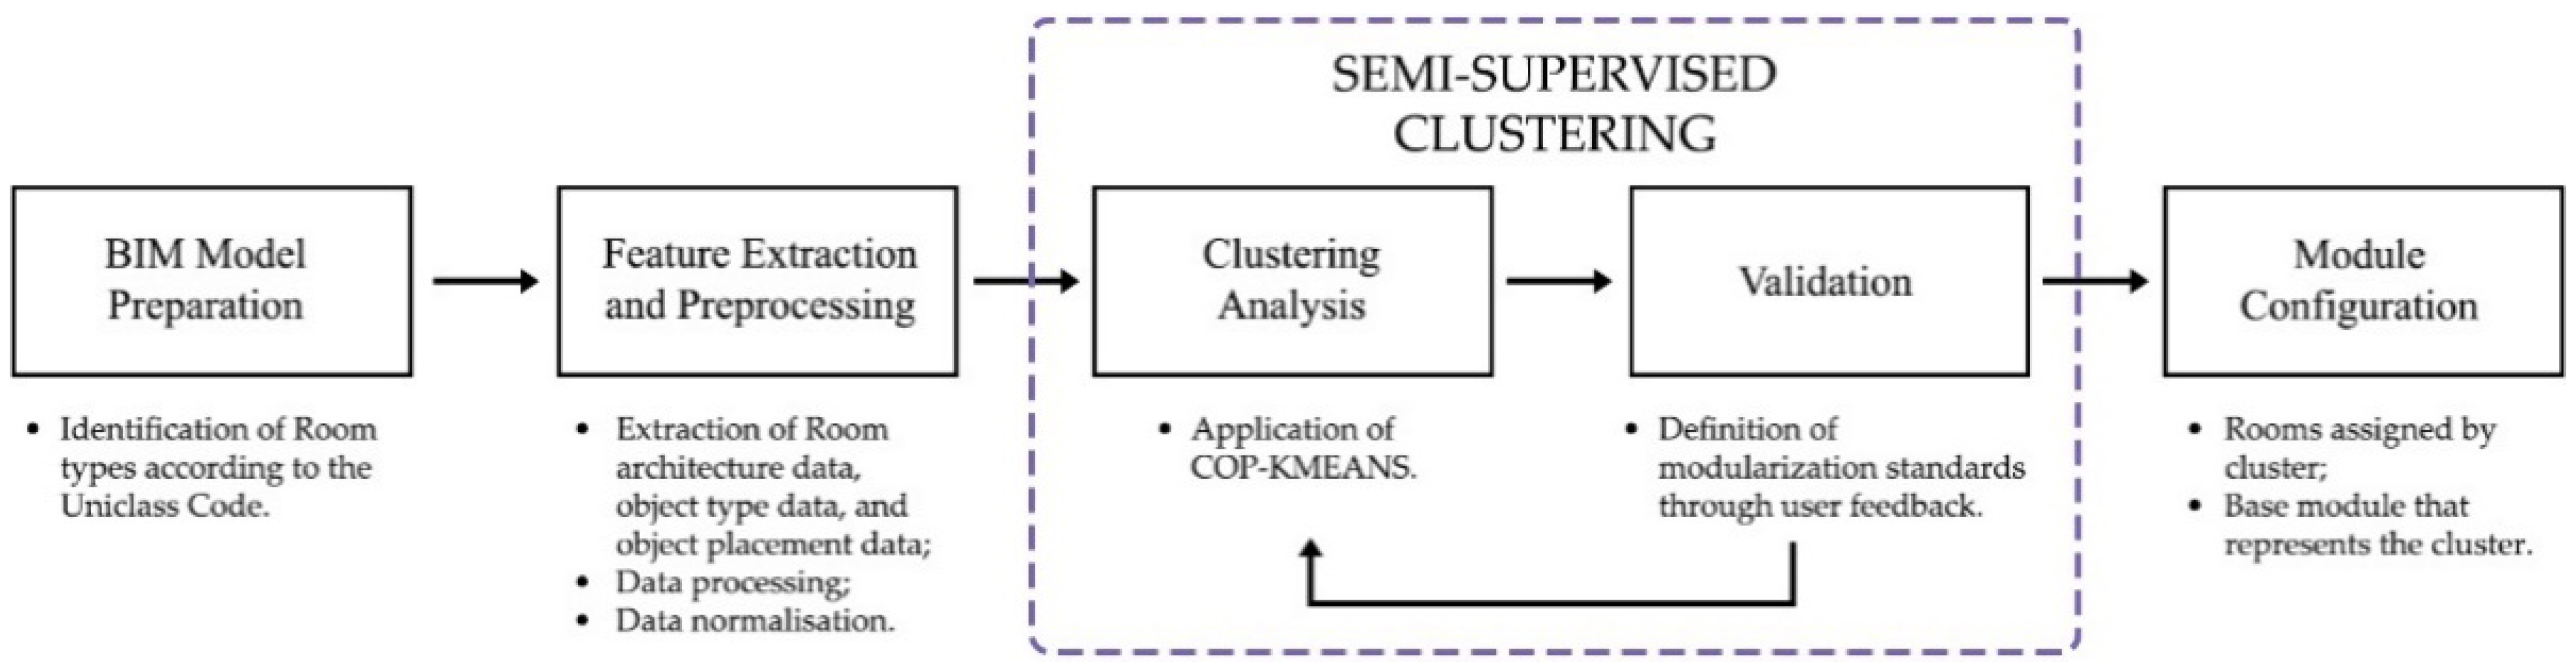
A semi-supervised methodology was developed based on the clustering of room data and subsequent user validation of the obtained clusters, resulting in the identification of a set of modules that can be industrialised for manufacture. As illustrated in
Figure 1, this methodology takes a previously prepared BIM model as input, extracting and preprocessing the model’s information to feed it into a semi-supervised clustering algorithm. This clustering analysis calculates the similarity between rooms, subsequently grouping them into distinct clusters. Afterwards, rooms with higher uncertainty in their clustering assignment are manually validated, with the user identifying the correct and incorrect cluster attributions. The user feedback is then accounted for in a new algorithm iteration. This process is iteratively repeated until a satisfactory solution is found. Finally, the methodology outputs the original rooms labelled by the obtained clusters, as well as the centres of the clusters, which serve as the modules’ base configuration.
This methodology was implemented as a plugin for the software Autodesk Revit, using C# to connect to Revit’s Application Programming Interface (API) and Python as the basis for the developed semi-supervised clustering model. The different stages of the process are explained in greater detail in the following sections.
3.1. BIM Model Preparation
As previously mentioned, the proposed methodology uses a BIM model as input, extracting room data from the model and using this data to calculate potential modularisation solutions. However, the BIM model must conform to a few modelling rules before beginning the data extraction process. Most notably, since the modularisation process is applied to rooms, the
Room category within the software needs to be modelled appropriately. Moreover, each room must be identified with a Uniclass Code [
33] (a unique parameter used to distinguish between different types of spaces) to allow for the selection of room types to be clustered. It should be stated that although the clustering analysis can be run on different types of rooms simultaneously, this process can lead to undesired clustering results, given that the inherent differences between room typologies can easily overshadow the differences between rooms of the same type.
3.2. Feature Extraction and Preprocessing
Once the BIM model is ready, the room information can be extracted for analysis. This information consists of the features deemed relevant to describe the room’s architecture and can be classified into three categories: (1) room architecture; (2) object type data; and (3) object placement data.
The first category,
room architecture, considers the general size and shape of the room and includes information about the room’s length, width, height, area, perimeter, and number of walls. To make these dimensions invariable to room rotation and orientation, the length and width are considered as the higher and lower dimensions of the room, respectively. These two features are extracted using the rooms’ object-aligned minimum bounding box [
34].
The second category, object type data, describes the room’s architectural features (i.e., doors, windows, furniture, and equipment) through quantitative and descriptive information, such as their typologies within the modelling software. As an example, consider the furniture/equipment of the following bathrooms:
Bathroom_1—one toilet, one sink, one shower;
Bathroom_2—one toilet, two sinks, one shower, one bidet;
Bathroom_3—one toilet, one sink, one bathtub.
Although bathroom_1 is easily distinguishable from bathroom_2 using the amount of sanitary equipment, it cannot be distinguished from bathroom_3 using this information solely. As such, to account for such differences, a vectorisation algorithm (CountVectorizer [
35]) is used to encode the different typologies into categorical data, subsequently transforming this categorical data (types) into numerical data (vectors). This method gives us a multidimensional numerical feature space on which the clustering analysis can be applied. Returning to the previous example, the bathrooms would be represented by the vectors shown in
Table 1.
Finally, the third category, object placement data, supplies information about the furniture and equipment placement within the room. To do so, the distance between the object’s placement point and the room centre is first calculated, making it invariant to different room orientations. Using this method, rotated or symmetric rooms are more likely to be placed in the same cluster since the distance to the room centre is equal, even though their orientation is different. Then, several metrics are extracted from the calculated distances to characterise the room, namely mean, standard deviation, sum, minimum, and maximum. These metrics are used in opposition to the distances themselves since, after initial trials, their use showed significant improvements in the clustering performance.
Once all room data is extracted, they are normalised and sent to the clustering analysis.
3.3. Semi-Supervised Clustering
3.3.1. Clustering Analysis
The semi-supervised clustering is applied as an iterative process with two distinct phases: the clustering analysis and the user validation. The first calculates the room clusters using the extracted data. The second validates the results of the output clusters by classifying rooms as correctly or incorrectly assigned.
To comply with the requirement of allowing user control over the automated procedure (
Section 1), the user takes an active part in choosing constraints, with the clustering analysis following a K-means approach based on the Constrained K-means algorithm (COP-KMEANS). This approach was chosen over setting penalties due to the need for constraints to be mandatory instead of preferential. These constraints translate the user’s a priori knowledge about the dataset, identifying which instances should or should not be grouped. Two types of pairwise constraints can be supplied: (1) must-links, which specify two instances that must belong in the same cluster, and (2) cannot-links, which specify two instances that cannot belong to the same cluster. Algorithm 1 contains the algorithm for COP-KMEANS as described in [
12], where
symbolises the input dataset,
the number of clusters,
the set of must-link constraints, and
the set of cannot-link constraints.
| Algorithm 1 COP-KMEANS |
COP-KMEANS (dataset , number of clusters , must-link constraints , cannot-link constraints )
Initialise the cluster centroids randomly.
For each point in , assign it to the closest cluster such that VIOLATE-CONSTRAINT (, , , ) is false. If no such cluster exists, fail (return { }).
For each cluster , update its centre by averaging all the points that have been assigned to it.
Iterate between (2) and (3) until convergence.
.
VIOLATE-CONSTRAINT (data point cluster must-link constraints , cannot-link constraints )
For each , return true.
For each , return true.
Else, return false.
|
It should be stated that during the base iteration of the clustering analysis stage and since there is no user feedback yet (only provided during the validation stage—
Section 3.3.2), the COP-KMEANS algorithm resets to the original K-means, such that the VIOLATE-CONSTRAINT condition is never checked. In the remaining iterations, it works as stipulated in Algorithm 1.
Additionally, since the algorithm also requires the manual selection of the number of clusters , which might be an unknown variable, the proposed implementation assesses multiple values of during the clustering analysis so that , where and . For higher user control, these values may be modified by the user.
To select the best
value within this range, each set of clusters provided by
is compared by calculating their Silhouette Coefficient
. The Silhouette Coefficient [
36] is calculated using the average intra-cluster distance (
) and the average inter-cluster distance (
) for each sample. Both are calculated according to the Euclidean distance. As such, the Silhouette Coefficient for a sample is given by:
and in one formula, (1) can be simplified as:
The result is a value between
and
, where
means that the cluster is dense and well separated from other clusters;
represents overlapping clusters; and
indicates that the samples might have been assigned to the wrong clusters. By averaging all samples’ Silhouette Coefficients, a Silhouette Score is acquired for the overall clusters [
35]. This score is used to select the best resulting clusters provided by
(i.e., the Silhouette Score closest to
), which are then sent to the validation stage.
3.3.2. Validation
The validation step allows the user to gain more control over the clustering algorithm results, helping them to understand how similar two rooms must be in order to be part of the same cluster and, thus, the same module. This process indirectly establishes the rules for modularisation.
Only a given percentage of the most dissimilar rooms (i.e., the furthest rooms from the cluster centroid) are shown during the validation process to avoid overloading the user with information. As with the
values (
Section 3.3.1), this dissimilarity percentage may also be defined by the user.
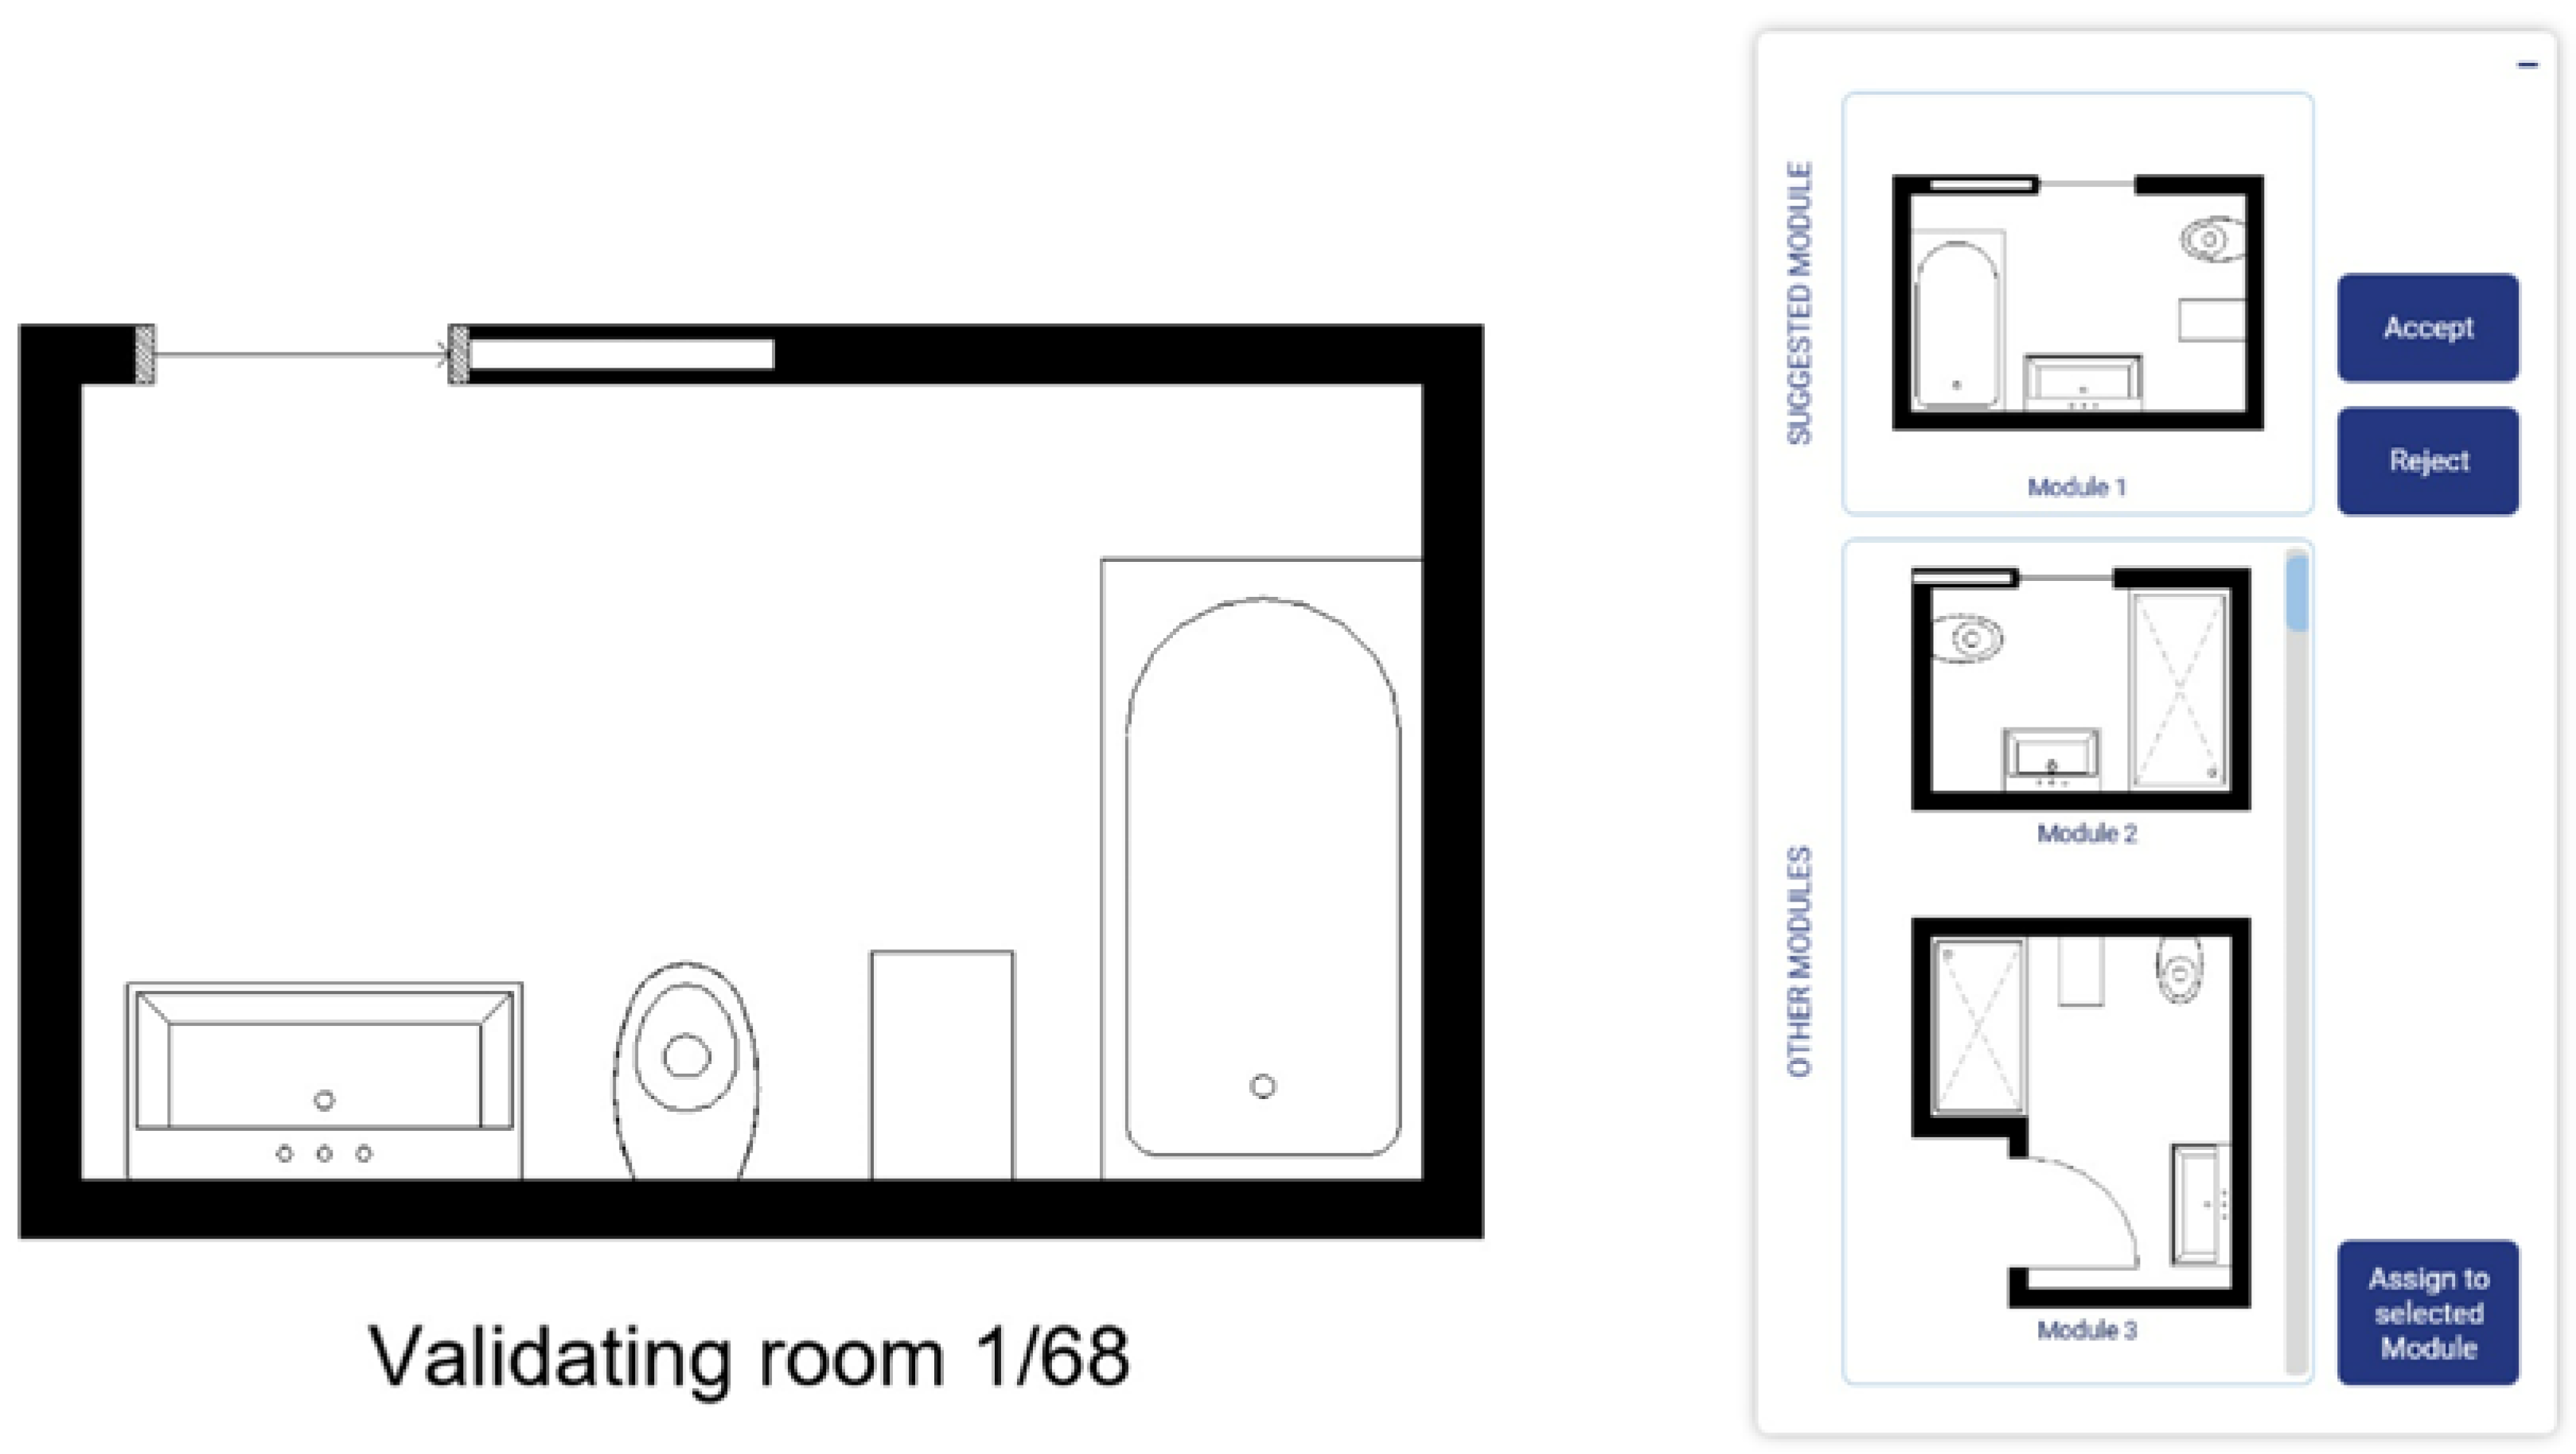
Using this percentage, the rooms considered dissimilar are validated one-by-one, as illustrated in
Figure 2. As shown, the user can either:
Accept the suggested cluster placement;
Reject the suggested cluster placement; or
Assign the room to another cluster than the suggested one.
Accepting or assigning a room to a specific cluster (options 1 and 3) creates a must-link constraint between the room being validated and the room representing the centroid of the suggested or assigned cluster. Rejecting the suggested cluster placement (option 2) creates a cannot-link constraint between the two.
With this information, the validation stage is complete and a new iteration is started by the COP-KMEANS algorithm, where the user feedback is taken into account during the cluster assignment. This iterative process can be run multiple times until a satisfactory solution is found. After a solution is found, the user carries out a final validation, in which rooms may be moved between clusters manually.
It should be stated that user feedback crosses over iterations, meaning, for instance, that constraints created in the first iteration are kept until the end of the semi-supervised clustering process. To this end, once a room is validated with a must-link, it will not be shown again for validation in the following iterations, even if it falls within the dissimilarity percentage. Meanwhile, the same is not valid for cannot-links, which may appear in further validations. This will guarantee that the user does not wrongly classify a pair of connected rooms as must-link and cannot-link in different iterations, which could potentially cause a constraint violation.
3.4. Module Configuration
Once a clustering solution is found, all rooms will have their own assigned cluster, and a module representative of each cluster can be derived from each group. This module corresponds to the centroid of the cluster. Since all room data has already been extracted in a previous step, the BIM model of each cluster’s representative module can then be automatically generated. With these results, the user can refine the modular structure and details of each module for construction planning, confident that the obtained module can be used to replace the original non-modular rooms of the corresponding cluster. Minor discrepancies between the original room and the obtained module will have to be solved manually. Finally, the obtained modules can also be uploaded to a module library and stored for use in future projects.
4. Case Study
The proposed methodology was demonstrated on a case study of a residential complex with 106 apartments, distributed over six blocks of up to three floors. The project was a large-scale investment, including up to two hectares of construction area, private gardens, and other outdoor activity spaces.
During the pre-construction phase, potential for modularisation and industrialisation was identified for the 233 bathrooms of the project since they contained similar structural and wall systems. Additionally, bathrooms have more facilities per square metre than other room types, making their modularisation have a greater impact on construction costs and delays. This post-design modularisation was carried out manually by the contractor company and consisted of rationalising the design to find a set of bathroom typologies that could be grouped and standardised as modules to be manufactured. This manual modularisation was used in this case study as a baseline to evaluate the proposed methodology.
4.1. Manual Modularisation by the Contractor Company
The manual modularisation carried out by the contractor company consisted of manually comparing each of the 233 bathrooms’ architecture in the project to find similarities. Through this comparison, bathrooms were firstly grouped based on room shape and dimensions and, secondly, based on the layout disposition of the furniture and equipment in the room. Inside the same group or cluster, minor dissimilarities such as room symmetry or slight variations in furniture spacing were allowed.
In the end, the 233 unique bathrooms were reduced to 46 groups of bathrooms that could, with minimal design changes, be adapted to industrialise their manufacture. The findings were summarised in an Excel sheet, which listed all the rooms, their respective dimensions, and the assigned group. This information was also stored in a CAD file, which further contained all bathroom floorplans and the proposed module for each group.
This process was complex and time-consuming, taking the contractor company over two months to complete with a two-person team. However, it still allowed them to significantly reduce construction costs and improve productivity with offsite fabrication.
4.2. Automated Modularisation Using the Proposed Methodology
As stated in the BIM modelling preparation (
Section 3.1), all bathrooms in the BIM model were identified with their Uniclass Code, i.e.,
SL_35_80_08. Using this information, room data was automatically extracted and preprocessed according to the methods explained previously.
The clustering analyses were run for the interval of 36–56 clusters (±20% clusters compared to the manual validation), with a dissimilarity percentage of 60% for validation. This percentage gradually increased by 5% with each iteration to accelerate the convergence speed. This percentage means that only the modules with a dissimilarity percentage of over 60% would be validated during the validation phase. The semi-supervised clustering analysis was then run until a satisfactory solution was found.
Between each clustering iteration, various metrics were used to measure the algorithm’s performance against the ground truth, which was given by the result of the manual modularisation. Among them, the Normalised Mutual Information Score (NMI) and Adjusted Mutual Information Score (AMI) [
37] measure the agreement between two assignments (predicted labels vs. ground truth), ignoring permutations. They differ in the fact that AMI is adjusted for chance. The Rand Index (RI) and Adjusted Rand Index (ARI) [
38] were also considered but ultimately not used since, according to Romano et al. [
39], these metrics are more suitable for large, equal-sized clusters, which was not the case for the present problem.
The remaining recorded measures included Homogeneity and Completeness [
40], which allowed for a more intuitive analysis of the results. Namely, the first metric indicated whether each cluster only comprised members of a single class, while the second indicated whether all members of a given class were assigned to the same cluster.
5. Results and Discussion
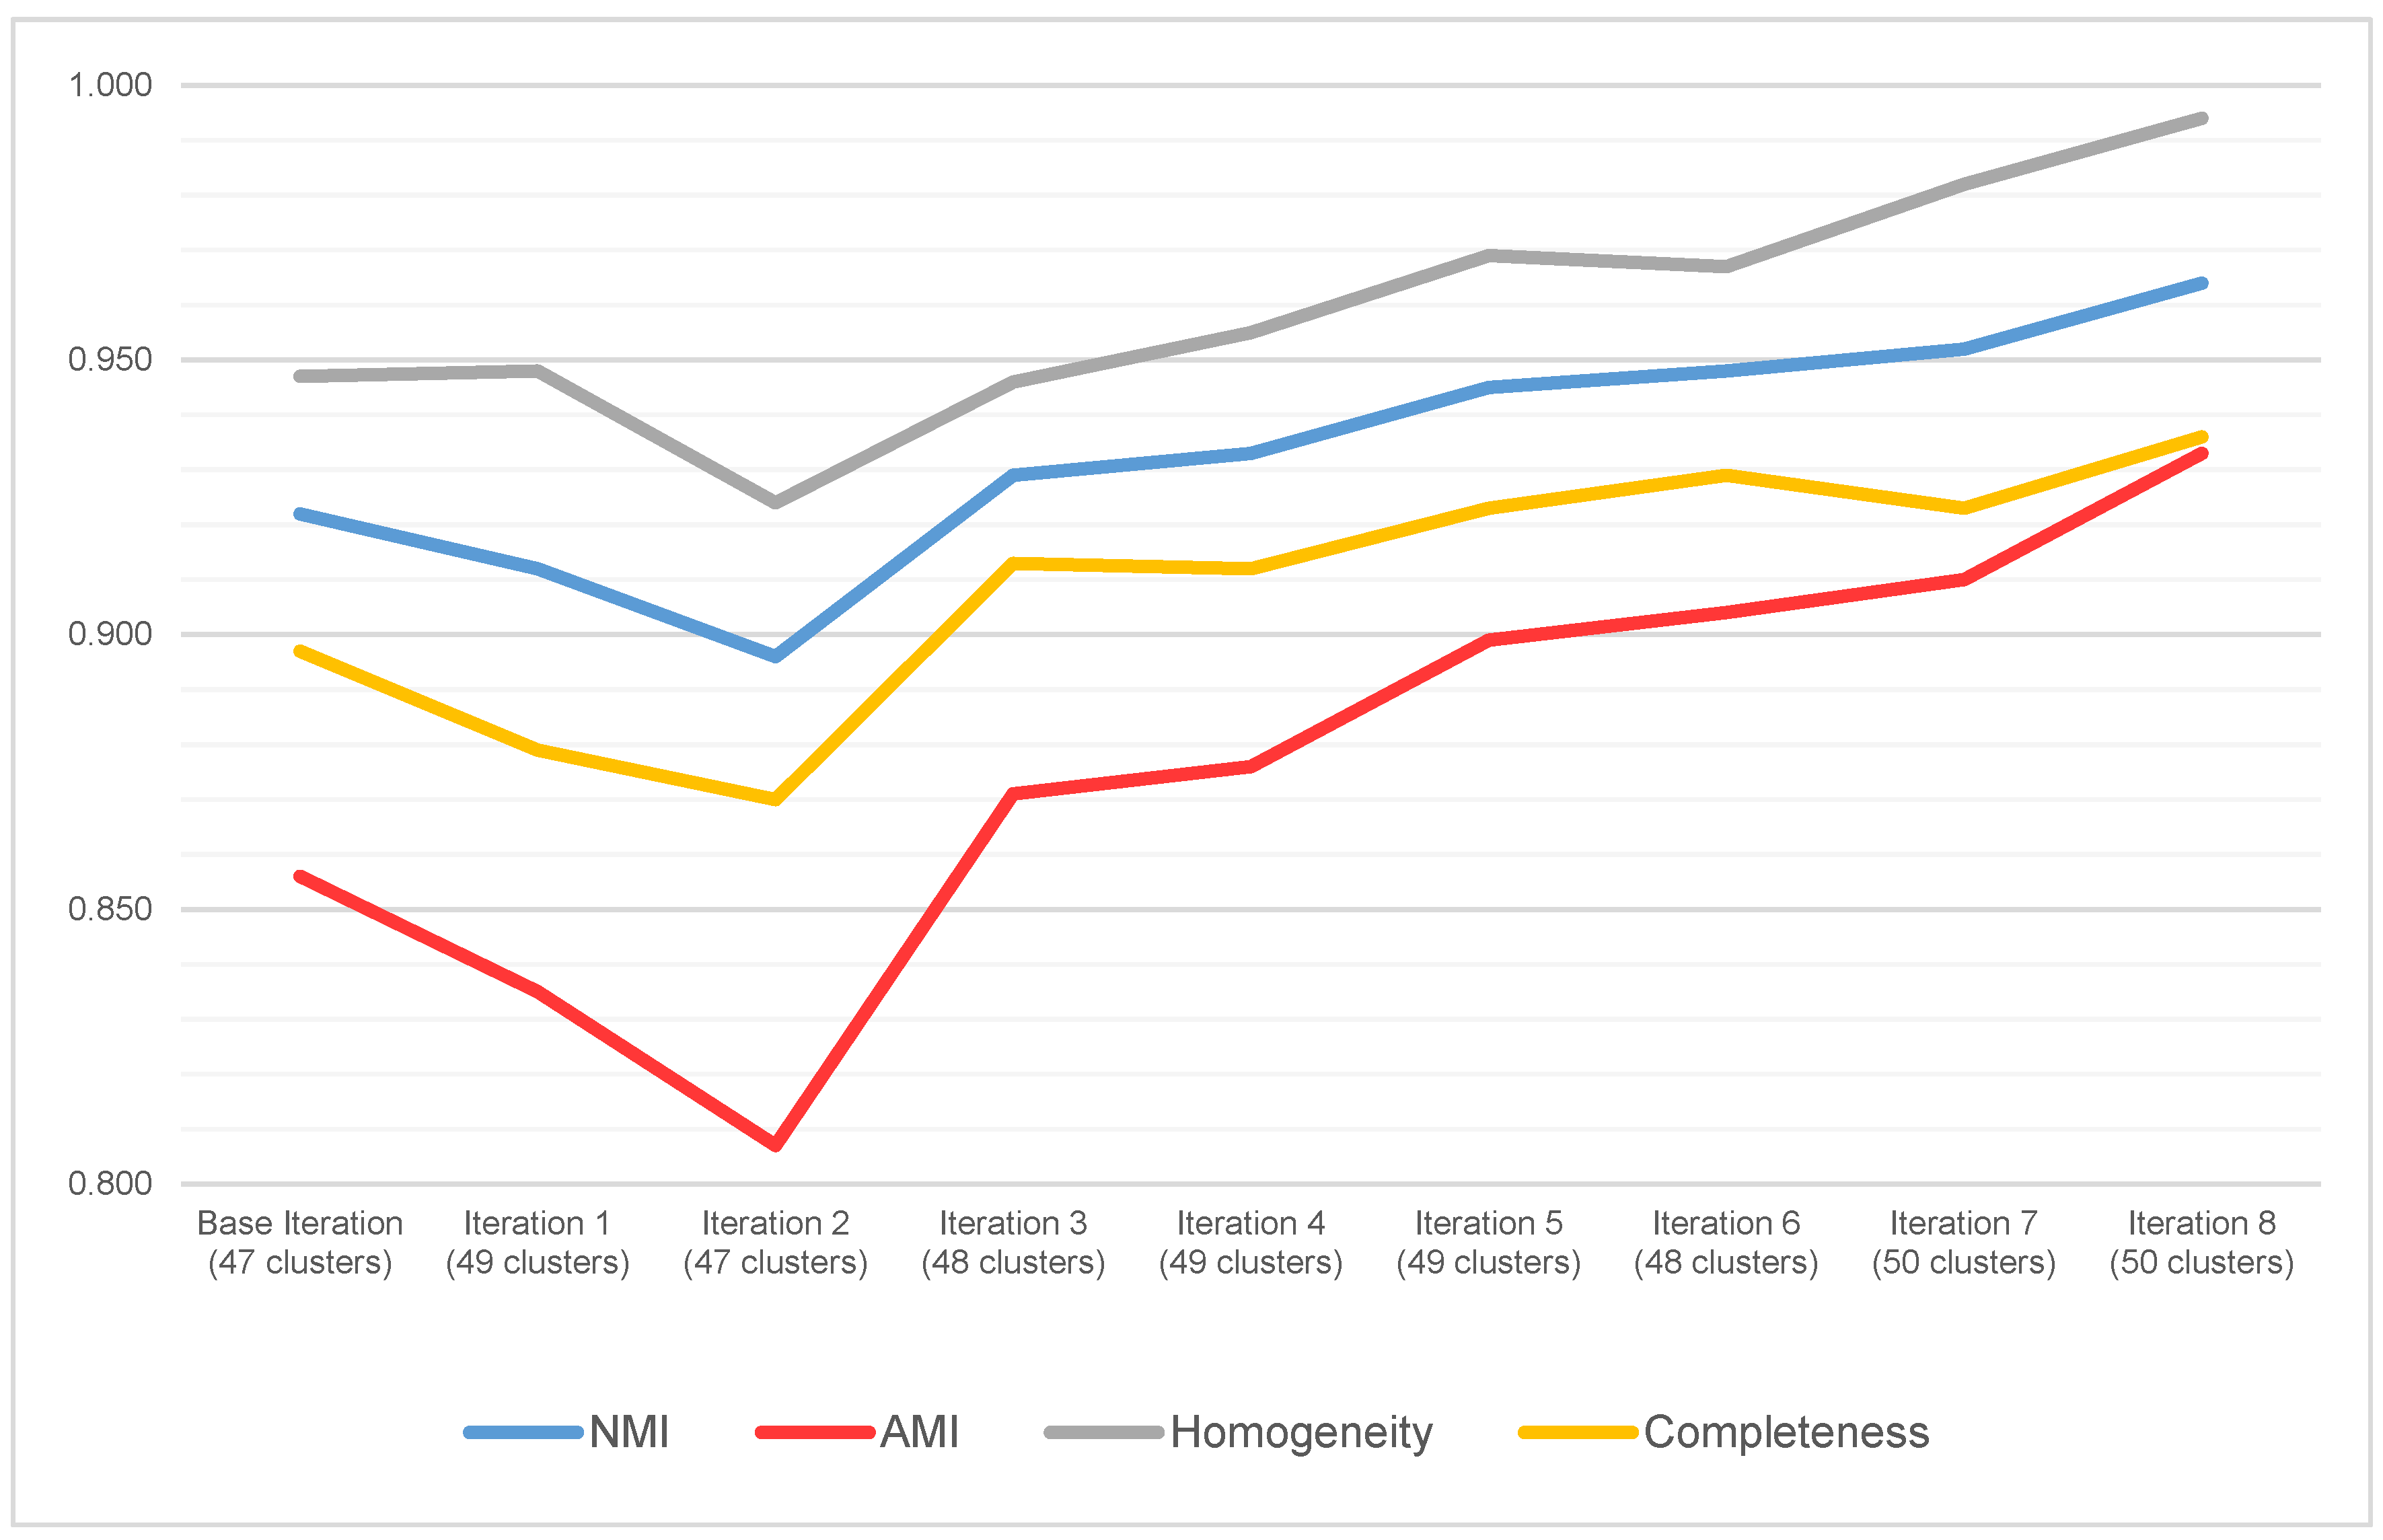
Figure 3 summarises the results of applying the proposed methodology to the present case study. It includes the acquired values of NMI, AMI, Homogeneity, and Completeness for each iteration and the optimal number of clusters given by the Silhouette Score.
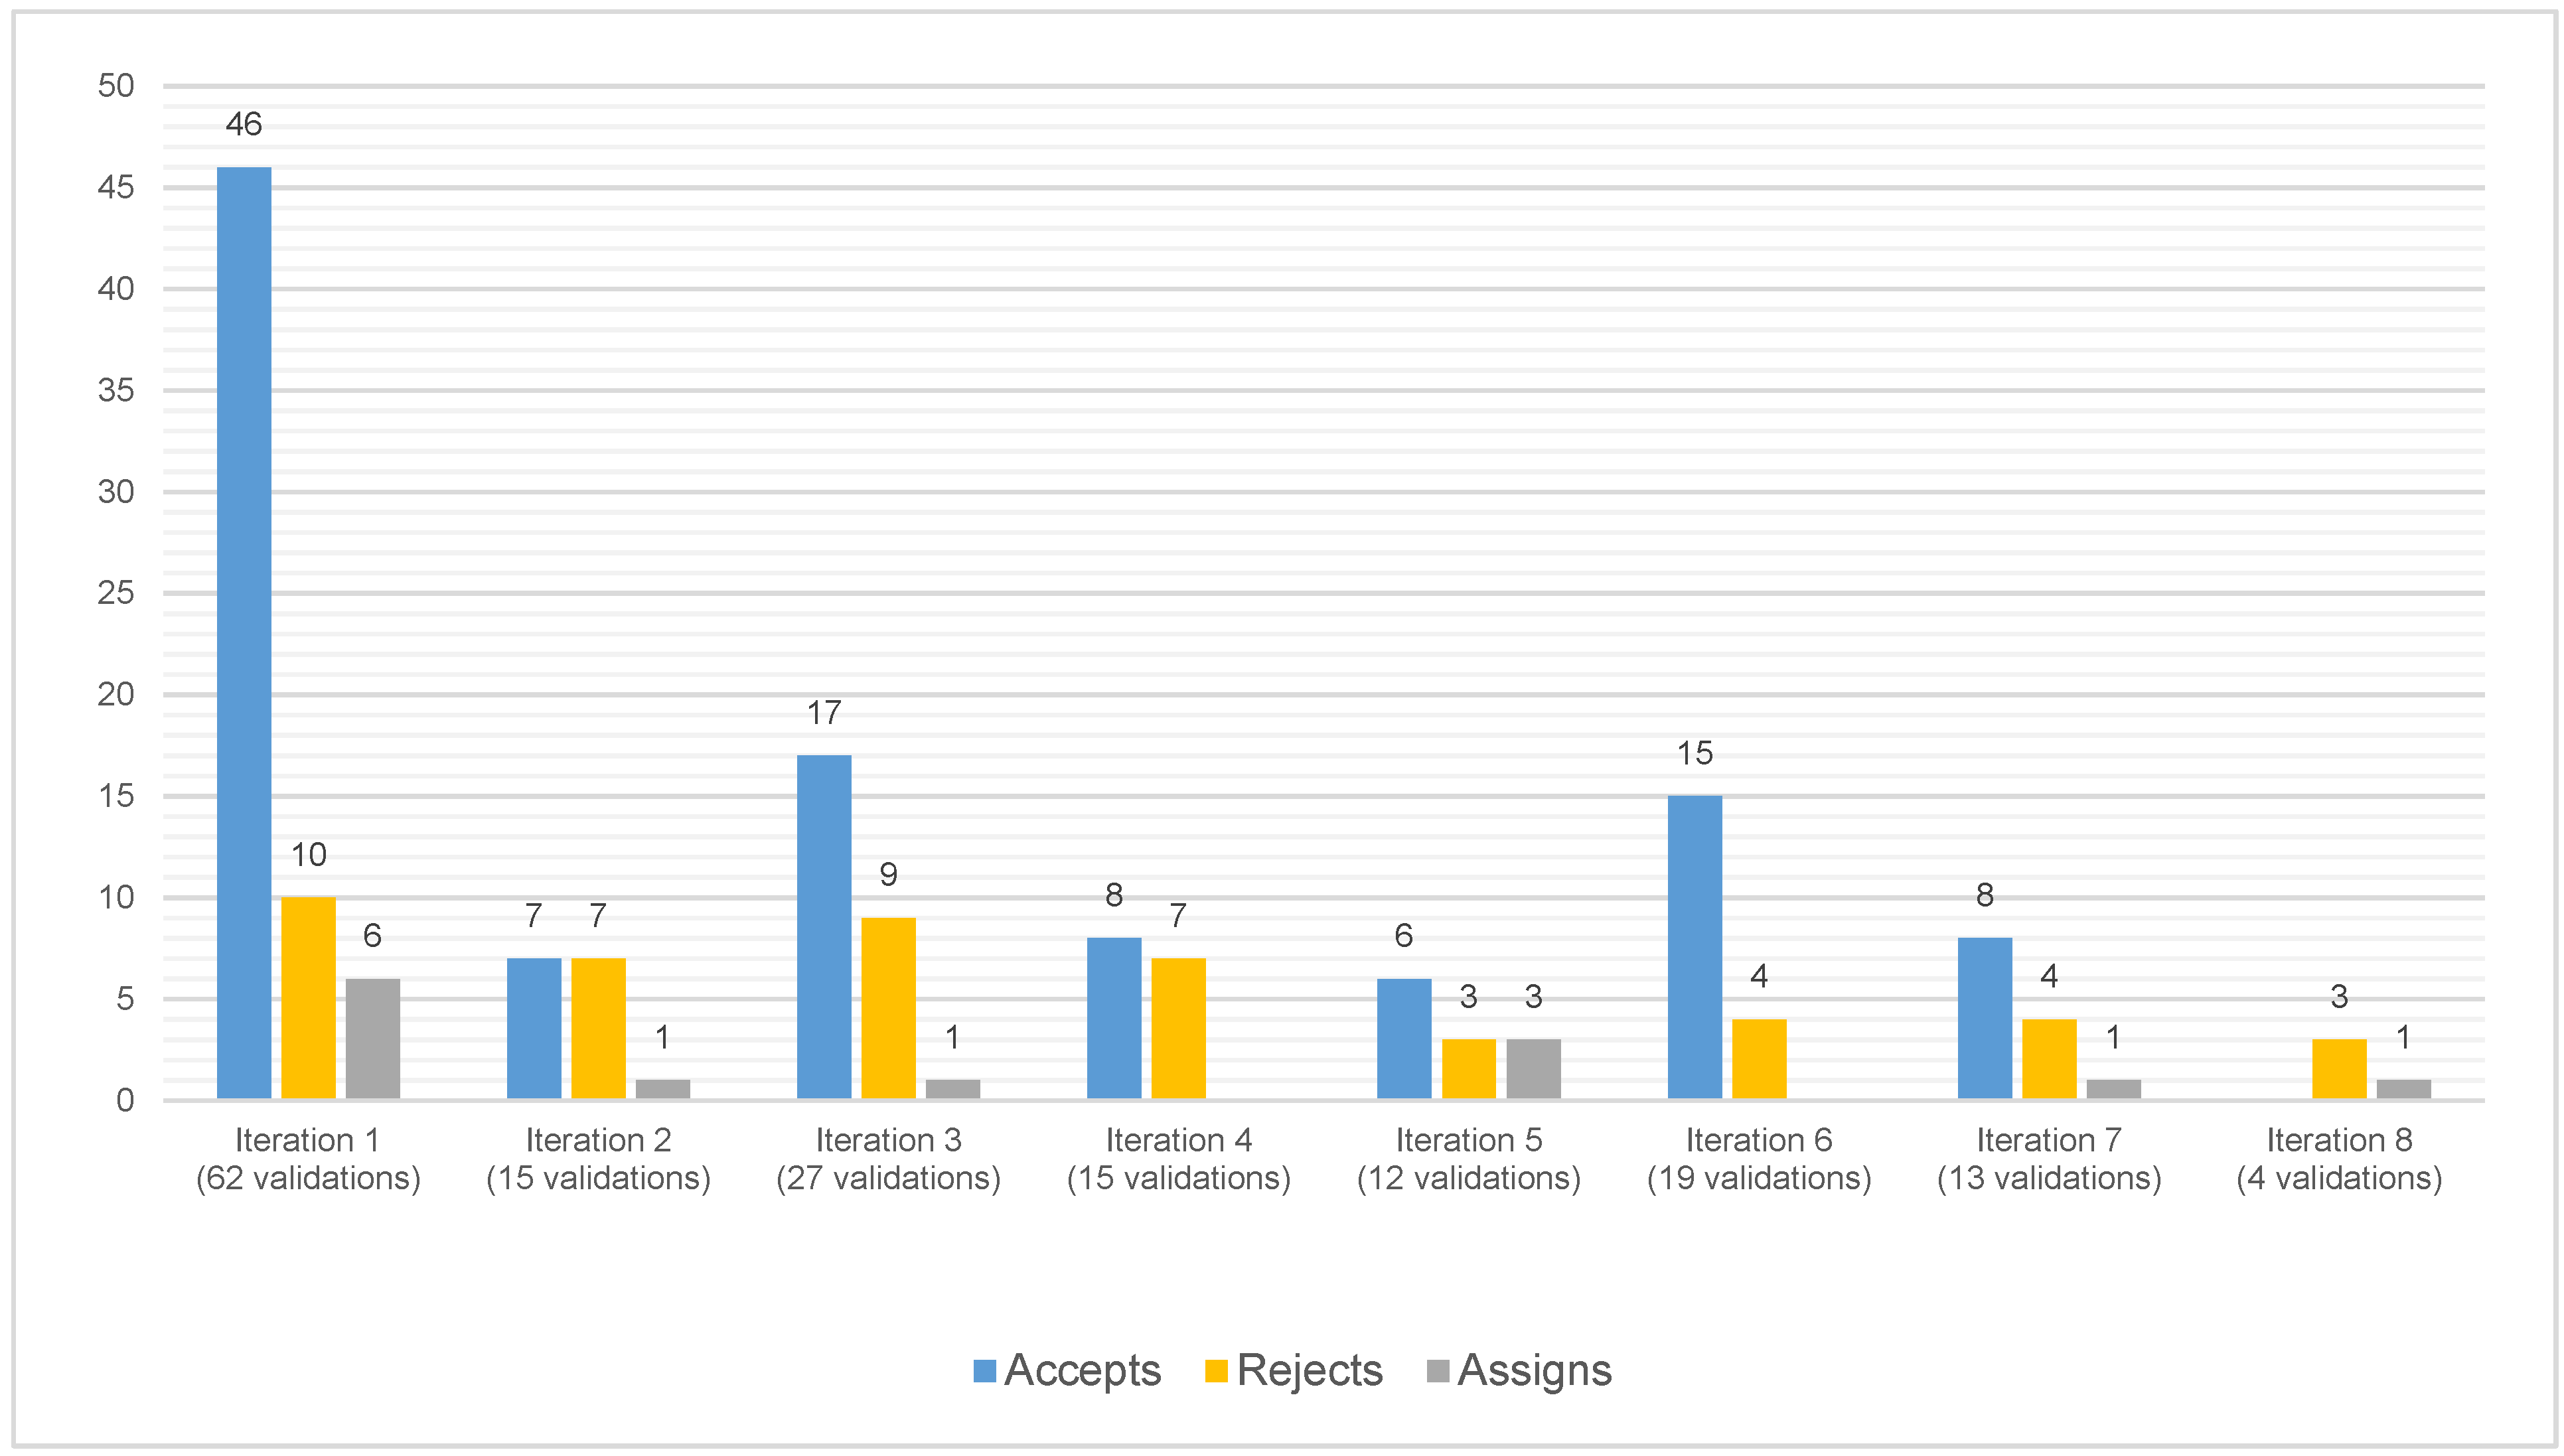
Figure 4 showcases the number of validations for each iteration.
By analysing
Figure 3, it is possible to see that the base iteration (i.e., before any validation stage is complete and the user’s feedback is given) achieves an NMI score of 92.2% and an AMI score of 85.6%. These are reliable scores for a base iteration, assuring the confidence in the extracted features and their ability to describe the overall bathrooms’ geometry and comprised equipment. In fact, this baseline indicates that even without the validation process, the user can quickly assess a project’s potential for modularisation with a high level of certainty. This baseline can then be improved with user feedback to obtain the optimised modules which will be standardised for industrialisation.
On this last point, from the acquired baseline, the validation process ensued with the following iterations, allowing for an increase in the NMI and AMI scores by 4.2% and 7.7%, respectively, achieving a maximum value of 96.4% and 93.3% in iteration 8. Both Homogeneity and Completeness also reflect this behaviour, despite the slight drop in accuracy in iteration 2, likely due to a cluster rearrangement in response to the user-created constraints during the validation stage.
Focusing on
Figure 4, it is possible to see that the number of modules validated fluctuates due to the 5% increments in the dissimilarity percentage (
Section 4.2) but gradually decreases throughout the iterations, given the algorithm’s convergence. The majority of constraints are created during the first iteration. In fact, out of the 120 constraints created during the performed iterations, 43.3% were completed in the first iteration. This behaviour is justified by (1) the increase in intra-cluster similarity throughout the iterations and (2) the fact that bathrooms with must-links cannot be validated again.
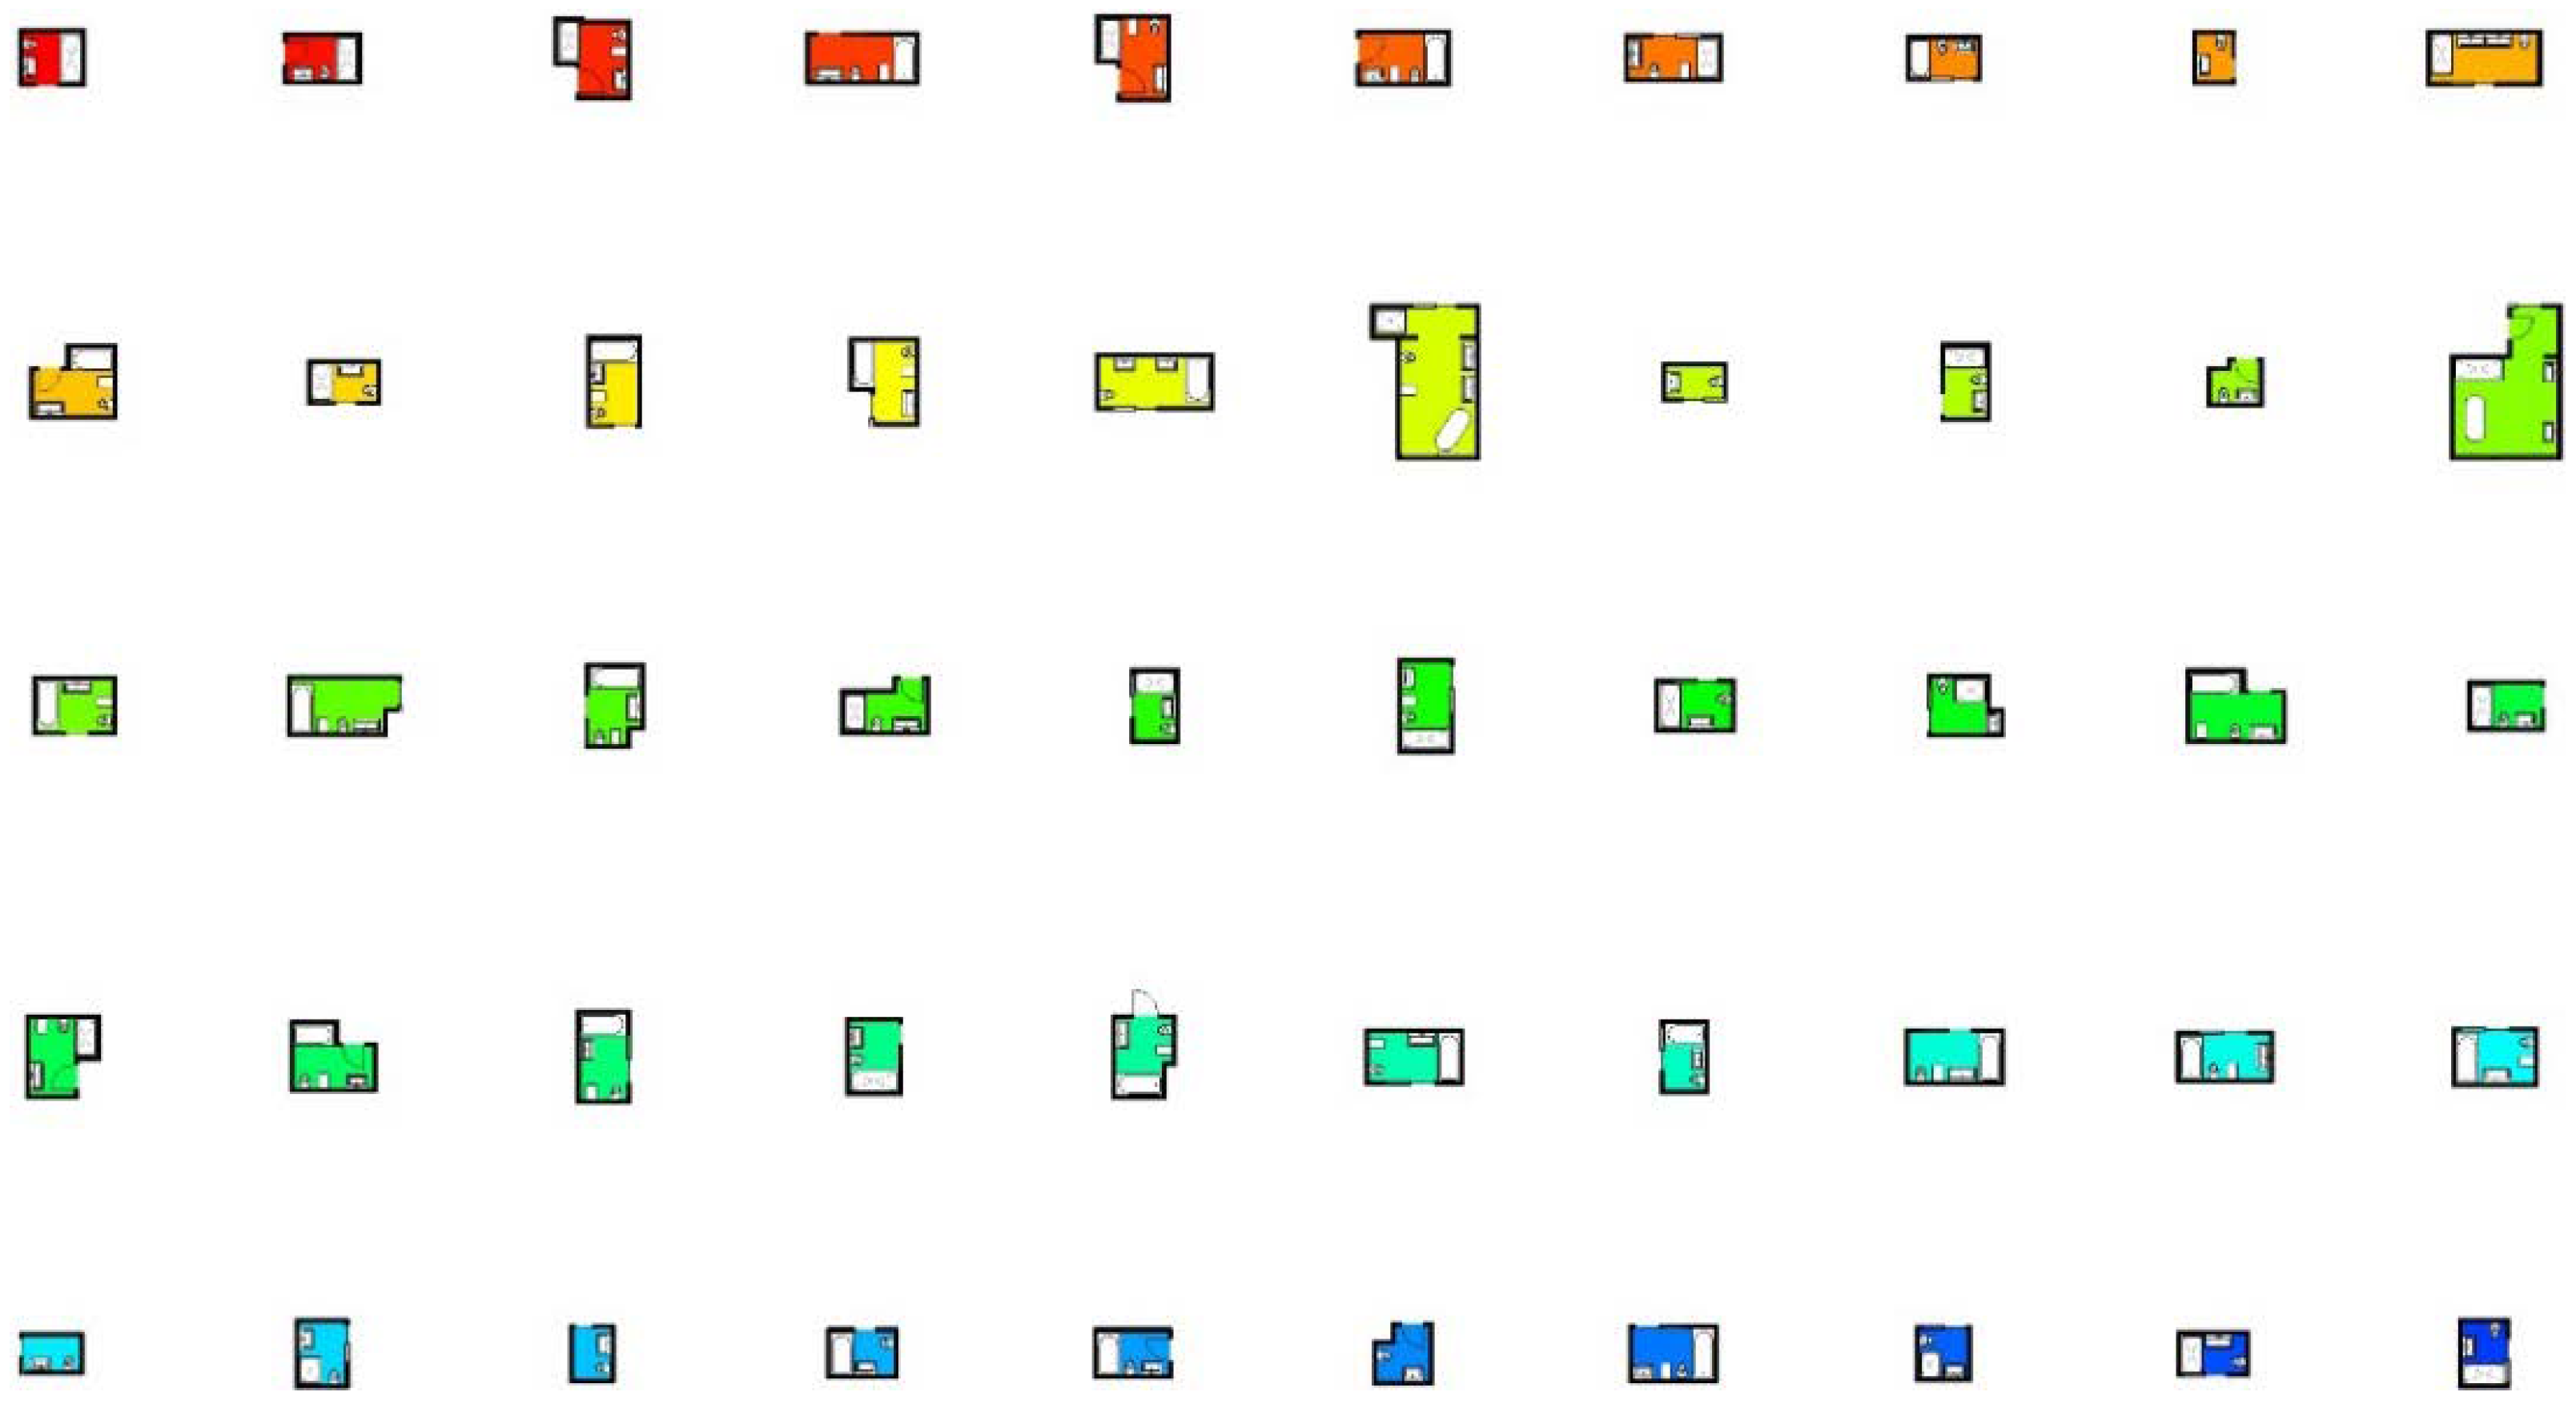
For this case study, the semi-supervised process was ended after iteration 8, with the user considering the proposed bathroom assignments as satisfactory. The results from this process can then be generated as modules representative of each cluster, which can then be further developed for manufacture and used to replace the original non-modular rooms in the BIM model. The results of iteration 8 can be seen in
Figure 5 and
Figure 6.
At this stage, the final adjustments to these modules and their respective clusters can be performed manually. Two visualisation tools were created to support this process, displaying the clusters (1) in a grid, sorted by cluster, or (2) with colours directly over the floor plans. The first visualisation mode takes all the analysed rooms in the BIM model and copies their core components (e.g., walls, doors, windows, furniture, equipment) into a new view, organised in a grid by cluster. This allows for a more straightforward comparison of the different rooms and clusters, helping to identify potential misplacements.
In the second visualisation mode, rooms are coloured in the floorplans according to their respective cluster. This allows for a contextualisation of the rooms within their surroundings, giving vital information about the location of nearby structural elements, plumbing systems, and the building’s overall layout—all information that may significantly impact the module placement.
As previously stated, the manual modularisation process undertaken by the design team took over two months to complete. Comparatively, the proposed methodology took only two hours. This outcome represents a 99.6% reduction in the duration of the modularisation process when compared to the manual approach. This reduction does not account for the time required to perform the final manual validation.
6. Conclusions and Future Work
The present article aimed to improve the process of modularising non-modular building projects. To do so, a methodology to automate this process was introduced, lessening the required duration and cost of performing it manually. The methodology relies on accessing the building’s BIM model, from which relevant data is extracted to feed the COP-KMEANS algorithm and obtain a modularisation solution.
The results of applying the proposed methodology to a case study showcase a 99.6% reduction in the process’s duration while maintaining a 96.4% NMI and 93.3% AMI, compared with the presented baseline. As such, this methodology allows for a quick assessment of a project’s modularisation potential, as well as the acquisition of a complete modularisation solution. The acquired modules can be automatically generated and used to replace the non-modular rooms in the input BIM model. This effectively condenses a process that took weeks into hours, justifying the continuous improvement of the methodology in future works.
Future works will focus on improving the methodology’s accuracy by fine-tuning the most relevant features for the clustering process, testing further room types, and developing tools to ease the integration of the proposed methodology into a traditional construction workflow.
It should be stated that while the article focused on the modularisation of bathrooms, it aimed to generalise the methodology to any room typology.
The authors hope that the success of this case study further encourages the investment in automation technologies within the AEC industry, fostering their research and adoption.
Author Contributions
Conceptualisation, L.S. and A.A.C.; methodology, S.F. and L.S.; software, S.F., L.S. and V.E.; validation, S.F., L.S. and V.E.; formal analysis, S.F., L.S. and V.E.; investigation, S.F., L.S. and V.E.; resources, A.A.C. and M.P.; data curation, S.F., L.S. and V.E.; writing—original draft preparation, S.F., L.S. and V.E.; writing—review and editing, S.F., L.S., V.E. and A.A.C.; visualisation, S.F., L.S. and V.E.; supervision, A.A.C. and M.P.; project administration, A.A.C. All authors have read and agreed to the published version of the manuscript.
Funding
This work is funded by the European Social Fund (ESF), through the North Portugal Regional Operational Programme (Norte 2020) and Lisbon Regional Operational Programme (Lisboa 2020) (Funding Reference: NORTE-06-3559-FSE-000176 and LISBOA-05-3559-FSE-000014).
Institutional Review Board Statement
Not applicable.
Informed Consent Statement
Not applicable.
Data Availability Statement
Not applicable.
Acknowledgments
The authors gratefully acknowledge CASAIS—Engenharia e Construção, for their contributions to the present paper.
Conflicts of Interest
The authors declare no conflict of interest.
References
- Barbosa, F.; Woetzel, J.; Mischke, J. Reinventing Construction: A Route of Higher Productivity; McKinsey Global Institute: Chicago, IL, USA, 2017. [Google Scholar]
- Thai, T.; Ngo, T.; Uy, B. A review on modular construction for high-rise buildings. Structures 2020, 28, 1265–1290. [Google Scholar] [CrossRef]
- Smith, R.E. Prefab Architecture: A Guide to Modular Design and Construction; John Wiley & Sons: Hoboken, NJ, USA, 2010. [Google Scholar]
- Bertram, N.; Fuchs, S.; Mischke, J.; Palter, R.; Strube, G.; Woetzel, J. Modular Construction: From Projects to Products; McKinsey & Company; Capital Projects & Infrastructure: Chicago, IL, USA, 2019. [Google Scholar]
- Modular Building Institute. Permanent Modular Construction; No. 2011 Annual Report; Modular Building Institute: Charlottesville, VA, USA, 2011. [Google Scholar]
- Piroozfar, P.; Altan, H.; Popovic-Larsen, O. Design for sustainability: A comparative study of a customised modern method of construction versus conventional methods of construction. Archit. Eng. Des. Manag. 2012, 8, 55–75. [Google Scholar]
- Staib, G.; Dörrhöfer, A.; Rosenthal, M. Components and Systems: Modular Construction—Design, Structure, New Technologies; Walter de Gruyter: Munich, Germany, 2013. [Google Scholar]
- Construction, M.H. Prefabrication and modularisation: Increasing productivity in the construction industry. Smart Market Report, 2011; Volume 1. [Google Scholar]
- Isaac, S.; Bock, T.; Stoliar, Y. A methodology for the optimal modularisation of building design. Autom. Constr. 2016, 65, 116–124. [Google Scholar] [CrossRef]
- Samarasinghe, T.; Gunawardena, T.; Mendis, P.; Sofi, M.; Aye, L. Dependency Structure Matrix and Hierarchical Clustering based algorithm for optimum module identification in MEP systems. Autom. Constr. 2019, 104, 153–178. [Google Scholar] [CrossRef]
- Song, L.; Mohamed, Y.; AbouRizk, S.M. Early contractor involvement in design and its impact on construction schedule performance. J. Manag. Eng. 2009, 25, 12–20. [Google Scholar] [CrossRef] [Green Version]
- Gusmao Brissi, S.; Debs, L. Lean, Automation and Modularisation in Construction. In Proceedings of the 27th Annual Conference of the International Group for Lean Construction, IGLC, Dublin, Ireland, 3–5 July 2019; pp. 711–722. [Google Scholar] [CrossRef] [Green Version]
- Wagstaff, K.; Cardie, C.; Rogers, S.; Schrödl, S. Constrained K-means Clustering with Background Knowledge. In Proceedings of the 18th International Conference on Machine Learning, San Francisco, CA, USA, 28 June–1 July 2001. [Google Scholar]
- Pandremenos, J.; Paralikas, J.; Salonitis, K.; Chryssolouris, G. Modularity concepts for the automotive industry: A critical review. CIRP J. Manuf. Sci. Technol. 2009, 1, 148–152. [Google Scholar] [CrossRef]
- Ashworth, G. Architectural Disruption in Aerospace. Master’s Dissertation, Massachusetts Institute of Technology, Cambridge, MA, USA, 2009. [Google Scholar]
- Ma, J.; Kremer, G.E.O. A systematic literature review of modular product design (MPD) from the perspective of sustainability. Int. J. Adv. Manuf. Technol. 2016, 86, 1509–1539. [Google Scholar] [CrossRef]
- Jose, A.; Tollenaere, M. Modular and platform methods for product family design: Literature analysis. J. Intell. Manuf. 2005, 16, 371–390. [Google Scholar] [CrossRef]
- Alsarhan, Q.; Ahmed, B.S.; Bures, M.; Zamli, K.Z. Software module clustering: An in-depth literature analysis. IEEE Trans. Softw. Eng. 2020. [Google Scholar] [CrossRef]
- Isaac, S.; Bock, T.; Stoliar, Y. A new approach to building design modularization. Procedia Eng. 2014, 85, 274–282. [Google Scholar] [CrossRef]
- Mohamad, A.; Hickethier, G.; Hovestadt, V.; Gehbauer, F. Use of modularisation in design as a strategy to reduce component variety in one-off projects. In Proceedings of the 21th Annual Conference of the International Group for Lean Construction, Fortaleza, Brazil, 31 July–2 August 2013. [Google Scholar]
- Tserng, H.P.; Yin, Y.L.; Jaselskis, E.J.; Hung, W.C.; Lin, Y.C. Modularization and assembly algorithm for efficient MEP construction. Autom. Constr. 2011, 20, 837–863. [Google Scholar] [CrossRef]
- Medjdoub, B.; Richens, P.; Barnard, N. Generation of variational standard plant room solutions. Autom. Constr. 2003, 12, 155–166. [Google Scholar] [CrossRef]
- Wagstaff, K.; Basu, S.; Davidson, I. When Is Constrained Clustering Beneficial, and Why? In Proceedings of the Twenty-First National Conference on Artificial Intelligence and the Eighteenth Innovative Applications of Artificial Intelligence Conference, Boston, MA, USA, 16–20 July 2006. [Google Scholar]
- Maimon, O.; Rokach, L. Data Mining and Knowledge Discovery Handbook, 2nd ed.; Springer Science and Business Media: New York, NY, USA, 2010. [Google Scholar]
- Omran, M.; Engelbrecht, A.; Salman, A. An overview of clustering methods. Intell. Data Anal. 2007, 11, 583–605. [Google Scholar] [CrossRef]
- Bramer, M. Clustering; Springer: London, UK, 2007. [Google Scholar]
- Gonzalez, T.F. Clustering to Minimise the Maximum Intercluster Distance. Theor. Comput. Sci. 1985, 38, 293–306. [Google Scholar] [CrossRef] [Green Version]
- Zhu, X.; Goldberg, A. Introduction to Semi-Supervised Learning; Morgan & Claypool: San Rafael, CA, USA, 2009. [Google Scholar]
- Davidson, I. A Survey of Clustering with Instance Level Constraints. ACM Trans. Knowl. Discov. Data 2007, 1, 2–42. [Google Scholar]
- Gançarski, P.; Dao, T.; Crémilleux, B.; Forestier, G.; Current, T.L.C.C.; Marquis, N.T.P.; Papini, O.; Prade, H. A Guided Tour of AI Research, 2nd ed.; Springer: Berlin/Heidelberg, Germany, 2020. [Google Scholar]
- MacQueen, J. Some methods for classification and analysis of multivariate observations. In Proceedings of the Fifth Berkeley Symposium on Mathematical Statistics and Probability, San Francisco, CA, USA, 21 June–18 July 1965. [Google Scholar]
- Davidson, I.; Ravi, S.S. Clustering with constraints: Feasibility issues and the K-means algorithm. In Proceedings of the 5th SIAM Data Mining Conference, SIAM, Newport Beach, CA, USA, 21–23 April 2005; pp. 138–149. [Google Scholar]
- NBS Enterprises. Uniclass 2015. Available online: https://www.thenbs.com/our-tools/uniclass-2015 (accessed on 20 October 2021).
- Chan, C.K.; Tan, S.T. Determination of the minimum bounding box of an arbitrary solid: An iterative approach. Comput. Struct. 2001, 79, 1433–1449. [Google Scholar] [CrossRef]
- Pedregosa, F.; Varoquaux, G.; Gramfort, A.; Michel, V.; Thirion, B.; Grisel, O.; Blondel, M.; Prettenhofer, P.; Weiss, R.; Dubourg, V.; et al. Scikit-learn: Machine Learning in Python. J. Mach. Learn. Res. 2011, 10, 2825–2830. [Google Scholar]
- Rousseeuw, P.J. Silhouettes: A graphical aid to the interpretation and validation of cluster analysis. J. Comput. Appl. Math. 1987, 20, 53–65. [Google Scholar] [CrossRef] [Green Version]
- Vinh, N.X.; Bailey, J.E.J. Information theoretic measures for Clusterings comparison: Variants, properties, normalisation and correction for chance. J. Mach. Learn. Res. 2010, 11, 2837–2854. [Google Scholar]
- Hubert, L.; Arabie, P. Comparing partitions. J. Classif. 1985, 2, 193–218. [Google Scholar] [CrossRef]
- Romano, S.; Vinh, N.X.; Bailey, J.; Verspoor, K. Adjusting for chance clustering comparison measures. J. Mach. Learn. Res. 2016, 17, 4635–4666. [Google Scholar]
- Rosenberg, A.; Hirschberg, J. V-measure: A conditional entropy-based external cluster evaluation measure. In Proceedings of the 2007 Joint Conference on Empirical Methods in Natural Language Processing and Computational Natural Language Learning, Prague, Czech Republic, 28–30 June 2007. [Google Scholar]
| Publisher’s Note: MDPI stays neutral with regard to jurisdictional claims in published maps and institutional affiliations. |
© 2022 by the authors. Licensee MDPI, Basel, Switzerland. This article is an open access article distributed under the terms and conditions of the Creative Commons Attribution (CC BY) license (https://creativecommons.org/licenses/by/4.0/).


