Article

Assessing Ozone Distribution Vertically and Horizontally in Urban Street Canyons Based on Field Investigation and ENVI-met Modelling

1
CAS Key Laboratory of Forest Ecology and Management, Institute of Applied Ecology, Chinese Academy of Sciences, Shenyang 110016, China
2
Shenyang Arboretum, Chinese Academy of Sciences, Shenyang 110016, China
*
Authors to whom correspondence should be addressed.
Buildings 2022, 12(3), 262; https://doi.org/10.3390/buildings12030262
Submission received: 25 January 2022 / Revised: 15 February 2022 / Accepted: 22 February 2022 / Published: 24 February 2022
(This article belongs to the Topic Climate Change and Environmental Sustainability)

Abstract

:
High concentrations of ozone (O3) is a major air problem in urban areas, which creates a serious threat to human health. Urban street canyon morphology plays a key role in air pollutant dispersion and photochemical reaction rate. In this study, a one-year observation at three height levels was performed to investigate the O3 distribution vertically in a street canyon of Shenyang. Then, field investigation and ENVI-met modelling were conducted to quantify the influence of street canyon morphology and microclimatic factors on O3 distribution at the pedestrian level. All O3 concentrations at the three height levels were high from 1:00 p.m. to 4:00 p.m. Both O3 concentrations at pedestrian level and the middle level in the canyon were 40% higher than at roof level. O3 accumulated in the canyons rather than spread out. The in-canyon O3 concentrations had significantly positive correlations with building height, aspect ratio, sky view factor, air temperature, and wind speed. Both field investigation and ENVI-met modelling found high O3 concentrations in medium canyons. Photochemical reaction intensity played a more important role in in-canyon O3 distribution than dispersion. Wide canyons were favorable for removing O3.

1. Introduction

The UN Sustainable Development Goals (SDGs) state that good health and well-being and sustainable cities and communities are integral to achieving the SDGs [1,2]. The increasing urbanization and industrial development makes air pollution a serious problem in urban areas [3,4,5]. Ozone (O3) is a key air pollutant worldwide and amplifies the risk of discomfort and poor health [6]. It can react to tissues in airways, weaken immune responses, decrease lung function, and increase morbidity from asthma [7,8]. High O3 concentration near the ground in the built environment has been known to be a major air pollution issue [9].
A street canyon refers to a long and narrow street with successive buildings built up along two sides [10]. Urban street canyons are a main area for individuals to participate in social activities [11]. The buildings along the two sides of the street may hinder the dispersion of pollutant emissions from traffic, leading to higher pedestrian exposure to the pollutants inside the canyon [12]. Pollutant distribution and dispersion in street canyons were closely associated with street canyon morphology [13,14,15]. Street canyon morphology can be characterized as building height (BH), aspect ratio (AR, building height/street width), and sky view factor (SVF) [16,17,18]. Decreasing the street aspect ratio or increasing the length might improve the rate of pollutant removal through turbulent diffusions across canopy roofs in canyons with uniform heights [19,20,21,22]. Increasing the aspect ratio decreases leeward-side pollutant exposure, whereas it increases windward-side pollutant exposure [23]. The O3 concentrations in street canyons show a distinct separation between the lower and upper regions, with an upward dispersion [24].
Model simulation and field investigation are two main approaches to study air quality in urban street canyons [25]. Air pollutant dispersion models in street canyons can be divided into three types: operational models, computational fluid dynamics (CFD) models, and reduced-scale models [26]. The simulation of air pollutant dispersion in urban street canyons mainly focuses on the impact of the morphology, orientation, width, and layout of street canyons on wind velocity, air flow, and air pollutant distribution [27]. Hassan et al. (2020) used Fluent to simulate air pollutant dispersion in street canyons and found that vertical forms of canyons could better explain the pattern of air pollutants dispersion than horizontal forms [28]. Yang et al. (2020) simulated wind velocity, wind direction, and air flow in canyons with various building height, volume, and density and found that the corner of canyons with high-rise buildings might face high air pollution when the wind speed is high [29].
Moreover, field investigation was used to explain air pollutant distribution in street canyons influenced by street canyon morphology, microclimatic factors, background concentration, vehicle traffic flow, etc. via in-situ observations. For example, Miao et al. (2020a) conducted a city-wide investigation in Shenyang (China) and found that narrow street canyons were more conducive to particle dispersion than wide canyons [15]. Voordeckers et al. (2021) evaluated NO2 distribution in 321 street canyons in Antwerp and found that aspect ratio and maximum hourly traffic volume were two of the most important predictors for NO2 concentrations [30].
Although numerous studies have been conducted to evaluate air pollutant distribution in street canyons, there are several gaps. Firstly, vertical variation of O3 in real urban street canyons based on long-term observations remains unknown. Secondly, there is a lack of knowledge about field investigation on O3 distribution horizontally in urban street canyons and its response to street canyon morphology and microclimatic factors. Thirdly, the trade-off of dispersion and photochemical reaction on O3 distribution in street canyons remains unclear. These gaps obstruct policymaking regarding outdoor air quality improvement in the built environment.
Aiming to understand the vertical and horizontal distribution of O3 in urban street canyons and its driving factors, we applied a fixed one-year observation to evaluate the vertical distribution of O3 concentration in street canyons and conducted a city-wide measurement to determine the influence of street canyon morphology (i.e., BH, AR, and SVF) and microclimatic factors (air temperature, wind speed, wind direction, relative humidity, and atmospheric pressure) on O3 concentration. Then, O3, NO, and NO2 concentrations in different canyons were simulated in ENVI-met to further analyze the dispersion and photochemical reaction processes. The findings will provide guidelines to future urban street design and policymaking in terms of air quality improvement.

2. Materials and Methods
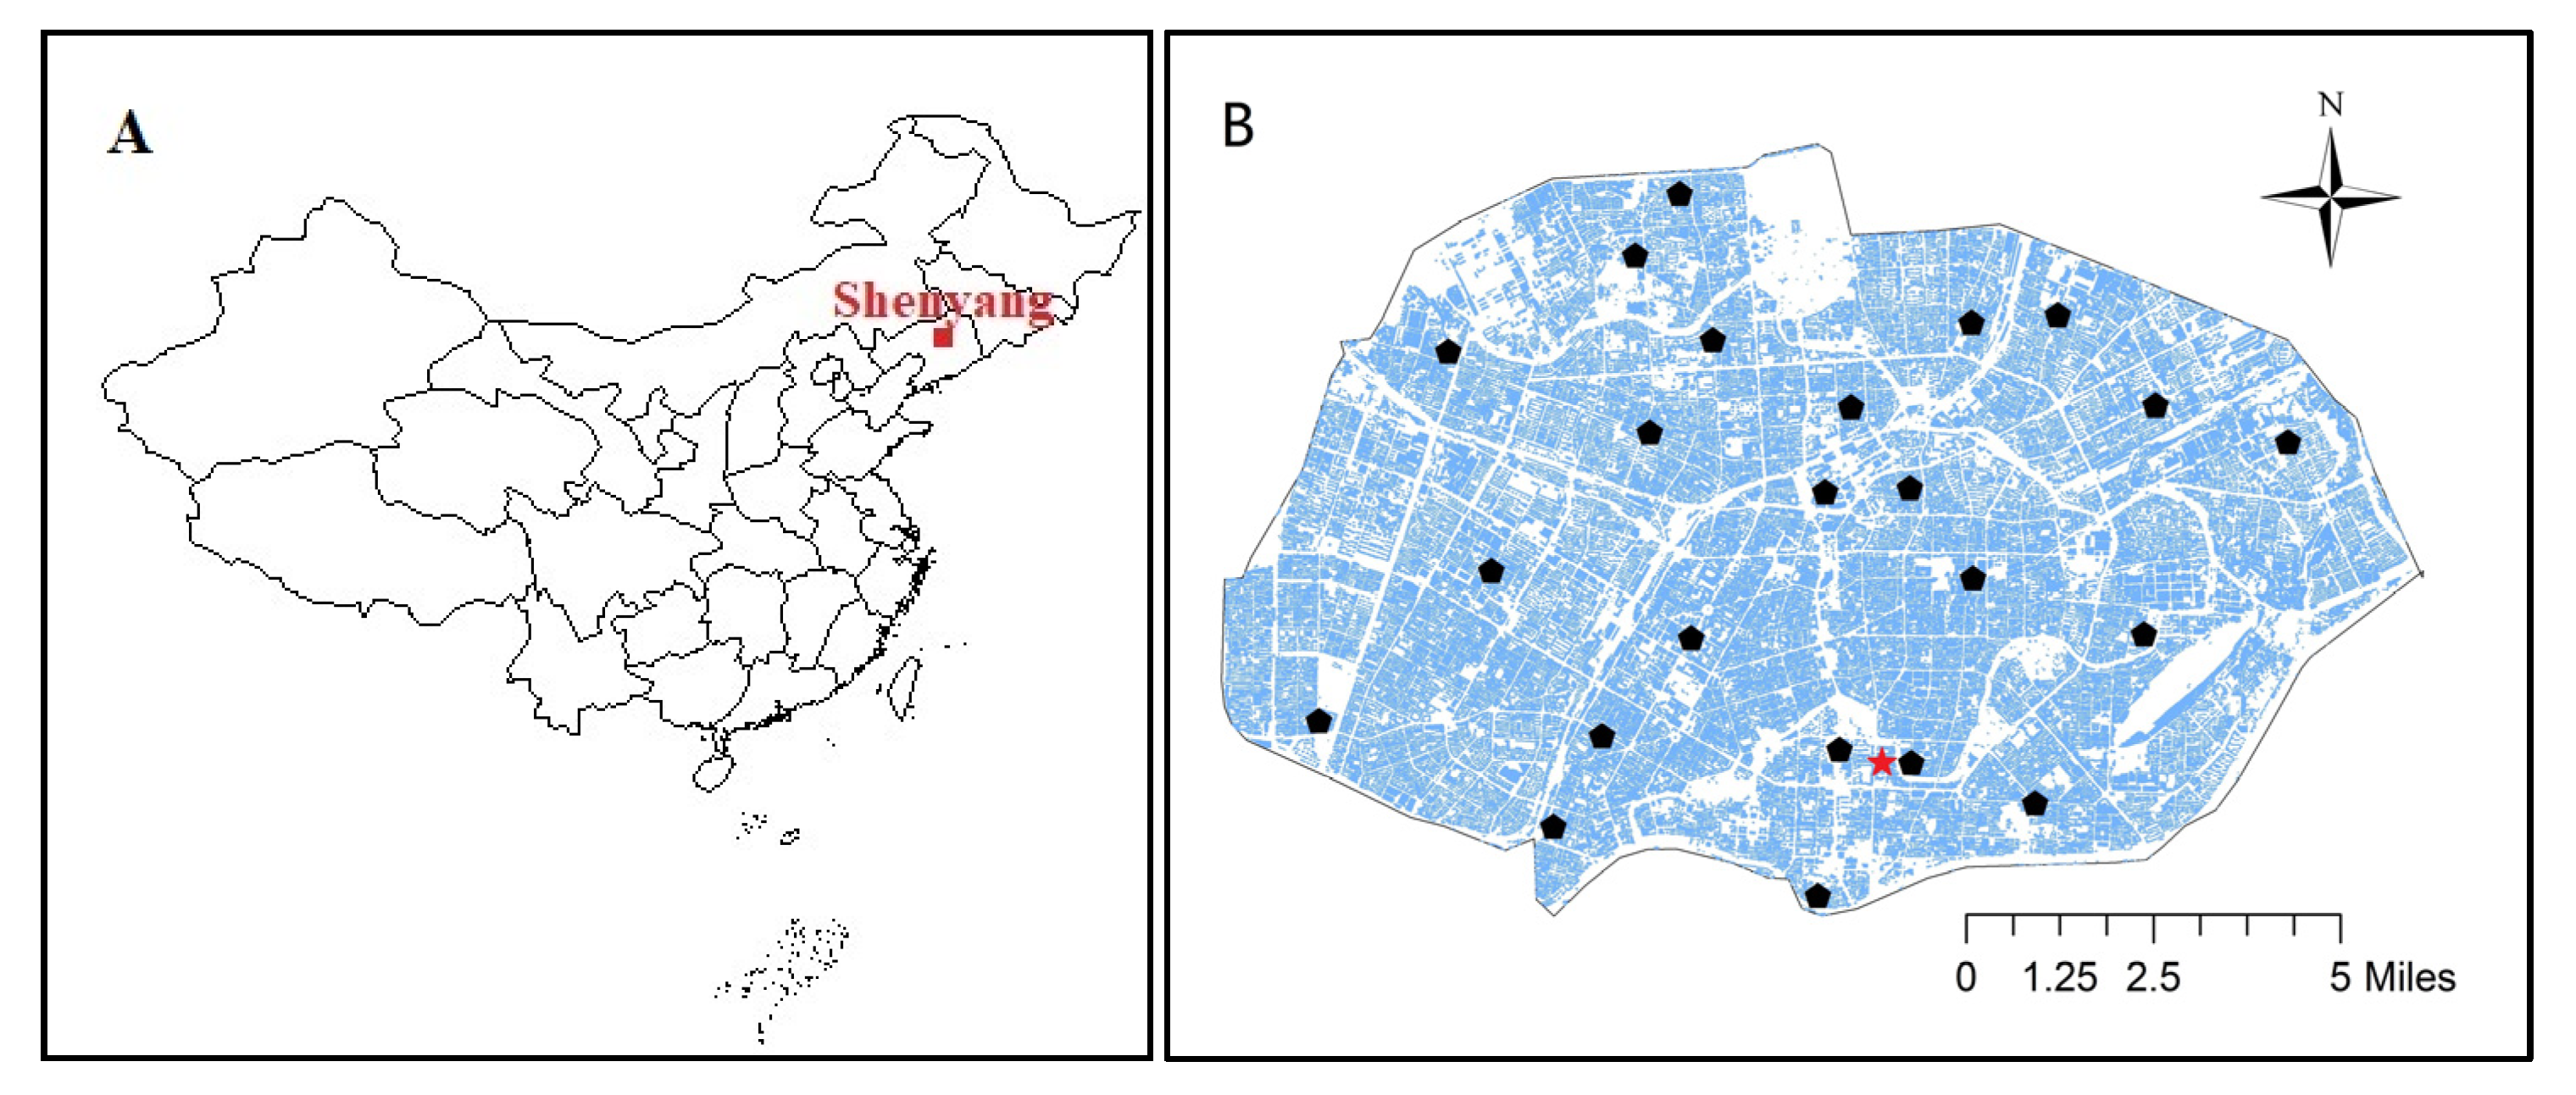
2.1. Study Area

This study was conducted in Shenyang (41°11′51″ N–43°02′13″ N, 122°25′09″ E–123°48′24″ E, Figure 1A), which is one of the cities that suffers from air pollution in China. The city belongs to a mid-temperate continental climate zone with an average annual temperature of 8.4 °C and an average annual rainfall of 510–680 mm. According to the Shenyang Municipal Environmental Status Bulletin, the percent of polluted days in Shenyang was 30.8% during the first half of 2020. Among these polluted days, the days when O3 was the primary pollutant accounted for 25.0%.

2.2. Field Investigation

A fixed observation site was placed at Wuai Street (Figure 1B) to collect O3 concentration from December 2018 to November 2019 at three height levels: pedestrian level (1.5 m), middle level (27 m), and roof level (69 m). The street has a width of 35 m and a length of 776 m. The observation site was located along an eastern building with a height of 69 m vertically. It was 225 m away from the north end of the street and 551 m away from the south end of the street. The observation was done by a U-Sky outdoor environmental observation terminal (Shanghai lanju Intelligent Technology Co., Ltd., Shanghai, China) with an accuracy of 0.3 ppm for O3. It recorded O3 concentration per second.
A total of 23 observation sites (Figure 1B) were set inside urban street canyons in the main area of Shenyang during May and June 2018 to assess the impact of street canyon morphology on O3. The 23 street canyons were divided into wide (0.41–0.85), medium (1.03–1.76), and deep street canyons (2.12–4.33) according to the value of AR; divided into narrow (0.27–0.35), medium (0.39–0.48), and wide canyons (0.51–0.59) according to the value of SVF; and divided into multilayer building canyons (18–30 m) and high-rise canyons (40–101 m) according to the height of the buildings beside the canyons. The estimation methods of AR and SVF are described in Section 2.2. The observation sites were randomly located in main residential areas. A mix of high-rise narrow streets, high-rise wide streets, multilayer narrow streets, and multilayer wide streets were included among the 23 street canyons.
O3 concentration was collected by an Aeroqual Series 500 portable gas monitor (Auckland, New Zealand) with an accuracy of ±0.005 ppm. All the measurements were taken at 1.5 m above the ground from 7:00 a.m. to 8:00 p.m. at a 1 min interval from May to July 2018. Moreover, microclimatic factors including wind speed, wind direction, air temperature, relative humidity, and atmospheric pressure were measured by microclimatic parameter instrument TNHY-5-A-G (Zhejiang Top Cloud-Agri Technology Co., Ltd., Hangzhou, China) at a 5 min interval. This instrument has a wind speed accuracy of ±(0.3 + 0.03 × V) m/s, a wind direction accuracy of ±3°, an air temperature accuracy of ±0.4 °C, a relative humidity accuracy of ±3%, and an atmospheric pressure accuracy of ±1 hPa. The measurements were taken at all sites.

2.2.1. Estimation of AR and SVF

Building height was interpreted from QuickBird imagery with a high resolution of 0.61 m according to Gong’s method based on building shadows [31]. QuickBird imagery is a remotely sensed product with fine resolution available to the public. Street width was estimated via visual interpretation from LandsatTM images with a resolution of 0.8 m. The AR was determined as the ratio of the average height of buildings along the two sides of street-to-street width.
The estimation of SVF was determined by fisheye photography methods [18]. This is a method to estimate SVF using fisheye photos taken vertically of the sky with a circular fisheye lens. This method was widely used for SVF estimation because its accuracy was high enough to test the accuracy of other technologies [18]. In this study, circumpolar fisheye photos were taken vertically of the sky at 1.5 m above the ground in street canyons using a digital camera (Nikon, D800, Tokyo, Japan) equipped with a fisheye lens (AF-S Fisheye NIKKOR 8–15 mm f/3.5–4.5 E ED, Tokyo, Japan).

2.2.2. Data Analysis

Differences in O3 concentration among street canyon types were determined by one-way analysis of variance (ANOVA) and a least significant difference test at a significant level of p < 0.05. The tests for homogeneity of variance and for normality were conducted before ANOVA analysis. Pairwise Pearson correlation coefficients between O3 concentration and AR, SVF, and microclimatic factors were calculated. The test for normality was conducted before pairwise Pearson correlation analysis. The significance of Pearson correlation coefficients was obtained at a level of p < 0.05.

2.3. ENVI-met Modelling Set-Up

ENVI-met is an urban microclimate simulation software based on CFD and thermodynamic laws [32]. It is a Reynolds Averaged Navier–Stokes equation-based non-hydrostatic microscale model. ENVI-met is widely used to simulate the interactions between urban surfaces, vegetation, and atmosphere, including wind flow, turbulence, urban microclimate, pollutant dispersion, radiation fluxes, and soil temperatures in built environments [32]. Many studies have verified its accuracy in microclimate simulation and air pollutant dispersion and deposition based on field data [33,34,35]. In this study, ENVI-met modelling was conducted to evaluate O3, NO, and NO2 concentration distribution; air temperature; and wind speed in street canyons (AR = 0.5, 1, 2) to further evaluate air pollutant dispersion and photochemical reaction.
The model computation domain size was 68 × 96 × 30 grids (X, Y, Z) with a resolution of 2 m × 2 m × 3 m. The building height and street width of the street canyons (AR = 0.5, 1, 2) were 24 m and 48 m, 24 m and 24 m, and 48 m and 24 m, respectively. The model was initialized using microclimatic information acquired from the field investigation. The roughness length of the study area was set at 0.01. The minimum and maximum temperature were 18 °C at 2:00 a.m. and 30 °C at 12:00 a.m, respectively. The minimum and maximum humidity were 45% at 12:00 a.m. and 70% at 7:00 a.m, respectively. The wind speed and wind direction were 2 m/s and 225°, respectively. The background concentration of O3, NO, and NO2 were 12 μg/m3, 30 μg/m3, and 60 μg/m3, respectively. The microclimatic and background data were from the daily data on simulation data (accessed on 17 June 2019) reported by the National Data Science Center at http://data.cma.cn/data/online/t/1 (accessed on 18 June 2019) and Liaoning Real-time Air Quality Publishing System at http://218.60.147.143:8089/Home/RealTime/#sy (accessed on 17 June 2019), respectively.

3. Results

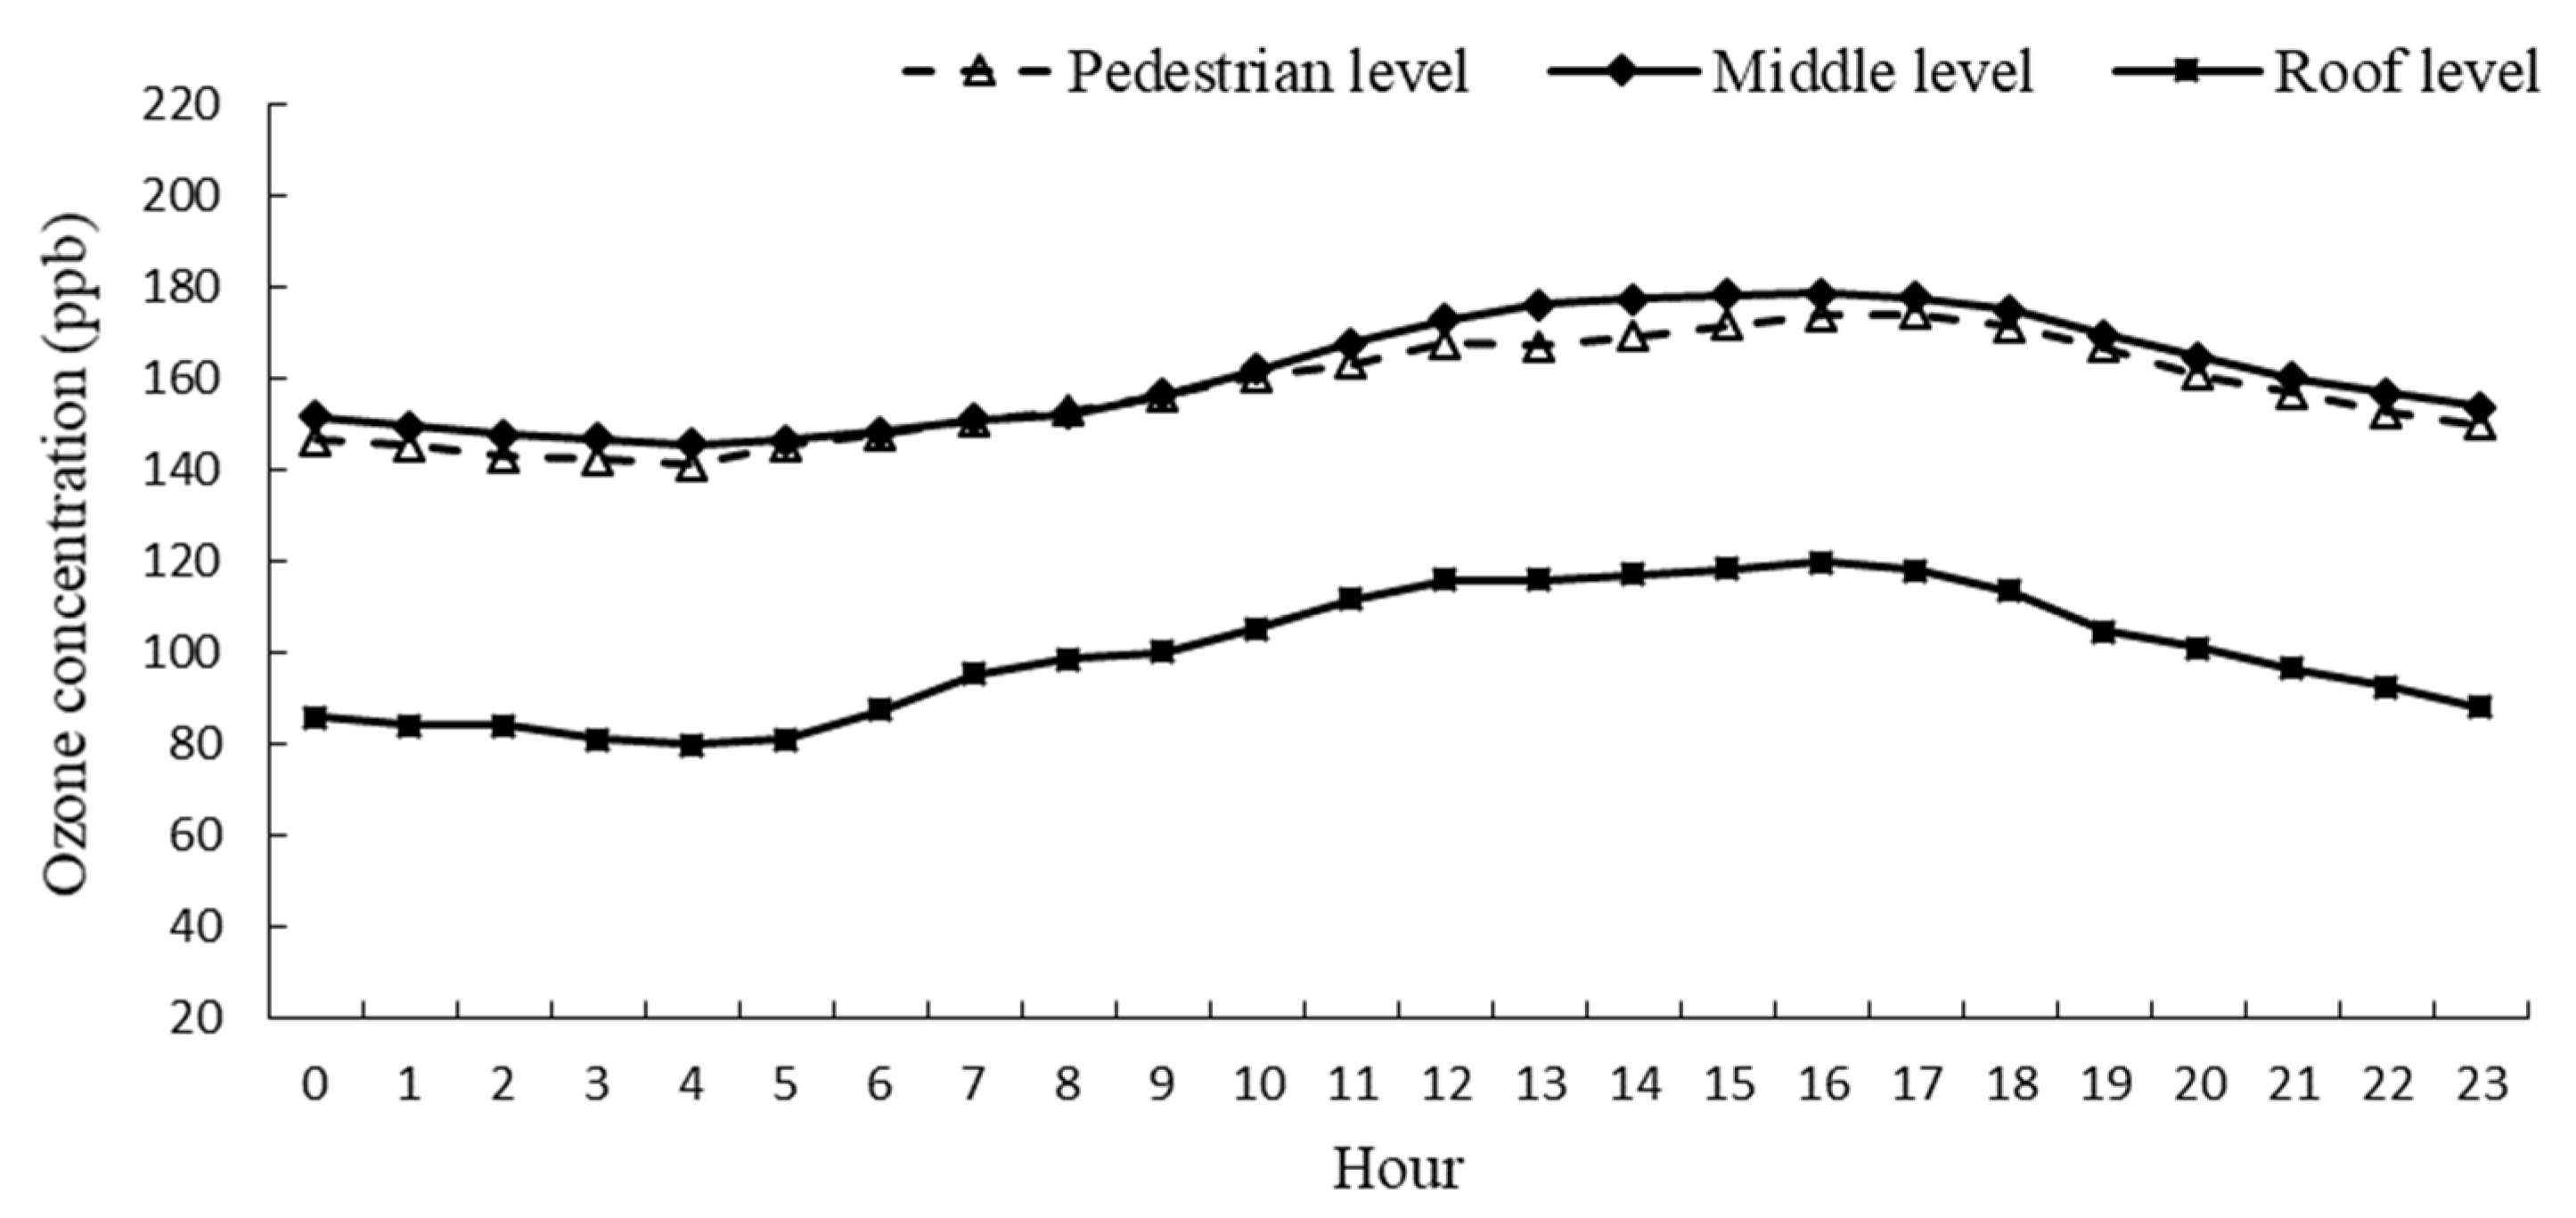
3.1. Vertical Distribution of O3 in a Street Canyon

Monthly variations and daily variations of O3 concentration were examined in a street canyon at three height levels: pedestrian level, middle level, and roof level. The O3 concentration at the pedestrian level increased from December 2018 to May 2019, and then decreased (Figure 2). The peak concentration occurred in May, reaching 187.9 ppb. Both the peak concentrations at the middle level and roof level occurred in July, reaching 187.6 ppb and 202.8 ppb, respectively. The curves of O3 concentration at pedestrian level and the middle level were close to each other, whereas the curve at roof level was significantly lower than at the pedestrian and middle levels, except in June and July.
Hourly variations of O3 concentration calculated from one-year observation are shown in Figure 3. All of the O3 concentration at the pedestrian level, middle level, and roof level increased from 5:00 a.m. to 5:00 p.m. and then decreased. The hourly O3 concentration at the middle level was slightly higher than at pedestrian level. However, O3 concentration at roof level was approximate 40% lower than at either pedestrian level or the middle level. Peak concentration at pedestrian level occurred at 5:00 p.m., reaching 174.3 ppb, whereas the peak concentrations at the middle level and roof level occurred at 16 p.m., reaching 178.8 ppb and 119.8 ppb, respectively.

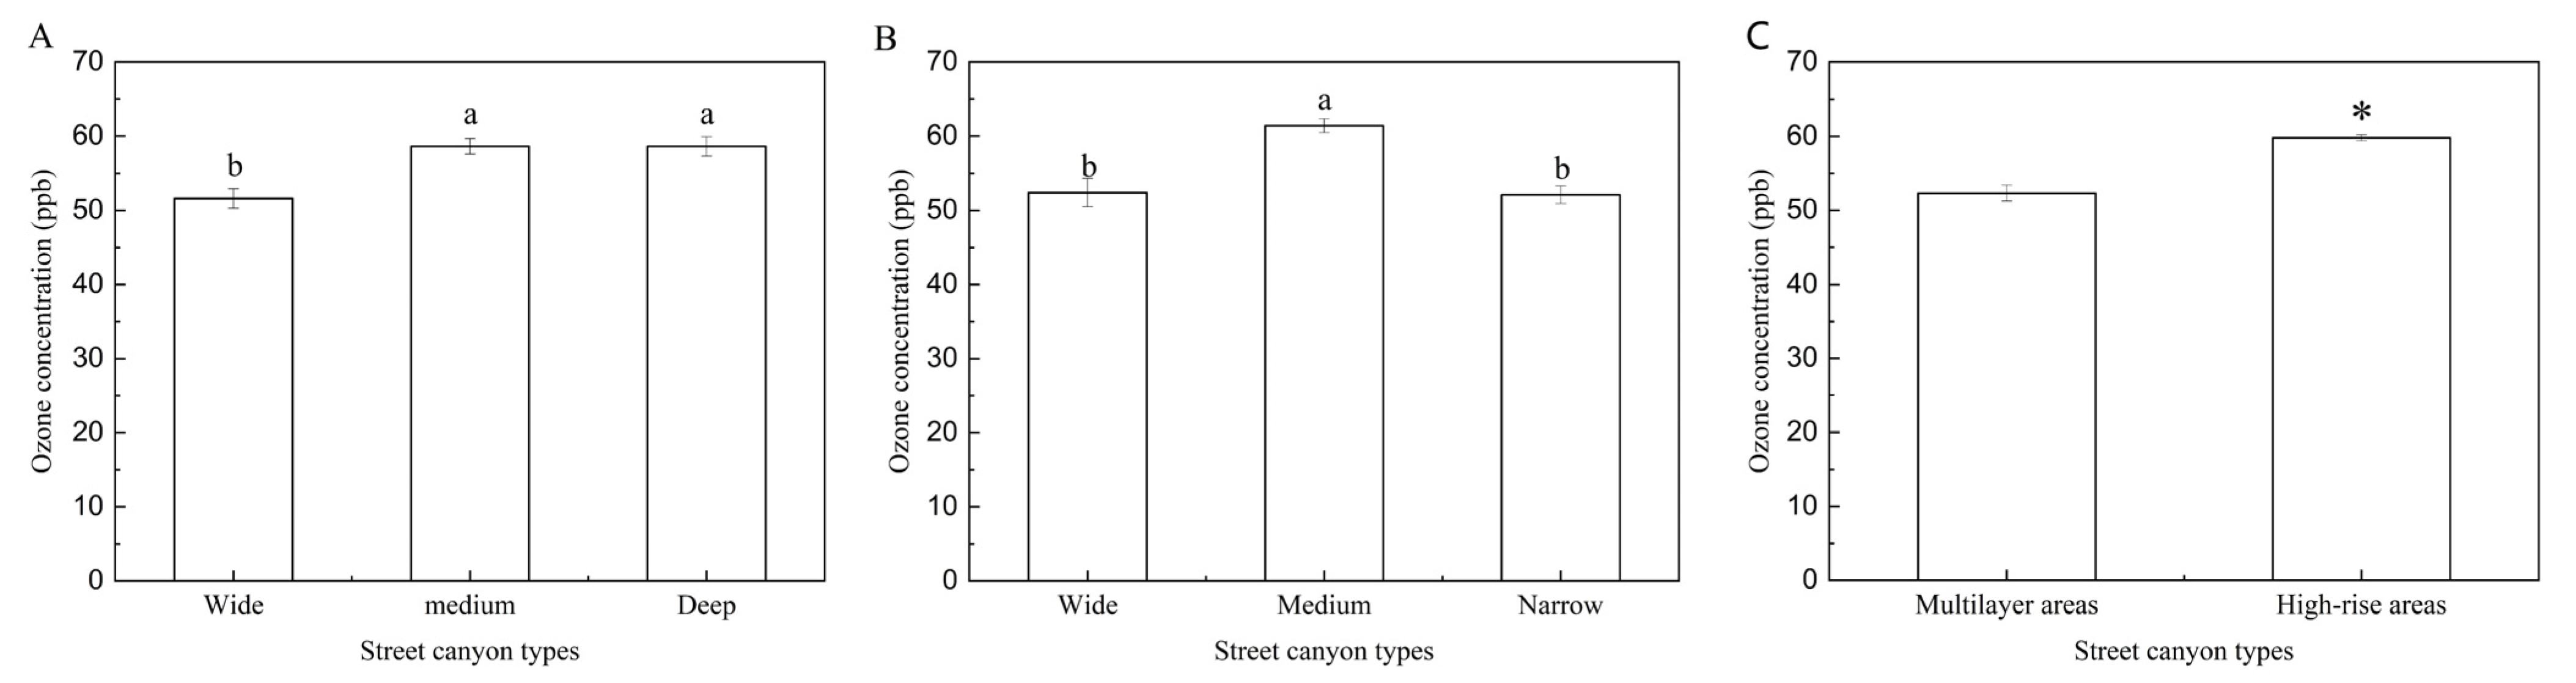
3.2. Horizontal Distribution of O3 in Street Canyons

The descriptive statistics of urban street morphology, O3 concentration, and microclimate conditions investigated in this study are summarized in Table 1. The Ars of these 23 street canyons varied from 0.41 to 4.33, with an average value of 1.45. The SVFs varied from 0.28 to 0.59, with an average value of 0.43. The BH along these streets varied from 18.85 m to 100.35 m, with an average value of 39.75 m. The investigated O3 concentration varied from 0 to 0.130 ppm, with an average concentration of 0.056 ppm. The air temperature during the investigation ranged from 11.7 °C to 36.8 °C, with an average of 27.0 °C.
The street canyon morphology significantly affected O3 concentration at pedestrian level (p < 0.05). According to the results divided by AR (Figure 4A), O3 concentration in a wide street canyon (0.052 ± 0.001 ppm) was significantly lower than in medium and deep street canyons divided by the aspect ratio. No significant difference was found in O3 concentration between medium and wide canyons (0.058 ± 0.001 ppm and 0.059 ± 0.001 ppm, respectively). O3 concentration in both narrow and wide canyons (0.052 ± 0.001 ppm and 0.052 ± 0.02 ppm, respectively) was significantly lower than in medium canyons (0.061 ± 0.001 ppm) divided by SVF (Figure 4B). Building height along the street canyons significantly affected in-canyon O3 concentration. Specifically, the concentration was markedly higher in high-rise canyons (0.060 ± 0.001 ppm) than in multilayer building canyons (0.052 ± 0.001 ppm) (Figure 4C).
According to ENVI-met modelling, O3 concentration at 2:00 p.m. in street canyons with an AR of 0.5, 1, and 2 ranged from 1.33 μg/m3 to 5.60 μg/m3, 1.53 μg/m3 to 5.61 μg/m3, and 1.25 μg/m3 to 5.47 μg/m3, respectively (Figure 5). The O3 concentration in street canyons with AR = 1 was higher than in canyons with AR = 0.5 and higher than in canyons with AR = 2. NO concentration in street canyons with AR = 0.5, 1, and 2 ranged from 24.62 μg/m3 to 55.44 μg/m3, 24.63 μg/m3 to 51.56 μg/m3, and 24.48 μg/m3 to 46.79 μg/m3, respectively. NO2 concentration in street canyons with AR = 0.5, 1, and 2 ranged from 65.38 μg/m3 to 101.33 μg/m3, 65.33 μg/m3 to 97.20 μg/m3, and 65.47 μg/m3 to 92.26 μg/m3, respectively. Both NO and NO2 concentration in street canyons decreased as AR increased.

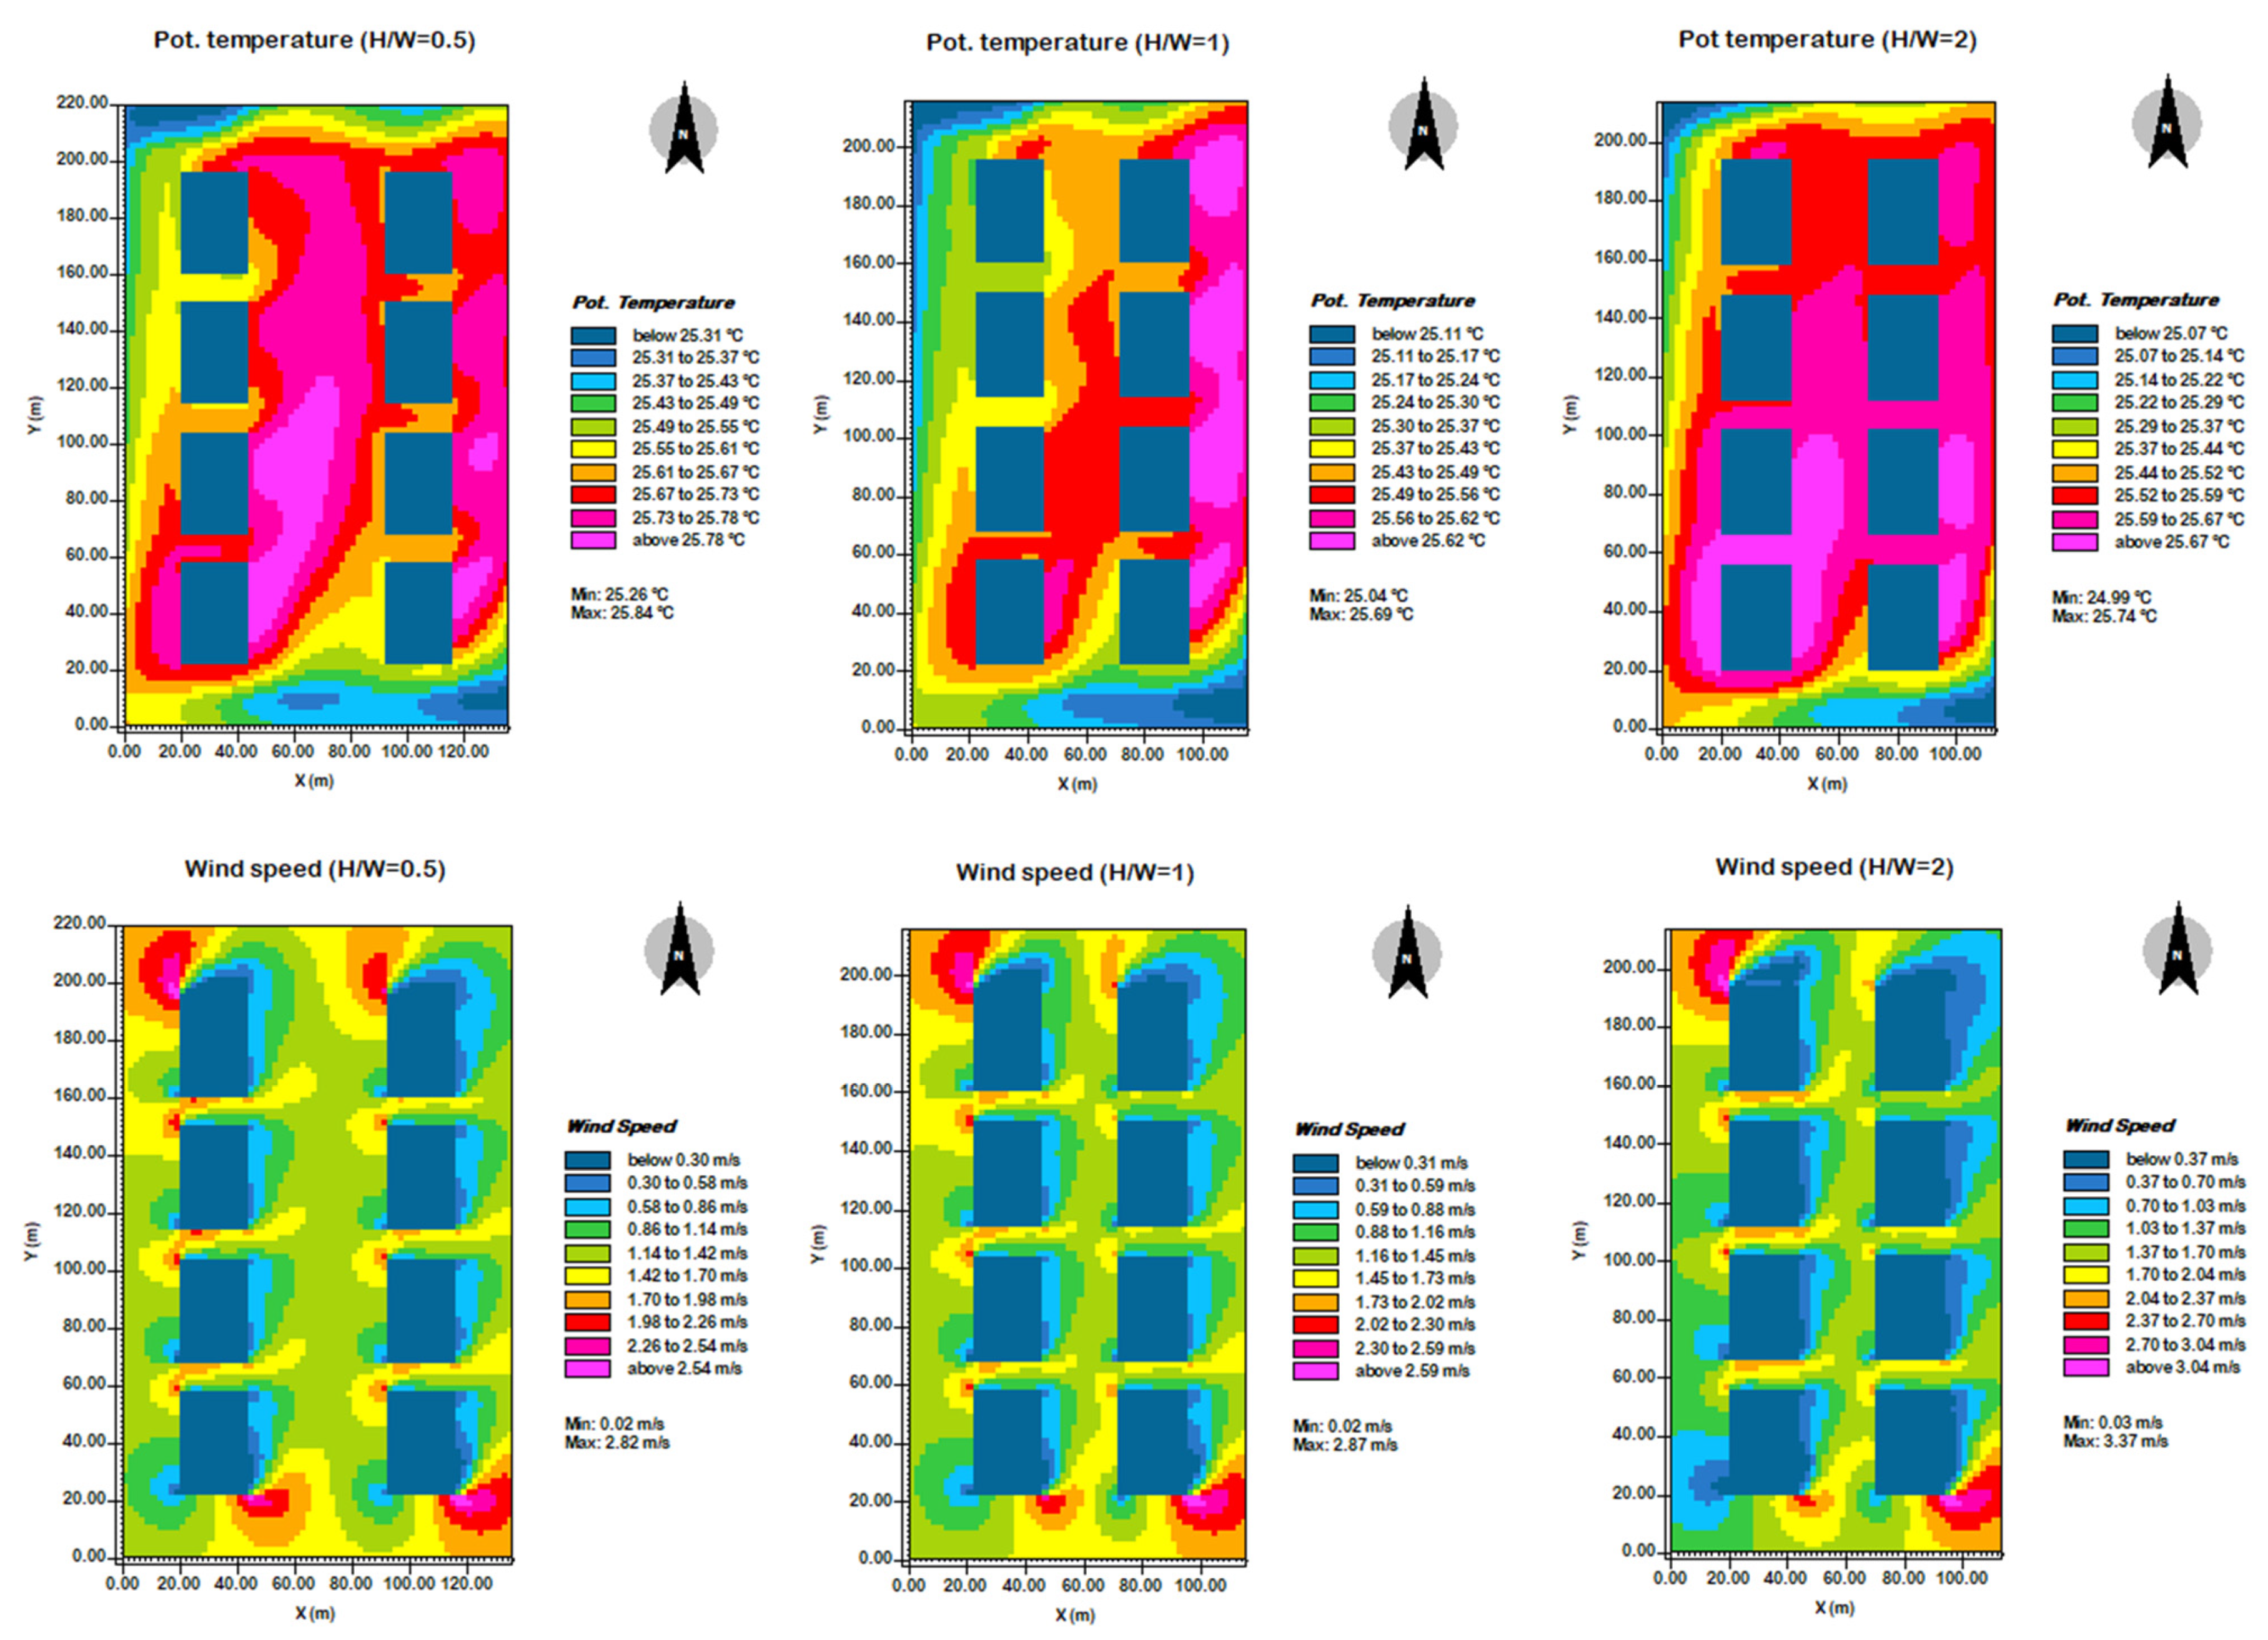
3.3. Relating O3 Concentration to Microclimatic Conditions

The Pearson correlation between O3 concentration and AR, SVF, BH, Ta, RH, WS, WD, and P are listed in Table 2. Significant correlations were shown between O3 concentration, urban street morphology, and microclimatic conditions. To be specific, significantly positive correlations were found between O3 and building height, aspect ratio, sky view factor, wind direction, wind speed, and air temperature (p < 0.01), and significantly negative correlations were found between O3 and relative humidity and atmospheric pressure (p < 0.01). Air temperature had a significantly positive correlation with building height (p < 0.01) and had a negative correlation with sky view factor (p < 0.01).
According to ENVI-met modelling, air temperature in street canyons with AR = 0.5, 1, and 2 ranged from 25.26 °C to 25.84 °C, 25.04 °C to 25.69 °C, and 24.99 °C to 25.74 °C, respectively (Figure 6). The air temperature was the highest in the canyon with AR = 1, and the lowest in the canyon with AR = 2. Moreover, it decreased from the leeward side to the windward side. Wind speed in street canyons with AR = 0.5, 1, and 2 ranged from 0.02 m/s to 2.82 m/s, 0.02 m/s to 2.87 m/s, and 0.03 m/s to 3.37 m/s, respectively. It gradually increased as AR increased. The highest speed was around the corner of the buildings.

4. Discussion

4.1. Distribution of O3 Concentration in Street Canyons

The photochemical pollution characterized by high O3 concentration exhibited featured of long duration and caused air pollution in local or downwind areas [6]. Observation-based analysis was performed to investigate the O3 distribution temporally and spatially. All of the O3 concentrations at three heights showed high levels during midday (11:00 a.m.–5:00 p.m.) in summer, when large amounts of O3 were produced by photochemical reactions [36]. The hourly variation of O3 was different than particulate matter, the concentration of which decreased from 8:00 a.m. to 4:00 p.m. and then increased until 7:00 p.m. [37]. The O3 concentration increased as the NOx emission rate decreased and the volatile organic compounds (VOC) emission rate and photolysis rate increased [38].
The O3 concentrations at pedestrian level and the middle level in the street canyons were approximate 40% higher than at roof level. Kwak et al. (2013) indicated that O3 was generally active in the region closed to the building wall, with high temperature regardless of wind flow [24]. This indicates that photochemical reactions played a more important role in in-canyon O3 distribution than dispersion. The photochemical reactions were enhanced to produce O3 in street canyons, especially in deep canyons, when compared with the atmospheric boundary layer [39].
Moreover, this study provides evidence that street canyon morphology plays an important role in O3 concentration at pedestrian level. O3 concentration had significantly positive correlations with both building height and aspect ratio (Table 2). The concentration at pedestrian level increased as the building height and aspect ratio increased (Figure 4A,C). A similar trend was found in NOx and CO over the center of downtown Beijing [10]. However, an opposite trend was found in suspended particulate matter in that its concentration decreased as building height and aspect ratio increased [15]. The O3 concentration was low in narrow street canyons divided by SVF, whereas it was high in deep canyons divided by AR (Figure 2). The SVF represents the proportion of visible sky compared to the areas obscured by buildings or trees [18]. Decreasing the building height along the two sides of street canyons results in an increase in SVF unless there are street trees [18]. The differences in O3 concentration between narrow canyons and deep canyons are probably due to street trees [40]. A CFD model simulation showed an improvement in ventilation efficiency in the presence of trees [41].

4.2. Response of O3 Distribution to Microclimatic Factors

The ground O3 concentration was closely related to microclimatic factors such as air temperature, relative humidity, wind direction, wind speed, and atmospheric pressure [42,43]. A significant correlation was found between O3 concentration and air temperature, whereas a negative correlation was found between O3 concentration and relative humidity (Table 2). Similar results were reported by previous studies from observation data [44,45]. Many studies have confirmed that low relative humidity or high air temperature was beneficial to O3 formation because this kind microclimatic factors enhanced the emission of VOCs [46,47].
The O3 distribution in street canyons is closely associated with flow therein, which depends on street canyon morphology and surface heating intensity [38]. Street canyon morphology relative to the sun’s trajectory affects microclimatic factors in canyons [48]. Air temperature in canyons had a significant positive correlation with building height, but a negative correlation with sky view factor (Table 2). Some studies showed that the nocturnal heat island increased as the aspect ratio increased [49]. However, other studies found lower air temperature in street canyons with high building height and a high aspect ratio rather than in street canyons with low height and a low aspect ratio [49]. The difference can be attributed to street canyon orientation, which has an important impact on solar shading and urban microclimate [50].
Dispersion and photochemical reactions are the two main processes determining O3 distribution in canyons [26]. On one side, we found that in-canyon air temperature was higher in medium canyons than in wide canyons, and higher than in narrow canyons. High air temperature tended to promote photochemical reactions and increase O3 chemical production [24]. This means that photochemical reaction intensity was the highest in medium canyons. On the other hand, wind speed in canyons gradually increased as AR increased. The highest O3 concentration indicated that photochemical reactions played a decisive role rather than dispersion in medium canyons.

4.3. Strengths and Limitations

Our study conducted a one-year observation on the vertical distribution of O3 in real urban street canyons, and compared O3 concentration at pedestrian level among different types of canyons by field investigation and ENVI-met modelling. This study provides an understanding the influence of dispersion and photochemical reactions on O3 distribution and contributes to urban planning and guideline making for O3 mitigation in built environments. The vertical results show that O3 accumulated in canyons rather than spread out to the atmospheric boundary layer. It is possible to enhance O3 dispersion and reduce the photochemical reaction from producing O3 through urban street design. On one side, wide canyons (AR = 0.41–0.85) were more conductive to lower O3 than medium (AR = 1.03–1.76) and narrow canyons (AR = 2.12–4.33). On the other side, photochemical reactions for O3 production played a more important role in O3 concentration than dispersion. Low temperature and high humidity were acknowledged as favorable conditions for reducing photochemical reactions. Different canyon orientations relative to the sun’s trajectory can render a solar path in canyons and a change in radiation exposure for microclimatic factors such as air temperature and relative humidity.
However, air pollution in canyons is affected by a large number of variables and uncertainties [30]. Considering this, there are several limitations to this study. Firstly, this study made us have a certain understanding of O3 distribution in an urban street canyon. However, observation at more height levels in different canyons is necessary to further explore vertical distribution of air pollutants and their driving factors. Secondly, ENVI-met modelling showed lower O3 concentration in narrow canyons than in wide canyons, whereas field investigation reported inconsistent results. The difference can probably be related to the complexity of the observation locations in real street canyons. Thirdly, this study demonstrated significant correlation between in-canyon O3 concentration and the canyon geometry and wind speed/direction (Table 2). However, street canyon morphology was not considered jointly with wind speed/direction. The influence on in-canyon O3 concentration would be different if the wind were directed along or across the street canyons. The angle between street canyons and wind direction should be consider to jointly account for the mutual street canyon/wind orientation on in-canyon O3 concentrations in the future. Finally, the in-canyon O3 distribution is the result of the trade-off between dispersion and photochemical reactions regulated by street canyon morphology. To better understand the photochemical reactions and its role in air quality, concentrations of NOx and VOC should be also investigated in real street canyons.

5. Conclusions

In this study, field investigation and ENVI-met modelling were conducted to analyze the vertical and horizontal distribution of O3 in urban street canyons and their response to microclimatic factors. The O3 concentration in the street canyons was more than 40% higher than that at roof level. The in-canyon O3 was positively correlated with air temperature, but negatively correlated with relative humidity. High temperature and low humidity were acknowledged as favorable conditions for O3 production. Moreover, this study revealed the important role of the building height, aspect ratio, and sky view factor of street canyons on O3 distribution at pedestrian level. Both field investigation and ENVI-met modelling showed high O3 concentration in medium street canyons because of high photochemical reaction. Multilayer building canyons were more favorable for removing O3 than high-rise canyons.

Author Contributions

Conceptualization, C.M. and W.C.; methodology, S.Y.; software, C.M.; validation, C.M., W.C. and S.Y.; formal analysis, C.M.; investigation, S.Y.; resources, W.C.; data curation, C.M.; writing—original draft preparation, C.M.; writing—review and editing, W.C.; visualization, S.Y.; supervision, W.C.; project administration, W.C.; funding acquisition, C.M., W.C. and S.Y. All authors have read and agreed to the published version of the manuscript.

Funding

This research was funded by the National Natural Science Foundation of China, grant numbers 41801187, 41730647, and 31901153, and the Natural Science Foundation of Liaoning Province of China, grant number 2020-MS-026. The APC was funded by 41801187, 31901153, and 2020-MS-026.

Institutional Review Board Statement

Not applicable.

Informed Consent Statement

Not applicable.

Data Availability Statement

Not applicable.

Conflicts of Interest

The authors declare no conflict of interest.

References

  1. Diao, Y.; Hu, W.; He, B.J. Analysis of the Impact of Park Scale on Urban Park Equity Based on 21 Incremental Scenarios in the Urban Core Area of Chongqing, China. Adv. Sustain. Syst. 2021, 5, 2100171. [Google Scholar] [CrossRef]
  2. United Nations. The UN Sustainable Development Goals. United Nations, New York. 2015. Available online: http://www.un.org/sustainabledevelopment/summit/ (accessed on 16 January 2018).
  3. Llaguno-Munitxa, M.; Bou-Zeid, E.; Hultmark, M. The influence of building geometry on street canyon air flow: Validation of large eddy simulations against wind tunnel experiments. J. Wind. Eng. Ind. Aerodyn. 2017, 165, 115–130. [Google Scholar] [CrossRef] [Green Version]
  4. Tao, Y.; Zhang, Z.; Ou, W.; Guo, J.; Pueppke, S.G. How does urban form influence PM2.5 concentrations: Insights from 350 different-sized cities in the rapidly urbanizing Yangtze River Delta region of China, 1998–2015. Cities 2020, 98, 102581. [Google Scholar] [CrossRef]
  5. Wu, W.; Li, L.; Li, C. Seasonal variation in the effects of urban environmental factors on land surface temperature in a winter city. J. Clean. Prod. 2021, 299, 126897. [Google Scholar] [CrossRef]
  6. Chen, X.; Situ, S.; Zhang, Q.; Wang, X.; Sha, C.; Zhouc, L.; Wu, L.; Wu, L.; Ye, L.; Li, C. The synergetic control of NO2 and O3 concentrations in a manufacturing city of southern China. Atmos. Environ. 2019, 201, 402–416. [Google Scholar] [CrossRef]
  7. El-Madany, T.S.; Niklasch, K.; Klemm, O. Stomatal and Non-Stomatal Turbulent Deposition Flux of Ozone to a Managed Peatland. Atmosphere 2017, 8, 175. [Google Scholar] [CrossRef] [Green Version]
  8. Yu, S. Fog geoengineering to abate local ozone pollution at ground level by enhancing air moisture. Environ. Chem. Lett. 2019, 17, 565–580. [Google Scholar] [CrossRef]
  9. Kalisa, E.; Fadlallah, S.; Amani, M.; Nahayo, L.; Habiyaremye, G. Temperature and air pollution relationship during heatwaves in Birmingham, UK. Sustain. Cities Soc. 2018, 43, 111–120. [Google Scholar] [CrossRef] [Green Version]
  10. Fu, X.; Liu, J.; Ban-Weiss, G.A.; Zhang, J.; Huang, X.; Ouyang, B.; Popoola, O.; Tao, S. Effects of canyon geometry on the distribution of traffic-related air pollution in a large urban area: Implications of a multi-canyon air pollution dispersion model. Atmos. Environ. 2017, 165, 111–121. [Google Scholar] [CrossRef]
  11. Yang, Y.; Zhou, D.; Gao, W.; Zhang, Z.; Chen, W.; Peng, W. Simulation on the impacts of the street tree pattern on built summer thermal comfort in cold region of China. Sustain. Cities Soc. 2018, 37, 563–580. [Google Scholar] [CrossRef]
  12. Pirjola, L.; Lahde, T.; Niemi, J.V.; Kousa, A.; Ronkko, T.; Karjalainen, P.; Keskinen, J.; Frey, A.; Hillamo, R. Spatial and temporal characterization of traffic emissions in urban microenvironments with a mobile laboratory. Atmos. Environ. 2012, 63, 156–167. [Google Scholar] [CrossRef]
  13. Di Bernardino, A.; Monti, P.; Leuzzi, G.; Querzoli, G. Pollutant fluxes in two-dimensional street canyons. Urban Clim. 2018, 24, 80–93. [Google Scholar] [CrossRef]
  14. Eeftens, M.; Odabasi, D.; Fluckiger, B.; Davey, M.; Ineichen, A.; Feigenwinter, C.; Tsai, M.-Y. Modelling the vertical gradient of nitrogen dioxide in an urban area. Sci. Total Environ. 2019, 650, 452–458. [Google Scholar] [CrossRef] [PubMed]
  15. Miao, C.; Yu, S.; Hu, Y.; Zhang, H.; He, X.; Chen, W. Review of methods used to estimate the sky view factor in urban street canyons. Build. Environ. 2020, 168, 105497. [Google Scholar] [CrossRef]
  16. Arnfield, A.J. Two decades of urban climate research: A review of turbulence, exchanges of energy and water, and the urban heat island. Int. J. Climatol. 2003, 23, 1–26. [Google Scholar] [CrossRef]
  17. Unger, J. Connection between urban heat island and sky view factor approximated by a software tool on a 3D urban database. Int. J. Environ. Pollut. 2009, 36, 59–80. [Google Scholar] [CrossRef] [Green Version]
  18. Miao, C.; Yu, S.; Hu, Y.; Bu, R.; Qi, L.; He, X.; Chen, W. How the morphology of urban street canyons affects suspended particulate matter concentration at the pedestrian level: An in-situ investigation. Sustain. Cities Soc. 2020, 55, 102042. [Google Scholar] [CrossRef]
  19. Hang, J.; Li, Y.; Sandberg, M.; Buccolieri, R.; Di Sabatino, S. The influence of building height variability on pollutant dispersion and pedestrian ventilation in idealized high-rise urban areas. Build. Environ. 2012, 56, 346–360. [Google Scholar] [CrossRef]
  20. He, B.-J.; Ding, L.; Prasad, D. Relationships among local-scale urban morphology, urban ventilation, urban heat island and outdoor thermal comfort under sea breeze influence. Sustain. Cities Soc. 2020, 60, 102289. [Google Scholar] [CrossRef]
  21. He, B.-J.; Ding, L.; Prasad, D. Wind-sensitive urban planning and design: Precinct ventilation performance and its potential for local warming mitigation in an open midrise gridiron precinct. J. Build. Eng. 2020, 29, 101145. [Google Scholar] [CrossRef]
  22. He, B.-J.; Ding, L.; Prasad, D. Urban ventilation and its potential for local warming mitigation: A field experiment in an open low-rise gridiron precinct. Sustain. Cities Soc. 2020, 55, 102028. [Google Scholar] [CrossRef]
  23. He, L.; Hang, J.; Wang, X.; Lin, B.; Li, X.; Lan, G. Numerical investigations of flow and passive pollutant exposure in high-rise deep street canyons with various street aspect ratios and viaduct settings. Sci. Total Environ. 2017, 584, 189–206. [Google Scholar] [CrossRef] [PubMed]
  24. Kwak, K.-H.; Baik, J.-J.; Lee, K.-Y. Dispersion and photochemical evolution of reactive pollutants in street canyons. Atmos. Environ. 2013, 70, 98–107. [Google Scholar] [CrossRef]
  25. Zheng, T.; Li, B.; Li, X.-B.; Wang, Z.; Li, S.-Y.; Peng, Z.-R. Vertical and horizontal distributions of traffic-related pollutants beside an urban arterial road based on unmanned aerial vehicle observations. Build. Environ. 2021, 187, 107401. [Google Scholar] [CrossRef]
  26. Huang, Y.; Lei, C.; Liu, C.-H.; Perez, P.; Forehead, H.; Kong, S.; Zhou, J.L. A review of strategies for mitigating roadside air pollution in urban street canyons. Environ. Pollut. 2021, 280, 116971. [Google Scholar] [CrossRef] [PubMed]
  27. Jana, A.; Sarkar, A.; Bardhan, R. Analysing outdoor airflow and pollution as a parameter to assess the compatibility of mass-scale low-cost residential development. Land Use Policy 2020, 99, 105052. [Google Scholar] [CrossRef]
  28. Hassan, A.M.; Elmokadem, A.A.; Megahed, N.A.; Eleinen, O.M.A. Urban morphology as a passive strategy in promoting outdoor air quality. J. Build. Eng. 2020, 29, 101204. [Google Scholar] [CrossRef]
  29. Yang, J.; Shi, B.; Shi, Y.; Marvin, S.; Zheng, Y.; Xia, G. Air pollution dispersal in high density urban areas: Research on the triadic relation of wind, air pollution, and urban form. Sustain. Cities Soc. 2020, 54, 101941. [Google Scholar] [CrossRef]
  30. Voordeckers, D.; Meysman, F.J.R.; Billen, P.; Tytgat, T.; Van Acker, M. The impact of street canyon morphology and traffic volume on NO2 values in the street canyons of Antwerp. Build. Environ. 2021, 197, 107825. [Google Scholar] [CrossRef]
  31. Gong, J.; Hu, Y.; Liu, M.; Bu, R.; Chang, Y.; Bilal, M.; Li, C.; Wu, W.; Ren, B. Land Use Regression Models Using Satellite Aerosol Optical Depth Observations and 3D Building Data from the Central Cities of Liaoning Province, China. Pol. J. Environ. Stud. 2016, 25, 1015–1026. [Google Scholar] [CrossRef]
  32. Bruse, M.; Fleer, H. Simulating surface-plant-air interactions inside urban environments with a three dimensional numerical model. Environ. Model. Softw. 1998, 13, 373–384. [Google Scholar] [CrossRef]
  33. Simon, H.; Lindén, J.; Hoffmann, D.; Braun, P.; Bruse, M.; Esper, J. Modeling transpiration and leaf temperature of urban trees—A case study evaluating the microclimate model ENVI-met against measurement data. Landsc. Urban Plan. 2018, 174, 33–40. [Google Scholar] [CrossRef]
  34. Hofman, J.; Samson, R. Biomagnetic monitoring as a validation tool for local air quality models: A case study for an urban street canyon. Environ. Int. 2014, 70, 50–61. [Google Scholar] [CrossRef] [PubMed]
  35. Morakinyo, T.-E.; Lam, Y.-F.; Hao, S. Evaluating the role of green infrastructures on near-road pollutant dispersion and removal: Modelling and measurement. J. Environ. Manag. 2016, 182, 595–605. [Google Scholar] [CrossRef]
  36. Zou, Y.; Charlesworth, E.; Yin, C.Q.; Yan, X.L.; Deng, X.J.; Li, F. The weekday/weekend ozone differences induced by the emissions change during summer and autumn in Guangzhou, China. Atmos. Environ. 2019, 199, 114–126. [Google Scholar] [CrossRef]
  37. Lu, K.F.; He, H.D.; Wang, H.W.; Li, X.B.; Peng, Z.R. Characterizing temporal and vertical distribution patterns of traffic-emitted pollutants near an elevated expressway in urban residential areas. Build. Environ. 2021, 172, 106678. [Google Scholar] [CrossRef]
  38. Kwak, K.-H.; Baik, J.-J. Diurnal variation of NOx and ozone exchange between a street canyon and the overlying air. Atmos. Environ. 2014, 86, 120–128. [Google Scholar] [CrossRef]
  39. Zhong, J.; Cai, X.-M.; Bloss, W.J. Large eddy simulation of reactive pollutants in a deep urban street canyon: Coupling dynamics with O3-NOx-VOC chemistry. Environ. Pollut. 2017, 224, 171–184. [Google Scholar] [CrossRef] [Green Version]
  40. Abhijith, K.V.; Kumar, P.; Gallagher, J.; McNabola, A.; Baldauf, R.; Pilla, F.; Broderick, B.; Di Sabatino, S.; Pulvirenti, B. Air pollution abatement performances of green infrastructure in open road and built-up street canyon environments—A review. Atmos. Environ. 2017, 162, 71–86. [Google Scholar] [CrossRef]
  41. Moradpour, M.; Afshin, H.; Farhanieh, B. A numerical investigation of reactive air pollutant dispersion in urban street canyons with tree planting. Atmos. Pollut. Res. 2017, 8, 253–266. [Google Scholar] [CrossRef]
  42. Ueno, H.; Tsunematsu, N. Sensitivity of ozone production to increasing temperature and reduction of precursors estimated from observation data. Atmos. Environ. 2019, 214, 116818. [Google Scholar] [CrossRef]
  43. Wang, Z.; Li, J.; Liang, L. Spatio-temporal evolution of ozone pollution and its influencing factors in the Beijing-Tianjin-Hebei Urban Agglomeration. Environ. Pollut. 2020, 256, 113419. [Google Scholar] [CrossRef] [PubMed]
  44. Ooka, R.; Khiem, M.; Hayami, H.; Yoshikado, H.; Huang, H.; Kawamoto, Y. Influence of meteorological conditions on summer ozone levels in the central Kanto area of Japan. Procedia Environ. Sci. 2011, 4, 138–150. [Google Scholar] [CrossRef] [Green Version]
  45. Wu, Y.; Zhao, K.; Huang, J.; Arend, M.; Gross, B.; Moshary, F. Observation of heat wave effects on the urban air quality and PBL in New York City area. Atmos. Environ. 2019, 218, 117024. [Google Scholar] [CrossRef]
  46. Toh, Y.Y.; Lim, S.F.; von Glasow, R. The influence of meteorological factors and biomass burning on surface ozone concentrations at Tanah Rata, Malaysia. Atmos. Environ. 2013, 70, 435–446. [Google Scholar] [CrossRef]
  47. Chen, Z.; Li, R.; Chen, D.; Zhuang, Y.; Gao, B.; Yang, L.; Li, M. Understanding the causal influence of major meteorological factors on ground ozone concentrations across China. J. Clean. Prod. 2020, 242, 118498. [Google Scholar] [CrossRef]
  48. Qaid, A.; Bin Lamit, H.; Ossen, D.R.; Rasidi, M.H. Effect of the position of the visible sky in determining the sky view factor on micrometeorological and human thermal comfort conditions in urban street canyons. Theor. Appl. Climatol. 2018, 131, 1083–1100. [Google Scholar] [CrossRef]
  49. Johansson, E.; Emmanuel, R. The influence of urban design on outdoor thermal comfort in the hot, humid city of Colombo, Sri Lanka. Int. J. Biometeorol. 2006, 51, 119–133. [Google Scholar] [CrossRef]
  50. Ali-Toudert, F.; Mayer, H. Numerical study on the effects of aspect ratio and orientation of an urban street canyon on outdoor thermal comfort in hot and dry climate. Build. Environ. 2007, 42, 1553–1554. [Google Scholar] [CrossRef]
Figure 1. Geographical location of Shenyang in China (A) and the fixed observation site (red star) and 23 sampling sites (black points) investigated in Shenyang (B).
Buildings 12 00262 g001
Figure 2. Violin plots showing monthly variations of O3 concentration in the street canyon at three levels: pedestrian level, middle level, and roof level.
Buildings 12 00262 g002
Figure 3. Hourly variations of O3 concentration in the street canyon at three levels: pedestrian level, middle level, and roof level.
Buildings 12 00262 g003
Figure 4. Ozone concentration (mean ± standard error) at 1.5 m varied among different types of street canyons divided by the AR (A), SVF (B), and building height (C). * and letters (a,b) represent the statistical difference between treatments. Different letters indicate significant difference in ozone concentration was found in different street canyon types.
Buildings 12 00262 g004
Figure 5. O3, NO, and NO2 distribution at 1.5 m height in street canyons with AR = 0.5, 1, and 2 at 2:00 p.m.
Buildings 12 00262 g005
Figure 6. Air temperature and wind speed at 1.5 m height in street canyons with AR = 0.5, 1, and 2 at 2:00 p.m.
Buildings 12 00262 g006
Table 1. Statistical characteristics of urban street morphology, ozone, and microclimate conditions at 1.5 m.
IndexMin.25%Medium75%Max.AverageSE
AR0.410.791.072.124.331.450.21
SVF0.280.340.440.510.590.430.02
BH (m)18.8519.8025.3550.35100.3539.755.38
O3 (ppb)0396175130561
Ta (°C)11.7024.2327.6030.2036.8027.000.12
RH (%)19.8038.0246.0555.0070.1045.220.34
WS (m/s)00.831.312.1713.031.620.03
WD (°)092.50192.00256.00358.00179.662.72
P (Pa)9439981000100510171001.170.18
AR = aspect ratio; SVF = sky view factor; BH = building height; Ta = air temperature; RH = relative humidity; WS = wind speed; WD = wind direction; P = atmospheric pressure; SE = standard error.
Table 2. Pearson correlation coefficients (r) between pairs of O3 concentration and building height (BH), aspect ratio (AR), sky view factor (SVF), relative humidity (RH), wind direction (WD), wind speed (WS), atmospheric pressure (P), and air temperature (Ta) at 1.5 m. * p < 0.05; ** p < 0.01.
BHARSVFRHWDWSPTaO3
O30.185 **0.076 **0.066 *−0.159 **0.117 **0.280 **−0.093 **0.430 **1
Ta0.105 **−0.001−0.126 **−0.0170.0270.175 **−0.564 **1
Publisher’s Note: MDPI stays neutral with regard to jurisdictional claims in published maps and institutional affiliations.

