1. Introduction
Project management is critical to successfully completing a mission [
1,
2]. Project management aims to keep the project on track and find the right balance between cost, time, and quality, which, if not appropriately managed, can lead to serious negative consequences and project failure [
3]. However, there is ample evidence that the success of many construction projects may be compromised by a variety of unanticipated risks and losses [
4,
5]. Projects are, indeed, characterized by uncertainty and risk, and they are frequently carried out in a dynamic and complex environment, which may exacerbate the consequences of the risks [
6]. The most common problems are a lack of economic justification for the project’s operation, efficiency reduction, and dissatisfaction [
7]. Internal and external factors can contribute to project failures if not considered during project planning and management. Due to the complexity, changes, and competition in the project environment, which causes many risks [
8], organizations need to use appropriate risk management strategies to evaluate, manage, and control risk [
9,
10].
Construction companies’ ability to collect, store, and disseminate information to improve risk management in construction projects has been questioned by many researchers [
11,
12]. Even though systematic risk management’s advantages have been extensively discussed [
13,
14,
15], construction companies, particularly in developing countries, have been slow to adopt it due to a lack of appropriate decision-making processes and tools [
16]. This motivates a great deal of interest in developing systematic risk management frameworks [
17,
18,
19,
20,
21]. However, assumptions and methodological flaws are inherent in every tool or approach, and the research is still needed for the development of a comprehensive framework with regards to uncertainty and real-life constraints. Hence, there are still many unanswered questions regarding construction risk management, particularly in terms of developing an effective response strategy need to be addressed.
This research aims to contribute new theoretical and practical insights to the growing body of knowledge about reducing risks associated with construction project management, particularly in countries where the construction sector is increasingly vulnerable to unexpected risks. As a result, the main contribution of this study is to provide a framework for selecting risk response strategies that maximize the utility function. Different recent and state of the art metaheuristic algorithms including the ant lion optimizer (ALO), dragonfly algorithm (DA), grasshopper optimization algorithm (GOA), Harris hawks optimization (HHO), moth-flame optimization algorithm (MFO), multi-verse optimizer (MVO), sine cosine algorithm (SCA), salp swarm algorithm (SSA), whale optimization algorithm (WOA), grey wolf optimizer (GWO) are applied. These algorithms are validated by the exact solver from CPLEX software and compared with each other. The outcomes of this study enable project-based company managers to make more effective risk-response decisions during planning and before implementation.
The paper has been structured as follows:
Section 2 provides a literature review.
Section 3 deals with methodology and provides information about each step.
Section 4 presents the practical implementation of the new proposed methodology in an Iranian construction company.
Section 5 solves our case study to analyze the proposed optimization model and compare our metaheuristic algorithms. Finally, the conclusion and managerial insights are explained in the last section.
2. Literature Review
According to our knowledge and review articles in this area, the first article can be referred to the approach proposed by Ben-David and Raz [
22], who developed a simple zero-one model to select risk response strategy. Similarly, the first general framework in risk response management can be attributed to Ben-David et al. [
23]. They provided a general framework with a mathematical model and an innovative algorithm to select a set of responses. The objective function was to minimize the total expected risks’ costs. Using various decision-making and optimization techniques has led to an increase in the number of studies in this field. Wu et al. [
24] proposed a novel risk response method by opening the project process’s black box and considering risk correlations among different subprocesses to assist practitioners in developing a practical risk response plan. This study began by identifying risk factors based on two-dimensional criteria known as risk categories and project development subprocesses. The risk correlations between different subprocesses were then considered to determine the true impact of each process’s risk factor. Finally, under resource constraints, a multi-objective risk response model was developed to minimize the total expected losses, total expected schedule delay, and total expected quality reduction. Zuo and Zhang [
25] proposed an optimization method to address the problem of selecting risk response actions (RRAs) while taking secondary risk into account. The optimization model aimed to reduce total risk costs while keeping the project timeline in mind. By solving the model, it is possible to obtain an optimal set of RRAs as well as the earliest start time for each activity.
Zhang and Guan [
26] used a bow-tie chart drawn by several experts to select appropriate risk prevention and response strategies. Then, an optimization model was used to choose the best strategies. This optimization model was then solved by using Lingo software. Later, Wang et al. [
27] used a simulated risk interaction network model including a binary matrix to evaluate risk response decision making and an improved refrigeration simulation algorithm to optimize responses. Buganová and Šimíčková [
28] analyzed and compared risk management considering the perspective of the traditional approach and different models of risk responses and, finally, introduced the most appropriate approach for some industries. Shoar and Nazari [
29] presented a framework for addressing the risk response action selection problem by considering the impact of risk events on project objectives, risk event interactions, and management criteria and preferences. Therefore, a framework was developed by an ant colony optimization (ACO) and a multi-criteria decision-making (MCDM) approach. In another study, Zhang et al. [
30] used an integrating case-based analysis and fuzzy optimization to make decisions about risk response. As a result, the optimal set of responses was selected. Chaouch et al. [
31] provided a framework for risk management implementation in development projects and considered the proposed optimization framework as a methodology and standard project management as a project risk management guide.
Beltrão and Carvalho [
32] presented a reliable and practical methodology to identify construction-related risks. They prioritized the main risks of main construction through prioritizing a fuzzy analytic hierarchical practical model. This model included three stages: (1) risk identification and development of risk failure structure, (2) pairwise comparison, and (3) risk prioritization. Ahmadi-Javid et al. [
33] presented a mathematical optimization-based method for selecting an appropriate set of a priori local and global responses to address risks that threaten a project portfolio. They considered key factors such as cost, budget, project preference weights, risk-event probabilities, interdependencies among work packages, and both occurrence and impact dependencies among risk events. Zhang et al. [
34] presented a method for controlling the risk probabilities of construction projects based on integrated TOPSIS and set pair analysis (SPA). The risk-mitigation effect matrix is used by SPA to evaluate risk levels. The TOPSIS ranks the risk-mitigation effects of the safety-measure combinations and quickly determines the optimal combination using dichotomy. The TOPSIS–SPA method seeks to identify the best combination of safety measures for reducing risks to an acceptable level. Wang et al. [
35] explored a novel approach for optimizing the risk response decisions under risk interactions, which is composed of a simulation model and an optimization model within the modified genetic algorithm.
Mokhtari and Aghagoli [
36] proposed a hybrid Bayesian model and fuzzy optimization to minimize the risk response costs. Finally, Boral et al. [
37] developed an integrated fuzzy hierarchical approach considering the points of the structure of project failure and the interaction between risks. Fallahpour et al. [
38] considered different risks and criteria based on Industry 4.0 and incorporated them with sustainable supplier selection in a case study for the wood industry in Iran. Guan et al. [
39] presented an analytical approach for allocating the response budget between risk prevention and risk protection to manage risks effectively in a project. The proposed method considers the project’s risk characteristics, risk response strategy, and requirement and models the relationship between risk response cost and effect as both linear and non-linear. Yan et al. [
40] developed a credibility-based fuzzy chance-constrained programming (CFCCP) model to generate appropriate risk response strategies for international construction project managers (PMs) while accounting for their different risk preferences. A fuzzy interactive solution method was used to solve this multi-objective model. Additionally, the model’s performance was validated through a real-world international industrial plant project.
Zhang and Guan [
41] proposed a method for allocating response budgets based on fault tree analysis. They developed an optimization model from both preventive and protective perspectives. The proposed method consisted of two major steps. The first step was to analyze and calculate the risk’s probability and loss. The next step was to create an optimization model for allocating the response budget. Parsaei Motamed and Bamdad [
42] provided a goal programming model for secondary risks to minimize undesirable deviations from expected changes in project cost, time, and quality due to the risk occurrence. Following the solution of this model, an optimal set of both primary and secondary response actions was chosen. A case study on the environmental risks of an oil and gas project was conducted to demonstrate the model’s effectiveness.
Having a conclusion for the literature review and identifying the research gaps, as far as we studied, the research on a comprehensive framework for the risk management of construction projects considering utility functions and budget constraints is still scarce. This study also applies innovative metaheuristics, which are recently proposed algorithms for solving optimization models.
3. Problem Definition
Inherently, construction projects are subject to various internal and external risks. If projects are not effectively managed, there will be cost overruns and delays. As a result, managing construction project risks is a constant challenge that should be addressed at each project stage. Risk management is a multi-step process that typically includes risk identification, analysis, response plan, response implementation, and ongoing risk monitoring as part of a project’s overall risk management strategy. Effective risk management is critical to accomplishing the project’s goals and fulfilling the sustainable development goals of the organizations.
Risk identification, which identifies and documents related risks, is the first stage in project risk management. The following stage is the process of assessing the project’s risks based on characteristics, such as probability and effect. The risk response strategy refers to the development, selection, and implementation of strategies to minimize exposed risk, which significantly reduces the negative impacts of project risks. As a result, optimizing the risk response analysis is a challenging task. Using the results of this optimization, response strategies should be chosen to minimize the total risk reflected in the project’s implementation, which has already been identified and analyzed.
In the majority of studies, risks are considered independently in risk response analysis. Indeed, because project risks are not always independent, they can be mutually reinforced in the project. As a result of this issue, risk interactions should be addressed as part of risk analysis. As one of the significant elements in defining the project’s complexity, interactions between risks cause an increase in the complexity of risk management models. As a result, risk response analysis optimization problems are regarded as complex. As the project’s complexities grow, more issues emerge as solutions to risk prioritization and strategy development are developed. As a result, it stands to reason that project managers will be able to make effective risk response decisions if the risk interaction can be truly amended.
This study aims to develop a risk management approach to select risk response strategies in projects to address the current challenges associated with risks in construction projects. The risk response strategy optimization model maximizes the project’s utility. In the case study, the utility objective function is non-linear exponential, which we convert into a linear model to reduce its complexity and then solve using CPLEX software. Since our optimization model is non-convex and non-linear, we need to use approximate solutions by metaheuristic algorithms for finding an optimal solution in a reasonable time. The proposed approach for project risk management begins by identifying key risks and response strategies. The risk interaction is then measured using this method. The weight or strength of the risks is then calculated. Because of the risk interdependence, the risk interaction is chosen for the selection of risk response strategies based on the output of the optimization model. Finally, the effects of risk interdependence on project risk response decisions are investigated, and the effects of key parameters have been evaluated.
4. Proposed Risk Management Framework
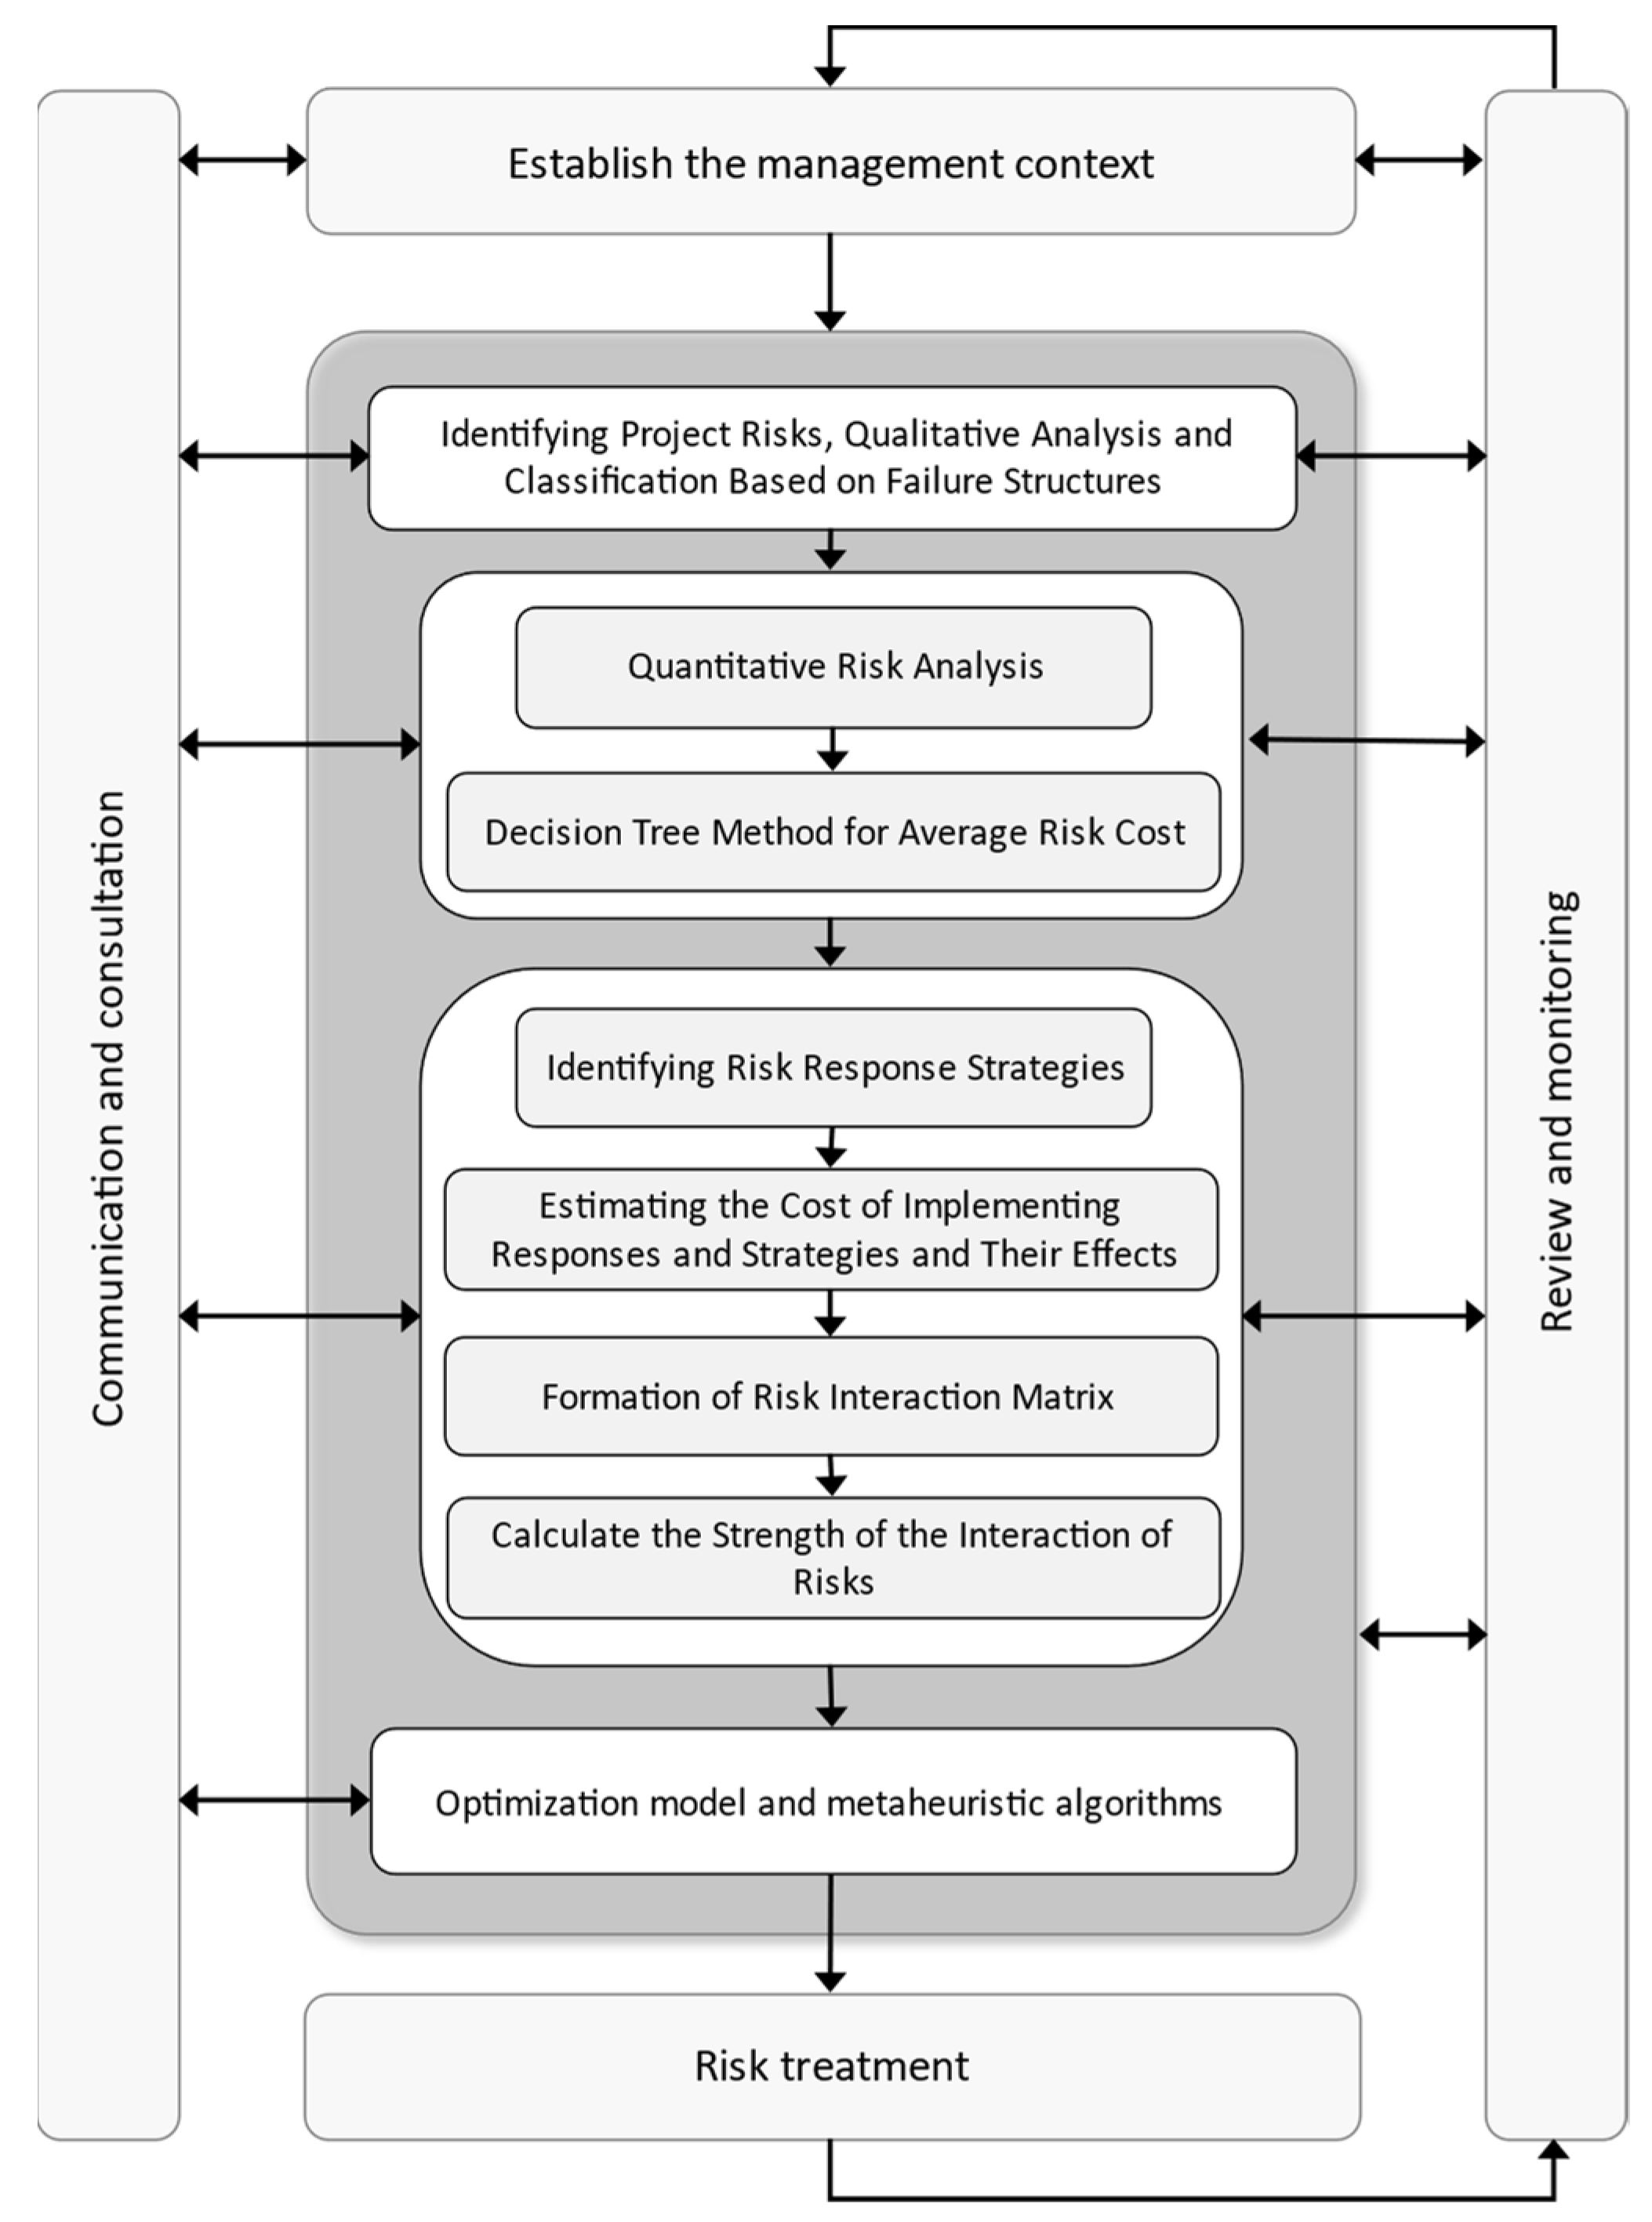
According to recent studies in the field of project risk management and project management body of knowledge (PMBOK) standards [
43], risk management in this project consists of seven stages, including risk management planning, risk identification, qualitative risk analysis, quantitative risk analysis, risk response implementation using optimization, and risk monitoring and control [
44]. As shown in
Figure 1, the proposed framework for selecting risk response strategies are illustrated. The risks have been identified in the initial stage of the framework. In this regard, qualitative analyses and the failure strictures have been provided. In the next stage, some quantitative risk analyses are done by transforming our qualitative metrics in the previous step. Then, we have considered the uncertainty for our parameters and estimated the expected cost based on the decision tree method for the average risk cost. In the next stage, the proposed risk response strategies to address our risk factors have been provided. Next, the cost estimations of risk response strategies are provided. In the next step, the interaction of risks and their responses are explained and identified. Based on these relations, the strength of the interaction of risks is calculated in the next step. Based on all these computations, our optimization model is provided. In addition, the proposed utility function and our weighting method are explained. Finally, this model is linearized to ease its computation by the CPLEX software. After selecting appropriate risk response strategies, the actions are taken.
Step 1: Identifying Project Risks, Qualitative Analysis, and Classification Based on Failure Structures: Qualitative risk analysis provides a quick initial review of project risks as well as a quick assessment of project risk importance. Prioritizing risk response planning necessitates a qualitative risk analysis. The main benefit of this process is that it focuses on major risks. The important risks of the project are selected and identified based on previous experiences with similar projects. Then, minor risks are eliminated through qualitative analysis of the identified risks, and the remaining risks are classified according to the project process for more specialized study.
Step 2:Quantitative Risk Analysis: Quantitative risk analysis is a numerical analysis process based on the combination of individual risks [
27]. Quantitative risk analysis is used to examine an in-depth analysis of the risks’ effects identified and prioritized through qualitative analysis. To evaluate effects, all of the project’s effective risks are used. The desired loss is calculated as a cost over time by taking the minimum and maximum risk costs into account. The maximum risk cost is calculated based on the chosen range and the difference between the limits.
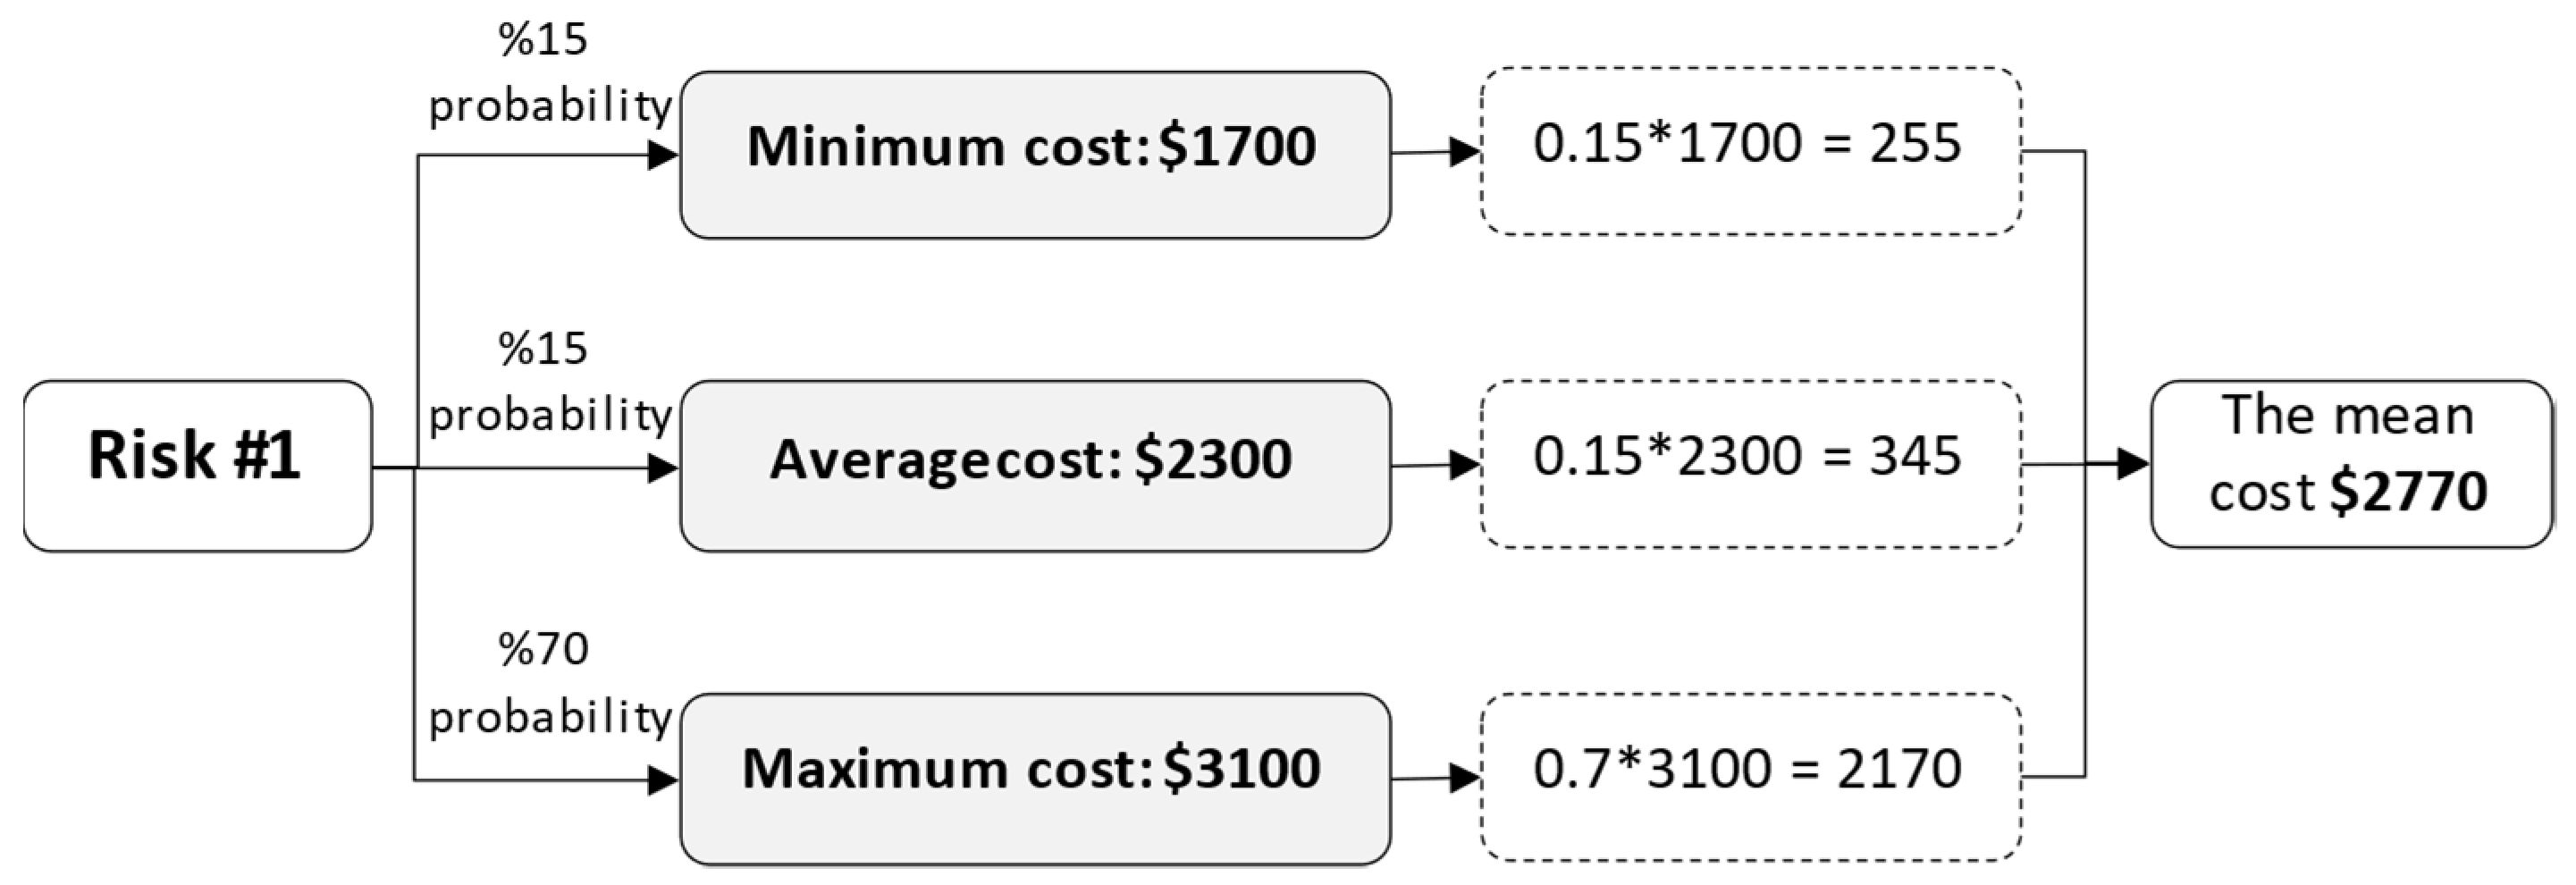
Step 3:Decision Tree Method for Average Risk Cost: The average cost of each risk is calculated after calculating the minimum, maximum, and average cost of risk. The decision tree method [
27] is used to calculate the cost of each risk based on the three perspectives of optimism, pessimism, and realism, from which its probability is determined. For example, the optimistic case is the minimum cost (
$1700). The realistic case is the average cost (
$2300). Finally, the pessimistic case is the maximum cost (
$3100).
Figure 2 depicts this example of the expected risk cost for the Risk #1 project, which has a probability of 15% optimistic, 15% realistic, and 70% pessimistic, with a total cost of
$2770 in the project.
Step 4:Identifying Risk Response Strategies: Risk response refers to the developed, selected, and implemented strategies to reduce project risk. Furthermore, risk response plays an important role in mitigating the negative impacts of the project risks. In this step, the goal is to identify our proposed risk strategies which are directly related to the details of our construction project and our previously defined risks. Appropriate risk response strategies should be developed to reduce losses that have previously been identified, analyzed, and selected during project implementation. As a result, risk response analysis can be an important factor in assessing project risk management. Initially, appropriate risk response strategies are proposed for each risk. After thoroughly reviewing each of them, approved strategies are finally selected.
Step 5:Estimating the Cost of Implementing Responses and Strategies and Their Effects: Following the selection of the approved risk-response strategies, the cost of implementing each strategy and its effects, i.e., the expected reduced loss, should be obtained [
18,
19,
20]. The effect of strategy implementation on risk is shown by
which indicates the effect of risk response after implementing risk response strategy (
) to deal with
risk event [
21,
22,
23,
24,
25]. For example,
indicates the effect of response strategy 1 on risk 2, and its number indicates the reduction in the average cost of the second risk after the implementation of the first strategy.
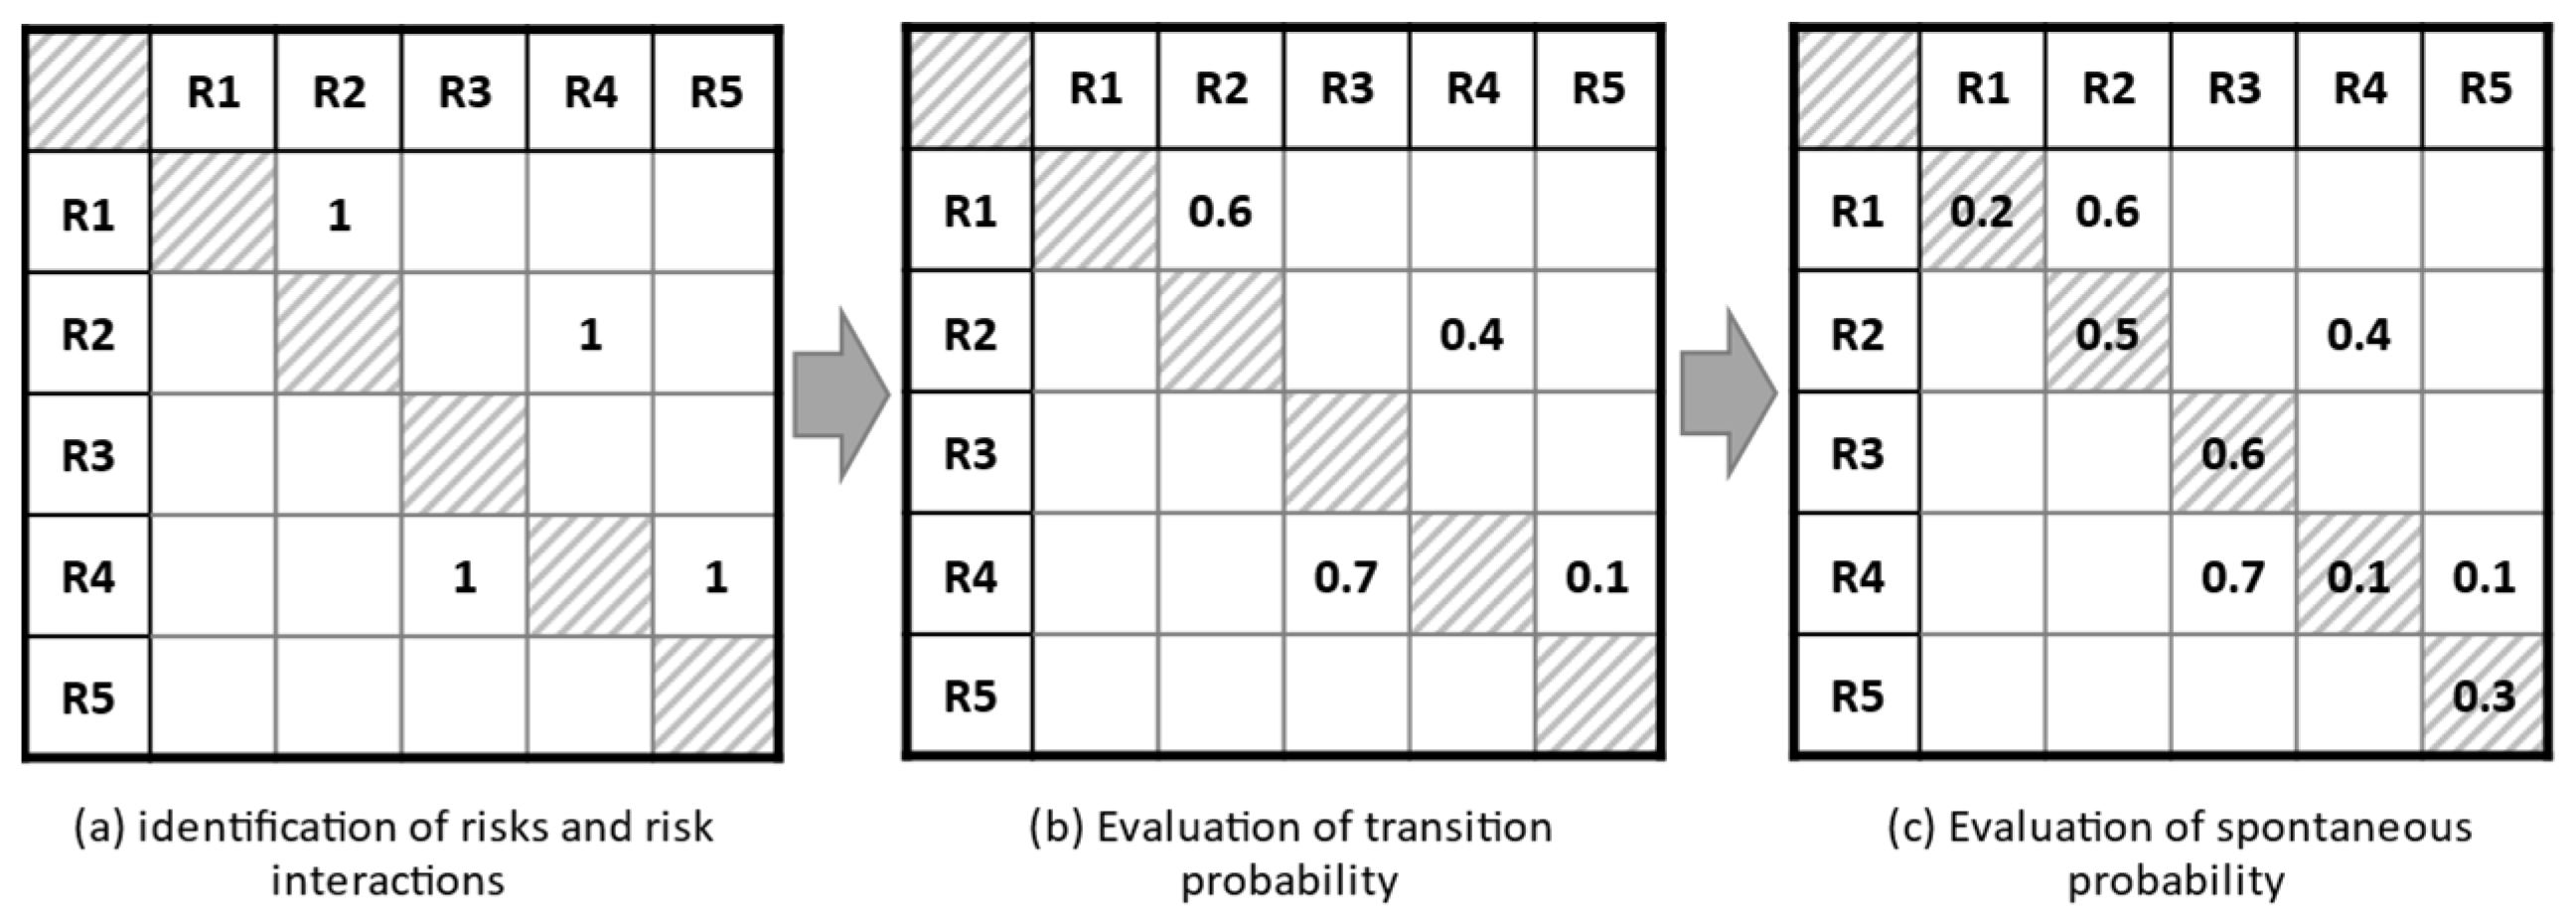
Step 6:Formation of Risk Interaction Matrix: The interaction between the risks and the main factors is identified at first. After that, the model determines the interaction between them and the effect of their power.
Figure 3 shows an example of a cross-matrix of risks determining the probability for 5 risks in a given project. In this matrix, the interaction between risks is determined, and if there is interaction, the value of one is allocated (a). Then, according to the degree of mutual influence of the risks on each other, the relevant weights are determined (b). Finally, the intensity of each risk (the main column of the risk interaction table is calculated by the weighting function
according to the selected weights (c) and set in the optimization model [
27].
Step 7:Calculate the Strength of the Interaction of Risks: Interaction between risks is used by the model for the power of ’s interaction on which means , and it always has the two properties in the calculations. The first characteristic is that the sum of the probabilities of two affected risks is always equal to one ( + = 1), while the second characteristic is that these probabilities are always between 0 and 1 (0 < < 1 and 0 < < 1). The mathematical reason for these relations is related to the definition of two complementary probabilities, which states that if the case does not occur, the second case will certainly occur. For example, if risk number one does not affect risk number two, risk number two will certainly have a greater interaction than risk number one. As both risks complement each other, the sum of the probabilities of these two will be equal to one. These two features can be seen in all articles on risk response optimization.
Step 8:Proposed Optimization Model: It is necessary to optimize risk responses, control, and evaluate for completing the risk management assessment in the proposed structure. Therefore, a mixed-integer non-linear programming (MINLP) [
45] is developed, which is due to the utility function used in the non-linear model. Before introducing the model, the sets, parameters, and decision variables of the proposed model are summarized as below:
| Sets: | |
| J | Risks set |
| H | Each risk response set |
| Parameters: | |
| Risk j losses |
| Risk j |
| Risk response h |
| Cost of risk response h |
| Effect of response h on risk j |
| B | Budget of risks responses |
| The weight or preference of each risk j |
| α | Fixed coefficient of the utility function |
| θ | The coefficient of the importance of each risk to its own loss |
| Decision variables: | |
| 1, if the response is chosen for the volunteer risk, otherwise, 0. |
| The maximum cost of the selected response for the risk response h |
Assume that
is the expected loss from the occurrence of
risk. Volunteer risk response strategies should be proposed and selected to address the risks involved in project implementation to decline the expected loss of each risk. When response strategies are formulated, the cost of implementing each strategy and the effect of responding to the volunteer risk must be estimated after implementing the strategies. Assume that the set A = {
,
, …,
} present a set of volunteer risk response strategies, and
is the cost of implementing the risk response
. The effect of strategy implementation on risk is shown by
which indicates the effect of risk response after the implementation of
risk response strategy to deal with the risk event
. Moreover, assume that B is the budget for risk response strategies. Therefore, an optimization model is created as follows to select risk response strategies according to risk interactions:
Variable is an integer variable of one and zero to decide the risk response strategy is chosen to deal with the risk event or not. Moreover, variable . is a positive variable for the number of selected answers. The goal in phrase (1) is to maximize the expected utility of the project manager. Constraint (2) ensures that the cost of implementing risk response strategies meets budget needs. The sum number of selected answers is determined in (3). The feasibility of the zero and one model variables is supported in constraint (4), and the feasibility of the non-negative model variables is specified in (5).
Step 9:Determining Utility Function: In the model described above, the objective function is to maximize the utility of the project manager. In this project, an exponential utility function that shows risk aversion is used. The proposed exponential function using the Boltzmann function will be between zero and one [
27]. The intended function is as follows:
The
presents a subjective assessment of the risk response impact
. The parameter coefficient α is an input parameter for evaluating the model. This coefficient is generally determined according to the model setting, the proposed problem’s complexity, and the user experience based on PMs’ criteria [
27].
Step 10:Definition of Weight Function: The most important feature of the proposed model is the effect of risk intensity in calculating the function of maximizing the utility of risk response management. The weight function
shows the risk intensity
. Two dimensions of risk interaction should be considered to calculate the probability transfer matrix or the power of risks. The power
means that risk
affects other risks, and the power
means other risks affect risk
. Therefore, the weighting function
is defined as follows:
is a vector of importance impact of weight
. In relation (7), it is used as parametric mean logic to correlate the degree of importance of risk and its expected loss. In this type of mean, a parameter weighs between two different criteria. For example, the weight of each risk and its average effect are used parametrically using the parameter θ to determine the degree of risk importance. This parameter is between zero and one [
46].
Step 11:Linearization of the Objective Function: The utility function is set to
for linearization. Therefore, the objective function is written as follows:
In addition, the non-negative integer variable V is entered as follows:
Additionally, the rest of the constraints are repeater in the model.
5. A Case Study of a Construction Company in Iran
This study aims to identify and examine appropriate risk and response strategies of the projects related to the field of information technology. This project belongs to the enterprise resource planning (ERP) unit of the Petropars Company located in Tehran, Iran.
In the first step of the proposed approach, Identifying Project Risks and Qualitative Analysis, the project’s significant risks are identified using failure structure and effect concepts.
Table 1 lists the risk factors.
Quantitative Risk Analysis and Cost Interval Length Estimation are carried out following the identification of the main risks. The process of numerically analyzing project risks is known as quantitative risk analysis. Each risk’s loss is calculated as a cost. Because risks arise from uncertainty, each risk does not have a specific cost; thus, this study calculates a specific interval based on the minimum and maximum losses in the event of a risk. As a result, the minimum and maximum risk costs for the 13 identified risk factors are estimated. The length of the interval determines the average cost of each risk.
Table 2 shows the assessment results.
After calculating the minimum, maximum and average risk costs, the average risk cost should be calculated according to the decision tree method and the three modes of pessimistic, realistic, and optimistic. The calculated average risk costs are given in
Table 3.
Appropriate risk response strategies should be selected to reduce the losses of risks that were previously identified and analyzed in the implementation of the project. Therefore, 13 appropriate strategies were selected. The results are given in
Table 4.
The next stage is estimating the cost of implementing strategies and their effects. The implementing cost of each response strategy is determined. Then, the effects of the implementation of each strategy on the risk, which is denoted by
are calculated. The results are given in
Table 5.
Forming the risk interaction matrix is the next step. In evaluating the interaction of these 13 risks, a set of qualitative languages including five terms is used, which is defined as S0 is too weak, S1 is weak, S2 is medium, S3 is strong, and S4 is too strong. Therefore, these estimated results are expressed using qualitative language in
Table 6.
For calculating the strength of the interaction of risks, some expressions which refer to the numerical linguistic criteria are used to calculate the interaction of risks, including S0 is 0, S1 is 0.25, S2 is 0.5, S3 is 0.75, and S4 is 1. Therefore, the risk interaction
is expressed in
Table 7.
5.1. A Comparative Study by Metaheuristic Algorithms
Many real-world optimization problems, particularly in the construction industry, are complex [
47]. For these challenging problems, metaheuristic algorithms may be used [
48]. There are some benefits to using metaheuristic algorithms [
49,
50]. They can be applied to any problem that can be expressed as a function optimization problem [
51], are typically easier to understand and implement [
52], can solve larger problems faster [
53], are simple to design and implement [
54], are very flexible [
55,
56], and can be combined with other techniques [
57]. The validation procedure and comparison of algorithms to solve the case study are discussed in this section. Therefore, ten different metaheuristic are selected including The ant lion optimizer (ALO) [
58], dragonfly algorithm (DA) [
59], grasshopper optimization algorithm (GOA) [
60], Harris hawks optimization (HHO) [
61], moth-flame optimization algorithm (MFO) [
62], multi-verse optimizer (MVO) [
63], sine cosine algorithm (SCA) [
64], salp swarm Algorithm (SSA) [
65], whale optimization algorithm (WOA) [
66], and grey wolf optimizer (GWO) [
67]. We have tuned the algorithms’ parameters based on their main sources to have an unbiased comparison. In this regard, the maximum number of iterations is set to 200, and the number of populations is set to 100 for all metaheuristics. Each algorithm is run 60 times, and the results, including the best (B), worst (W), mean (A), and standard deviation (SD) of the answers, are recorded in
Table 8. In addition, after carefully solving the problem, the value of the mean response distance of each algorithm from the best-found answer (GAP) is also given in the table. It should be noted that after solving the problem accurately and the best answers obtained from the algorithms, it was found that among the 13 existing strategies, due to the budget limitation, the company considered ten strategies, which are given in
Table 9. The coefficient of the utility function (α) is also assumed to be 0.1. Finally, to select the best algorithm from the employed methods, convergence analysis (
Figure 4), distance from the best answer as mean (
Figure 5), and box and whisker plot (
Figure 6) are presented. It is worth mentioning that because the computational time of the algorithms is very small, about 1.32 s, and on average similar, the comparison of the solving time of the algorithms has been omitted.
It should be noted that this issue has been considered experimentally and randomly. For the case study, according to the results of
Table 8, the ideal answer for the project’s desirability is 5.638, which includes the ten answers listed in
Table 9. Among the algorithms, only the MFO has been able to achieve this value, and the rest of the algorithms have reached a close answer.
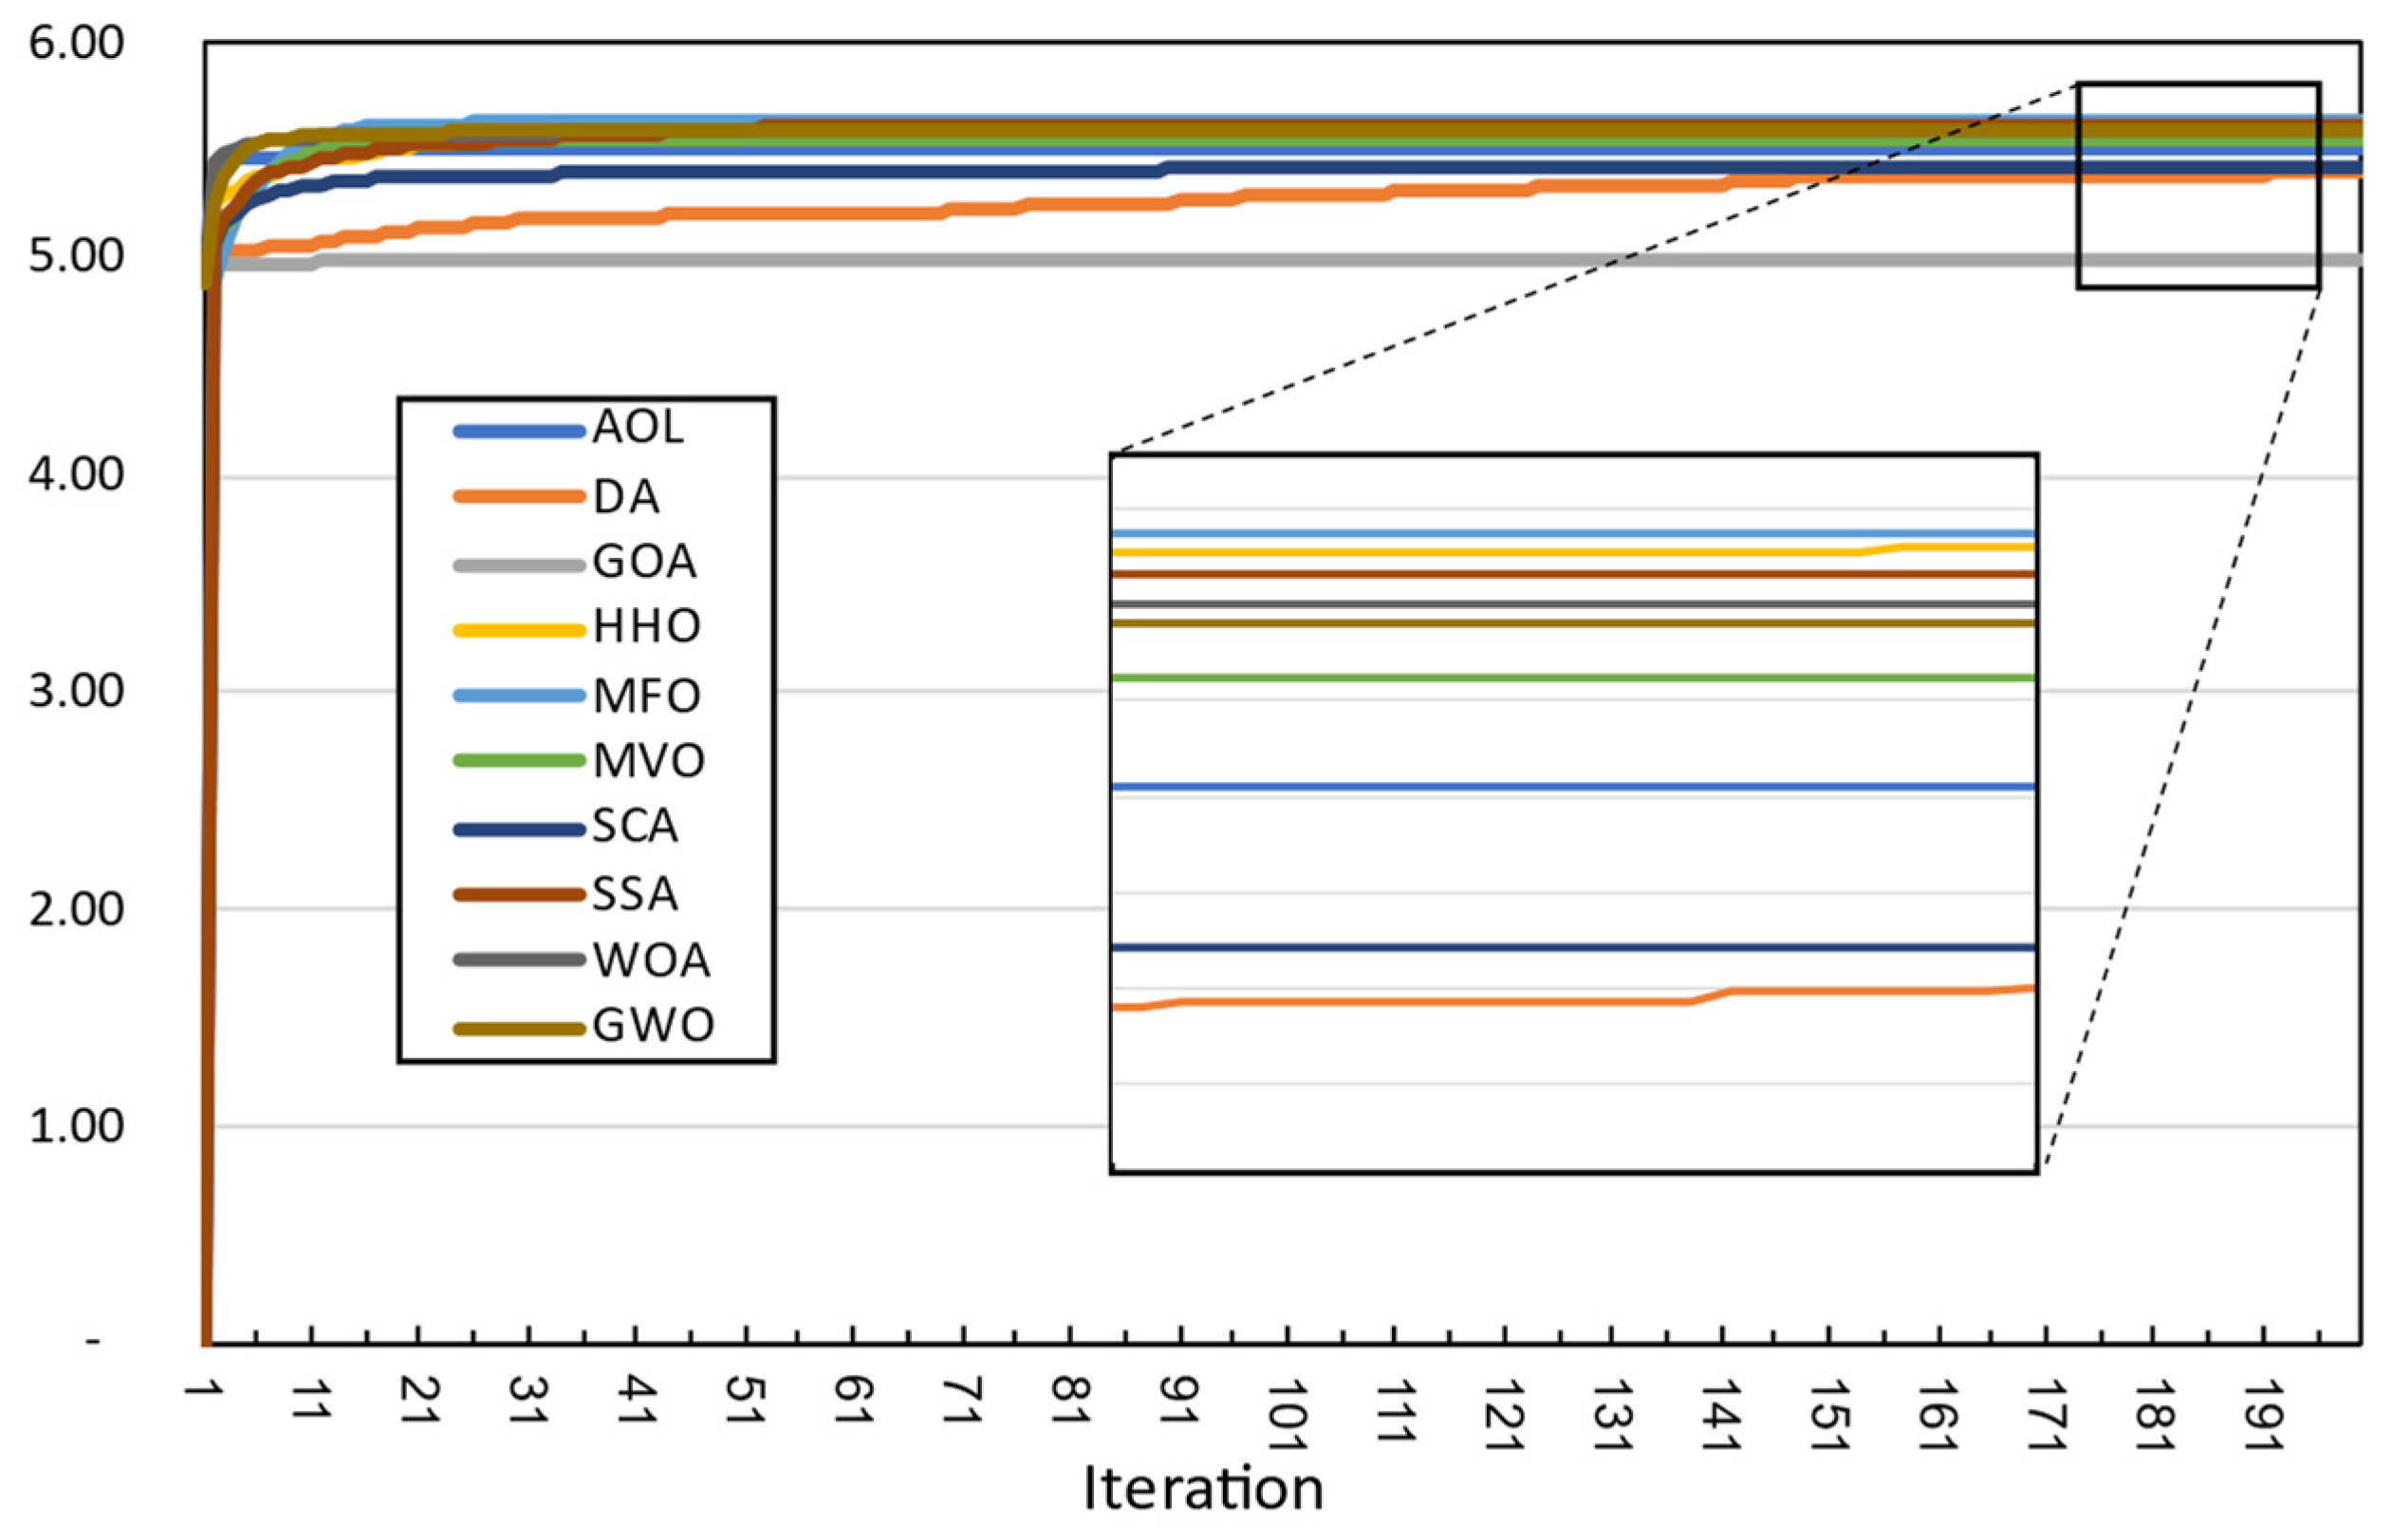
Comparison of the convergence diagrams of the algorithms in
Figure 4 is illustrated for our case study with a size 13 risk response strategy. In this case, this diagram shows the obvious superiority of the MFO as the best algorithm in this comparative study over the other algorithms. It can be inferred that the convergence optimization behavior of MFO has a similar performance in comparison with HHO. It should be noted that this trend can be expressed with a few more phrases due to the greater variety of answers found for a more large-size problem about the convergence process of algorithms.
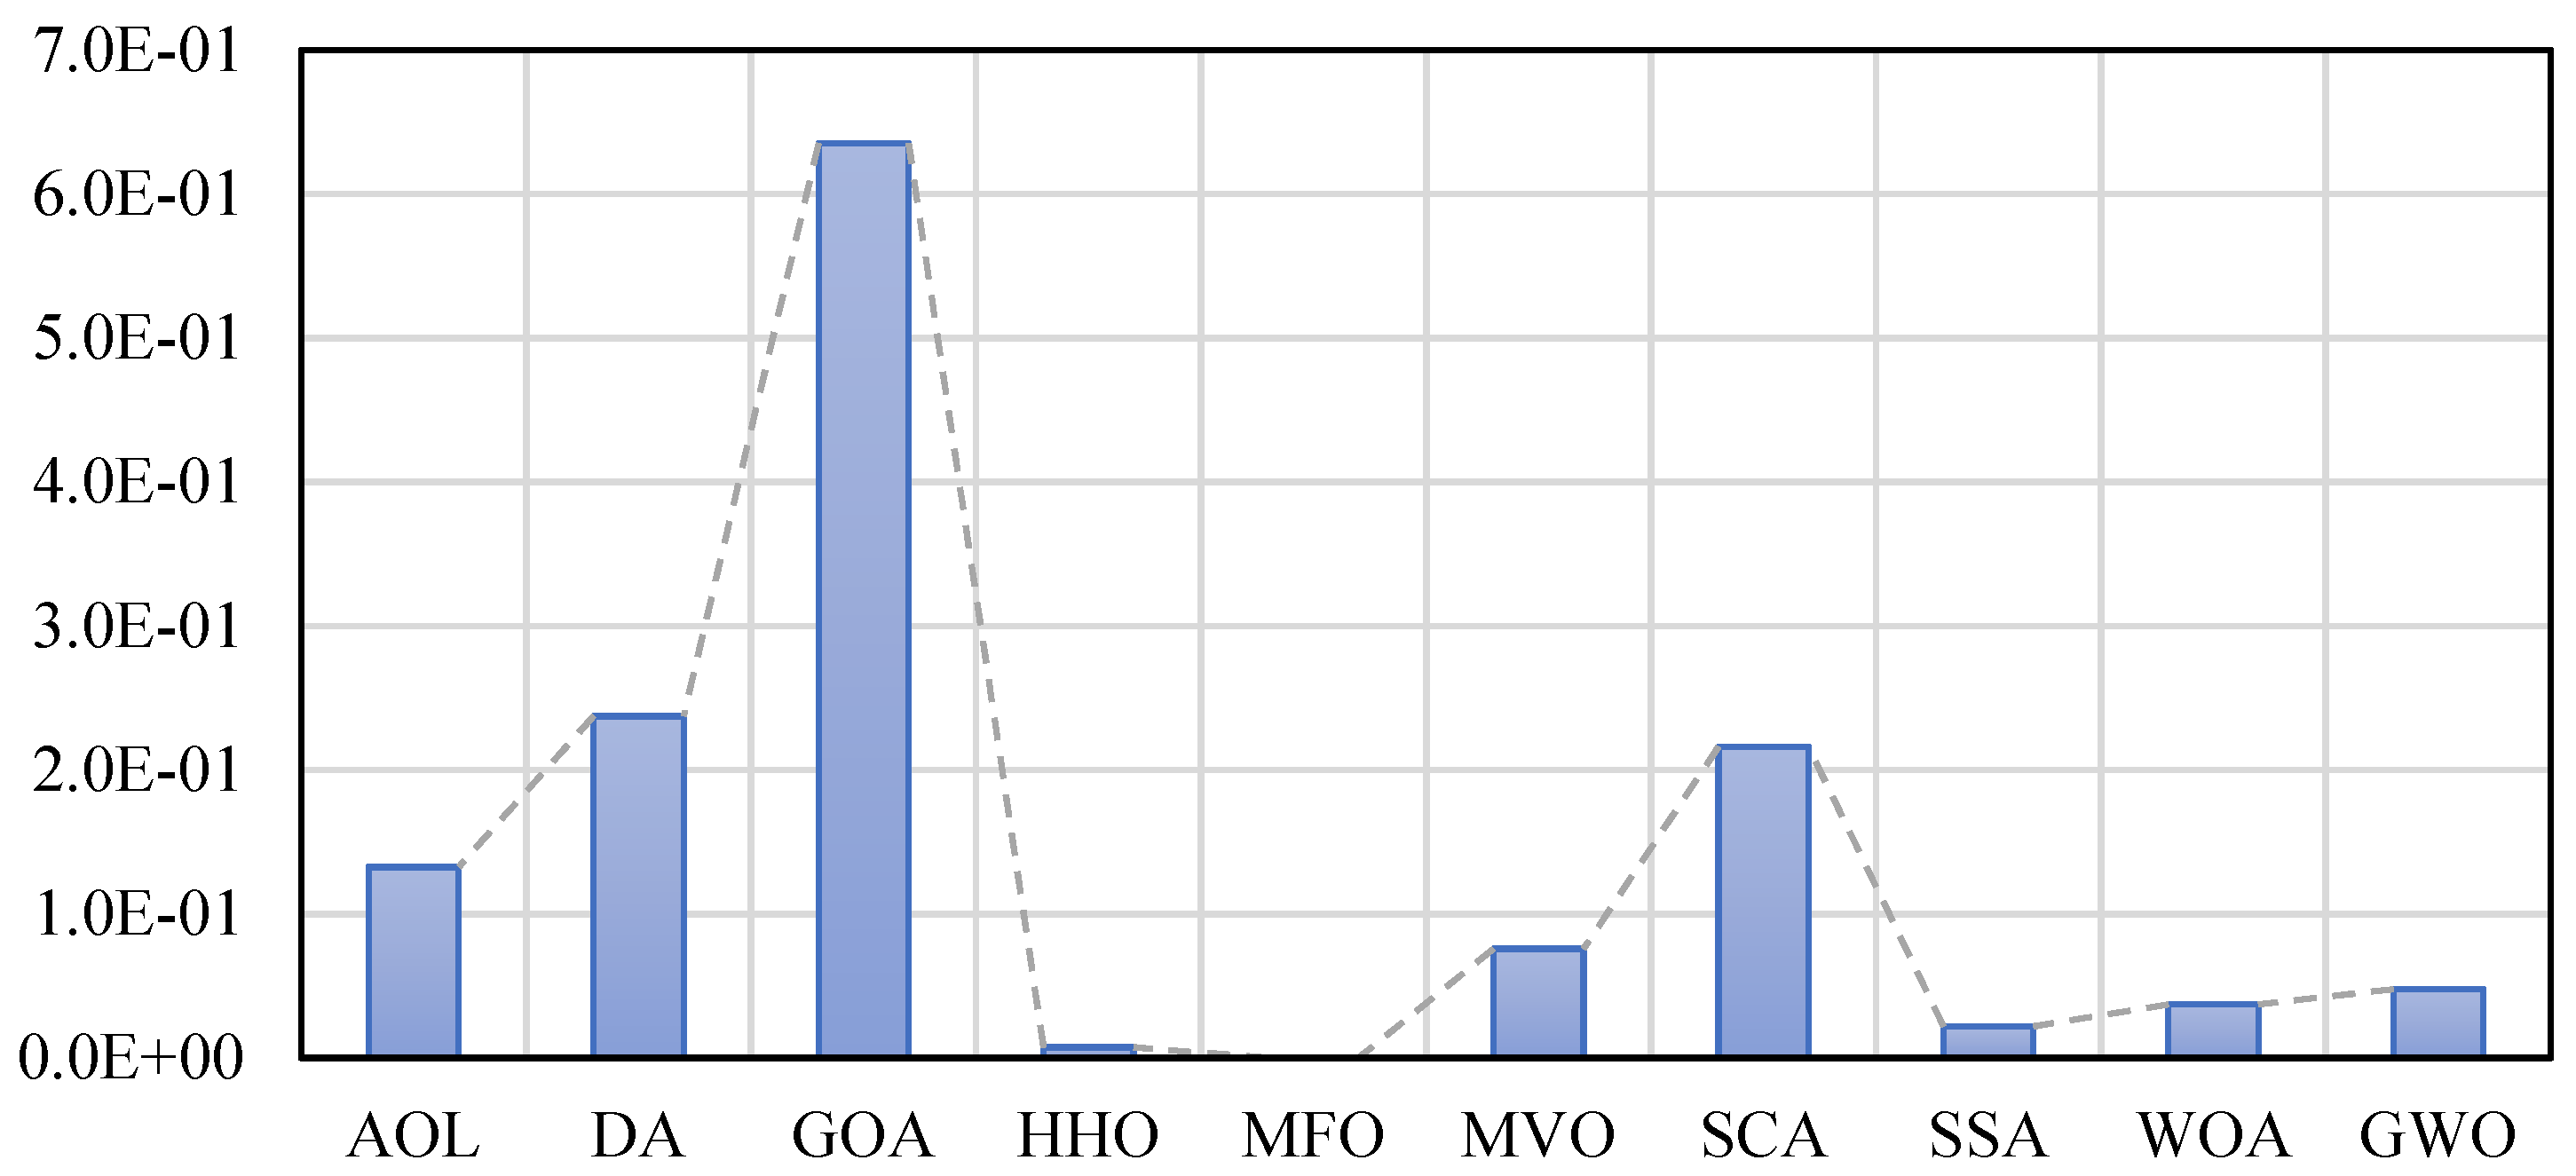
In
Figure 5, the mean distance from the best answer obtained by the exact method from CPLEX software is compared for the algorithms. In this criterion, it is clear that the lower the value, the higher the quality of the algorithm solutions. In this comparison, the MFO provides the best answer quality. Next to this algorithm, HHO, SSA, WOA, and GWO are respectively better than other algorithms.
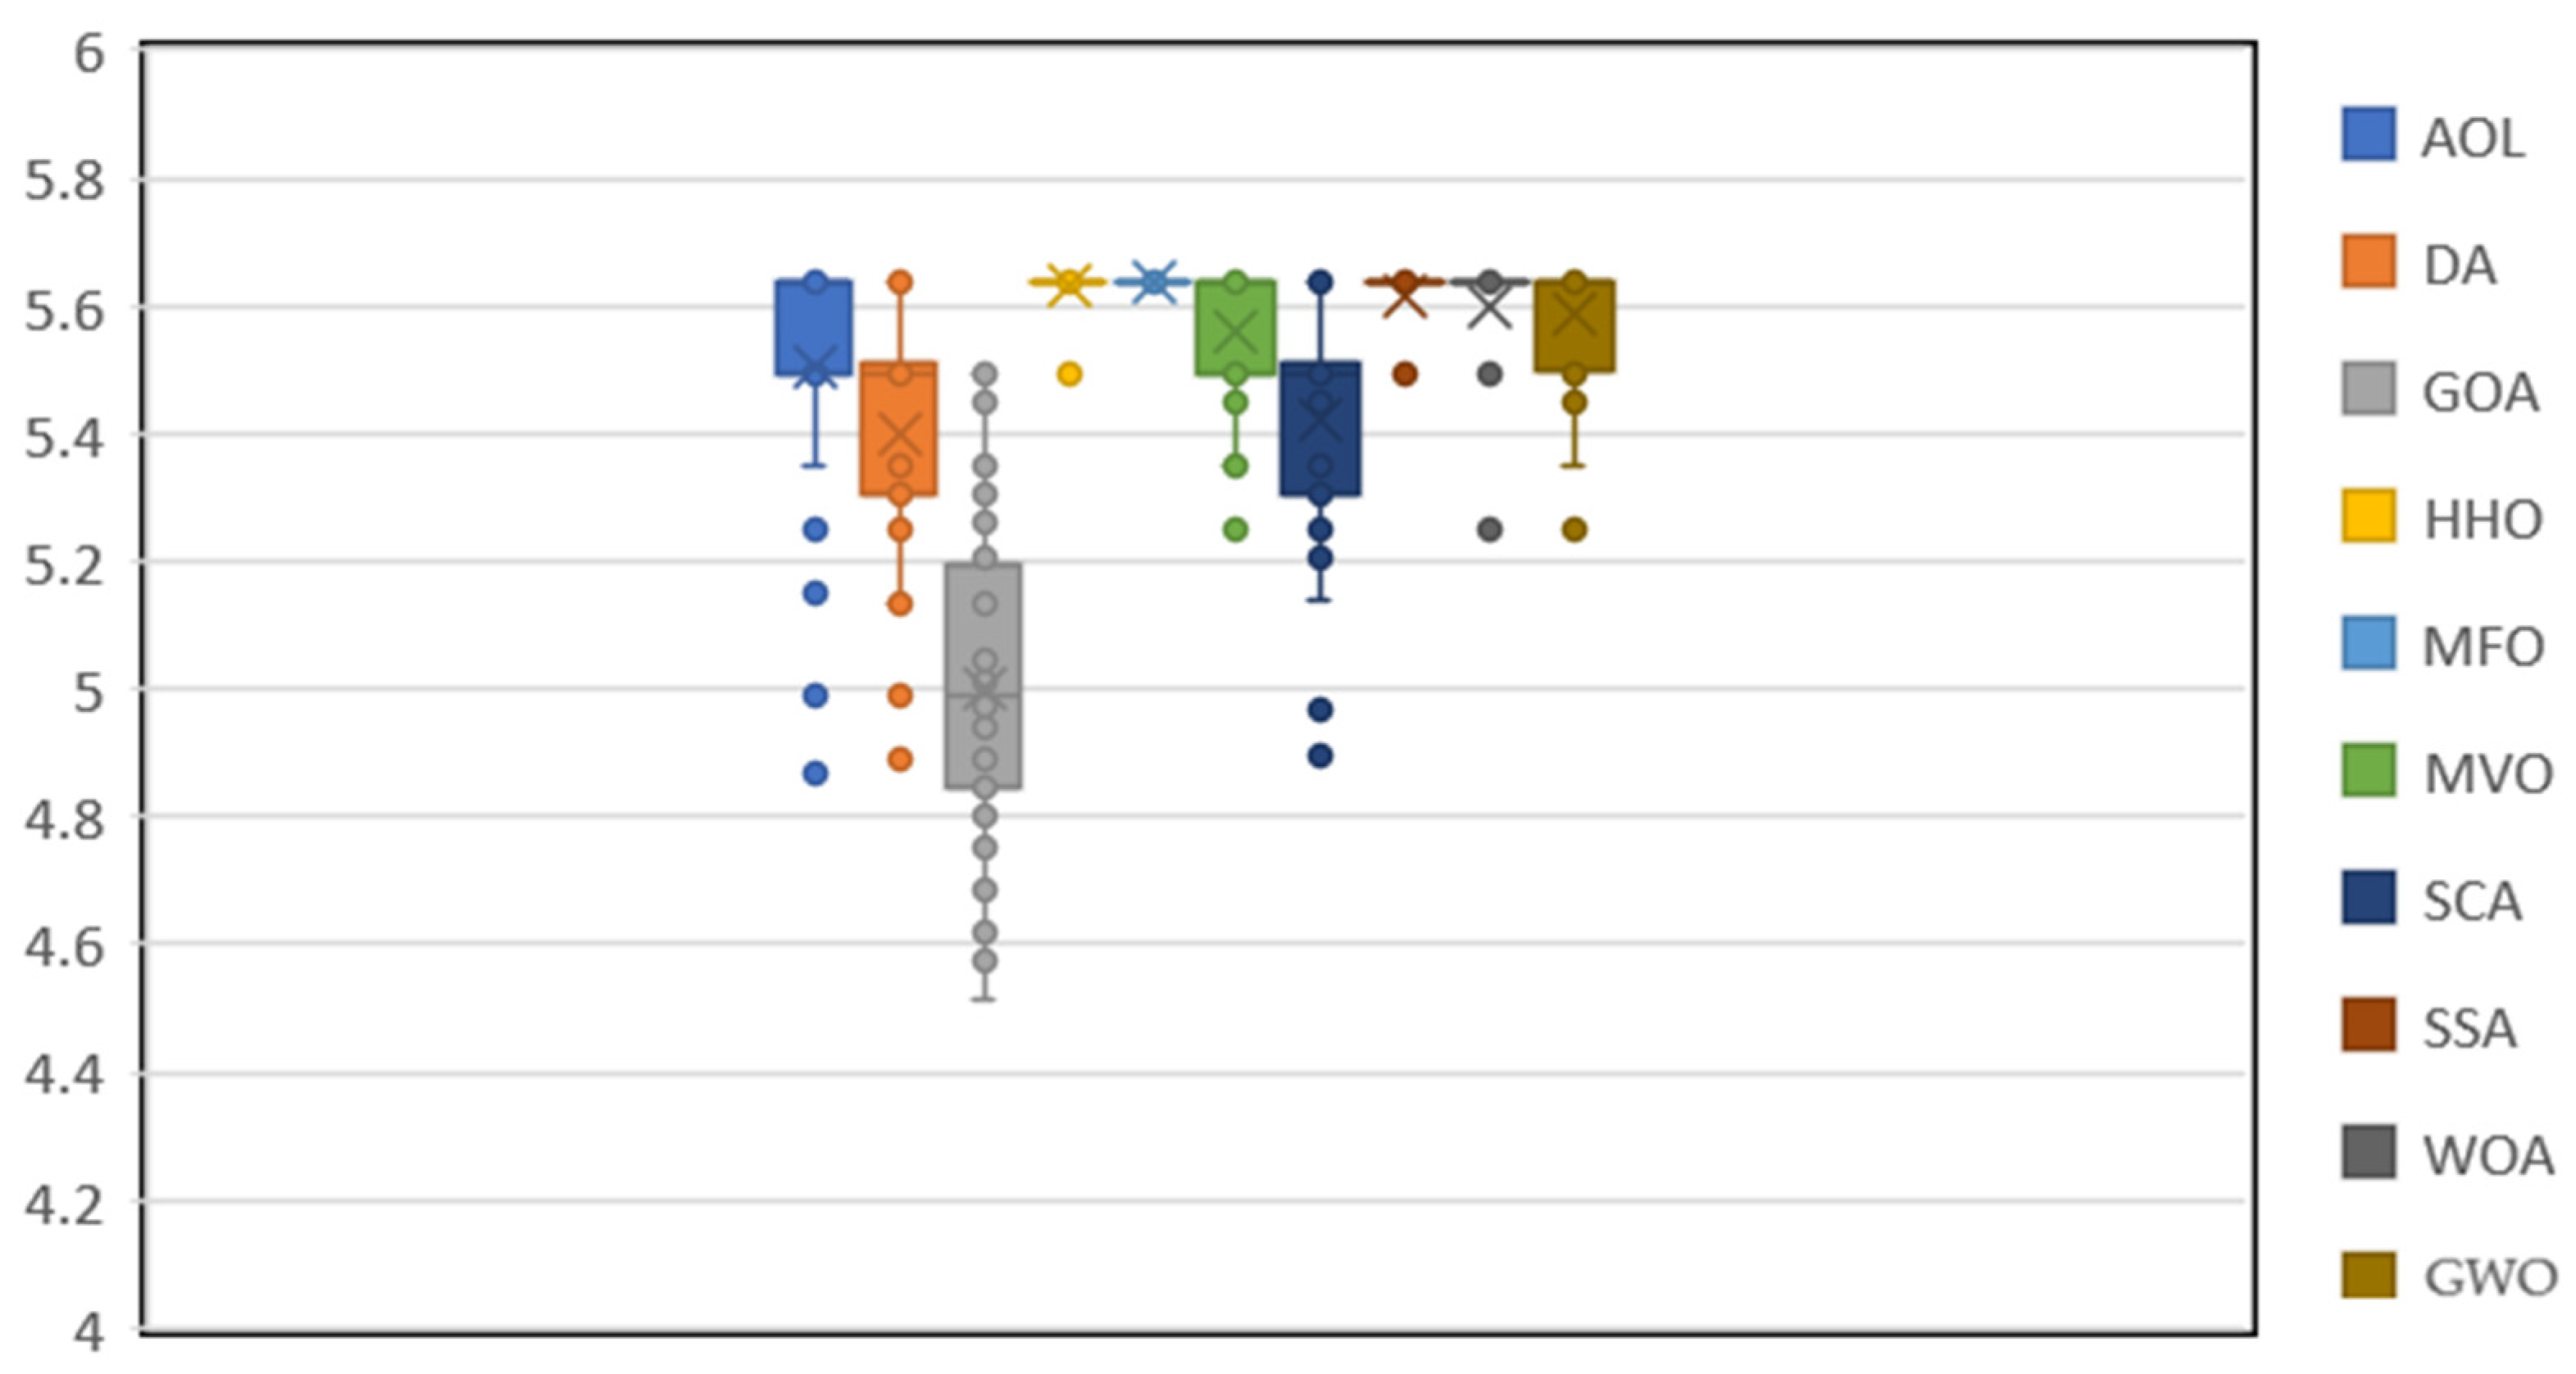
Finally, statistical analysis is used to show the accuracy of the algorithms in addition to the quality criterion. The standard deviation values of the answers in each iteration using the Box and whisker plot are used in
Figure 6. The more compact and upper the bars, the more accurate the algorithm. This diagram also testifies to the greater accuracy of the metaheuristic algorithms like MFO, HHO, and SSA than other algorithms with similar accuracy.
5.2. Sensitivity Analysis
After solving the model with the aforementioned data using CPLEX software, the final results for our main decision variables are given in
Table 10 and
Table 11.
The final solution for the objective value is equal to 8534.5. Here is a key parameter in the validation model to express the model’s sensitivity to input values. The sensitivity of budget B is measured to perform the sensitivity analysis on the model. According to the initial tests and analysis, the impact of this factor is much greater than the other parameters in the model. Therefore, four suggested values are used. Different values for B are given in
Table 12.
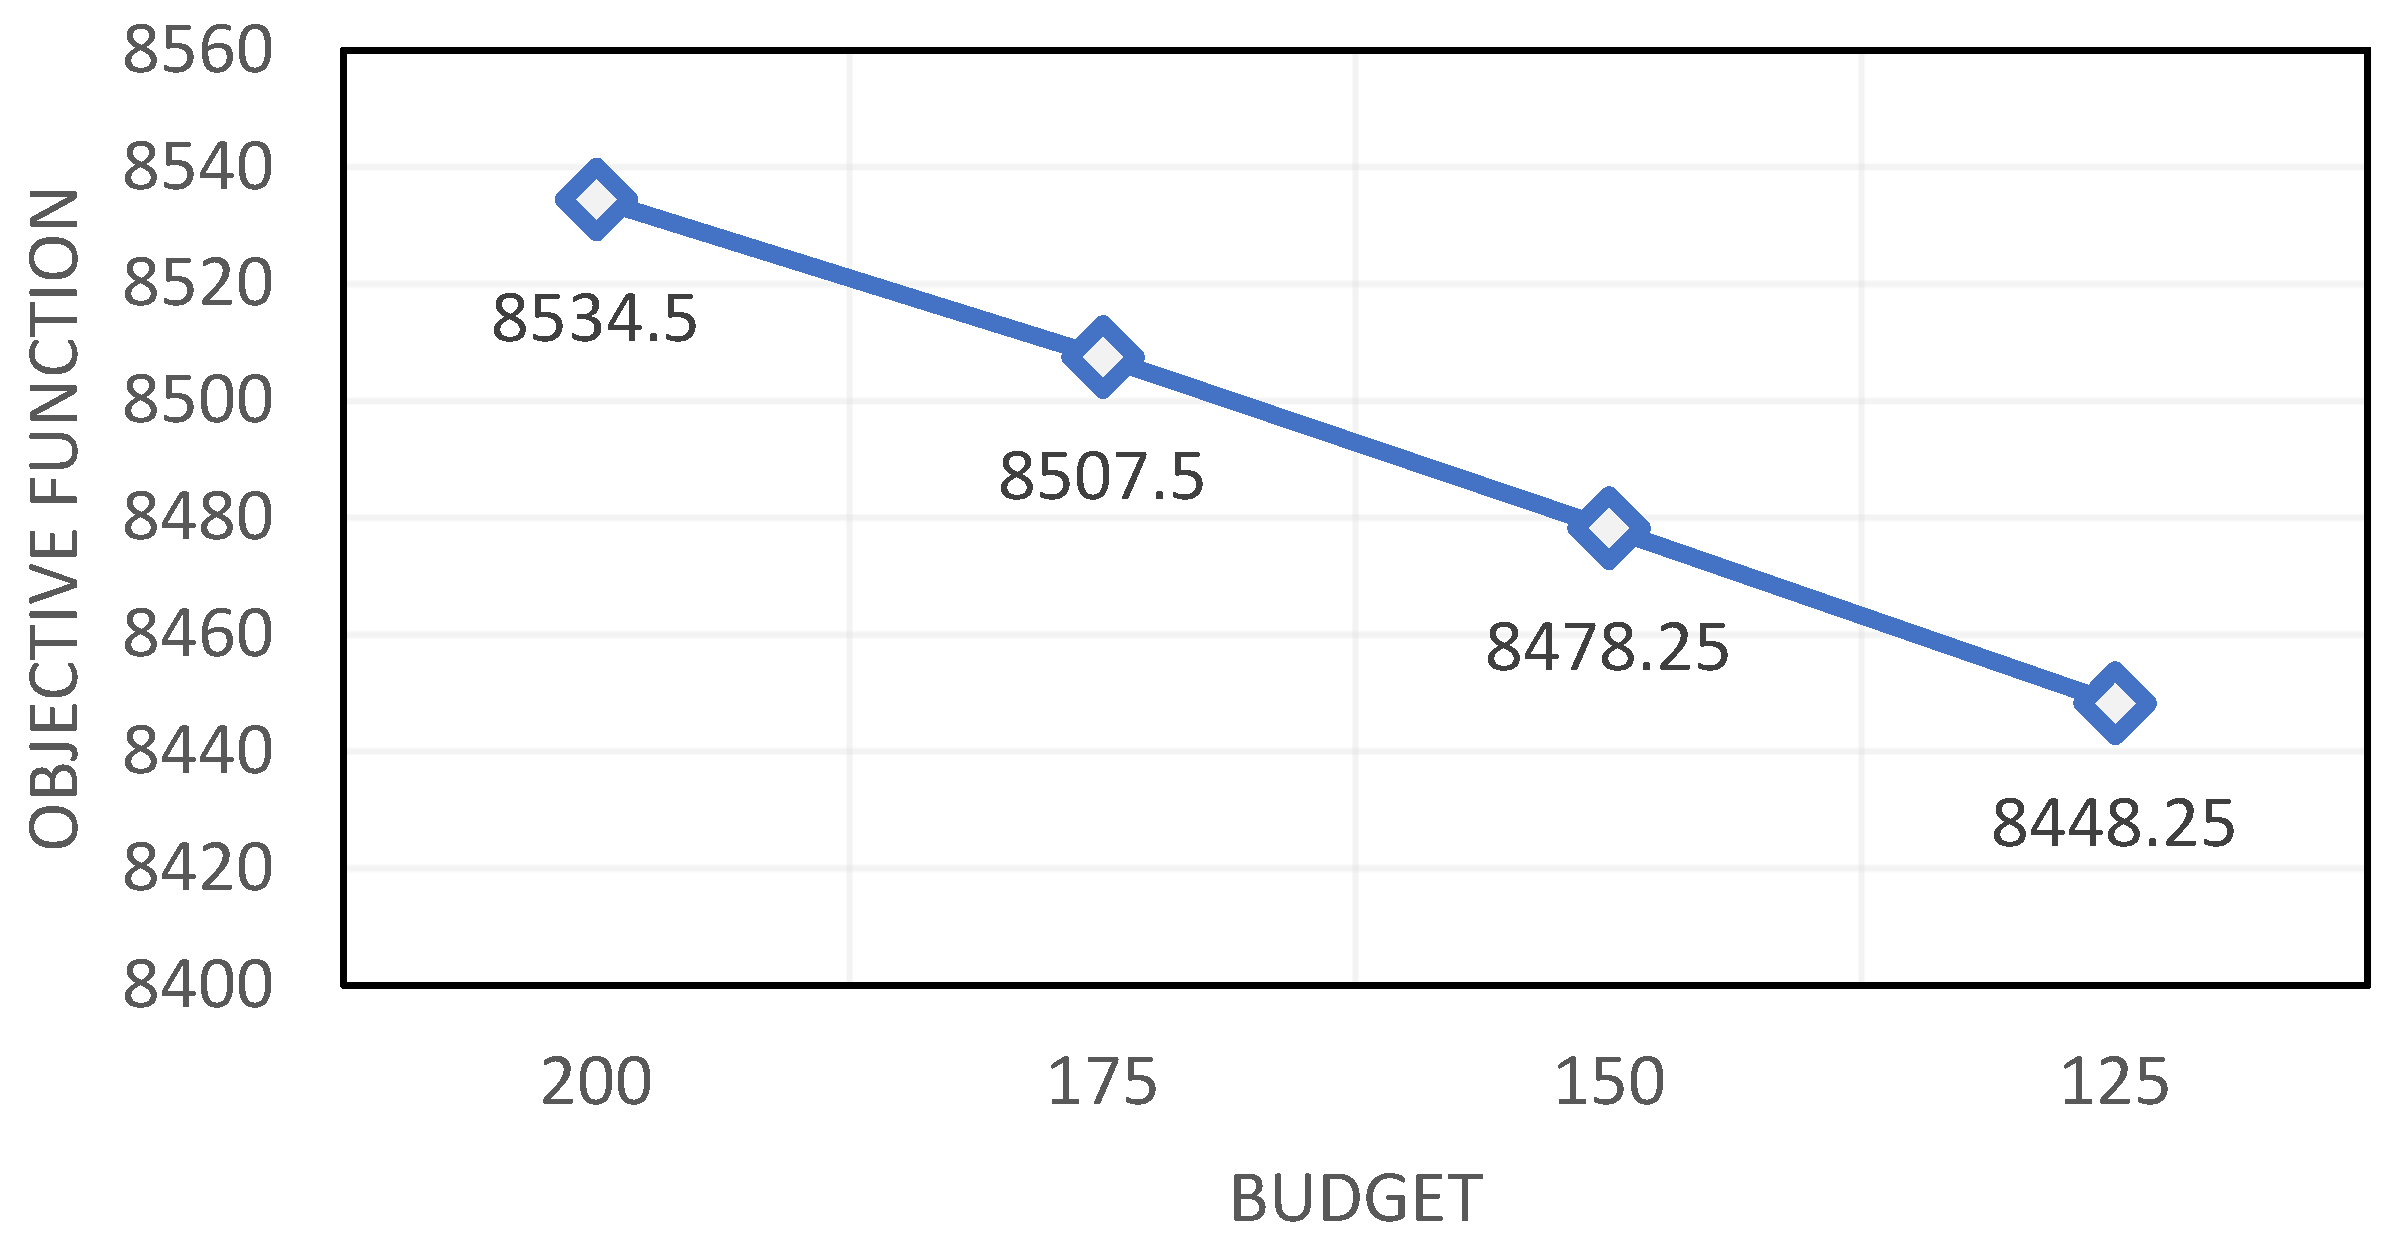
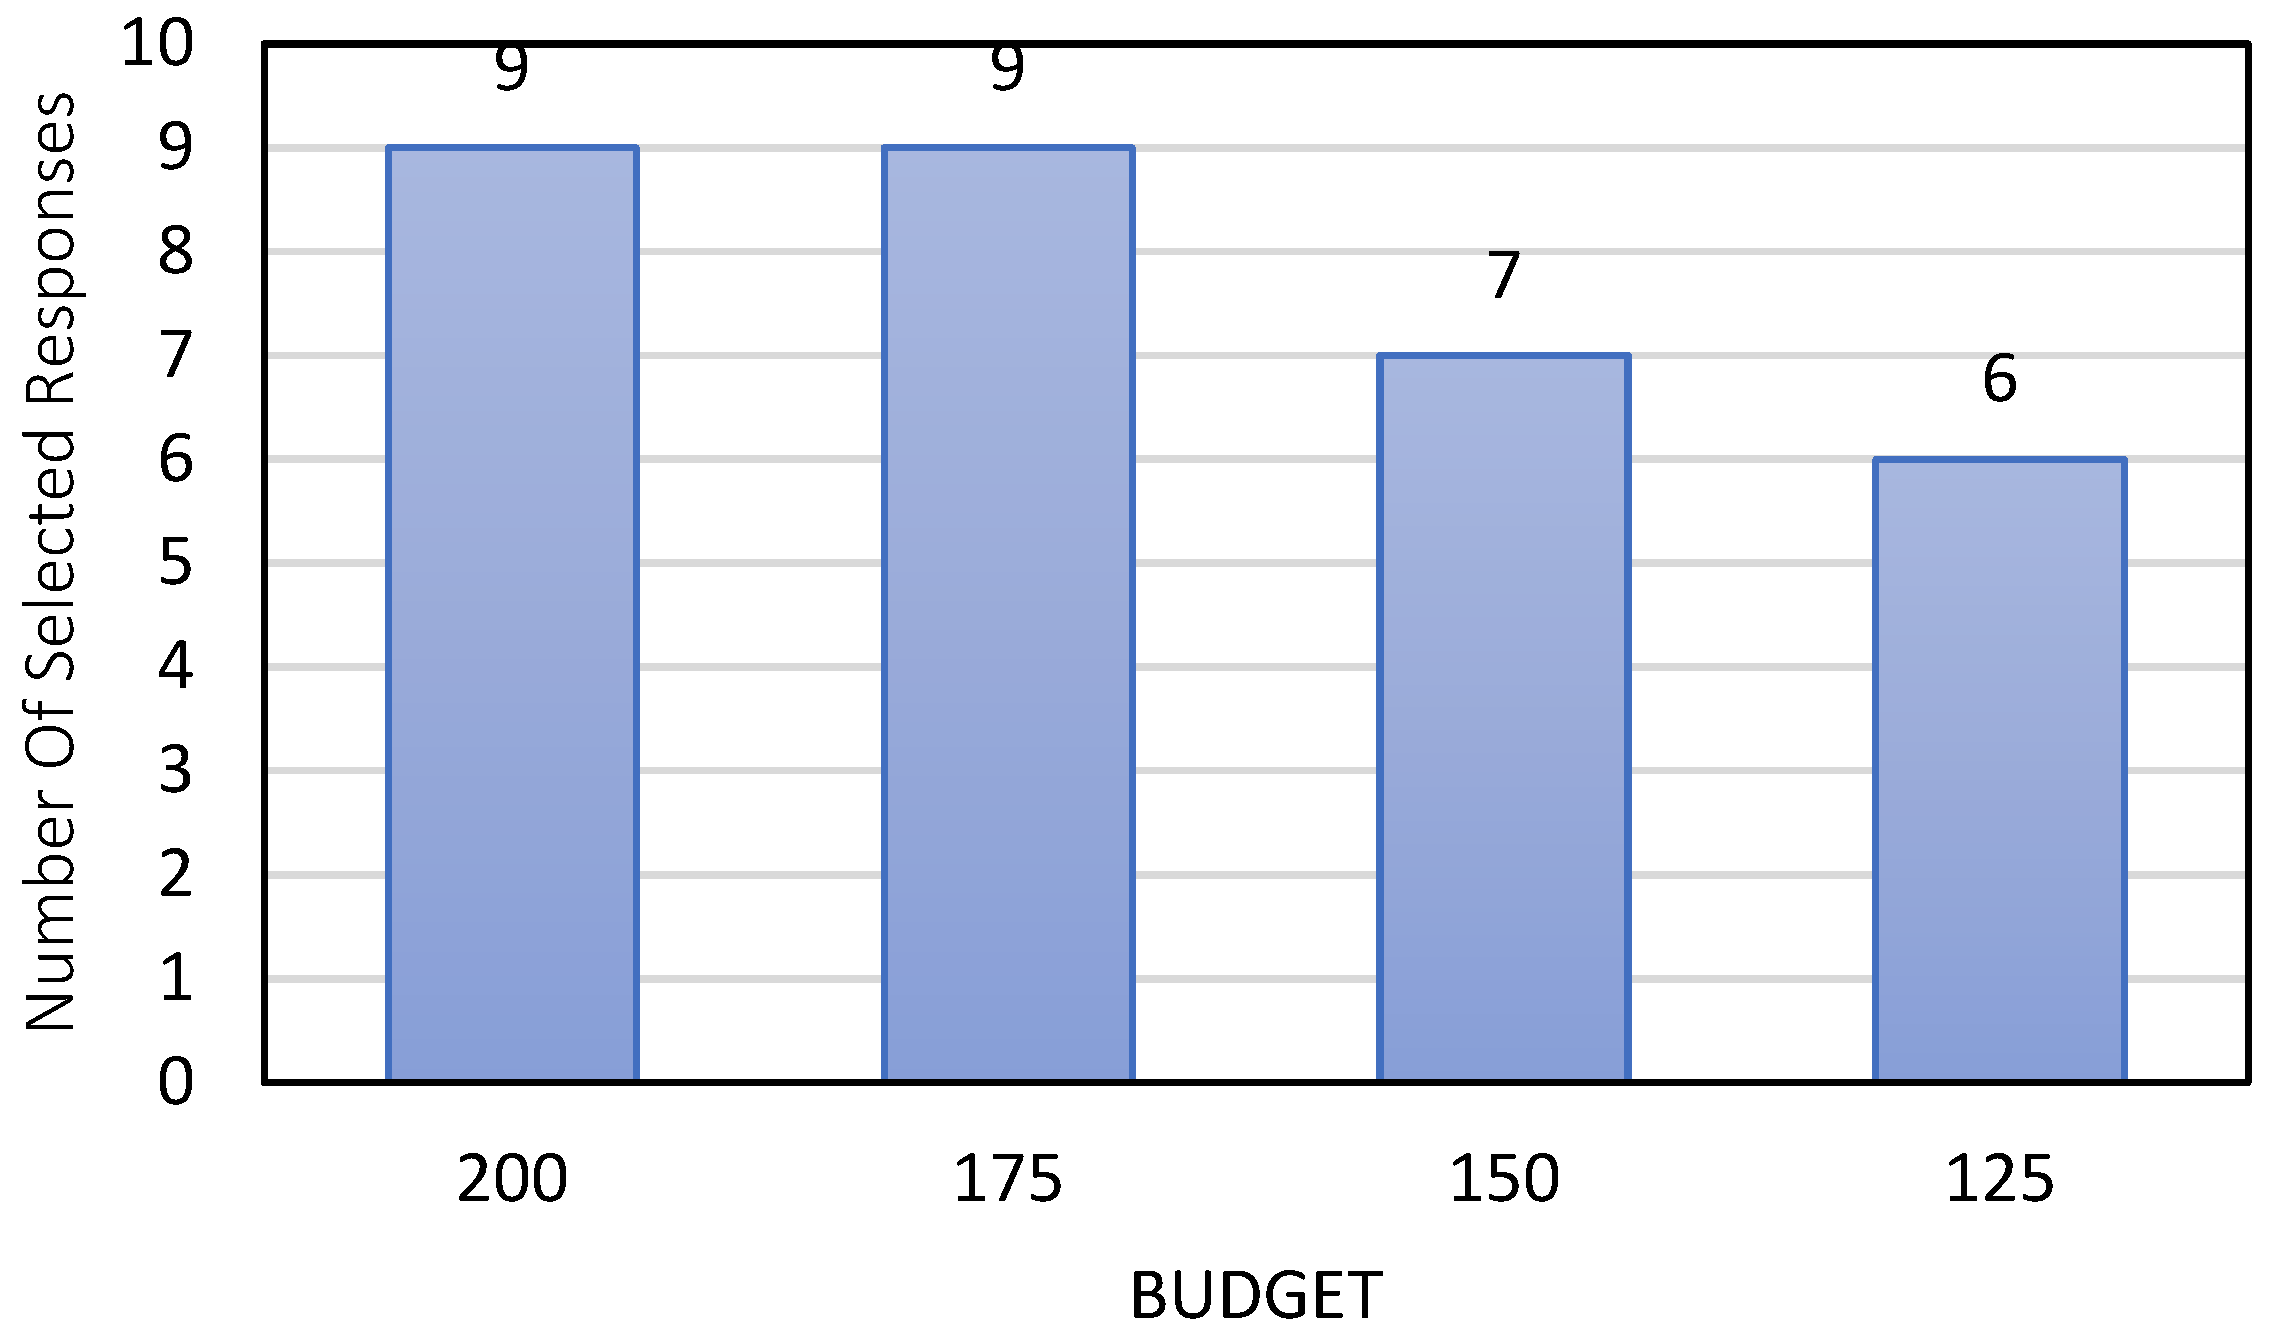
Based on the mentioned results in
Table 12, the object value of the project (
Figure 7) and the number of selected responses (
Figure 8) have been decreased. This highlights the importance of budget constraints on selecting appropriate risk response strategies. The PM should take care of the budget constraint. For example, in our numerical example, the best value for the budget is
$175 million.
6. Conclusions and Future Works
In today’s evolving society, the methods of projects that should be completed in the assigned time and budget are among the most significant factors that must be taken to compete with other companies. The budget constraints and uncertain cost factors are very important for construction projects to maximize the profit for PMs. In this study, we proposed a risk management framework based on PMBOK standards for selecting suitable risk response strategies for solving a case study in a construction company in Iran. In addition to our contribution to the development of an optimization model, another novelty is to provide a comparison among different recent and state of the art metaheuristic algorithms including ALO, DA, GOA, HHO, MFO, MVO, SCA, SSA, WOA, and GWO. The main finding in this comparison is the high performance of MFO compared to other metaheuristics.
To justify the steps of our framework, we first identified the potential risks in our construction project. After that, project risks are analyzed quantitatively and qualitatively. After identifying the proper risk response strategy for each risk, strategies implementation costs and effects were determined. The optimization model was created, and its utility function was determined. Based on our numerical example, we not only solve it by CPLEX software, but also different metaheuristic algorithms as our optimization model was non-linear and non-convex due to the utility function. The best risk responses were obtained with the specific budget in the results. Therefore, the assigned strategies can be used easily to improve the utility function. It goes without saying that in sensitivity analysis, it was shown that when the budget decreases, the objective value will decline, and it is against the model goal.
Although this study creates a significant contribution for risk management frameworks, some limitations can be considered for our future works. First, the proposed model can be formulated by robust optimization to tackle the uncertainty and compare it with our model efficiently. Many other metaheuristic algorithms like the lion optimization algorithm [
68], the red deer algorithm [
69], and the social engineering optimizer [
70] can be applied to our optimization model and compared with our results. Finally, more real-life constraints like human resource constraints [
71] and the criterion of lost workdays [
72] can be formulated and added to our proposed optimization model.


 ,
, 


