Article

Research on 3D Defect Information Management of Drainage Pipeline Based on BIM

1
School of Water Conservancy Engineering, Zhengzhou University, Zhengzhou 450001, China
2
National Local Joint Engineering Laboratory of Major Infrastructure Testing and Rehabilitation Technology, Zhengzhou 450001, China
3
Collaborative Innovation Center of Water Conservancy and Transportation Infrastructure Safety, Zhengzhou 450001, China
4
School of Civil Engineering, Guangzhou University, Guangzhou 510006, China
*
Author to whom correspondence should be addressed.
Buildings 2022, 12(2), 228; https://doi.org/10.3390/buildings12020228
Submission received: 4 January 2022 / Revised: 12 February 2022 / Accepted: 14 February 2022 / Published: 17 February 2022
(This article belongs to the Section Construction Management, and Computers & Digitization)

Abstract

:
With the age of pipeline and increase in the volume of urban sewage, the pipeline has different degrees of defects, which can cause safety problems such as road collapse and urban flooding. The service life of drainage pipes is closely related to daily maintenance and inspection, so it is very important to inspect the defects and monitor the operation of drainage pipes regularly. However, the existing research lacks quantitative detection and intelligent management of pipeline defect information. Therefore, the depth camera is used as the sensor to quantitatively detect the volume and area of the pit on the concrete pipe, and a defect information management platform is constructed in this paper. Firstly, combined BIM model with 3D point cloud, this paper proposes a 3D defect information management platform of drainage pipeline. Then, the depth camera is used to collect the damage data and preprocess the data, and a method for calculating the damage volume and surface area of drainage pipeline based on 3D mesh reconstruction of the defect point cloud is proposed. The verification experiment results show that the error between the quantized volume and the real volume is mostly within 10%, and the maximum error is 17.54%, indicating high accuracy. The drainage pipeline information model is created. Finally, the data is uploaded to the information management platform to realize the visualization and informatization of pipeline defects and the later operation and maintenance requirements of the pipeline.

1. Introduction

Urban underground drainage network is an important part of municipal infrastructure. It plays an essential role in people’s daily life and is an important guarantee to maintain the cleanness of urban environment. With the accumulation of time, the erosion of sewage and the pipeline has not been repaired for a long time, and the functional structure of the pipeline has problems, resulting in a large number of aging and damage. The main defects of the drainage pipes include cracks, deformation, leakage, rupture, wrong mouth, corrosion, collapse, penetration of foreign matters, etc. These defects will affect the operation of pipes, cause potential safety hazards, and then seriously affect the normal operation of the city and bring trouble to the travel of residents. Therefore, it is very important to detect the drainage pipeline regularly, find the pipeline defects and detect the damage in time.
The traditional detection methods of drainage pipe defects include manual detection method, observation method, reflector method, mud bucket method, etc. [1]. These detection methods have low efficiency, certain blindness, high cost, and cannot achieve high-precision detection. At present, the detection methods of drainage pipe defects mainly include CCTV detection technology, laser detection technology, sonar detection technology, ground penetrating radar detection technology, ultrasonic detection technology and periscope detection technology. CCTV detection technology has the characteristics of low cost and high safety, but it also has some limitations, the auxiliary workload is large, and the water level during detection cannot be greater than 30% of the inner diameter of the pipe; laser detection technology has fast speed and high sensitivity, but when there is sludge inside the pipeline, the inner wall of the pipeline cannot be detected; sonar detection technology can only detect the area below the water surface of the pipeline; as a non-destructive testing technology, GPR is not affected by the environment, but the contradiction between detection depth and resolution is difficult to overcome [2,3,4,5,6]. At present, the methods of machine learning and deep learning are gradually applied in pipeline defect detection, mainly used to identify various diseases on the pipeline surface and automatically detect and classify the defects of drainage pipelines [7,8]. Nowadays, there are few studies on quantitative detection of pipeline defects, the existing methods have difficulty directly detecting the damage volume, and the degree of information management is low. Therefore, a better method is needed to evaluate the damage volume and surface area of structural surface and carry out information management of pipeline defects.
Laser scanning can collect spatial point information quickly and in large quantities, which is mainly used in various detection and evaluation of construction engineering sites [9,10]. In recent years, there are more and more studies on structural surface damage detection based on 3D reconstruction. Three-dimensional reconstruction technology constructs the real point cloud into a mathematical model that conforms to computer logic expression through the process of deep data acquisition, pre-processing, point cloud registration and fusion, and surface generation. This model can be applied to the research fields of cultural relics protection, architectural design, and clinical medicine [11,12,13], and 3D point cloud data is also gradually applied in the defect detection of building structures. Gustavo H. Beckman et al. [14] used cheap depth sensors to quantify the surface spalling of concrete slabs, and proposed a concrete spalling damage volume detection method based on fast regional convolution neural network for multiple images. A large number of training results showed that this method had high accuracy; Liu et al. [15] proposed a volume measurement method based on three-dimensional reconstruction of surface damage of concrete slab structures. By comparing the methods of obtaining point cloud data by smart phones and depth cameras, it was concluded that the detection effect of smart phones was better; Mohammad R Jahanshahi et al. [16] used RGB-D sensor to detect and quantify defects in pavement, and proposed a method that can automatically detect various pavement diseases and quantify pavement damage; Asadi P et al. [17] used a RGB-D sensor and deep learning detection model to develop an economical, efficient and reliable platform for automatic detection of pavement cracks on a single board computer based on an arm. I Moazzam et al. [18] collected pavement depth images from concrete and asphalt pavement using a low-cost Kinect sensor. According to depth analysis and pavement image analysis, the area and approximate volume of the pothole are calculated. Turkan Y et al. [19] used ground-based laser scanners and proposed a method based on an adaptive wavelet neural network (WNN) to automatically detect concrete cracks and other forms of damage. However, the above are based on the detection and volume measurement of surface defects of planar plates. The application of 3D point cloud reconstruction technology in pipeline damage detection is rare. At present, the research on the quantification of surface damage information is still few and in the preliminary stage.
At present, the research of BIM information management in many fields is becoming more and more popular. The application of BIM Technology in underground pipelines is mainly reflected in the planning, design, construction and later operation and maintenance life cycle stages of pipelines, so as to solve the problems of pipeline positioning difficulties, reduce design errors and reduce pipeline collision. Chen et al. [20] developed a standards-based FM system based on BIM technology, and discussed the capture, classification, integration and transmission methods of key FM information. Qian et al. [21] used BIM bridge model technology and combined with computer vision technology of sensor data to provide computer visualization for bridge deck management and maintenance departments. Lai et al. [22] proposed an ABIM-based collaborative design and project management platform to address data interoperability issues. Chen et al. [23] used BIM technology to visualize an underground pipe network, so as to quickly and effectively detect the collision relationship between pipes, and between pipes and other underground facilities. Xu et al. [24] integrated BIM and GIS to analyze urban underground pipe network planning and management, environmental monitoring and evaluation, disaster warning and loss assessment, etc. Zhang et al. [25] integrated BIM model and advanced intelligent measuring equipment to effectively reflect accurate model data to the construction site and improve the efficiency and accuracy of pipeline construction and completion acceptance. Guo et al. [26] deeply studied the application of BIM technology in urban visualization construction based on the problems existing in various aspects of pipeline. These studies apply BIM technology to all stages of underground pipe gallery, but cannot carry out overall information management. Ding et al. [27] proposed a database construction method based on Unity3D to establish a BIM information management platform, so as to achieve the acquisition of pipeline information by convenient equipment during construction, ensure the consistency of site construction and design drawing, and provide accurate information for operation and maintenance management. However, the existing studies mainly focus on the information management of underground pipelines. Through a large number of literature research, it is found that the application of BIM Technology in underground drainage pipe is far lower than that in the construction industry, and at present, the application of BIM-based information management in drainage pipeline defects is less, so it has a broad research space in this area.
To sum up, there is a lack of research on quantitative detection of pipeline surface defects, and the application of BIM-based information management platform in three-dimensional defects of drainage pipeline is even less. To facilitate the maintenance personnel to repair the pipeline in time and ensure the safety of urban residents, therefore, this study proposes a method to quantify the damage volume and surface area of point cloud of pipe surface defects based on Kinect DK depth camera. Then, the drainage pipeline 3D defect information management platform is integrated with BIM and point cloud. It not only solves the problem that the existing pipeline damage cannot be quantitatively evaluated, but also improves the lack of three-dimensional information of pipeline operation and maintenance system. The rest of this paper is organized as follows: Section 2 constructs the basic research framework of this paper. Section 3 is the methodology. Section 4 introduces the experiments. Section 5 is a results discussion. Section 6 introduces BIM model construction and the function of drainage pipeline 3D defect information management platform based on BIM, and the last section is a summary of the whole paper.

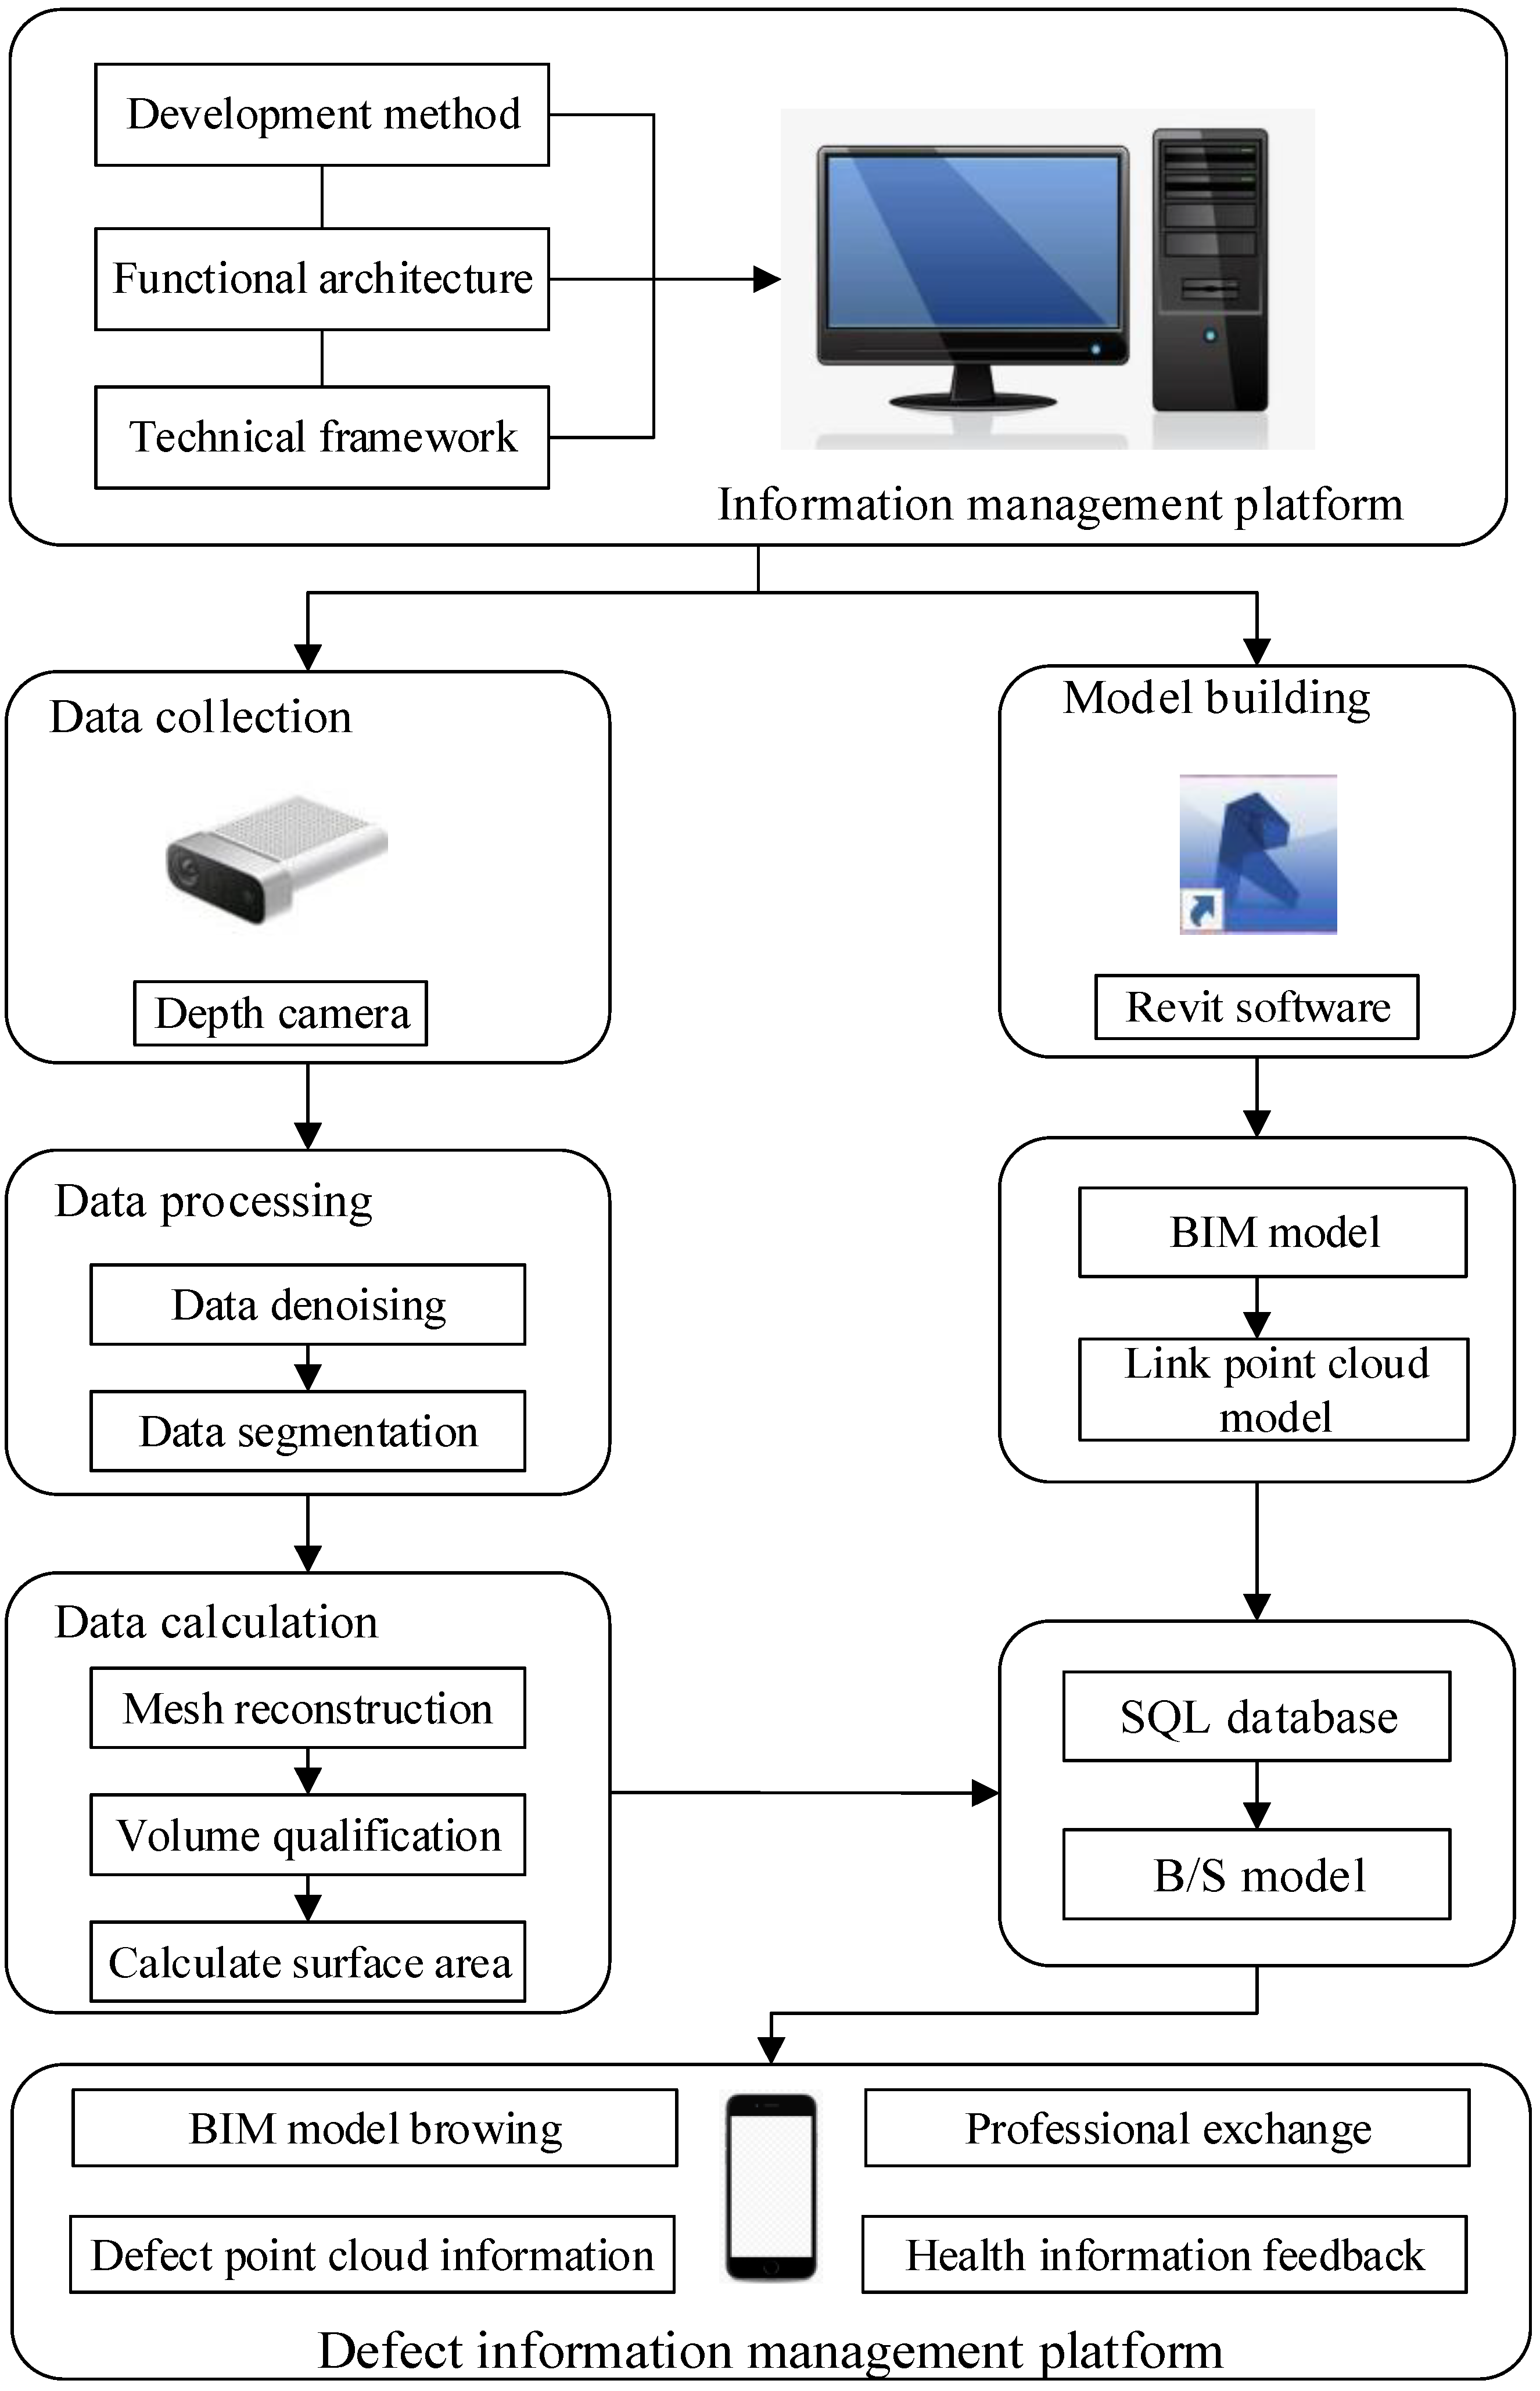
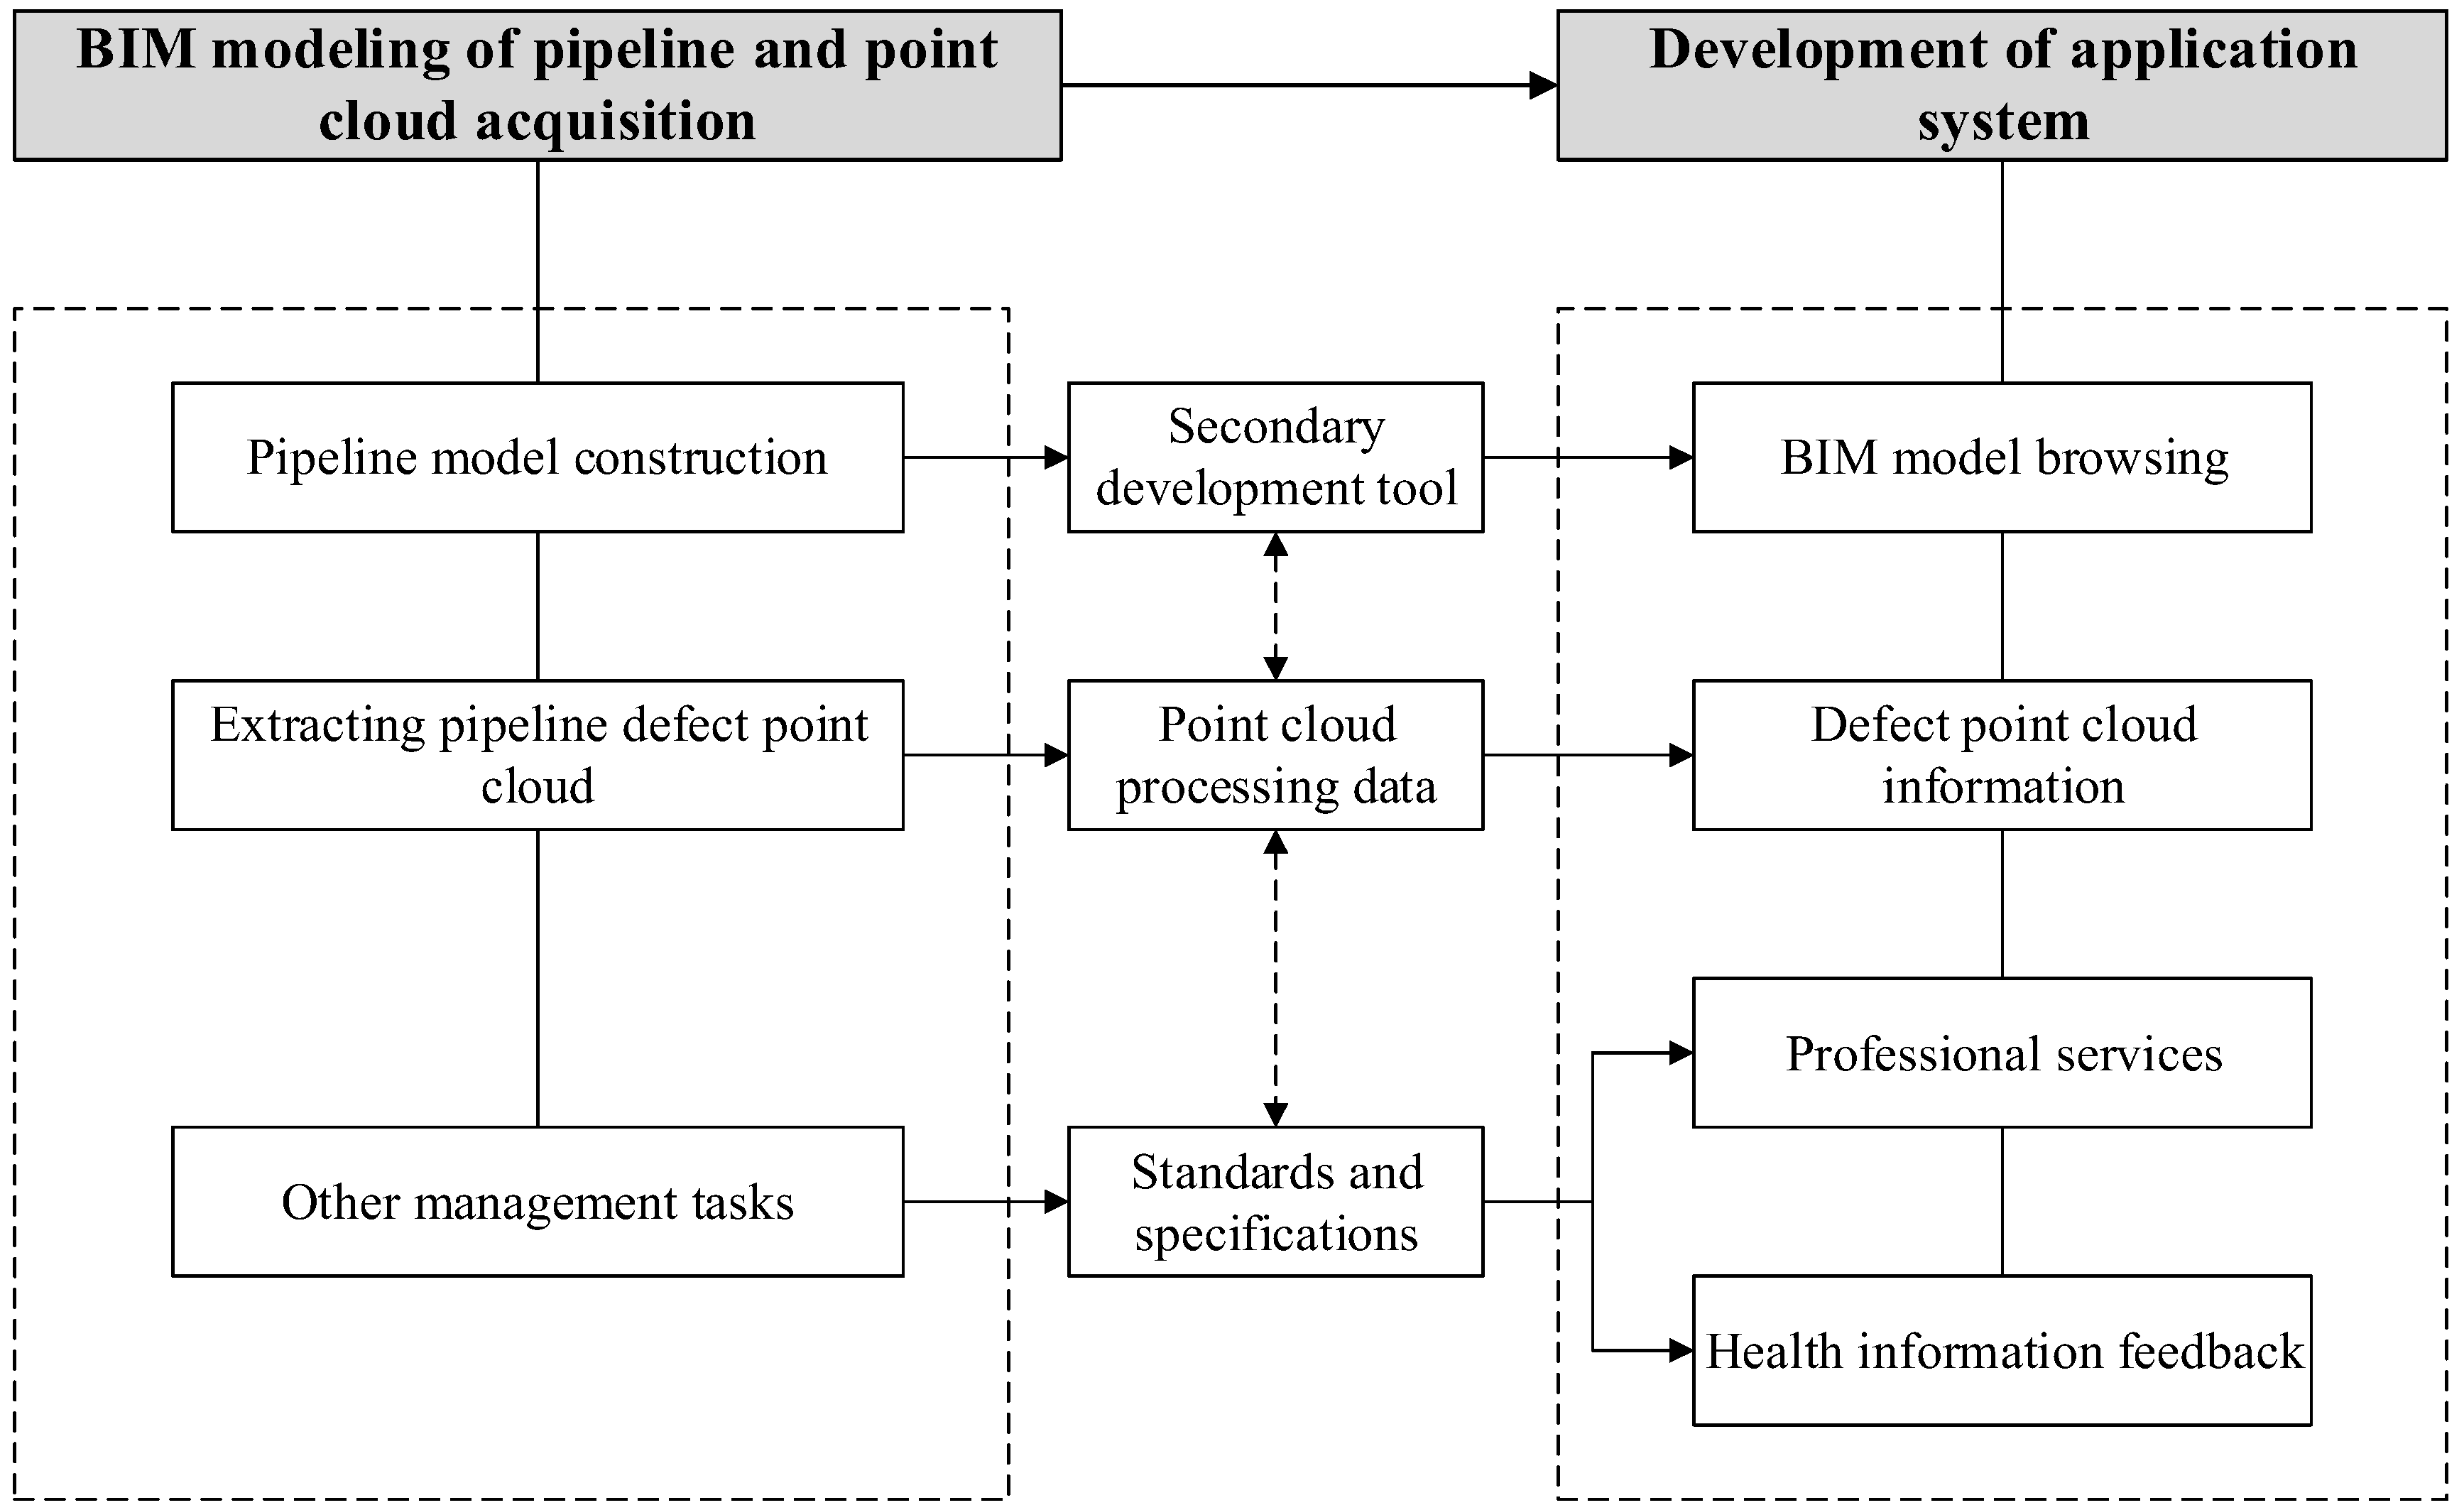
2. Research Framework

The research framework of this paper is shown in Figure 1. First of all, the development of a drainage pipeline 3D defect information management platform is introduced based on the system development method, function construction framework and overall technical framework, then we put forward the methods of data processing, mainly including 3D defect point cloud processing and damage information quantitative process. Three-dimensional point cloud processing includes point cloud data denoising and segmentation. Statistical filtering algorithm is used to remove redundant noise points. Pipeline model is extracted through a cylinder model segmentation algorithm, and then the European clustering algorithm is used to extract damaged point cloud from pipeline point cloud. MeshLab software is used for point cloud reconstruction and the quantization of damage information is mainly calculated by Cloud Compare software. Based on the depth camera, the surface defects of concrete pipeline are processed and the damaged volume and surface area are obtained through mesh reconstruction. A BIM model of the pipeline is established based on Revit software and a point cloud model is linked to the model. Finally, data is imported into SQL database, and information is displayed on the platform and fed back to users.

3. Methodology

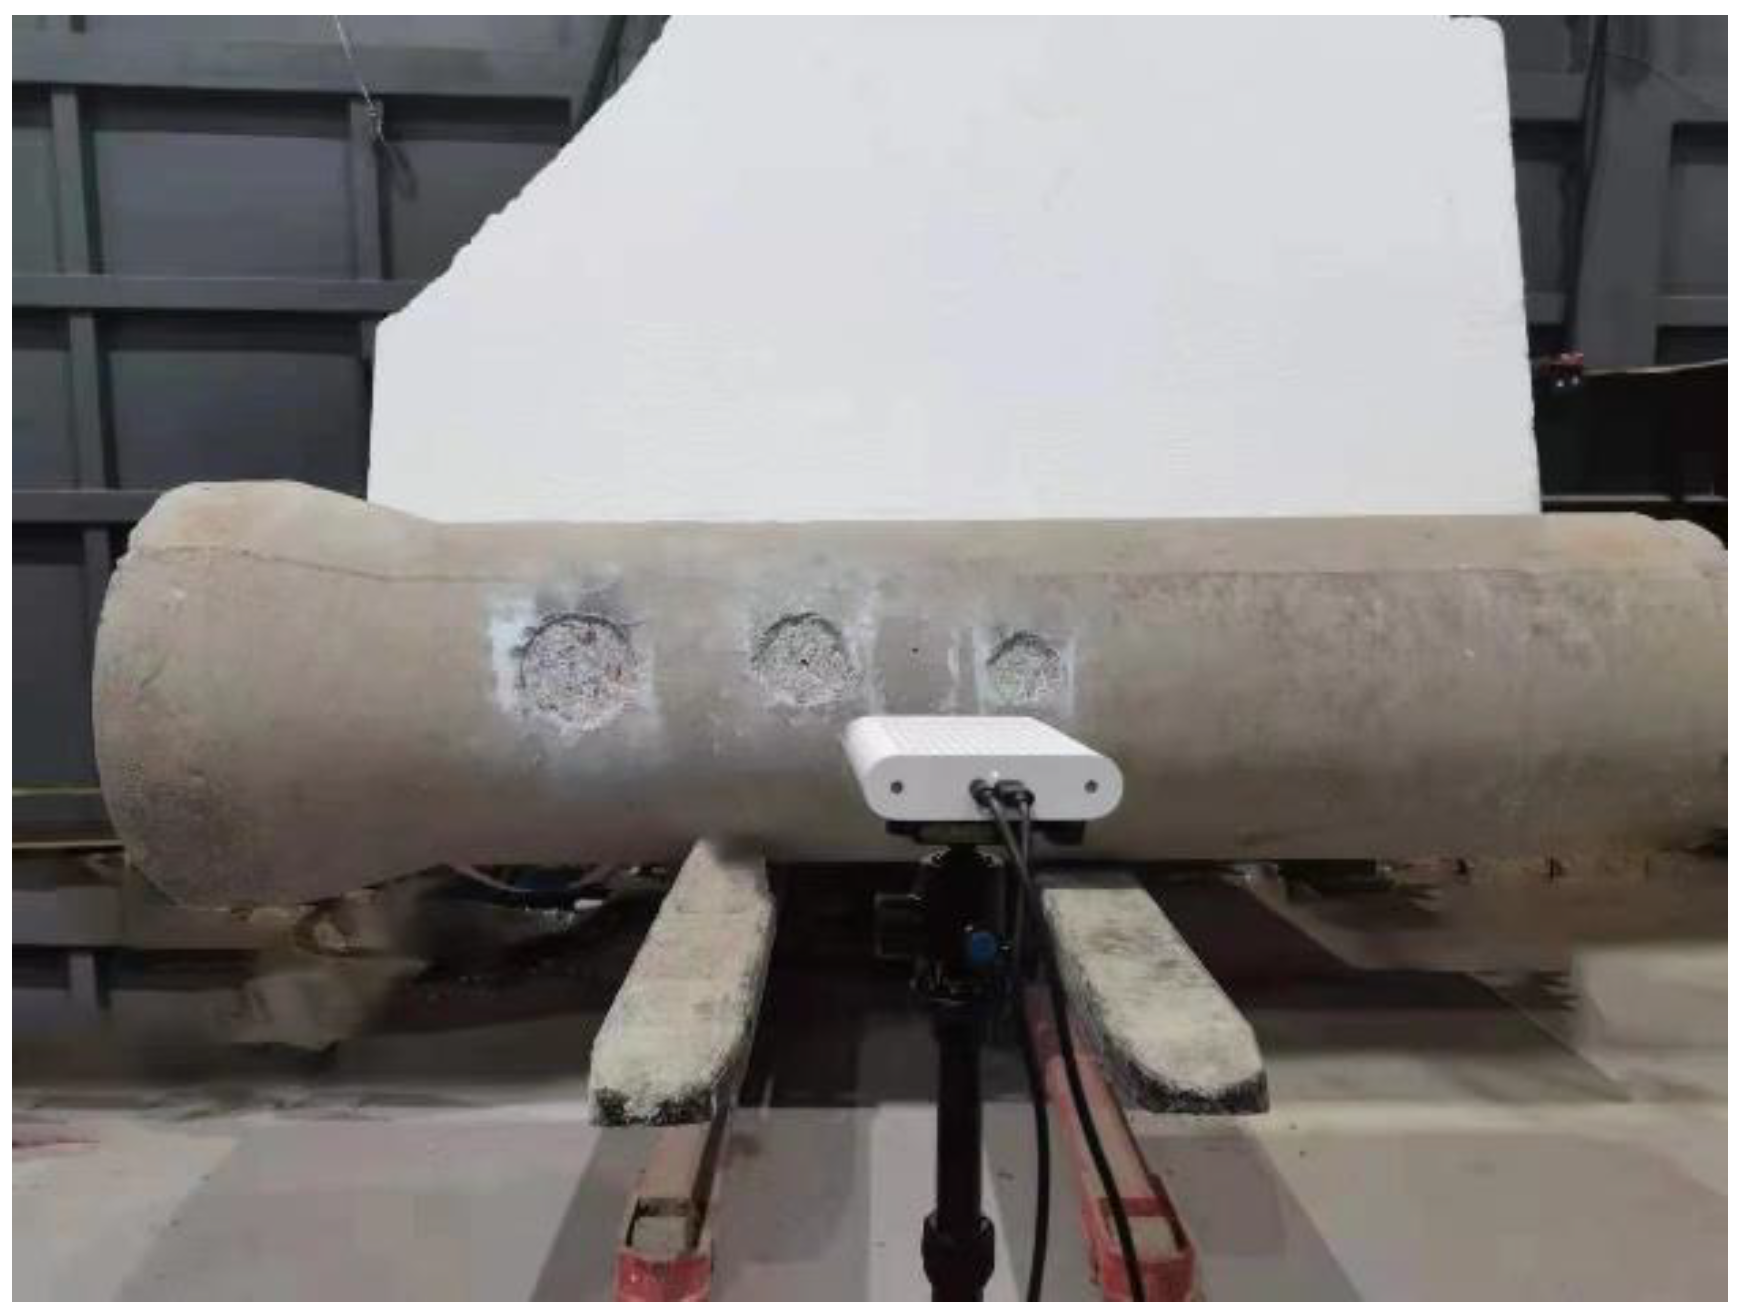
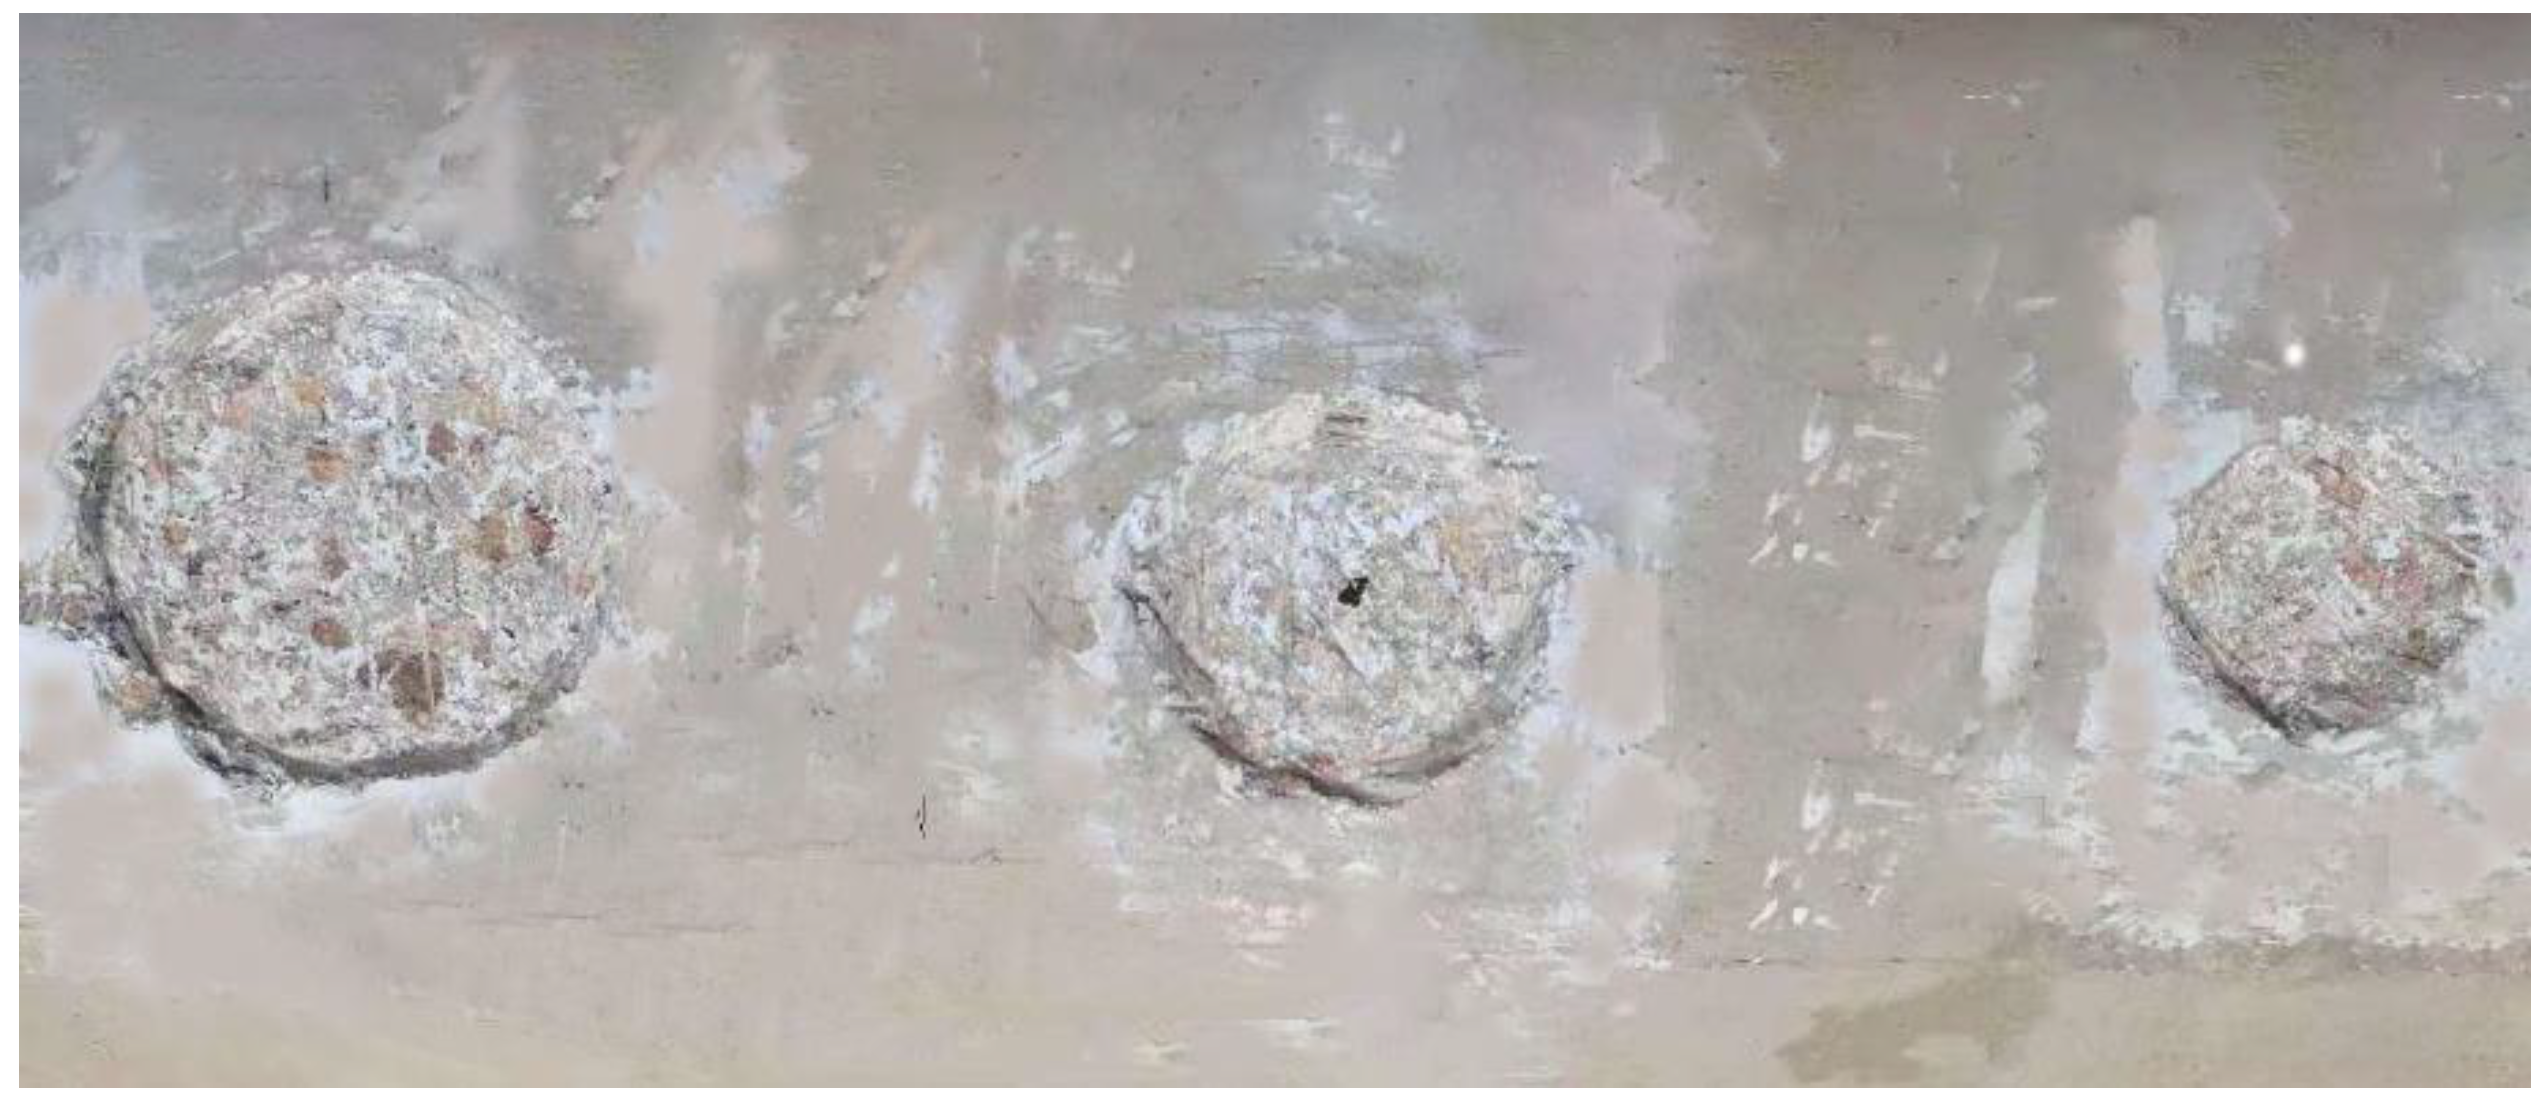
3.1. Data Collection

In this paper, depth camera Microsoft Azure Kinect DK [28] was used to obtain 3D point cloud information of damaged pipeline. By implementing the principle of amplitude modulated continuous wave (AMCW) time difference ranging (TOF), the Azure Kinect DK depth camera projects the modulated light in the near infrared (NIR) spectrum into the scene, records the indirect time measurements taken by the light to propagate from the camera to the scene and return from the scene to the camera, and generates a depth image by processing these measurements. The depth image is a set of Z-coordinate values of each pixel of the image, in millimeters. The parameters of Azure Kinect DK depth camera adopted are shown in Table 1.
In order to avoid errors caused by irregular operation, the center line of the depth camera should be consistent with the center of the pipeline when collecting the depth image information of pipeline defects. The depth image is converted into point cloud image by MATLAB software. The principle of converting depth image into point cloud image is the mutual conversion between internal and external parameter matrices, and the image coordinates are converted into world coordinates. There is a certain relationship between the three-dimensional coordinates ( x , y , z ) of the camera and its world coordinates ( x 0 , y 0 , z 0 ), namely
x 0 = x f x z + c x
y 0 = y f y z + c y
z 0 = z s
where f x and f y are the focal lengths of the camera on the x and y axes, respectively, c x and c y are the aperture factors of the camera on the x and y axes, respectively, and s is the scaling factor of the depth image.

3.2. Data Processing

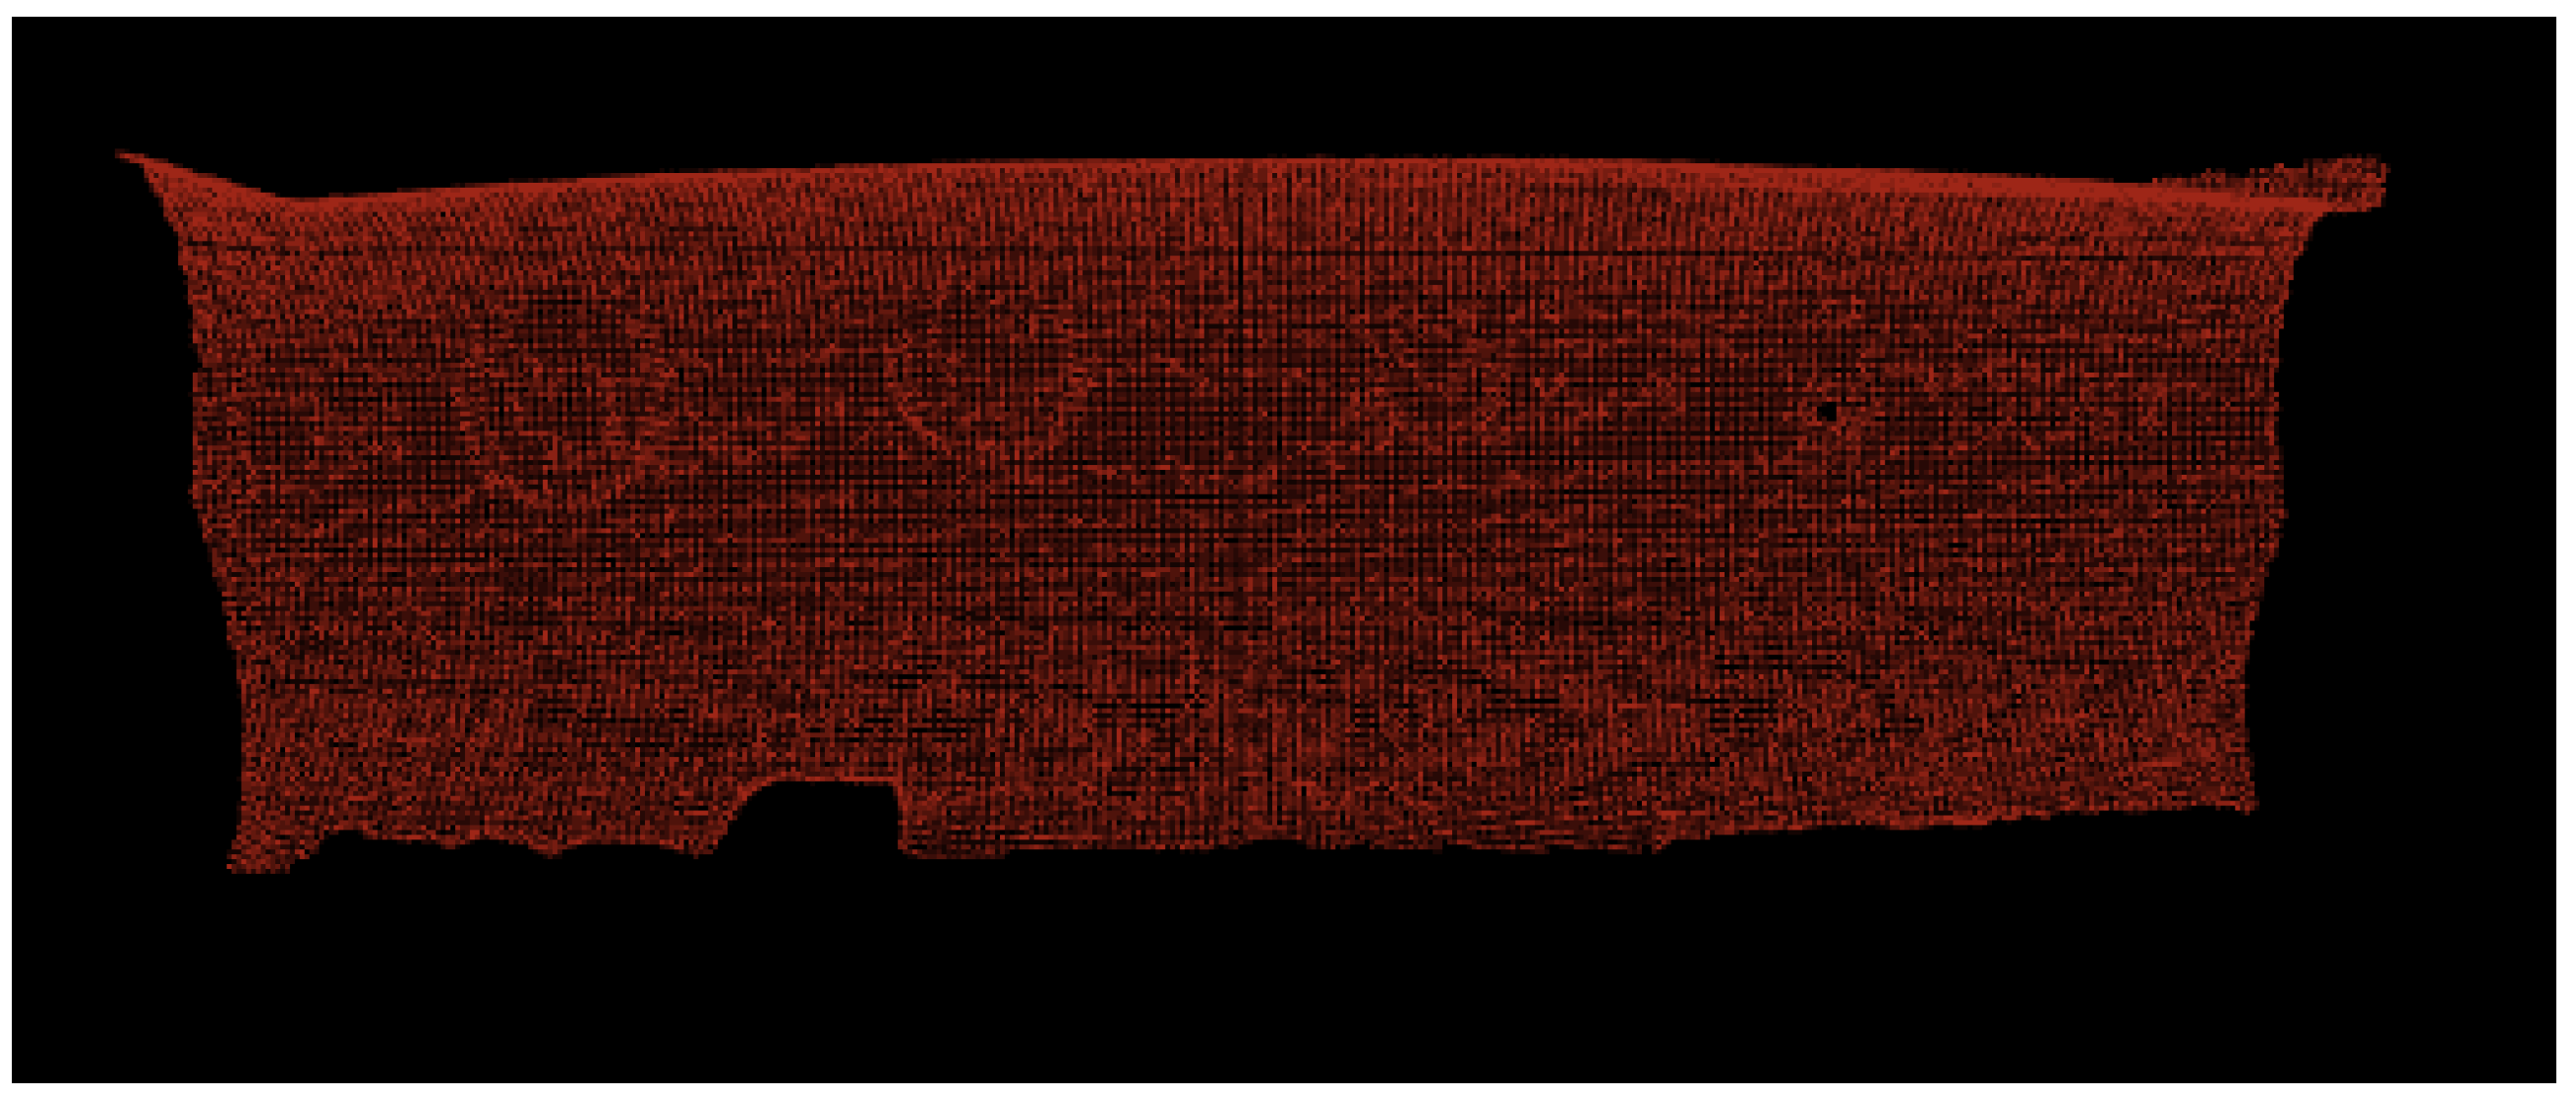
3.2.1. Data Denoising

In the process of shooting, due to the influence of equipment precision limitations, environmental conditions and human operation factors, objects other than the pipeline will be photographed; that is, noise points will be generated. Therefore, the obtained point cloud should be filtered and denoised to remove redundant noise points and outliers. In order to deal with more complex point clouds, there are more and more studies on point cloud denoising algorithms. Curvature constraint [29] and region growth [30] are used for point cloud denoising to deal with different types of point clouds, so as to improve the accuracy.
Statistical outlier removal is adopted to eliminate obvious redundant outliers. Its principle is to select query points, and make a statistical analysis on the field of each point. It eliminates some points that do not meet a certain standard and calculates the average distance between the query points and all point sets in its neighborhood, as well as the mean value of these average distances μ and standard deviation σ. It assumes that the result is gaussian distribution. The distance threshold D is expressed as:
D = μ ± σ × α
where μ is the mean value; σ is the standard deviation; α is the standard deviation multiple threshold; D is the distance threshold.
Then, for the whole point cloud, the point whose average distance is greater than that of the query point and all point sets in the neighborhood is identified as the outliers and removed from the data. Point cloud denoising can reduce the amount of data and improve the efficiency of feature extraction. However, we should try to reduce the appearance of noise. Firstly, direct sunlight should be avoided in the indoor experiment. Secondly, a relatively quiet and clean environment is required while shooting. Finally, the experiment operation should be correct, so as to improve the accuracy of the experiment.

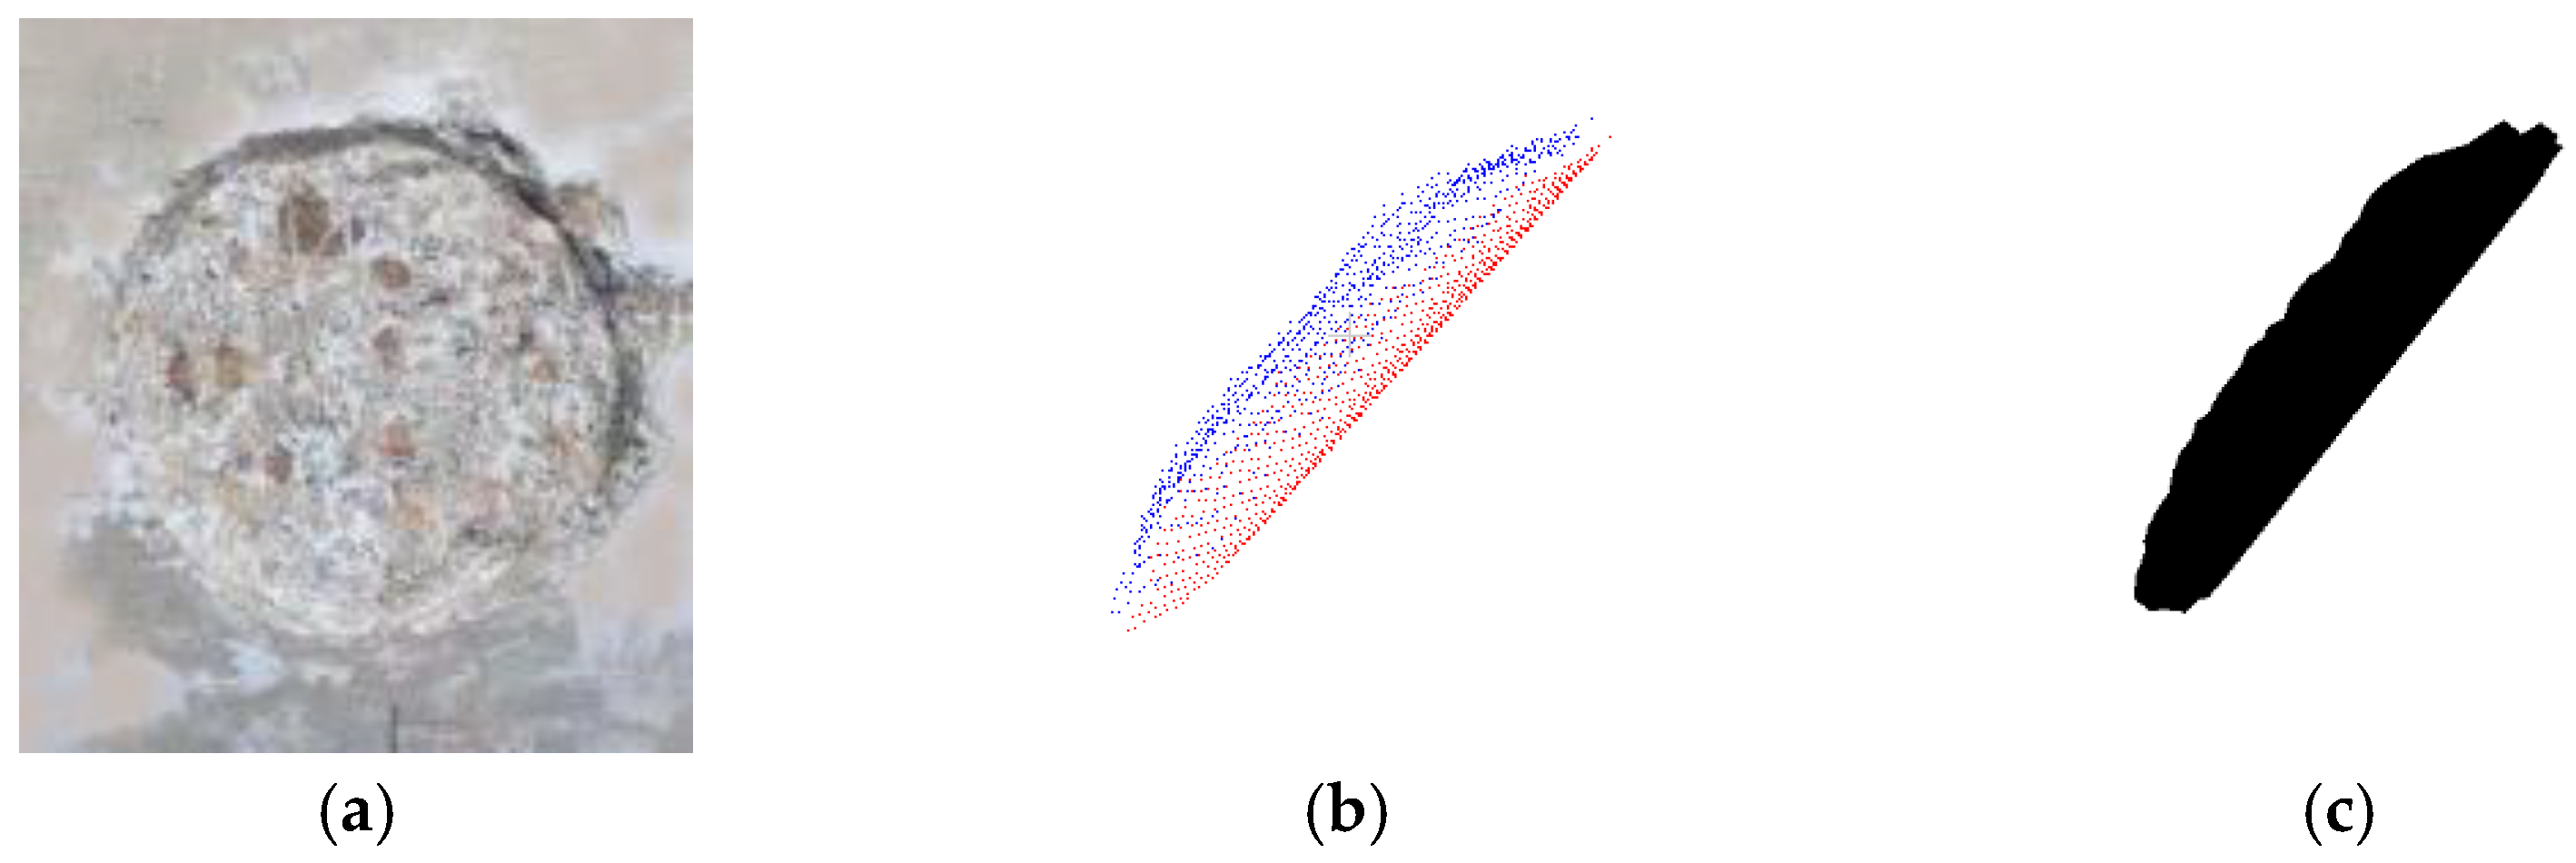
3.2.2. Data Segmentation

Point cloud segmentation is to classify the point cloud according to the characteristics of space, geometry and texture. The main purpose is to divide the point cloud into multiple homogeneous regions, so that the point cloud segmented in the same region has similar properties, which is convenient for subsequent work. At present, the point cloud segmentation methods that have attracted more attention are mainly segmentation algorithms based on deep learning. There are, relatively, many studies on point cloud semantic segmentation and other enhanced semantic segmentation algorithms [31,32], but the deep learning methods need a large number of data sets for training, so it is difficult to implement. In this study, the pipe point cloud and damage point cloud model are obtained. RANSAC random sampling consistency algorithm, namely cylinder model segmentation algorithm, can extract a cylinder model from the point cloud with noise [15]. SACMODEL_CYLINDER model is defined as the cylinder model provided in PCL, and this method has clear objectives, simple procedures and is easy to understand. Therefore, the cylinder model segmentation algorithm is preferred to segment the pipe point cloud. The cylinder model segmentation algorithm can obtain the cylinder surface in the point cloud by nonlinear least square fitting. The algorithm uses random sampling consistency estimation to extract the key part, namely the pipe model, from the point cloud. On the basis of filtering the data, firstly, the normal of the point cloud needs to be estimated, and then the plane model in the point cloud is fitted. Secondly, the RANSAC random sampling consistency robust estimation is used to obtain the cylindrical model coefficients.
For the extraction of pipeline surface damage, the damage is floating in midair relative to the pipeline surface. If the pipeline surface is extracted, the Euclidean clustering algorithm [33] can be used to segment the damage. Euclidean clustering extraction is a clustering algorithm based on Euclidean distance measurement. Firstly, the pipeline surface model is segmented, all pipeline surfaces are extracted, to be merged and removed, and then the k-d tree object is established as the index method for extracting damaged point cloud. A Euclidean clustering object is created, and reasonable extraction parameters and variables are set according to the size of the segmented point cloud. Finally, the damage model is extracted.

3.3. Data Calculation

ICP (Iterative Closure Point) algorithm can realize the splicing of defect point cloud and fitting pipeline surface point cloud, which has high registration speed and accuracy [34]. MeshLab is a very powerful open source system for processing and editing triangular mesh models. It provides a set of tools for editing, cleaning, repairing, checking, rendering, texturing and converting meshes. Different algorithms can be used to reconstruct the collected 3D point clouds into mesh models. The Cloud Compare open source tool is used to calculate the volume and surface area of the reconstructed model, and then the surface area of triangular mesh is also calculated by using the class vtkmassproperties in PCL.

3.4. Construction of the Platform

With the development of cloud computing, Internet of Things, GIS, big data analysis and other intelligent technologies, the tide of information based on computer technology has occupied various fields of social economy, and information management has become an important part of the management industry. The biggest feature of BIM Technology is that there is a large amount of information in the building model, which aims to help realize the integration of building information. It is defined as “digital representation of facility physical and functional characteristics” and used as “a shared knowledge resource” [35]. Building Information Modeling (BIM)-based tools are diffusely used to improve the performances of facility management [36,37]. BIM technology can be extended to the operation and maintenance stage of underground drainage pipeline, so as to help us understand the operation state of the pipeline and improve the service level of the pipeline.

3.4.1. Development Method of the Platform

Underground sewage pipes are mostly made of concrete, and under the action of long-term erosion and external load, the internal and external walls of the pipes are prone to various degrees of damage. Nowadays, the three-dimensional defect information management of drainage pipes faces the following challenges: (1) there are many three-dimensional defects in pipes; (2) it is generally difficult to build models with defects in BIM; (3) the volume and surface area of these defects cannot be calculated and displayed directly, which is easy to cause the problem of information island; and (4) lack of an information management platform. Therefore, BIM is applied in the later operation and maintenance stage of the pipeline, the method of combining the real-time point cloud data of the pipeline with the pipeline BIM model is adopted. On the basis of the damage data obtained, the information management platform is constructed by using the database technology to make the data more intuitive. On this platform, you can not only browse the three-dimensional model of the pipeline, but also display the location and size of the pipeline damage. At the same time, professionals communicate with each other about the detection and maintenance of the pipeline, and feedback the health status of the pipeline, so as to achieve the purpose of operation and maintenance monitoring of the life cycle of the drainage pipeline. The development process of a three-dimensional defect information management platform of a drainage pipeline based on BIM is shown in Figure 2, which is composed of BIM modeling of the pipeline, acquisition of defect point cloud data and development of an application system. Firstly, the pipeline information model is established and the defect point cloud of pipeline is collected, and the proposed method is used for data processing. Then, the application system is developed and realized based on secondary development tools, point cloud processing data and corresponding standards and specifications.

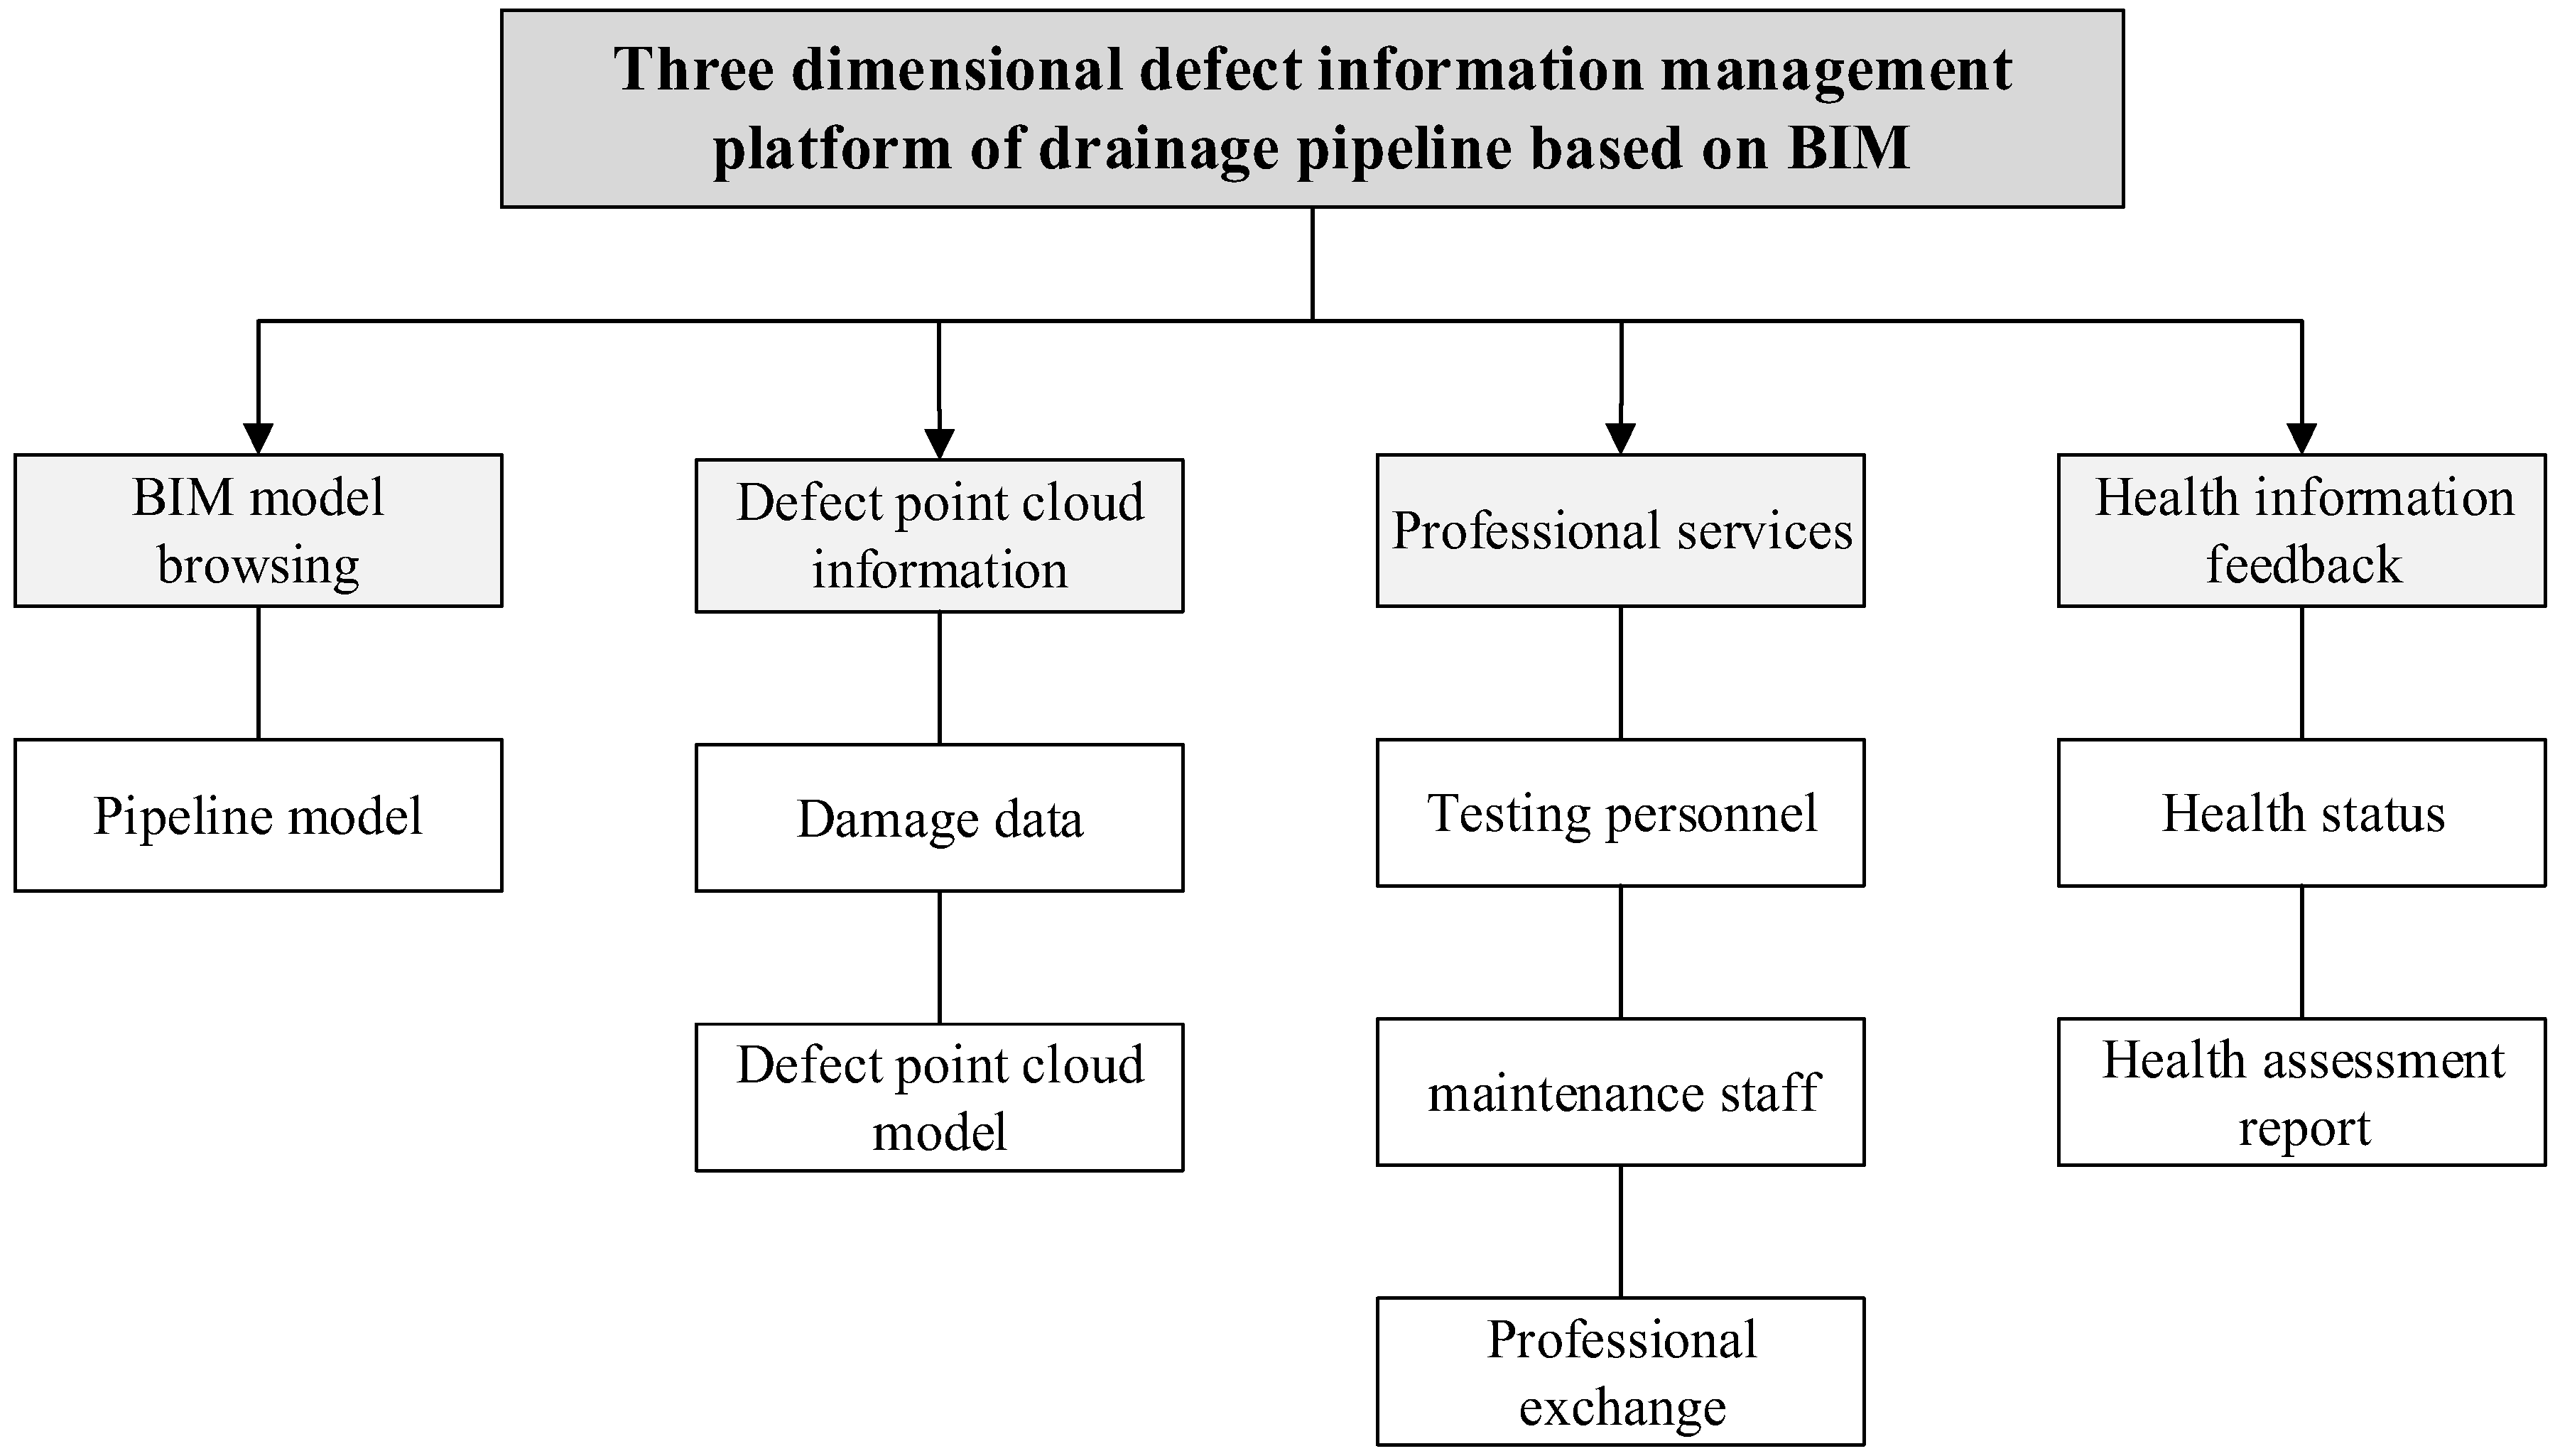
3.4.2. Functional Composition of the Platform

In this study, a BIM-based 3D defect information management platform for drainage pipes is constructed. The construction framework of the platform is mainly composed of four modules: BIM model browsing, defect point cloud information, professional services and health information feedback. These four modules are connected to form an information structure based on pipeline operational management of the information, and all information is integrated on the visual platform to avoid the trouble caused by paper. Figure 3 is the functional construction framework of the information management platform. The BIM model browsing module establishes the underground pipeline model database for 3D model visualization; the defect point cloud information module can statistically analyze and display the three-dimensional damage information of pipeline; in the professional service module, managers discuss the damaged condition and maintenance mode of pipeline on the platform; and the health information feedback module can evaluate the health of the pipeline according to the overall condition of the pipeline. The system includes the three-dimensional defect information of the pipeline and the later maintenance and evaluation, and realizes the simple operation and maintenance mode of the pipeline.

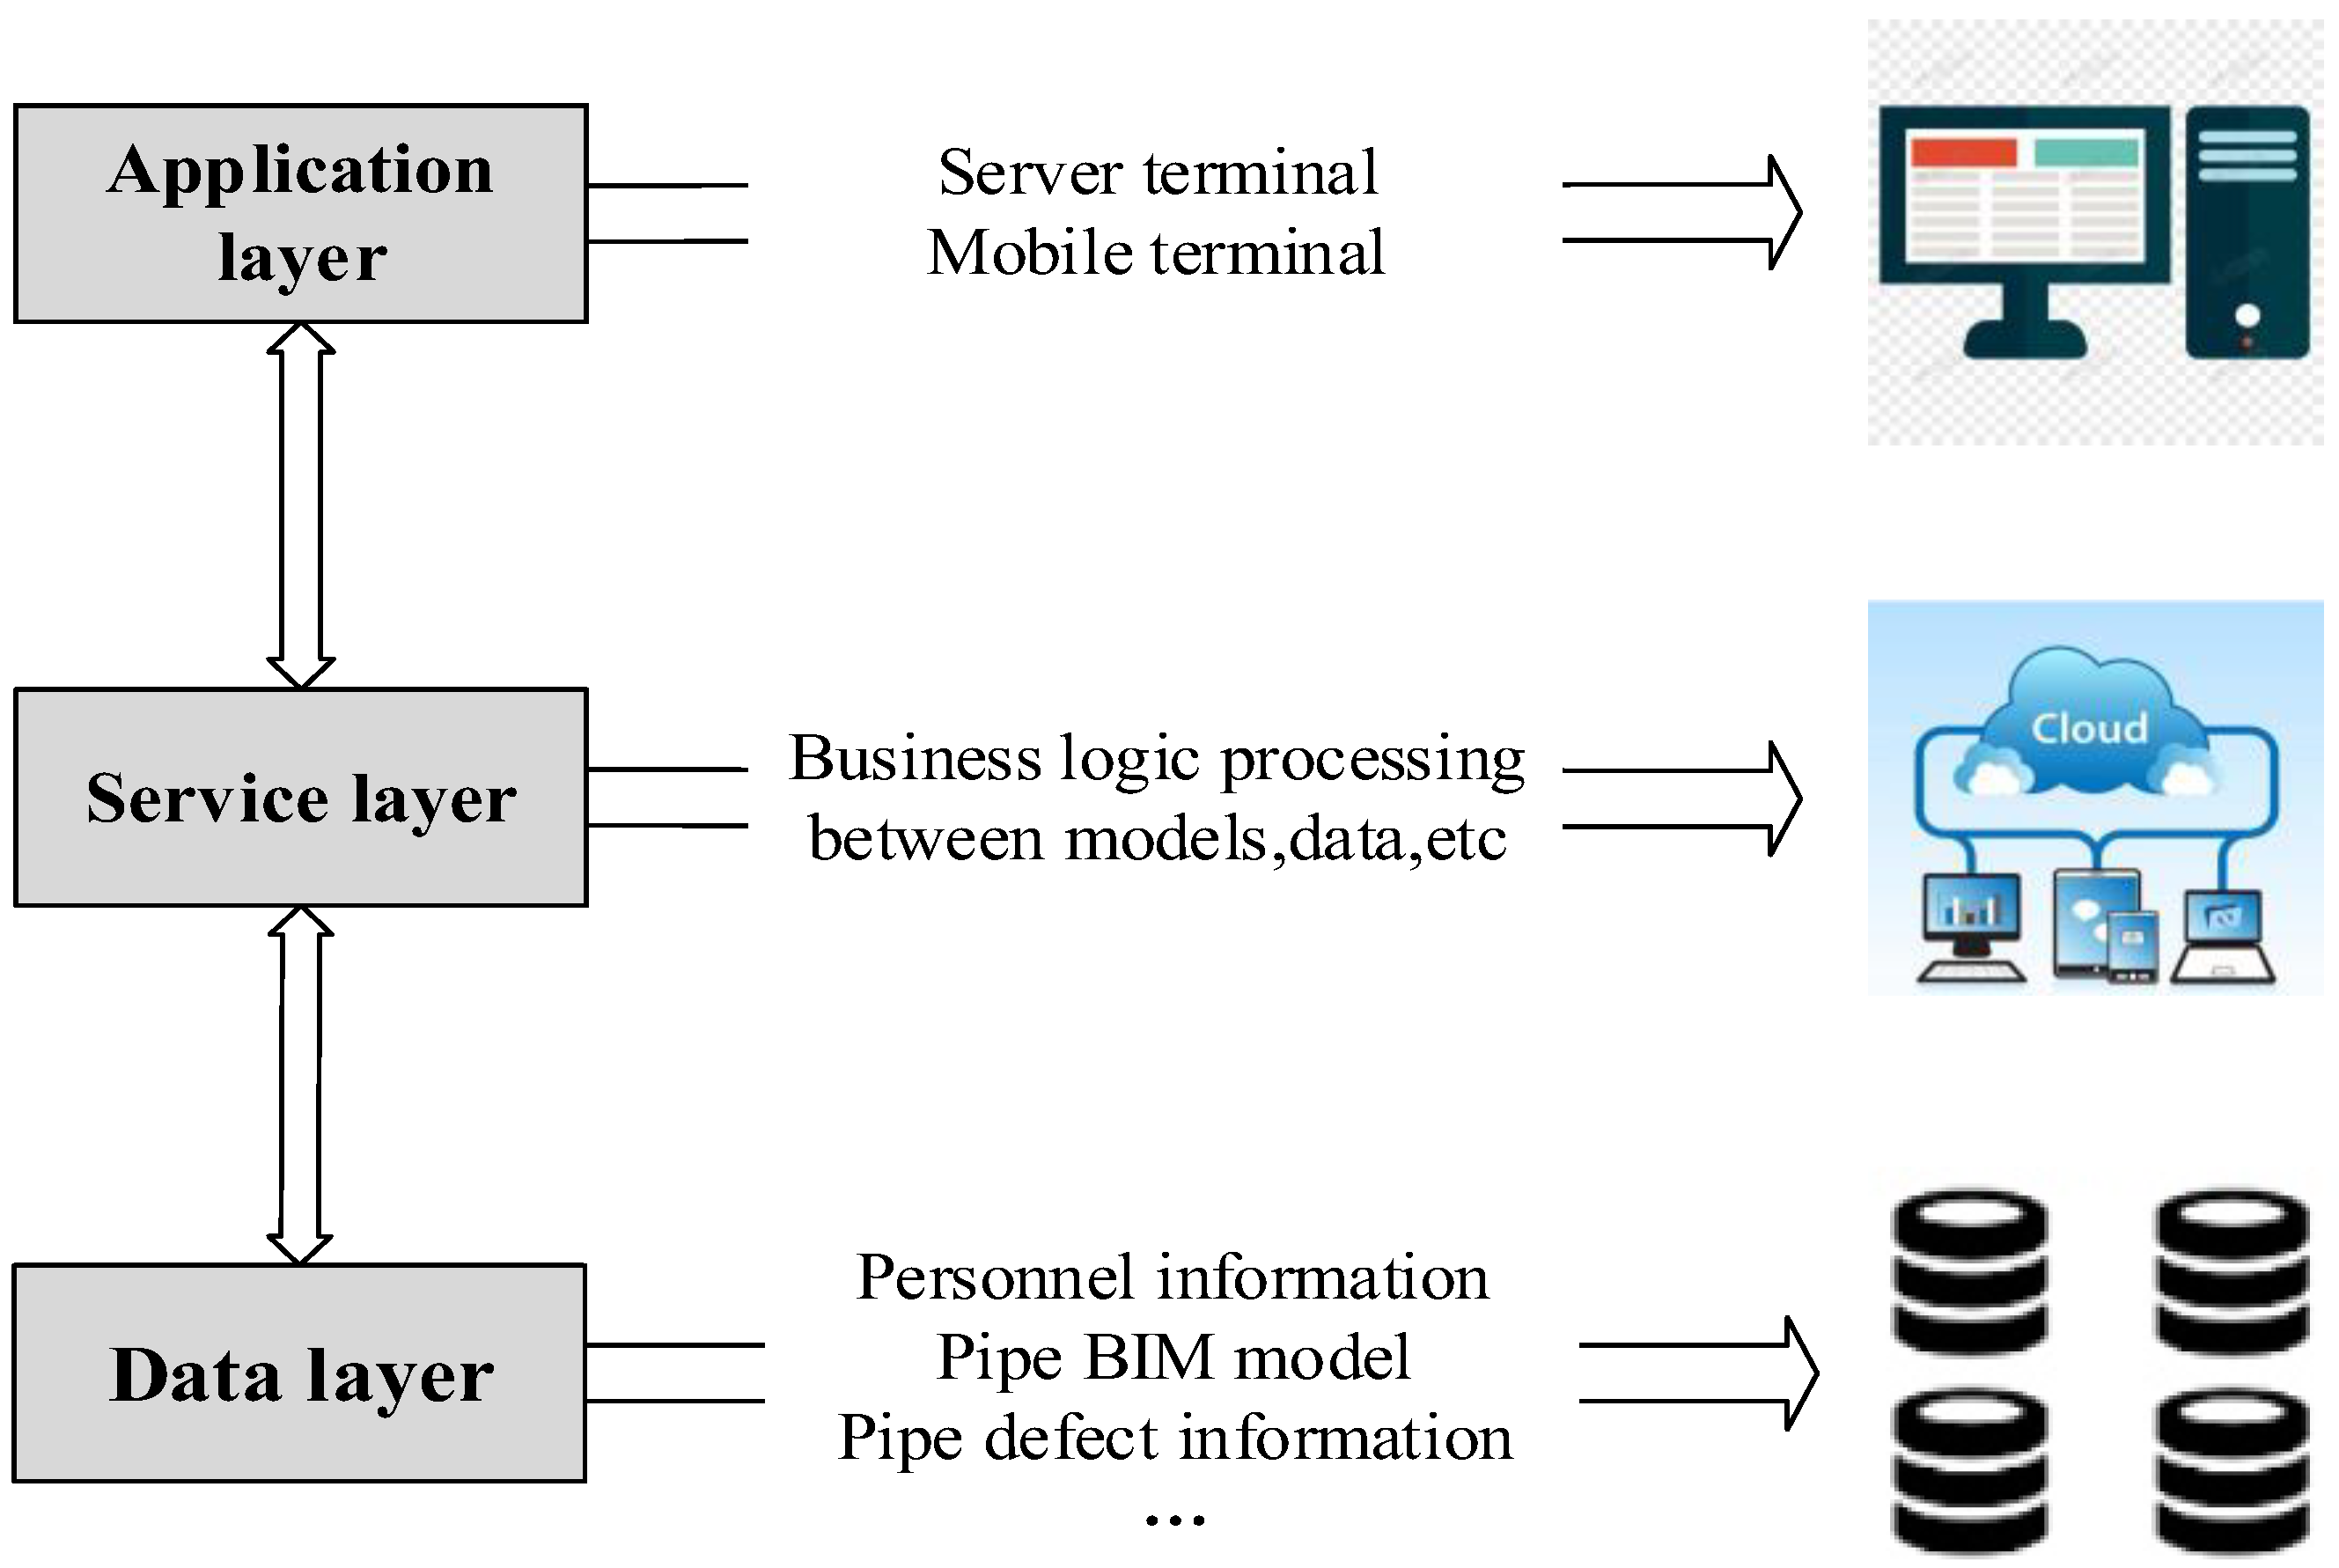
3.4.3. Overall Structure of the Platform

The platform is mainly built on the basis of B/S structure mode (B/S structure is Browser/Server abbreviation, refers to the Browser/Server mode. In this structure, the user work interface is realized through the Browser, a little part of the transaction logic is implemented in the front end (Browser), but the main transaction logic is implemented in the Server side (Server), forming the so-called three-tier structure.), adopting a three-layer structure system of data layer, service layer and application layer, as shown in Figure 4. The data layer is the collection of all data of the platform, and the data processed above is submitted to the database through forms. The database includes model data, damage data, professional communication, inspection personnel, maintenance personnel and health status. The forms submitted to the database are in Table A1 of Appendix A. The database is constructed by structured query language (SQL) to facilitate inquiry and operation [38]. The service layer carries the business logic processing task of the system, and the core part of the system function realization is concentrated on the server. The server uses Spring Boot technology to interact with the database, and can establish the mapping relationship between information and generate data tables using unified standards. The application layer interacts with the front-end interface, and the front-end interface is designed to deploy and develop in the Node.js operating environment with Vue.js technology [39]. The data can be visually displayed on the web browser, and then we can also feedback the information to the mobile phone or browser for viewing.

4. Experiments

This section introduces the method of quantifying the three-dimensional defect information of drainage pipeline, obtains the three-dimensional point cloud information of pipeline defects based on the depth camera, and extracts the features of the collected point cloud data by using the random sampling consistency algorithm and Euclidean clustering algorithm. After that, damage point cloud mesh is reconstructed, and damage volume and surface area are calculated.

4.1. Data Collection

Figure 5 shows the pipeline photographed by Kinect DK. Since the frame rate of the depth sensor is certain, the farther the distance is, the less the amount of data that will be obtained. Therefore, the distance between the camera and the pipeline is adjusted to 100 cm, 125 cm, 150 cm, 175 cm and 200 cm, respectively, to shoot multiple groups of depth images, which is convenient for data comparison and analysis. The detection distance is mainly selected and set reasonably according to the parameters of the depth camera in Table 1 above. In order to reduce the influence of external environmental noise, this measurement test was carried out indoors. To discuss the effect of noise on accuracy, we carried out a comparative test with or without light, and found that the experimental results are basically the same, indicating that the influence of light on the experiment is not significant. In addition, we can also analyze the effect of strong sunlight on the results by adding outdoor comparative experiments. The geometric dimensions of the pipe are 49 cm outer diameter, 39 cm inner diameter and 210 cm long. Figure 6 shows the extracted point cloud. In this study, a 3D point cloud was collected for only part of the pipeline with defects, so only part of the point cloud of the pipeline was extracted.

4.2. Data Processing

Firstly, statistical filtering algorithm is used to denoise the acquired point cloud data. The distance threshold D is set to 2 mm for data denoising [15]. Then, the cylinder model segmentation algorithm can extract the pipe point cloud according to the extraction coefficient of the pipe, and the point cloud model of the pipeline is shown in Figure 7. Finally, the Euclidean clustering algorithm can be used to segment the damage from the pipeline. The extracted damage point cloud is shown in Figure 8.

4.3. Damage Data Calculation

4.3.1. Damage Real Volume Measurement

In order to verify the accuracy of the calculated damage volume, firstly, the volume of each damage on the pipeline is measured by physical experiment. Since the damage surface is irregular, it is difficult to measure the volume, so the damage volume is measured manually by dental alginate impression material. Experimental apparatus: beaker, measuring cylinder, rubber head dropper, precision electronic weighing instrument, etc., experimental materials: water, alginate impression material, etc., after mixing alginate impression material with water, it has the advantages of good fluidity, elasticity and no change in size, stable performance and low price, so it is very suitable for this experiment [40,41]. The main experimental steps are as follows: First the alginate impression material mixed with water in certain proportion, mix after rapid filling into the pipeline damage, then trowel its surface, and the surface has the same radian as the pipeline. After standing for 1 min, take out the model after it is fully fused with the damaged surface, and finally measure the volume of the impression taken out by the drainage method. As alginate impression material has good non water absorption, the volume of discharged water is the real volume of damage to be measured. In order to reduce the error, the volume of each damage is measured three times, and the average value of the three times is obtained, as shown in Table 2 below. In Figure 9, 1–3 are the three damages from right to left, and the same is true for Table 3 and Table 4 below.

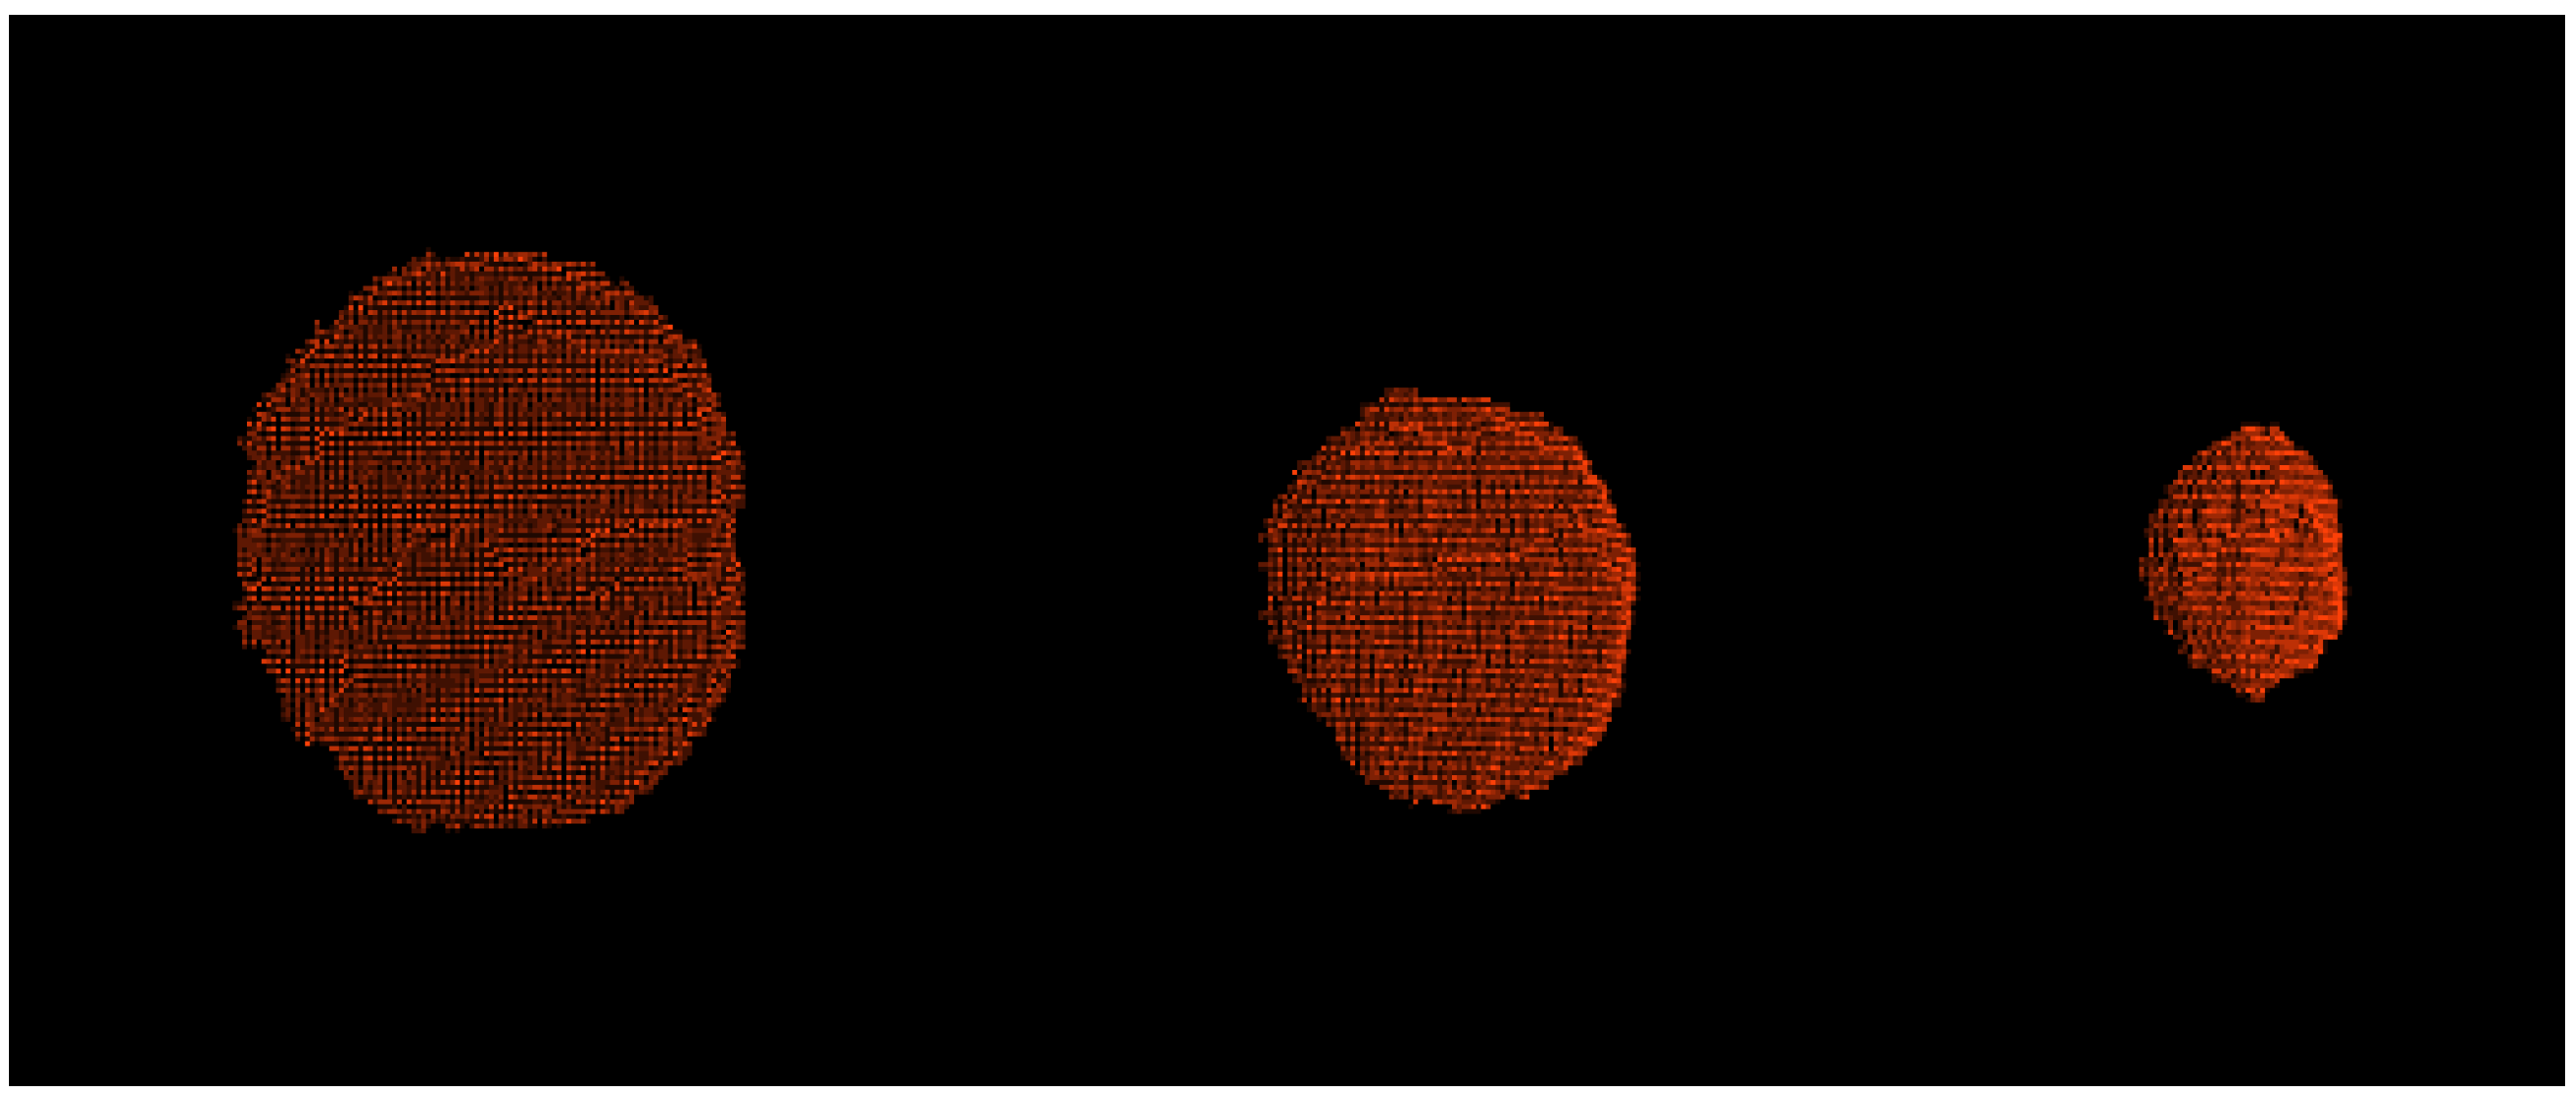
4.3.2. Damage Point Cloud Reconstruction

After the damage point cloud is spliced and reconstructed, the volume is quantified. Then, in MeshLab, the surface reconstruction function is used to build the point cloud mesh model of each damage by adjusting the size of parameters. Figure 10 shows the process of damage point cloud reconstruction.

4.3.3. Quantification of Damage Volume

Next, the damage volume is quantified, and the reconstructed mesh model is imported into Cloud Compare software to calculate the volume of the mesh model. Table 3 shows the damage volume and the error E between the quantified volume and the real volume, where the error E is calculated by Formula (5).
E = Q v R v R v × 100 %
where E is the error, R v is the real volume and Q v is the calculated volume.

4.3.4. Calculation of Damage Surface Area

The surface area of three-dimensional damage is the sum of the areas of each surface of the constructed mesh model. Two methods are used to compare and calculate the surface area, respectively. Firstly, the overall surface area of the reconstructed mesh is measured by using the measure surface function in the open source tool cloud compare, and then the damage area of the triangular mesh is calculated by using the class vtkmassproperties in PCL. Finally, it is found that the results of the two methods are the same, and the surface areas at different distances of the three damages are obtained, as shown in Table 4.

5. Results Discussion

According to the results of the above experiments, it can be seen that most of the errors between the quantified damage volume and the real volume are within 10%, and the calculated average errors with respect to different volumes are 6.14%, 4.16%, 9.85%, 8.03%, and 10.24%, respectively. Some errors are large, which may be caused by the error in the process of data preprocessing. In addition, in the process of shooting with depth camera, the infrared projector is not aligned with the horizontal centerline of the pipeline. The shape and location of damage will affect the accuracy of measurement. However, the maximum error in Table 3 is 17.54%, which is smaller than the maximum errors of 25.29% and 25.92% in the experimental results of Gustavo H. Beckman et al. [14] and Liu et al. [15], indicating that the accuracy is high and can be used. As the damage of the actual surface is difficult to measure in reality, we used two methods to calculate its surface area, and the calculation result is the same. According to the quantified damage volume and the size of damage depth, it can be seen that the calculated surface area is reasonable. We use the same method to calculate the size of the surface area and volume. It shows that the final surface area is close to the real value, and the calculation method is accurate.

6. Defect Information Management Platform

6.1. Model Construction

6.1.1. Creation of Pipeline BIM Model

The Revit software of Autodesk company is used to establish the three-dimensional model of the pipeline. Revit is one of the most commonly used software for building the three-dimensional model in BIM. It can realize the complete handover of the plan and elevation, has a powerful linkage function, and can export the three-dimensional design size and volume data of each component, can save the cost and improve the engineering efficiency. It is conducive to the construction of large-scale building model and information acquisition. During modeling, attention should be paid to the size and material selection of the pipeline. The model is finally obtained by the two-dimensional contour through the rotation command. Figure 11 is the single pipe model established by Revit software. The minimum Level of Detail (LOD) for the pipeline model is LOD 100. LOD of pipeline model refers to the degree of model meticulousness, which refers to the process in which the pipeline model unit develops from the lowest level of conceptual design to the highest level of demonstration accuracy.

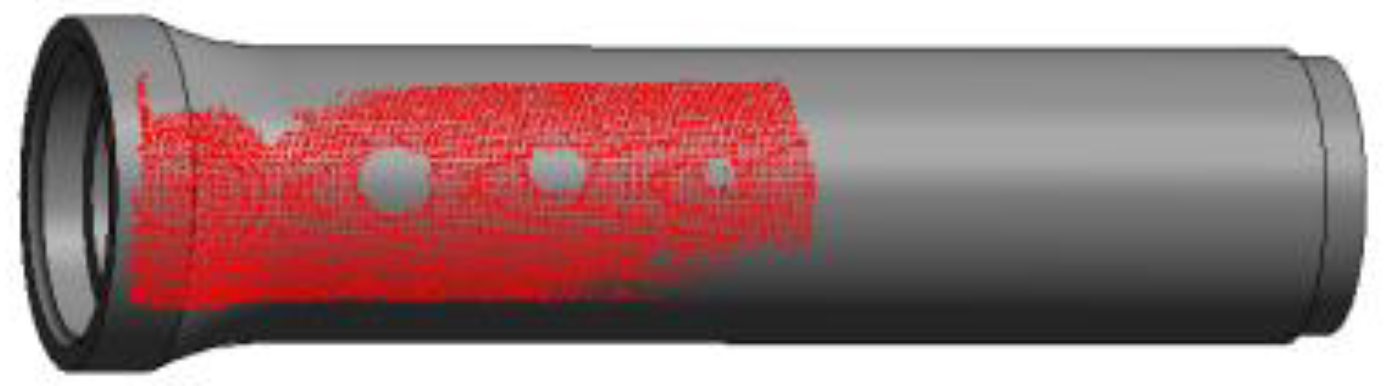
6.1.2. BIM Model Combined with Point Cloud Data

To combine the extracted pipeline point cloud data with the built BIM model for visual display, the point cloud format needs to be converted to the file format supported by BIM first. The point cloud formats that can be directly imported into Revit include RCP and RCS formats. As there are disordered points in the pipeline point cloud obtained when extracting key parts, which affects the subsequent registration, Cloud Compare software is used to cut the point cloud model. After the point cloud is imported into the model, to register the position between them. Registration is mainly done in Revit software. First, after point cloud data is imported into Revit, Revit will place the world origin of point cloud, namely (0,0,0) point, at the origin of Revit project. Then, in the site plane, the Revit project origin can be regarded as the project base point. The north direction of point cloud (0,1,0) overlapped with “project North” in Revit to keep the coordinate system in the same direction. Then, rotate the point cloud to match the position of the model. The registered point cloud and pipeline model are shown in Figure 12. After registration, the method of traversing every point in the point cloud is adopted to obtain the direction from the point cloud emission origin to the point, and the laser emission direction is obtained. Further, a forward projection and a reverse projection are carried out in this direction to try to find the plane that can be projected to, and calculate the corresponding distance. Finally, the shortest distance is taken as the error of this point. The registration accuracy of most point clouds is within 5 mm. In the following research, we will further improve the registration accuracy. However, it can be found that some point clouds are not completely consistent with the BIM model. The main causes of these errors are external interference during shooting, camera accuracy and some improper operation factors.

6.2. The Platform Function

The damage data obtained from the above test and the pipeline model are integrated into the constructed information management platform. Furthermore, the functions of the platform are realized by leveraging B/S architecture and database technology. This section mainly introduces the specific implementation of the functions of the four modules of the system (BIM model browsing, defect point cloud information, professional service and health information feedback). The required server specifications for running the platform are 1 core, 1 GB memory and 1 MB bandwidth.

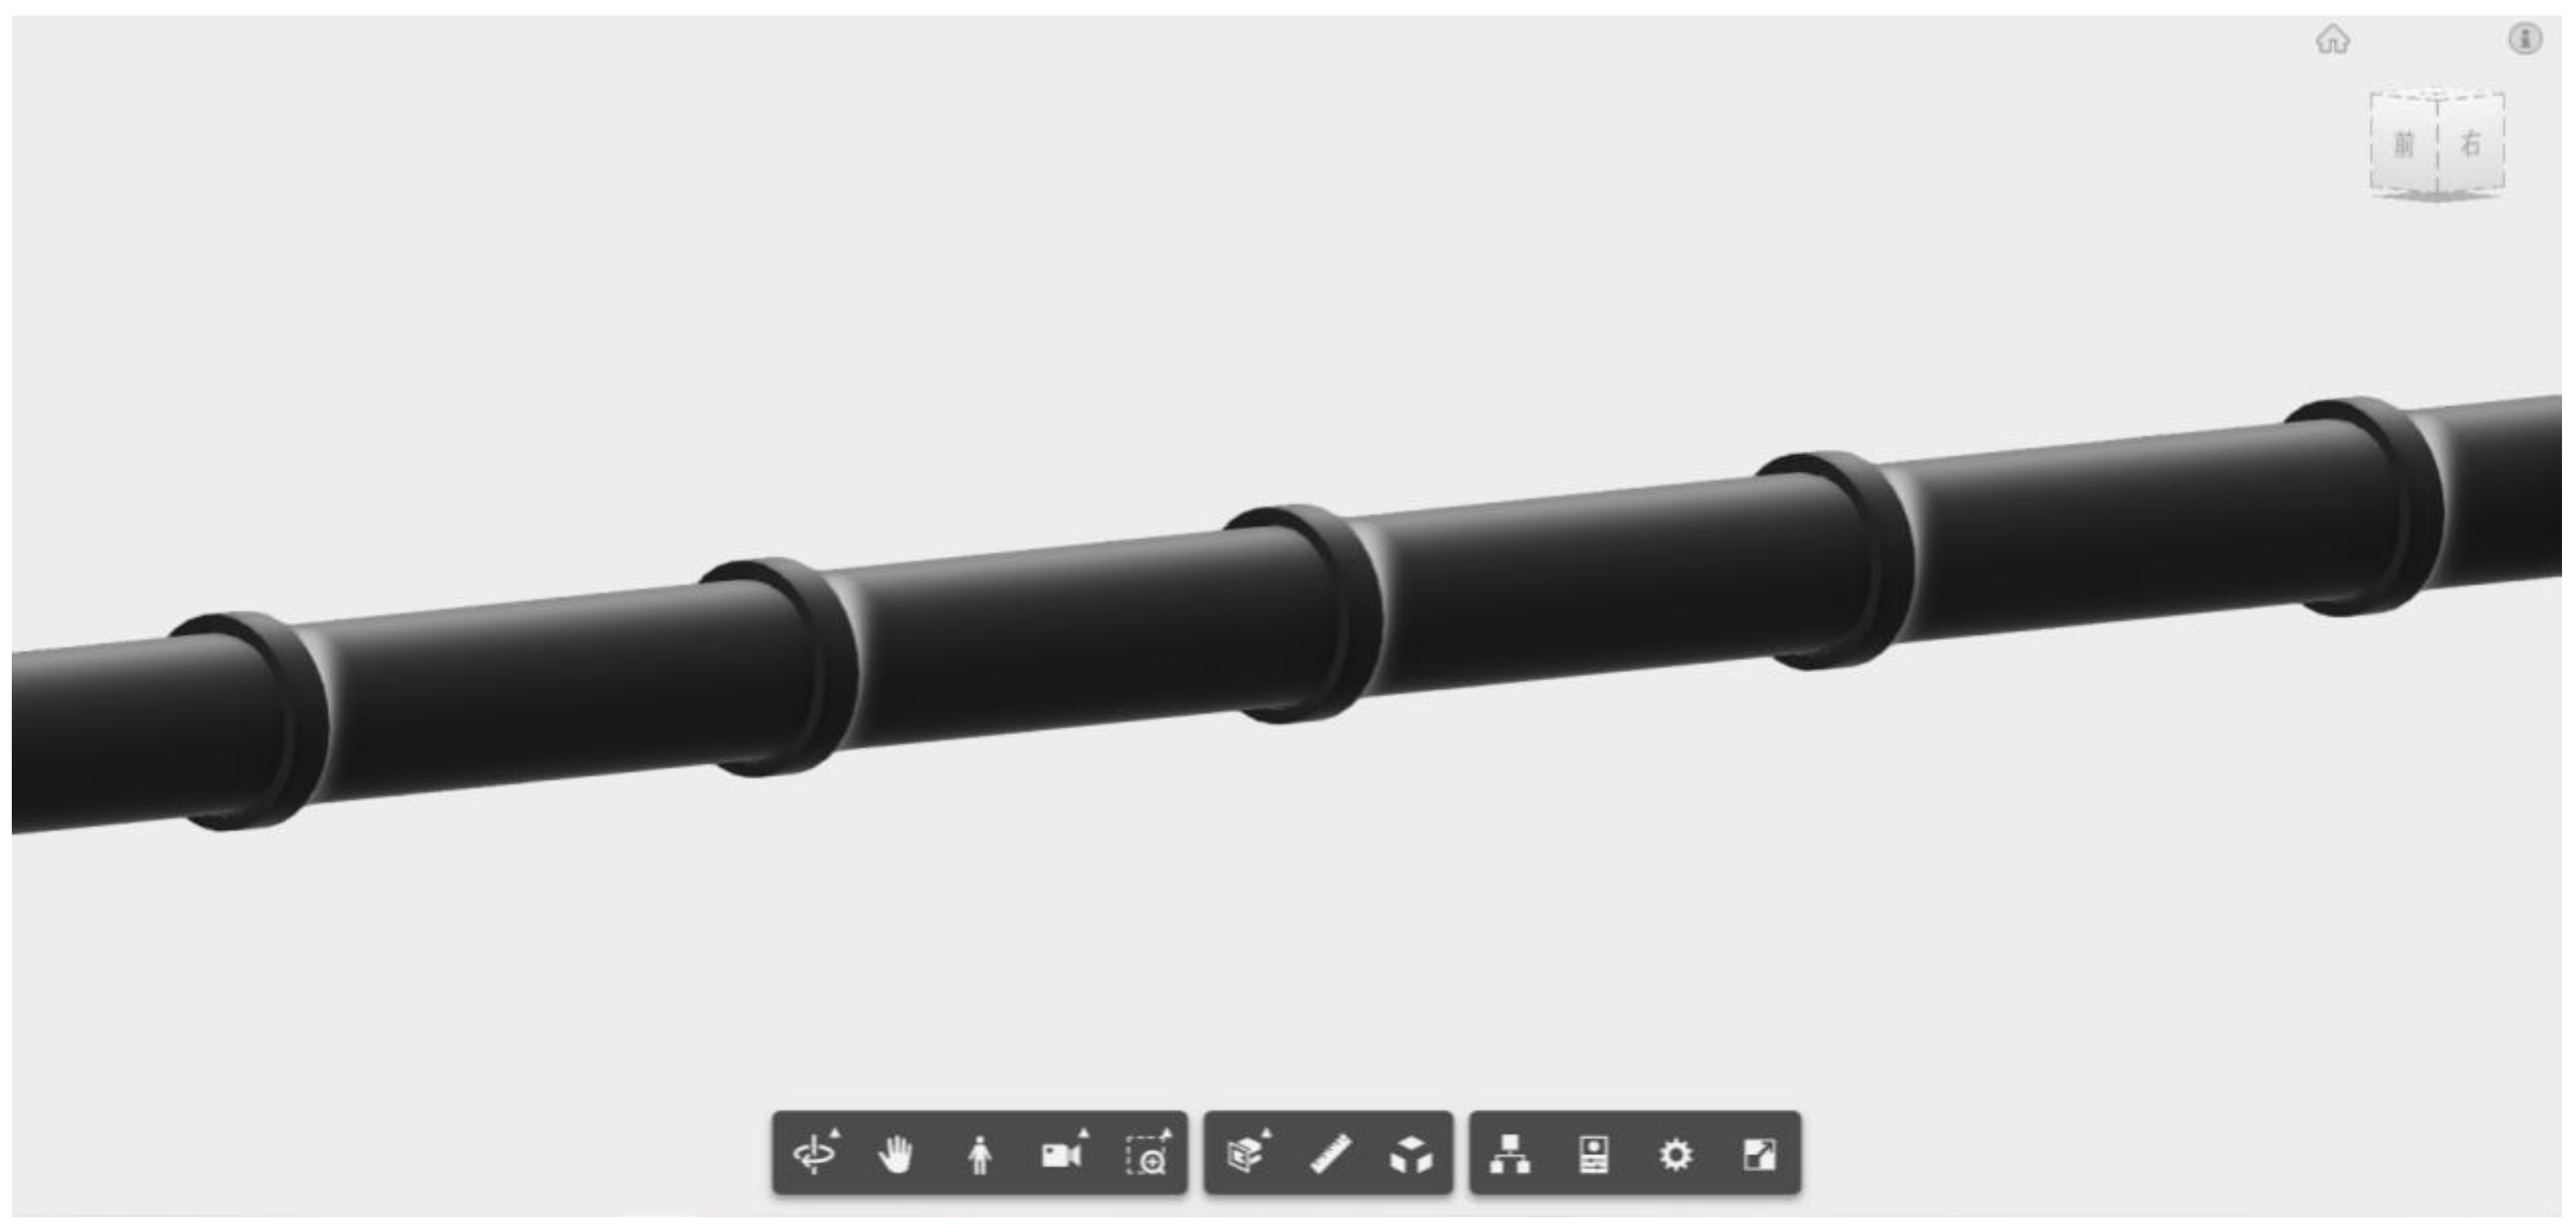
6.2.1. BIM Model Browsing

The model is an essential part of the visualization work. This module mainly includes the pipeline 3D model library. The BIM model can be browsed online on the information platform. On the browser side, you can not only rotate, side cut and zoom in the model at will, but also view various attribute information of the model, Revit secondary development plug-in is selected as the lightweight engine for rapid display of 3D pipeline model in the browser. Figure 13 shows the multidimensional model of the pipeline.

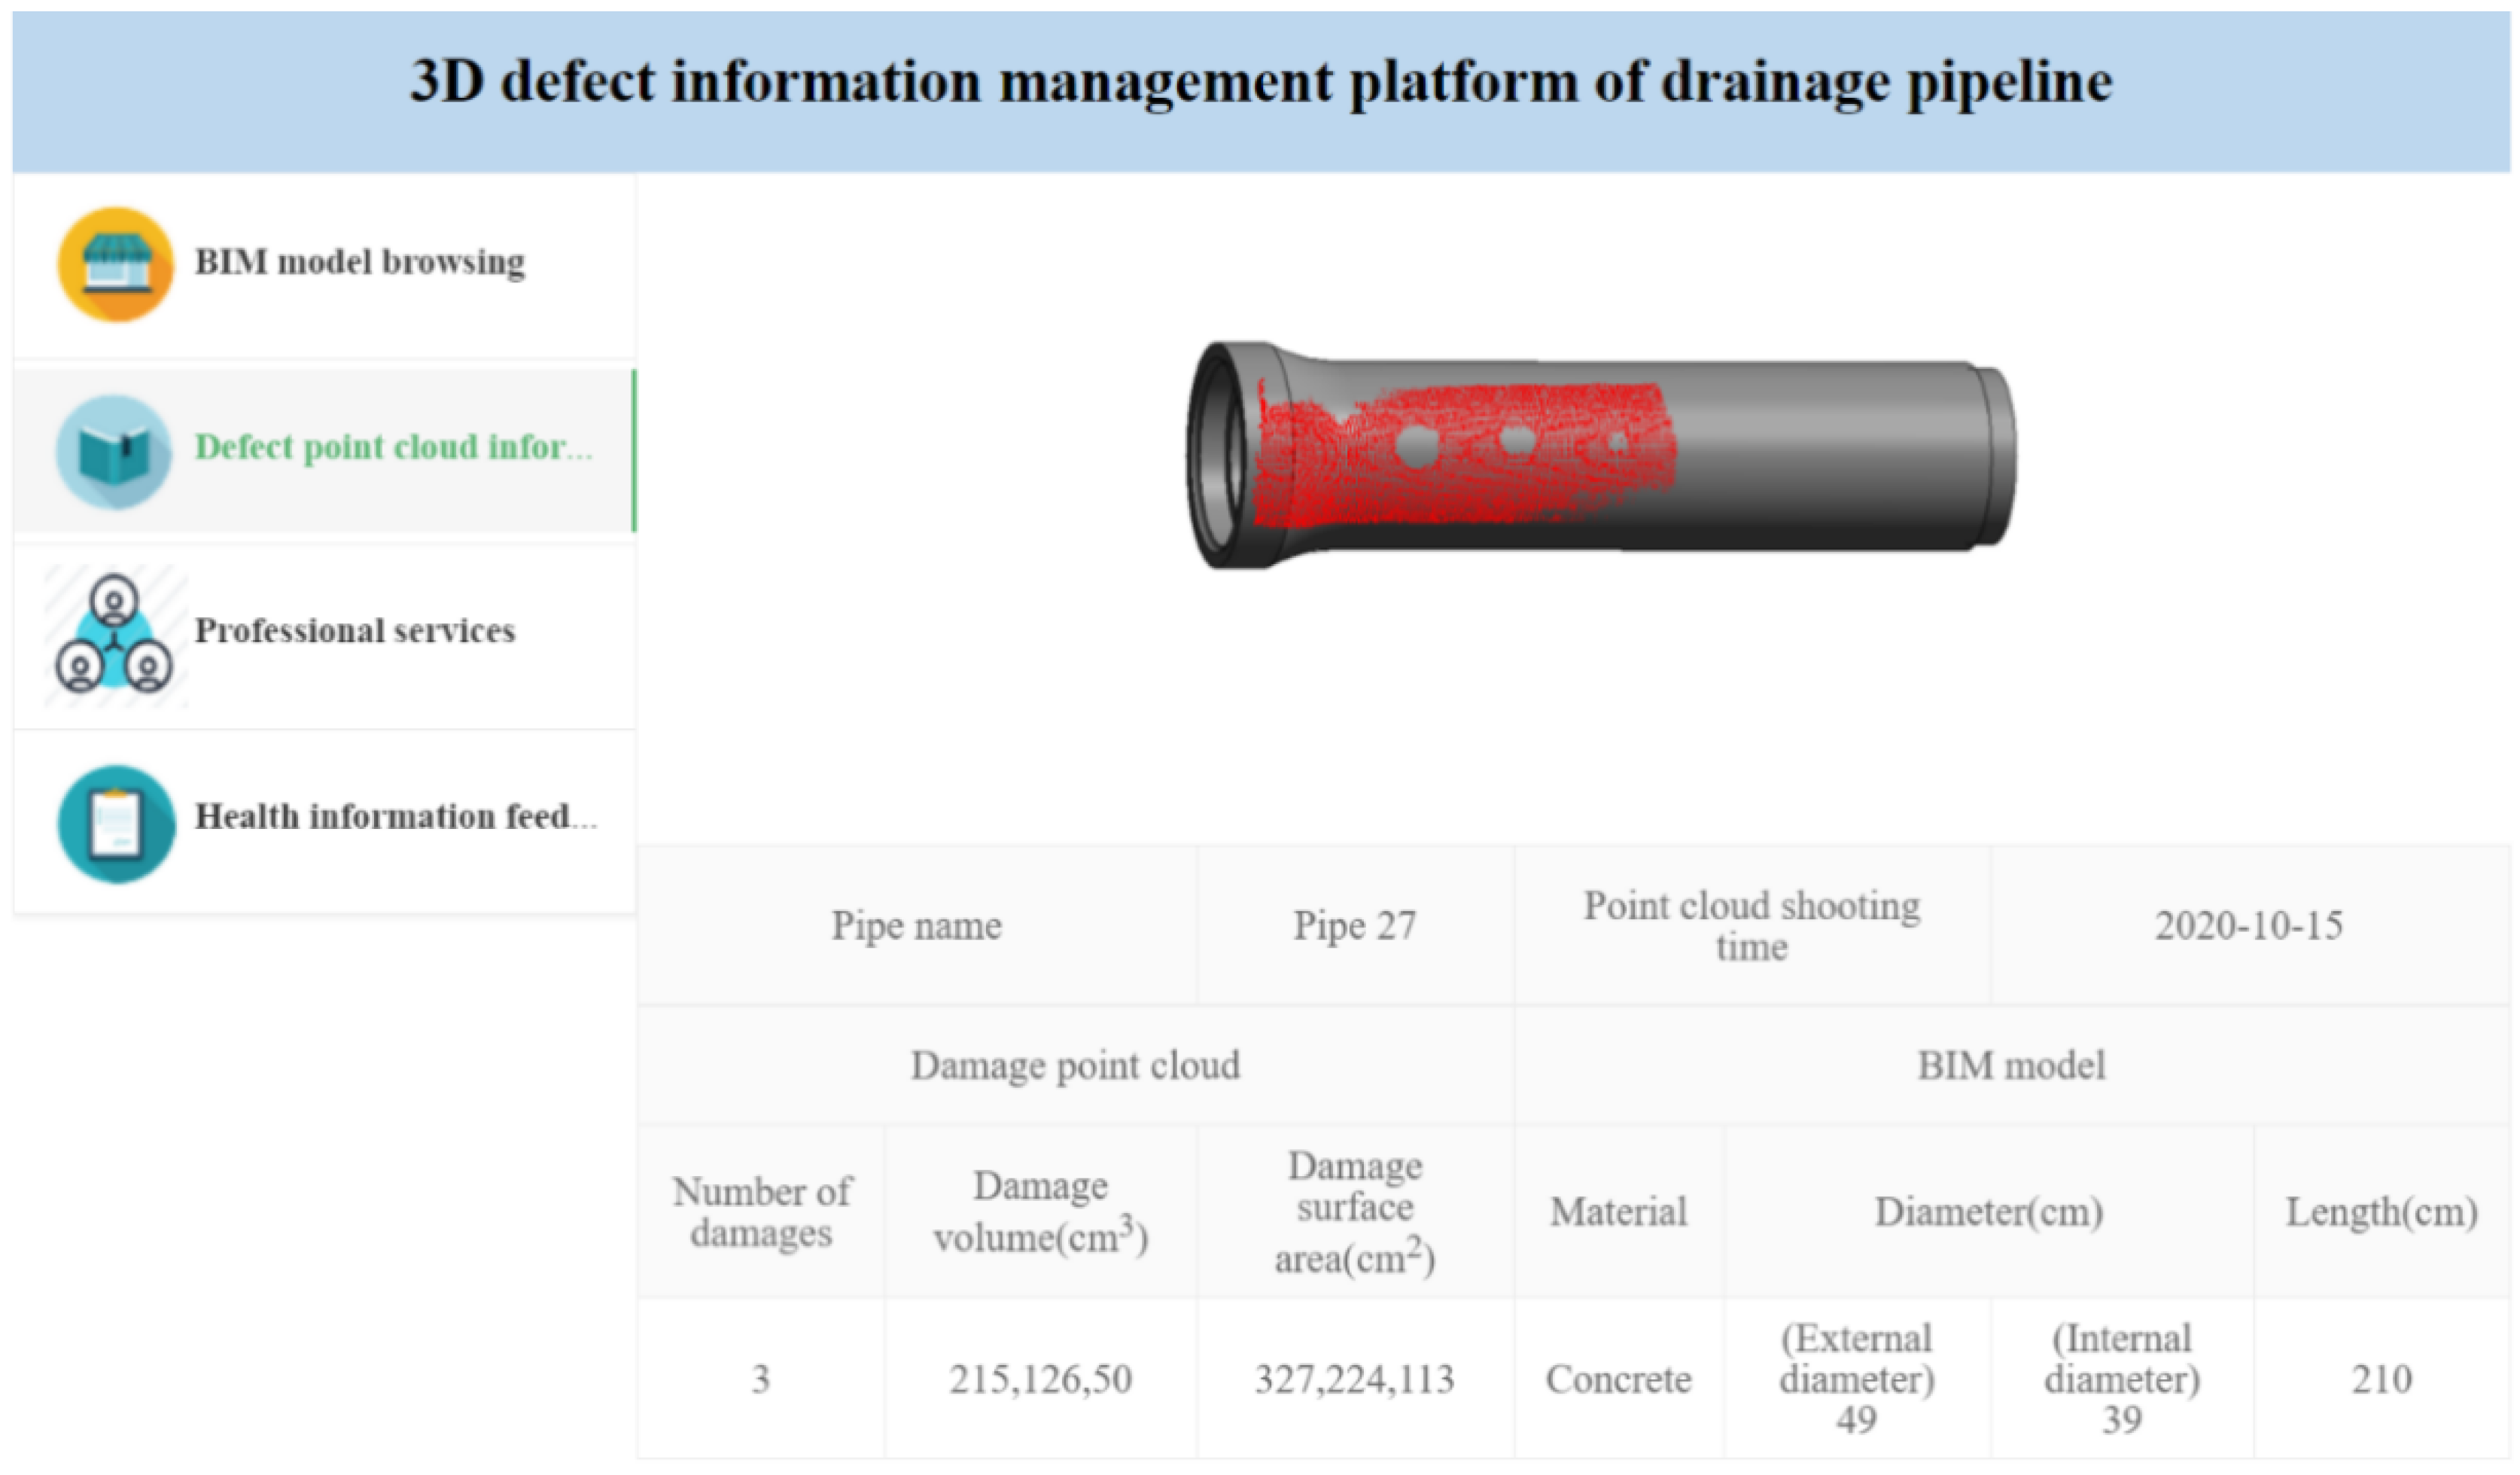
6.2.2. Defect Point Cloud Information

In order to visually display the damage information on the pipeline surface, the pipeline model diagram of integrated point cloud is imported into the platform, and the information of each damage is effectively analyzed (the processing method of defect point cloud on the pipeline surface has been introduced in Section 4 of this paper), and the data is stored in the database and displayed in the browser. As shown in Figure 14, the data in the database are presented in the form of tables, including the number of damages, damage volume and surface area (the volume and surface area of the three damages from left to right in the figure), the shooting time of point cloud, and the material, pipe diameter and pipe length of BIM model. The module centrally manages the three-dimensional defect information, which reduces the trouble of relevant personnel in the query of paper data, so as to be conducive to the later repair of the pipeline by managers to a certain extent.

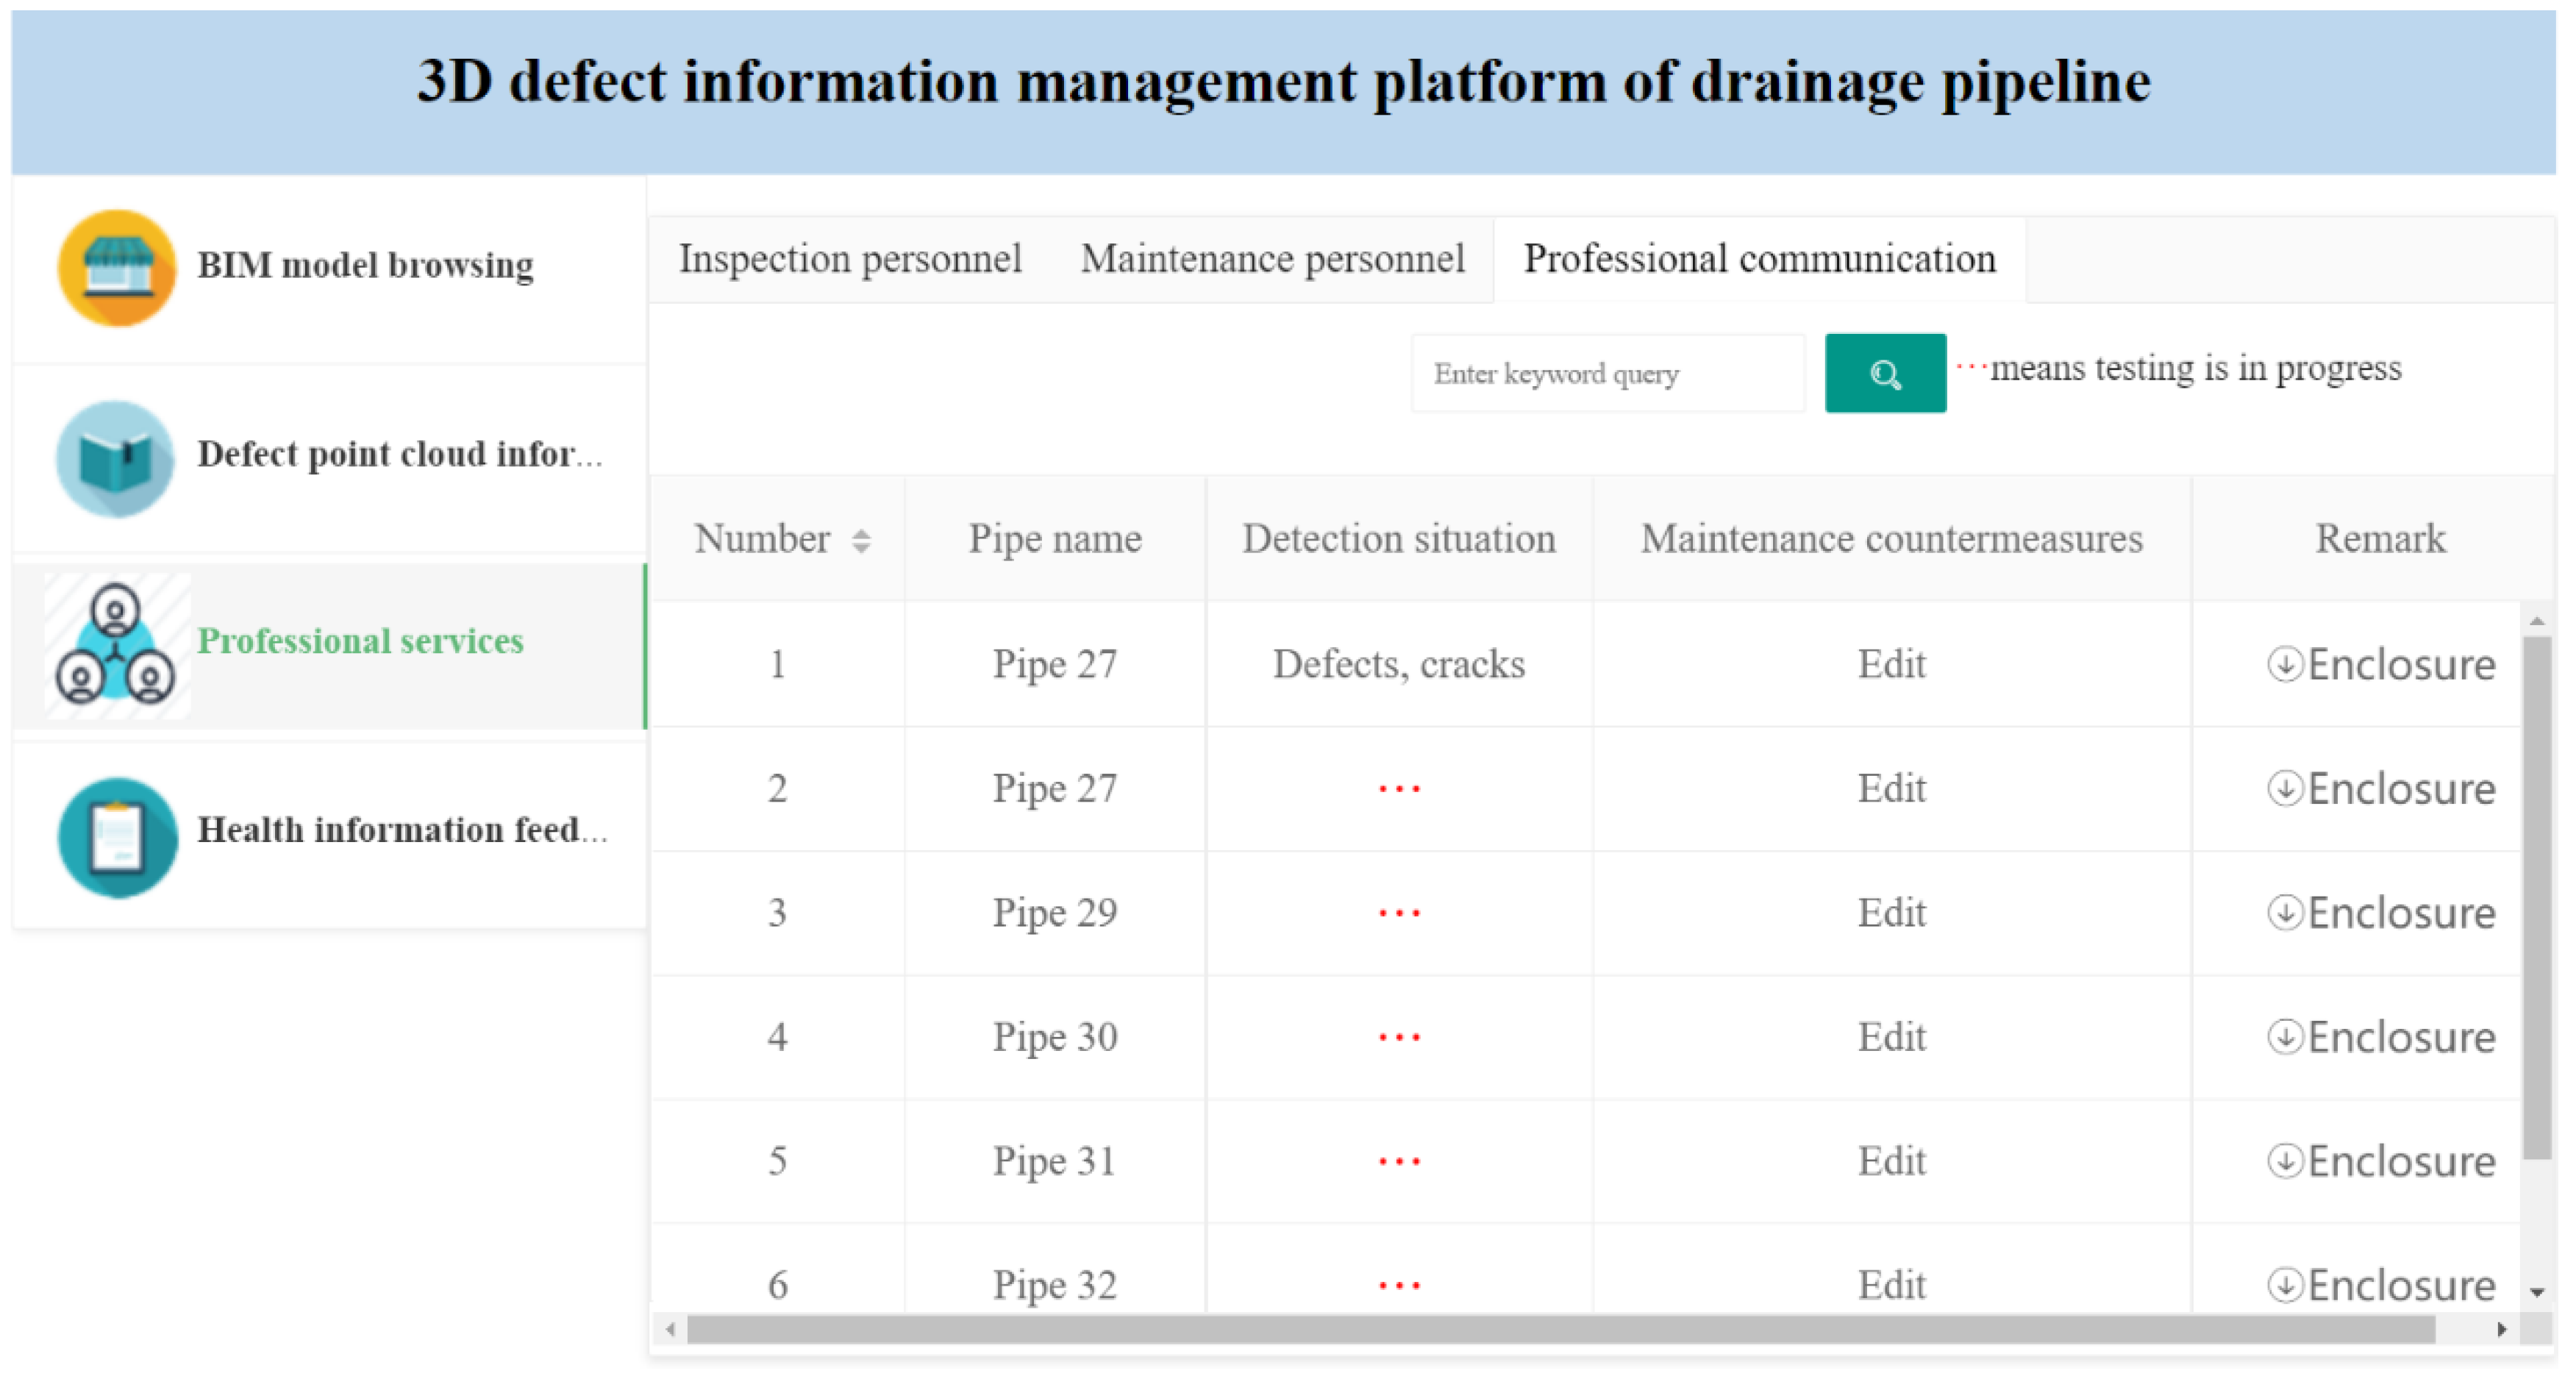
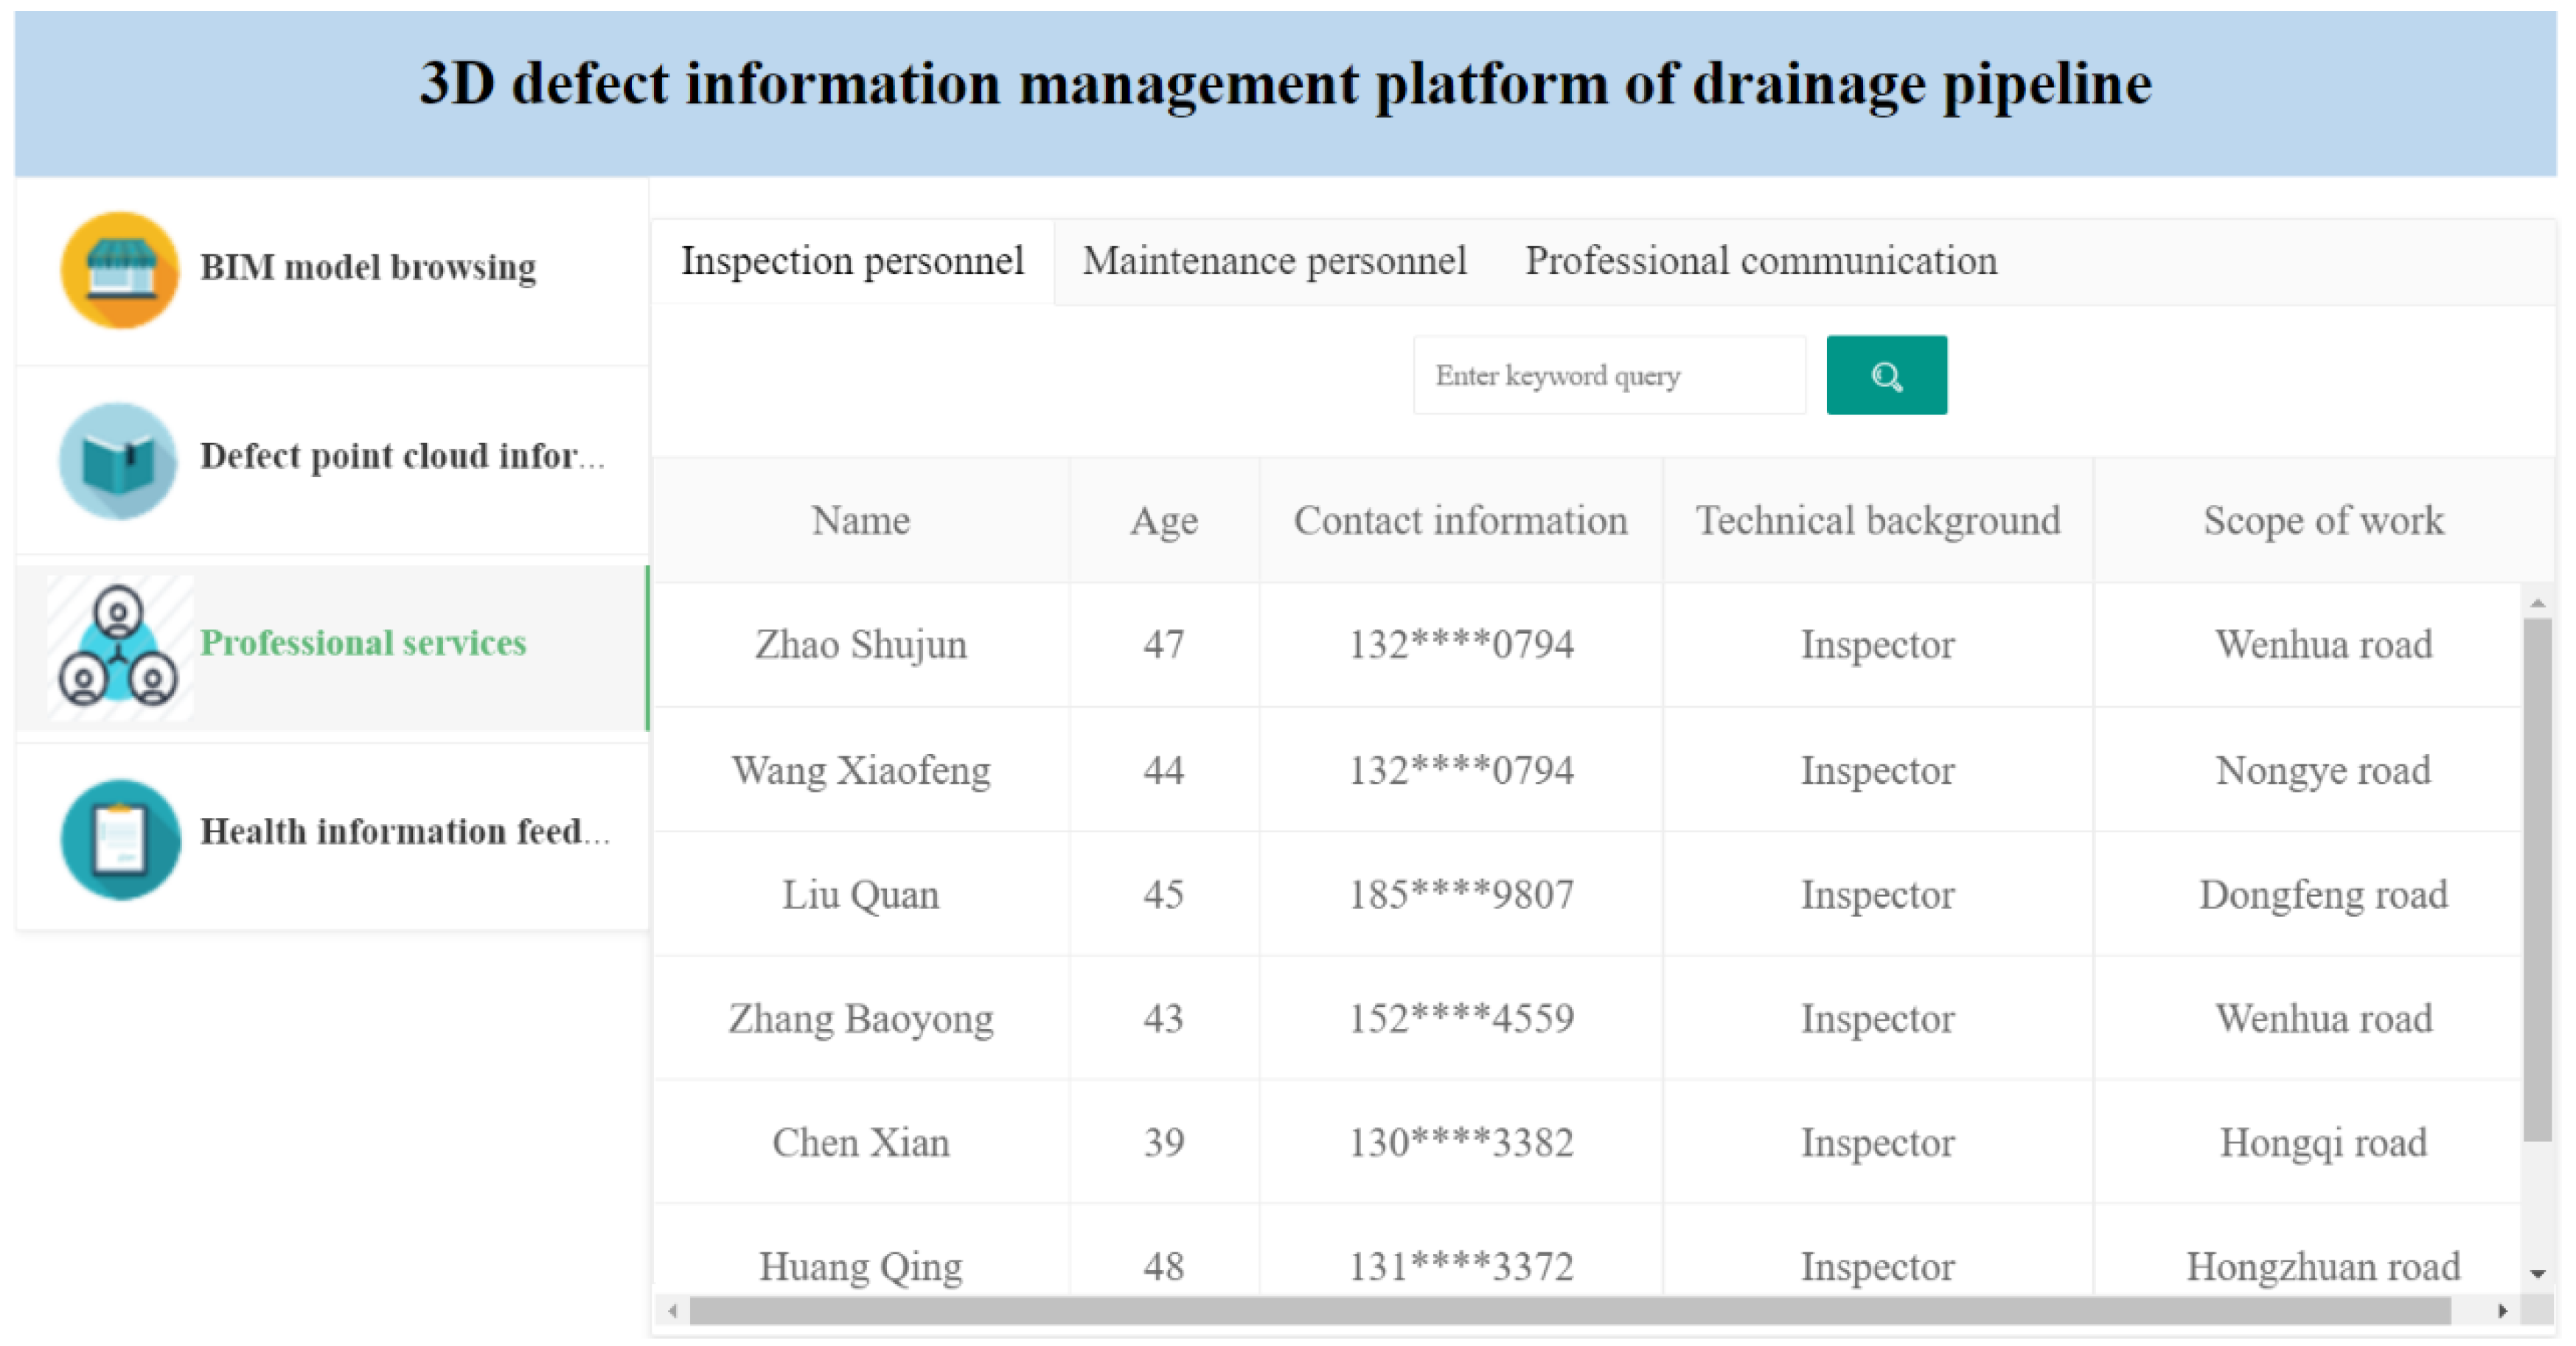
6.2.3. Professional Services

In order to detect the three-dimensional damage and various diseases of the drainage pipes, timely maintenance and ensuring the quality of work, a professional service module is constructed, including three parts of inspection personnel, maintenance personnel and professional communication. The personnel information management part mainly covers their basic personal information (name, contact information, age), technical background, work scope, etc. (Figure 15). By understanding the basic situation of the staff, it is convenient to carry out the corresponding work of the underground drainage pipeline in a specific section, or directly obtain the pipeline information and disease data from the inspectors. On the professional personnel exchange platform, the inspectors upload the final situation to the platform through the inspection of the pipeline. The maintenance personnel can edit and propose solutions according to the inspection results online. They can also upload detailed attachment information for reference, as shown in Figure 16 below.

6.2.4. Health Information Feedback

The health information feedback includes the pipeline health status and health assessment report. The health level of the pipeline is mainly judged by the pipeline inspection results and the standards and specifications proposed by relevant countries such as Denmark. It is divided into three levels according to the pipeline repair index RI, maintenance index MI and the degree of ring damage, and generate the health assessment report of the pipeline at this time, including its disease damage level, overall evaluation of pipeline condition, repair suggestions, maintenance methods and other information.
The information management platform orderly stores the data in the database for storage. Through the establishment of SQL database, the data collected and processed by us are displayed on the browser, the three-dimensional defect information on the pipeline surface is visually displayed, and its later health status is further evaluated, It has certain practical significance for the operation, maintenance, monitoring and maintenance of pipeline life cycle. However, the platform is still in the preliminary stage, and there are still some limitations. As only the external damage of the pipeline was photographed, some defects of the pipeline could be seen and could not make a comprehensive analysis of the pipeline. In the later stage, each module of the platform, especially the health information feedback module, will also be optimized.

7. Conclusions

The structure and function of underground drainage pipeline are the guarantee for the safe operation of the city. However, the concrete peeling off on the pipeline surface often occurs, so it is necessary to calculate the peeling volume to evaluate its damage. In this paper, the point cloud image of the damaged pipeline is obtained through the depth camera, and the data is preprocessed. The defect point cloud mesh of the drainage pipeline is reconstructed and the size of the volume and surface area are calculated. Next, the BIM model of the drainage pipeline is created and the captured point cloud data is imported. Finally, the function of the information management platform of three-dimensional pipeline defects is realized.
The research contributions are as follows: (1) Based on the pipeline surface damage, a method to quantify the volume and surface area of mesh reconstruction of defective point cloud of drainage pipeline is proposed, which is convenient for the later repair of the pipeline. The three-dimensional defect detection of the pipeline is extended to the stage of quantifying its defects, and the method is relatively simple. (2) A drainage pipeline information management platform based on B/S framework, database and three-dimensional model is constructed to intuitively display the pipeline BIM model and its three-dimensional damage information, adding professional service and health information feedback module to carry out later detection, maintenance and evaluation. (3) The integration of drainage pipeline BIM and 3D point cloud defect information is realized, which is of certain significance and value for BIM Technology in the informatization and intelligent management of pipeline 3D defects.
However, some problems are also found in the research process. Due to the incomplete shooting point cloud caused by the use of cheap depth camera and some improper operations in the shooting process, the point cloud could not be completely consistent with the BIM model data of the pipeline. However, these do not have a necessary impact on our research work, and will be further studied and improved in the future. The proposed platform is still in the preliminary exploration stage, and there are still some problems to be solved in practical engineering application. In future research, we will use multiple depth cameras to shoot the whole pipeline, and splice the obtained multiple point clouds with point cloud registration algorithm (ICP algorithm, etc.). Therefore, we can study the entire surface of the underground pipeline. We will further develop the research on the platform.

Author Contributions

Conceptualization, N.W.; methodology, F.H. and N.W.; software, G.P.; validation, F.H. and G.P.; formal analysis, N.W.; investigation, F.H.; resources, H.F.; data curation, F.H.; writing—original draft preparation, F.H.; writing—review and editing, F.H. and H.L.; visualization, F.H.; supervi-sion, N.W.; project administration, H.F.; funding acquisition, H.F. All authors have read and agreed to the published version of the manuscript.

Funding

This research was funded by the National Key Research and Development Program of China (No. 2017YFC1501200) and the National Natural Science Foundation of China (No. 51978630, 52108289). This project was supported by the Outstanding Young Talent Research Fund of Zhengzhou University (1621323001); the Postdoctoral Science Foundation of China (2020M672276, 2021T140620); the Key Scientific Research Projects of Higher Education in Henan Province (21A560013); and the Open Fund of Changjiang Institute of Survey, Planning, Design and Research (CX2020K10).

Institutional Review Board Statement

Not applicable.

Informed Consent Statement

Not applicable.

Data Availability Statement

All data that support the findings of this study are available from the corresponding author upon reasonable request.

Acknowledgments

This research was funded by the National Key Research and Development Program of China (No. 2017YFC1501200), the National Natural Science Foundation of China (No. 51978630, 52108289). This project was supported by the Outstanding Young Talent Research Fund of Zhengzhou University (1621323001), the Postdoctoral Science Foundation of China (2020M672276, 2021T140620), the Key Scientific Research Projects of Higher Education in Henan Province (21A560013), the Open Fund of Changjiang Institute of Survey, Planning, Design and Research (CX2020K10). The authors would like to thank for these financial supports.

Conflicts of Interest

The authors declare no conflict of interest.

Appendix A

Table A1. The forms submitted to the database.
Model data
Pipe name
Model link
Damage data
Pipe name Point cloud shooting time
Material Number of damages
Damage volume Diameter
Model link
Professional communication
Pipe name
Detection situation
Maintenance countermeasures
Inspection personnel
Name
Age
Contact information
Technical background
Scope of work
Maintenance personnel
Name
Age
Contact information
Technical background
Scope of work
Health status
Pipe name
Health level
Service life

References

  1. Liu, Q. Application and Development of Detection Technology for Urban Drainage Pipeline. Urban. Archit. 2019, 16, 148–149. [Google Scholar]
  2. Wang, X. Analysis on defect detection methods and development status of urban drainage pipeline. Railw. Constr. Technol. 2020, 58, 50–53. [Google Scholar]
  3. Wang, J.; Deng, Y.; Li, Y.; Zhang, X. Overview of drainage pipeline detection and defect identification technology. Sci. Technol. Eng. 2020, 20, 13520–13528. [Google Scholar]
  4. Li, H.-J. The Application of Pipeline CCTV Detection Technology in Urban Drainage Project. Manag. Technol. SME 2018, 6, 170–171. [Google Scholar]
  5. Li, W.-H. Development and Application of Urban Drainage Pipeline Inspection Technology. Guangzhou Archit. 2009, 37, 33–37. [Google Scholar]
  6. Peng, Z. Application of CCTV inspection technology in public drainage pipeline. Superv. Test Cost Constr. 2009, 2, 28–33. [Google Scholar]
  7. Ma, D.; Liu, J.; Fang, H.; Wang, N.; Zhang, C.; Li, Z.; Dong, J. A Multi-defect detection system for sewer pipelines based on StyleGAN-SDM and fusion CNN. Constr. Build. Mater. 2021, 312, 125385. [Google Scholar] [CrossRef]
  8. Wang, N.; Zhao, X.; Zou, Z.; Zhao, P.; Qi, F. Autonomous damage segmentation and measurement of glazed tiles in historic buildings via deep learning. Comput.-Aided Civ. Infrastruct. Eng. 2020, 35, 277–291. [Google Scholar] [CrossRef]
  9. Wang, M.; Wang, C.C.; Zlatanova, S.; Sepasgozar, S.; Aleksandrov, M. Onsite Quality Check for Installation of Prefabricated Wall Panels Using Laser Scanning. Buildings 2021, 11, 412. [Google Scholar] [CrossRef]
  10. Nowak, R.; Orłowicz, R.; Rutkowski, R. Use of TLS (LiDAR) for building diagnostics with the example of a historic building in Karlino. Buildings 2020, 10, 24. [Google Scholar] [CrossRef] [Green Version]
  11. Zheng, J.; Guan, H.; Yi, W.; Sun, M. 3D Reconstruction of Small-sized Cultural Relics Based on Laser Scanning and Close-range Photogrammetry. Int. J. Digit. Content Technol. Its Appl. 2012, 6, 196–205. [Google Scholar]
  12. Ren, Z.Y. A Study on 3D Reconstruction of Building Structure. Tech. Autom. Appl. 2019, 38, 117–123. [Google Scholar]
  13. Andrikos, I.O.; Sakellarios, A.I.; Siogkas, P.K.; Tsompou, P.I.; Kigka, V.I.; Michalis, L.K.; Fotiadis, D.I. A Novel Method for 3D Reconstruction of Coronary Bifurcation Using Quantitative Coronary Angiography; Springer: Berlin/Heidelberg, Germany, 2019. [Google Scholar]
  14. Beckman, G.H.; Polyzois, D.; Cha, Y.J. Deep learning-based automatic volumetric damage quantification using depth camera. Autom. Constr. 2019, 99, 114–124. [Google Scholar] [CrossRef]
  15. Liu, C.; Zhou, L.; Wang, W.; Zhao, X. Concrete Surface Damage Volume Measurement based on Three-dimensional Reconstruction by Smartphones. IEEE Sens. J. 2021, 21, 11349–11360. [Google Scholar] [CrossRef]
  16. Jahanshahi, M.R.; Jazizadeh, F.; Masri, S.F.; Becerik-Gerber, B. Unsupervised approach for autonomous pavement-defect detection and quantification using an inexpensive depth sensor. J. Comput. Civ. Eng. 2013, 27, 743–754. [Google Scholar] [CrossRef]
  17. Asadi, P.; Mehrabi, H.; Asadi, A.; Ahmadi, M. Deep Convolutional Neural Networks for Pavement Crack Detection Using an Inexpensive Global Shutter RGB-D Sensor and ARM-Based Single Board Computer. Transp. Res. Rec. J. Transp. Res. Board 2021, 2675, 885–897. [Google Scholar] [CrossRef]
  18. Moazzam, I.; Kamal, K.; Mathavan, S.; Usman, S.; Rahman, M. Metrology and visualization of potholes using the microsoft kinect sensor. In Proceedings of the 16th International IEEE Conference on Intelligent Transportation Systems, The Hague, The Netherlands, 6–9 October 2013. [Google Scholar]
  19. Turkan, Y.; Hong, J.; Laflamme, S.; Puri, N. Adaptive wavelet neural network for terrestrial laser scanner-based crack detection. Autom. Constr. 2018, 94, 191–202. [Google Scholar] [CrossRef] [Green Version]
  20. Chen, L.; Shi, P.; Tang, Q.; Liu, W.; Wu, Q. Development and application of a specification-compliant highway tunnel facility management system based on BIM. Tunn. Undergr. Space Technol. 2020, 97, 103262. [Google Scholar] [CrossRef]
  21. Qian, Z.; Li, Y.; Chen, Y. Research on Bridge Deck Health Assessment System Based on BIM and Computer Vision Technology. J. Phys. Conf. Ser. 2021, 1802, 042047. [Google Scholar] [CrossRef]
  22. Lai, H.; Deng, X.; Chang, T. BIM-Based Platform for Collaborative Building Design and Project Management. J. Comput. Civ. Eng. 2019, 33, 05019001. [Google Scholar] [CrossRef]
  23. Chen, J.; Guo, X.; Rao, H.; Wu, F. Application of 3DVisualization of Underground Pipeline Based on BIM Technology. Chin. J. Eng. Geophys. 2018, 15, 65–72. [Google Scholar]
  24. Xu, W.; Zhou, Y. Application of BIM + GIS Used in Information Management of Underground Pipeline Network in University Campus. Constr. Technol. 2017, 6, 58–60. [Google Scholar]
  25. Liang, Z. Integrated Application of BIM and Robot Total Station in the Construction of Underground Pipelines. Constr. Technol. 2016, 45, 27–31. [Google Scholar]
  26. Guo, H.; Guo, F.; Tian, G. Research on application path of building information modeling (BIM) technology in construction of visualization of urban pipe gallery. Revista de la Facultad de Ingenieria 2017, 32, 631–637. [Google Scholar]
  27. Ding, L.; Zhou, D.; Wang, C.; Zui, W. Development and application of pipeline information management platform based on BIM technology. Cryog. Constr. Technol. 2021, 43, 120–123. [Google Scholar]
  28. Lee, G.C.; Yoo, J. Real-time Virtual-viewpoint Image Synthesis Algorithm Using Kinect Camera. J. Electr. Eng. Technol. 2014, 38, 1016–1022. [Google Scholar] [CrossRef] [Green Version]
  29. Zhu, G.; Minl, Y.E. Research on the method of point cloud denoising based on curvature characteristics and quantitative evaluation. Bull. Surv. Mapp. 2019, 65, 105–108. [Google Scholar]
  30. Luo, N.; Jiang, Y.; Wang, Q. Supervoxel Based Region Growing Segmentation for Point Cloud Data. Int. J. Pattern Recognit. Artif. Intell. 2020, 35, 2154007. [Google Scholar] [CrossRef]
  31. Zhang, J.; Zhao, X.; Chen, Z.; Lu, Z. A Review of Deep Learning-Based Semantic Segmentation for Point Cloud. IEEE Access 2019, 7, 179118–179133. [Google Scholar] [CrossRef]
  32. Li, L.; Qian, B.; Lian, J.; Zheng, W.; Zhou, Y. Traffic Scene Segmentation Based on RGB-D Image and Deep Learning. IEEE Trans. Intell. Transp. Syst. 2017, 19, 1664–1669. [Google Scholar] [CrossRef]
  33. Chetverikov, D.; Stepanov, D.; Krsek, P. Robust Euclidean alignment of 3D point sets: The trimmed iterative closest point algorithm. Image Vis. Comput. 2005, 23, 299–309. [Google Scholar] [CrossRef]
  34. Tian, Y.; Zhou, X.; Wang, X.; Wang, Z.; Yao, H. Registration and occlusion handling based on the FAST ICP-ORB method for augmented reality systems. Multimed. Tools Appl. 2021, 80, 21041–21058. [Google Scholar] [CrossRef]
  35. Jiang, Y.; Liu, X.; Liu, F.; Wu, D.; Anumba, C.J. An analysis of BIM web service requirements and design to support energy efficient building lifecycle. Buildings 2016, 6, 20. [Google Scholar] [CrossRef] [Green Version]
  36. Fargnoli, M.; Lombardi, M. Building information modelling (BIM) to enhance occupational safety in construction activities: Research trends emerging from one decade of studies. Buildings 2020, 10, 98. [Google Scholar] [CrossRef]
  37. Fargnoli, M.; Lleshaj, A.; Lombardi, M.; Sciarretta, N.; Gravio, G.D. A BIM-based PSS approach for the management of maintenance operations of building equipment. Buildings 2019, 9, 139. [Google Scholar] [CrossRef] [Green Version]
  38. Wang, N.; Zhao, X.; Wang, L.; Zou, Z. Novel system for rapid investigation and damage detection in cultural heritage conservation based on deep learning. J. Infrastruct. Syst. 2019, 25, 04019020. [Google Scholar] [CrossRef]
  39. Arévalo, J.G.; Viecco, L.; Arévalo, L. Methodology to define an integration process between frameworks SCRUM, Django REST framework y Vue.js, implemented for software development, from quality management approach and agility. IOP Conf. Ser. Mater. Sci. Eng. 2020, 844, 012022. [Google Scholar] [CrossRef]
  40. Cao, T.; Zhou, Y.; Zhang, Q.; Liu, L. Dimension change of Jeltrate alginate impression at various pouring time points. Stomatology 2013, 33, 165–167. [Google Scholar]
  41. Babic, S.; Kerr, A.T.; Westerland, M.; Gooding, J.; Schreiner, L.J. Examination of Jeltrate® Plus as a tissue equivalent bolus material. J. Appl. Clin. Med. Phys. 2002, 3, 170–175. [Google Scholar] [CrossRef]
Figure 1. The research framework.
Buildings 12 00228 g001
Figure 2. Development method.
Buildings 12 00228 g002
Figure 3. Functional architecture.
Buildings 12 00228 g003
Figure 4. Overall framework.
Buildings 12 00228 g004
Figure 5. Test shooting.
Buildings 12 00228 g005
Figure 6. Obtained point cloud.
Buildings 12 00228 g006
Figure 7. Point cloud model of pipeline.
Buildings 12 00228 g007
Figure 8. Point cloud models of pipeline damage.
Buildings 12 00228 g008
Figure 9. Damages on pipeline.
Buildings 12 00228 g009
Figure 10. 3D point cloud mesh reconstruction: (a) real defects, (b) closed point cloud model, and (c) mesh model of defects.
Buildings 12 00228 g010
Figure 11. BIM model of pipeline.
Buildings 12 00228 g011
Figure 12. BIM model combined with point cloud data.
Buildings 12 00228 g012
Figure 13. Browsing of 3D model of pipeline.
Buildings 12 00228 g013
Figure 14. Defect point cloud information.
Buildings 12 00228 g014
Figure 15. Inspection personnel.
Buildings 12 00228 g015
Figure 16. Professional communication.
Buildings 12 00228 g016
Table 1. Parameters of azure Kinect DK depth camera.
Azure Kinect DK Depth Camera
RGB camera resolution2560 × 1540
Depth camera resolution640 × 576
Frame rate0, 5, 15, 30
Detection distance range0.5–3.86 m
Measuring angle range65° × 75°
Table 2. Real volume of damage.
Damage123
Volume (cm3)50.5125.3213.6
50.2126.9214.5
50.1125.8215.3
Average volume (cm3)50.3126.0214.5
Table 3. Damage volume: the test bench distance is 100–200 cm.
Distance (cm)100125150175200
1Real volume (cm3)50.3
Calc. volume (cm3)48.748.947.546.547.4
Error (%)3.182.785.577.555.77
2Real volume (cm3)126.0
Calc.volume (cm3)115.5129.4103.9123.5110.6
Error (%)8.732.7017.541.9812.22
3Real volume (cm3)214.5
Calc. volume (cm3)198.8199.5228.3183.3187.2
Error (%)7.326.996.4314.5512.73
Average error (%)6.414.169.858.0310.24
Table 4. Damage surface area: the test bench distance is 100–200 cm.
Distance (cm)100125150175200
1Surface area (cm2)104.23103.63128.08108.16121.58
Average area (cm2)113.14
2Surface area (cm2)217.86230.51221.79226.87223.03
Average area (cm2)224.01
3Surface area (cm2)322.92333.70348.85309.73317.54
Average area (cm2)326.55
Publisher’s Note: MDPI stays neutral with regard to jurisdictional claims in published maps and institutional affiliations.

