
Modelling the Strength and Fracture Parameters of Dam Gallery Concrete Considering Ambient Temperature and Humidity

 ,
, 
Abstract
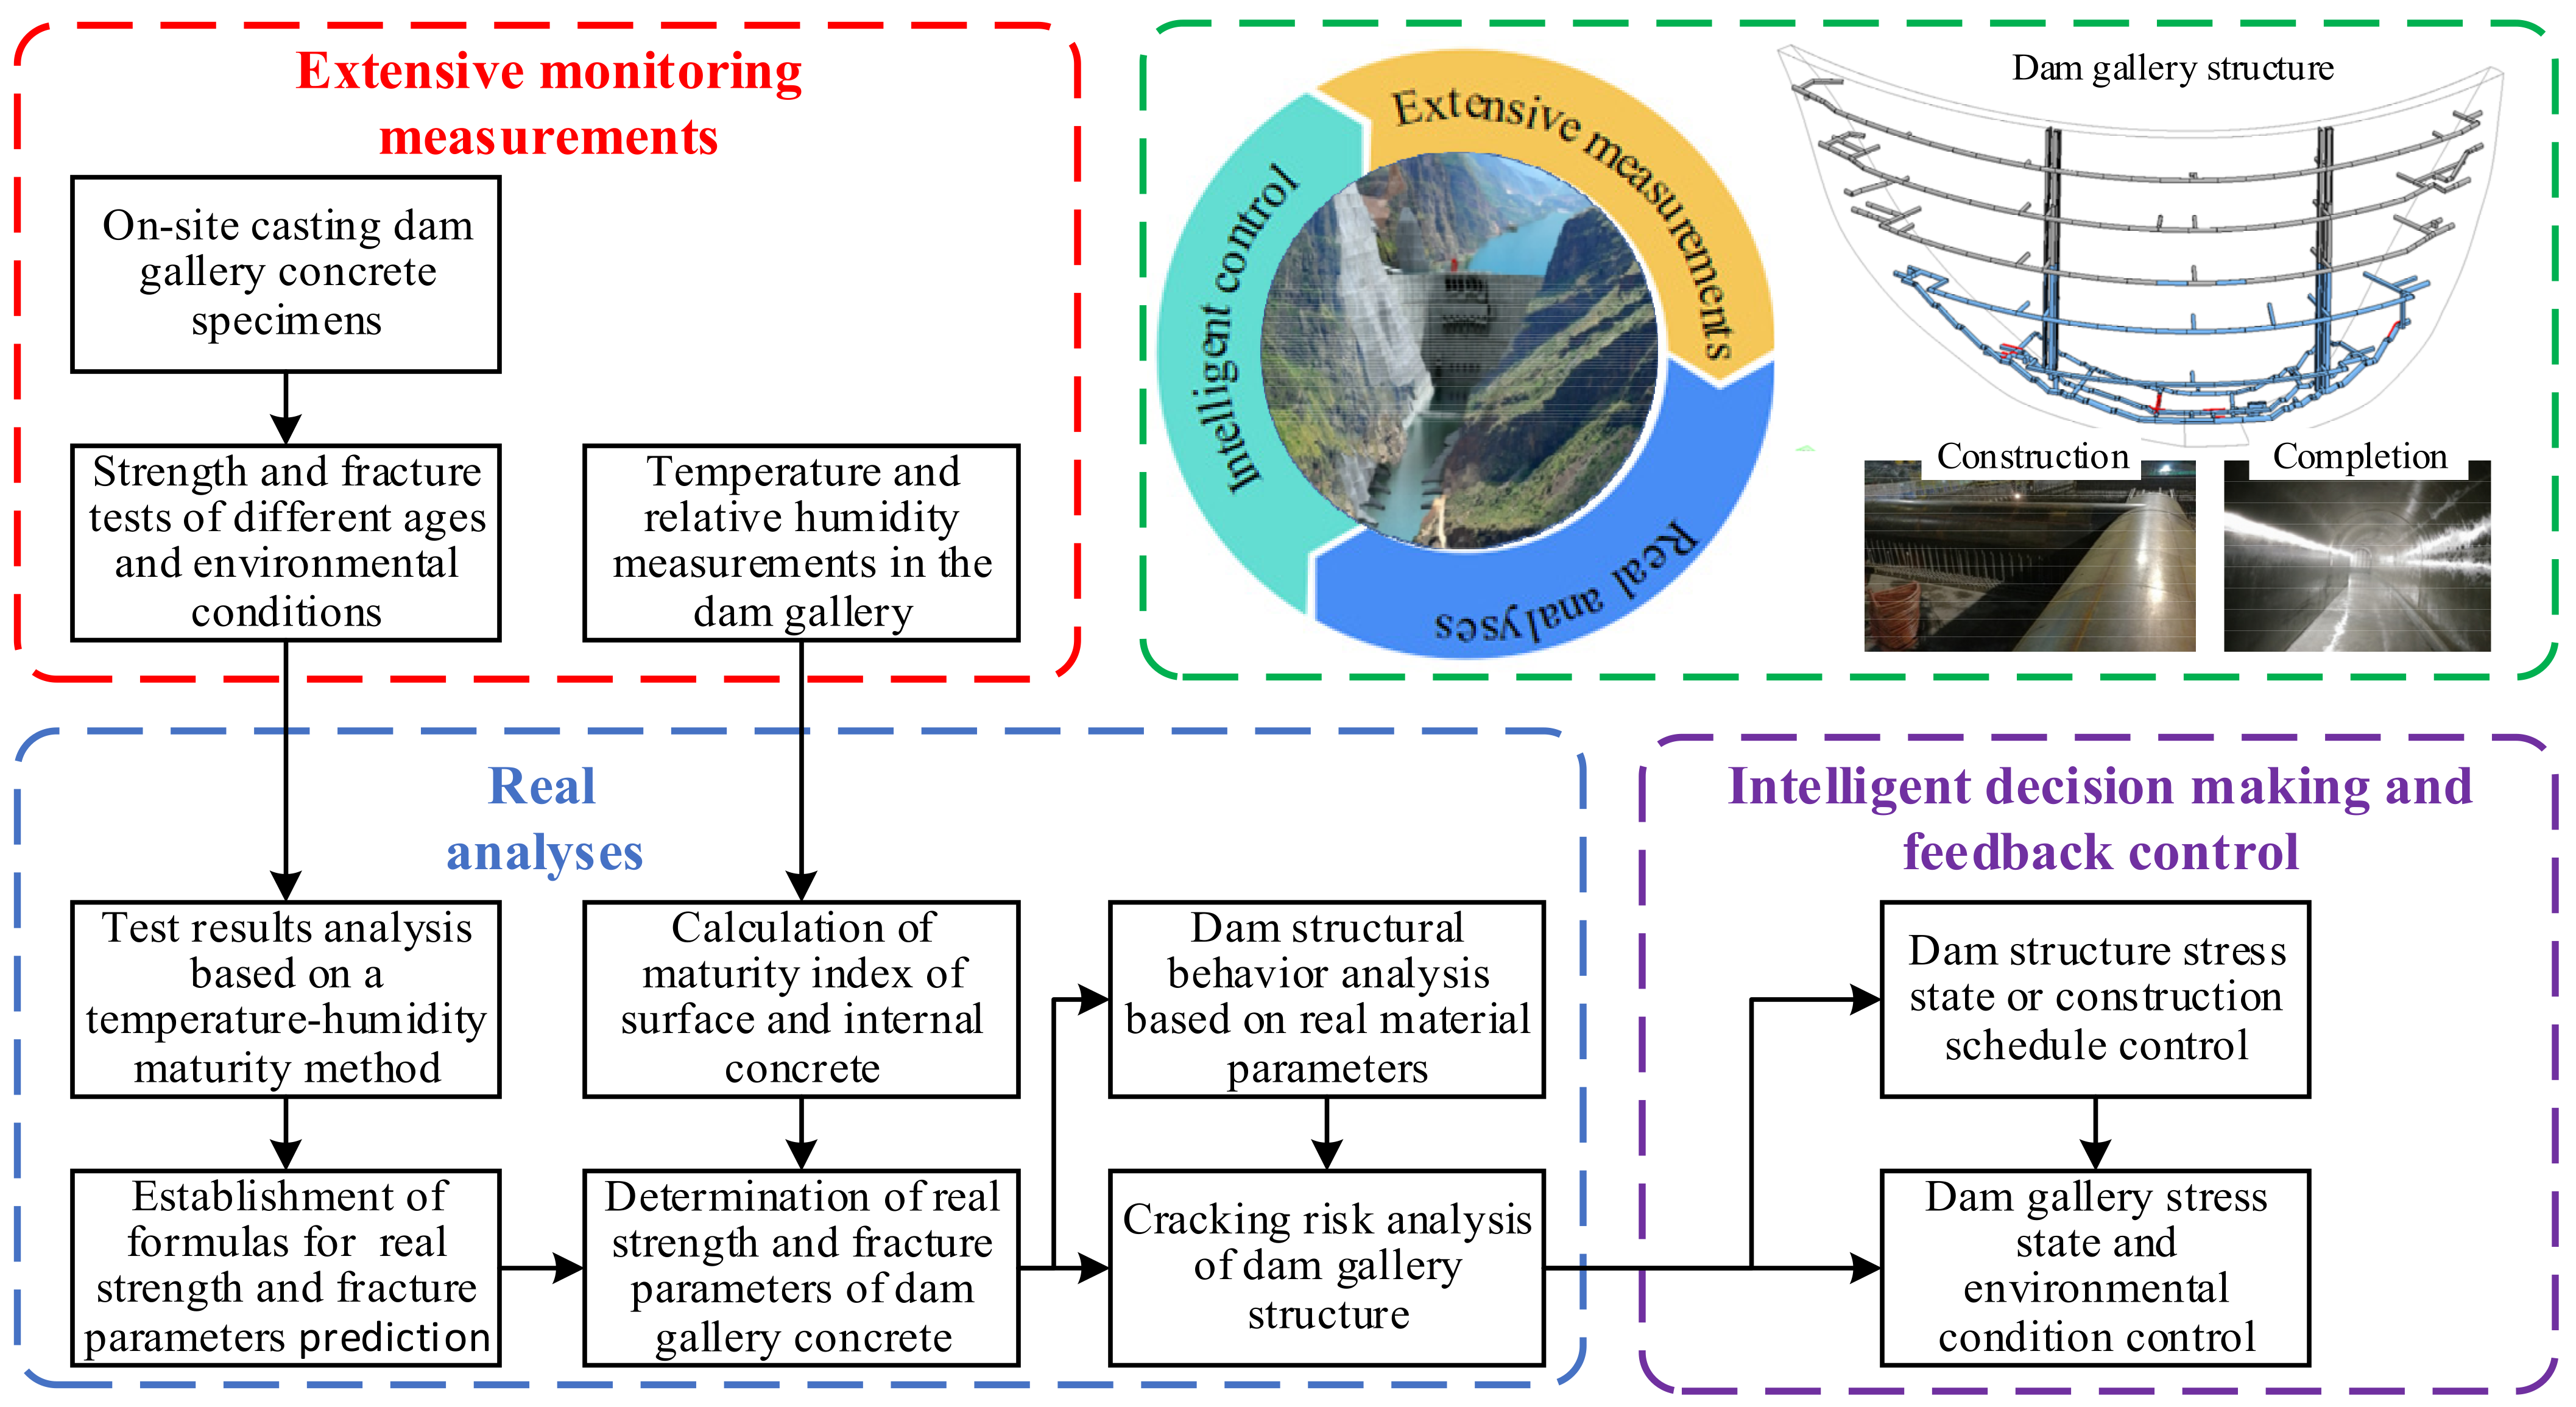
:1. Introduction
2. Materials and Methods
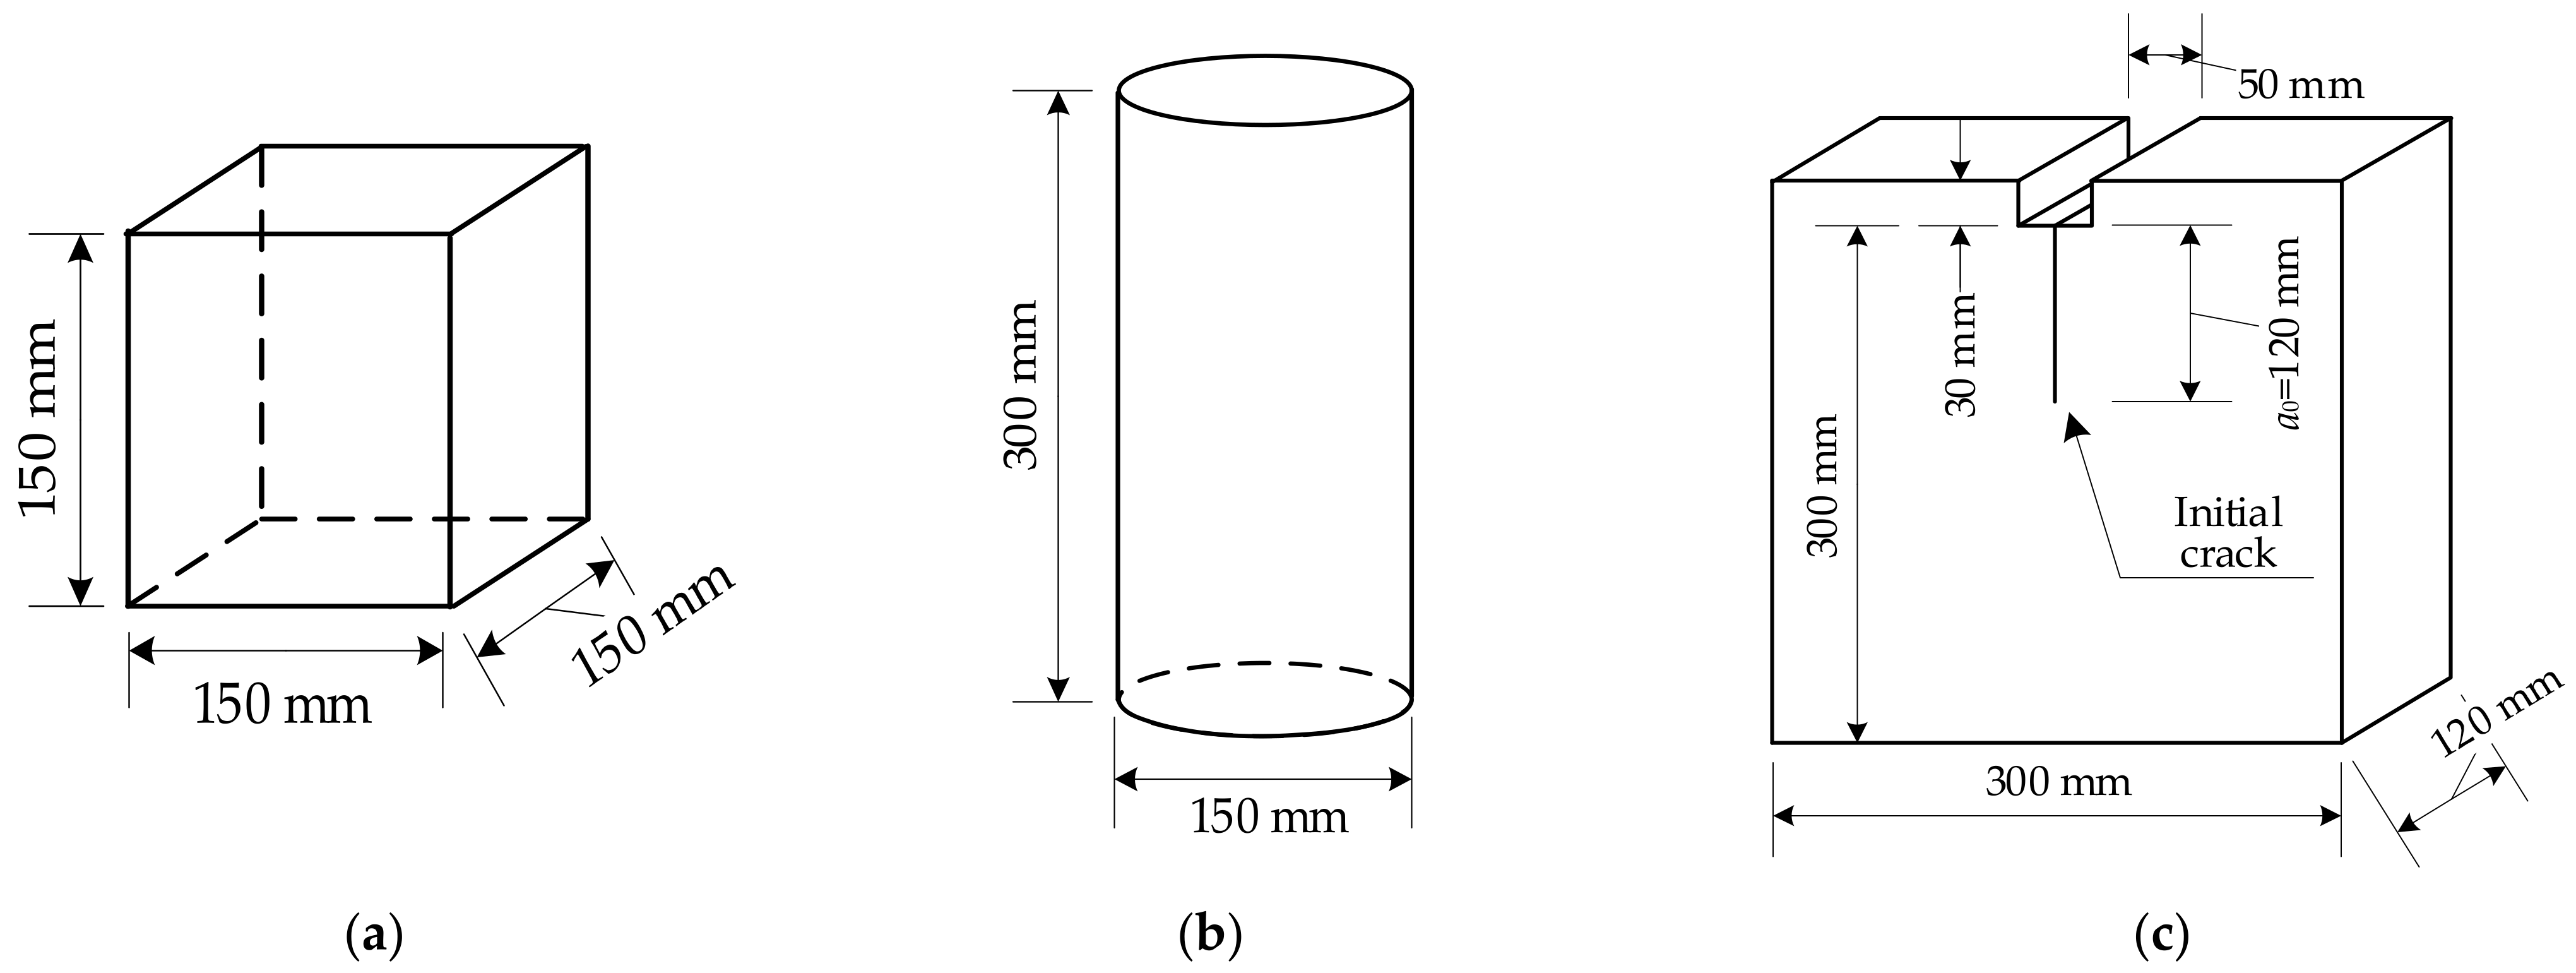
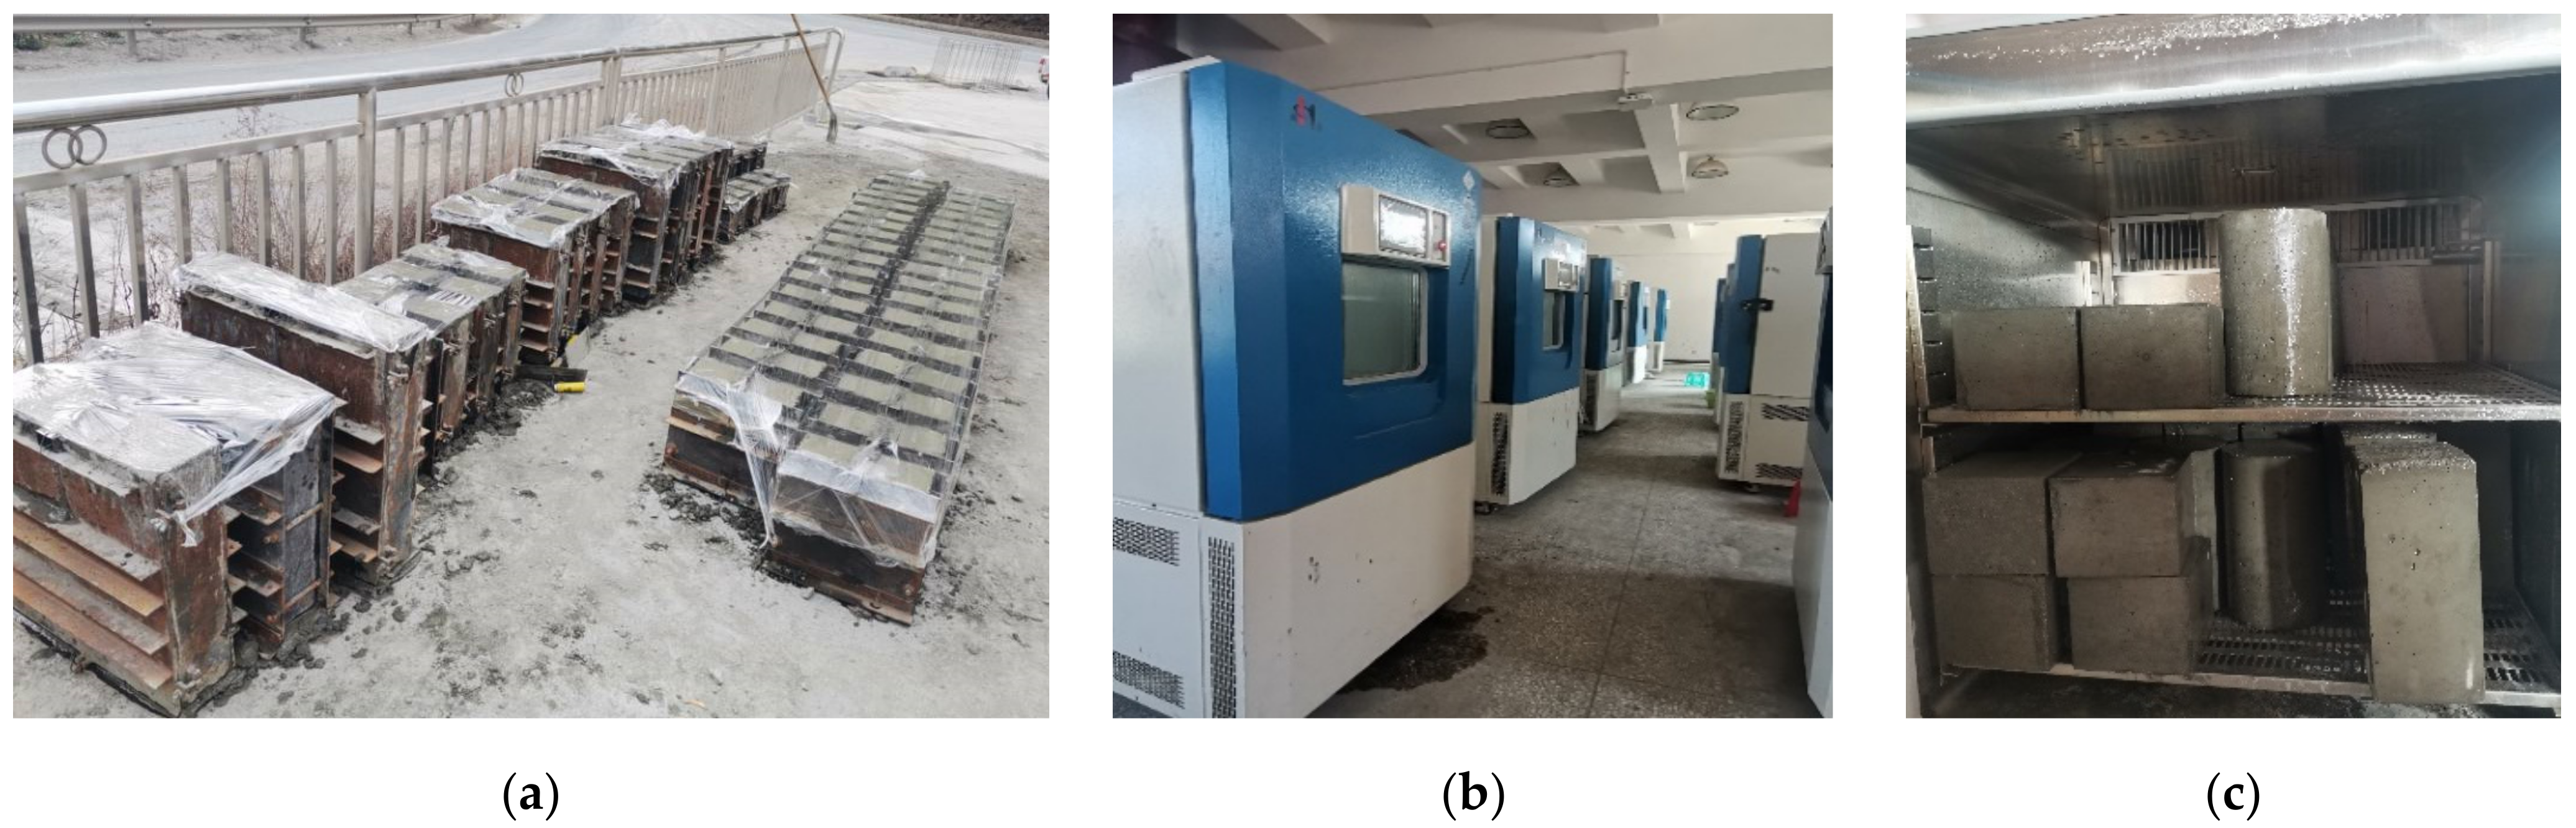
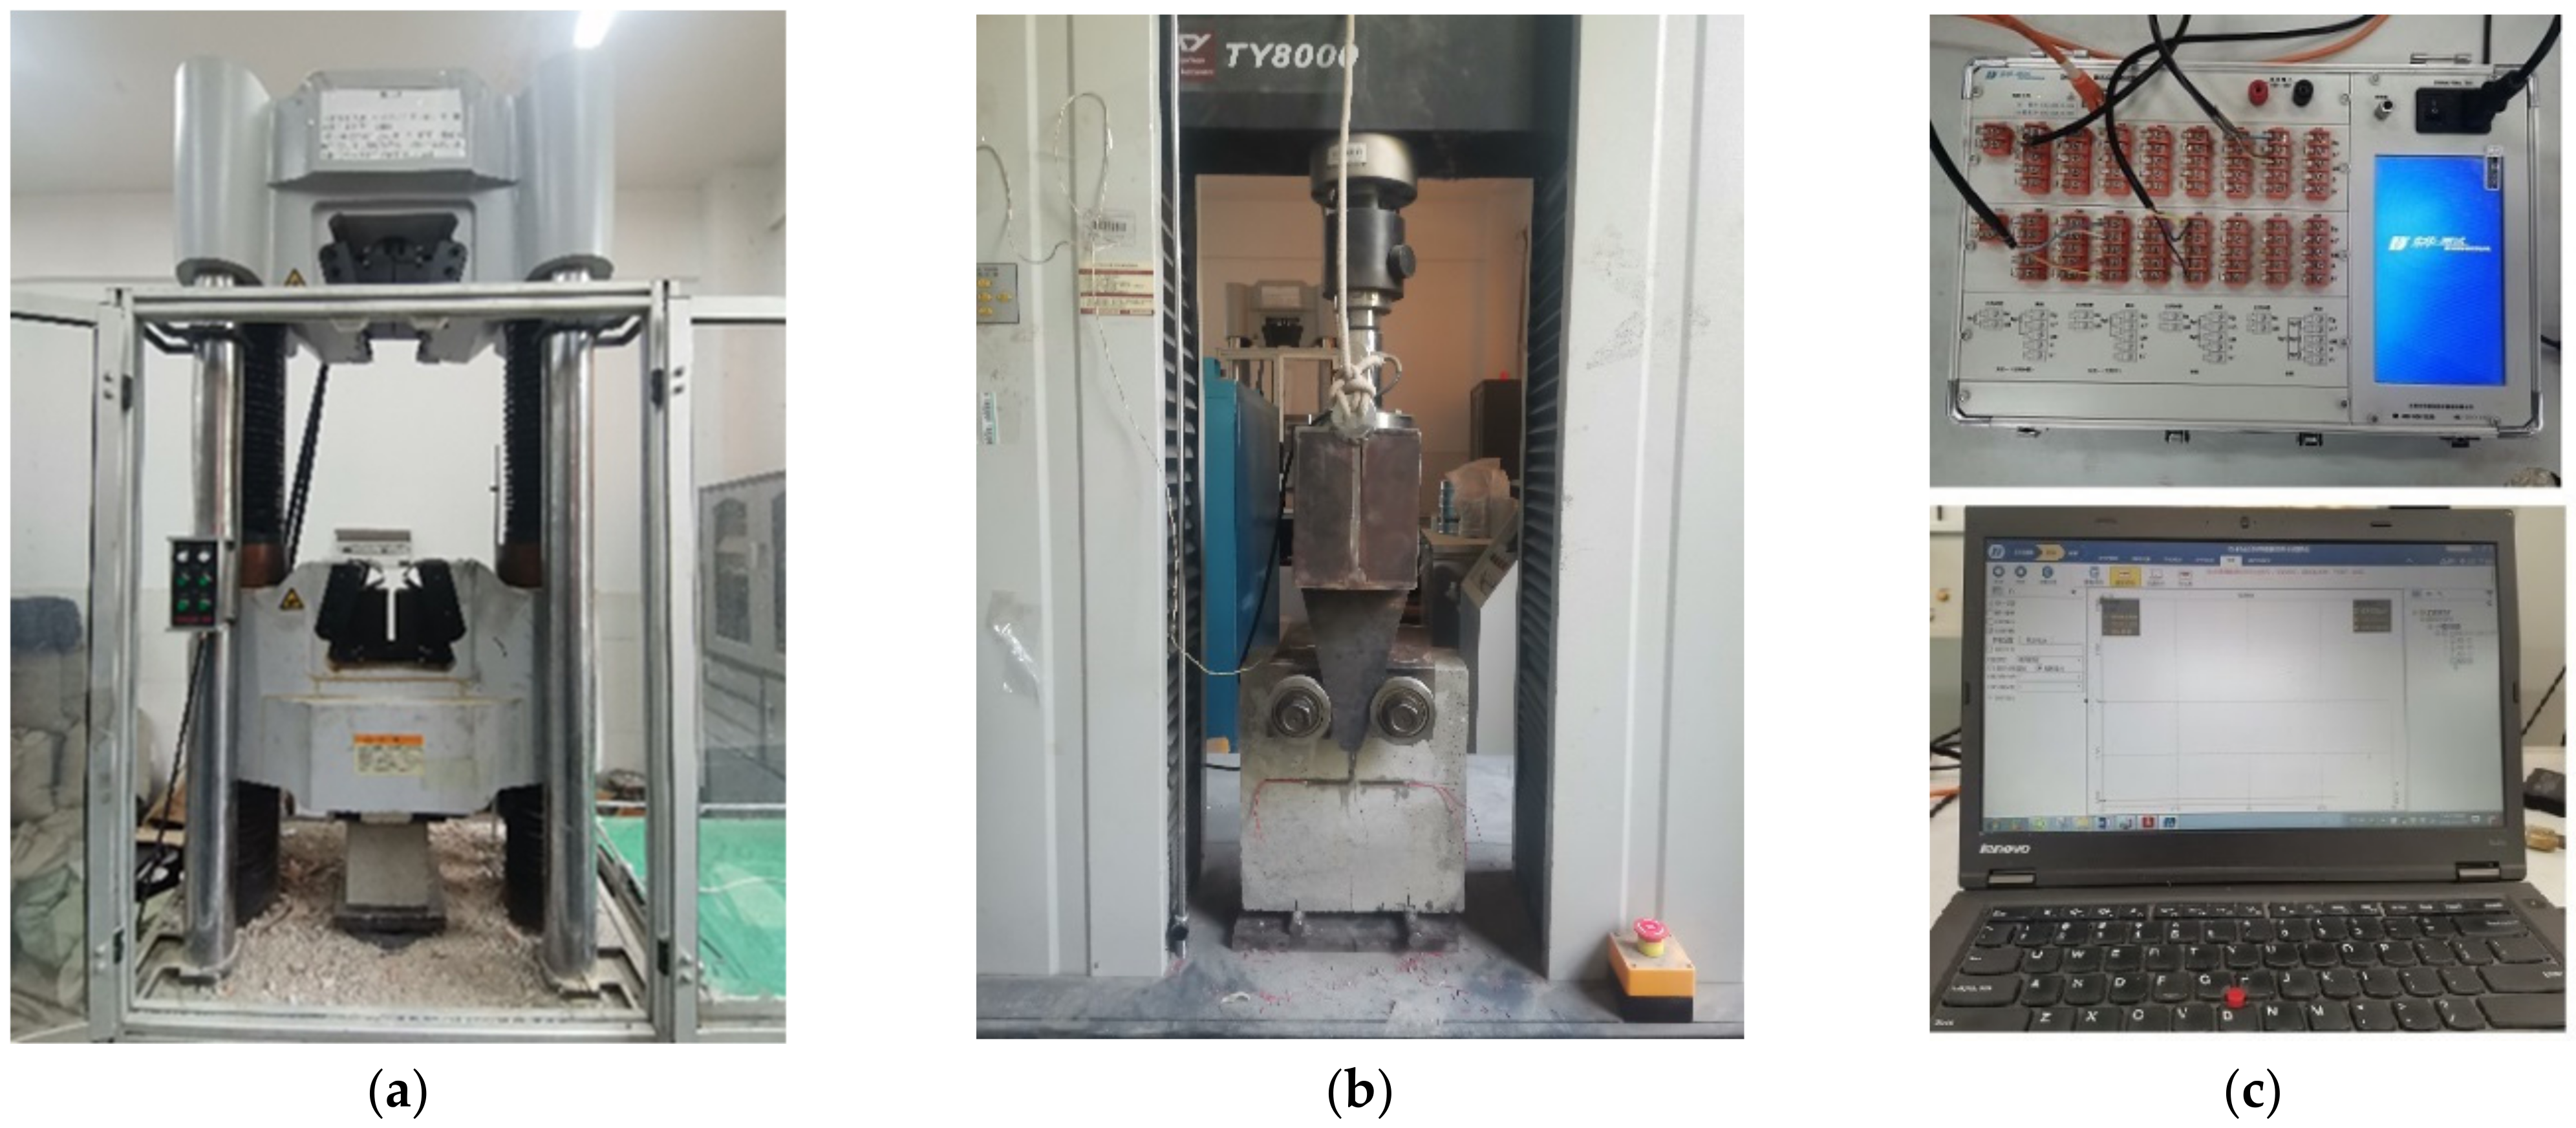
2.1. Strength and Fracture Tests
2.1.1. Raw Materials and Mixture Proportions
2.1.2. Test Scheme
2.1.3. Specimen Preparation
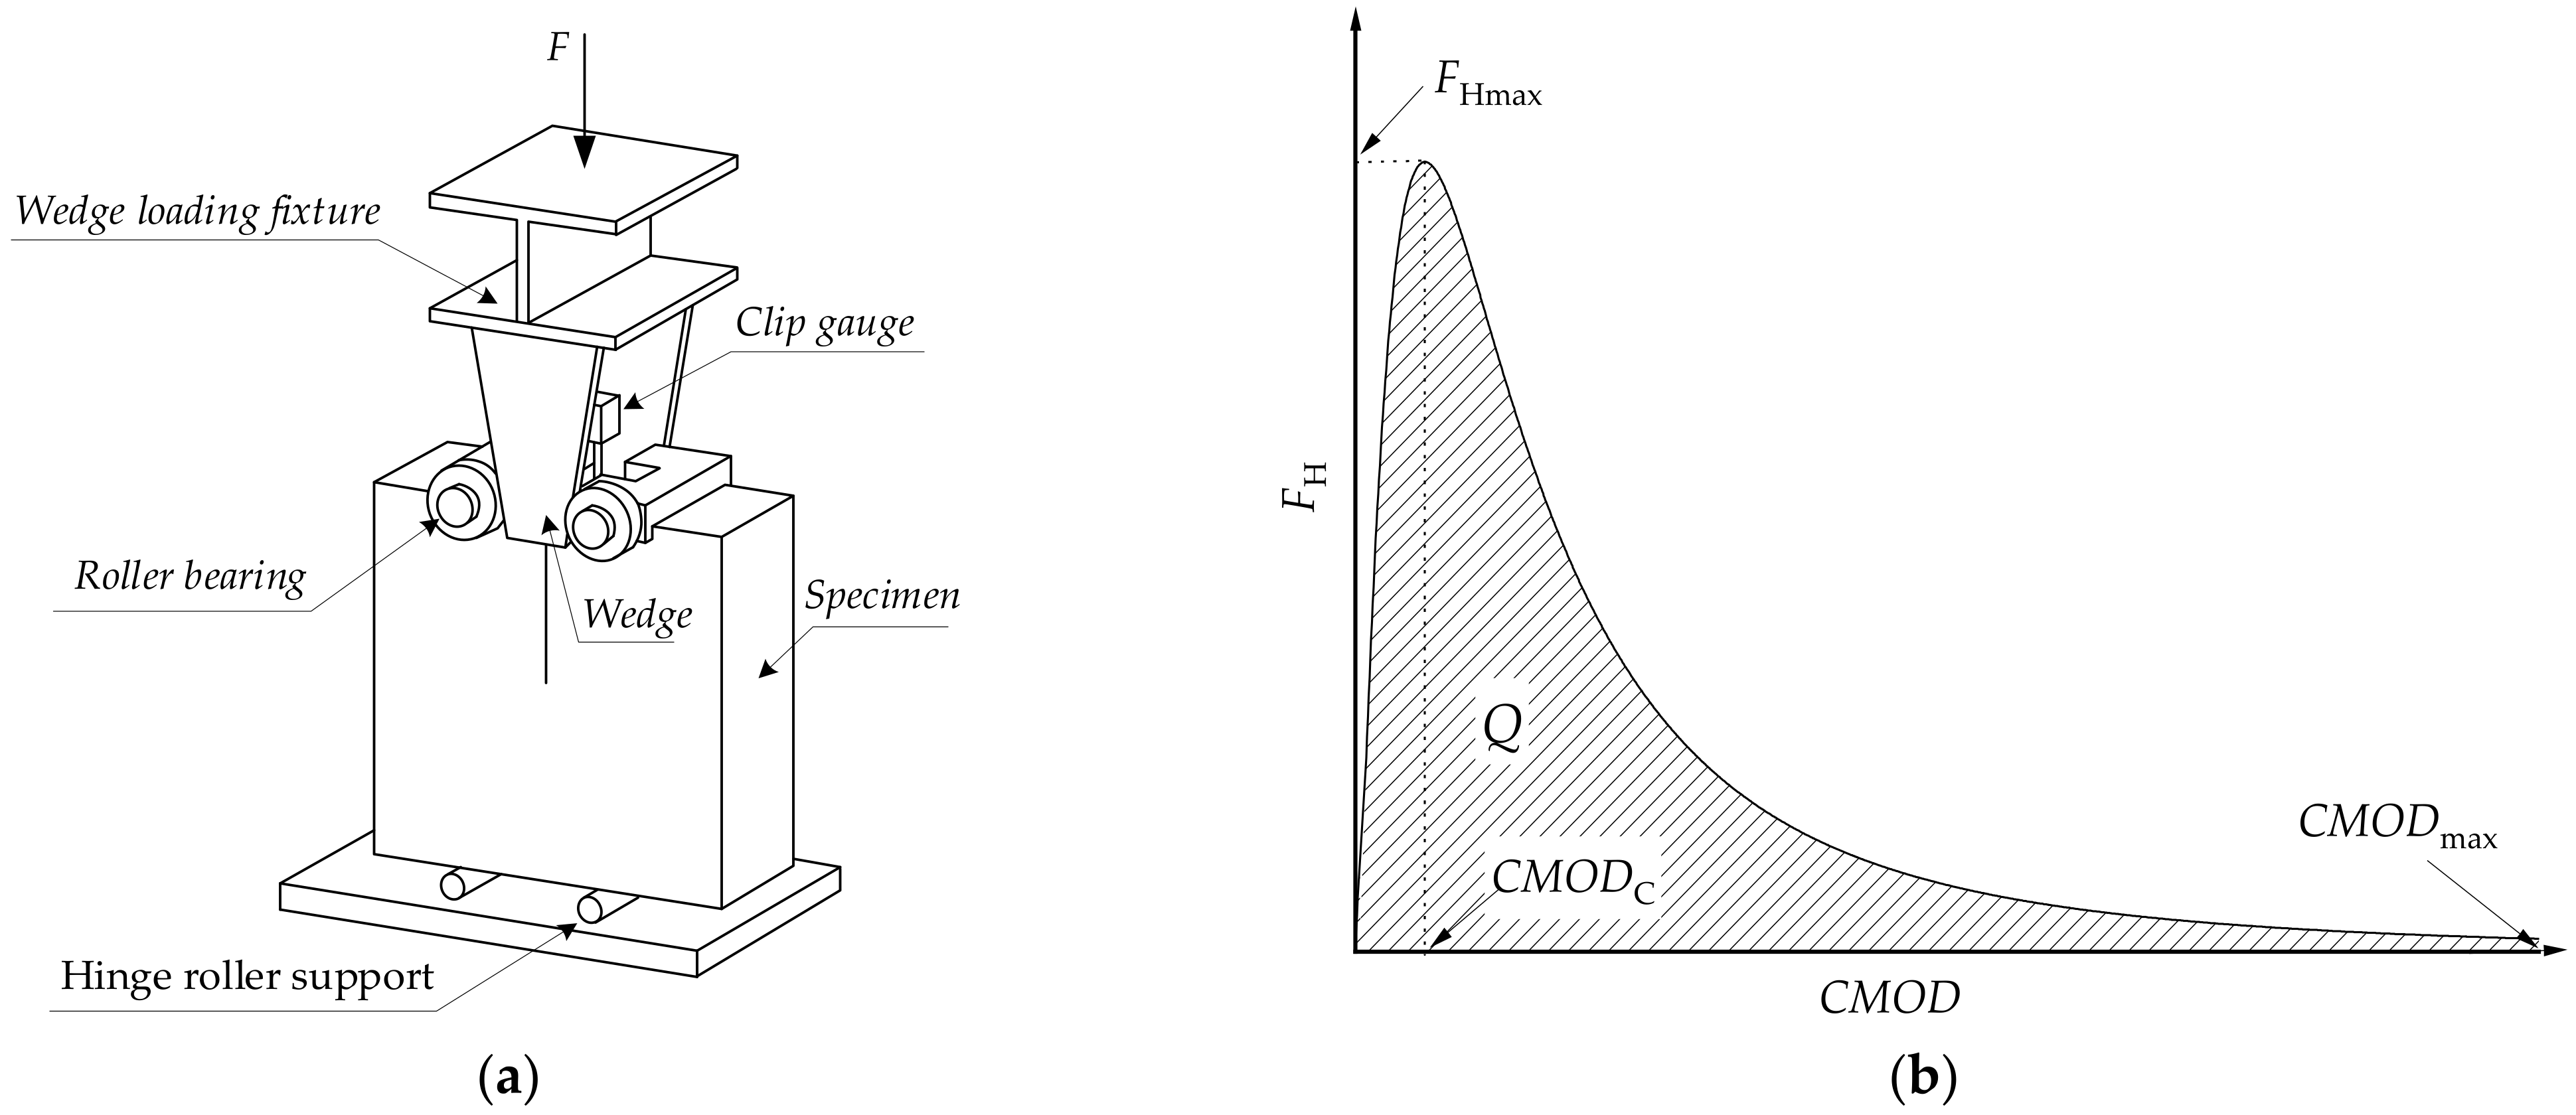
2.1.4. Test Methods
2.2. Temperature–Humidity Maturity Method
2.2.1. Maturity Functions
2.2.2. Strength–Maturity Relationships
3. Results and Discussion
3.1. Test Results
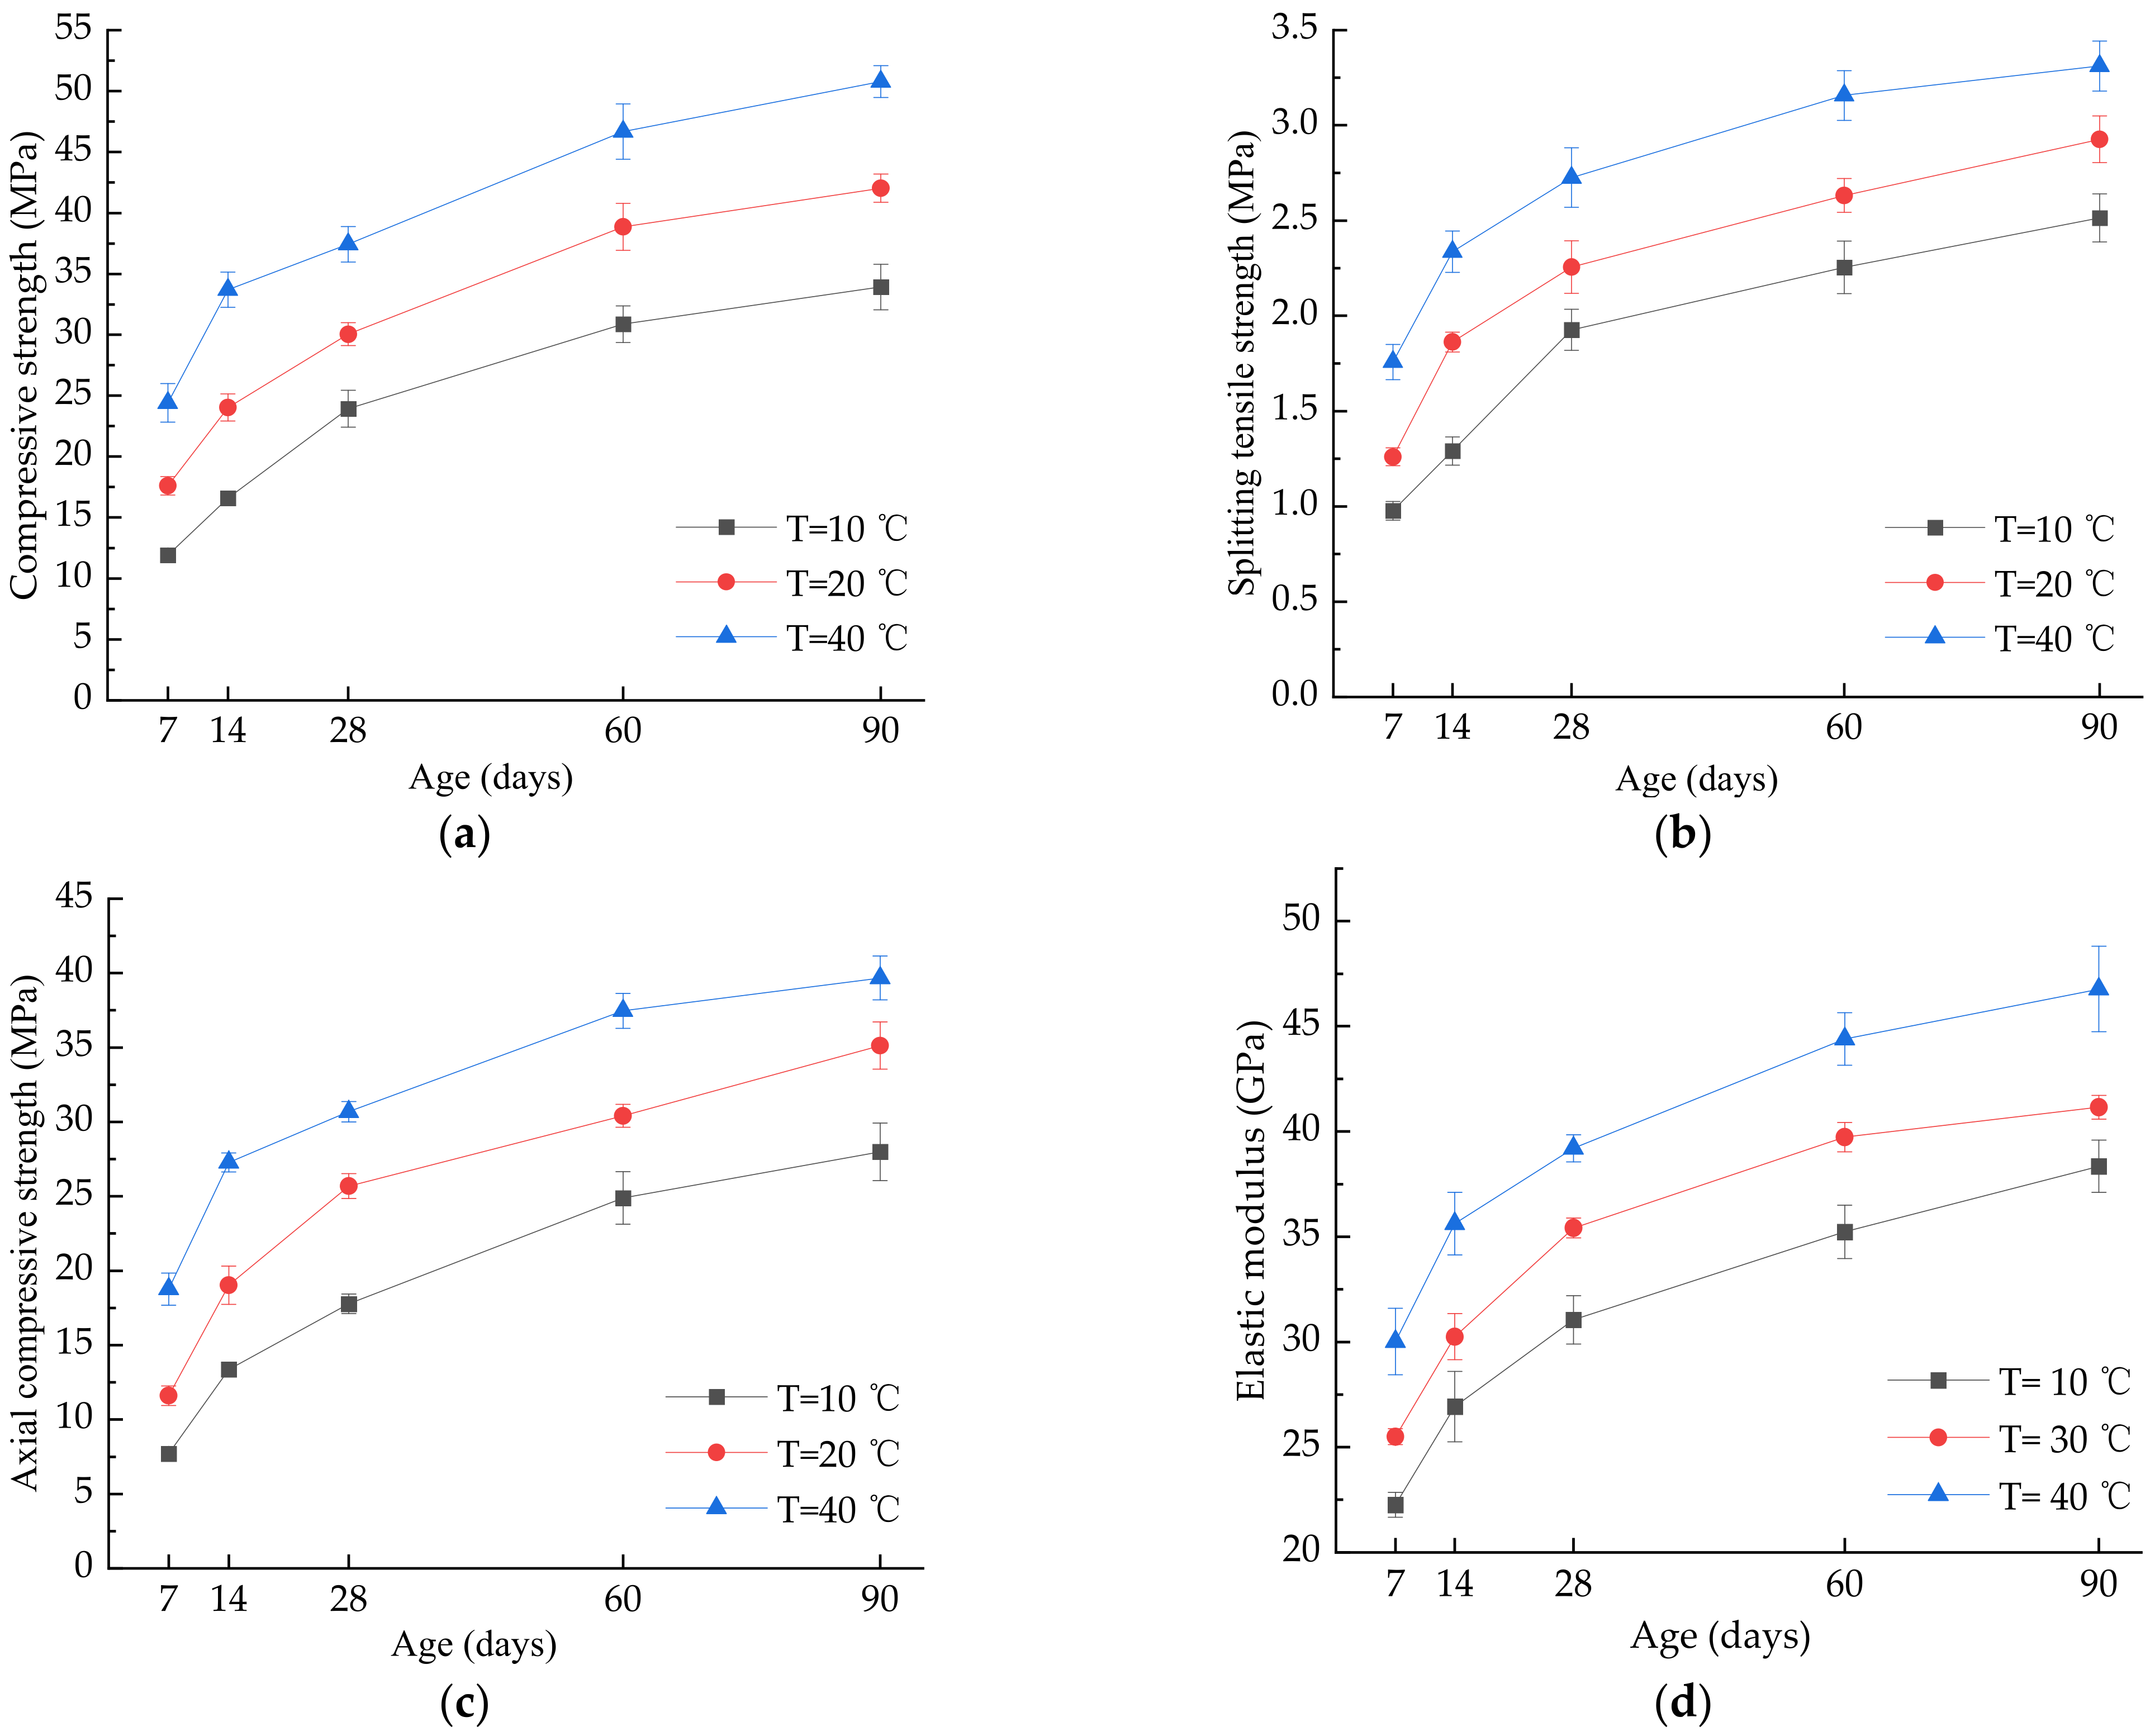
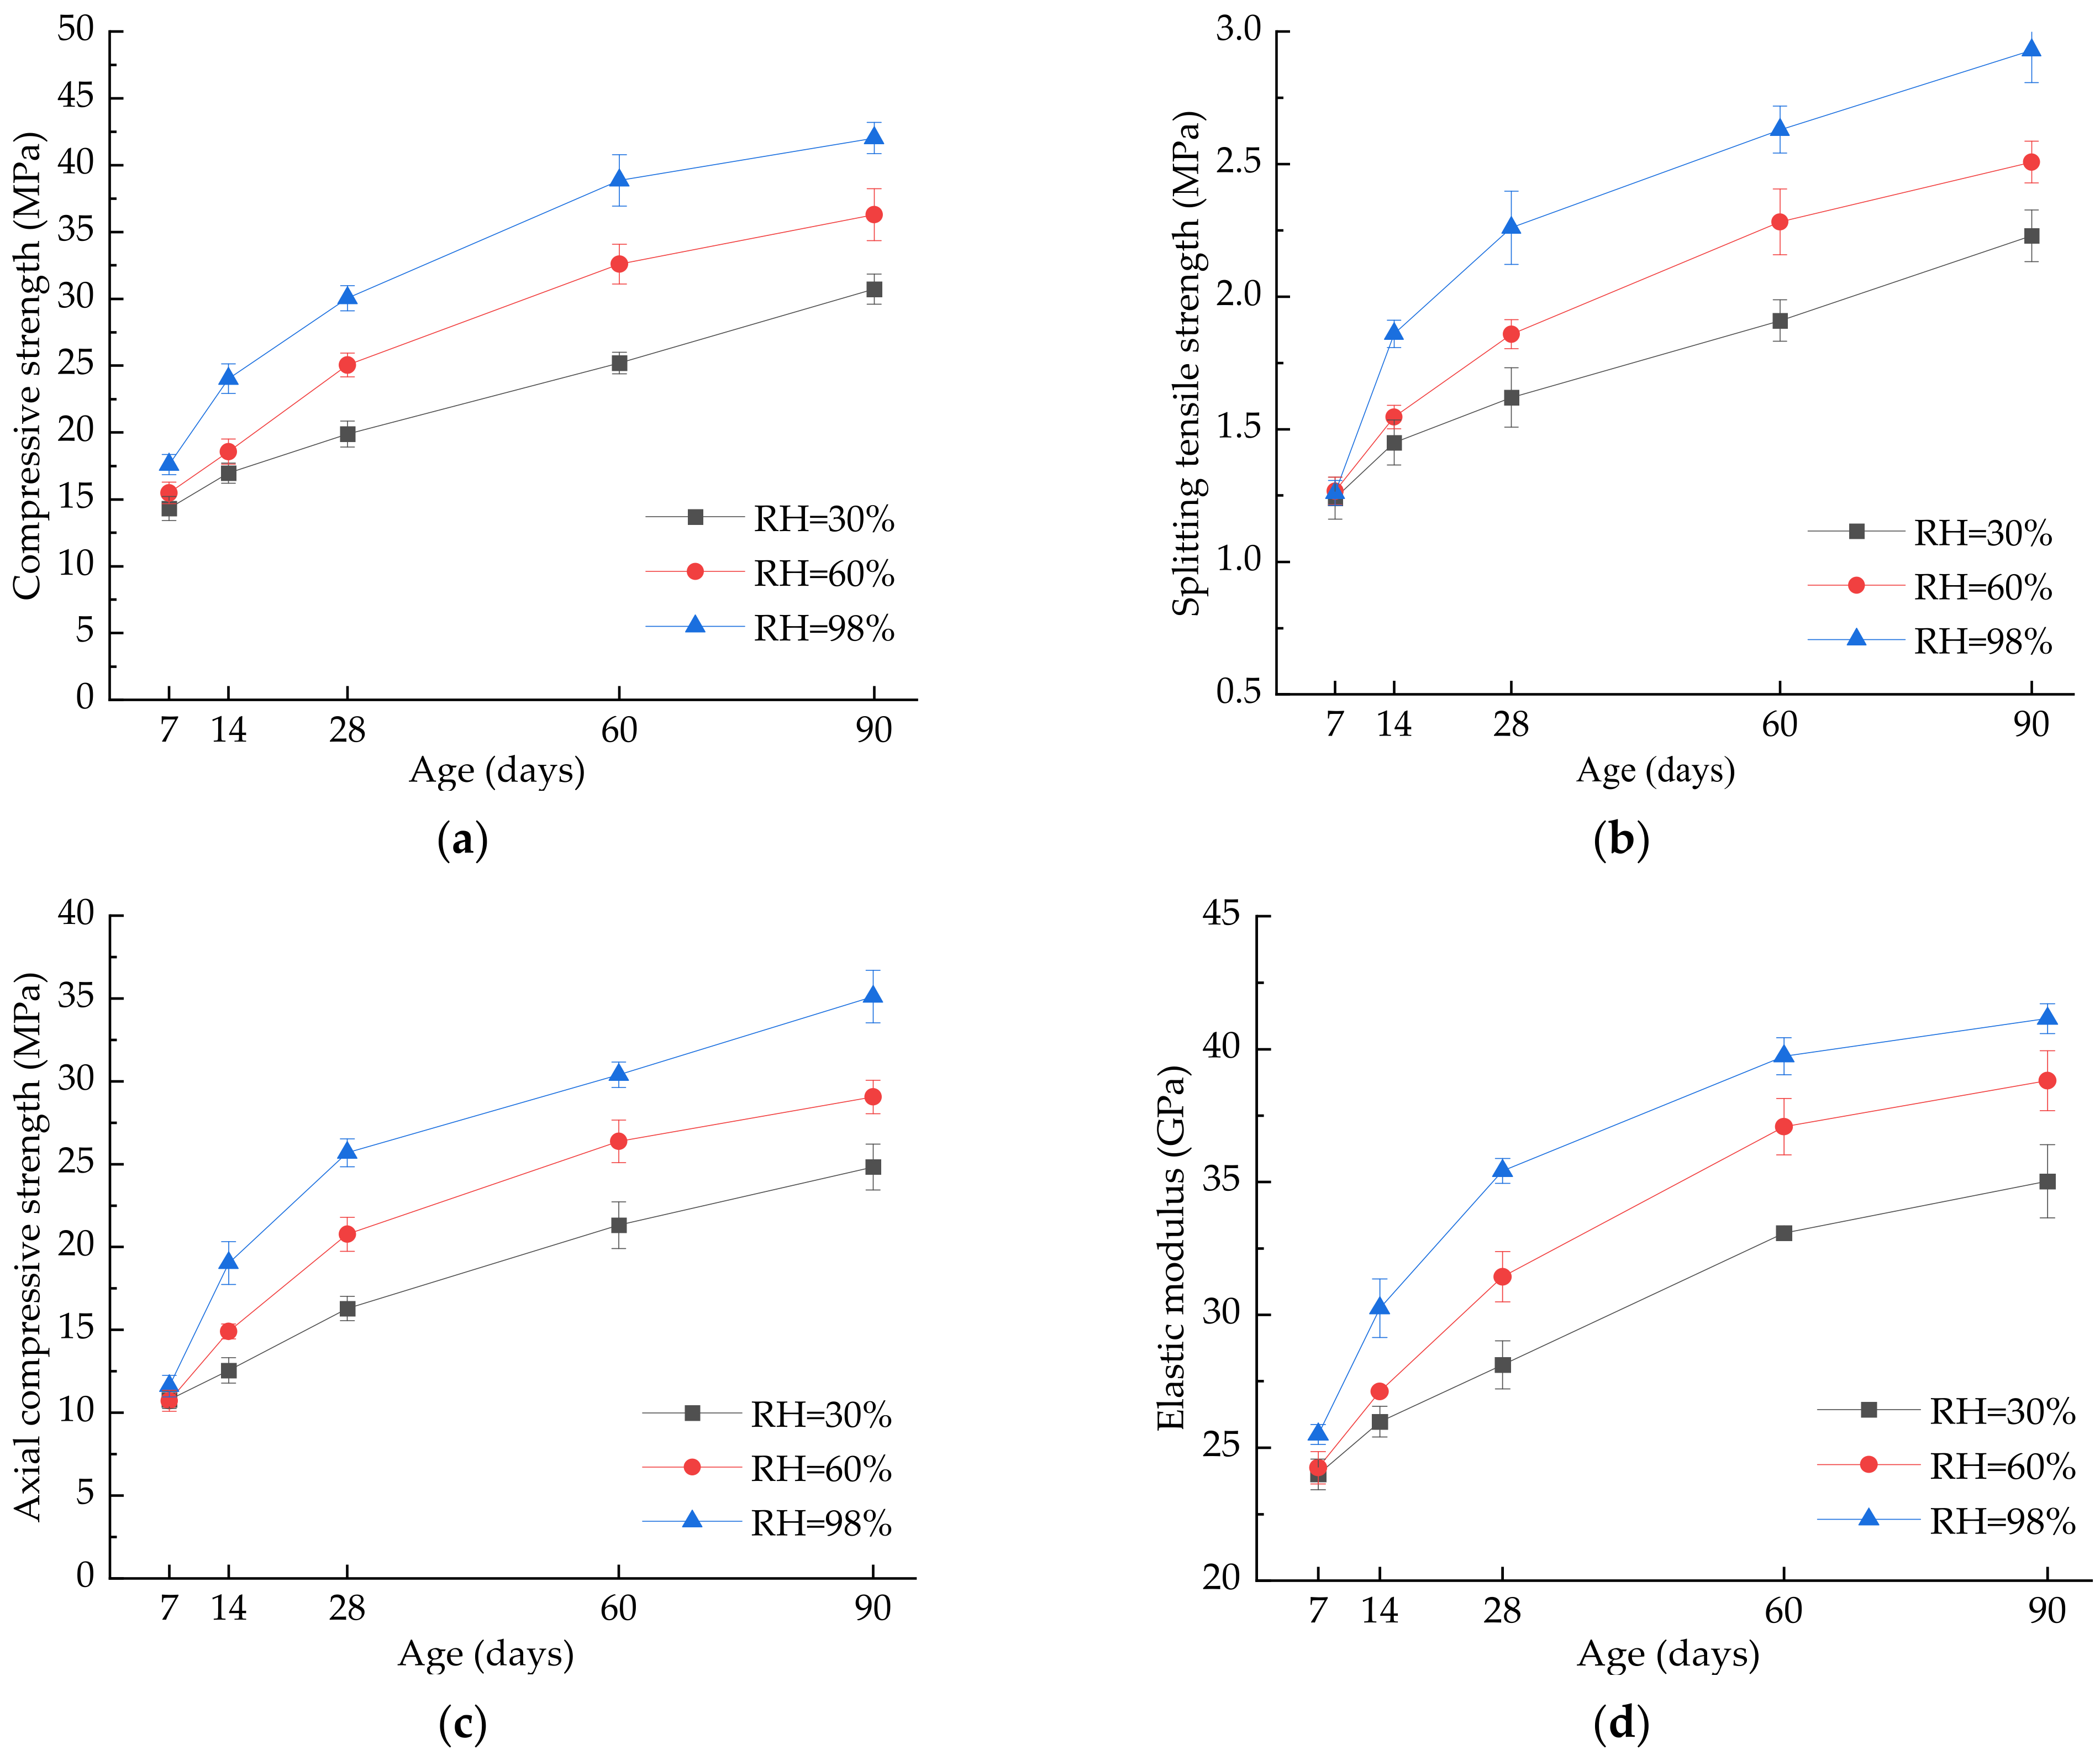
3.1.1. Strength Test Results
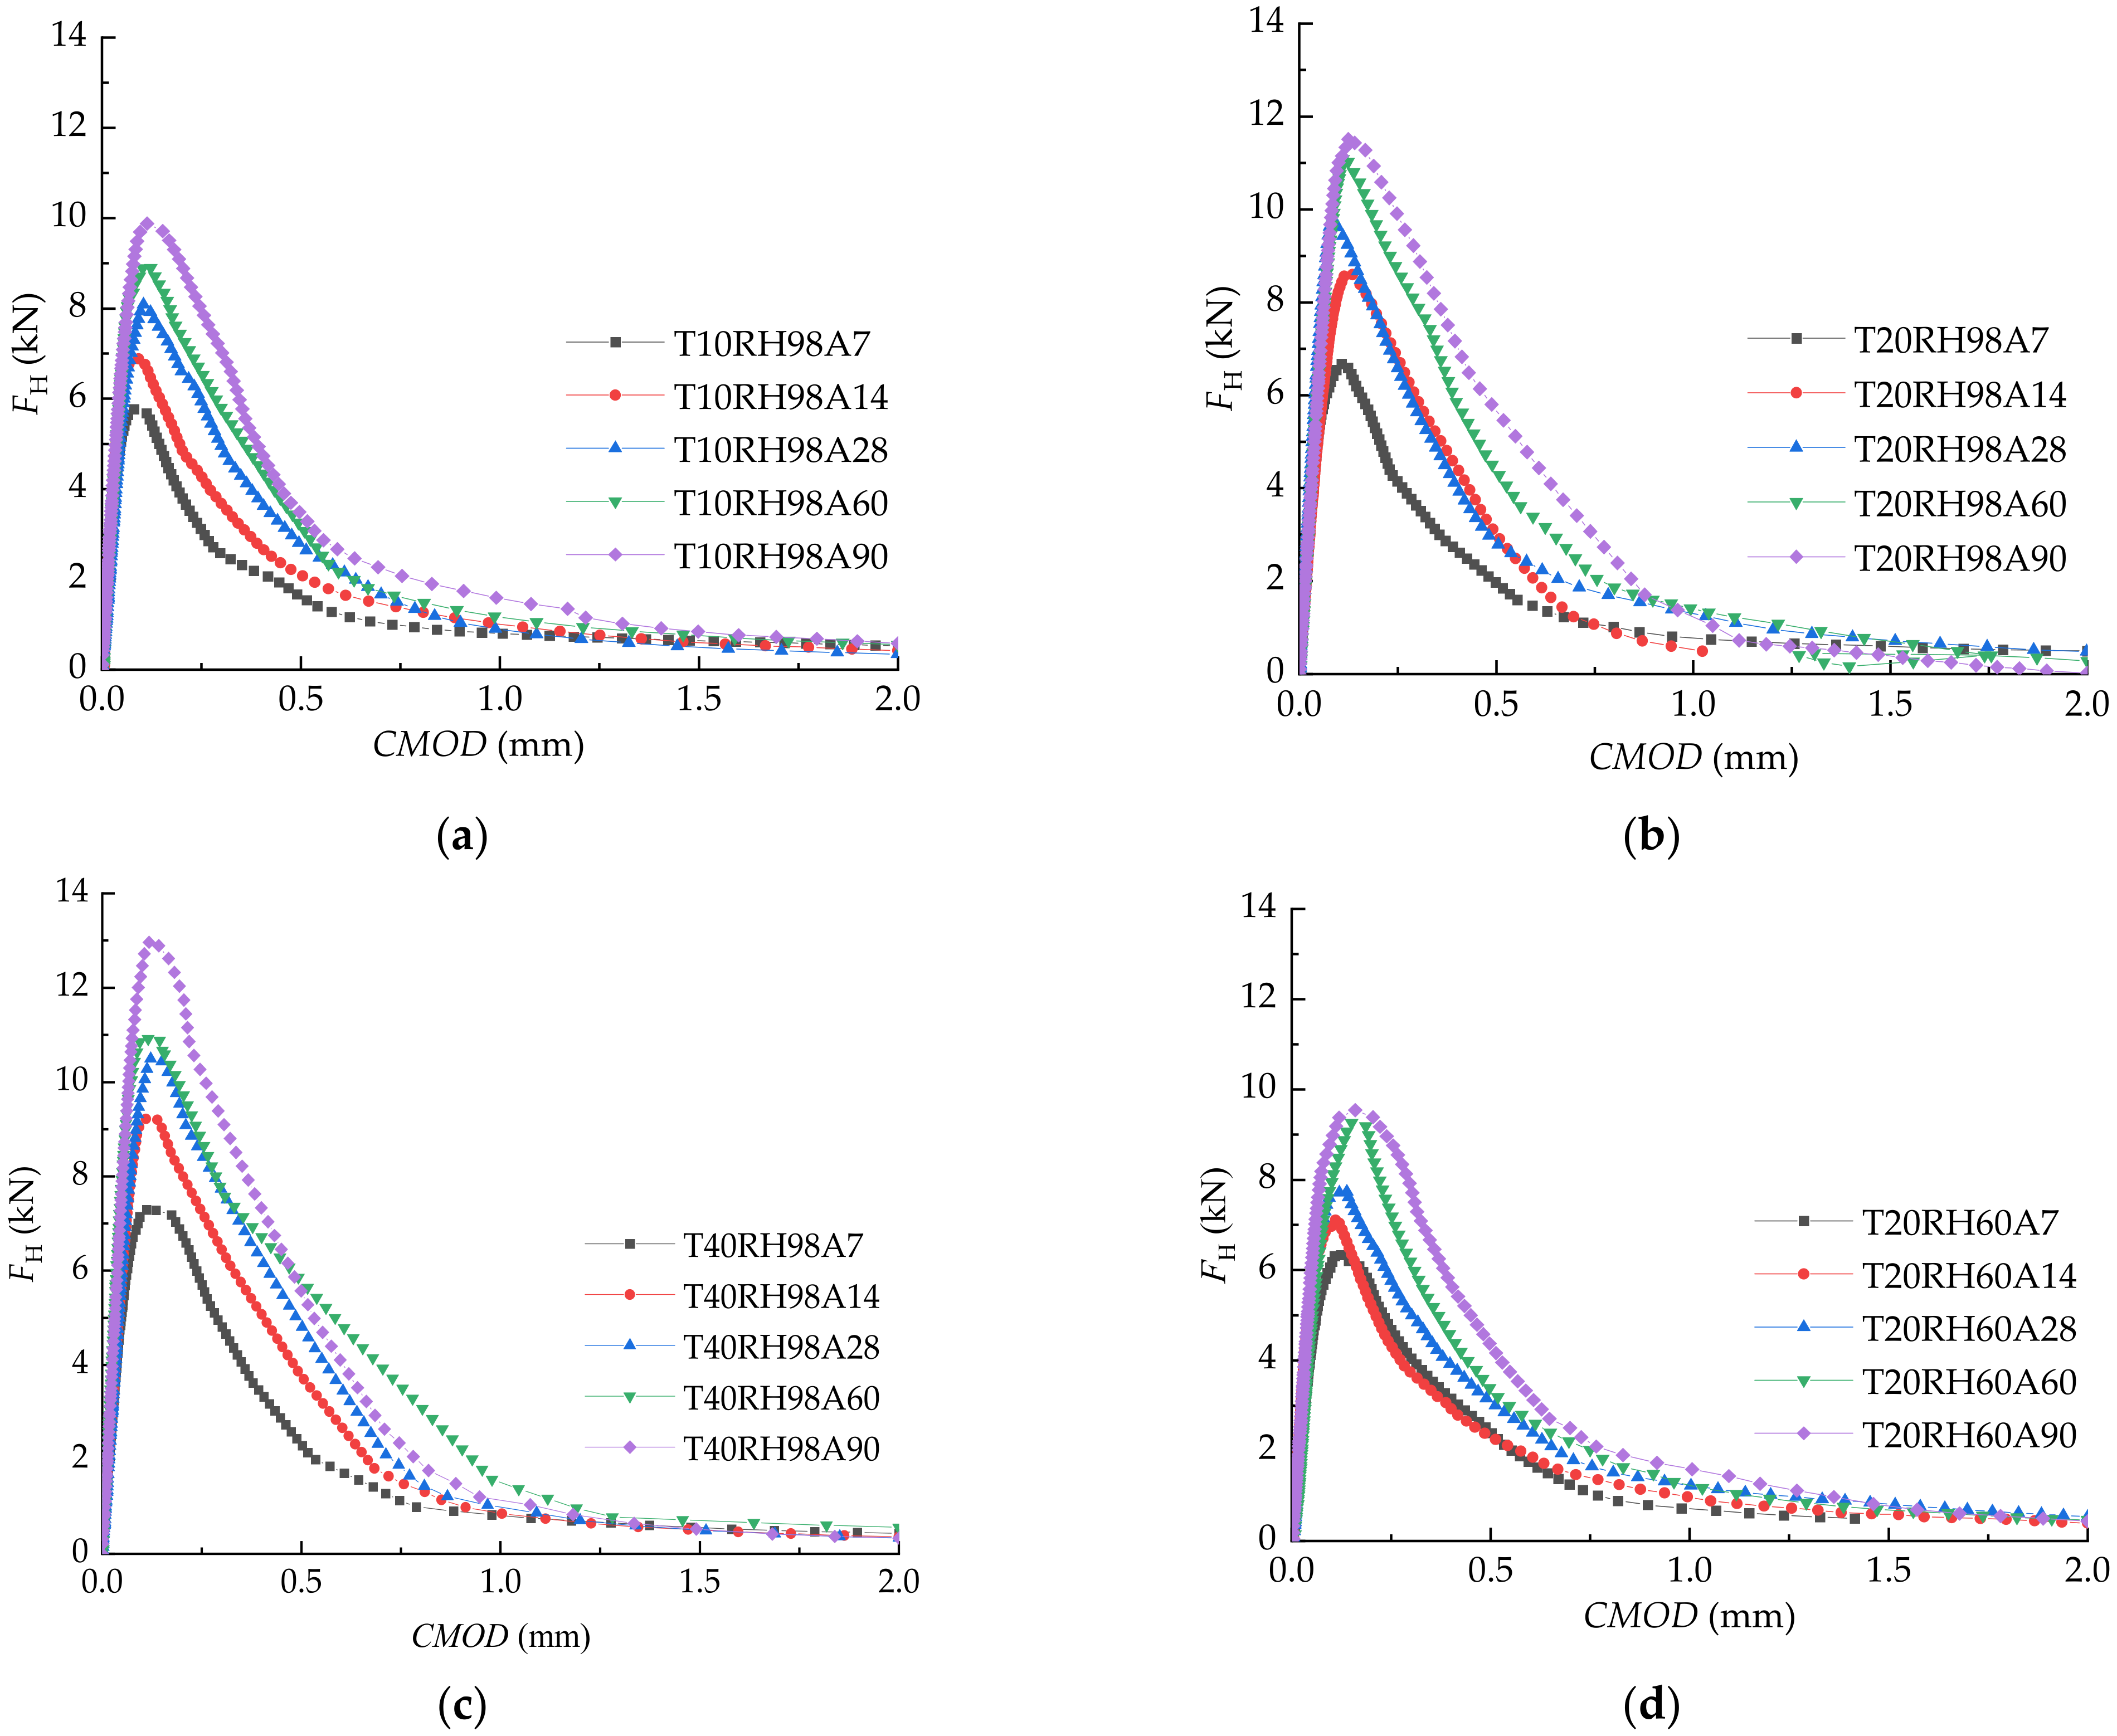
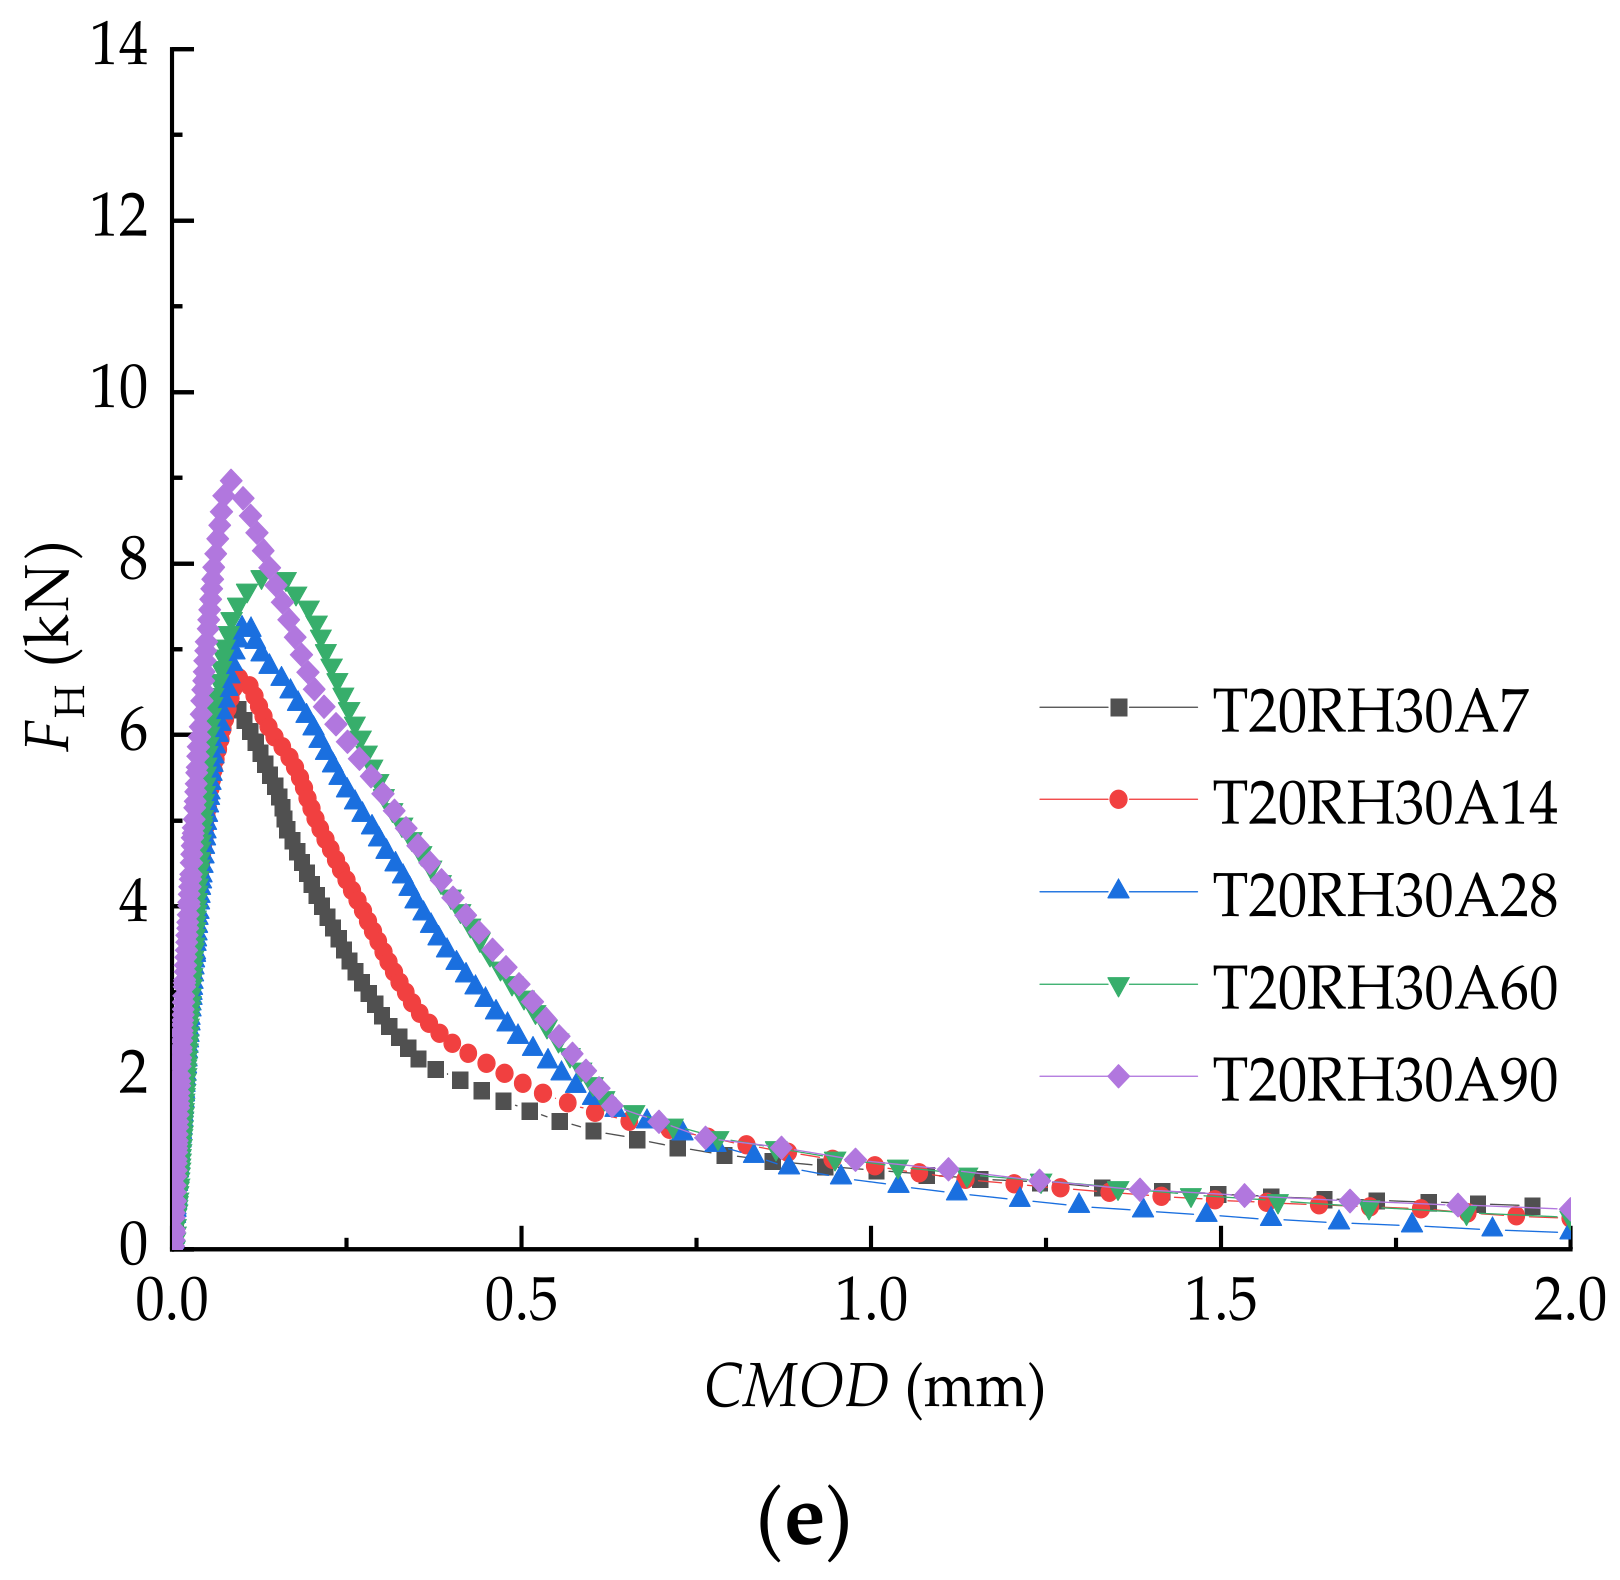
3.1.2. Fracture Test Results
3.2. Maturity Method Analysis
3.2.1. Maturity Index Calculation
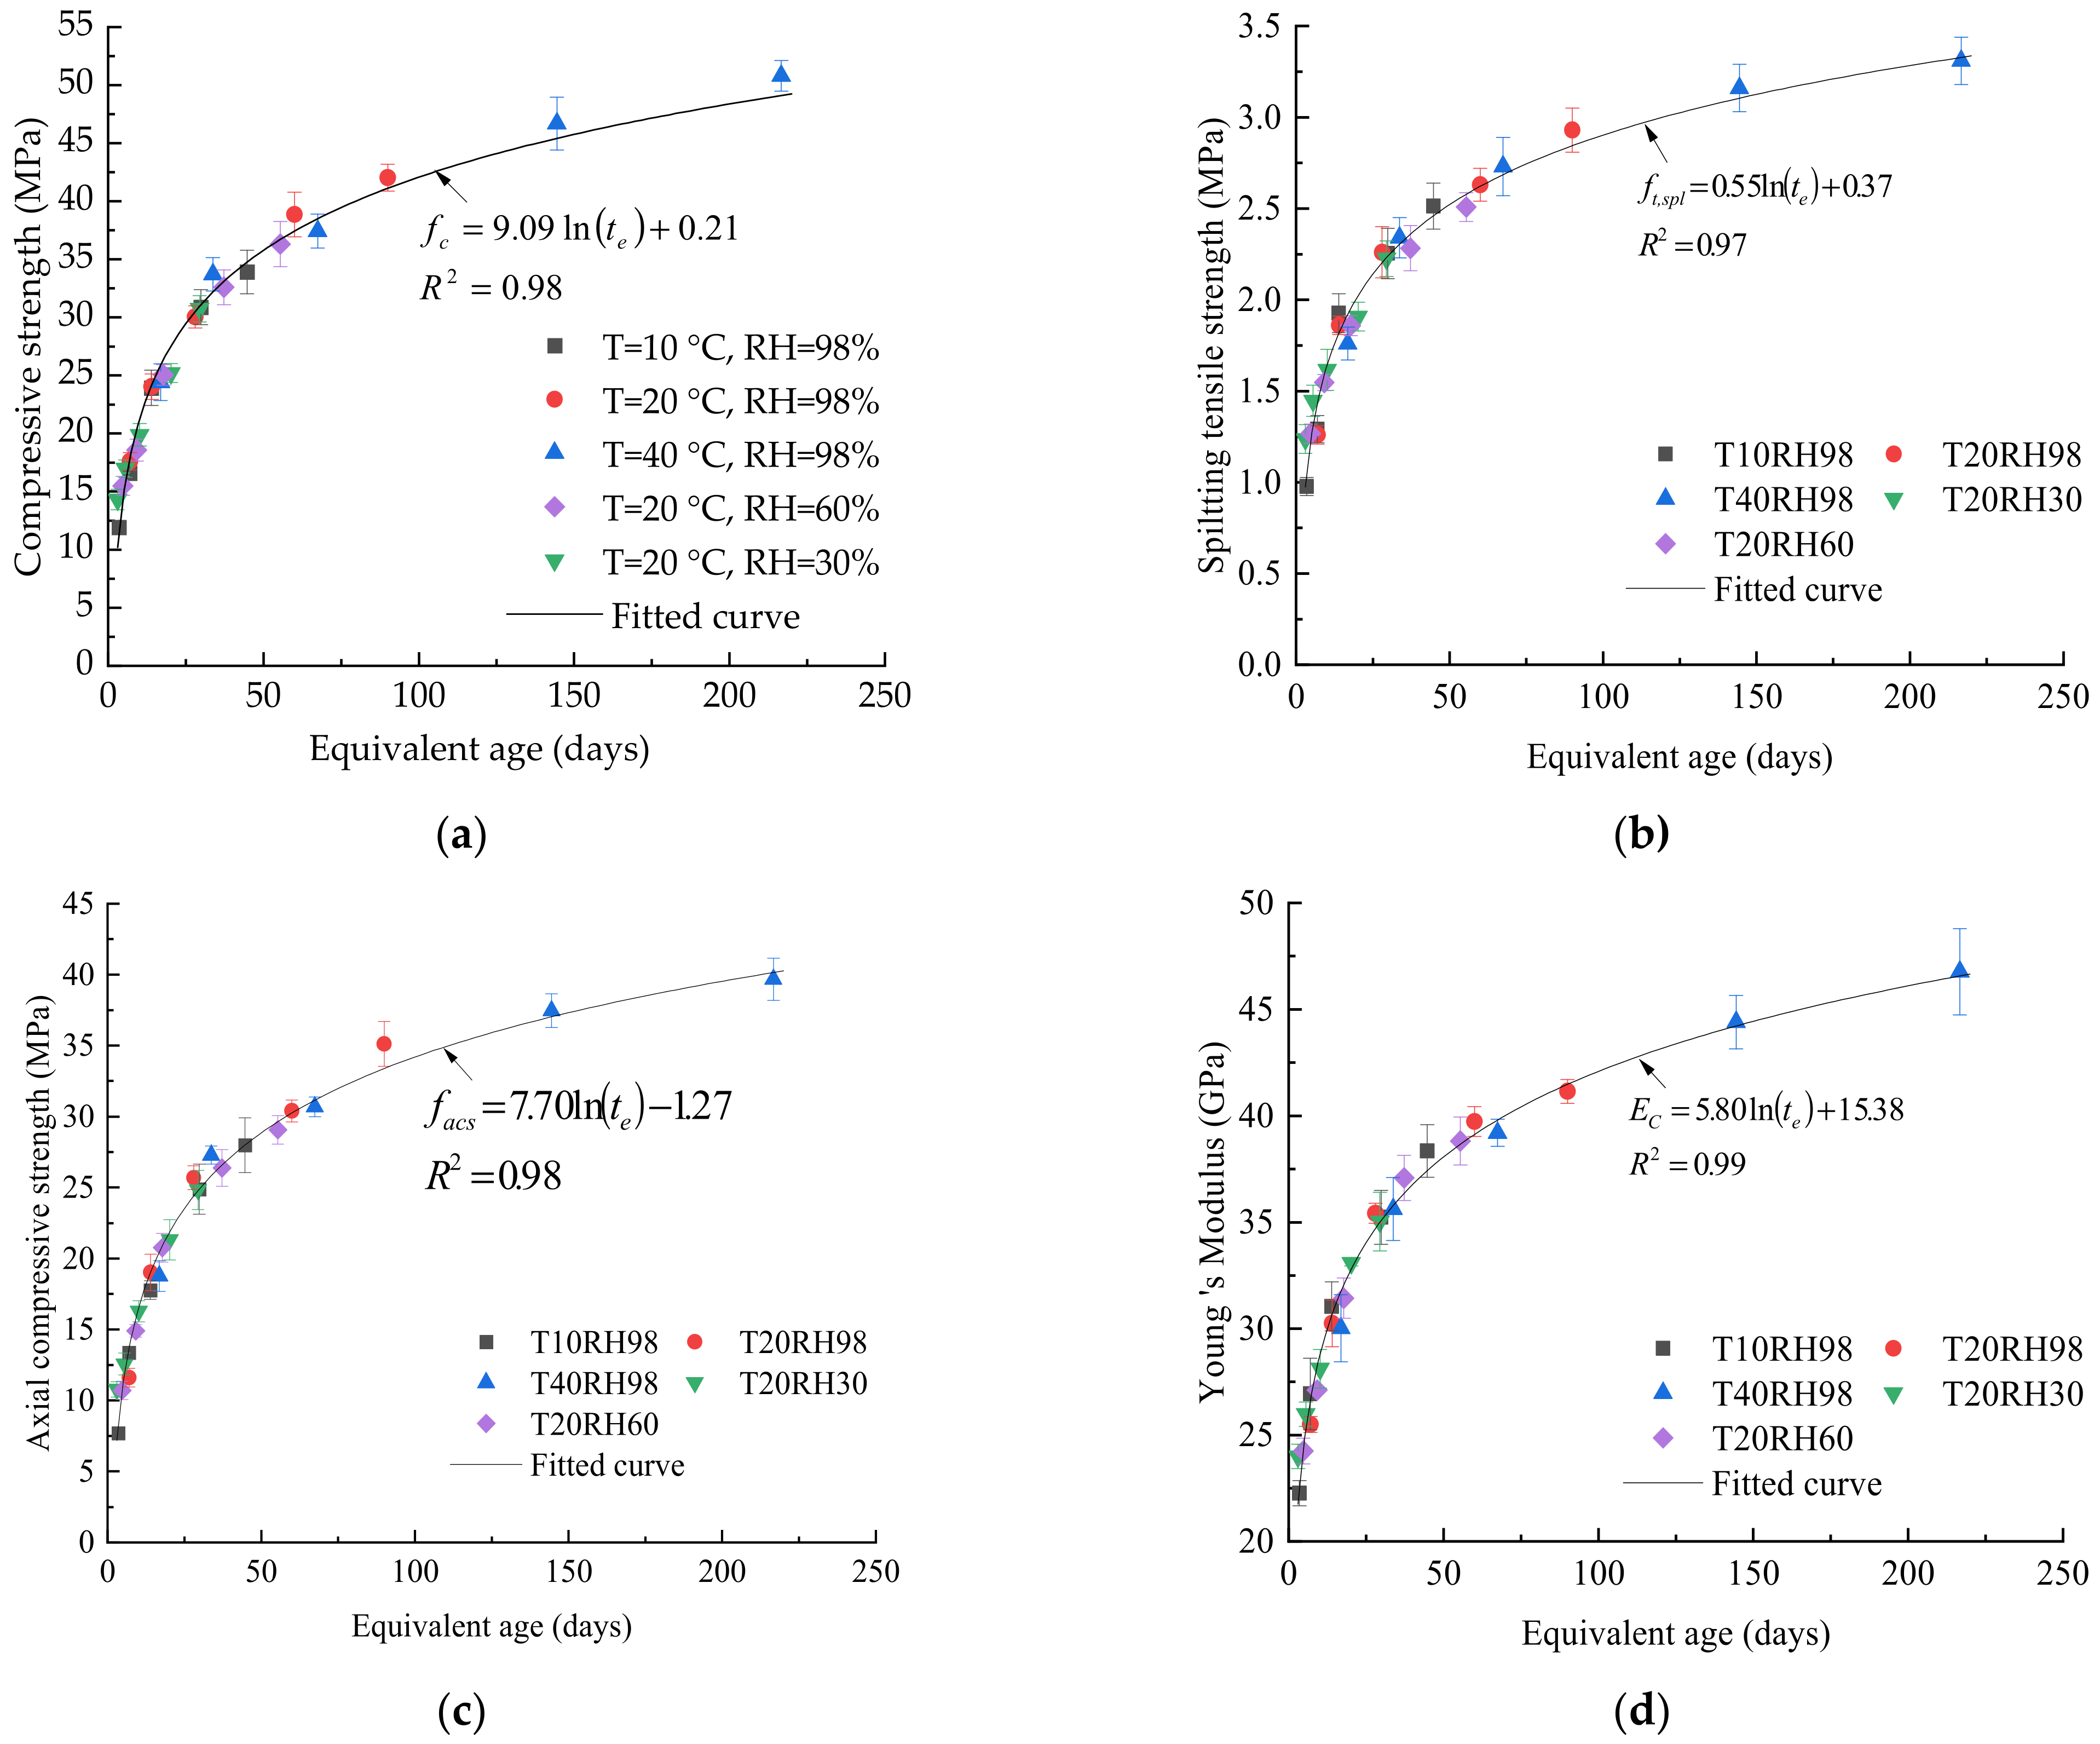
3.2.2. Strength Parameters
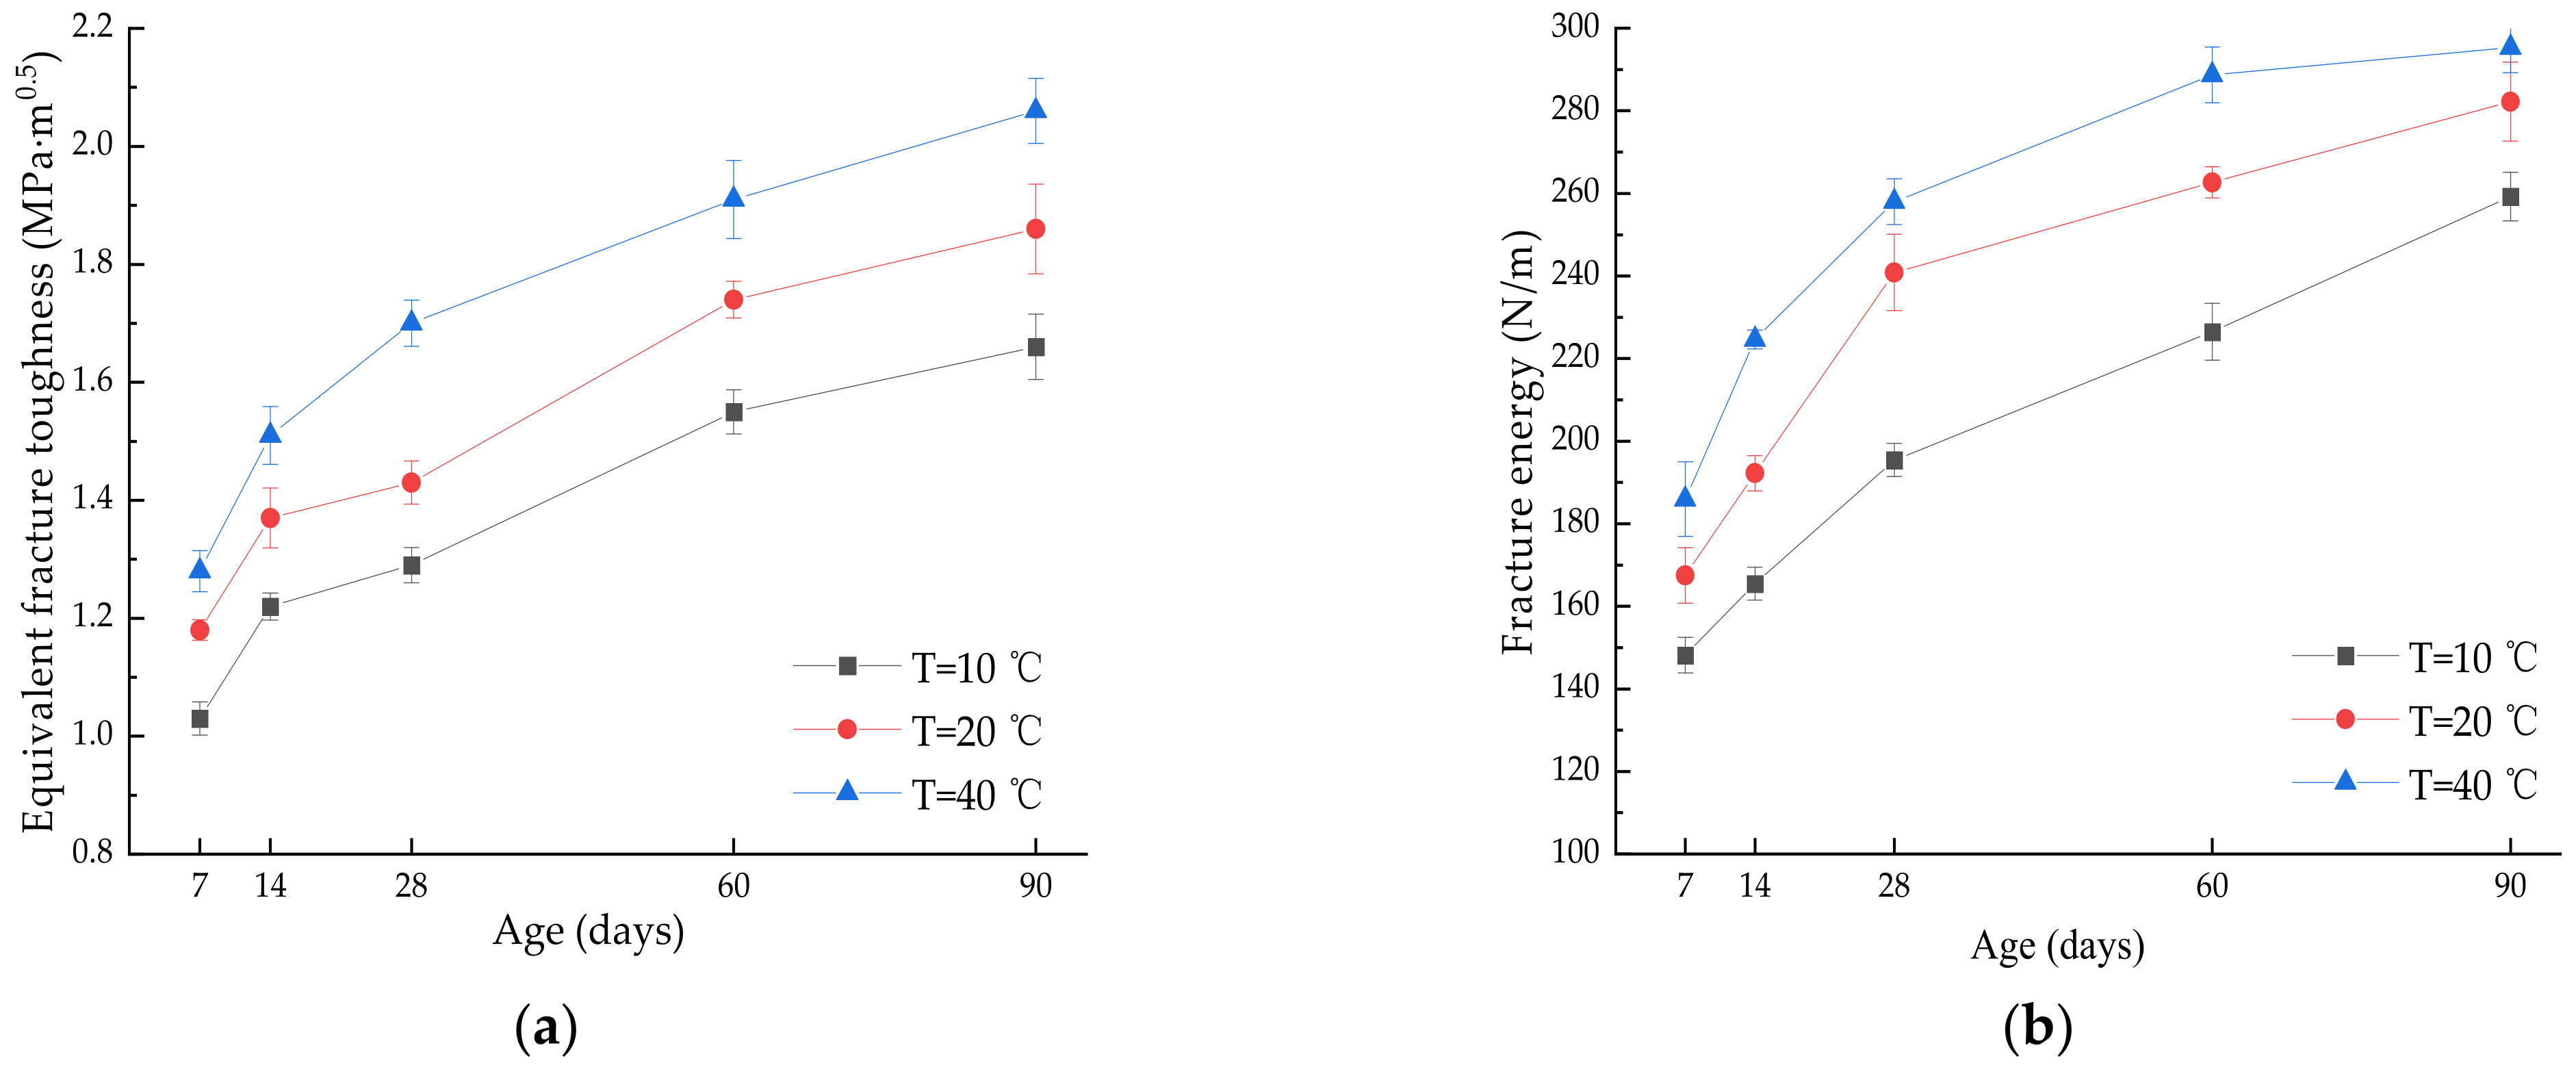
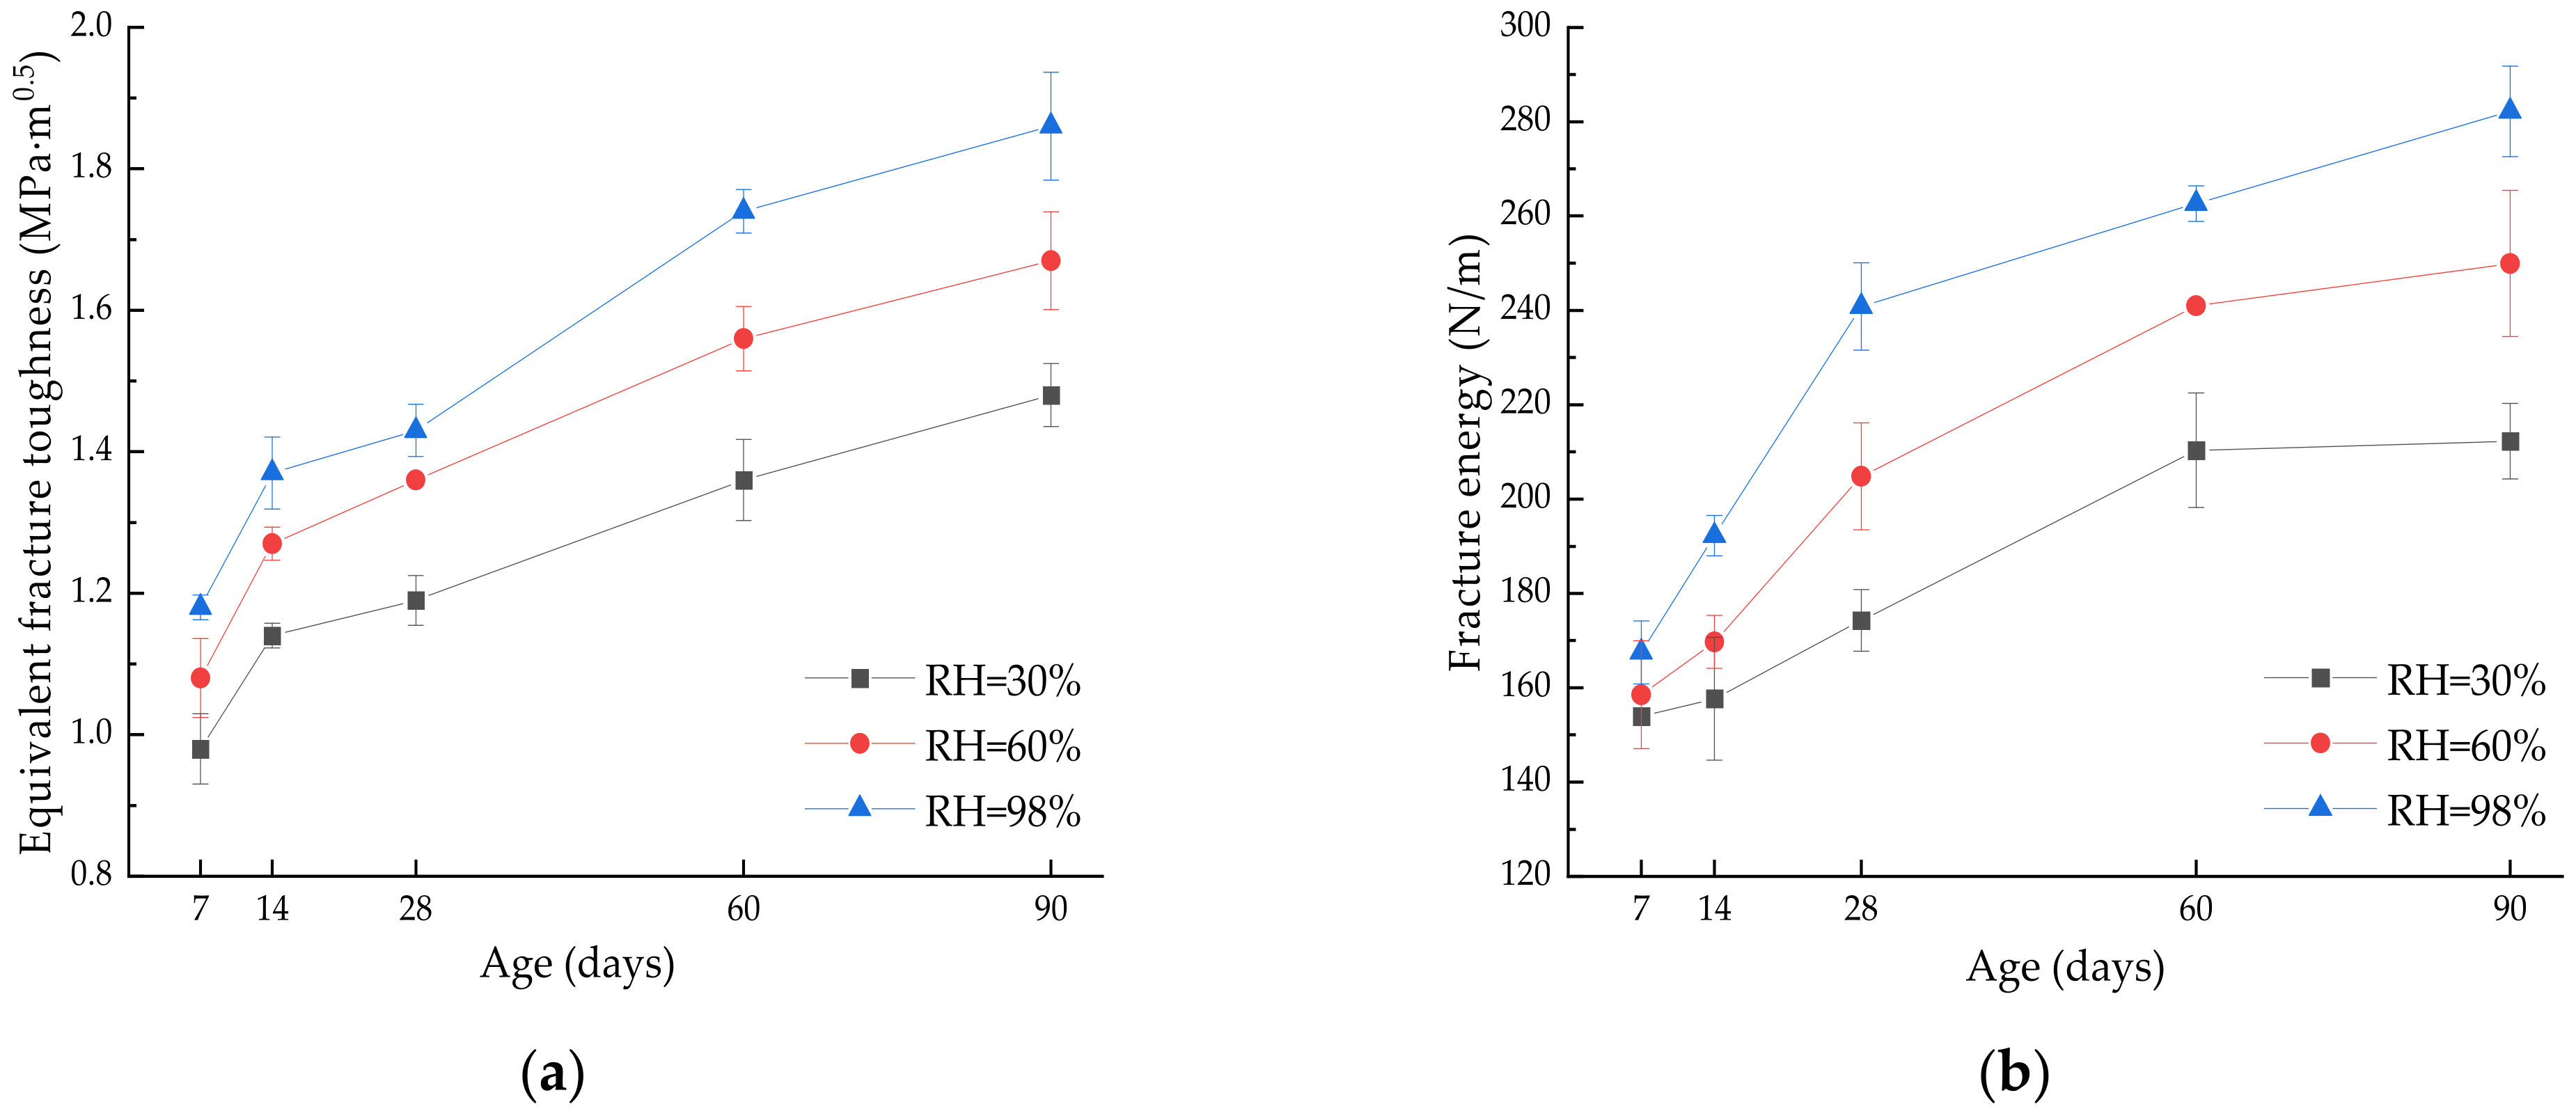
3.2.3. Fracture Parameters
3.3. Determination of Real Strength and Fracture Parameters of Dam Gallery Concrete
3.3.1. Maturity Index Calculation
3.3.2. Determination of Strength and Fracture Parameters
4. Conclusions
- (1)
- In the range of 10 °C to 40 °C, the higher the curing temperature, the greater the strength and fracture parameters of the gallery concrete, and the faster the growth rate of the strength and fracture parameters at the same age. As the age increases, the strength and fracture parameters of concrete, under different curing temperatures, will gradually approach their final stable values.
- (2)
- The curing humidity has a negligible effect on the strength and fracture parameters of gallery concrete at early ages, but as the age increases, the adverse effects of insufficient curing humidity on the strength and fracture parameters gradually appear, and the difference between the material parameters under different humidity conditions demonstrates a law that first expands and then reduces. The low-humidity curing condition may result in a reduction in the strength growth rate, up to 58.72%, and strength up to 33.81%; hence, its effect on the mechanical parameters of gallery concrete cannot be neglected.
- (3)
- The coefficients of determination for the relationship equations between strength and fracture parameters and equivalent ages are all greater than 0.96, indicating the temperature–humidity maturity function and logarithmic relationship between strength and maturity index can be used to quantitatively describe the growth law of strength and fracture parameters of low-heat cement gallery concrete, under conditions of curing temperatures of 10 °C to 40 °C, and relative humidity of 30% to 98%.
- (4)
- The method of embedding thermometers in the gallery concrete and setting up weather stations inside and outside the gallery can determine the most unfavorable environmental conditions for the development of the gallery concrete’s strength and fracture parameters, which can help to correct a maximum deviation of 54.62% on mechanical parameters, calculated using actual ages.
- (5)
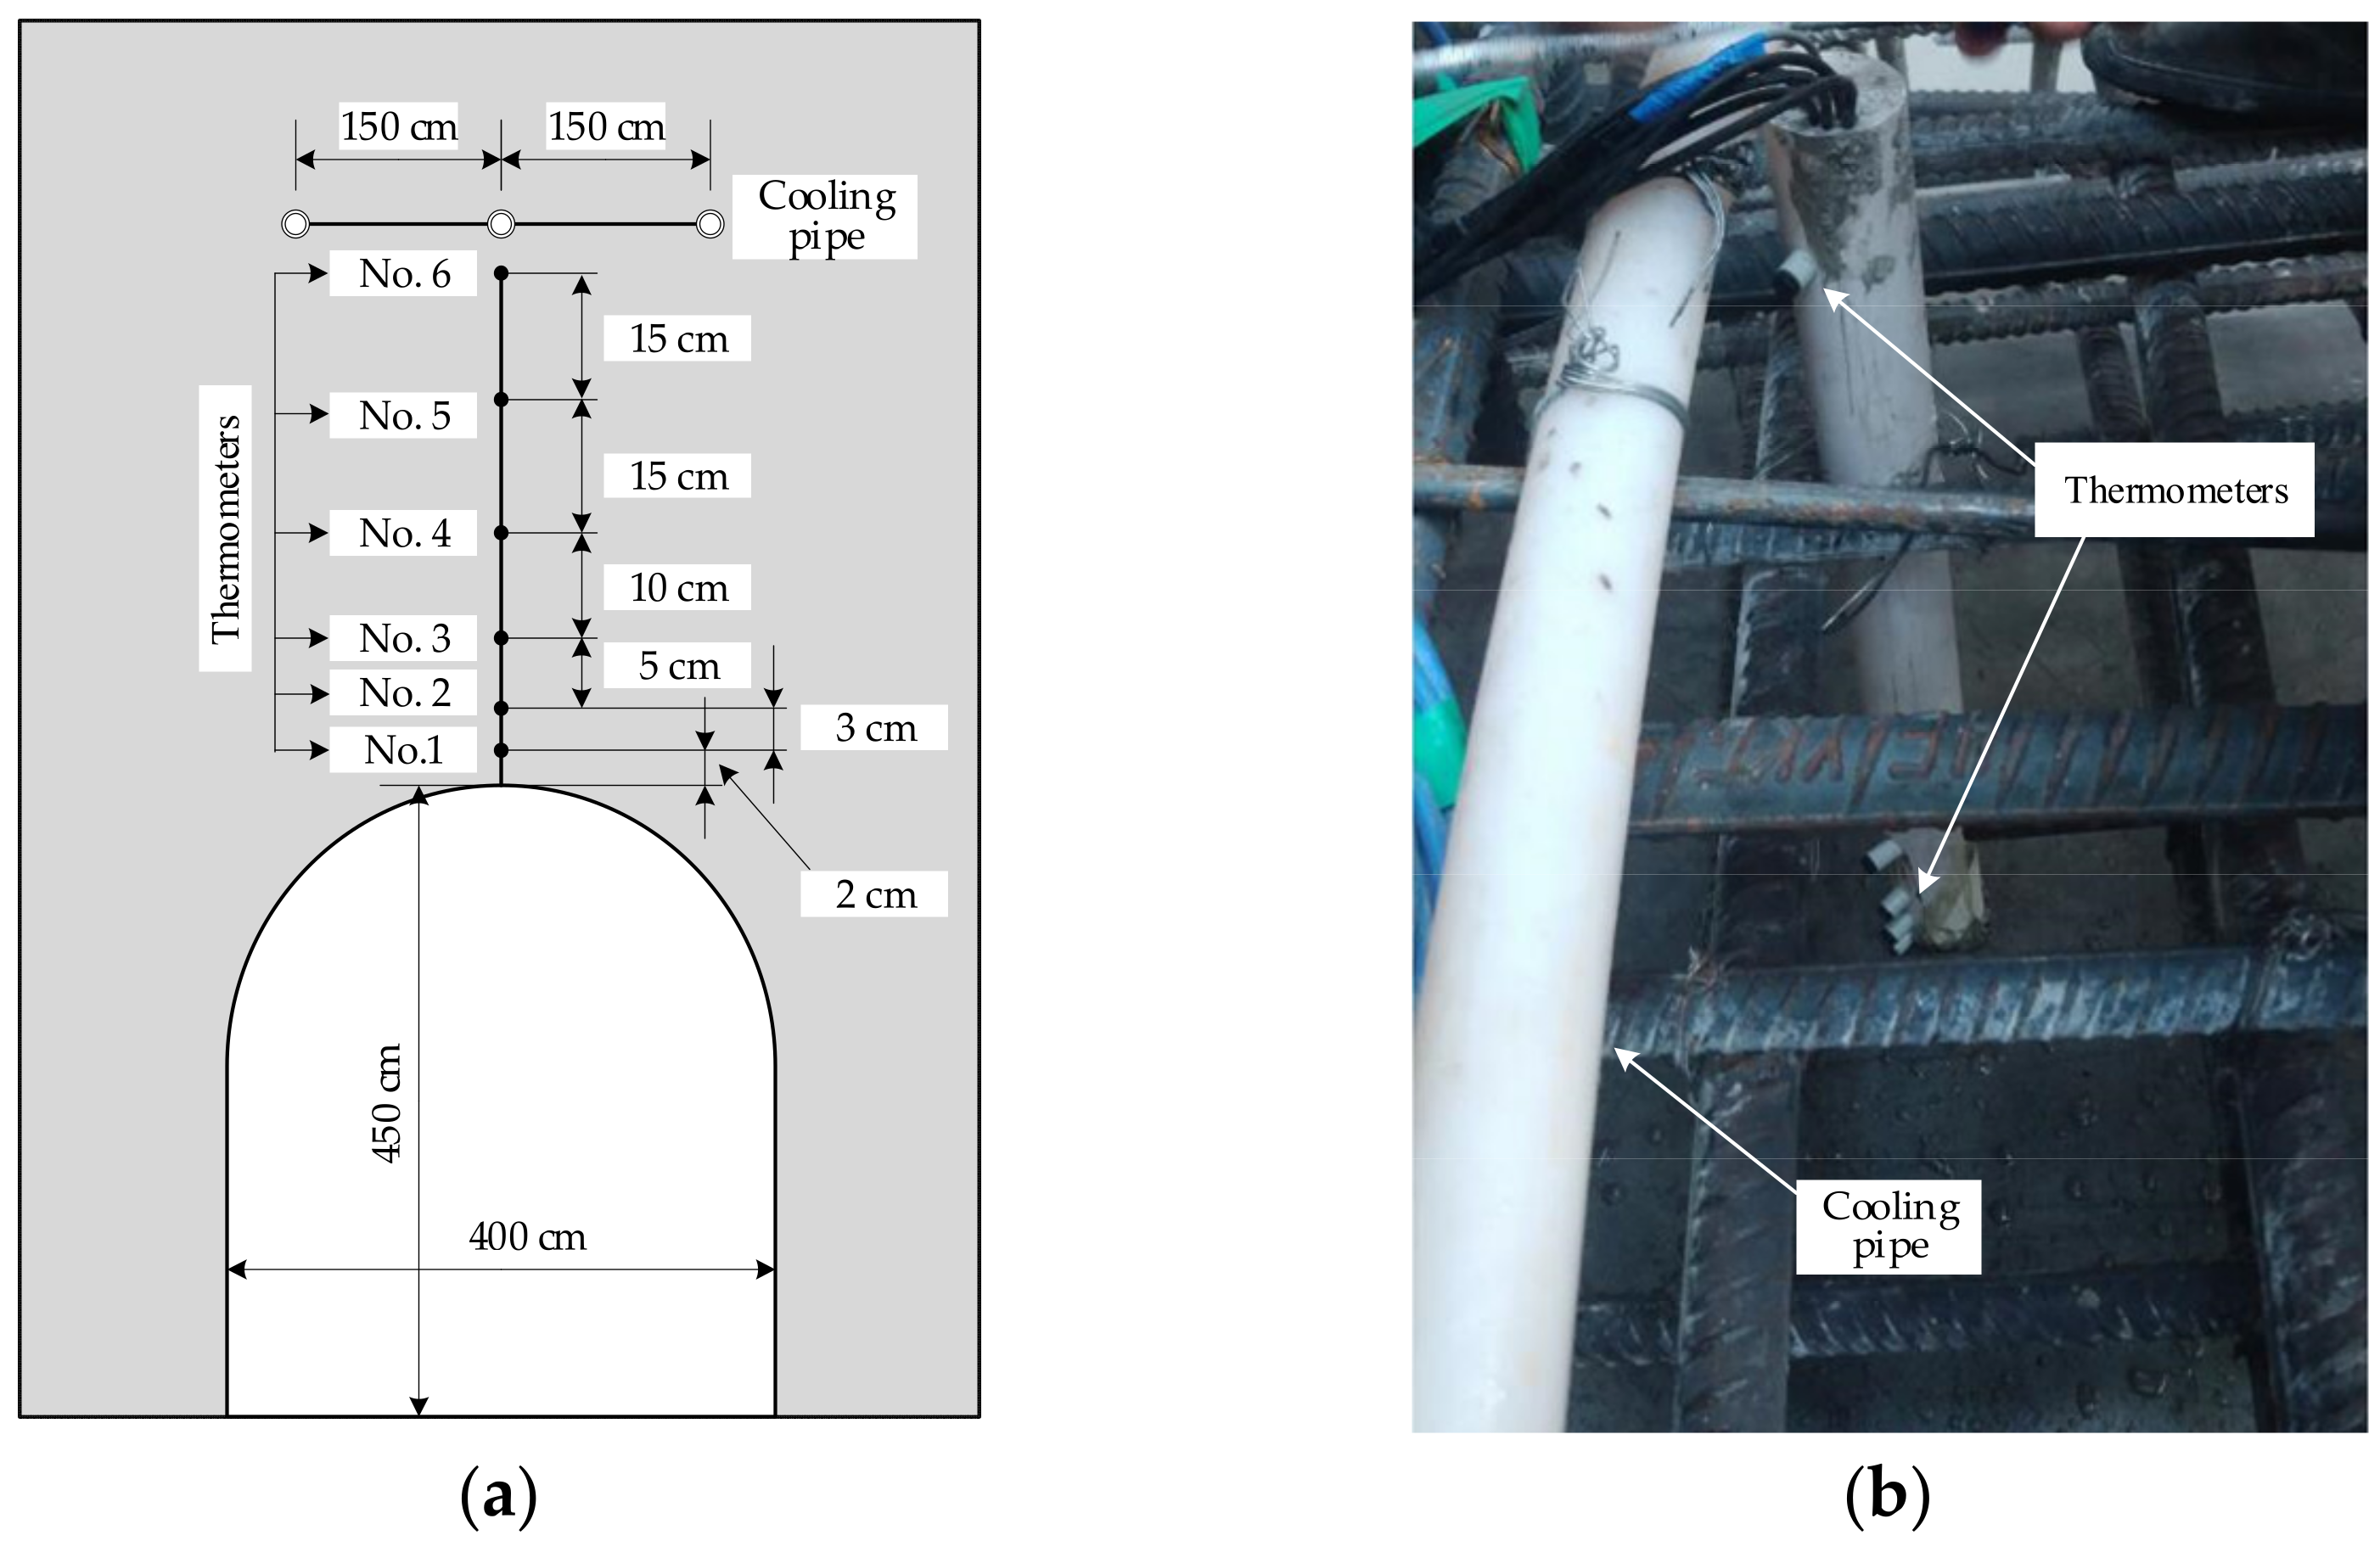
- A case study based on the real temperature and humidity data of a dam gallery shows that the development of the strength and fracture parameters in the shallow surface concrete, within 2 cm of the gallery top arch, is greatly affected by the ambient temperature and humidity.
- (6)
- In engineering, when the strength and fracture parameters of the gallery concrete, determined by the method proposed in this study, are much lower compared with the values obtained by the traditional method, special attention should be paid to whether the strength and fracture parameters of the dam gallery concrete meet the requirements of bearing capacity.
Author Contributions
Funding
Institutional Review Board Statement
Informed Consent Statement
Data Availability Statement
Conflicts of Interest
References
- Li, Q.B.; Lin, P. Demonstration on intelligent dam. J. Hydroelectr. Eng. 2014, 33, 139–146. Available online: http://www.slfdxb.cn/CN/Y2014/V33/I1/139 (accessed on 4 January 2022). (In Chinese).
- Zhong, D.H.; Shi, M.N.; Gui, B.; Wang, J.J.; Guan, T. Research progress of the intelligent construction of dams. J. Hydraulic. Eng. 2019, 50, 38–52+61. (In Chinese) [Google Scholar] [CrossRef]
- Tan, Y.S.; Fan, Q.X.; Wang, Z.L.; Chen, W.F.; Guo, Z.G.; Lin, E.D.; Lin, P.; Zhou, T.G.; Zhou, M.X.; Liu, C.F.; et al. Intelligent construction methods for the Baihetan super high arch dam. J. Tsinghua Univ. (Sci. Technol.) 2021, 61, 694–704. (In Chinese) [Google Scholar] [CrossRef]
- Lin, P.; Wei, P.C.; Wang, W.H.; Huang, H.F. Cracking Risk and Overall Stability Analysis of Xulong High Arch Dam: A Case Study. Appl. Sci. 2018, 8, 2555. [Google Scholar] [CrossRef] [Green Version]
- Lin, P.; Guan, J.F.; Peng, H.Y.; Shi, J. Horizontal cracking and crack repair analysis of a super high arch dam based on fracture toughness. Eng. Fail. Anal. 2019, 97, 72–90. [Google Scholar] [CrossRef]
- Lin, P.; Zhou, W.Y.; Liu, H.Y. Experimental study on cracking: Reinforcement and overall stability of the Xiaowan super-high arch dam. Rock. Mech. Rock. Eng. 2015, 48, 819–841. [Google Scholar] [CrossRef]
- Wieland, M.; Kirchen, G.F. Long-term dam safety monitoring of Punt dal Gall arch dam in Switzerland. Front. Struct. Civ. Eng. 2012, 6, 76–83. [Google Scholar] [CrossRef]
- Malla, S.; Wieland, M. Analysis of an arch-gravity dam with a horizontal crack. Comput. Struct. 1999, 72, 267–278. [Google Scholar] [CrossRef]
- Ma, K.; Zhuang, D.Y.; Tang, J.A.; Jin, F.; Tang, S.B. Study on formation causes of gallery cracks in Dagangshan high arch dam based on microseismic monitoring. Chin. J. Rock. Mech. Eng. 2018, 37, 1608–1617. [Google Scholar] [CrossRef]
- Mcdonald, J.E.; Curtis, N.F. Repair and Rehabilitation of Dams: Case Studies; U.S. Army Engineer Research and Development Center: Vicksburg, MS, USA, 1999. [Google Scholar]
- Froehlich, D.; Kapoor, V.; Flint, E. India’s large dams are showing their age. Part 1: Concrete and masonry dams-examples from drip. In Proceedings of the Third National Dam Safety Conference, Roorkee, India, 18–19 February 2017. [Google Scholar]
- Mirzabozorg, H.; Ghaemian, M.; Roohezamin, A. The reason of cracking in bottom gallery of SefidRud Buttress Dam and earthquake and post earthquake performance. Struct. Monit. Maint. 2019, 6, 103–124. [Google Scholar] [CrossRef]
- Wang, W.M.; Ding, J.X.; Wang, G.J.; Zou, L.C.; Chen, S.H. Stability analysis of the temperature cracks in Xiaowan arch dam. Sci. China. Technol. Sc. 2011, 54, 547–555. [Google Scholar] [CrossRef]
- Lv, Y.N.; Li, T.; Lin, P.B.; Huang, J.W. Cause analysis and effect of gallery cracks on dam block 19 at Shaxikou dam. Dam Saf. 2007, 4, 36–38. Available online: http://magtech.dam.com.cn/CN/Y2007/V0/I4/36 (accessed on 4 January 2022). (In Chinese).
- Lin, P.; Ning, Z.Y.; Shi, J.; Liu, C.; Chen, W.F.; Tan, Y.S. Study on the gallery structure cracking mechanisms and cracking control in dam construction site. Eng. Fail. Anal. 2021, 121, 105–135. [Google Scholar] [CrossRef]
- Mi, Z.X.; Li, Q.B.; Hu, Y.; Liu, C.F.; Qiao, Y. Fracture Properties of Concrete in Dry Environments with Different Curing Temperatures. Appl. Sci. 2020, 10, 4734. [Google Scholar] [CrossRef]
- Viviani, M.; Lanzoni, L.; Savino, V.; Tarantino, A.M. An Auto-Calibrating Semi-Adiabatic Calorimetric Methodology for Strength Prediction and Quality Control of Ordinary and Ultra-High-Performance Concretes. Materials 2022, 15, 96. [Google Scholar] [CrossRef] [PubMed]
- Mi, Z.X.; Hu, Y.; Li, Q.B.; An, Z.Z. Effect of curing humidity on the fracture properties of concrete. Constr. Build. Mater. 2018, 169, 403–413. [Google Scholar] [CrossRef]
- Brzozowski, P.; Strzałkowski, J.; Rychtowski, P.; Wróbel, R.; Tryba, B.; Horszczaruk, E. Effect of Nano-SiO2 on the microstructure and mechanical properties of concrete under high temperature conditions. Materials 2022, 15, 166. [Google Scholar] [CrossRef]
- Mahmood, W.; Khan, A.-u.-R.; Ayub, T. Carbonation Resistance in Ordinary Portland Cement Concrete with and without Recycled Coarse Aggregate in Natural and Simulated Environment. Sustainability 2022, 14, 437. [Google Scholar] [CrossRef]
- Fan, Q.X.; Duan, Y.H.; Wang, Y.Z.; Wang, X.H.; Yang, S.M.; Kang, X.S. Intelligent closed-loop control of concrete moisture levels. J. Tsinghua Univ. (Sci. Tech.) 2021, 61, 671–680. (In Chinese) [Google Scholar] [CrossRef]
- Gao, X.F.; Hu, Y.; Yang, N.; Wu, K.; Zhong, Y.H.; Tan, Y.S.; Li, Q.B. Method for determining real strength of full-graded low-heat cement concrete. J. Hydroelectr. Eng. 2021, 40, 91–104. (In Chinese) [Google Scholar] [CrossRef]
- Kim, J.; Han, S.H.; Song, Y.C. Effect of temperature and aging on the mechanical properties of concrete. Part 1: Experimental results. Cem. Concr. Res. 2002, 32, 1087–1094. [Google Scholar] [CrossRef]
- Castellano, C.C.; Bonavetti, V.L.; Donza, H.A.; Irassar., E.F. The effect of w/b and temperature on the hydration and strength of blastfurnace slag cements. Constr. Build. Mater. 2016, 111, 679–688. [Google Scholar] [CrossRef]
- Lee, C.; Lee, S.; Nguyen, N. Modeling of compressive strength development of high-early-strength-concrete at different curing temperatures. Int. J. Concr. Struct. Mater. 2016, 10, 205–219. [Google Scholar] [CrossRef] [Green Version]
- Shoukry, S.N.; William, G.W.; Downie, B.; Riad, M.Y. Effect of moisture and temperature on the mechanical properties of concrete. Constr. Build. Mater. 2011, 25, 688–696. [Google Scholar] [CrossRef]
- Li, Q.B.; Guan, J.F.; Wu, Z.M.; Dong, W.; Zhou, S.W. Equivalent maturity for ambient temperature effect on fracture parameters of site-casting dam concrete. Constr. Build. Mater. 2016, 120, 293–308. [Google Scholar] [CrossRef]
- Yu, B.J.; Ansari, F. Method and theory for nondestructive determination of fracture energy in concrete structures. Struct. J. 1996, 93, 602–613. [Google Scholar] [CrossRef]
- Mi, Z.X.; Hu, Y.; Li, Q.B.; Zhu, H. Elevated temperature inversion phenomenon in fracture properties of concrete and its application to maturity model. Eng. Fract. Mech. 2018, 199, 294–307. [Google Scholar] [CrossRef]
- Mi, Z.X.; Hu, Y.; Li, Q.B.; Gao, X.F.; Yin, T. Maturity model for fracture properties of concrete considering coupling effect of curing temperature and humidity. Constr. Build. Mater. 2019, 196, 1–13. [Google Scholar] [CrossRef]
- Powers, D.C. A discussion of cement hydration in relation to the curing of concrete. Highw. Res. Board Proc. 1948, 27, 178–188. [Google Scholar]
- Liao, W.C.; Lee, B.J.; Kang, C.W. A humidity-adjusted maturity function for the early age strength prediction of concrete. Cem. Concr. Comp. 2008, 30, 515–523. [Google Scholar] [CrossRef]
- Liang, J.L.; Wang, H.; Zhang, Q. Effect of curing temperature and humidity conditions on flexural tensile strength of pavement cement concrete. J. Highw. Transp. Res. Dev. 2011, 28, 32–38. (In Chinese) [Google Scholar] [CrossRef]
- Cebeci, O.Z. Strength of concrete in warm and dry environment. Mater. Struct. 1987, 20, 270–272. [Google Scholar] [CrossRef]
- Saengsoy, W.; Nawa, T.; Termkhajornkit, P. Influence of relative humidity on compressive strength of fly ash cement paste. J. Struct. Constr. Eng. 2008, 73, 1433–1441. [Google Scholar] [CrossRef] [Green Version]
- Un, H.; Baradan, B. The effect of curing temperature and relative humidity on the strength development on the Portland cement mortar. Sci. Res. Essays 2011, 6, 2504–2511. Available online: https://academicjournals.org/journal/SRE/article-abstract/DE9732F23029 (accessed on 4 January 2022).
- Bazant, Z.P.; Prat, P.C. Effect of temperature and humidity on the fracture energy of concrete. Aci. Mater. J. 1988, 85, 262–271. [Google Scholar] [CrossRef]
- Lau, D.; Buyukozturk, O. Fracture characterization of concrete/epoxy interface affected by moisture. Mech. Mater. 2010, 42, 1031–1042. [Google Scholar] [CrossRef]
- DL/T 5055-2007; Technical Specification of Fly Ash for Use in Hydraulic Concrete. National Development and Reform Commission: Beijing, China, 2007. (In Chinese)
- DL/T 5150-2017; Test Code for Hydraulic Concrete. National Energy Administration: Beijing, China, 2017. (In Chinese)
- Xu, S.L.; Reinhardt, H.W. Determination of Double-K criterion for crack propagation in quasi-brittle fracture. Part III: Compact tension specimens and wedge splitting specimens. Int. J. Fract. 1999, 98, 179–193. [Google Scholar] [CrossRef]
- Nurse, R.W. Steam curing of concrete. Mag. Concr. Res. 1949, 1, 79–88. [Google Scholar] [CrossRef]
- Saul, A.G.A. Principles underlying the steam curing of concrete at atmospheric pressure. Mag. Concr. Res. 1951, 2, 127–140. [Google Scholar] [CrossRef]
- Rastrup, E. Heat of hydration in concrete. Mag. Concr. Res. 1954, 6, 79–92. [Google Scholar] [CrossRef]
- Freiesleben Hansen, P.; Pedersen, E.J. Maturity computer for controlling curing and hardening of concrete. Nord. Betong. 1977, 1, 21–25. [Google Scholar]
- Malhotra, V.M.; Carino, N.J. Handbook on Nondestructive Testing of Concrete; CRC Press: Boca Raton, FL, USA, 1991. [Google Scholar]
- ASTM C1074-11; Standard Practice for Estimating Concrete Strength by the Maturity Method. ASTM International: West Conshohocken, PA, USA, 2011.
- Plowman, J.M. Maturity and the strength of concrete. Mag. Concr. Res. 1956, 8, 13–22. [Google Scholar] [CrossRef]
- Utepov, Y.; Aniskin, A.; Tulebekova, A.; Aldungarova, A.; Zharassov, S.; Sarsembayeva, A. complex maturity method for estimating the concrete strength based on curing temperature, ambient temperature and relative humidity. Appl. Sci. 2021, 11, 7712. [Google Scholar] [CrossRef]
- Freiesleben Hansen, P.; Pedersen, E.J. Curing of concrete structures. CEB Inf. Bull. 1985, 166. [Google Scholar]


| Water (kg/m3) | Cement (kg/m3) | Fly Ash (kg/m3) | Sand (kg/m3) | Aggregate (kg/m3) | High-Range Water Reducing Admixture (kg/m3) | Air-Entraining Agent (kg/m3) | |
|---|---|---|---|---|---|---|---|
| 5–20 (mm) | 20–40 (mm) | ||||||
| 112 | 173 | 93 | 687 | 669 | 669 | 1.33 | 0.093 |
| Composition | CaO | SiO2 | Al2O3 | Fe2O3 | MgO | SO3 | K2O | Na2O | R2O | Others |
|---|---|---|---|---|---|---|---|---|---|---|
| Cement | 60.66 | 22.92 | 3.27 | 4.58 | 4.02 | 2.50 | 0.46 | 0.17 | 0.47 | 0.95 |
| Fly ash | 3.25 | 55.58 | 21.68 | 8.99 | 1.30 | 0.35 | 1.16 | 0.20 | 0.96 | 6.53 |
| Curing Conditions | Temperature (°C) | Humidity (%) | Specimen Size (mm × mm × mm) | Number of Specimens | Number of Groups | Measured Parameters | Test Ages (Days) |
|---|---|---|---|---|---|---|---|
| T10RH98 | 10 | 98 | 150 × 150 × 150 | 30 | 10 | fc, ft | 7, 14, 28, 60, 90 |
| φ150 × 300 | 30 | 5 | facs, Ec | ||||
| 330 × 300 × 120 | 15 | 5 | KIC, GF | ||||
| T20RH98 | 20 | 98 | 150 × 150 × 150 | 30 | 10 | fc, ft | 7, 14, 28, 60, 90 |
| φ150 × 300 | 30 | 5 | facs, Ec | ||||
| 330 × 300 × 120 | 15 | 5 | KIC, GF | ||||
| T40RH98 | 40 | 98 | 150 × 150 × 150 | 30 | 10 | fc, ft | 7, 14, 28, 60, 90 |
| φ150 × 300 | 30 | 5 | facs, Ec | ||||
| 330 × 300 × 120 | 15 | 5 | KIC, GF | ||||
| T20RH60 | 20 | 60 | 150 × 150 × 150 | 30 | 10 | fc, ft | 7, 14, 28, 60, 90 |
| φ150 × 300 | 30 | 5 | facs, Ec | ||||
| 330 × 300 × 120 | 15 | 5 | KIC, GF | ||||
| T20RH30 | 20 | 30 | 150 × 150 × 150 | 30 | 10 | fc, ft | 7, 14, 28, 60, 90 |
| φ150 × 300 | 30 | 5 | facs, Ec | ||||
| 330 × 300 × 120 | 15 | 5 | KIC, GF |
| Curing Conditions | Test Age (Days) | fc (MPa) [Mean (Standard Deviation)] | ft (MPa) [Mean (Standard Deviation)] | facs (MPa) [Mean (Standard Deviation)] | Ec (GPa) [Mean (Standard Deviation)] |
|---|---|---|---|---|---|
| T10RH98 | 7 | 11.92 (0.53) | 0.98 (0.05) | 7.71 (0.23) | 22.27 (0.59) |
| 14 | 16.58 (0.16) | 1.29 (0.07) | 13.37 (0.44) | 26.93 (1.67) | |
| 28 | 23.93 (1.52) | 1.93 (0.11) | 17.77 (0.65) | 31.05 (1.15) | |
| 60 | 30.88 (1.50) | 2.25 (0.14) | 24.89 (1.77) | 35.23 (1.27) | |
| 90 | 33.92 (1.88) | 2.51 (0.13) | 27.99 (1.93) | 38.35 (1.24) | |
| T20RH98 | 7 | 17.61 (0.76) | 1.26 (0.05) | 11.61 (0.65) | 25.50 (0.37) |
| 14 | 24.03 (1.10) | 1.86 (0.05) | 19.03 (1.29) | 30.25 (1.10) | |
| 28 | 30.05 (0.95) | 2.26 (0.14) | 25.69 (0.84) | 35.42 (0.47) | |
| 60 | 38.86 (1.93) | 2.63 (0.09) | 30.40 (0.77) | 39.73 (0.70) | |
| 90 | 42.03 (1.15) | 2.93 (0.12) | 35.12 (1.58) | 41.15 (0.56) | |
| T40RH98 | 7 | 24.41 (1.58) | 1.76 (0.09) | 18.77 (1.08) | 30.02 (1.57) |
| 14 | 33.70 (1.45) | 2.34 (0.11) | 27.28 (0.64) | 35.62 (1.48) | |
| 28 | 37.43 (1.46) | 2.73 (0.16) | 30.68 (0.70) | 39.20 (0.64) | |
| 60 | 46.68 (2.27) | 3.16 (0.13) | 37.46 (1.18) | 44.40 (1.25) | |
| 90 | 50.79 (1.31) | 3.31 (0.13) | 39.67 (1.48) | 46.77 (2.03) | |
| T20RH60 | 7 | 15.49 (0.81) | 1.27 (0.05) | 10.71 (0.63) | 24.25 (0.61) |
| 14 | 18.57 (0.94) | 1.55 (0.04) | 14.90 (0.44) | 27.12 (0.14) | |
| 28 | 25.05 (0.89) | 1.86 (0.06) | 20.77 (1.02) | 31.43 (0.94) | |
| 60 | 32.60 (1.50) | 2.28 (0.12) | 26.37 (1.29) | 37.08 (1.07) | |
| 90 | 36.30 (1.94) | 2.51 (0.08) | 29.06 (1.01) | 38.82 (1.13) | |
| T20RH30 | 7 | 14.32 (0.89) | 1.24 (0.08) | 10.78 (0.54) | 24.00 (0.58) |
| 14 | 16.97 (0.76) | 1.45 (0.08) | 12.56 (0.77) | 25.98 (0.57) | |
| 28 | 19.89 (0.97) | 1.62 (0.11) | 16.29 (0.74) | 28.12 (0.91) | |
| 60 | 25.20 (0.81) | 1.91 (0.08) | 21.32 (1.41) | 33.08 (0.14) | |
| 90 | 30.73 (1.13) | 2.23 (0.10) | 24.83 (1.38) | 35.03 (1.38) |
| Curing Conditions | Age (Days) | FHmax (kN) [Mean (Standard Deviation)] | CMODC (µm) [Mean (Standard Deviation)] | ac (mm) [Mean (Standard Deviation)] | KIC (MPa·m0.5) [Mean (Standard Deviation)] | GF (N/m) [Mean (Standard Deviation)] |
|---|---|---|---|---|---|---|
| T = 10 °C, RH = 98% | 7 | 5.65 (0.26) | 87.45 (4.63) | 161.21 (6.53) | 1.03 (0.03) | 148.18 (4.29) |
| 14 | 6.99 (0.15) | 95.20 (0.85) | 160.09 (2.72) | 1.22 (0.02) | 165.49 (3.99) | |
| 28 | 7.66 (0.34) | 125.67 (16.81) | 155.98 (5.29) | 1.29 (0.03) | 195.44 (3.98) | |
| 60 | 9.14 (0.33) | 122.85 (6.24) | 157.64 (3.87) | 1.55 (0.04) | 226.46 (6.89) | |
| 90 | 10.19 (0.21) | 132.31 (16.87) | 153.46 (3.00) | 1.66 (0.06) | 259.27 (5.88) | |
| T = 20 °C, RH = 98% | 7 | 6.70 (0.20) | 108.36 (5.04) | 157.20 (3.98) | 1.18 (0.02) | 167.50 (6.69) |
| 14 | 8.43 (0.46) | 125.40 (9.95) | 153.00 (9.10) | 1.37 (0.05) | 192.22 (4.29) | |
| 28 | 9.48 (0.24) | 88.80 (14.06) | 145.63 (5.52) | 1.43 (0.04) | 240.82 (9.25) | |
| 60 | 10.53 (0.48) | 131.99 (16.95) | 155.18 (6.33) | 1.74 (0.03) | 262.67 (3.75) | |
| 90 | 11.53 (0.48) | 130.49 (14.88) | 154.08 (5.95) | 1.86 (0.08) | 282.20 (9.58) | |
| T = 40 °C, RH = 98% | 7 | 7.46 (0.27) | 123.01 (13.98) | 157.68 (3.53) | 1.28 (0.03) | 185.92 (9.02) |
| 14 | 9.42 (0.28) | 115.53 (10.41) | 151.6 (5.94) | 1.51 (0.05) | 224.62 (2.26) | |
| 28 | 10.25 (0.40) | 136.50 (6.01) | 155.24 (5.01) | 1.70 (0.04) | 257.95 (5.53) | |
| 60 | 11.72 (0.54) | 125.55 (9.90) | 153.32 (8.12) | 1.91 (0.07) | 288.67 (6.76) | |
| 90 | 12.57 (0.44) | 115.59 (10.50) | 154.12 (5.36) | 2.06 (0.06) | 295.30 (6.04) | |
| T = 20 °C, RH = 60% | 7 | 6.20 (0.28) | 110.26 (14.34) | 158.59 (6.77) | 1.08 (0.06) | 158.53 (11.43) |
| 14 | 7.05 (0.12) | 126.67 (29.80) | 165.51 (4.85) | 1.27 (0.02) | 169.69 (5.60) | |
| 28 | 7.79 (0.13) | 141.92 (9.76) | 160.29 (1.26) | 1.36 (0.01) | 204.82 (11.34) | |
| 60 | 9.29 (0.07) | 125.47 (37.99) | 156.59 (2.30) | 1.56 (0.05) | 240.95 (0.67) | |
| 90 | 9.71 (0.13) | 141.17 (20.20) | 159.07 (4.91) | 1.67 (0.07) | 249.95 (15.52) | |
| T = 20 °C, RH = 30% | 7 | 5.95 (0.14) | 86.95 (11.54) | 150.43 (5.48) | 0.98 (0.05) | 153.92 (0.59) |
| 14 | 6.34 (0.25) | 125.21 (18.87) | 163.37 (5.10) | 1.14 (0.02) | 157.68 (13.01) | |
| 28 | 7.30 (0.01) | 106.82 (14.66) | 154.08 (3.17) | 1.19 (0.04) | 174.26 (6.55) | |
| 60 | 8.50 (0.45) | 111.18 (20.77) | 151.79 (9.67) | 1.36 (0.06) | 210.31 (12.15) | |
| 90 | 8.73 (0.25) | 108.65 (21.09) | 157.29 (4.85) | 1.48 (0.04) | 212.25 (8.03) |
| Test Age (Days) | Equivalent Age (Days) (RH = 98%) | Equivalent Age (Days) (T = 20 °C) | |||
|---|---|---|---|---|---|
| T = 10 °C | T = 20 °C | T = 40 °C | RH = 60% | RH = 30% | |
| 7 | 3.48 | 7.00 | 16.85 | 4.72 | 3.00 |
| 14 | 6.96 | 14.00 | 33.71 | 9.15 | 5.51 |
| 28 | 13.92 | 28.00 | 67.42 | 17.79 | 10.13 |
| 60 | 29.82 | 60.00 | 144.46 | 37.26 | 20.20 |
| 90 | 44.73 | 90.00 | 216.70 | 55.40 | 29.46 |
| Actual Age (Days) | Equivalent Age (Days) Calculated by Temperature History | Equivalent Age (Days) Calculated by Temperature and Humidity History | ||||||||
|---|---|---|---|---|---|---|---|---|---|---|
| Measured by Thermometer | Measured by Weather Station Installed | Measured by Weather Station Installed | ||||||||
| No. 1 | No. 2 | No. 3 | No. 4 | No. 5 | No. 6 | Outside the Gallery | Inside the Gallery | Outside the Gallery | Inside the Gallery | |
| 3 | 3.25 | 3.23 | 3.22 | 2.99 | 3.08 | 3.01 | 2.53 | 2.58 | 2.16 | 2.42 |
| 7 | 7.69 | 7.64 | 7.62 | 7.20 | 7.28 | 7.12 | 5.38 | 6.11 | 4.61 | 5.94 |
| 14 | 14.79 | 14.65 | 14.56 | 13.80 | 13.80 | 13.44 | 9.68 | 12.27 | 8.24 | 12.04 |
| 28 | 27.72 | 27.43 | 27.24 | 25.85 | 25.75 | 25.04 | 19.63 | 23.28 | 16.69 | 22.11 |
| 60 | 53.60 | 53.08 | 52.81 | 50.36 | 50.38 | 49.28 | 41.53 | 46.91 | 35.07 | 43.21 |
| 90 | 75.28 | 74.65 | 74.40 | 71.02 | 71.43 | 70.07 | 61.48 | 68.89 | 51.51 | 64.15 |
| Parameters | Standard Curing Conditions | Temperature Measured by Thermometer No. 6 | Temperature and Humidity Inside the Gallery | Temperature and Humidity Outside the Gallery | |||||||
|---|---|---|---|---|---|---|---|---|---|---|---|
| Actual Age (Days) | Theoretical Values | te (Days) | Model Predictions | Error of Theoretical Value (%) | te (Days) | Model Predictions | Error of Theoretical Value (%) | te (Days) | Model Predictions | Error of Theoretical Value (%) | |
| fc (MPa) | 3 | 10.20 | 3.01 | 10.23 | −0.29% | 2.42 | 8.22 | 24.09% | 2.16 | 7.19 | 41.86% |
| 7 | 17.90 | 7.12 | 18.06 | −0.89% | 5.94 | 16.41 | 9.08% | 4.61 | 14.11 | 26.86% | |
| 14 | 24.20 | 13.44 | 23.83 | 1.55% | 12.04 | 22.83 | 6.00% | 8.24 | 19.38 | 24.87% | |
| 28 | 30.50 | 25.04 | 29.49 | 3.42% | 22.11 | 28.35 | 7.58% | 16.69 | 25.80 | 18.22% | |
| 60 | 37.43 | 49.28 | 35.64 | 5.02% | 43.21 | 34.44 | 8.68% | 35.07 | 32.55 | 14.99% | |
| 90 | 41.11 | 70.07 | 38.84 | 5.84% | 64.15 | 38.04 | 8.07% | 51.51 | 36.04 | 14.07% | |
| ft (MPa) | 3 | 0.97 | 3.01 | 0.98 | −1.02% | 2.42 | 0.85 | 14.12% | 2.16 | 0.79 | 22.78% |
| 7 | 1.44 | 7.12 | 1.45 | −0.69% | 5.94 | 1.35 | 6.67% | 4.61 | 1.21 | 19.01% | |
| 14 | 1.82 | 13.44 | 1.80 | 1.11% | 12.04 | 1.74 | 4.60% | 8.24 | 1.53 | 18.95% | |
| 28 | 2.20 | 25.04 | 2.14 | 2.80% | 22.11 | 2.07 | 6.28% | 16.69 | 1.92 | 14.58% | |
| 60 | 2.62 | 49.28 | 2.51 | 4.38% | 43.21 | 2.44 | 7.38% | 35.07 | 2.33 | 12.45% | |
| 90 | 2.84 | 70.07 | 2.71 | 4.80% | 64.15 | 2.66 | 6.77% | 51.51 | 2.54 | 11.81% | |
| facs (MPa) | 3 | 7.19 | 3.01 | 7.22 | −0.42% | 2.42 | 5.52 | 30.25% | 2.16 | 4.65 | 54.62% |
| 7 | 13.71 | 7.12 | 13.85 | −1.01% | 5.94 | 12.46 | 10.03% | 4.61 | 10.50 | 30.57% | |
| 14 | 19.05 | 13.44 | 18.74 | 1.65% | 12.04 | 17.89 | 6.48% | 8.24 | 14.97 | 27.25% | |
| 28 | 24.39 | 25.04 | 23.53 | 3.65% | 22.11 | 22.57 | 8.06% | 16.69 | 20.40 | 19.56% | |
| 60 | 30.26 | 49.28 | 28.74 | 5.29% | 43.21 | 27.73 | 9.12% | 35.07 | 26.12 | 15.85% | |
| 90 | 33.38 | 70.07 | 31.45 | 6.14% | 64.15 | 30.77 | 8.48% | 51.51 | 29.08 | 14.79% | |
| Ec (GPa) | 3 | 21.75 | 3.01 | 21.77 | −0.09% | 2.42 | 20.49 | 6.15% | 2.16 | 19.84 | 9.63% |
| 7 | 26.67 | 7.12 | 26.77 | −0.37% | 5.94 | 25.72 | 3.69% | 4.61 | 24.25 | 9.98% | |
| 14 | 30.69 | 13.44 | 30.45 | 0.79% | 12.04 | 29.81 | 2.95% | 8.24 | 27.61 | 11.16% | |
| 28 | 34.71 | 25.04 | 34.06 | 1.91% | 22.11 | 33.34 | 4.11% | 16.69 | 31.71 | 9.46% | |
| 60 | 39.13 | 49.28 | 37.99 | 3.00% | 43.21 | 37.22 | 5.13% | 35.07 | 36.01 | 8.66% | |
| 90 | 41.48 | 70.07 | 40.03 | 3.62% | 64.15 | 39.51 | 4.99% | 51.51 | 38.24 | 8.47% | |
| KIC (MPa∙m0.5) | 3 | 0.95 | 3.01 | 0.96 | −1.04% | 2.42 | 0.90 | 5.56% | 2.16 | 0.87 | 9.20% |
| 7 | 1.17 | 7.12 | 1.17 | 0.00% | 5.94 | 1.13 | 3.54% | 4.61 | 1.06 | 10.38% | |
| 14 | 1.34 | 13.44 | 1.33 | 0.75% | 12.04 | 1.30 | 3.08% | 8.24 | 1.21 | 10.74% | |
| 28 | 1.51 | 25.04 | 1.49 | 1.34% | 22.11 | 1.45 | 4.14% | 16.69 | 1.38 | 9.42% | |
| 60 | 1.70 | 49.28 | 1.65 | 3.03% | 43.21 | 1.62 | 4.94% | 35.07 | 1.57 | 8.28% | |
| 90 | 1.80 | 70.07 | 1.74 | 3.45% | 64.15 | 1.72 | 4.65% | 51.51 | 1.67 | 7.78% | |
| GF (N/m) | 3 | 136.52 | 3.01 | 136.66 | −0.10% | 2.42 | 128.01 | 6.65% | 2.16 | 123.57 | 10.48% |
| 7 | 169.75 | 7.12 | 170.44 | −0.40% | 5.94 | 163.34 | 3.92% | 4.61 | 153.38 | 10.67% | |
| 14 | 196.93 | 13.44 | 195.34 | 0.81% | 12.04 | 191.01 | 3.10% | 8.24 | 176.16 | 11.79% | |
| 28 | 224.12 | 25.04 | 219.74 | 1.99% | 22.11 | 214.86 | 4.31% | 16.69 | 203.82 | 9.96% | |
| 60 | 254.01 | 49.28 | 246.29 | 3.13% | 43.21 | 241.14 | 5.34% | 35.07 | 232.95 | 9.04% | |
| 90 | 269.91 | 70.07 | 260.10 | 3.77% | 64.15 | 256.63 | 5.17% | 51.51 | 248.03 | 8.82% | |
Publisher’s Note: MDPI stays neutral with regard to jurisdictional claims in published maps and institutional affiliations. |
© 2022 by the authors. Licensee MDPI, Basel, Switzerland. This article is an open access article distributed under the terms and conditions of the Creative Commons Attribution (CC BY) license (https://creativecommons.org/licenses/by/4.0/).
Share and Cite
Gao, X.; Li, Q.; Liu, Z.; Zheng, J.; Wei, K.; Tan, Y.; Yang, N.; Liu, C.; Lu, Y.; Hu, Y. Modelling the Strength and Fracture Parameters of Dam Gallery Concrete Considering Ambient Temperature and Humidity. Buildings 2022, 12, 168. https://doi.org/10.3390/buildings12020168
Gao X, Li Q, Liu Z, Zheng J, Wei K, Tan Y, Yang N, Liu C, Lu Y, Hu Y. Modelling the Strength and Fracture Parameters of Dam Gallery Concrete Considering Ambient Temperature and Humidity. Buildings. 2022; 12(2):168. https://doi.org/10.3390/buildings12020168
Chicago/Turabian StyleGao, Xiaofeng, Qingbin Li, Zhihong Liu, Jiangnan Zheng, Kai Wei, Yaosheng Tan, Ning Yang, Chunfeng Liu, Yongjiu Lu, and Yu Hu. 2022. "Modelling the Strength and Fracture Parameters of Dam Gallery Concrete Considering Ambient Temperature and Humidity" Buildings 12, no. 2: 168. https://doi.org/10.3390/buildings12020168
APA StyleGao, X., Li, Q., Liu, Z., Zheng, J., Wei, K., Tan, Y., Yang, N., Liu, C., Lu, Y., & Hu, Y. (2022). Modelling the Strength and Fracture Parameters of Dam Gallery Concrete Considering Ambient Temperature and Humidity. Buildings, 12(2), 168. https://doi.org/10.3390/buildings12020168