


Is 24.9 °C Too Hot to Think? A Call to Raise Temperature Setpoints in Australian Offices

 ,
,  ,
, 
 , and
, and 
Abstract
:1. Introduction
2. Methodology
2.1. The NABERS Energy Dataset
2.1.1. NABERS Overview
- Tenancy Rating—covers just the small power, lighting and any supplementary air-conditioning installed by the tenant
- Base Building—covers just the common area services and the base building provided air-conditioning
- Whole Building—Includes both of the above.
2.1.2. NABERS Energy
- The energy consumed by the tenants
- Hours of occupancy
- The number of computers
- The production of a tenancy energy use estimate that can help inform the design, commissioning and operation of a new building; and
- The conversion of a building’s energy use estimate into a NABERS Energy rating.
2.2. Thermal Comfort and Air Quality
2.3. Post-Occupancy Evaluation (POE) Surveys
2.4. Simulation Model
2.4.1. Independent Variables
- Cooling set point (CSP): One of the major and more recurrent complaints in open offices relates to the thermal environment, hence one of the tested variables relates to the temperature set point. The current Australian Standard AS 1837–1976 recommends offices to maintain summer set point temperature in the range of 21 °C to 24 °C, range that is further extended by the government’s guideline for safety and health in workplaces up to 26 °C [31]. However, tenancy agreements often prescribe an indoor temperature of 22 °C all year around [32] despite evidence indicating the neutral temperature to be higher [18]. Hence, CSP was assumed ranging from 21 °C to 26 °C, with steps of 1 °C. It is important to note that hereby the setpoint temperature is defined as the operative temperature threshold at which the mechanical system will start to operate.
- Air change rate (ACH): The National Construction Code (NCC) of Australia [33] requires a minimum air change per hours equal to 7.5 L/pers. However, this value is currently being discussed after the global COVID-19 pandemic, which challenged all pre-assumptions on ventilation and fresh air rates to maintain healthy indoors [34]. Based on the increasing number of evidence [35,36], this analysis compared two ACH values, the first corresponding to an average standard value of 3 ACH, and the second reflecting an augmented indoor ventilation with 6ACH.
- Occupancy density (OCC): New open-plan and activity-based offices are designed to support social interactions, which can be correlated to an increased diversity and abundance of indoor microbes [37]. Social distancing as a way to avoid potential airborne transmissions may lead to different occupation profiles of spaces, which is further impacted by increased work from home practices. With a higher number of employees benefiting from remote working, offices are likely to implement flexible arrangements in the post-pandemic future. This analysis accounted for these potential changes in occupation profiles by considering three different scenarios: 100%, 70% and 50% of occupation density, starting from the UK National Calculation Method schedule [38].
2.4.2. Dependent Variables
2.4.3. Simulation Model
3. Results and Discussion
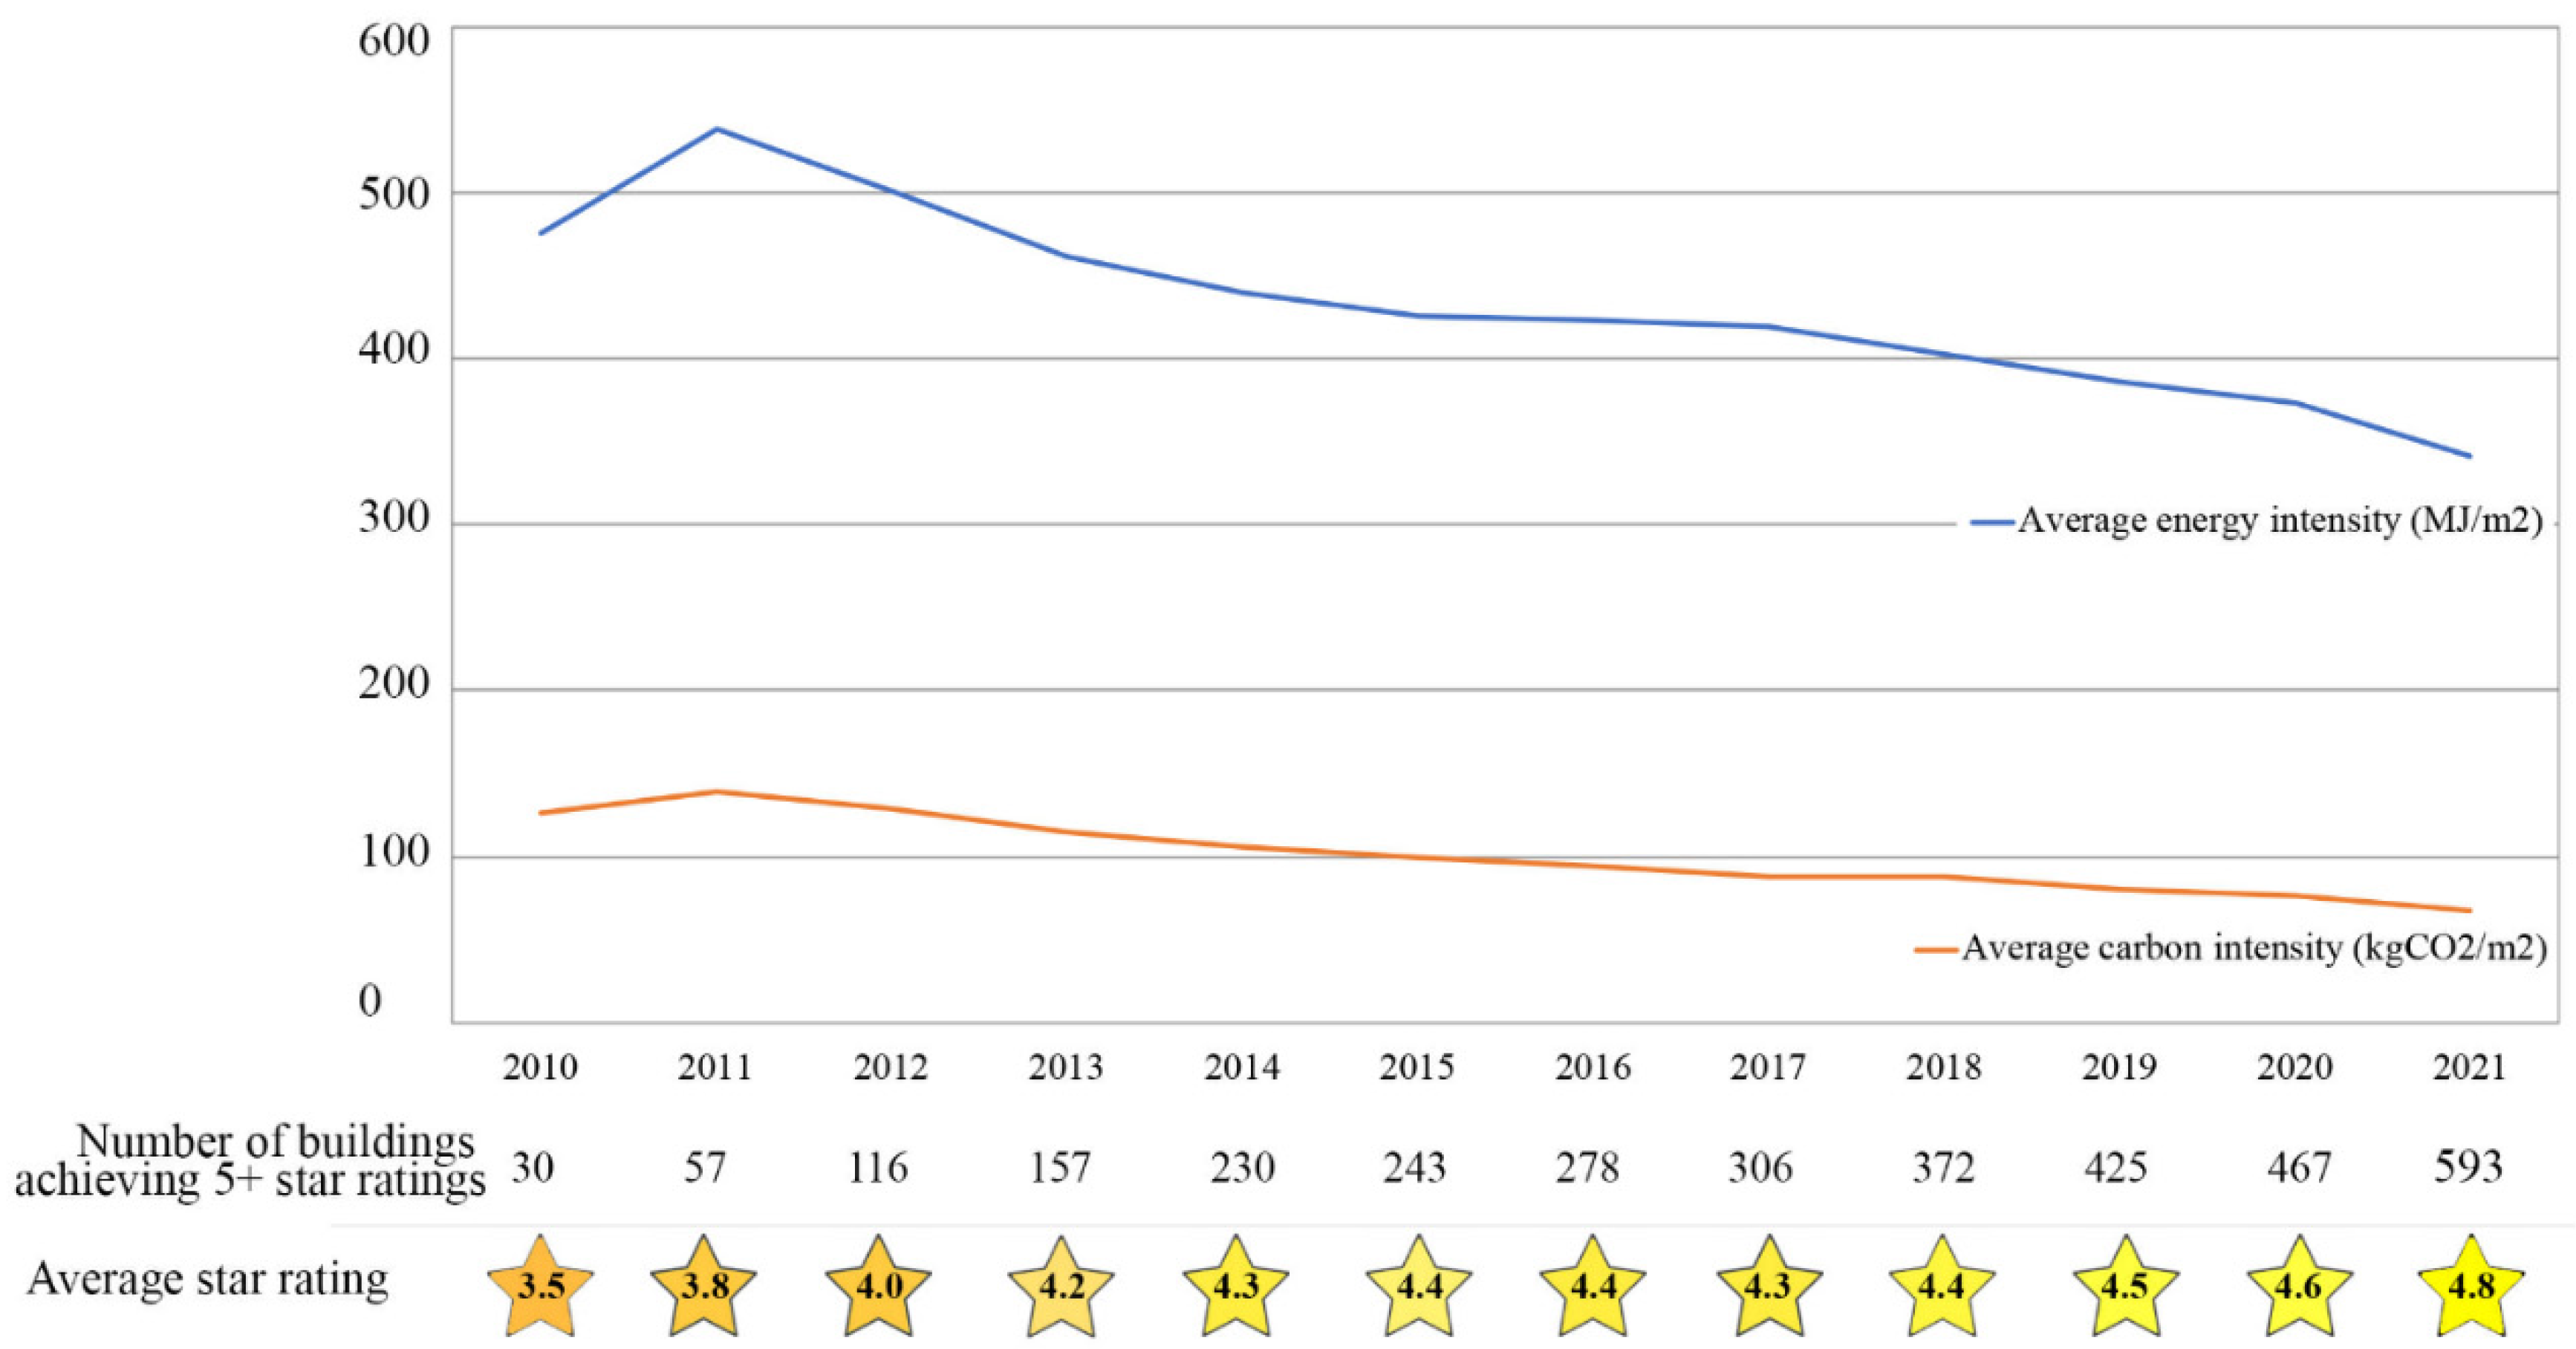
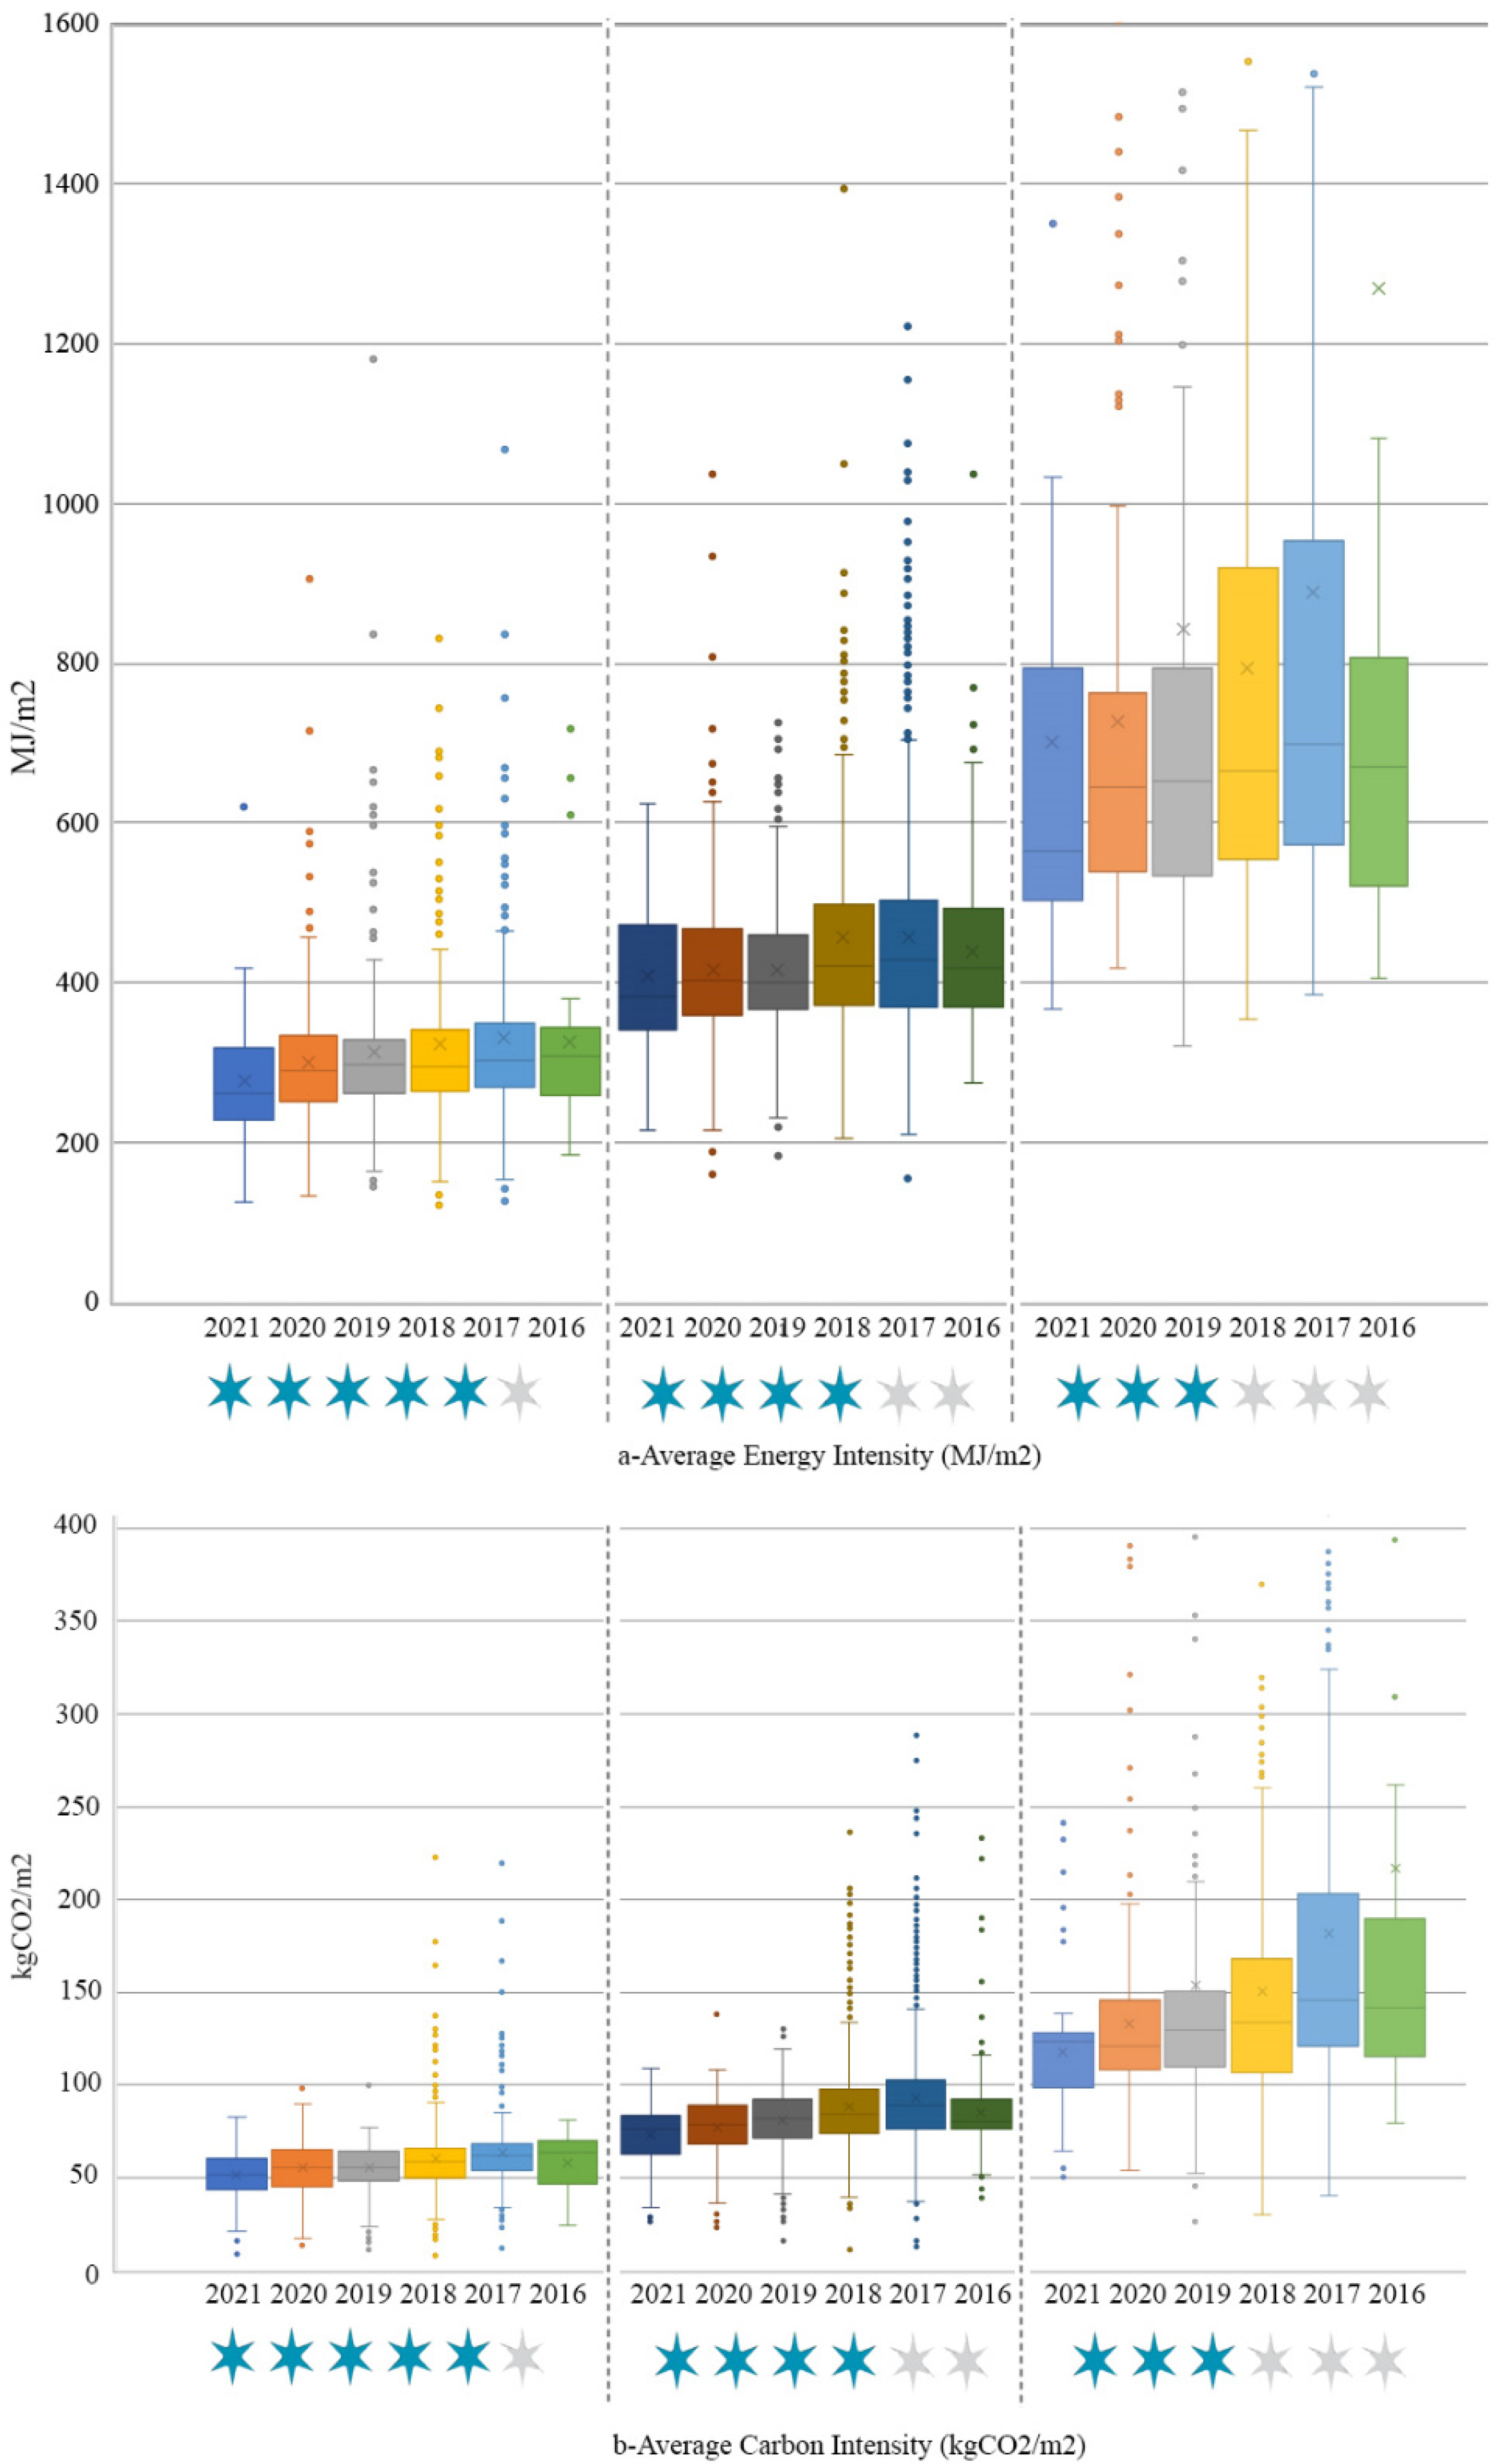
3.1. Mapping the Trends in NABERS Energy Data using NABERS 10-Year Dataset
3.2. Thermal Comfort and Air Quality in NABERS-Certified Buildings
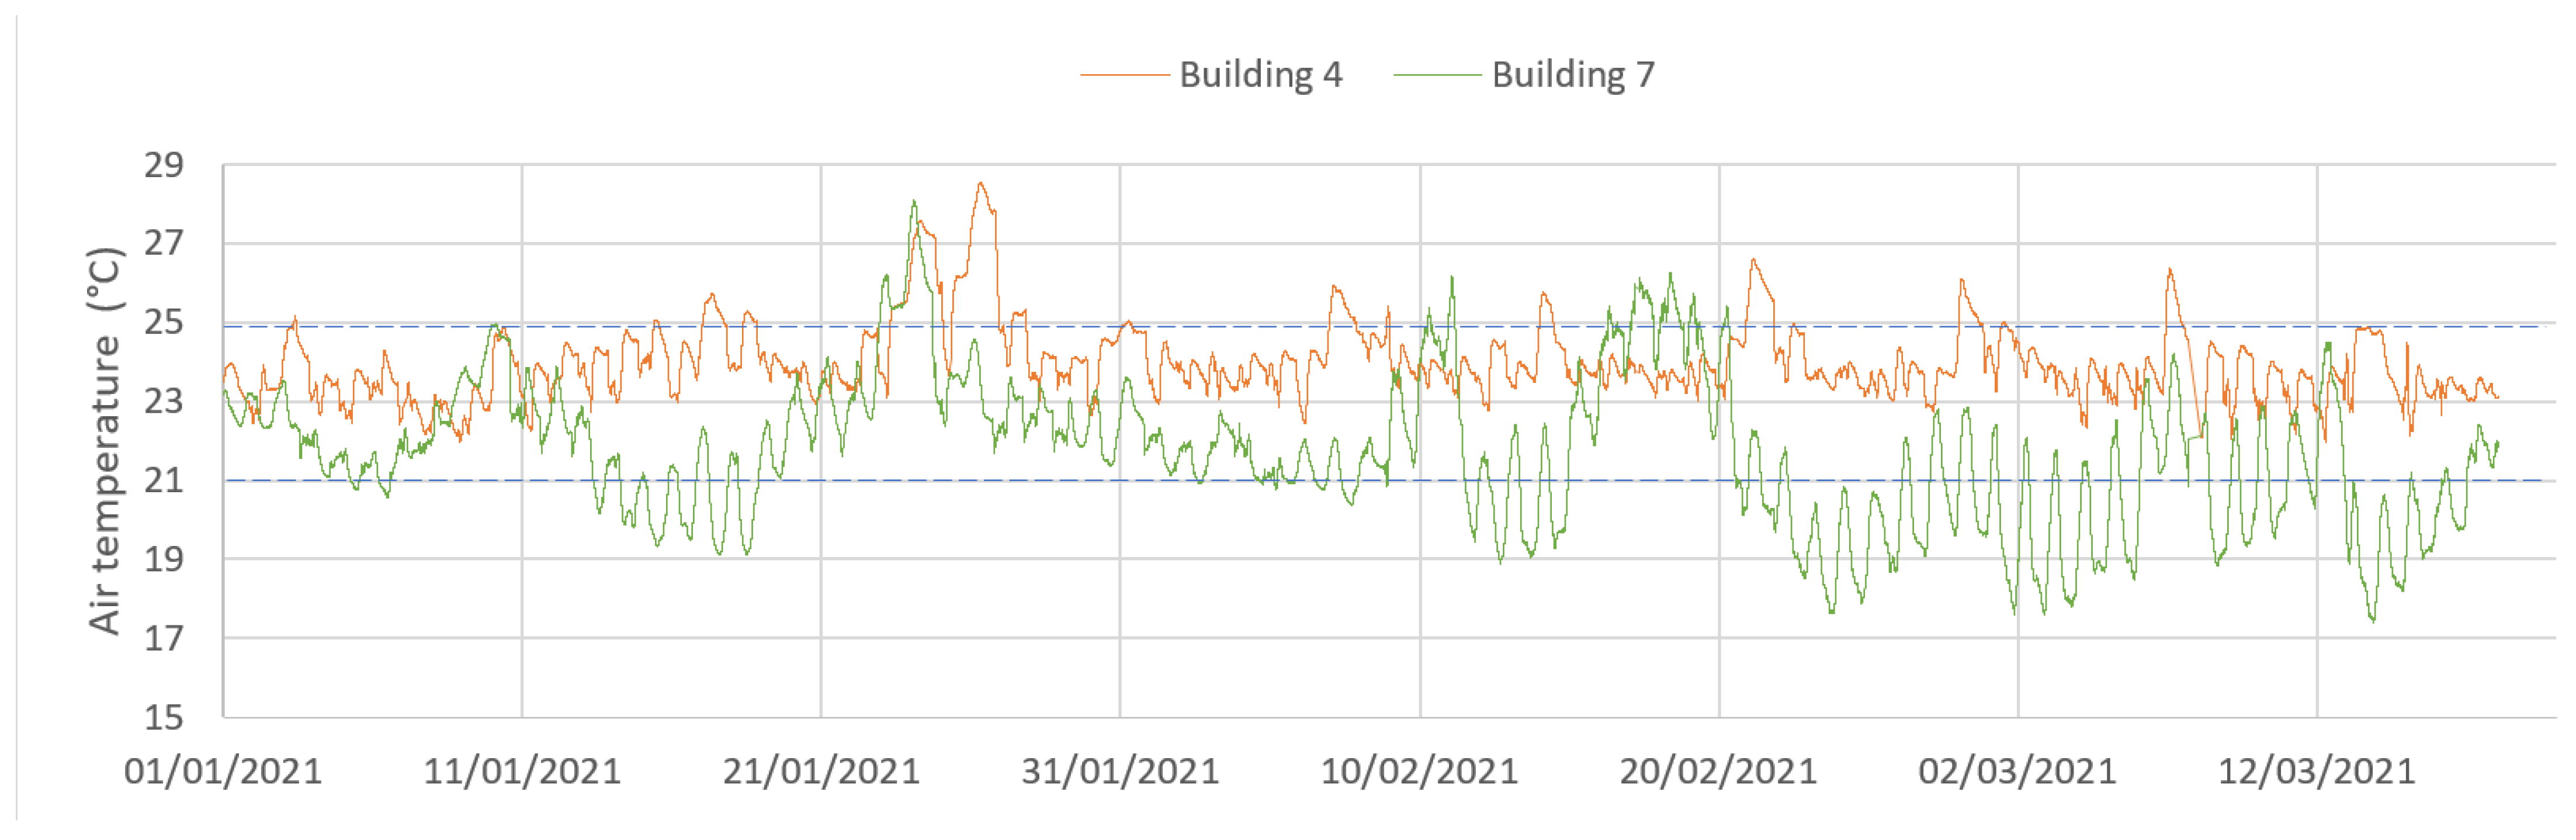
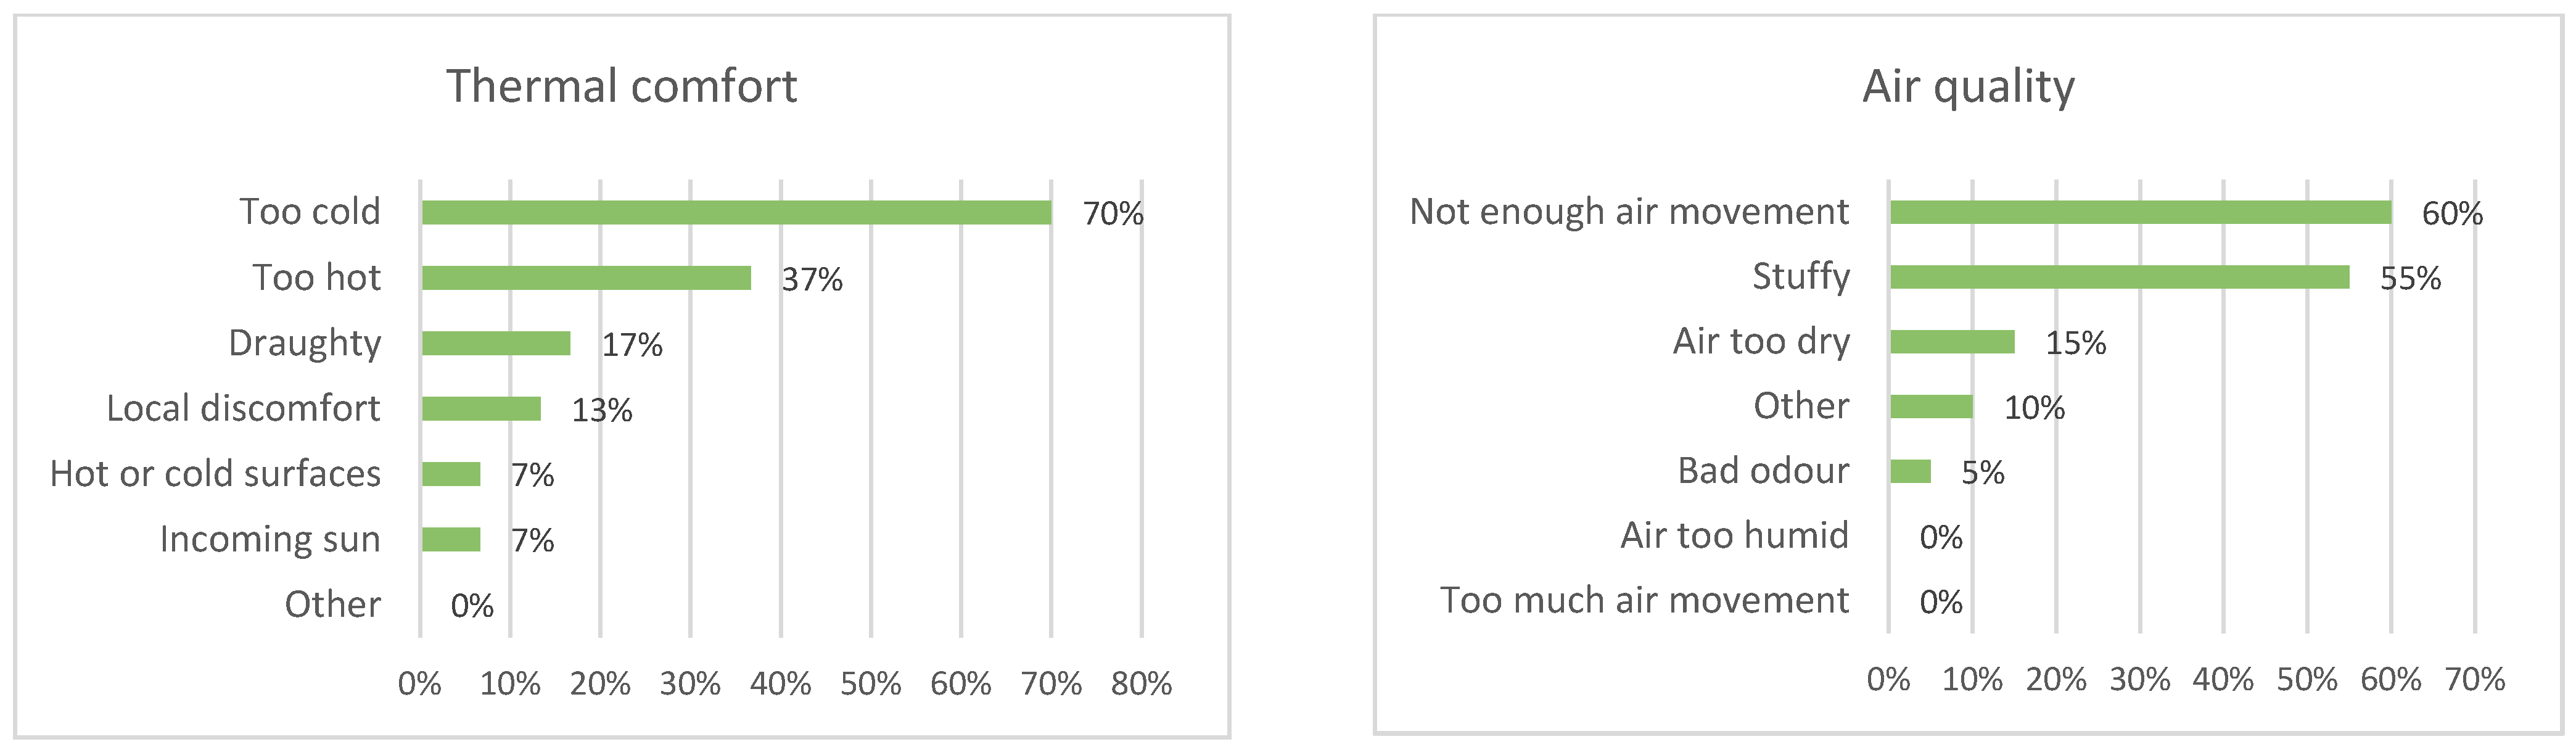
3.2.1. Thermal Comfort
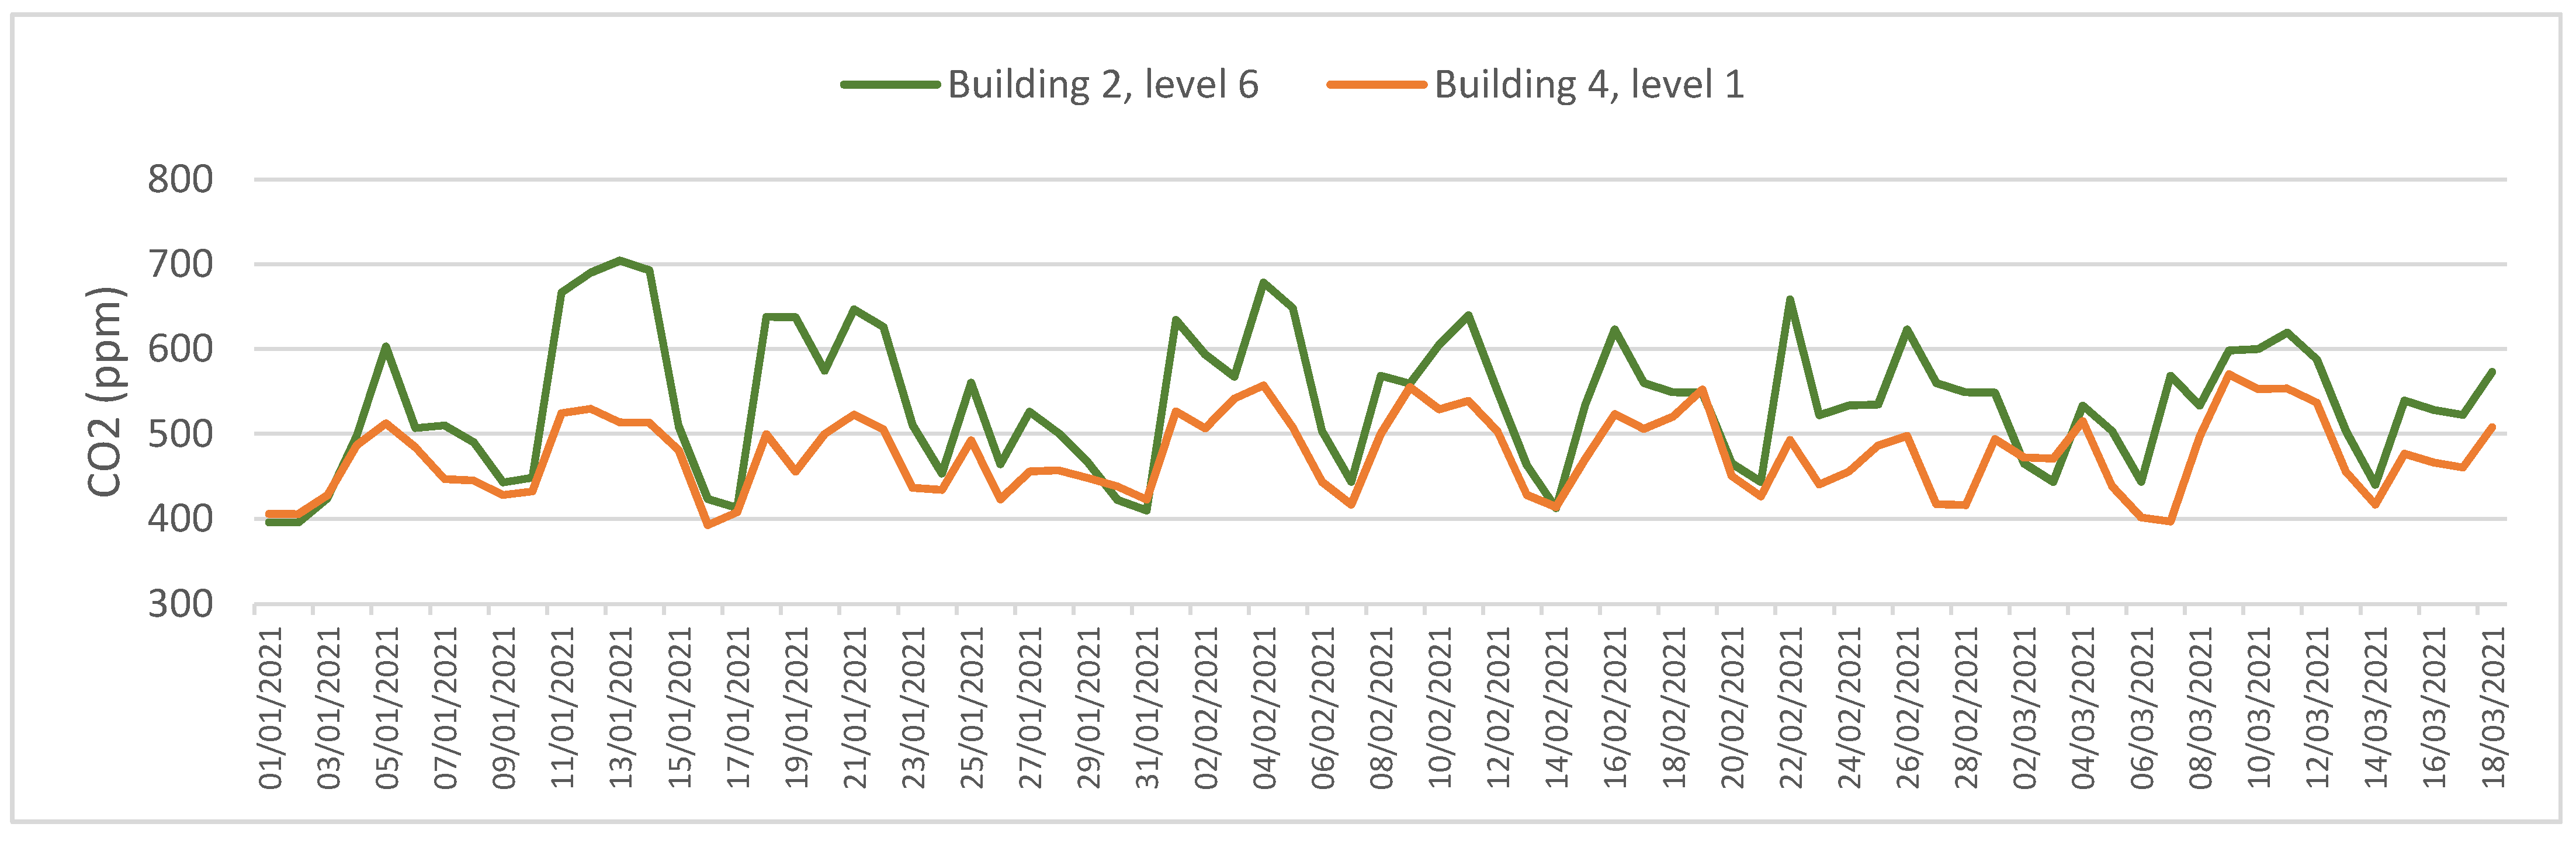
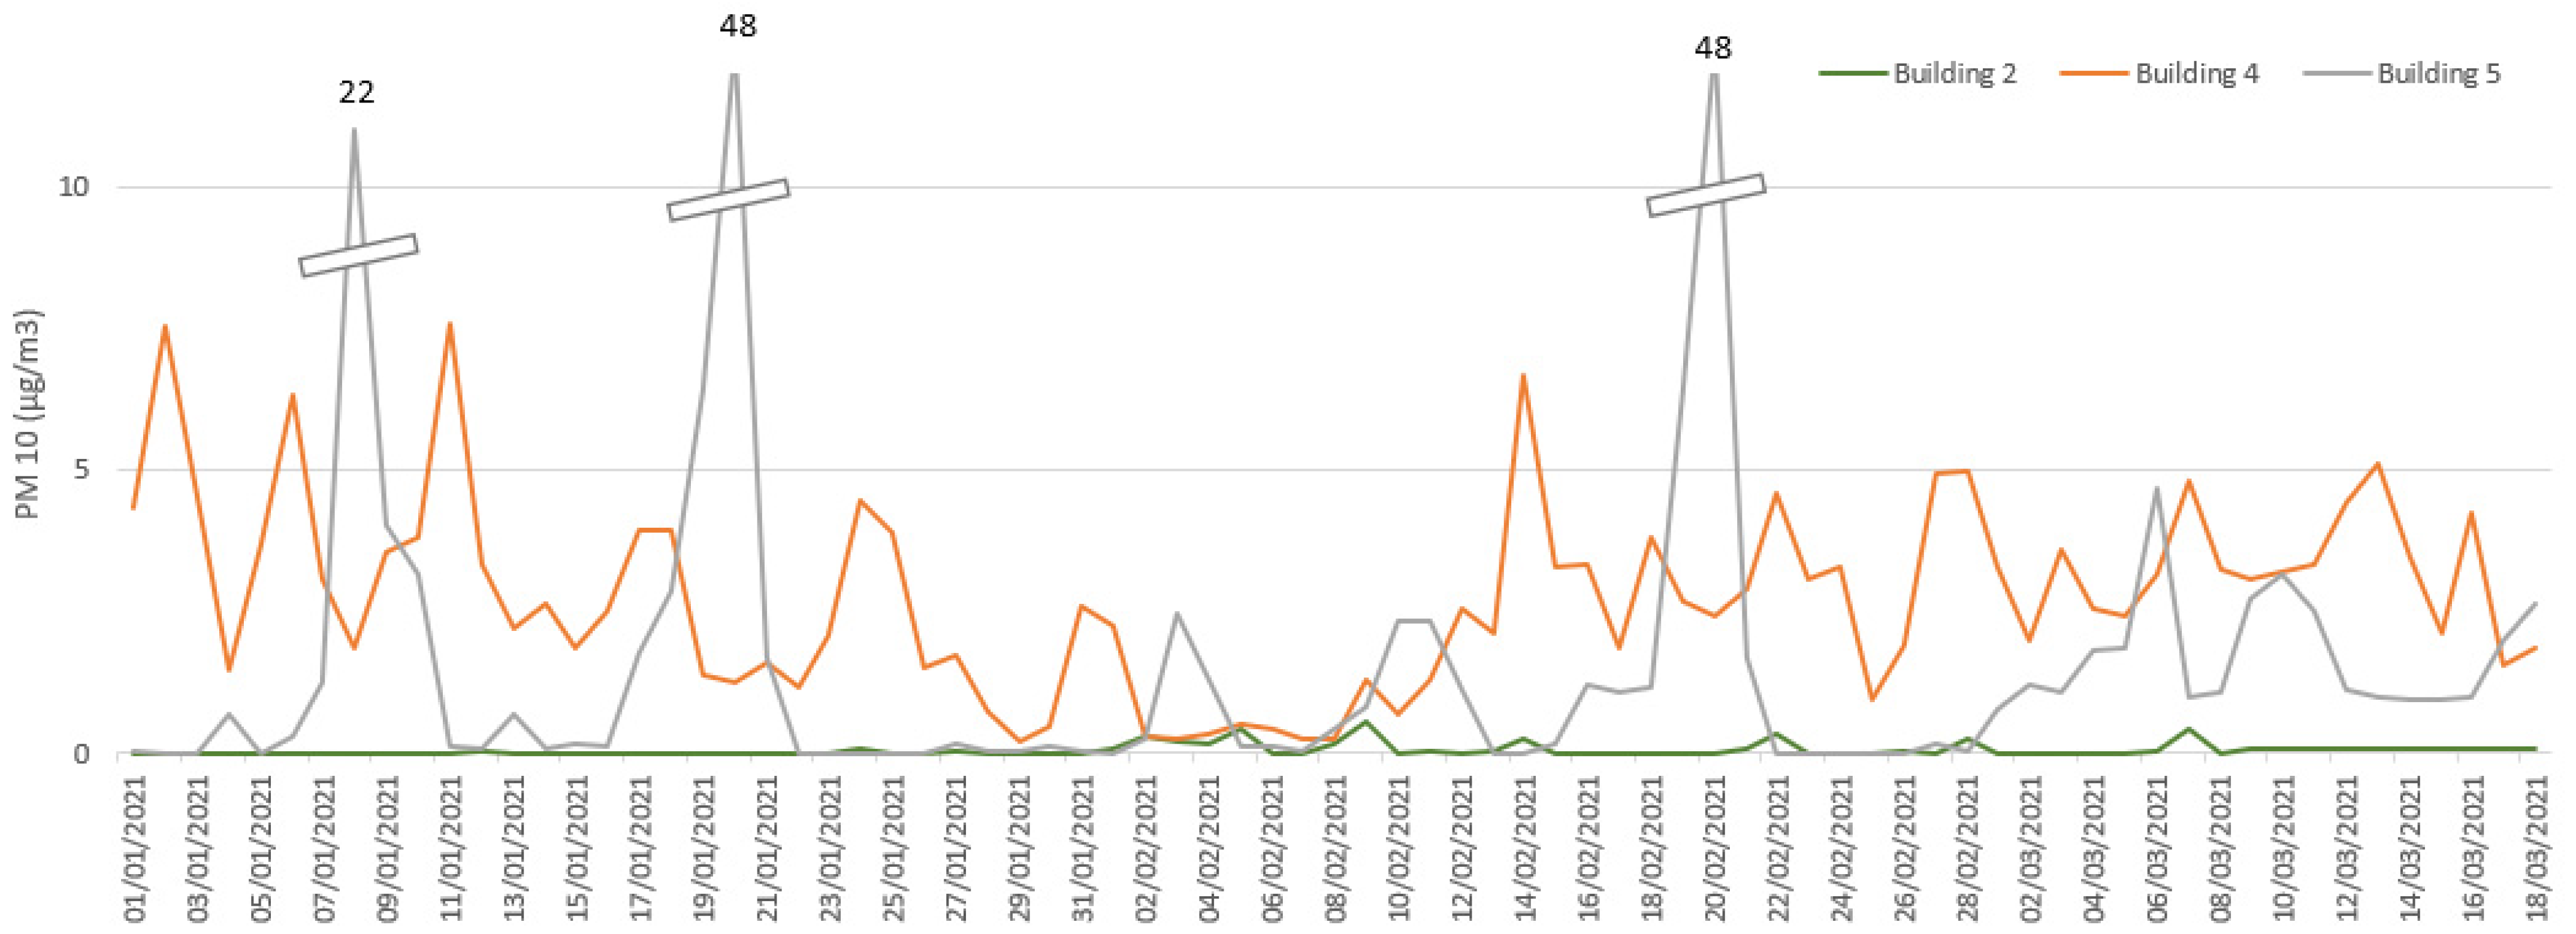
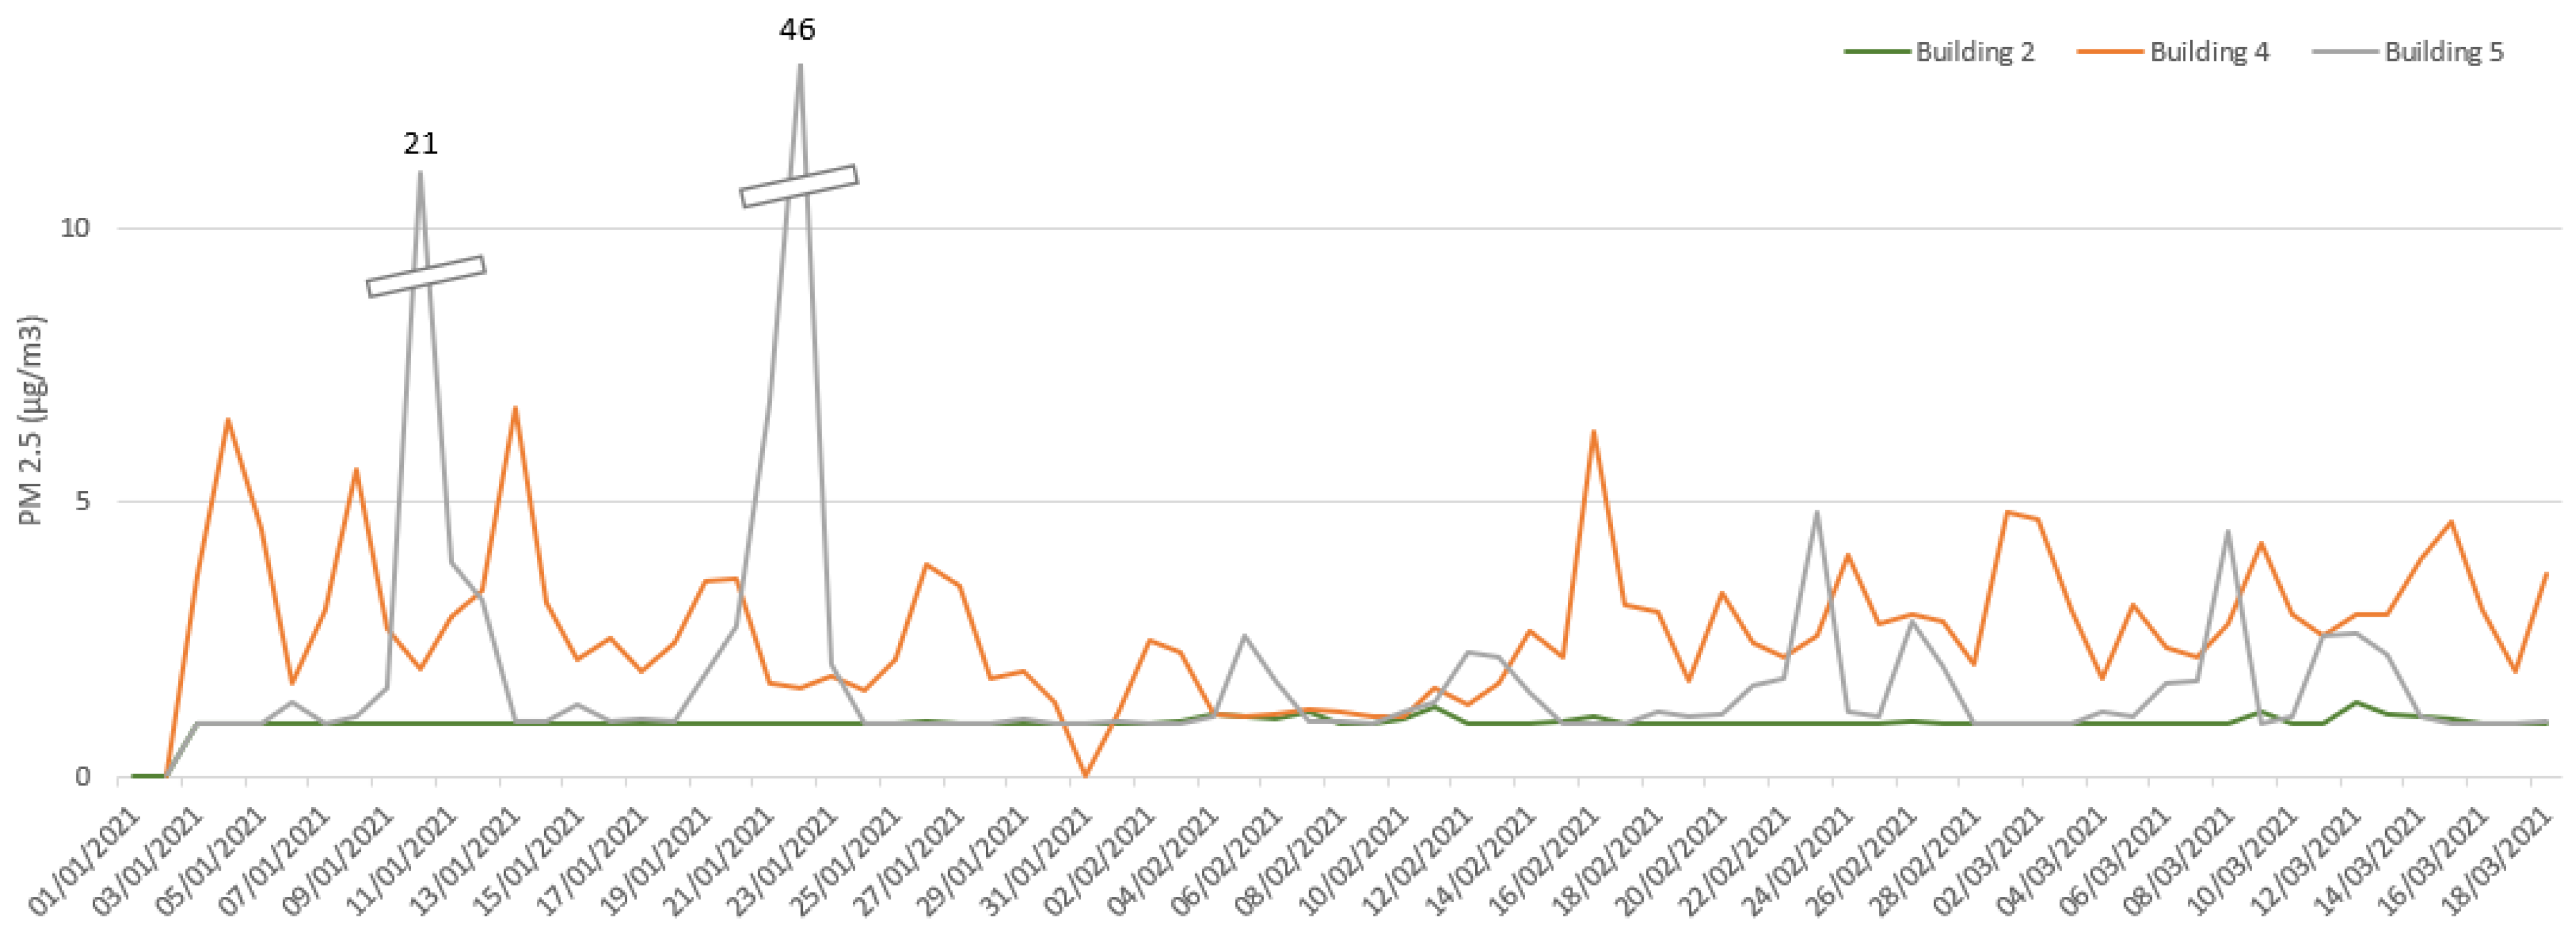
3.2.2. Indoor Air Quality
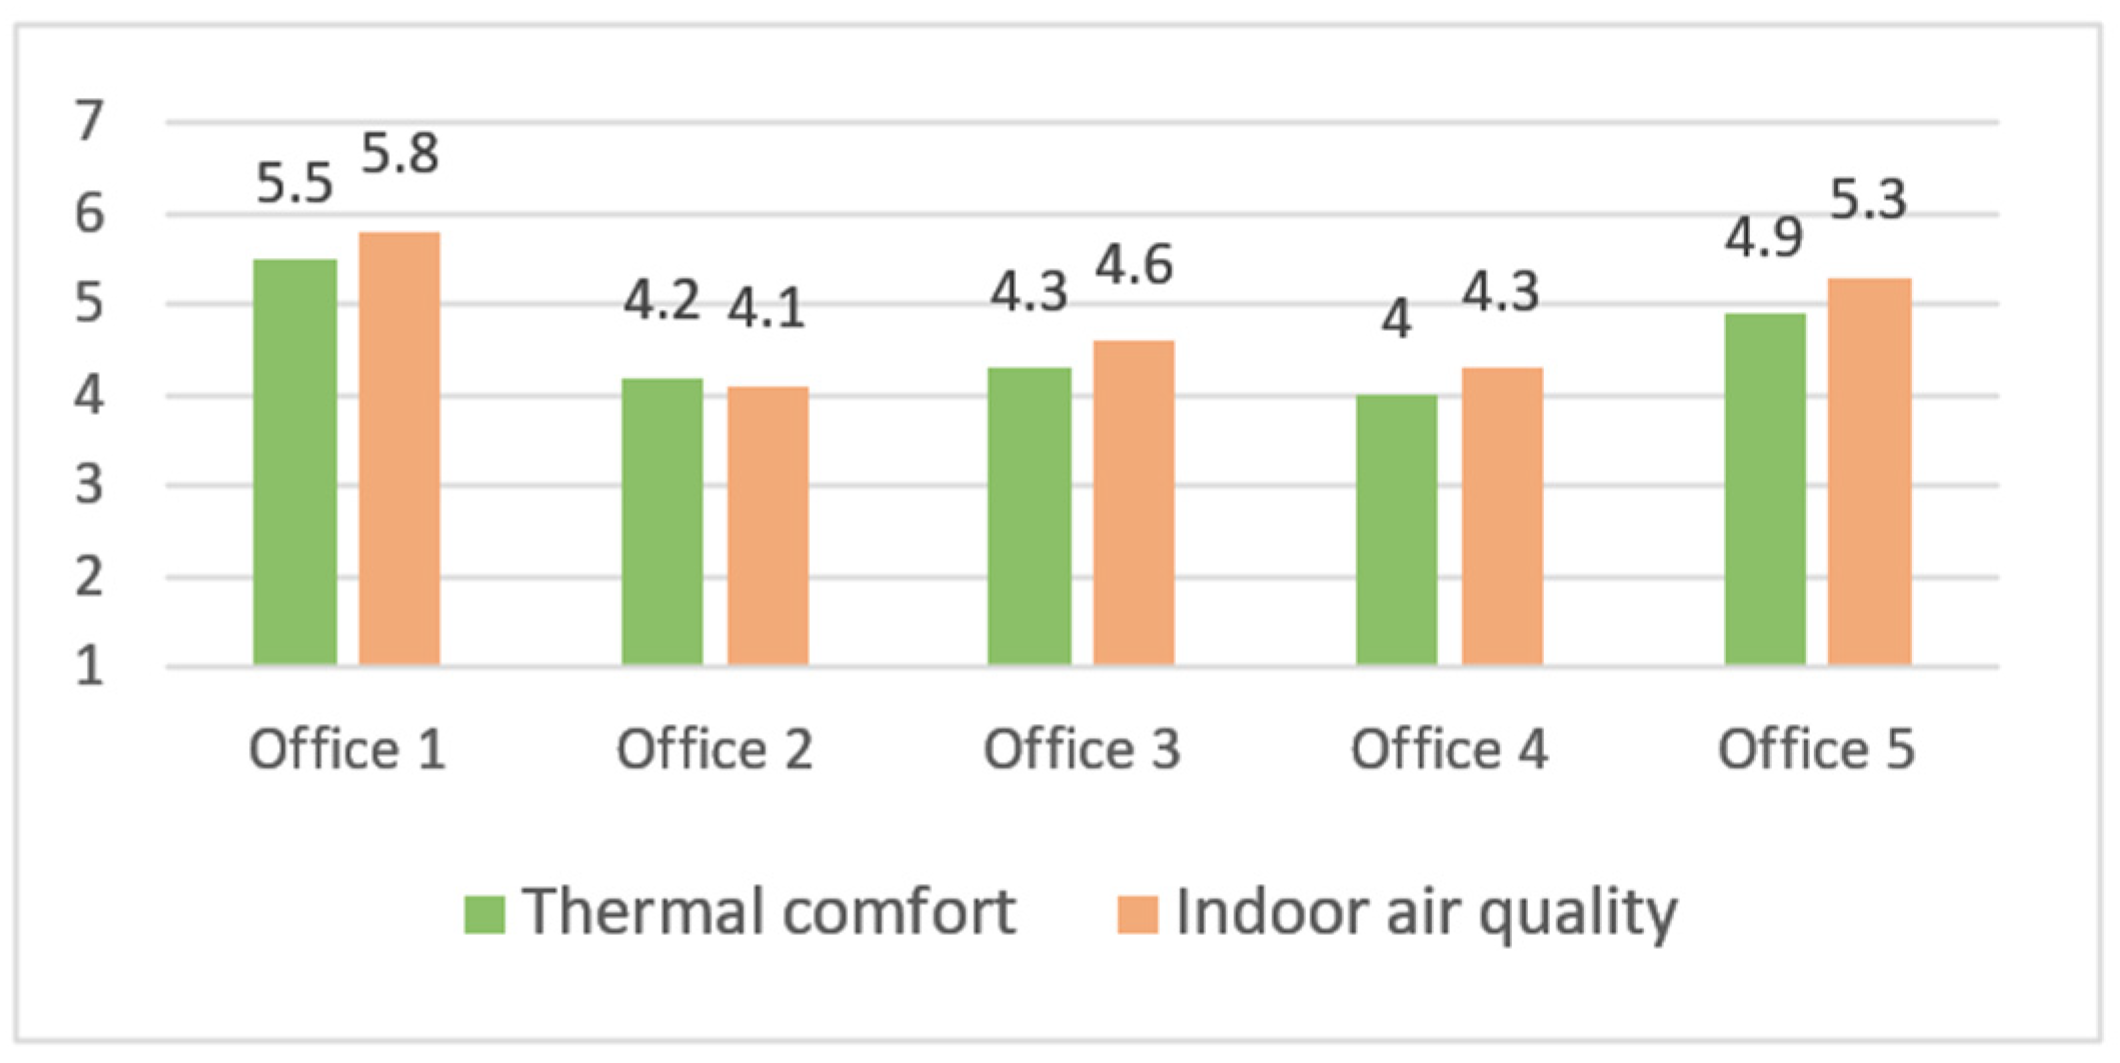
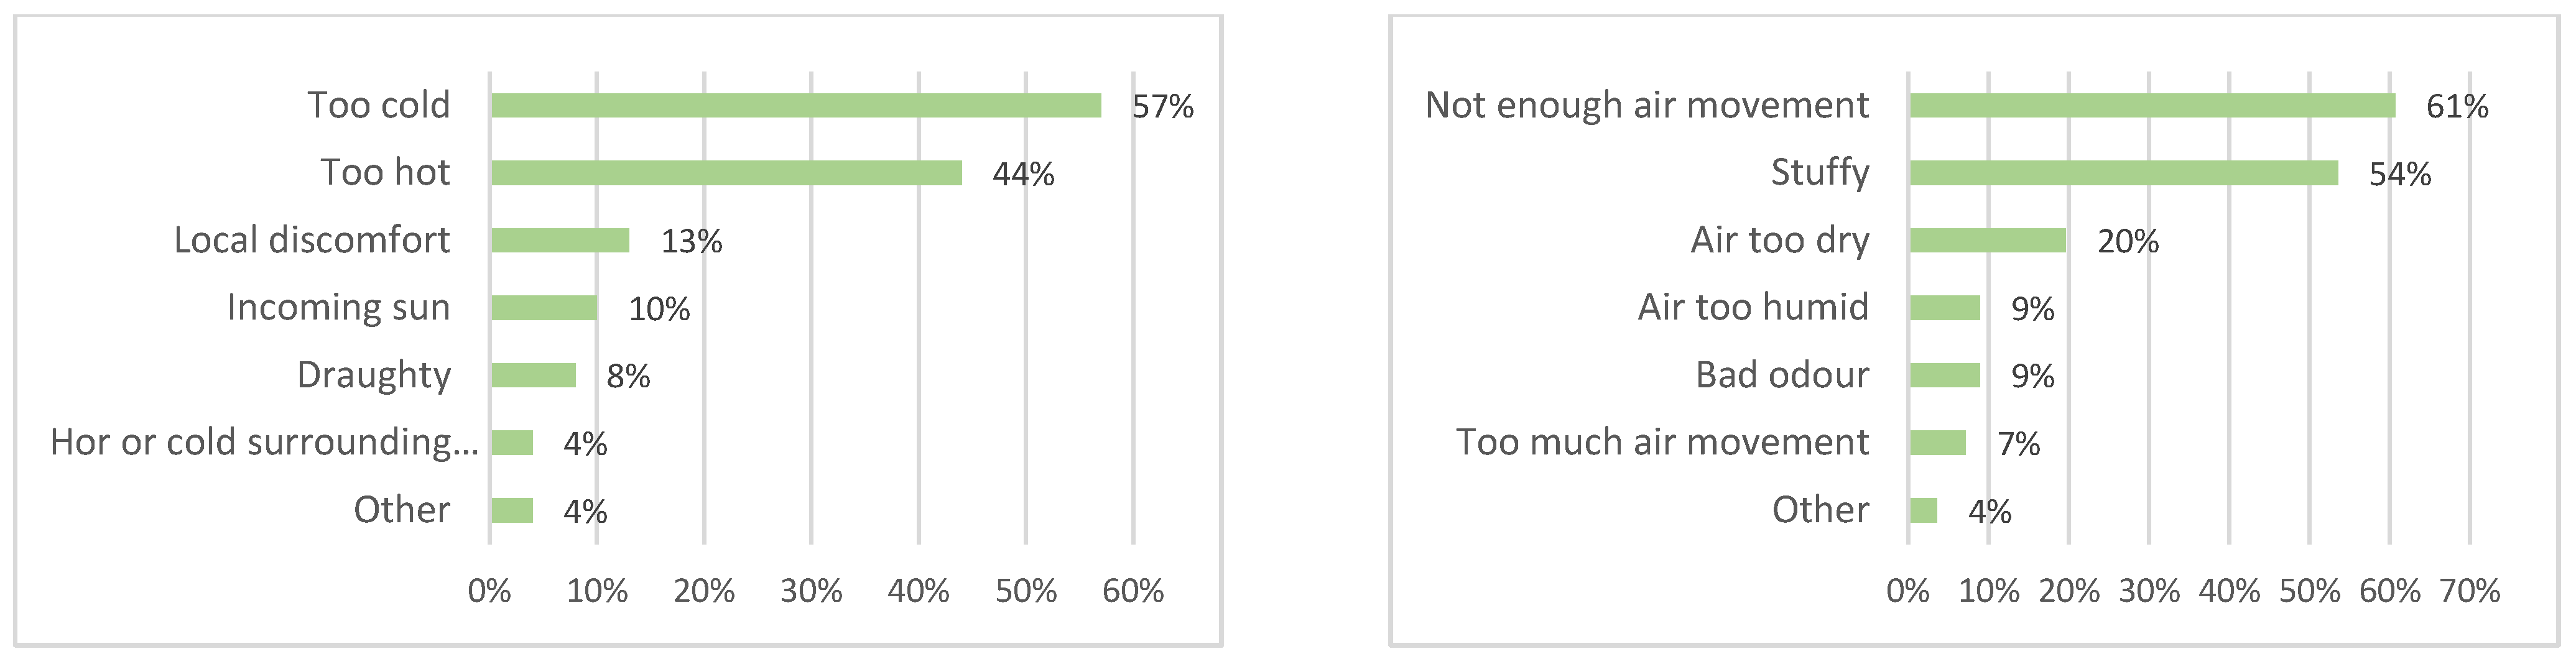
3.3. Satisfaction with Temperature and Air Quality in NABERS-Certified Buildings
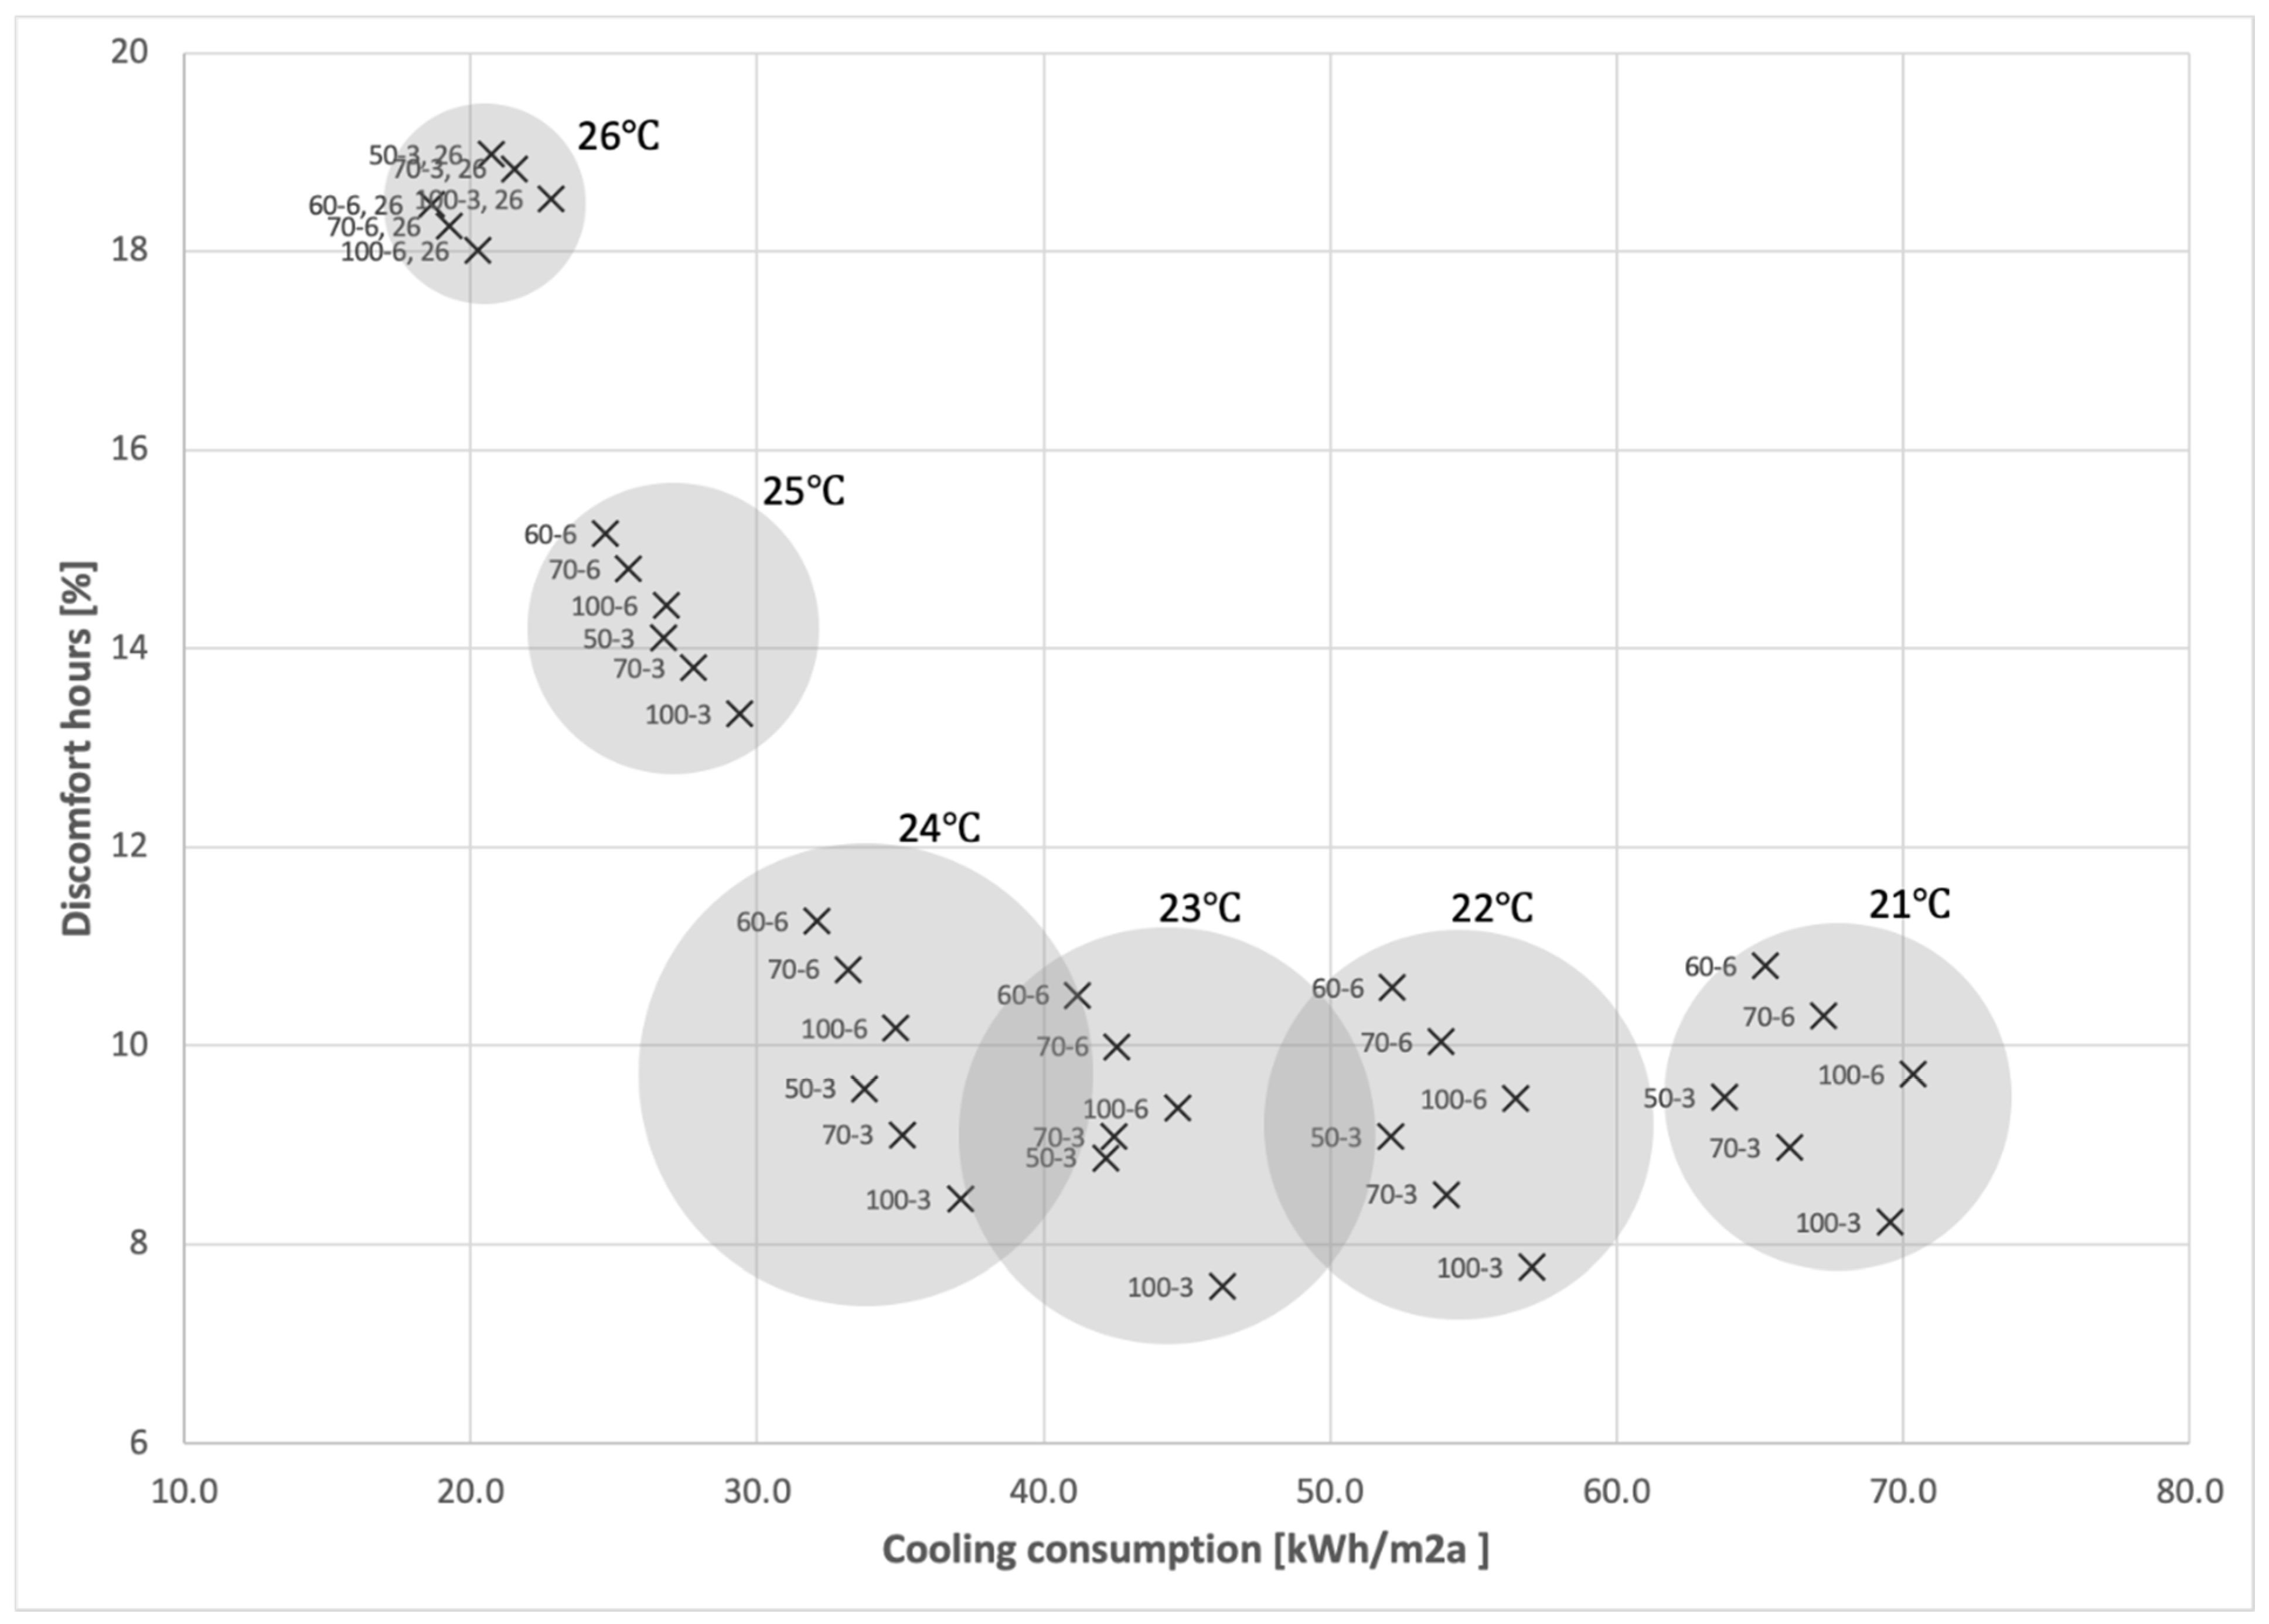
3.4. Predicting Energy Consumption under Various Conditions of CSP, ACH and OCC
4. Conclusions
Author Contributions
Funding
Data Availability Statement
Acknowledgments
Conflicts of Interest
References
- IPCC. Climate Change 2022: Impacts, Adaptation and Vulnerability. 2022. Available online: https://www.ipcc.ch/report/ar6/wg2/ (accessed on 15 May 2022).
- Brambilla, A.; Candido, C.; Sangiorgio, M.F.; Gocer, O.; Gocer, K. Can commercial buildings cope with Australian bushfires? An IAQ analysis. Build. Cities 2021, 2, 583–598. [Google Scholar] [CrossRef]
- Jensen, C.A.; Yule, J. Response strategies used to mitigate the effect of extreme weather on rural and remote housing in Australia. IOP Conf. Ser. Mater. Sci. Eng. 2022, 1218, 012049. [Google Scholar] [CrossRef]
- Warner, R.F. The impacts of flood-mitigation structures on floodplain ecosystems: A review of three case studies from Australia and France. Aust. Geogr. 2022, 53, 265–295. [Google Scholar] [CrossRef]
- Azeem, A.; Chiranjeevi, C.; Sekhar, Y.R.; Natarajan, M.; Srinivas, T. Performance optimization of chiller used for commercial building air-conditioning. Green Energy Technol. 2023, 2, 509–522. [Google Scholar] [CrossRef]
- Dowling, R.; Carr, C.; McGuirk, P. Orchestrating energy transitions: From ‘eco-bling’ to tuning the building. Soc. Cult. Geogr. 2022, 1–20. [Google Scholar] [CrossRef]
- Hou, F.; Ma, J.; Kwok, H.H.L.; Cheng, J.C.P. Prediction and optimization of thermal comfort, IAQ and energy consumption of typical air-conditioned rooms based on a hybrid prediction model. Build. Environ. 2022, 225, 109576. [Google Scholar] [CrossRef]
- Department of Climate Change, Energy, the Environment and Water (CCEEW), Australian Government. Commercial Buildings. 2022. Available online: https://www.energy.gov.au/government-priorities/buildings/commercial-buildings#:~:text=The%20commercial%20building%20sector%20is,reduce%20operating%20costs (accessed on 21 July 2022).
- Residovic, C. The new NABERS indoor environment tool—The next frontier for Australian Buildings. Procedia Eng. 2017, 180, 303–310. [Google Scholar] [CrossRef]
- Bannister, P. NABERS: Lessons from 12 Years of Performance Based Ratings in Australia; Energy Systems Laboratory, Texas A&M University: College Station, TX, USA, 2012; Available online: http://esl.tamu.edu (accessed on 28 June 2022).
- AUSNVIRO. The Performance of NABERS. 2013. Available online: https://www.ausnviro.com.au/the-performance-of-nabers/#:~:text=A%20Brief%20History,a%20buildings%20energy%20efficiency%20system (accessed on 5 September 2022).
- Kim, Y.K.; Abdou, Y.; Abdou, A.; Altan, H. Indoor environmental quality assessment and occupant satisfaction: A post-occupancy evaluation of a UAE University Office Building. Buildings 2022, 12, 986. [Google Scholar] [CrossRef]
- Mallaburn, P.; Azhari, R.; Fawcett, T.; Topouzi, M. Australian non-domestic buildings policy as an international exemplar. Build. Cities 2021, 2, 318–335. [Google Scholar] [CrossRef]
- Burroughs, S. Improving office building energy-efficiency ratings using a smart-engineering–computer-simulation approach: An Australian case study. Adv. Build. Energy Res. 2018, 12, 217–234. [Google Scholar] [CrossRef]
- Roumi, S.; Stewart, R.; Zhang, F.; Santamouris, M. Unravelling the relationship between energy and indoor environmental quality in Australian office buildings. Sol. Energy 2021, 227, 190–202. [Google Scholar] [CrossRef]
- Gui, X.; Gou, Z. Association between green building certification level and post-occupancy performance: Database analysis of the National Australian Built Environment Rating System. Build. Environ. 2020, 179, 106971. [Google Scholar] [CrossRef]
- NABERS. NABERS Indoor Environment. 2015. Available online: https://www.nabers.gov.au/sites/default/files/_nabers_indoor_environment_guide_bv_edit.pdf (accessed on 30 May 2022).
- Zhang, F.; Haddad, S.; Nakisa, B.; Rastgoo, M.N.; Candido, C.; Tjondronegoro, T.; de Dear, R. The effects of higher temperature setpoints during summer on office workers’ cognitive load and thermal comfort. Build. Environ. 2017, 123, 176–188. [Google Scholar] [CrossRef] [Green Version]
- Hua, Y.; Göçer, Ö.; Göçer, K. Spatial mapping of occupant satisfaction and indoor environment quality in a LEED platinum campus building. Build. Environ. 2014, 79, 124–137. [Google Scholar] [CrossRef]
- NABERS. “Find a Current Rating” Tool. Available online: https://www.nabers.gov.au/ratings/find-a-current-rating (accessed on 6 October 2022).
- Olesen, B.W.; Parsons, K.C. Introduction to thermal comfort standards and to the proposed new version of EN ISO 7730. Energy Build. 2002, 34, 537–548. [Google Scholar] [CrossRef]
- Alfano, F.R.; Olesen, B.W.; Palella Bi, I.; Riccio, G. Thermal comfort: Design and assessment for energy saving. Energy Build. 2014, 81, 326–336. [Google Scholar] [CrossRef]
- Kantor, N.; Unger, J. The most problematic variable in the course of human-biometeorological comfort assessment-the mean radiant temperature. Cent. Eur. J. Geosci. 2011, 3, 90–100. [Google Scholar] [CrossRef] [Green Version]
- Langner, M.; Scherber, K.; Endlicher, W. Indoor heat stress: An assessment of human bioclimate using the UTCI in different buildings in Berlin. DIE ERDE–J. Geogr. Soc. Berl. 2013, 144, 260–273. [Google Scholar]
- Matzarakis, A.; Amelung, B. Physiological equivalent temperature as Indicator for impacts of climate change on thermal comfort of humans. In Seasonal Forecasts, Climatic Change and Human Health; Thomson, M., Garcia-Herrera, R., Beniston, M., Eds.; Springer: Cham, The Netherlands, 2008; pp. 61–72. [Google Scholar]
- ASHRAE. ASHRAE Standard 62.1-2019: Ventilation for Acceptable Indoor Air Quality. American Society of Heating, Refrigerating and Air-Conditioning Engineers (ASHRAE). 2019. Available online: https://www.ashrae.org/technicalresources/bookstore/standards-62-1-62-2 (accessed on 10 June 2022).
- ABCB (Australian Building Codes Board). Building Code of Australia 577 2019, Class 2 to 9 Buildings; National Construction Code Series; ABCB: Canberra, Australia, 2019; Volume 1. [Google Scholar]
- WHO (World Health Organization). WHO Guidelines for Indoor Air Quality: Dampness and Mould; WHO: Geneva, Switzerland, 2009. [Google Scholar]
- ADEE (Australia Department of Environment and Energy). National Air Quality Standards. 2016. Available online: https://soe.environment.gov.au/theme/ambient-air-quality/topic/2016/national-air-quality-standards (accessed on 5 February 2022).
- ANSI/ASHRAE Standard 55; American Society of Heating, Refrigerating and Air-Conditioning Engineers ASHRAE Standard: Thermal Environmental Conditions for Human, Ventilation. The Society: New York, NY, USA, 2020.
- Safework NSW, NSW Government. Safety Starts Here: Physical Safety at Work—The Basics, Facilities at Work. 2020. Available online: https://www.safework.nsw.gov.au/safety-starts-here/physical-safety-at-work-the-basics/facilities-at-work (accessed on 30 May 2022).
- Roussac, A.C.; Bright, S. Improving environmental performance through innovative commercial leasing: An Australian case study. Int. J. Law Built Environ. 2012, 4, 6–22. [Google Scholar] [CrossRef]
- National Construction Code. 2019. Available online: https://ncc.abcb.gov.au/ (accessed on 30 May 2022).
- WHO (World Health Organization). Roadmap to Improve and Ensure Good Indoor Ventilation in the Context of COVID-19; WHO: Geneva, Switzerland, 2021. [Google Scholar]
- Bhagat, R.K.; Wykes, M.D.; Dalziel, S.B.; Linden, P.F. Effects of ventilation on the indoor spread of COVID-19. J. Fluid Mech. 2020, 903. [Google Scholar] [CrossRef]
- Dietz, L.; Horve, P.F.; Coil, D.A.; Fretz, M.; Eisen, J.A.; Van Den Wymelenberg, K. 2019 novel coronavirus (COVID-19) pandemic: Built environment considerations to reduce transmission. Msystems 2020, 5, e00245-20. [Google Scholar] [CrossRef] [PubMed]
- Kembel, S.W.; Meadow, J.F.; O’Connor, T.K.; Mhuireach, G.; Northcutt, D.; Kline, J.; Moriyama, M.; Brown, G.Z.; Bohannan, B.J.M.; Green, J.L. Architectural design drives the biogeography of indoor bacterial communities. PLoS ONE 2014, 9, e87093. [Google Scholar] [CrossRef] [PubMed]
- UK NCM. UK’s National Calculation Method for Non Domestic Buildings. 2022. Available online: https://www.uk-ncm.org.uk (accessed on 30 May 2022).
- CSIRO Energy. Typical Meteorological Year Weather Files for Building Energy Modelling. Available online: https://acds.csiro.au/future-climate-typical-meteorological-year (accessed on 30 May 2022).
- Lee, C.L.; Gumulya, N. The role of mandatory building efficiency disclosure on green building price premium: Evidence from Australia. Buildings 2022, 12, 297. [Google Scholar] [CrossRef]
- Licina, D.; Yildirim, S. Occupant satisfaction with indoor environmental quality, sick building syndrome (SBS) symptoms and self-reported productivity before and after relocation into WELL-certified office buildings. Build. Environ. 2021, 204, 108183. [Google Scholar] [CrossRef]


| Type of Rating | Component |
|---|---|
| Tenancy | Tenancy energy consumption, including:
|
| Base Building Energy consumed by building’s central services including: |
|
| Whole Building |
|
| 6 Stars | Market leading performance |
| 5 Stars | Excellent performance |
| 4 Stars | Good performance |
| 3 Stars | Average performance |
| 2 Stars | Below average performance |
| 1 Star | Poor performance |
| Survey Question | Answers | Percentage |
|---|---|---|
| When were you born? | 1946–1964 (Baby Boomers) | 11% |
| 1965–1979 (Generation X) | 35% | |
| 1980–1994 (Generation Y) | 45% | |
| 1995–2012 (Generation Z) | 6% | |
| 2013–2025 | 0% | |
| Prefer not to respond | 2% | |
| Which gender do you identify with the most? | Female | 42% |
| Male | 54% | |
| Intersex, other and prefer not to respond | 3% | |
| On a typical week, how many hours do you work? | 10 h or less | 1% |
| 11 to 30 h | 2% | |
| 31–40 h | 33% | |
| 41–50 h | 41% | |
| 51–60 h | 20% | |
| More than 60 h and prefer not to respond | 3% | |
| Which one of the following best describes the type of work you do? | Managers and administrators | 40% |
| Professionals | 42% | |
| Tradespersons and related workers | 0% | |
| Clerical | 7% | |
| Sales and service | 5% | |
| Other and prefer not to respond | 5% |
| Component | U-Value (W/m2K) | Solar Heat Gain Transmittance (-) | Light Transmittance (%) |
|---|---|---|---|
| High performance DGU (total system, including glazing and frame) | 2.8 | 0.4 | 65 |
| Component | R-Value (m2K/W) |
|---|---|
| Horizontal spandrel panel | 1.0 |
| Concrete slab | 3.7 |
| Slab on grade | 2.0 |
| Internal partitions | 1.4 |
| Concrete floor | 2.0 |
| NABERS Energy Rating | Measurement Period | Temperature 7 a.m.–7 p.m. (A Typical Flexible Workday) Exc. Saturday and Sunday | ||||
|---|---|---|---|---|---|---|
| Minimum | Maximum | Average | ||||
| Building 1 | 5 Star | Level 4 | 24 January–14 March 2021 | 19.3 | 23.1 | 20.7 |
| Level 8 | 24 January–14 March 2021 | 21.6 | 25.0 | 22.9 | ||
| Building 2 | 6 Star | Level 6 | 1 January–18 March 2021 | 24.1 | 27.2 | 25.2 |
| Level 10 | 1 January–18 March 2021 | 21.4 | 23.4 | 22.2 | ||
| Building 3 | 5.5 Star | Level 2 | 1 January–24 February 2021 | 21.8 | 27.5 | 24.1 |
| Level 4 | 1 January–17 March 2021 | 21.7 | 27.6 | 23.2 | ||
| Building 4 | 5.5 Star | Level 1 | 1 January–18 March 2021 | 22.0 | 28.6 | 24.0 |
| Building 5 | 5 Star | Level 7 | 1 January–17 March 2021 | 21.8 | 25.5 | 23.4 |
| Building 6 | 5 Star | Level 1 | 1 January–17 March 2021 | 17.2 | 24.7 | 22.4 |
| Building 7 | 5.5 Star | Level 11 | 1 January–18 March 2021 | 17.6 | 26.3 | 21.6 |
| Temperature | IAQ | ||||||
|---|---|---|---|---|---|---|---|
| Office | Dissatisfied % | Neutral % | Satisfied % | Dissatisfied % | Neutral % | Satisfied % | |
| 3 | Office 1 | 22 | 0 | 78 | 9 | 0 | 83 |
| 4 | Office 2 | 42 | 13 | 46 | 38 | 23 | 38 |
| 12 | Office 3 | 34 | 15 | 51 | 25 | 23 | 52 |
| 17 | Office 4 | 42 | 17 | 41 | 27 | 27 | 46 |
| 29 | Office 5 | 18 | 14 | 68 | 8 | 14 | 78 |
| Overall | 30 | 14 | 56 | 21 | 21 | 59 | |
 .
.Publisher’s Note: MDPI stays neutral with regard to jurisdictional claims in published maps and institutional affiliations. |
© 2022 by the authors. Licensee MDPI, Basel, Switzerland. This article is an open access article distributed under the terms and conditions of the Creative Commons Attribution (CC BY) license (https://creativecommons.org/licenses/by/4.0/).
Share and Cite
Marzban, S.; Candido, C.; Brambilla, A.; Gocer, O.; Vijapur, D.; Jensen, C. Is 24.9 °C Too Hot to Think? A Call to Raise Temperature Setpoints in Australian Offices. Buildings 2022, 12, 2259. https://doi.org/10.3390/buildings12122259
Marzban S, Candido C, Brambilla A, Gocer O, Vijapur D, Jensen C. Is 24.9 °C Too Hot to Think? A Call to Raise Temperature Setpoints in Australian Offices. Buildings. 2022; 12(12):2259. https://doi.org/10.3390/buildings12122259
Chicago/Turabian StyleMarzban, Samin, Christhina Candido, Arianna Brambilla, Ozgur Gocer, Diksha Vijapur, and Christopher Jensen. 2022. "Is 24.9 °C Too Hot to Think? A Call to Raise Temperature Setpoints in Australian Offices" Buildings 12, no. 12: 2259. https://doi.org/10.3390/buildings12122259
APA StyleMarzban, S., Candido, C., Brambilla, A., Gocer, O., Vijapur, D., & Jensen, C. (2022). Is 24.9 °C Too Hot to Think? A Call to Raise Temperature Setpoints in Australian Offices. Buildings, 12(12), 2259. https://doi.org/10.3390/buildings12122259