Article

Study on Air Cabin Ventilation System by Local Structural Optimization during Tunnel Construction

1
School of Highway, Chang’an University, Xi’an 710064, China
2
Shaanxi Provincial Major Laboratory for Highway Bridge & Tunnel, Chang’an University, Xi’an 710064, China
*
Author to whom correspondence should be addressed.
Buildings 2022, 12(12), 2235; https://doi.org/10.3390/buildings12122235
Submission received: 3 November 2022 / Revised: 28 November 2022 / Accepted: 12 December 2022 / Published: 15 December 2022
(This article belongs to the Section Building Structures)

Abstract

:
In tunnel construction, the difficulty of ventilation gradually increases with the increase of ventilation distance, which endangers construction safety and delays construction progress. This paper presents an air cabin ventilation system of the tunnel during construction. Theoretical calculations show that the energy consumption of this ventilation system is reduced by 20.7% compared with blowing ventilation, especially since the resistance loss along the air duct is reduced by 47.04%. A 3D numerical model validated with field test data was employed to discuss the air cabin structural parameters on the ventilation efficiency of the axial fan. The results show that the relative pressure on the fan’s end face increases when the air cabin’s length–width ratio is R = 1:2. The fan spacing S = 2–4 m can ensure the larger relative pressure of multiple fans. The significant difference in air demand between the left and right sides causes the disordered airflow. Set a middle diaphragm length of 1.5 D in the air cabin, which can effectively reduce the phenomenon. The middle diaphragm with a radian of 30°effectively reduced the local loss by 59.40%. The proposed ventilation system shortens the ventilation distance and has the advantages of low energy consumption and resistance loss. It improves the construction environment and is a valuable means of ventilation design for tunnel construction.

1. Introduction

In recent years, China’s underground engineering technology has developed dramatically, and the mechanization degree of tunnel construction has been improved to varying degrees [1]. Tunnels have an irreplaceable role in overcoming obstacles in mountainous terrain, shortening distances and improving the quality of land transportation engineering operations [2]. However, during the exploitation of underground space, ventilation problems [3], such as high air temperature [4,5], toxic gases [6] and dust pollution [7,8], during construction. Therefore, proper ventilation is important to improve the construction environment and protect workers’ health. The inclined shaft ventilation [9,10,11] needs to arrange the air duct in the inclined shaft. Multiple large-diameter ducts are required when multiple excavation surfaces are constructed in parallel. Still, it is usually difficult to implement them due to the restricted clearance of the inclined shaft section. The air cabin ventilation system provides a new idea for the rapid and safe construction of long tunnels [12,13,14]. The air cabin structure shortens the length of the ducts. It provides fresh gas to multiple driving faces simultaneously, which can be preferentially used to construct multiple driving faces in inclined shafts. Therefore, it is necessary to conduct a study on the structure of air cabins.
With the increasing maturity of computational fluid dynamics (CFD) and computational techniques, numerical simulation has become one of the main research tools for studying large subsurface structures [6,15]. S, Torno and J. Toranoá [16] developed an algorithm for simulating pollutants dispersion after underground works excavation. J, Toranoá [17] studied the dust characteristics of a dual-assisted ventilation system and used a predictive model to calculate the time factor to optimize a tunnel ventilation system with multiple auxiliary passages. The foundation for the simulation of dust dispersion is laid later in this paper. Researchers have also investigated air cabin ventilation systems using numerical simulations. Luo et al. and Zhang et al. [18,19] compared the ventilation effects of air cabin ventilation and blowing ventilation by numerical simulation and concluded that air cabin ventilation had greater advantages than blowing ventilation. Using the Funishan Tunnel as the engineering background, Song et al. [20] designed the air cabin ventilation system for tunnel construction using numerical simulation [21]. Dou and Chen [22] proved that the air cabin ventilation system has a good ventilation effect and was used in the Luojia Tunnel. Liu, G. [23] reduced the ventilation distance from 6383 m to 2500 m using relay ventilation based on a small plenum in the Qinling Tunnel. Therefore, air cabin ventilation is important for shortening extra-long tunnels’ single-head driving distance [24]. The air cabin ventilation has a good ventilation effect and can effectively shorten the ventilation distance. Researchers have studied the structure of air cabins and the arrangement of fans. Relying on a large underground storage cavern group, Liu et al. [25] studied the influence of air cabin sizes and fan layout on the efficiency of axial fans [26,27]. However, no solution was proposed for the suction phenomenon that arises when the air volume required to the left and right of the air cabin is different.
There is less research on the new air cabin ventilation system in long highway tunnels, especially on the structural parameters of air cabins. Based on the Funiu Mountain tunnel, this paper verified the advantage of the low energy consumption of the new system ventilation calculations. The appropriate structural parameters of the air cabin have a significant impact on improving the ventilation effect. Based on the CFD simulation analysis, this paper used the control variable method [28,29] to optimize the length–width ratio R, fan spacing S, middle diaphragm length and diaphragm angle in the air cabin. The research results provided a reference for the construction ventilation design of similar extra-long tunnels.

2. Calculation of Air Demand and Energy Consumption

2.1. Air Demand for Driving Face

The air demand by the driving face must meet the requirements of personnel breathing and discharging dust generated by blasting and diluting diesel locomotive exhaust. Therefore, the maximum air volume is selected as the air volume required by the driving face. The driving face is the working face that keeps moving forward in the tunnel construction process.
(1)
Air demand of workers breathing:
Q p = q N = 3 × 60 = 180 m 3 / min
where Q p denotes the total air demand for workers’ breathing in m3/min, and q denotes the air volume required per person per minute in m3/min. Based on the Technical Specifications for Construction of Highway Tunnel of China [30], q = 3 m3/min. N denotes the maximum number of people.
(2)
Air demand for blasting operation:
Q b = 7.8 t G ( A L 0 ) 2 3 = 7.8 20 316 × ( 82 × 120 ) 2 3 = 1220 m 3 / min
where Qb denotes the total air demand for discharging the dust produced by blasting in m3/min; t denotes the ventilation time in min; G denotes the total explosive mass in kg; A denotes the sectional area of driving face in m2 and L0 denotes the ventilation length in m.
According to the actual situation of the Fu Niu Mountain tunnel excavation, t = 20 min, G = 316 kg and A = 82 m2.
L 0 = 1.2 × ( 15 + G 5 ) = 1.2 × ( 15 + 316 5 ) = 93.84 m
In practical applications, considering that the length of the ventilation section should meet the ventilation demand from the driving face to the secondary lining, L0 = 120 m.
(3)
Air demand of the minimum air velocity:
Q v = 60 · v · A = 60 × 0.15 × 82 = 738 m 3 / min
where Qv denotes the total air demand to meet the minimum air velocity in m3/min, and v denotes the minimum air velocity in m/s. Based on the Technical Specifications for Construction of Highway Tunnel of China [30], v = 0.15 m/s.
(4)
Air demand for diluting mechanical exhaust gas:
Q s = k · k 1 · k 2 · i = 1 N i = 3 × 0.6 × 0.8 × 610 = 878.4 m 3 / min
where Qs denotes the total air demand for diluting mechanical exhaust gas in m3/min; k denotes the air demand per unit power of machinery, 3 m3/min · kW; k1 denotes the effective utilization coefficient of mechanical power, 0.6; k2 denotes the working coefficient of mechanical power, 0.8 and Ni denotes the power of machinery operating in kW.
According to the calculations, the air volume required for tunnel construction under different working conditions is shown in Table 1. Based on the Technical Specifications for Construction of Highway Tunnel of China [30], the air demand at the driving face is 1220 m3/min.

2.2. Ventilation Energy Consumption

According to the construction ventilation scheme of Funiu Mountain, the inclined shaft needs to supply air to three driving faces simultaneously under the most unfavorable working conditions. Two systems are proposed for this situation: blowing and air cabin ventilation. The energy consumption of the two ventilation systems is compared, and their calculated parameters are shown in Table 2. The small mileage is for the direction to the right side in Figure 1, and the large mileage is for the direction to LuanChuan.

2.2.1. Calculation Principle

(1)
Air volume of the forced draft fan
Qf denotes the air volume of the forced draft fan in m3/s, which can be written as:
Q f = Q 0 ( 1 β ) L 100
where β denotes the average value of 100 m air leakage rate, and L denotes the duct length in m.
(2)
Ventilation resistance
hg denotes the friction resistance of the air duct in Pa, which can be written as:
h g = λ L d · v 2 2 ρ = λ ρ 2 d 0 L v x 2 d x = λ ρ 2 d 0 L Q 0 2 ( 1 β ) 2 X 100 A 2 d x = 400 λ ρ π 2 d 5 · 1 ( 1 β ) 2 L 100 ln ( 1 β ) · Q 0 2
where λ denotes the friction coefficient; ρ denotes the air density in kg/m3; d denotes the equivalent diameter of the air passage section in m and Q0 denotes the air demand in m3/s.
hg11 denotes the local resistance of the air duct in Pa, which can be written as:
h g 11 = ξ · ρ 2 A 2 Q f 2
hv denotes the dynamic pressure loss at the air duct outlet in kg/m3, which can be written as:
h v = 1 2 ρ v 1 2
where v1 denotes the wind speed of the air duct outlet in m/s.
(3)
Power calculation:
Nt denotes the total power of the ventilation system in kW, which can be written as:
N t = H t · Q f 1000
where Ht denotes the total pressure of the ventilation system in Pa.

2.2.2. Calculation of Ventilation Energy Consumption

The blowing ventilation system layout is shown in Figure 1a. Under this system, three axial fans at the inclined shaft opening supply air to the driving face through a φ 1.6 m air duct. The air supply distance of this ventilation system is too long, and the air duct leaks resulting in a lot of energy waste. The air duct bends three times when supplying air to the left driving face, resulting in sizeable local resistance loss. The energy consumption of the blowing ventilation system is shown in Table 3.
The air cabin ventilation system is shown in Figure 1b. In this ventilation system, the inclined shaft and the tunnel near the bottom of the inclined shaft are separated into upper and lower parts by diaphragms. The upper part conveys fresh air, and the lower part is used as a passage for transportation. The upper part of the intersection between the inclined shaft and the main tunnel forms an air cabin through a diaphragm. This system shortens the air supply distance of the air duct and partly solves the tunnel’s long-distance ventilation problem. According to the engineering parameters of the Funiu Mountain tunnel, the ventilation energy consumption of the air cabin ventilation system was calculated, as shown in Table 4.
A comparison of ventilation energy consumption based on the calculation results in Table 3 and Table 4 is shown in Figure 2. For a given construction condition, the total power is the smallest, and the energy consumption is the lowest when using the air cabin ventilation system. The total ventilation power of the air cabin ventilation system was reduced by 15.0% compared to the blowing ventilation system. The air chamber reduces the duct length and the number of duct bends due to its special structure, so the duct resistance loss is significantly reduced by 47.04%. At the same time, the resistance of the diaphragm was increased by 749.15 Pa. The total resistance of the air cabin ventilation system was reduced by 20.7% compared with the blowing ventilation system.

3. Numerical Simulation of the Air Cabin

This study set up several cases to study the effect of the air cabin parameters on fan efficiency. The calculation cases were performed according to the steps shown in Figure 3 [31]. The setup of each step is explained in the following section. Based on the actual situation of the Funiu Mountain tunnel, SCDM was used to establish a physical model. Meshing software was used for meshing. The suitable mesh type was obtained by studying the mesh independence. Fluent performed calculations. The data from field tests were compared with the data from numerical simulations to verify the model’s reliability. This paper sets four operating conditions. The single variable control method was used to compare the influencing factors one by one and determine the optimal structural parameters of the air cabin. The operating condition settings are shown in Table 5.

3.1. Numerical Computational Control Model
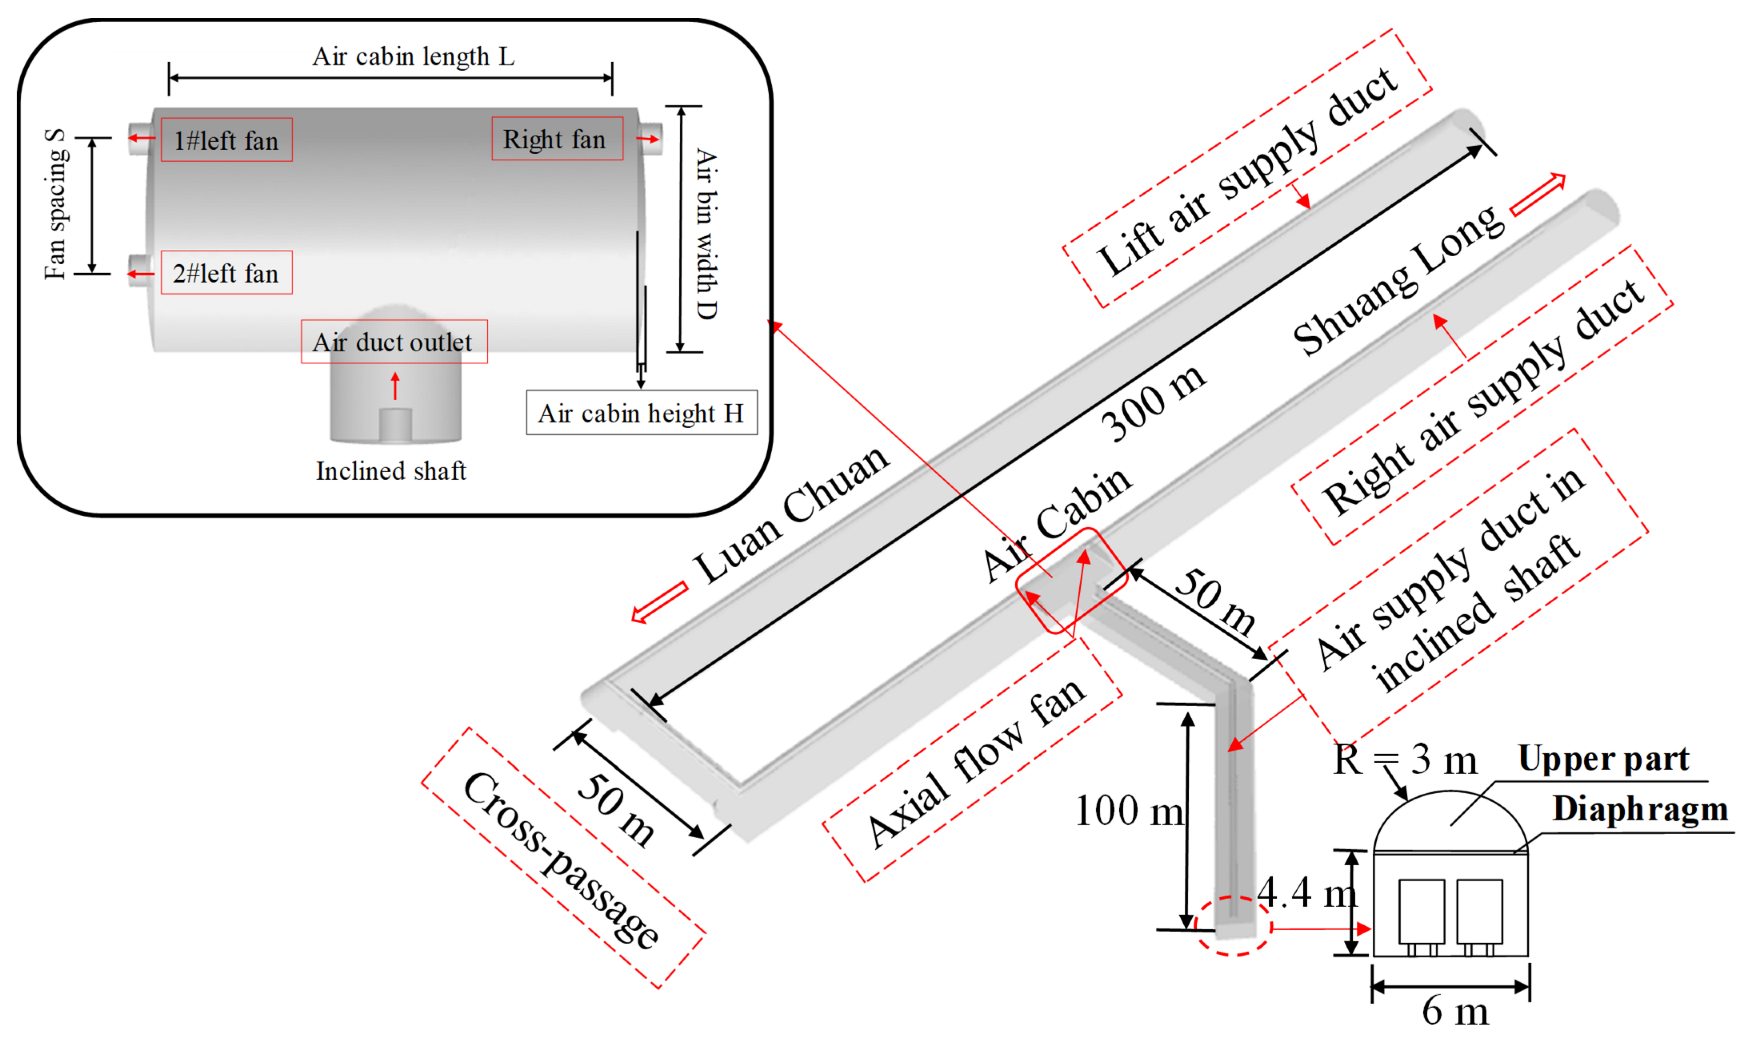
According to the condition assumption of airflow calculation, the airflow in the tunnel is a stable constant flow, and the space flow field is a constant temperature flow field [32].
Continuity equation:
ρ t + x t ( ρ v t ) = 0
Equivalent equation:
ρ t ( ρ v t ) + x j ( ρ v i v j ) = ρ x i + x i ( μ e ( v i x i + v i x j ) ) + ρ g i + S i
μ e = μ + μ t
μ t = ρ C μ k 2 ε
where x i denotes the right angle coordinates (i = 1,2,3); v i denotes the component of flow velocity in the x i direction in m/s; ρ donates the fluid density in kg/m3; S i donates the turbulent momentum source term in N/m3; k donates the turbulent energy project in m2/s2; ε donates the turbulent energy dissipation rate in m2/s3; μ donates the laminar viscosity coefficient in P a · s ; μ t donates the turbulent viscosity coefficient in P a · s ; P donates the static pressure in P a and g i donates the acceleration of gravity in the direction i in m/s2.
The flow of air in construction tunnels involves the mixing and interaction of different components of air, so the law of conservation of components is also followed in the study of construction tunnel ventilation systems.
t ( ρ Y s ) + x j ( ρ v i Y s ) = x j ( μ e σ s Y s x j )
where Y s donates the component mass fraction.
A three-dimensional nonconstant component transport model is used for the numerical calculations, and a standard κ-ε double turbulence model [33,34] is used.
The turbulent flow k equation:
t ( ρ k ) + x j ( ρ k v i ) = x j ( μ e σ k k x j ) + G k ρ ε
Dissipation rate of the turbulent flow ε equation:
t ( ρ ε ) + x j ( ρ ε v i ) = x j ( μ e σ ε ε x j ) + ε k ( G 1 ε G k G 2 ε ρ ε )
G k = μ t ( v i x j + v j x i ) v i x j
where σ k donates the Prandtl number of the K equation; σ ε donates the Prandtl number of the ε equation; G k donates the term for the generation of turbulent kinetic energy k due to the mean velocity gradient and G 1 ε , G 2 ε , σ k and σ ε are 1.44, 1.92, 1.0 and 1.2, respectively.
The velocity and trajectory of the airflow within the tunnel can be determined by solving the basic control equations for the airflow at a given moment concerning the property parameters of the relevant airflow in the tunnel using the above solution method.

3.2. Physical Model

Figure 4 shows the geometric model of the whole ventilation system, including two tunnels, inclined shafts, and the air cabin structure. The model length is 300 m, the cross-passage distance is 50 m and the air duct is 20 m from the driving face. In the long tunnel model, fresh air enters the air cabin through the inclined shaft duct. Then, the fan transfers the fresh air to the driving face through the duct. The polluted air is summarized near the inclined shaft and discharged to the outside by the lower passage. The air cabin model includes three fans supplying air to the tunnel face and air ducts supplying air to the air cabin. The air cabin is a semi-circular arch with a width of 11 m, and the length L and fan spacing S were variable. The diameter of the air duct was 1.6 m.

3.3. Mesh Independence

The grid sensitivity analysis of the air cabin model was carried out. As shown in Figure 5, three different types of meshes were divided for the model: polyhedral mesh, tetrahedral mesh and hexahedral mesh. Three models were simulated, including 69,049 elements (grid A), 150,094 elements (grid B) and 128,642 elements (grid C). The distance from the stroke pipe outlet to each model’s working face was 35 m (Figure 2). The three models were compared based on the average wind speed at different places in the air cabin. As shown in Figure 6, the average difference in air velocity between grid A and grid C was 3.81%, whereas the average difference between grid B and grid C was only 8.98%. Thus, grid C was selected for further study. The maximum size of grid C was 0.25 m, and the minimum size was 0.1 m. The maximum skewness was 0.69, and the average grid quality was 0.86.

3.4. Boundary Conditions

Generally, the air in the tunnel was regarded as a turbulent flow state, and the gas flow change with time was not considered. Therefore, the airflow in the roadway was regarded as three-dimensional incompressible stable viscous turbulence in the calculation [13]. The standard k-epsilon in the viscous model was adopted when simulated. Mathematical models include continuity equations, momentum equations, and k-epsilon model equations [2]. The settings of the simulation parameters for the airflow are as follows:
(1)
The air cabin and duct wall were set as the wall, the roughness constant Re was 0.57, and the average roughness height Rh was 0.09.
(2)
The left and right fans in the air cabin outlets were set as the velocity inlet, with a wind speed of −15.6 m/s and −14.6 m/s, respectively, where “-” represents the direction, and in this paper, −15.6 m/s represents a velocity of 15.6 m/s in the negative direction of the X-axis.
(3)
The air supply outlet of the inclined shaft air duct was set as the velocity inlet, with a wind speed of 25 m/s.
(4)
The air inlet is set as the pressure inlet, and the inlet pressure (relative to atmospheric pressure) is defined as 0.
(5)
All walls were set as non-slip walls.

3.5. Field Test Verification

Field testing during tunnel construction is the best way to verify the accuracy of the ventilation model [4,26]. Thus, we measured and analyzed the dust concentration and airspeed ventilation after constructing the Funiu Mountain tunnel. After blasting, we selected 10 monitoring surfaces within 100 m of the driving face. Nine monitoring points were placed on each monitoring surface, and the testing heights were 1 m, 1.7 m, and 3 m. The average value of the 9 monitoring points was taken as the testing value of the testing surface.
AS856S portable anemometer was used to measure the wind speed, with a measurement range of 0.3~45 m/s and an error of ±0.1 m/s. CCHZ-1000 was used to measure the dust concentration, with a measurement range of 0~1000 mg/m3 and an error of ±2.5%. The field test instrument is shown in Figure 7. Figure 8 shows the layout of test sections and the distribution of test points in the tunnel. The simulation results are compared with the measured data. The model’s reliability is verified if the comparison results achieve a high agreement.
Figure 9 shows the comparison results between the simulation and measured data, achieving good consistency. The average speed test error was 11.7%, and the maximum error was 22.7%. The average error of the dust concentration test was 13.9%, and the maximum error was 27.2%. The verification test shows that the simulation results of the model were reliable.

4. Results and Discussion

Fan efficiency was an essential indicator of tunnel construction ventilation, so it evaluated each operating condition. η denotes the shaft power and motor power of the fan, which can be written as [2,31]:
η = Q a p t o t 1000 S K W ( 237 + T 0 273 + T 1 ) p 1 p 0
where Qa denotes the fan flow in m3/s; Ptot denotes the fan full-pressure in N/m2; SKW denotes the mechanical motor power in KW; t0 denotes the standard temperature, taking 20 °C; t1 denotes the ambient temperature in °C; P1 denotes the ambient air pressure of fan in Pa; and P0 denotes the standard atmospheric pressure, taking 101,325 Pa.
Multiple fans work simultaneously in the air cabin to transfer wind from the air cabin to the driving face. Therefore, the fan efficiency significantly affects the ventilation effect. According to Equation (19), other variables that affect the fan efficiency are fixed values in the case of a determined fan model, except for p1. The p1 changes as the working conditions change. During the simulation calculation, the fan efficiency cannot be visually represented, so the change of P1 is used to represent the change in fan efficiency and, thus, the ventilation efficiency, where P1 is positively correlated with the change in fan efficiency. Therefore, the greater the differential pressure between the air cabin inlet and the fan inlet, the higher the fan efficiency.
p1 can be written as:
p 1 = p a p f
where Pa denotes the total pressure of the air cabin inlet in Pa, and Pf denotes the total pressure of the fan inlet in Pa.

4.1. Effect of Length–Width Ratio R of Air Cabin on Fan Efficiency

The height and width of the air cabin are limited by the tunnel dimensions and cannot be freely changed; therefore, they are not considered. The height of the air cabin H is =3.9 m, and the width D is 11 m. This paper studied the influence of the length–width ratio R on ventilation efficiency and proposed the optimal R. The length–width ratio R was set to 1:1, 1:1.5, 1:2, 1:2.5, and 1:3, respectively. The air duct is 1 m high from the bottom of the air cabin, so the 1.8 m high test section was selected to study the airflow. The differential pressure of the fan is calculated by measuring the total pressure at the inlet of the left- and right-side fans and the duct outlet. Two fans were set up in the air cabin at this time, showing a left and right axisymmetric distribution.
Figure 10a shows the airflow field distributions corresponding to the 1.8 m height for length–width ratio R = 1:2. Fresh air is divided into two air streams after entering the air cabin from the air inlet, and the fans obtain each air stream. Vortexes are formed on both sides of the air cabin inlet. Figure 10b shows that the difference pressure shows a trend of increasing and then decreasing with the increase of R. When the length–width ratio R increased from 1:1 to 1:2, the differential pressure of the right fan increased by 7.52%, and the left fan increased by 7.09%. When the length–width ratio R increased from 1:2 to 1:3, the differential pressure value decreased slowly, the differential pressure of the right fan increased by 3.91%, and the left fan increased by 3.44%. The differential pressure of the fan is maximum when the R is 1:2, the maximum differential pressure of the right fan is 399.87 Pa, and the left fan is 388.11 Pa. Considering the construction cost and other factors, the best length–width ratio R of the air cabin is 1:2.

4.2. Effect of Fan Spacing S on Fan Efficiency

When the length–width ratio R = 1:2 was determined, this paper investigated the effect of the fan spacing S on the ventilation efficiency. At this time, three fans were set up in the air cabin, two fans on the left side: 1# left fan and 2# left fan, and one fan on the right side. This paper studies the effect of the spacing of the two fans on the left side on the differential pressure. The fan spacing S between the two fans on the left was set as 2 m, 4 m, 6 m, and 8 m, respectively.
Figure 11a shows the airflow field distributions corresponding to 1.8 m height at fan spacing S = 4 m. Due to the significant difference in air demands on both sides of the air cabin, the flow field is not uniformly distributed compared to Figure 10a. The average wind speed on the left side was 53.28% higher than on the right. To reduce this phenomenon, setting up a middle diaphragm in the air cabin is necessary.
Figure 11b shows that when the fan spacing S increased from 2 m to 8 m, the differential pressure of the right-side fan and 1# left-side fan changed slightly, about 1.1%. With the increase of fan spacing S, the differential pressure of 2# left side fan first increases and then decreases. As the S increases from 2 m to 4 m, the differential pressure of the 2# left fan increases slightly by 0.2%. When increasing the S from 4 m to 8 m, the differential pressure decreased significantly by approximately 4.8%. To ensure the overall efficiency of three fans, the fan spacing S between 2 and 4 m was kept.

4.3. Effect of Middle Diaphragm Length on Fan Efficiency

To reduce the phenomenon of suction of fans, set up a middle diaphragm in the air cabin, as shown in Figure 12. The length of the diaphragms is the object of study in this paper. Due to the limitation of tunnel height, the middle diaphragm height was not studied.
When the length–width ratio R = 1:2, this paper studied the influence of middle diaphragm length on ventilation efficiency. At this time, three fans were set up in the air cabin, with two fans on the left side spaced at s = 4 m and one on the right side. The middle diaphragm length was set as 1/4 D, 1/3 D, 1/2 D, 1/1.5 D, and 1/1 D, respectively.
Comparing Figure 11a with Figure 13a, the difference in wind speed between the left and right sides was reduced from 53.28% to 35.84%. The use of the middle diaphragm reduces the phenomenon of suction of fans. Figure 13b shows that the efficiency of the three fans decreases to different degrees with the use of the middle diaphragm. For the right-side fan, the differential pressure remained stable when the length of the middle diaphragm was increased to 1/1.5 D. As the length increased from 1/1.5 D to D, the differential pressure decreased by 4.08%. The differential pressure of 1#left fan tends to increase first and then decrease with the increase of the length of the middle diaphragm. When the length increases to 1/1.5 D, the differential pressure is relatively high. This condition is 1.73% less than the condition without the middle diaphragm. The differential pressure of the 2#left fan decreases, then increases and decreases with the increase of the middle diaphragm length. Two high points of differential pressure exist at this time, located at 1/4 D and 1/1.5 D, respectively. When the length increased to 1/4 D and 1/1.5 D, the differential pressure was reduced by 1.27% and 3.76%, respectively. Considering the efficiency of the three fans, the middle diaphragm length is kept as 1/1.5 D.

4.4. Effect of Angle of the Middle Diaphragm in “Y” Shape on Fan Efficiency

The vertical collision between the airflow and the air cabin sidewall produced a significant local pressure loss, and a “Y”−shaped middle diaphragm is proposed to reduce it. When the length−width ratio R = 1:2, this paper studied the influence of the angle of the middle diaphragm in the “Y” shape on fan efficiency. At this time, three fans were set up in the air cabin, with two on the left side spaced at S = 4 m and one on the right side. The angle was set as 0°, 30°, 45°, 60°, and 90°, respectively. When the angle was set as 45°, the “Y”−shaped middle diaphragm is shown in Figure 14.
As shown in Figure 15a, two vortex regions are on both sides of the air cabin. Figure 15b shows that the pressure difference between the three fans gradually decreases as the angle of the middle bulkhead increases from 30° to 90°. When the angle of the middle partition is 30°, the differential pressure of the right fan decreases by 0.13%, the differential pressure of the #1 left fan decreases by 1.83%, and the differential pressure of the #2 left fan increases by 6.23% compared to the angle of 0°. Based on the ventilation efficiency and local energy loss, the best ventilation effect is achieved when the bending angle of the “Y” middle diaphragm is 30°.
The local pressure loss due to airflow collision under different working conditions is shown in Figure 16. The local pressure loss reached 82.79 Pa when the middle diaphragm angle was 0°. With the angle increased to 30°, the local pressure loss sharply decreased by 59.40%. The angle increased from 30° to 45°; it slightly decreased by 53.48%; and as the angle increased to 90°, it slowly increased by approximately 11.32%.

4.5. Effect Evaluation of Air Cabin Ventilation System

Numerical simulations were conducted to study the dust removal effect of the air cabin ventilation system. The model length was set to 300 m, and the continuous diffusion time was 600 s. This paper studied the distribution of pollutant concentrations in the tunnel after 600 s of ventilation.
As shown in Figure 17, the peak value of dust concentration gradually moved away from the driving face with the increase in ventilation time. It is indicated that the dust keeps moving toward the inclined shaft and is finally discharged under tunnel ventilation. As can be seen from Figure 17a, the dust concentration near the driving face is very high, reaching 51.4 mg/m3 on the left tunnel within 100 m of the driving face and 67 mg/m3 on the right tunnel. Under the wind flow, the dust from the driving face of the left tunnel has passed through the cross passage and reached the right tunnel and the inclined shaft. The dust from the right driving face reached the inclined shaft and discharged through the exhaust duct. After 600 s, the dust released from the driving face stopped. From Figure 17b, the dust concentration near the driving face is significantly reduced after the dust release stops. The average dust concentration within 100 m of the driving face is less than 30 mg/m3. At this time, the peak dust concentration is located at 150 m from the driving face. Comparing Figure 17a–e, the dust concentration in the tunnel is significantly lower. After 1200 s, the dust concentration within 100 m near the driving face is lower than the dust concentration limit of 4 mg/m3 in the specified working area [30]. The construction environment under the air cabin ventilation system is good and has a good reference for similar projects.

5. Conclusions

This study proposed a new air cabin ventilation system for tunnel construction. The energy consumption of blowing ventilation and air cabin ventilation was compared through calculation. A numerical model was employed to discuss the influence of the air cabin length–width ratio, fan spacing, middle diaphragm length, and angle on fan efficiency. The diffusion of pollutants evaluated the ventilation effect of the optimized ventilation system. The main results are as follows:
(1)
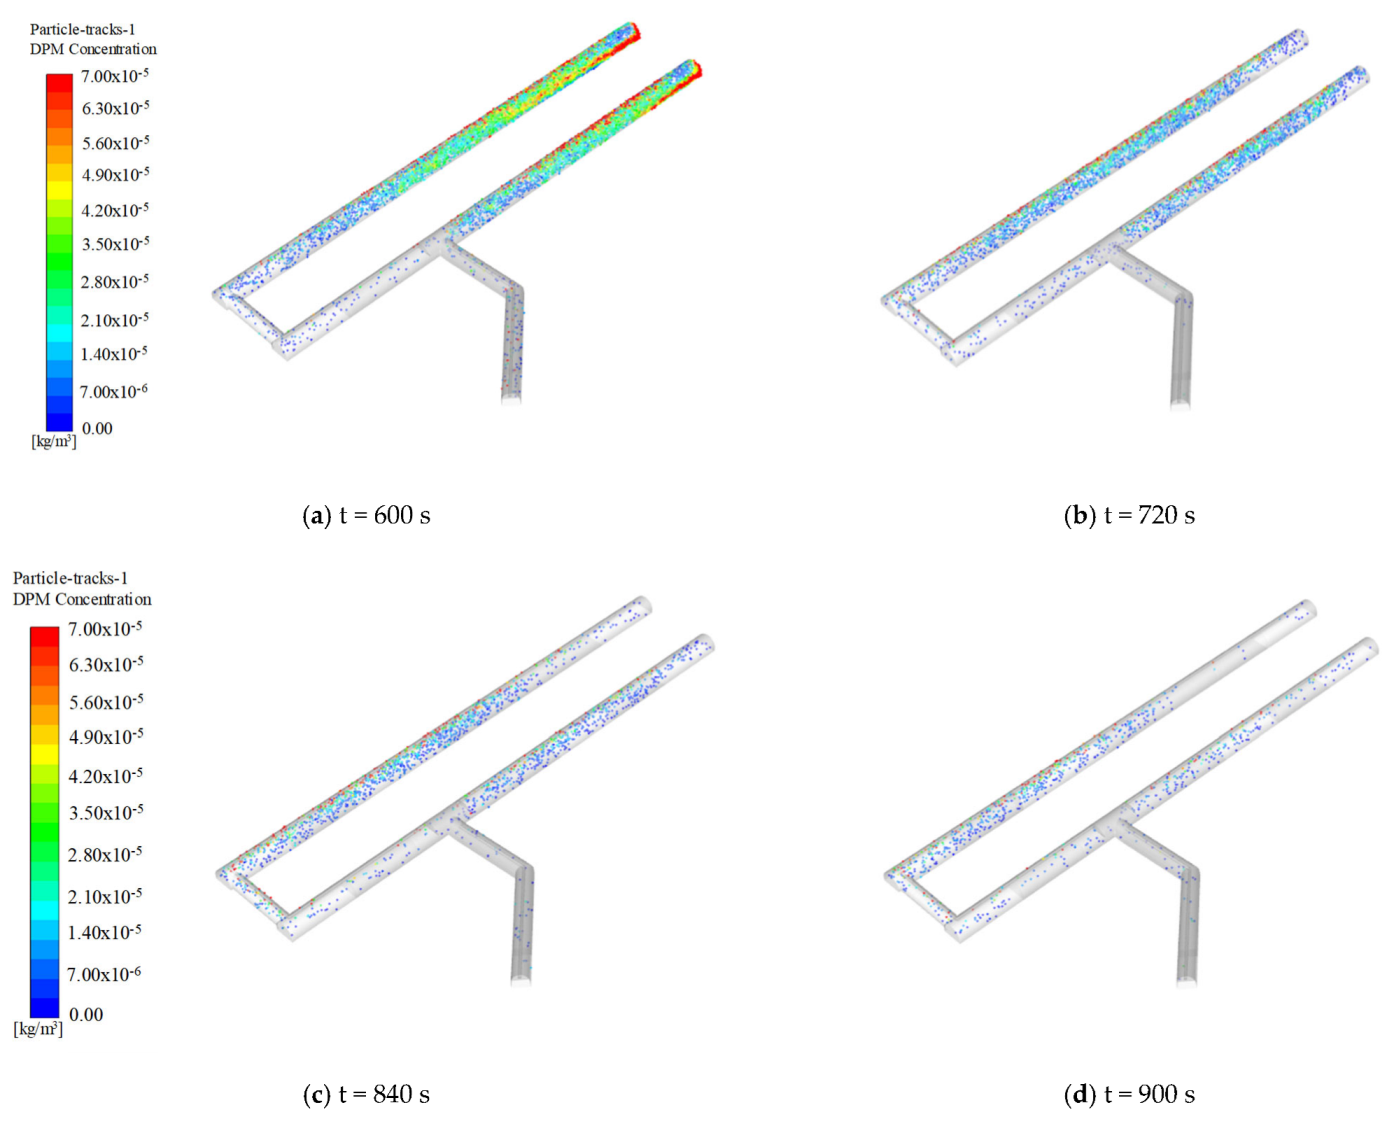
The air cabin ventilation system reduces the ventilation energy consumption and fully uses the inclined shaft’s clearance section. A numerical model was developed to simulate the air cabin ventilation system. The model’s simulation results are reliable, as verified by the actual measurement data in the field. The ventilation system has a good dust removal effect and ensures a healthy construction environment.
(2)
Increasing the length of the air cabin makes the wind flow develop more fully, which is the same as the results of other scholars. The pressure difference of the fan is the maximum when the length–width ratio R of the air cabin is 1:2, which satisfies the wind flow wind development demand.
(3)
The change of fan spacing has less effect on the pressure difference between the two fans arranged in axisymmetry. As the spacing between two fans on the same side increases, the vortex area increases, and the greater the impact on the differential pressure of the 2# fan. As S increases from 2 m to 4 m, the differential pressure of the 2# fan increases slightly by 0.2%. The fan spacing S is taken as 2−4 m to ensure the ventilation efficiency of the three fans.
(4)
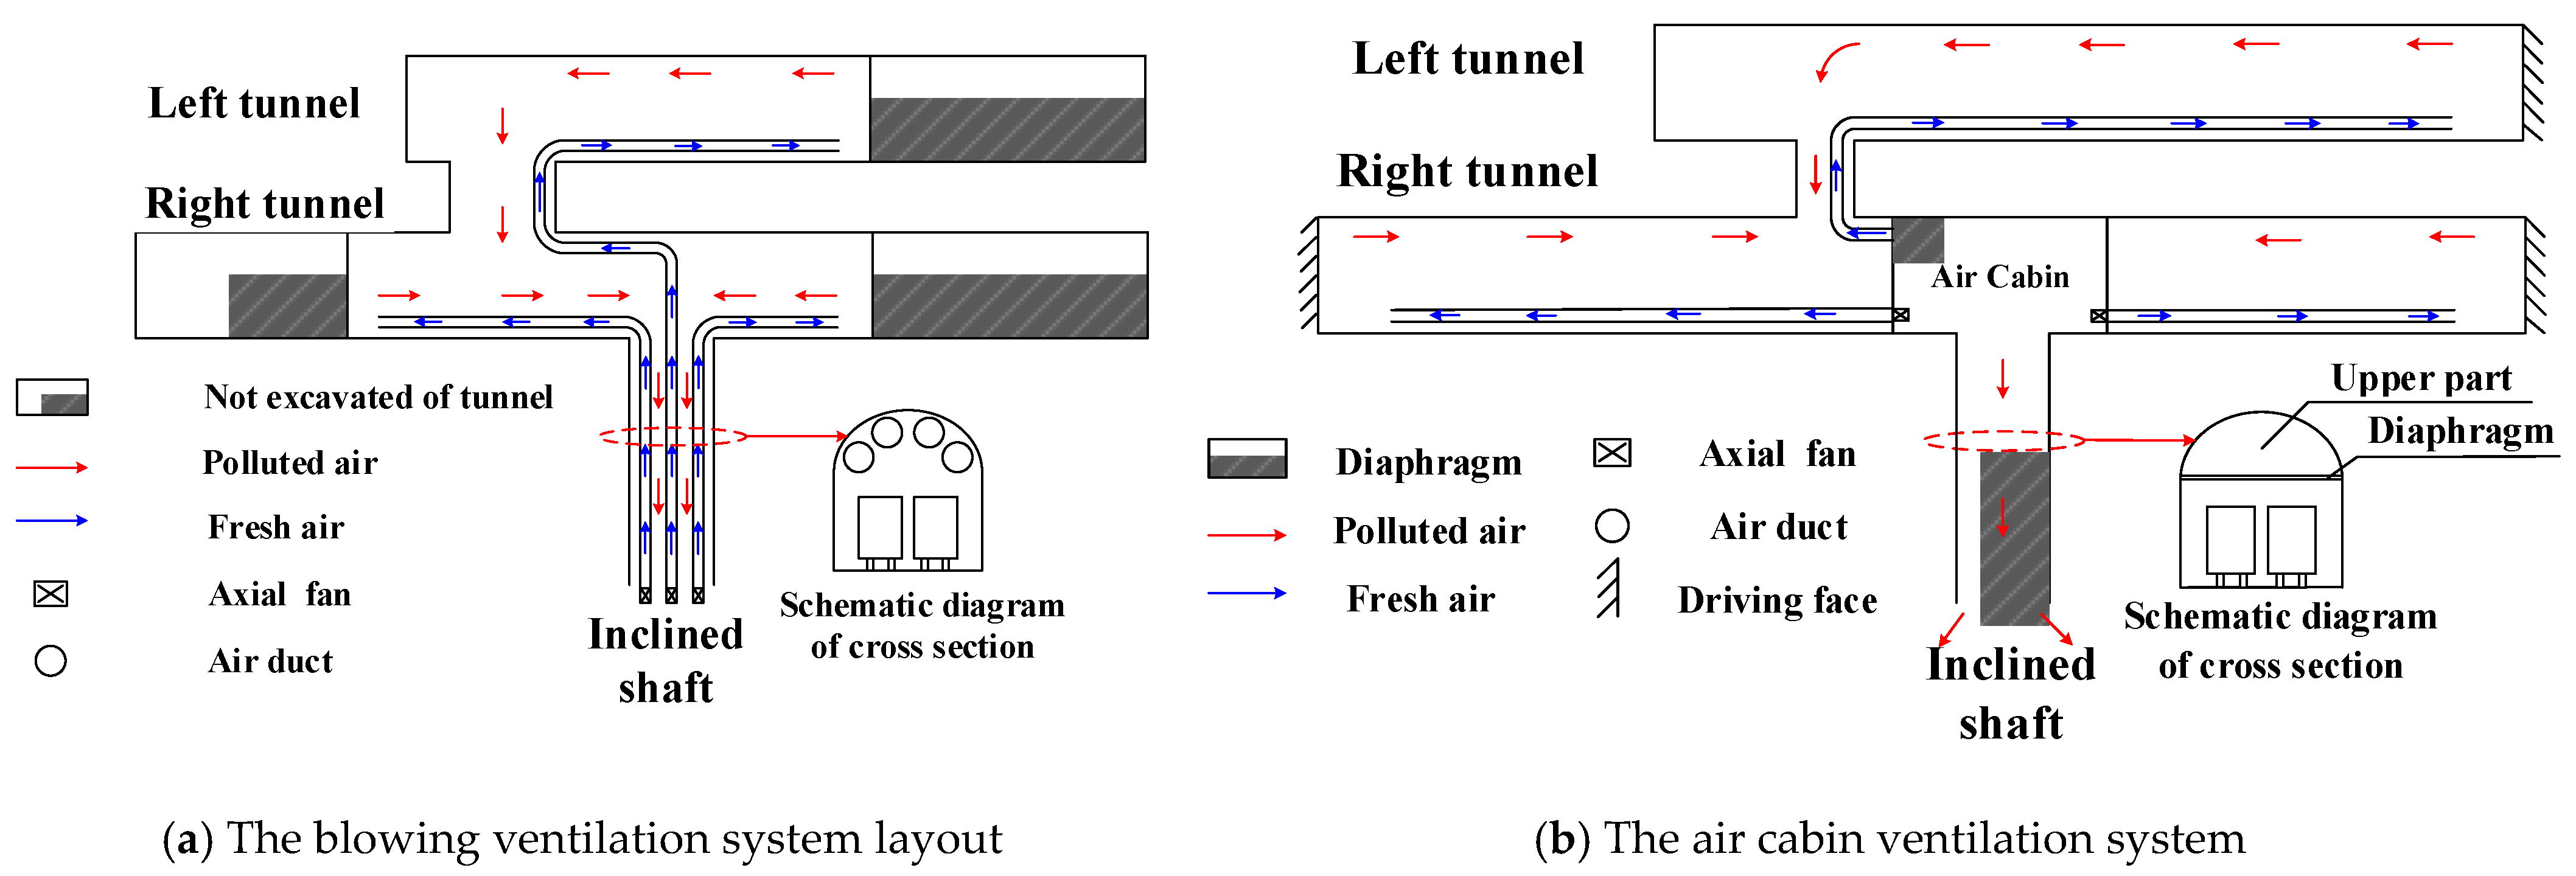
When the difference in air demand between the two sides of the air cabin is large, the distribution of the flow field is not uniform, and the phenomenon of suction of fans occurs. The average wind speed on the left side was 53.28% higher than on the right. The middle diaphragm can reduce the phenomenon while generating a larger local pressure loss. The difference in wind speed between the left and right sides was reduced to 35.84%. A “Y”−shaped middle diaphragm with an angle can reduce local loss. When the angle is 30°, the local pressure loss sharply decreased by 59.40%.
(5)
This paper uses the control variable method to study each factor’s effect on the fan’s efficiency without considering the interaction between the factors. Therefore, subsequent research can design orthogonal experiments to improve the final combination of air cabin design parameters.

Author Contributions

Conceptualization, Y.-Q.W. and R.R.; methodology, S.Y. and R.R.; software, S.Y. and R.R.; validation, S.Y. and Y.-Q.W.; formal analysis, S.Y.; investigation, Y.-Q.W.; resources, R.R.; data curation, Y.-Q.W.; writing—original draft preparation, S.Y. and R.R.; writing—review and editing, S.Y. and R.R.; visualization, R.R.; supervision, Y.-Q.W.; project administration, S.Y.; funding acquisition, Y.-Q.W. and R.R. All authors have read and agreed to the published version of the manuscript.

Funding

The National Natural Science Foundation of China, No.5197082676, funder: Y.-Q.W.; The National Natural Science Foundation of China, No.51908061, funder: R.R.

Data Availability Statement

The data used to support the findings of this study are available from the corresponding author upon request.

Conflicts of Interest

The authors declare no conflict of interest.

Abbreviations

SymbolsNotes
AThe sectional area of the driving face
dThe equivalent diameter of the air passage section
DThe width of the air cabin
GTotal explosive mass
hgThe friction resistance of the air duct
hg11The local resistance of the air duct
hvThe dynamic pressure loss at the air duct outlet
HThe height of the air cabin
HtThe total pressure of the ventilation system
g i The acceleration of gravity in direction i
G k The term for the generation of turbulent kinetic energy k due to the mean velocity gradient
kThe air demand per unit power of machinery
k1The effective utilization coefficient of mechanical power
k2The working coefficient of mechanical power
LDuct length
L0Ventilation length
N The maximum number of people
NiThe power of machinery operating
NtThe total power of the ventilation system
PThe static pressure
p1The ambient air pressure of the fan
p0The standard atmospheric pressure
paThe total pressure of the air cabin inlet
PfThe total pressure of the fan inlet
ptotFan full-pressure
qThe air volume required per person per minute
Q0Air demand
QaFan flow
QbAir demand for discharging the dust produced by blasting
QfThe air volume of the forced draft fan
QsThe total air demand for diluting mechanical exhaust gas
QvThe total air demand to meet the minimum air velocity
Q p Air demand for workers’ breathing
RThe length–width ratio of an air cabin
SThe fan spacing in the air cabin
S i The turbulent momentum source term
SKWThe mechanical motor power
tVentilation time
T0Standard temperature
T1Ambient temperature
vThe minimum air velocity
v1The wind speed of the air duct outlet
v i The component of flow velocity in the x i direction
x i The right angle coordinates
Y s The component mass fraction
ρAir density
βThe average value of 100 m air leakage rate
σ k The Prandtl number of the K equation
σ ε The Prandtl number of the ε equation
ε The turbulent energy dissipation rate
μ The laminar viscosity coefficient
λFriction coefficient
ηFan efficiency
ξ Local resistance coefficient

References

  1. Jiang, S.; Lin, Z.; Wang, S. Development of highway tunnels in China in 2018. Tunn. Constr. 2019, 39, 1217–1220. [Google Scholar]
  2. Tao, Y.; Hu, H.; Zhang, H.; Zhang, G.; Hao, Z.; Wang, L. A new ventilation system for extra-long railway tunnel construction by using the air cabin relay: A case study on optimization of air cabin parameters length. J. Build. Eng. 2022, 45, 103480. [Google Scholar] [CrossRef]
  3. Li, K.; Mao, S.; Yang, H.; Zhang, F.; Guo, C. Study on Optimization of Mixed Construction Ventilation for Super Long Tunnel. Mod. Tunn. Technol. 2020, 57 (Suppl. S1), 686–692. [Google Scholar]
  4. Wang, F.; Luo, F.; Xu, H.; Wang, Y. Calculation method of air temperature in tunneling section of open-type TBM construction. China Railw. Sci. 2019, 40, 64–70. [Google Scholar]
  5. Zeng, Y.; Tao, L.; Ye, X.; Zhou, X.; Fang, Y.; Fan, L.; Liu, X.; Yang, Z. Temperature reduction for extra-long railway tunnel with high geotemperature by longitudinal ventilation. Tunn. Undergr. Space Technol. 2020, 99, 103381. [Google Scholar] [CrossRef]
  6. Chen, Y.; He, X.; Lin, G.; Ping, W. Research on safety risk early warning of tunnel construction based on BIM and RFID Technology. E3S Web Conf. EDP Sci. 2021, 293, 02048. [Google Scholar]
  7. Yu, H.; Cheng, W.; Xie, Y.; Pengm, H. Micro-scale pollution mechanism of dust diffusion in a blasting driving face based on CFD-DEM coupled model. Environ. Sci. Pollut. Res. 2018, 25, 21768–21788. [Google Scholar] [CrossRef]
  8. Zhou, W.; Nie, W.; Liu, C.; Liu, Q.; Hetang, W.; Wei, C.; Yan, J.; Yin, S.; Xiu, Z.; Xu, C. Modelling of ventilation and dust control effects during tunnel construction. Int. J. Mech. Sci. 2019, 160, 358–371. [Google Scholar] [CrossRef]
  9. Chang, X.; Chai, J.; Luo, J.; Qin, Y.; Xu, Z.; Cao, J. Tunnel ventilation during construction and diffusion of hazardous gases studied by numerical simulations. Build. Environ. 2020, 177, 106902. [Google Scholar] [CrossRef]
  10. Li, Z.; Xie, W.; Wang, M.; Yu, L. Ventilation energy saving technology for Hongtiguan extra-long highway tunnel construction. J. Railw. Sci. Eng. 2016, 13, 760–766. [Google Scholar]
  11. Zhang, H.; Sun, J.; Lin, F.; Wang, L. Optimization on energy saving ventilation of gallery-type combined construction shaft exhaust in extra long tunnel. Procedia Eng. 2017, 205, 1777–1784. [Google Scholar] [CrossRef]
  12. Chang, X.; Chai, J.; Liu, Z.; Qin, Y.; Xu, Z. Comparison of ventilation methods used during tunnel construction. Eng. Appl. Comput. Fluid Mech. 2020, 14, 107–121. [Google Scholar] [CrossRef] [Green Version]
  13. Liu, R.; He, Y.; Zhao, Y.; Jiang, X.; Ren, S. Tunnel construction ventilation frequency-control based on radial basis function neural network. Autom. Constr. 2020, 118, 103293. [Google Scholar] [CrossRef]
  14. Zhao, Z.; Xiao, Y.; Jiang, C.; Ren, Z.; Li, X.; Yu, K. Numerical study on fine dust pollution characteristics under various ventilation time in metro tunnel after blasting. Build. Environ. 2021, 204, 108111. [Google Scholar]
  15. Cao, Z.; Yang, Q.; Guo, C. Optimization of clapboard with wind box type construction ventilation in super-long railway tunnel. In Civil Engineering and Urban Planning III; CRC Press: Boca Raton, FL, USA, 2014; p. 267. [Google Scholar]
  16. Torno, S.; Toraño, J. On the prediction of toxic fumes from underground blasting operations and dilution ventilation. Conventional and numerical models. Tunn. Undergr. Space Technol. 2020, 96, 103194. [Google Scholar] [CrossRef]
  17. Toraño, J.; Torno, S.; Menéndez, M.; Gent, M. Auxiliary ventilation in mining roadways driven with roadheaders: Validated CFD modelling of dust behaviour. Tunn. Undergr. Space Technol. 2011, 26, 201–210. [Google Scholar] [CrossRef]
  18. Luo, Y.; Han, J.; Wen, Z.; Wen, Z.; Luo, Y.; Liu, F. Optimization of Ventilation Scheme of Jinjiazhuang Extra-long Spiral Tunnel. Tunn. Constr. 2019, 39 (Suppl. S1), 385–391. [Google Scholar]
  19. Zhang, H.; Zhang, J.; Zhou, S.; Sun, J.C.; Wu, J. Deciding and determination of the key parameters of the relay ventilation based on the air cabin and its effect in the ultra-long tunnel. J. Saf. Environ. 2019, 19, 795–803. [Google Scholar]
  20. Song, J.; Wan, X.; Guo, C. Study on Construction Ventilation Scheme of Air Cabin for An′ding Tunnel on Yumo Railway. Mod. Tunn. Technol. 2020, 57, 232–238. [Google Scholar]
  21. Han, X.M.; Sun, M.L.; Zhu, Y.Q. Application of combined clapboard and vent-pipe ventilation techniques in the construction of extra-long tunnels on a plateau. Mod. Tunn. Technol. 2016, 5, 208–215. [Google Scholar]
  22. Liu, G. An Application of Relay Ventilation in the Construction of a Water-conveyance Tunnel. Tunn. Constr. 2013, 33, 785–790. [Google Scholar]
  23. Zhou, S. Numerical analysis on air cabin construction ventilation effect in extra long railway tunnel. Sichuan Archit. 2018, 38, 222–225. [Google Scholar]
  24. Liu, X.; Yang, Q.; Jiang, Y.; Cao, Z. The Simulation Computing Research on Air Cabin Construction Ventilation in Underground Storage Caverns. Chin. J. Undergr. Space Eng. 2015, 11, 462–468. [Google Scholar]
  25. Chen, H. Study of Optimization of Construction Ventilation of Wanhua Yantai Underground Liquefied Hydrocarbon Water-sealed Cavern Group. Tunn. Constr. 2017, 37, 230–235. [Google Scholar]
  26. Luo, G.; Liu, C.; Jia, H.; Zhang, Y.; Wang, H. Study on Optimization of Ventilation Parameters of Air Cabin in Long Highway Tunnel. Constr. Technol. 2020, 49, 57–60. [Google Scholar]
  27. Atinc, G.; Simmering, M.J.; Kroll, M.J. Control variable use and reporting in macro and micro management research. Organ. Res. Methods 2012, 15, 57–74. [Google Scholar] [CrossRef]
  28. Bernerth, J.B.; Aguinis, H. A critical review and best-practice recommendations for control variable usage. Pers. Psychol. 2016, 69, 229–283. [Google Scholar] [CrossRef]
  29. JTG/T 3600-2020; Technical Specifications for Construction of Highway Tunnel. Ministry of Communications of PRC: Beijing, China, 2020.
  30. Niu, J.; Zheng, Q.; Lv, D.; Wang, Y. Numerical simulation of the effect of air-intake on the indoor flow field of a dedusting equipment cabin used in tunnel construction. Alex. Eng. J. 2022, 61, 12405–12416. [Google Scholar] [CrossRef]
  31. Caliendo, C.; Genovese, G.; Russo, I. A 3D CFD modeling for assessing the effects of both longitudinal slope and traffic volume on user safety within a naturally ventilated road tunnel in the event of a fire accident. IATSS Res. 2022, 46, 547–558. [Google Scholar] [CrossRef]
  32. Bogdan, S.; Birgmajer, B.; Kovačić, Z. Model predictive and fuzzy control of a road tunnel ventilation system. Transp. Res. Part C Emerg. Technol. 2008, 16, 574–592. [Google Scholar] [CrossRef]
  33. Ferkl, L.; Meinsma, G. Finding optimal ventilation control for highway tunnels. Tunn. Undergr. Space Technol. 2007, 22, 222–229. [Google Scholar] [CrossRef]
  34. Zhang, Z.; Tan, Y.; Zhang, H.; Zhao, Y.; Zhu, X. Experimental and numerical study on the influence of wall roughness on the ventilation resistance coefficient in a tunnel under construction. Tunn. Undergr. Space Technol. 2022, 119, 104198. [Google Scholar] [CrossRef]
Figure 1. Ventilation system diagram.
Buildings 12 02235 g001
Figure 2. Comparison diagram of the energy consumption.
Buildings 12 02235 g002
Figure 3. Calculation process.
Buildings 12 02235 g003
Figure 4. Schematic of the physical model.
Buildings 12 02235 g004
Figure 5. The meshing of the three grids.
Buildings 12 02235 g005
Figure 6. Comparison of the average air velocity of the three grids.
Buildings 12 02235 g006
Figure 7. Test instrument.
Buildings 12 02235 g007
Figure 8. Test section layout.
Buildings 12 02235 g008
Figure 9. Comparison between the simulation result and field test.
Buildings 12 02235 g009
Figure 10. Airflow field distribution and differential pressure in different R.
Buildings 12 02235 g010
Figure 11. Airflow field distribution and differential pressure in different S.
Buildings 12 02235 g011
Figure 12. The middle diaphragm of the air cabin.
Buildings 12 02235 g012
Figure 13. Airflow field distribution and differential pressure in different lengths of the middle diaphragm.
Buildings 12 02235 g013
Figure 14. The “Y”−shaped middle diaphragm.
Buildings 12 02235 g014
Figure 15. Airflow field distribution and differential pressure in different angles of the middle diaphragm.
Buildings 12 02235 g015
Figure 16. Local resistance in different angles of the middle diaphragm.
Buildings 12 02235 g016
Figure 17. Dust distribution under the air cabin ventilation system.
Buildings 12 02235 g017aBuildings 12 02235 g017b
Table 1. Air demand in the theoretical calculations.
Working ConditionAir Demand (m3/min)
The total air demand for breathing of workers180
The total air demand for discharging the dust produced by blasting1220
The total air demand to meet the minimum air velocity738
The total air demand for diluting mechanical exhaust gas878.4
Q 0 = max ( Q p , Q b , Q v , Q s ) 1220
Table 2. Ventilation calculation parameters.
ItemParameter
100 m air leakage rate of air duct (%)1.5
The friction coefficient of the air duct0.02
Air demand of driving face (m3/min)1220
Ventilation length of the inclined shaft (m)1030
Left tunnelVentilation length of small mileage (m)1230
Right tunnelVentilation length of small mileage (m)1793
Ventilation length of large mileage (m)100
Duct diameter (m)1.6
Air density (kg/m3)1.004
Table 3. Energy consumption of a blowing ventilation system.
ItemCalculated Value
Air volume (m3/s)Small mileage of left tunnel28.64
Small mileage of right tunnel31.28
Large mileage of right tunnel24.12
Resistance of air duct (Pa)Resistance along the air duct 2863.62
Local resistance at fan inlet82.99
Local resistance at Three bends of air duct53.77
Dynamic pressure loss at the air outlet of the air duct51.39
Resistance at the inclined shaft (Pa)Friction resistance of the inclined shaft99.96
Local resistance of inclined shaft air inlet1.03
Local resistance of inclined shaft air outlet8.66
Total resistance of ventilation system (Pa)3161.42
Total power of ventilation system (kW)347
Table 4. Energy consumption of air cabin ventilation system.
ItemCalculated Value
Air volume (m3/s)Small mileage of left tunnel23.76
Small mileage of right tunnel26.66
Large mileage of right tunnel20.64
Resistance of air duct (Pa)Resistance along the air duct1528.92
Local resistance at two bends of the air duct35.85
Dynamic pressure loss at the air outlet of the air duct51.39
Resistance of diaphragm (Pa)Friction resistance of the diaphragm552.28
Local resistance at the inlet of the inclined shaft fan79.09
Local resistance at the outlet of the inclined shaft fan25.7
Local resistance at the junction of the inclined shaft and tunnel diaphragm 64.92
Local resistance at the junction of the right tunnel and cross-passage diaphragm 3.01
Local resistance at the junction of tunnel diaphragm and fan24.15
Resistance at the inclined shaft (Pa)Friction resistance of the inclined shaft107.21
Local resistance of inclined shaft air inlet18.58
Local resistance of inclined shaft air outlet9.29
Total resistance of ventilation system (Pa)2500.39
Total power of ventilation system(kW)275
Table 5. Operating conditions.
Item12345
Length width ratio R1:11:1.51:21:31:4
Fan spacing S2 m4 m6 m8 m~
Length of the middle diaphragm1:1 D1:1.5 D1:2 D1:3 D1:4 D
The angle of the middle diaphragm 30°45°60°90°
Publisher’s Note: MDPI stays neutral with regard to jurisdictional claims in published maps and institutional affiliations.

