Article

Experimental Investigation of Indoor Thermal Comfort under Different Heating Conditions in Winter

1
School of Civil Engineering, Guangzhou University, Guangzhou 510006, China
2
Guangdong Provincial Key Laboratory of Building Energy Efficiency and Application Technologies, Guangzhou University, Guangzhou 510006, China
3
Guangzhou Planning, Survey, Design and Research Institute, Guangzhou 510006, China
*
Authors to whom correspondence should be addressed.
Buildings 2022, 12(12), 2232; https://doi.org/10.3390/buildings12122232
Submission received: 29 October 2022 / Revised: 25 November 2022 / Accepted: 8 December 2022 / Published: 15 December 2022

Abstract

:
Owing to historical reasons, only a few locations in the Guangdong province use heating to enhance interior thermal conditions. With the variation in climate and increase in people’s lifestyle requirements, winter heating has become increasingly necessary. However, a literature review revealed that only a few studies have investigated the heating requirements during winter in the Guangdong province. In this study, we compared the thermal comfort of radiant floor heating with wall-mounted air conditioner heating. A Guangzhou University climate chamber was used in several investigations. The findings revealed that the thermal neutral temperatures of radiant heating and air conditioner heating were 22.0 °C and 23.0 °C, respectively, about 1 °C variation in temperature. Additionally, in the research on thermal reactions and local skin temperature measurements, the impact of local thermal discomfort on the overall thermal experience was also considered. The findings showed a direct relationship between the local thermal discomfort caused by radiant heating and general thermal sensation. Thermal sensation of the subjects mainly originated from the lower extremities and was significantly affected by Va (air velocity). The relationship between the local thermal discomfort of convective heating and general thermal sensation was weak and mainly caused by the uneven thermal environment. Thus, in south China, for lowering energy usage, radiant floor heating should be used to create an improved indoor thermal environment in winter.

1. Introduction

China’s Pearl River Delta (PRD) is situated in a region characterized by hot, muggy summers, and chilly to mild winters [1]. For historical reasons, central heating has not been adopted in winter in this area. Some occupants use individual heating to create a comfortable indoor thermal environment [2]. Reducing the share of building energy consumption in the overall energy consumption is vital, given the rapid growth and urbanization of the economy. Some investigations have reported that heating energy consumption accounts for more than half of building energy consumption [3]. However, because living standards have recently improved, many residential buildings have heating terminals for thermal comfort [4]. The two most frequently employed heating terminals in these structures are air conditioners and radiant floor heating [5,6]. Moreover, with the deterioration of the global climate and recent carbon peaks, carbon neutrality has been proposed. Global awareness of the thermal comfort of various heating terminals has increased, particularly for radiant floor and air convection heating [7].

1.1. Literature Review and Problem Statement for the Work

The effects of convection and radiant heating on thermal comfort have been extensively investigated in human subjects. These studies evaluated the performance of different heating terminals in providing thermal comfort [8,9,10,11]. In addition, during actual operation, thermal comfort is accompanied by continuous or indirect operation [12,13,14]. According to Bozkr et al. [8], radiant systems outperform convective heating systems in terms of heating quality and comfort. According to the results of simulation and experimental research, the temperature distribution in radiant systems is generally even and consistent. In radiant systems, there is less danger of drafts because there is less air movement, as demonstrated by simulations of computational fluid dynamics and experiments by Catalina et al. [9]. Radiant heating systems use radiation heat transfer, which reduces noise production during operation and produces a more comfortable and quieter environment [10]. Based on experimental investigations, Imanari et al. [11] found that the use of radiant heating systems might reduce the vertical temperature disparities in a space, thereby enhancing thermal comfort ratings.
More recently, other approaches have been employed to understand the thermal comfort from continuous or indirect operations during the actual operation. According to Tian and Love [12], occupants liked a certain amount of draft to supply fresh air, and there were no appreciable differences in airflow during the continuous operation of radiant and convective terminals. Furthermore, Lin and Wang [13] discovered that even with greater air movement in a convective heating environment, there were no appreciable variations in the overall thermal experience between the long-term convective and radiant heating systems [14]. A constantly operating fired heater (FH) system, radiator, and a fan coil system were tested by Hu et al. for their ability to distribute temperature. According to the findings, there was no discernible variation in the thermal comfort between the various terminals.
In addition, the literature review shows that numerous studies have examined the thermal comfort parameters of various heating terminals. The relevant details and results are presented in Table 1.

1.2. Objectives and Significance for the Study

In the aforementioned context, it is easy to see that air convection heating and radiation floor heating typically have different comfort effects on the human body. However, the conclusions in the literature are inconsistent and contradictory. Therefore, more efforts are required to discuss the influence of two different types of FH and AC heating systems on thermal combustion, which is the first goal of this study.
The second goal of this study is to understand regional heat discomfort. Compared to air convection heating, radiant floor heating typically has various comfort effects on the human body because it affects different portions of the body differently. Because different bodily regions are given varying weights when calculating the overall body’s thermal comfort, two different heating terminals can cause differences in local thermal discomfort. Based on the current literature, neither equations nor local thermal discomfort curves have been created for these two heating systems. Therefore, further research is required to determine how well the two heating systems perform in terms of reducing local thermal discomfort.
Therefore, the results of this study provide a scientific research basis for thermal comfort response under different heating forms in South China, including the selection of heating forms and local thermal response. This study provides reference and support for winter heating in hot summer and warm winter areas, and is important for the development of the economy and the promotion of the low-carbon era to ensure the thermal comfort of residents and the low-carbon rationality of heating forms.

2. Materials and Methods

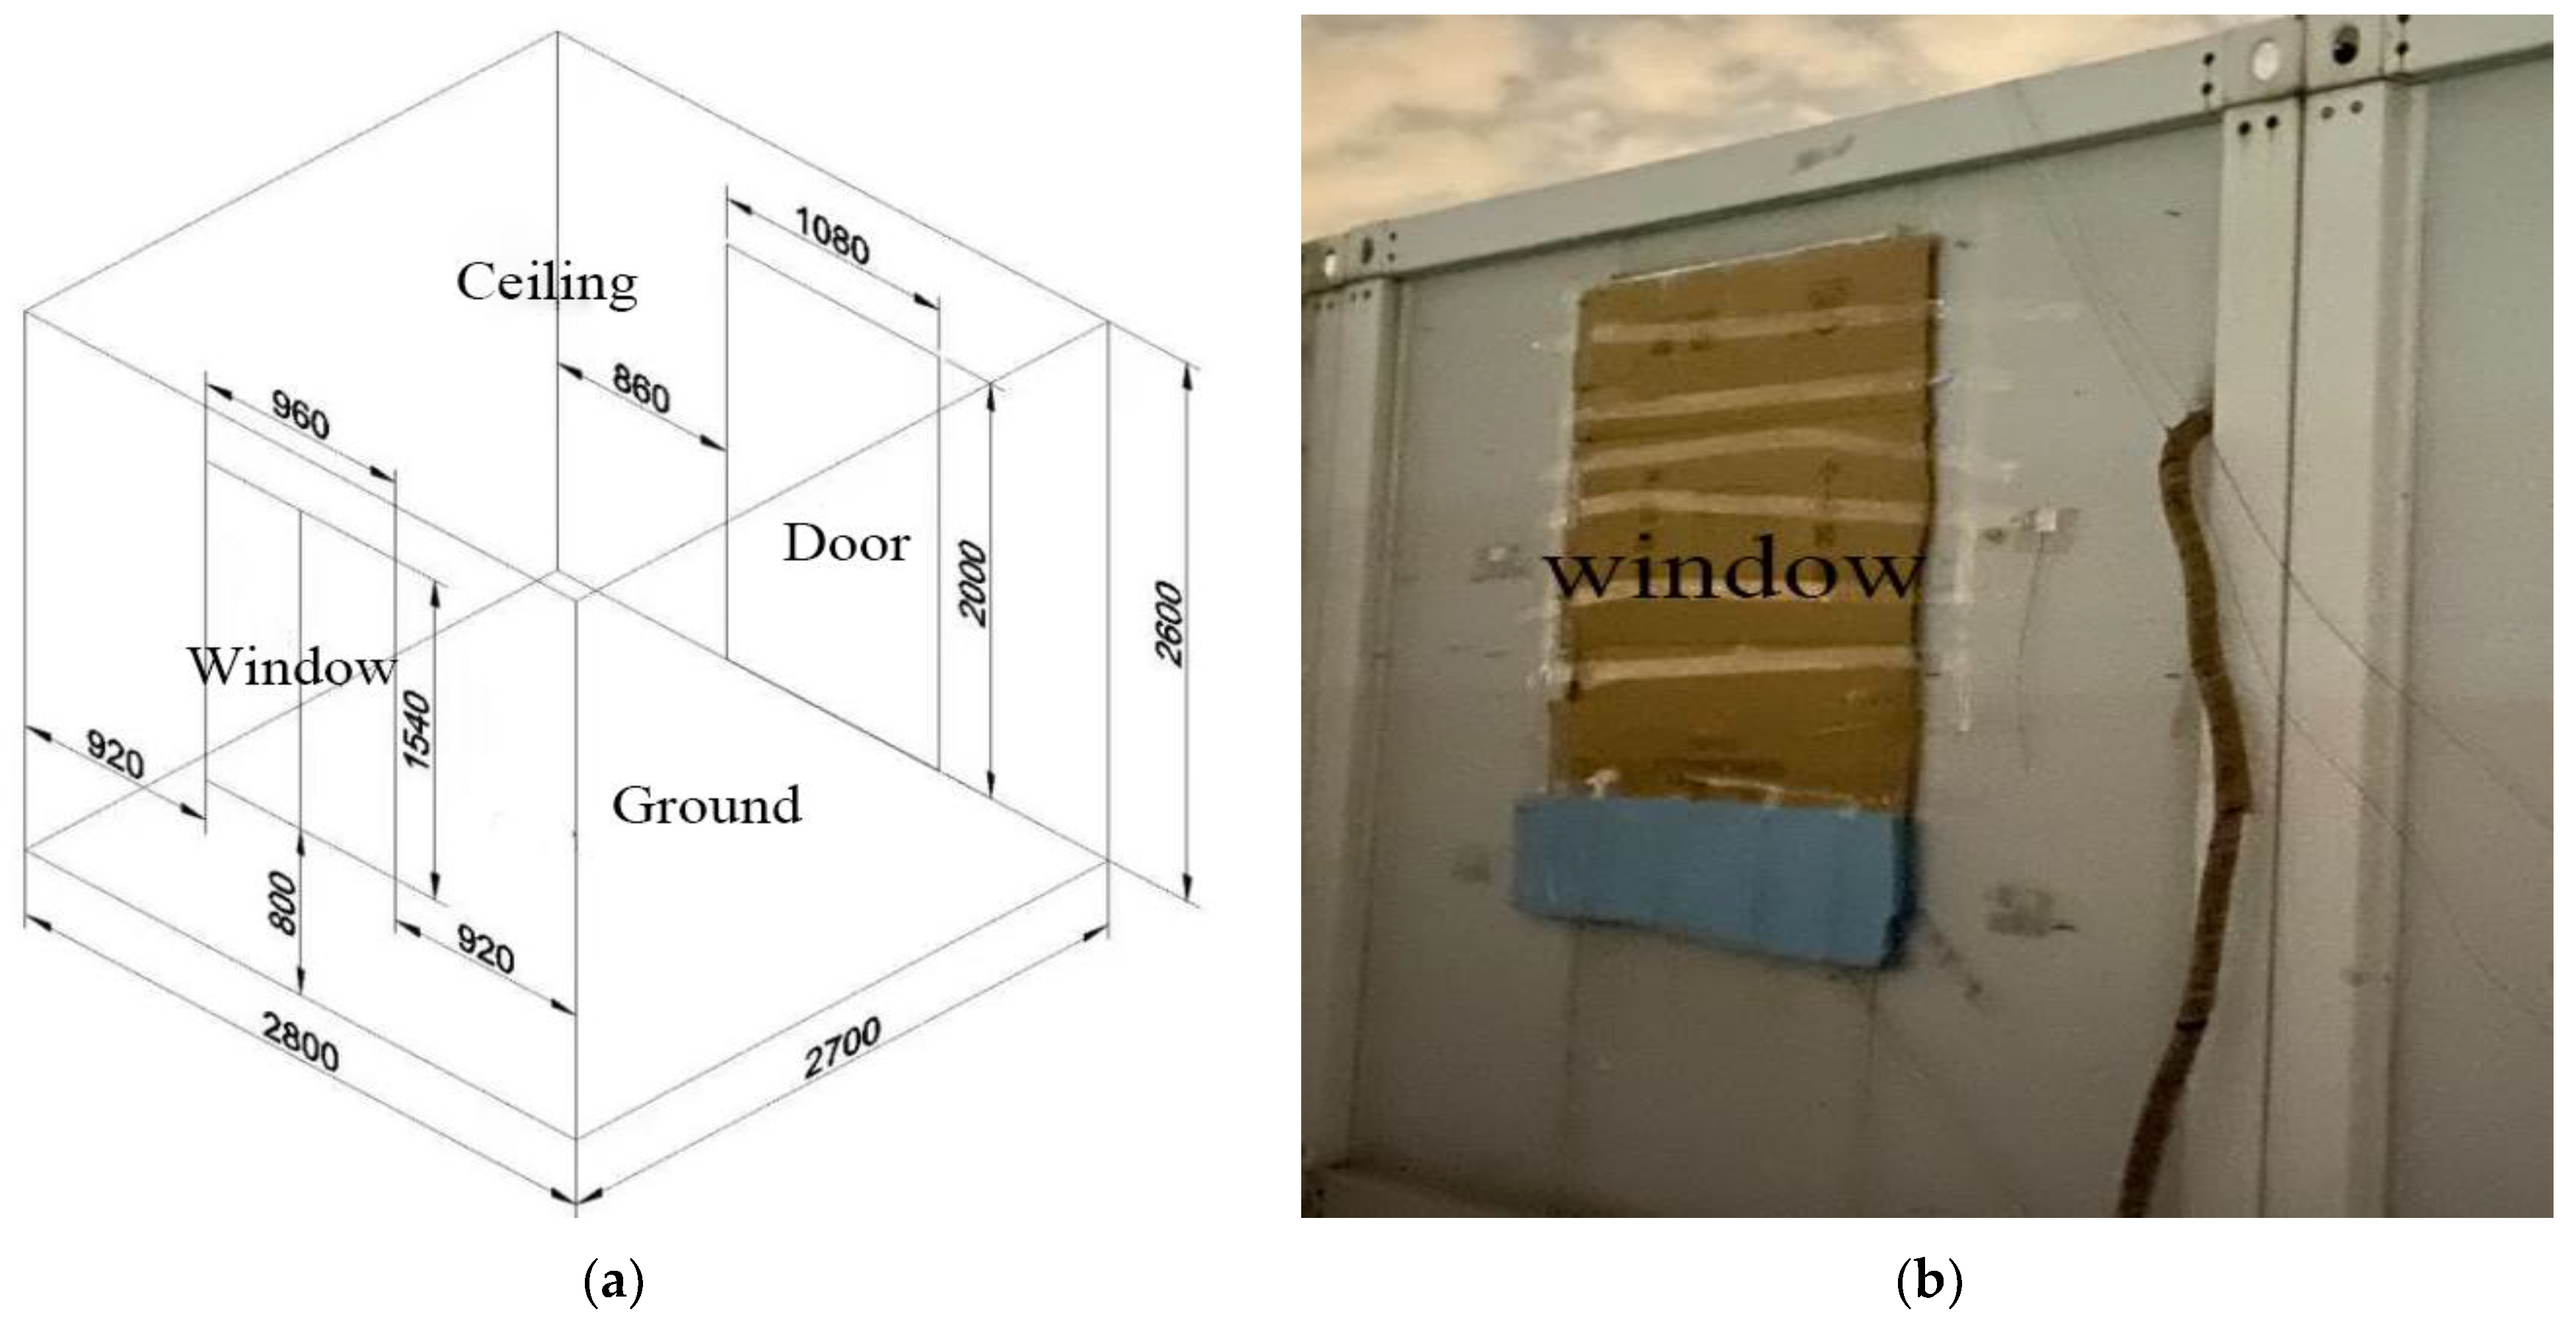
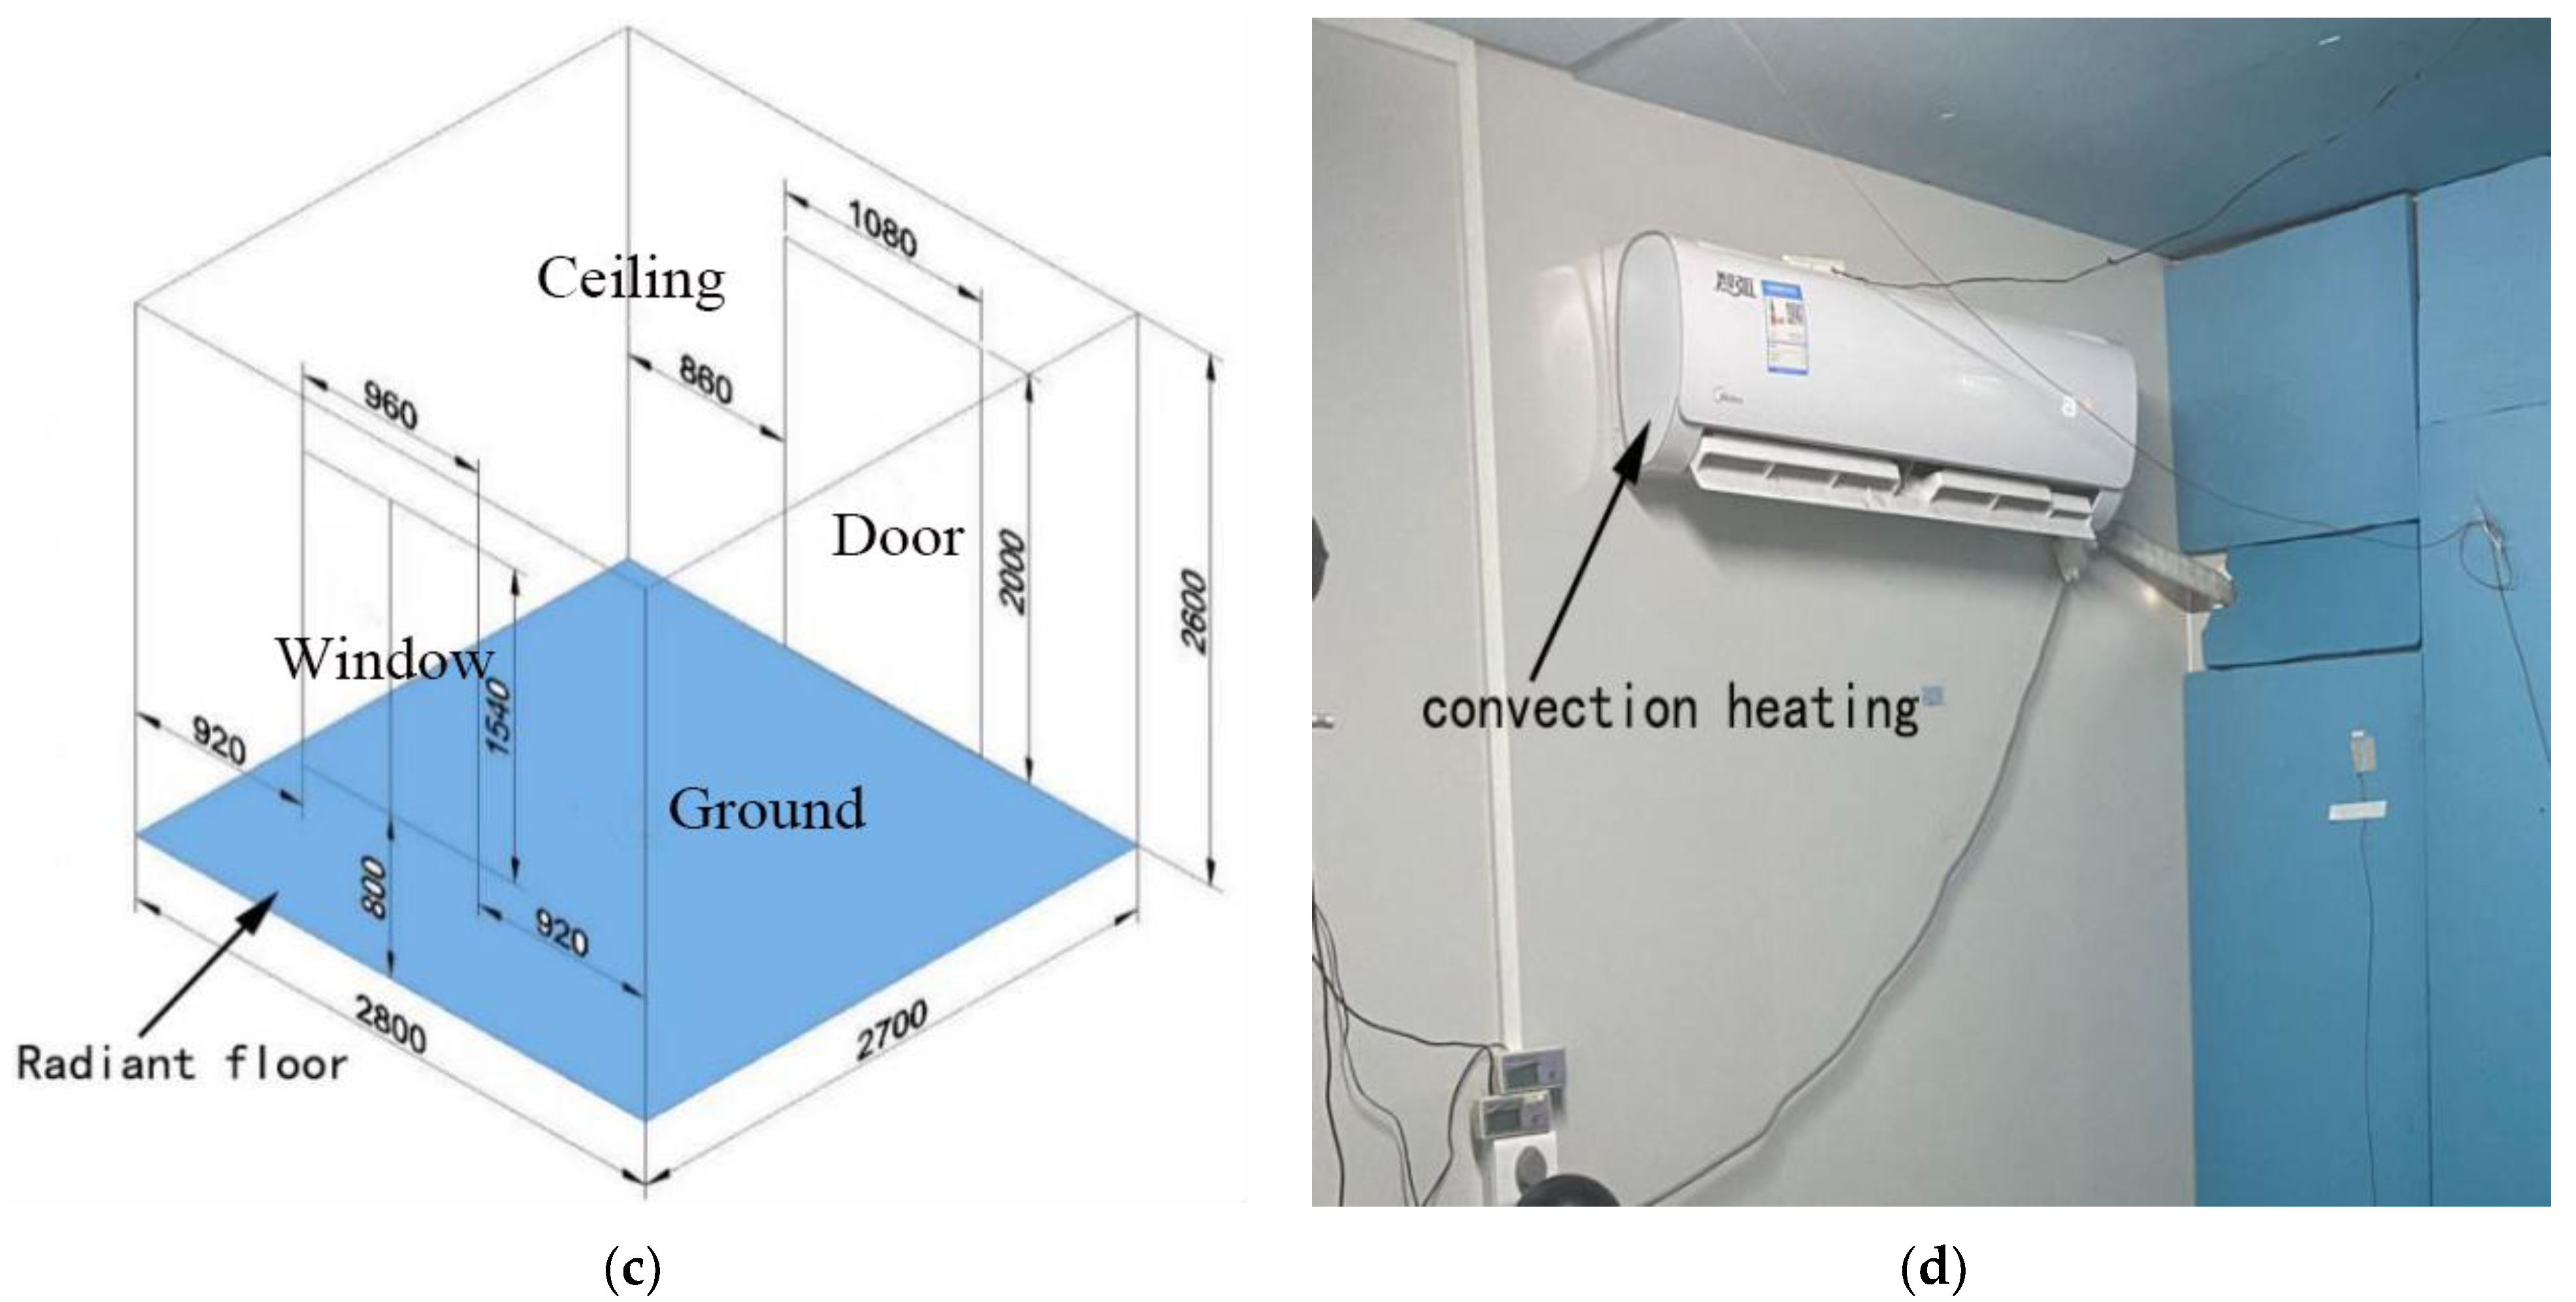
2.1. Experimental Facility

Two climate chambers were created in Guangzhou for this investigation. Guangzhou is a city with hot summers and warm winters. As shown in Figure 1a, the dimensions of the chamber are 2.8 × 2.7 × 2.6 m, with a 1.54 × 0.96 m window in the south wall. Two laboratories utilized different types of heating systems for wall-mounted air conditioners: radiant floor heating and convection heating. The heating systems were arranged as shown in Figure 1c,d, and to reduce the exposure of the experiment to direct sunlight, the windows were covered, as shown in Figure 1b. This experiment examined and analyzed the primary environmental factors affecting indoor thermal comfort in winter including air temperature, radiant temperature, relative humidity, and air velocity. Thermal parameters, such as Ta, Va, RH, and Tg in the outdoor environment were recorded and utilized to examine how the external environment affected the indoor environment.

2.2. Experimental Design

2.2.1. Subjects

A total of 24 males and 24 females were selected for the experiments. All participants were college students who were residents of Guangzhou for at least a year. They consumed less than 1 cup of coffee and alcohol or 2 cigarettes per day, and their regular exercise frequency was 2–4 times per week.
Notably, all subjects were between the age of 21 to 25 years, disregarding the impact of age on thermal perception. Additionally, all participants were asked to wear similar clothing, including underwear, a T-shirt, pants, a pair of regular socks, and a pair of shoes. The influence of various garment insulation values on thermal sensation was not considered, leaving a total clothing insulation of 0.7 clo. Table 2 provides thorough information on the subjects.

2.2.2. Subjective Questionnaire

All test subjects were instructed to perform sedentary activities at a metabolic rate of roughly 1.1 throughout the experiment. Furthermore, with varying air temperatures, subjects may have different thermal sensations; thus, the individuals were questioned subjectively on how they felt about the local body-part sensation and overall perception of whole-body thermal comfort. The thermal perceptions of the subjects were evaluated using the ASHARE 7-point scale. However, additional elements, including air velocity, radiation temperature, happiness with the environment, and relative humidity, may also be related to thermal comfort. Thermal comfort cannot be accurately reflected by information on thermal senses alone [23]. As a result, in addition to a satisfaction vote and other random data, the questionnaire also asked about thermal, humidity, and other sensations. The participants were asked to describe what they thought the environment would be like. Table 3 lists the voting scales used in this study. They comply with the global thermal comfort database scales and ASHRAE standard scales [23,24].
In addition to the subjective questionnaire, skin temperature sensors were used to gauge the body temperature of each subject. To record local thermal perceptions, the sensors were affixed to seven body areas (forehead, left chest, left upper arm, left hand, anterior thigh, anterior calf, and left foot). The mean skin temperature (MST) can be calculated using one of two methods: (1) techniques that use constant weighting factors based on the relative regional surface area of particular measurement sites; and (2) unweighted methods using the same weighting factors for all measurement sites, whose result is the average of the entire local skin temperature. The distribution of surface temperature of the human body is better described by weighted calculation methods than by unweighted approaches [25], and it is valuable for researching thermal comfort. Therefore, weighted calculation methods were mainly used in this study. MST was calculated using Equation (1) [25,26].
T sk = 0.07 T forehead + 0.14 T   left   upper   arm + 0.35 T left   chest + 0.05 T left   hand + 0.19 T anterior   thigh + 0.13 T   anterior   calf + 0.07 T   left   foot

2.2.3. Measurement Parameters and Instruments
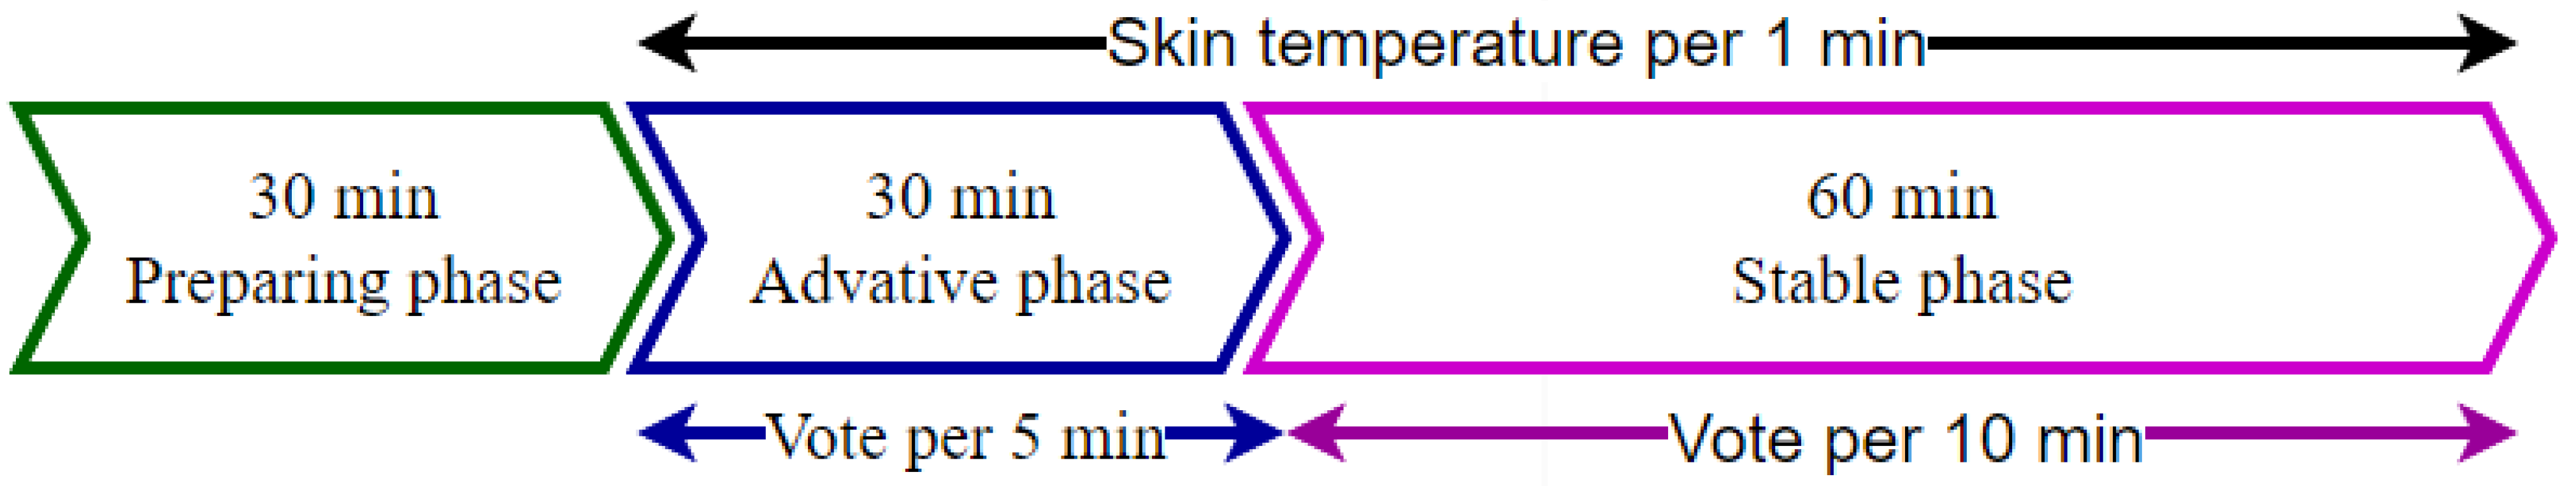
In addition, the air temperature, radiation temperature, relative humidity, and air velocity were measured along with the skin temperature during the experiment. Table 4 lists the measurement apparatus used in this study. During the experiment, the physical parameters were measured in the chamber at a height of 1.1 m.

2.3. Test Procedure

Seven test groups were used in the experiment. Each test group was divided into four phases at four set temperatures. Each phase was divided into two parts, which lasted for 2 h. The 2-h tests comprised three steps. First, prior to the beginning of preparation phase, the subjects were given 30 min to relax and put on the skin temperature sensors. The experimental results from prior research showed that when exposed to a new thermal environment, the MST and thermal sensation stabilized after approximately 40 min (the environmental temperature change was less than 10 °C) [27,28,29]. Therefore, the subjects were allowed 30 min to familiarize themselves with the chamber setting and cast their votes. Finally, the subjects had a 60 min stable period to experience. The voting and body temperature recording frequencies are shown in Figure 2. Subsequently, the interior design temperature of the two chambers remained unchanged, and the subjects in the two chambers swapped rooms to conduct the next part of the experiment using the same experimental procedure as in the previous section. In this experimental investigation, the indoor air temperatures were maintained at different levels (20 °C, 25 °C, 30 °C, and 35 °C). However, the indoor air temperature fluctuated because of the limitations of the test conditions and the disturbance of external environment. Therefore, by monitoring the changes in room temperature and debugging several times before the test, the air conditioning and radiant floor heating equipment screen-display parameters were changed such that the two climatic indoor air temperatures were maintained in the same range at the same test time, and this was used as the basis for grouping the test arrangements. Data processing using the actual air temperature in the climate chamber for analysis did not affect the experimental results. The actual air temperature in the chamber at different levels is shown in Figure 3.

2.4. Data Processing

Considering that materials making up the artificial climate chamber are different from that of the actual residential building, it is impossible to overlook the body’s ability to store heat and how radiation heat-exchange affects it. The operational temperature considers both the air temperature and the average radiation temperature to compensate for this modest deficiency caused by merely using the air temperature as the thermal environment evaluation indicator. The equation presented in ASHRAE standard 55 [23] was used to calculate the room operating temperature in this experiment:
T o p = A T a + ( 1 A ) T m r t
where Ta is the temperature of the indoor air, Tmrt is the mean radiant temperature, and A is a constant factor. Tmrt was calculated using Equation (3), and the value of A was obtained as shown in Table 5.
Black-globe thermometers are currently the most popular tool for determining the mean radiative temperature [30]. The globe bulb temperature (Tg) was measured in the experiment using a typical globe thermometer that had a diameter (D) of 0.15 m and was matte-black coated (globe emissivity, g = 0.95). The mean radiant temperature was calculated by combining the measured air temperature, black-bulb temperature, and indoor wind speed, and the specific calculation is based on ISO 7726 [31] as follows:
T m r t = [ ( T g + 273 ) 4 + 1.1 × 10 8 × V a × ( T g T a ) ε g × D 0.4 ] 1 4 273

3. Results

3.1. Outdoor Air Parameters

Thermal comfort was measured in a climatic chamber located in Guangzhou, China. Measurements were made for external ambient factors. According to the tested outdoor climatic conditions, the outdoor temperature varied widely during the test days, with a difference of 26.6 °C between the highest and lowest temperatures. Therefore, although the average winter temperature in Guangzhou was 22.66 °C, low temperatures were often observed, with only 8.7% of the temperatures being above 28 °C. Additionally, owing to the rainy winter in Guangzhou, the humidity reached a maximum of 91.3%. A higher humidity at the same temperature can result in a more uncomfortable feeling.

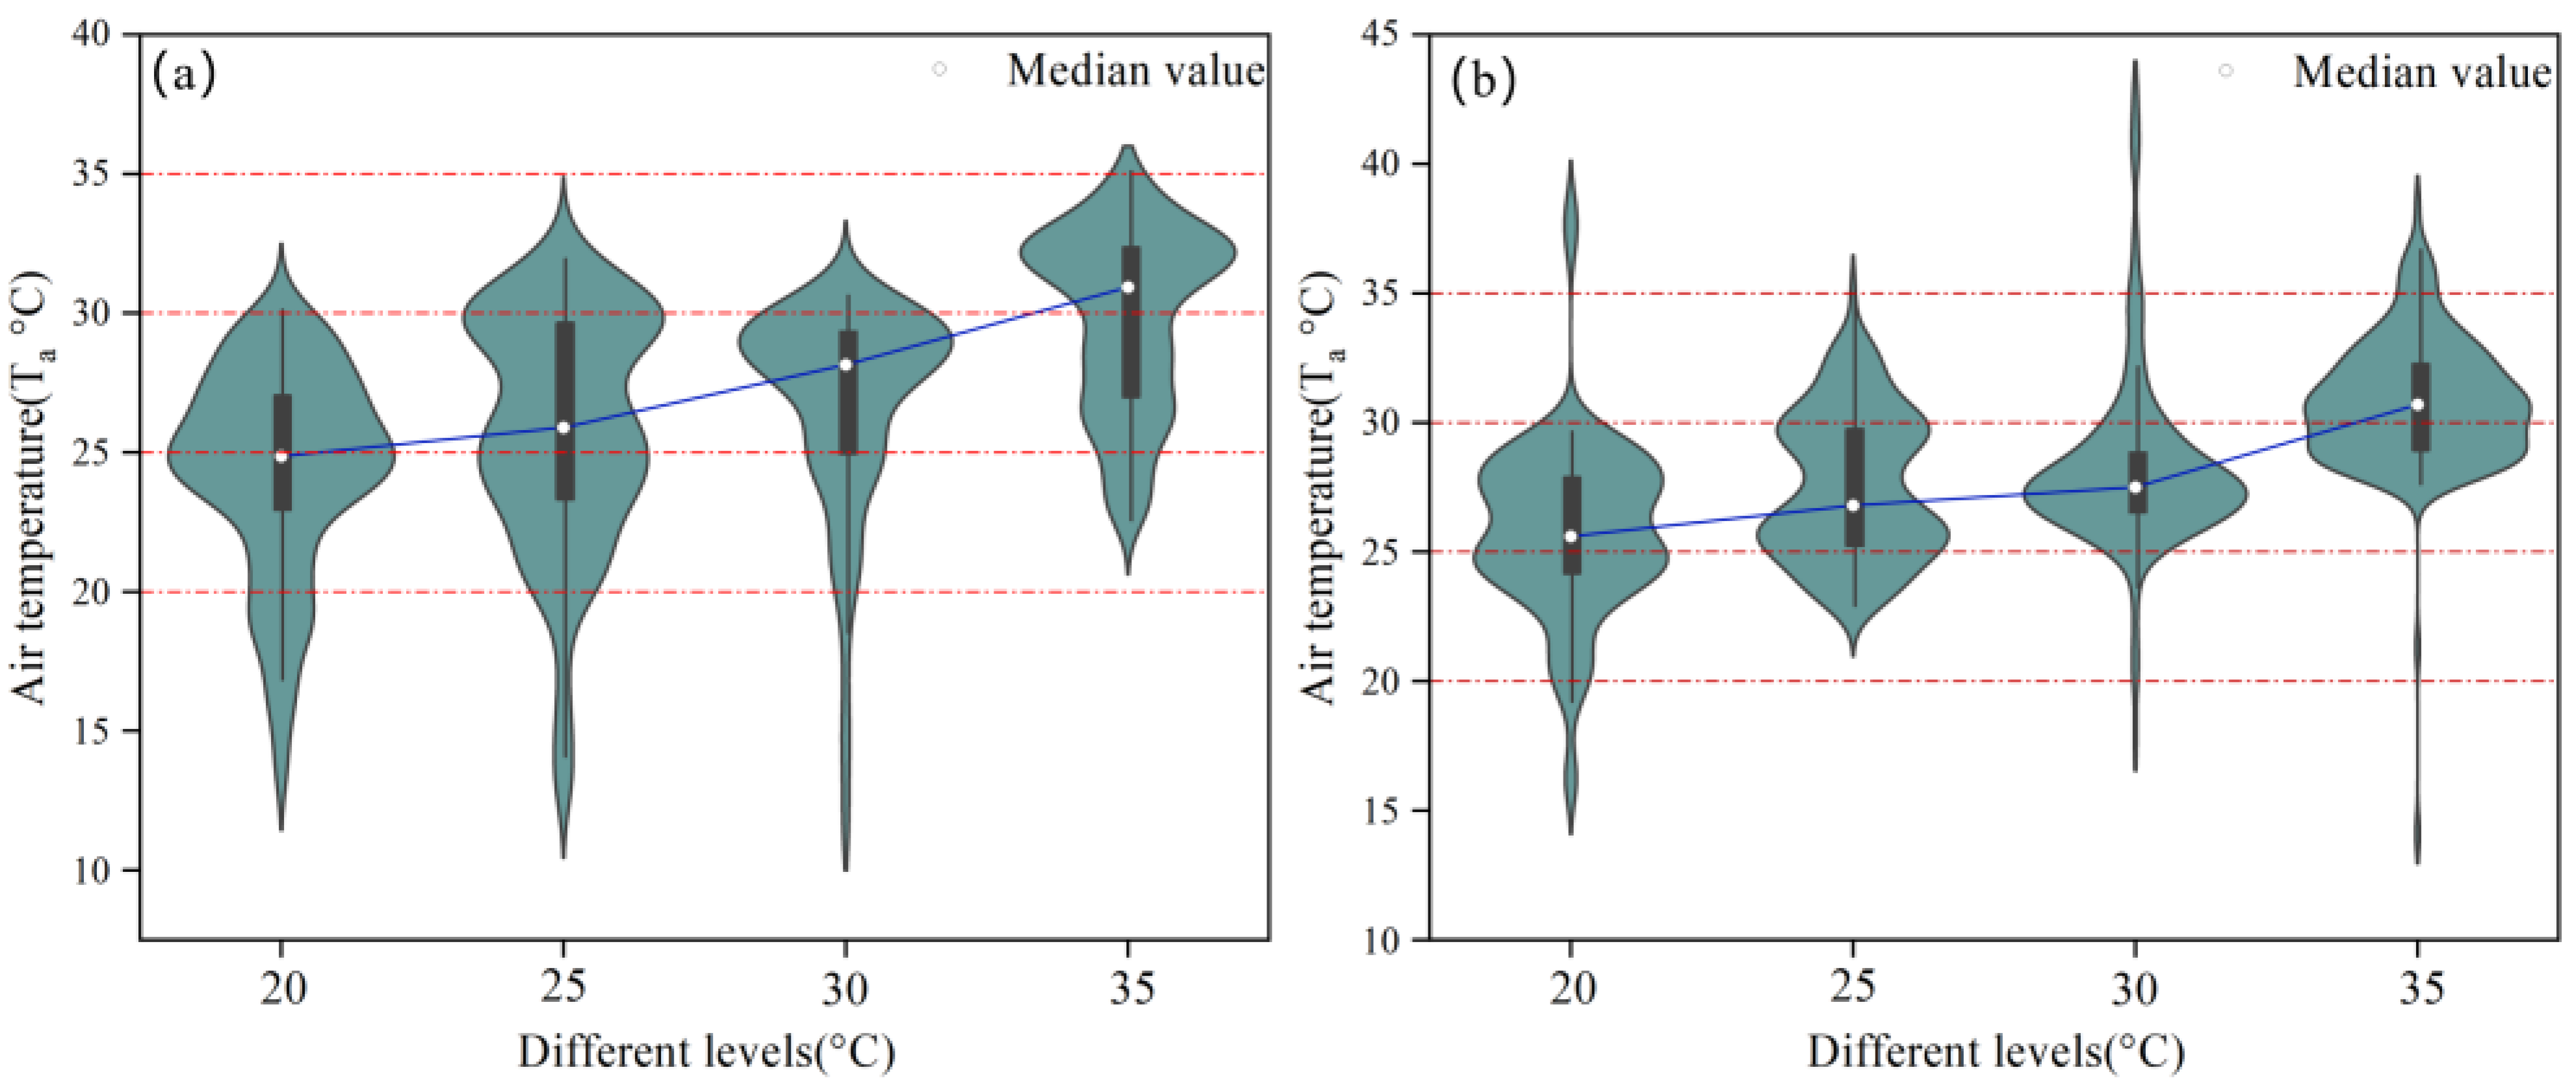
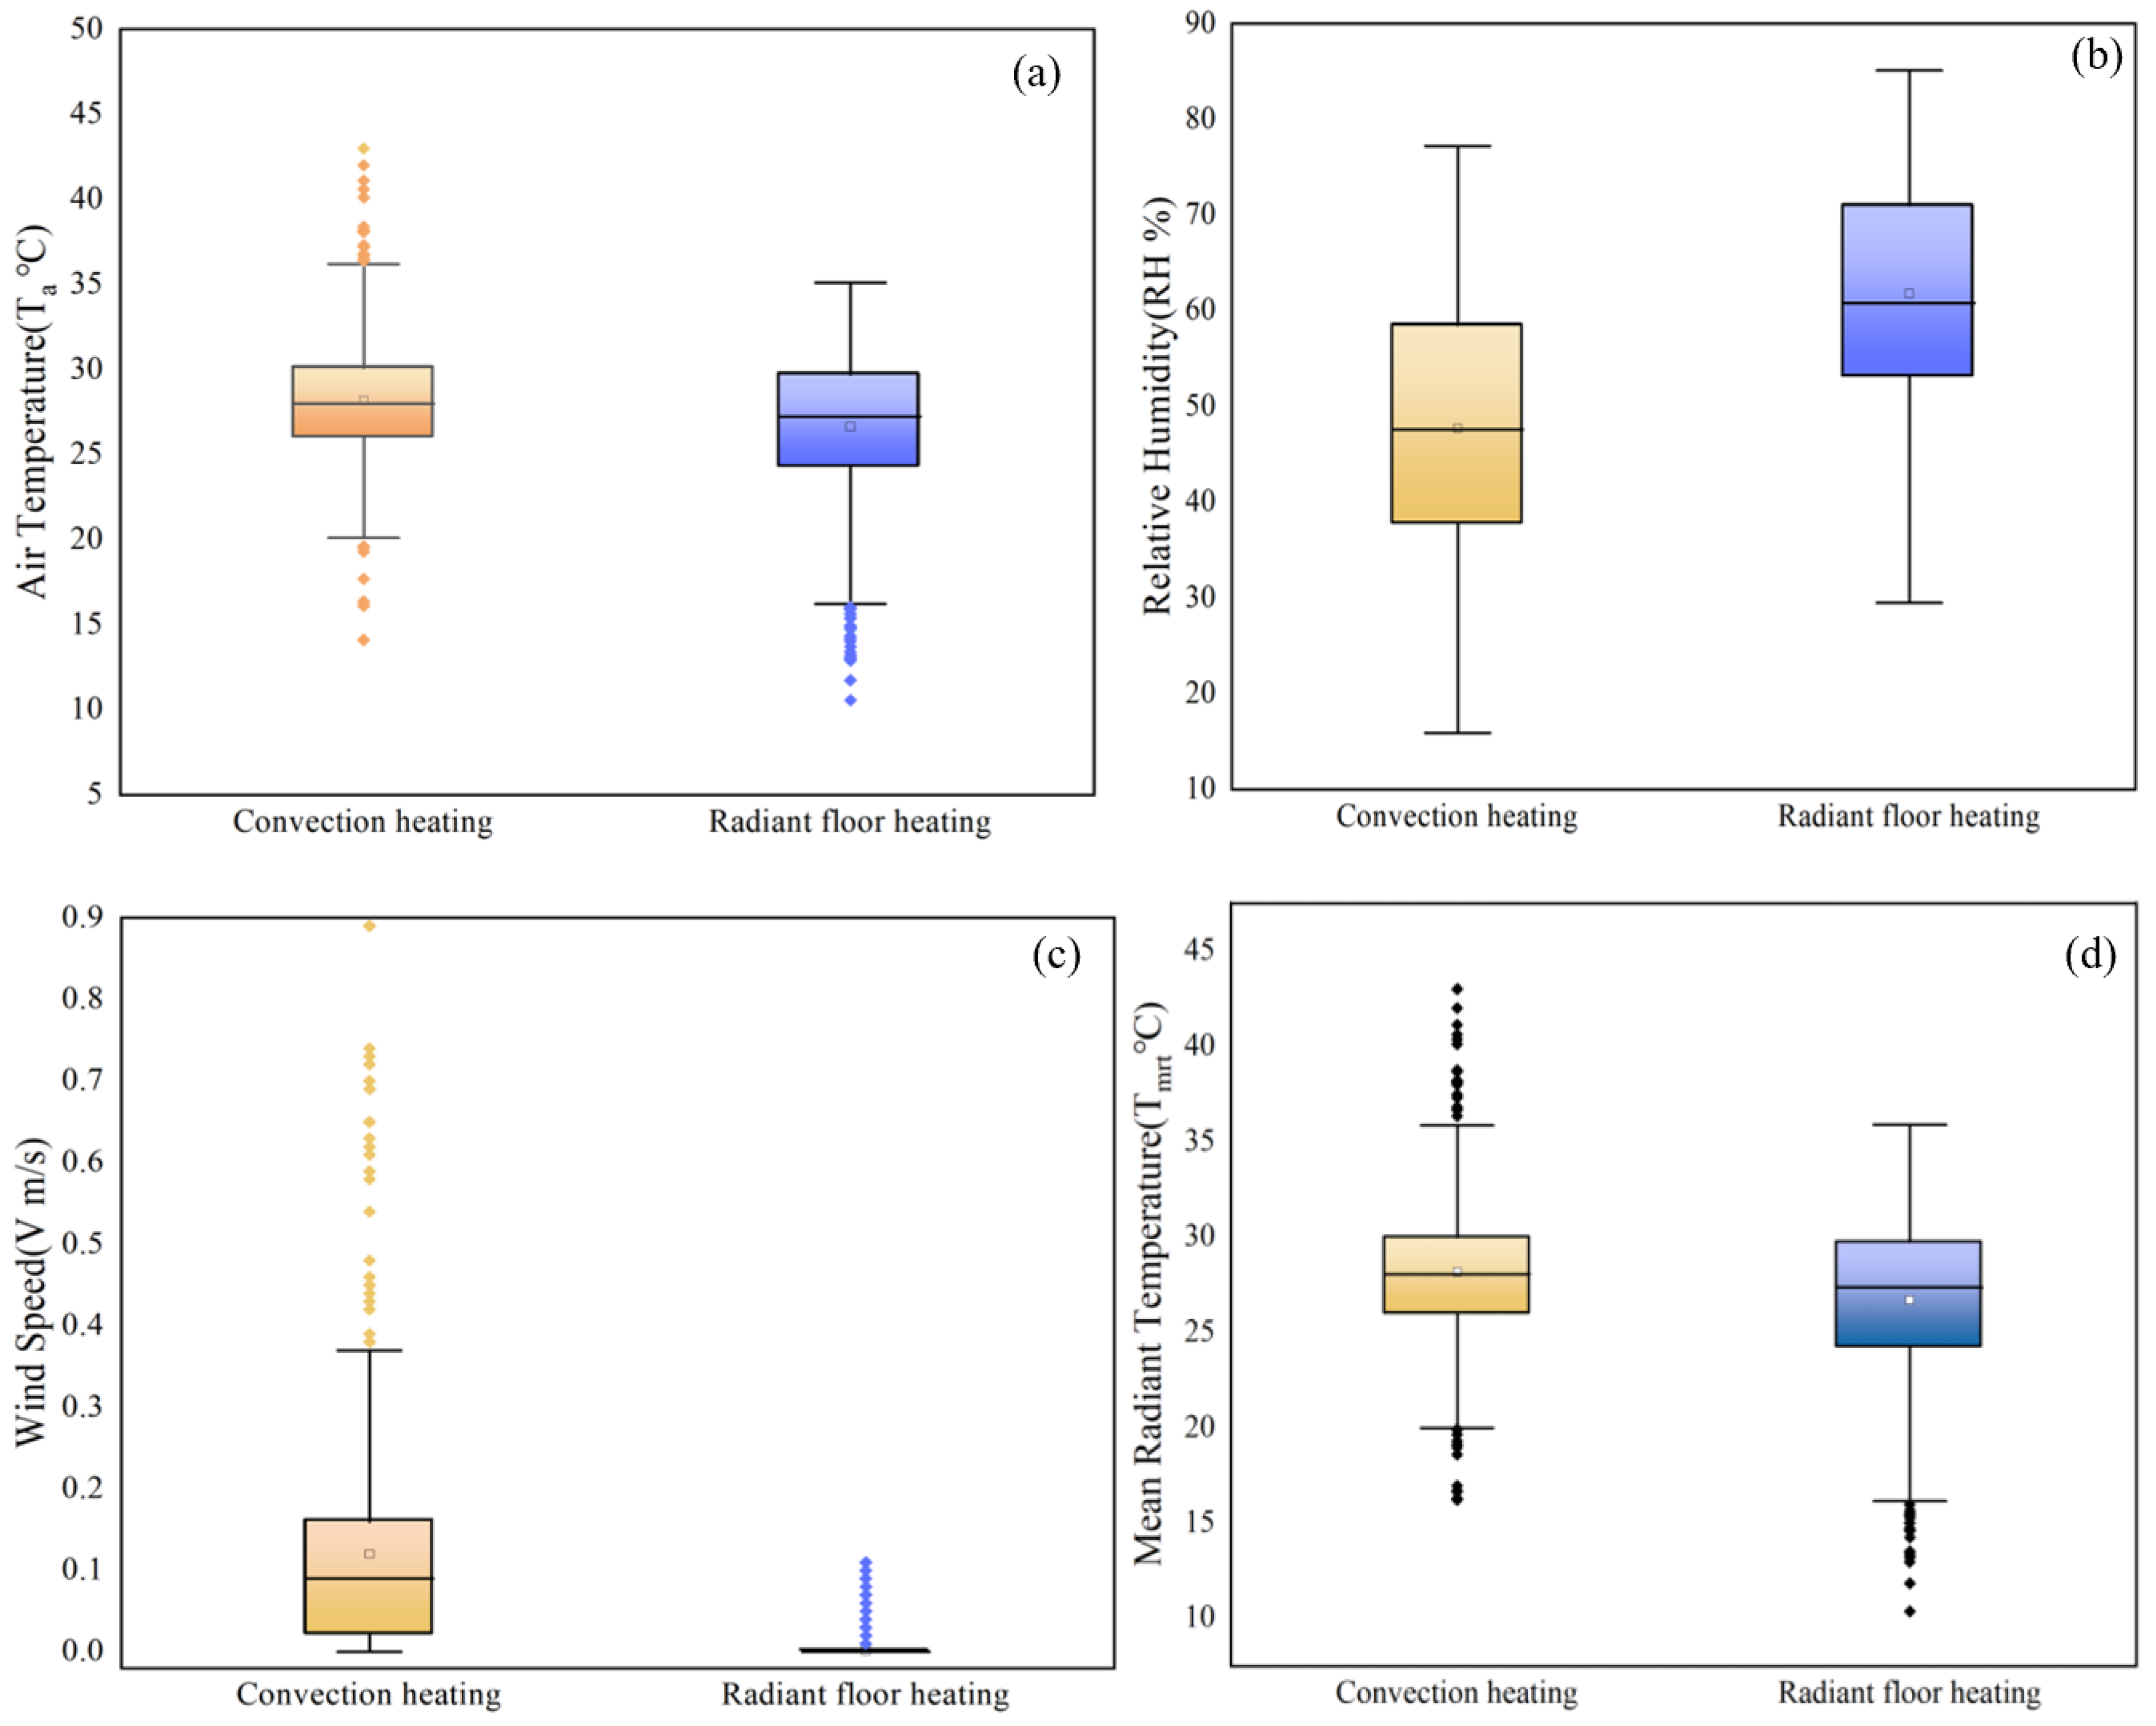
3.2. Indoor Environmental Parameters

During the investigation, the climatic parameters of the two laboratories were recorded (Table 6). Additionally, the distributions of temperature and humidity levels in the air in the two climatic chambers were determined, as shown in Figure 4.
Figure 4a shows the distribution of the air temperature in the two rooms with more than 50% of the test time and the indoor temperature of the air in the two rooms was between 25 °C and 30 °C. Moreover, the temperature change in the room heated by the wall-mounted air conditioners was relatively higher. However, the high-temperature anomalies were significantly higher than those in radiant floor heating rooms. Additionally, because both climate chambers had insulation, the inside temperature was less affected by the outside temperature, and the indoor temperature changes were derived from the heating of both devices.
Figure 4b shows the distribution of the relative humidity (RH) in the two rooms in the experiment. The relative humidity of the radiant floor heating room was concentrated between 53% and 71%. The relative humidity of the wall-mounted air-conditioned heating room was mainly concentrated in the range of 38–58%. This phenomenon may be related to the automatic adjustment of the air conditioner. According to ASHRAE 55, the comfortable humidity range for occupants is 40–60%. The relative humidity was high because of the rainy winters in Guangzhou. Moreover, because of the body’s self-adaptation to the climate, people who live in the Guangzhou area often tend to have slightly higher comfort requirements for humidity than normal, and the relative humidity of the floor-heated room is significantly closer to the level of thermal comfort for the human body. Additionally, a wall-mounted air-conditioner heated room will produce drier conditions, and drier conditions at the same heating temperature will significantly reduce human thermal comfort. Therefore, relative humidity should be properly controlled while maintaining the heating temperature.
Air velocity was recorded in the two rooms during the experiment, and the room doors and windows were closed tightly without ventilation. The results are shown in Figure 4c. The radiant floor-heating room had almost no wind speed. The wall-mounted air-conditioned heating chamber saw winds on average of 0.12 m/s, with gusts exceeding 0.2 m/s after around 30% of the time and clearly unstable.
Additionally, this study calculated the average radiation temperature (Tmrt) of the two rooms, the results of which are displayed in Figure 4d. The calculation results show that the average radiation temperature is the same as that of room temperature. This was primarily due to the slow wind speed of the room.

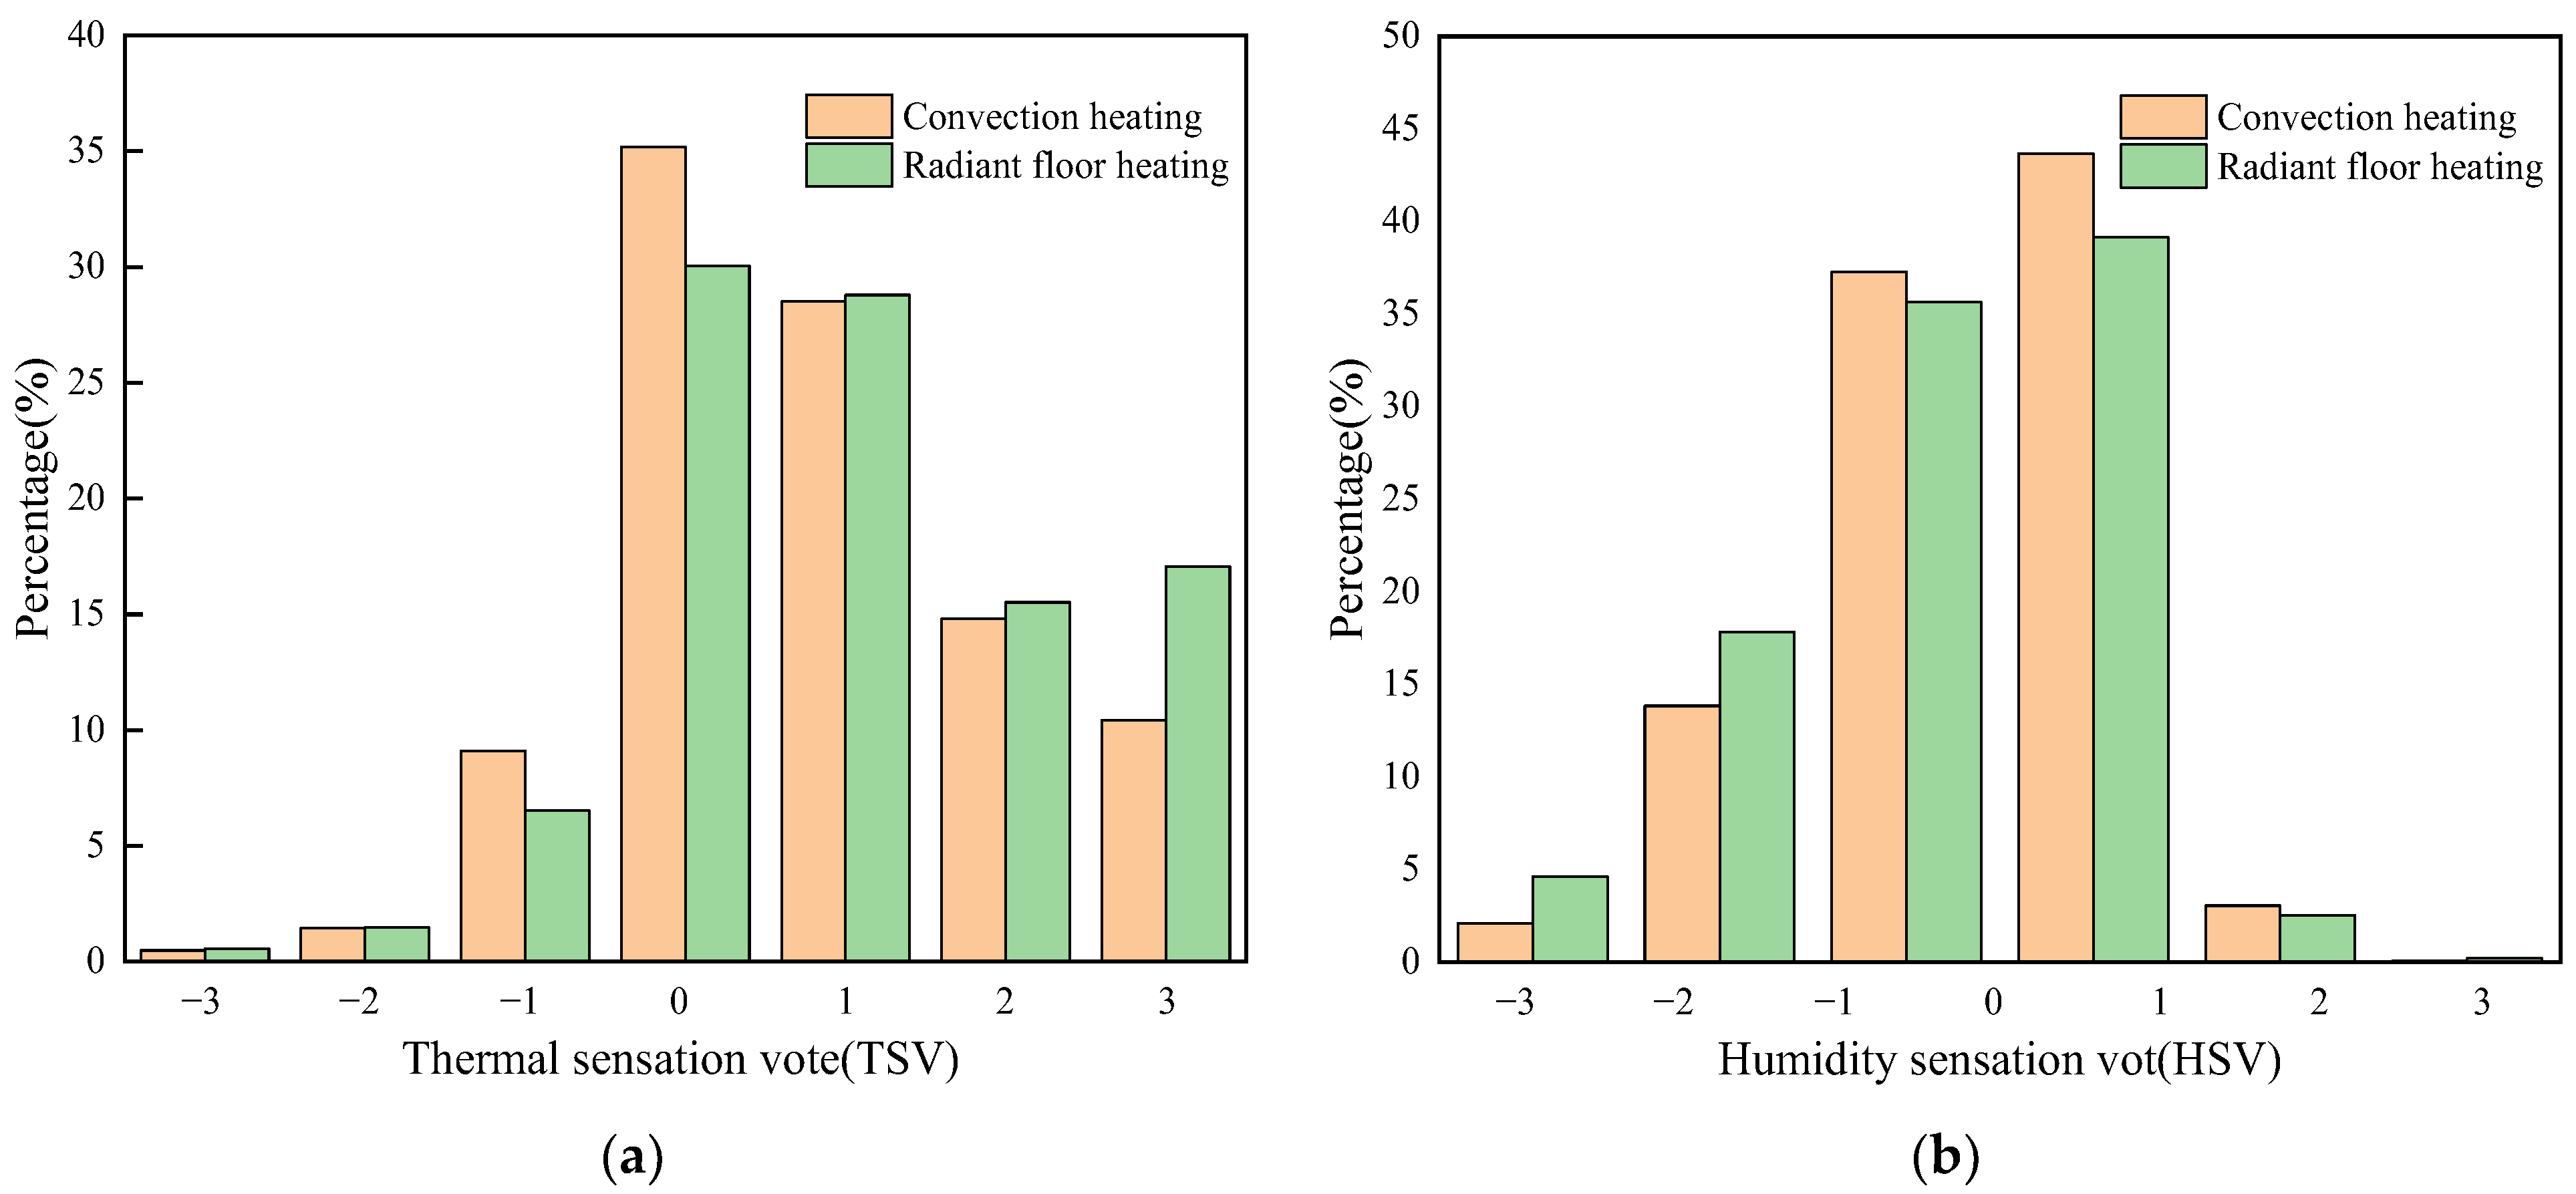
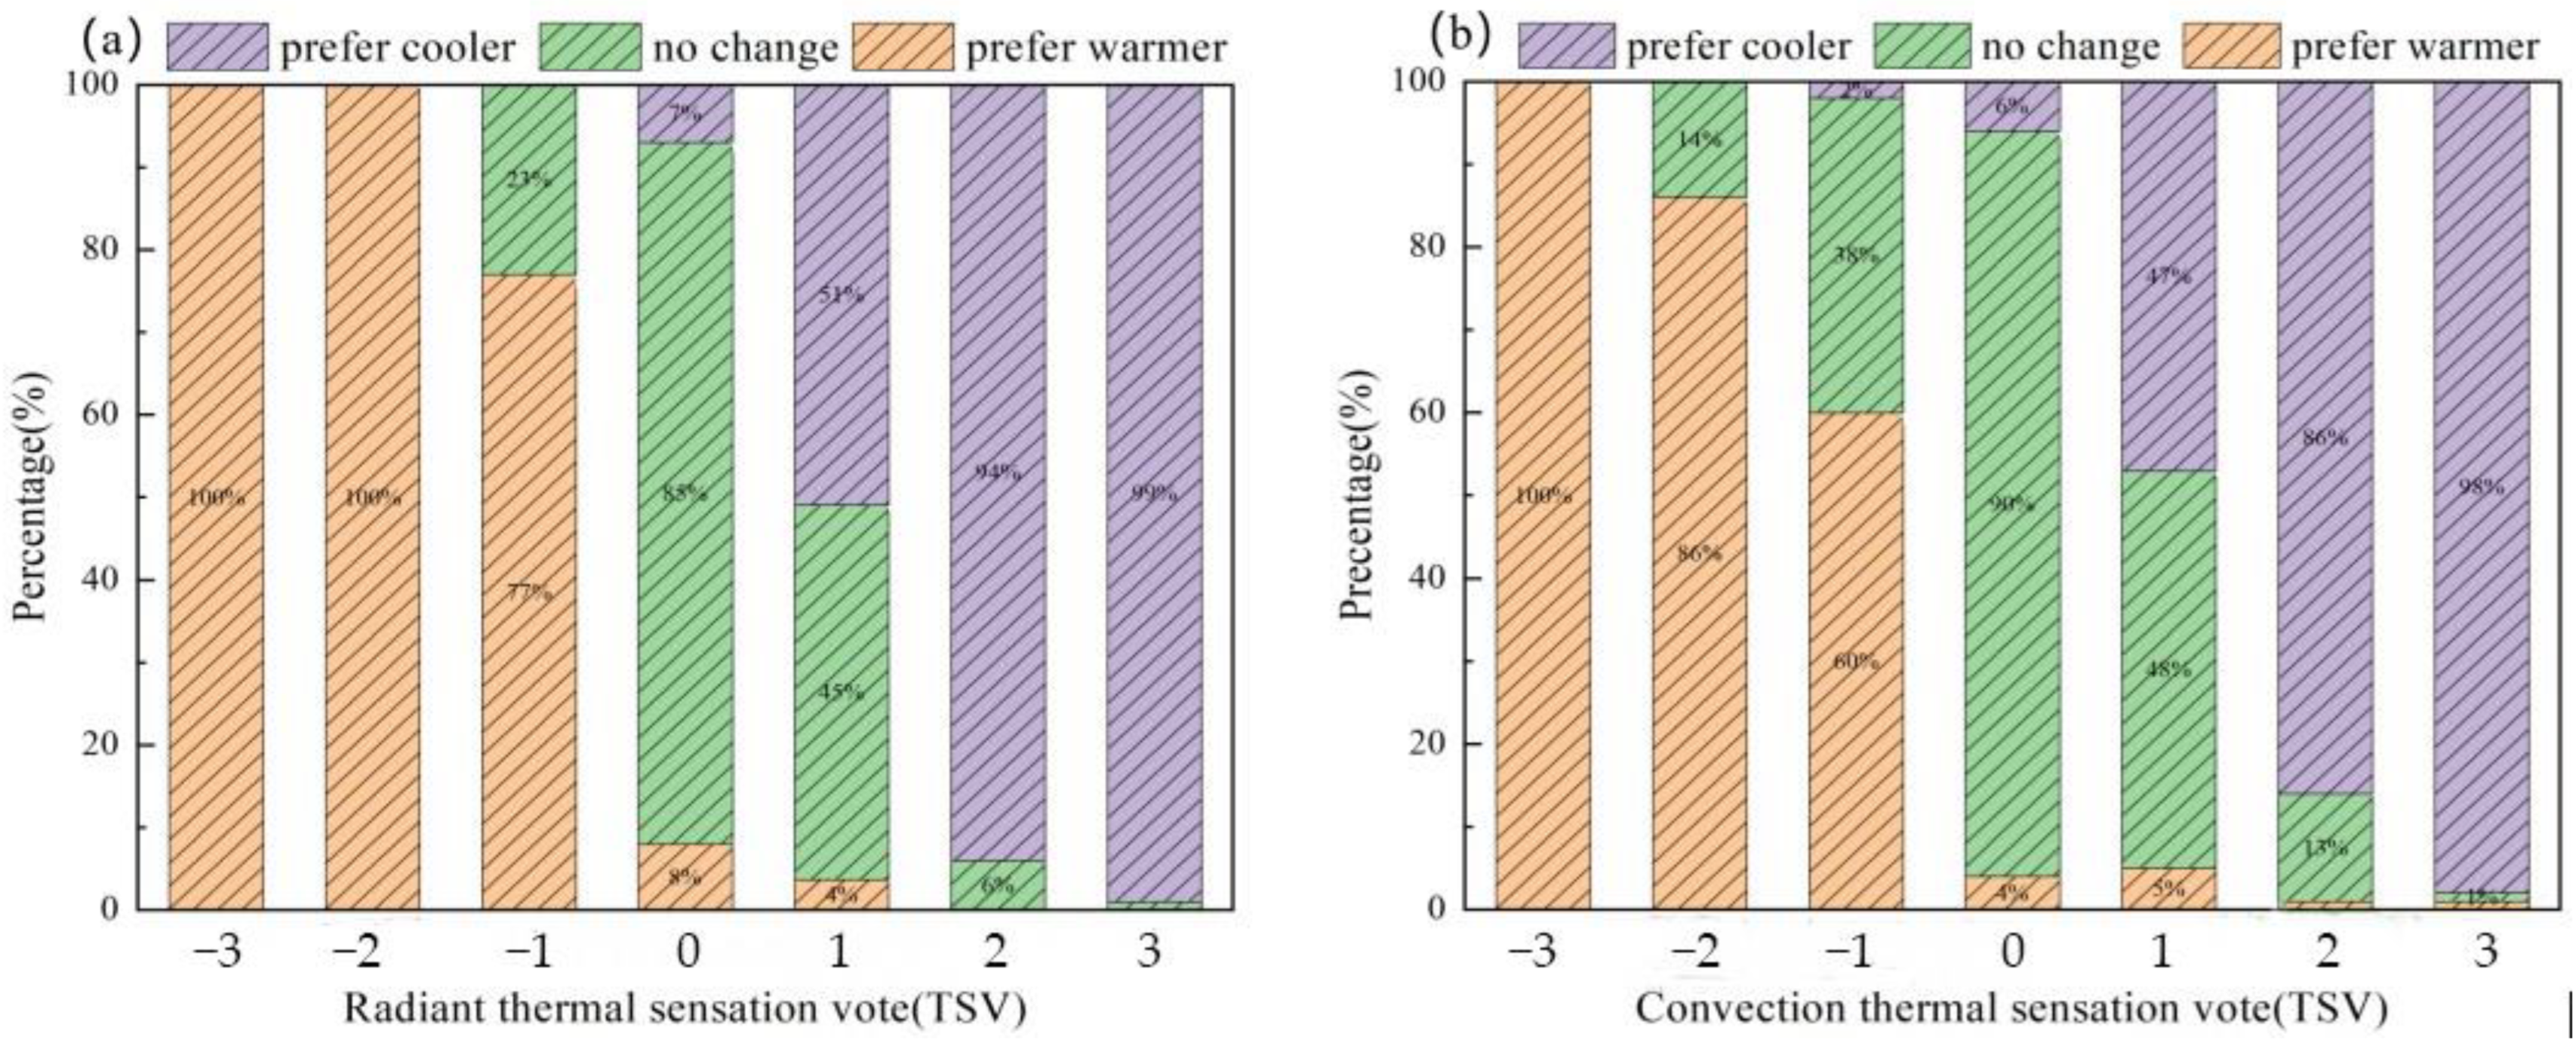
3.3. Subjective Thermal Responses

During the experiment, the subjects were dressed in the same manner, which ruled out sensory differences due to clothing insulation. The subjective thermal responses, including thermal sensation vote (TSV), humidity sensation vote (HSV), and thermal preferences, were analyzed throughout the test.
An analysis of TSV is shown in Figure 5a. The rooms with radiant floor heating and those with wall-mounted air conditioning heating had average TSV values of 1.00 and 0.76, respectively. For the air-conditioned heating room, the subjects felt more heat in the floor heating room. However, Figure 3 shows that the maximum temperature of the convection room is higher than that of the radiant heating room. Therefore, the subjects were more adapted to high temperatures in the wall-mounted air-conditioned heating room than in the radiant floor heating room.

Humidity Sensation Vote (HSV)

An analysis of HSV is presented in Figure 5b. The distribution showed no votes greater than 2. Figure 3 shows that there is high relative humidity in both rooms, which indicates that the subjects living in the Guangzhou area have adapted to a high-humidity environment. Additionally, the percentage of HSV between −1 and 1 reached 80%. However, the percentage of votes between −3 and −1 indicates that the subjects in the radiant floor heating room were more likely to have dry sensations. This differs from Sun et al. [7], who asserted that under radiative and convective conditions, the variation in relative humidity has no impact on people’s perceptions.
Professor de Dear [28] believes that a thermal preference scale is more appropriate for measuring thermal comfort. The test divides thermal preferences into three categories: warmer, no change, and cooler. Information regarding the subjects’ thermal preferences was obtained from the questionnaire.
The statistics of the distribution of thermal preferences corresponding to the subjects’ hot-sensation polls are shown in Figure 6. This graph demonstrates that the radiant floor heating room exhibits distinct regularity. The preference of “no change” is concentrated between −1 and 1. Additionally, as the grade of thermal sensation increased, the percentage of votes preferring colder conditions gradually increased and the preference for hotter conditions gradually decreased. Despite the constant overall trend of the air-conditioned heating room, there was a noticeable fluctuation phenomenon that was compatible with the temperature instability of the air-conditioned heating room. At a heat sensation vote of −1, the percentage of votes preferring hotter conditions in the radiant floor heating room was higher than that in the wall-mounted air-conditioned heating room, and the percentage of votes for no change was lower than that in the air-conditioned heating room. However, at a thermal sensory vote of 1, the percentage of votes preferring cooler conditions and no change in the radiant floor heating room were essentially the same as those in the wall-mounted air-conditioned heating room. This indicates that the subjects were more tolerant of colder sensations in the air-conditioned room. At heat sensation voting values from −2 to −3, all subjects in the floor-heated room preferred hotter conditions, which is more indicative of subjects who could not tolerate cold sensations in the floor-heated room. Additionally, the heat sensation voting values from 0 to 3 essentially showed the same percentage of the three heat preferences in both chambers for all the subjects. This indicates that the subjects’ tolerance for heat sensation was essentially the same in both rooms.

3.4. Thermal Comfort Analysis

The thermal comfort of the individuals was further examined in this study under various heating terminals based on the statistical analysis of the indoor thermal and humid settings discussed above and the subjective human voting. Different mathematical techniques were used to determine the participants’ thermally neutral temperatures and the temperature ranges that they could tolerate under radiant and convective heating conditions.

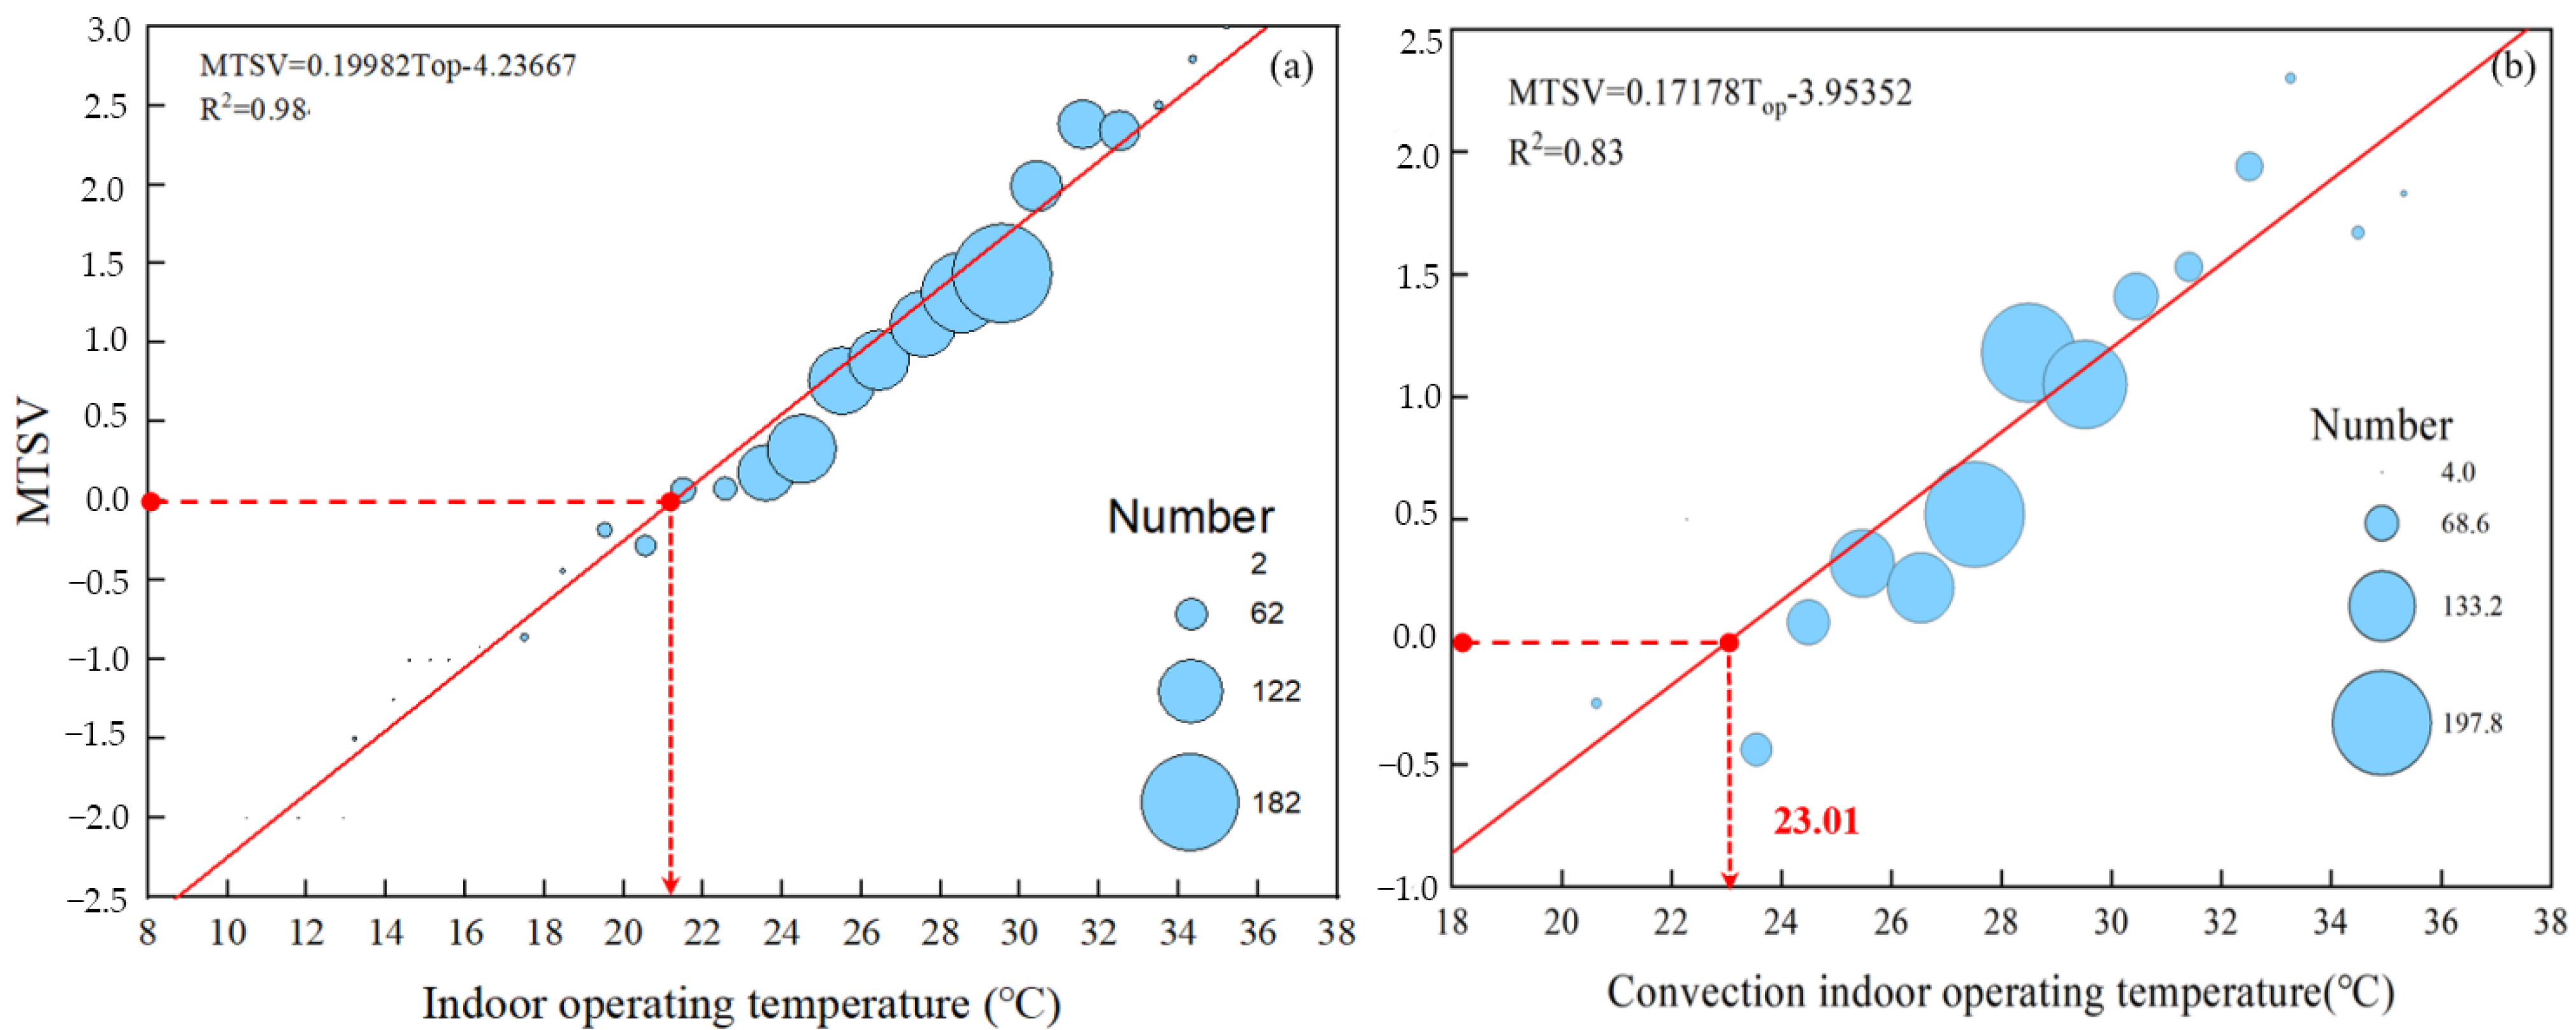
3.4.1. Linear Regression

According to Lin [32], to exclude the influence of outliers in the TSV data, Top was grouped and solved for the mean TSV (MTSV) data in the corresponding group. Subsequently, linear regression analysis was conducted for MTSV and Top. The results are shown in Figure 7.
The relationship between the MTSV of the two chambers and indoor Top can be determined using linear fitting, as shown in Figure 7.
Introducing “TSV = 0” into the regression equation, the calculated thermal neutral temperatures of different climate chambers were 21.20 °C and 23.01 °C for the radiation and convection conditions, respectively.
Rijal et al. [33] found that linear regression methods used to estimate thermal neutral temperatures may produce errors when adaptive behavior is present in subjects. The Griffith technique was applied to simultaneously determine the thermal neutral temperatures of the two climate chambers to prevent inaccuracies.

3.4.2. Acceptable Temperature Range

The ASHRAE 55 standard provides a comfort range of 90% and acceptable range of 80%. The thermal comfort sensations were −0.5–0.5 and −1–1, respectively. Using the regression model of MTSV and Top derived in the previous section, the acceptable temperature ranges are presented in Table 7.
The acceptable temperature ranges obtained using these two methods are summarized in Table 7. This table shows that the width of acceptable temperature range is the same for both heating conditions. Additionally, the upper and lower temperature limits of the acceptable rates of 90% and 80%, respectively, under convection conditions increased by 2–3 °C compared with those under radiation conditions. This indicates that subjects in wall-mounted air-conditioned heating rooms have a stronger adaptability to higher temperature environments in the range of 20–30 °C.

3.4.3. Thermal Comfort Temperature Using the Griffith Method

Griffith’s method is based on Equation (4) to solve the indoor thermal neutral temperature, where the regression coefficients (b) are typically considered to be 0.25 [34], 0.33 [35], and 0.50 [36] respectively. The data from each test day were pooled to determine the regression coefficient values for this study. First, the Top and TSV (Tf) obtained from each testing day were subtracted from their daily averages (Topm, Tfm) to form two new variables: δTop = (Top − Topm) and δTf = (Tf − Tfm). Subsequently, data from all test days were pooled for regression analyses of δTOP and δTf.
T c = T o p + ( 0 T S V ) / a
Table 8 presents the regression coefficients and other information. Humphreys et al. [36] suggested that faults may unavoidably occur during testing and may have an impact on the regression coefficients; hence, the adjustment of the regression coefficients is based on Equation (5).
b a d j = b ( σ 2 δ T o p ) / ( σ 2 δ T o p σ 2 E R R )
where badj is the corrected regression coefficient, b is the regression coefficient, σ2δTop is the variance of δTop and σ2ERR is the error variance of δTop.
Nicol, Fanger, and Humphreys proposed three regression coefficients of 0.25, 0.33, and 0.50, based on the study of massive data, and these three coefficients are also the most commonly used in related studies. The regression coefficient badj (0.26) obtained in this study under radiation conditions is not significantly different from the commonly used coefficient of 0.25. The thermal neutral temperature in the room with radiant floor heating was calculated using a regression coefficient of 0.25 and used for further analysis. The regression coefficient (0.15) obtained from the wall-mounted air-conditioned heating room differs significantly from the common coefficients currently used. The regression coefficient of the wall-mounted air-conditioned heating room was adopted based on the results of this study.
The thermal neutral temperature calculated by Griffith’s method, whose values are 22.73 °C and 22.83 °C for radiation and convection conditions, respectively.
The calculated results are not exactly the same as the thermal neutral temperature derived using linear regression, especially for radiant floor heating rooms.
The Griffith method is essentially calculated by determining the Griffith coefficient. Ricardo Forgiarini Rupp et al. [37] studied thermal comfort sites in different building types and statistically derived the thermal sensitivity of building users, ultimately concluding that the thermal sensitivity of office buildings in air conditioning operations (air conditioned and mixed buildings) was closest to the commonly used Griffith constant, while users in other rooms had sensitivity of only about half that of the air-conditioned rooms. Thus, the thermally neutral temperatures obtained by the Griffith method for the floor-heated rooms deviate more from those obtained by the linear regression method. To account for the slight deviation between the two results, the thermal neutral temperature was finally determined as the arithmetic mean of the results obtained by the two methods. Thus, thermal neutral temperatures of the radiant floor heating room and the wall-mounted air-conditioned heating room were 21.97 °C and 22.92 °C, respectively.

3.5. Local Thermal Sensation

The different installation locations of different heating terminals can lead to significant local differences in the thermal sensation. In this study, ten different areas of the human body were given a subjective questionnaire. The subject’s whole-body thermal sensation was compared to the local site thermal sensation using regression analysis, and the results are displayed in Figure 8. The findings indicate that under the radiation condition, as opposed to the convection condition, the correlation coefficients of the overall thermal feeling and the thermal sensation of each component are higher. This indicates that the subjects had a more stable and positive response to radiant heating. Additionally, the correlation coefficients for radiation conditions MTSVface–MTSV, MTSVhead–MTSV, and MTSVhand–MTSV were significantly higher than those for convective conditions. Comparatively, the number of correlations for MTSVthigh–MTSV and MTSVcalf–MTSV were slightly lower.
According to previous research, the most uncomfortable or unneutral local body areas generally dominate the overall thermal feeling or thermal comfort perception. For instance, suffering from a cold foot or hand may cause discomfort to the body [38]. This may partly explain why the subjects were less receptive to cold conditions in the radiation-heating condition. Temperature changes under radiation conditions usually have a stronger effect on exposed body parts, such as the face, head, and hand.
Additionally, for the analysis of the two different working conditions, according to this study, the following factors had varying degrees of influence on the overall temperature experience caused by radiation: hand > face > head > small arm > chest > back > large arm > feet > thigh > calf; that for the convection conditions was small arm > large arm > back > thigh > calf > hand > chest > foot > head > face. Therefore, the overall heat sensation under radiation conditions is mainly from the upper body, whereas that under convection conditions is mainly from the extremities. This is also related to the uneven airflow under convective conditions, which causes the local heat sensation in the exposed body regions to fluctuate more.
As is evident from the previous section, the total temperature sensation of the subjects was significantly influenced by the local thermal feeling. In this study, the skin temperatures of seven different parts of the subjects were also recorded, and the local skin temperature was regressed against the mean thermal feeling. The results are shown in Figure 9.
By combining the two tables, changes in the thermal sensation of subjects under radiation conditions can be reflected in the skin temperature. Under the same skin temperature, the thermal sensations of the subjects under convective conditions fluctuated significantly. Thus, it was inferred that the thermal sensation changes under convective conditions were attributed more to the thermal perturbation of the environment. Although transient changes in air velocity and relative humidity do not significantly affect skin temperature, local changes in sensation can significantly affect the overall thermal sensation of the subjects.
Additionally, as the test was conducted in a small climate chamber, the doors and windows were tightly closed, resulting in an unventilated environment. Figure 4 shows that the radiation-heating condition occurred in a windless state, resulting in a stuffy environment. Thus, the thermal sensation in the head and skin temperature are closely related to the overall thermal feeling. Additionally, as shown in Figure 9, for MTSV–MSTforehead, the forehead skin temperature and radiation conditions under convective heating conditions are essentially the same; however, there is a wide range in the relationship between skin temperature and overall thermal perception, which may be attributed to fluctuations in wind speed leading to fluctuations in thermal sensory changes under convective heating conditions. Therefore, measures such as changing the wind speed magnitude and controlling the fluctuation of wind speed can effectively improve thermal sensation.

4. Discussion

4.1. Analysis of Subjective and Objective Results

The test results showed no significant differences between radiant and convection heating systems in terms of thermal comfort during the stabilization phase. During the stabilization phase, the room’s operating temperature ranged was 20 to 30 °C. The air velocity and relative humidity of the two climate chambers stabilized at different levels. The thermal preference and sensation were not significantly different. However, thermal perturbations were evident under convective conditions, including large temperature stratification, unstable air velocity, and differences between the air and radiation temperatures.
The test results show that the temperature fluctuations under convection conditions are greater than those under radiation conditions, and more concentrated in convection heating systems than in radiant heating systems. Additionally, the regularity of the thermal environment under radiant conditions is evident, and it is easier to achieve a controlled and stable thermal environment. Therefore, residents often operate radiant systems all the time during the winter season, resulting in a thermal environment that is consistently warm and steady. However, convective conditions result in a faster response to changes in the thermal environment. The continuous functioning mode uses less energy than radiant conditions [39]. Therefore, optimization methods should be further explored in the context of regional climate and residential requirements.

4.2. Analyses of Thermal Neutral Temperature and Thermal Comfort Temperature Range

According to this investigation, there was no discernible difference between the steady states of the radiant and convective systems in terms of thermal comfort.
The air-conditioned heated rooms had a thermal comfort temperature range of 20.1–25.93 °C and a thermal neutral temperature range of 22.92 °C, respectively. This is higher than the 12.48–21.23 °C and 15.91–21.21 °C ranges in the Nanjing and Yangzhou areas, respectively [18]. This may be attributed to the high rainfall and humidity in winter in the Guangzhou area, leading to higher thermal environmental temperature requirements. In addition, it has been shown [40] that people living in Guangzhou have experienced hot climates for a long time, have never experienced any severe cold, and require a higher value for thermal neutrality. Zhang et al. [15] studied the thermal comfort of air conditioning in the Guangzhou area and suggested a comfortable temperature range of 20.6–30.5 °C. A higher temperature requirement leads to higher energy consumption. The experiment showed that the thermal neutral temperature and thermal comfort temperature range using radiant floor heating were lower than those of air conditioner heating.
In addition, radiant floor heating has mostly been used in cold winter areas in the north in the past, and there is not much research on the wintertime thermal comfort of radiant floor heating in the PRD region; therefore, this study provides a theoretical reference for the research application of radiant floor heating in the PRD region in winter.
In summary, in the radiation condition, the heat neutral temperature and thermal comfort temperature range are lower than those in the convective condition, and the temperature increase arises from the energy consumption; therefore, the radiation condition has a higher energy-saving potential compared to the convection condition.

4.3. Limitation and Future Challenge

This study used a wall-mounted air-conditioner heating system and radiant floor heating system as research tools. Future research should examine more types of heating terminals.
In practice, radiant floor heating systems are generally arranged under the floor, and the existing residential use area is larger than the climate room used in this study. Therefore, future studies should include field measurements.
In addition to the aforementioned thermal disturbance, a few more elements like auditory and visual characteristics as well as air quality can affect thermal comfort [41]. Junfeng Wang et al. [42] refer to the improvement of air quality by clean heating in winter in the north. Therefore, the synergistic effects of additional influences on a person’s thermal comfort of heating systems should be fully considered in future studies.

5. Conclusions

This study conducted a series of human subject experiments in two different climatic chambers in Guangzhou to investigate the impact of radiant floor heating and air convection heating on human thermal comfort in the PRD zone during winter. By exploring two issues of thermal comfort response and the local thermal discomfort performance of subjects under different heating forms, a practical guideline is provided for winter heating in hot summer and warm winter regions. Notable findings and recommendations include the following:
(1)
Different heating terminals have different operating methods and working principles. When both convection and radiation terminals operate continuously, the impact of an unstable indoor thermal environment on human thermal comfort caused by convection terminals cannot be ignored. In winter, the radiant floor heating and thermal neutral temperature of wall-mounted air-conditioner heating are 21.97 °C and 22.92 °C, respectively; the acceptable temperature ranges are 18.79–23.72 °C and 20.1–25.93 °C, respectively.
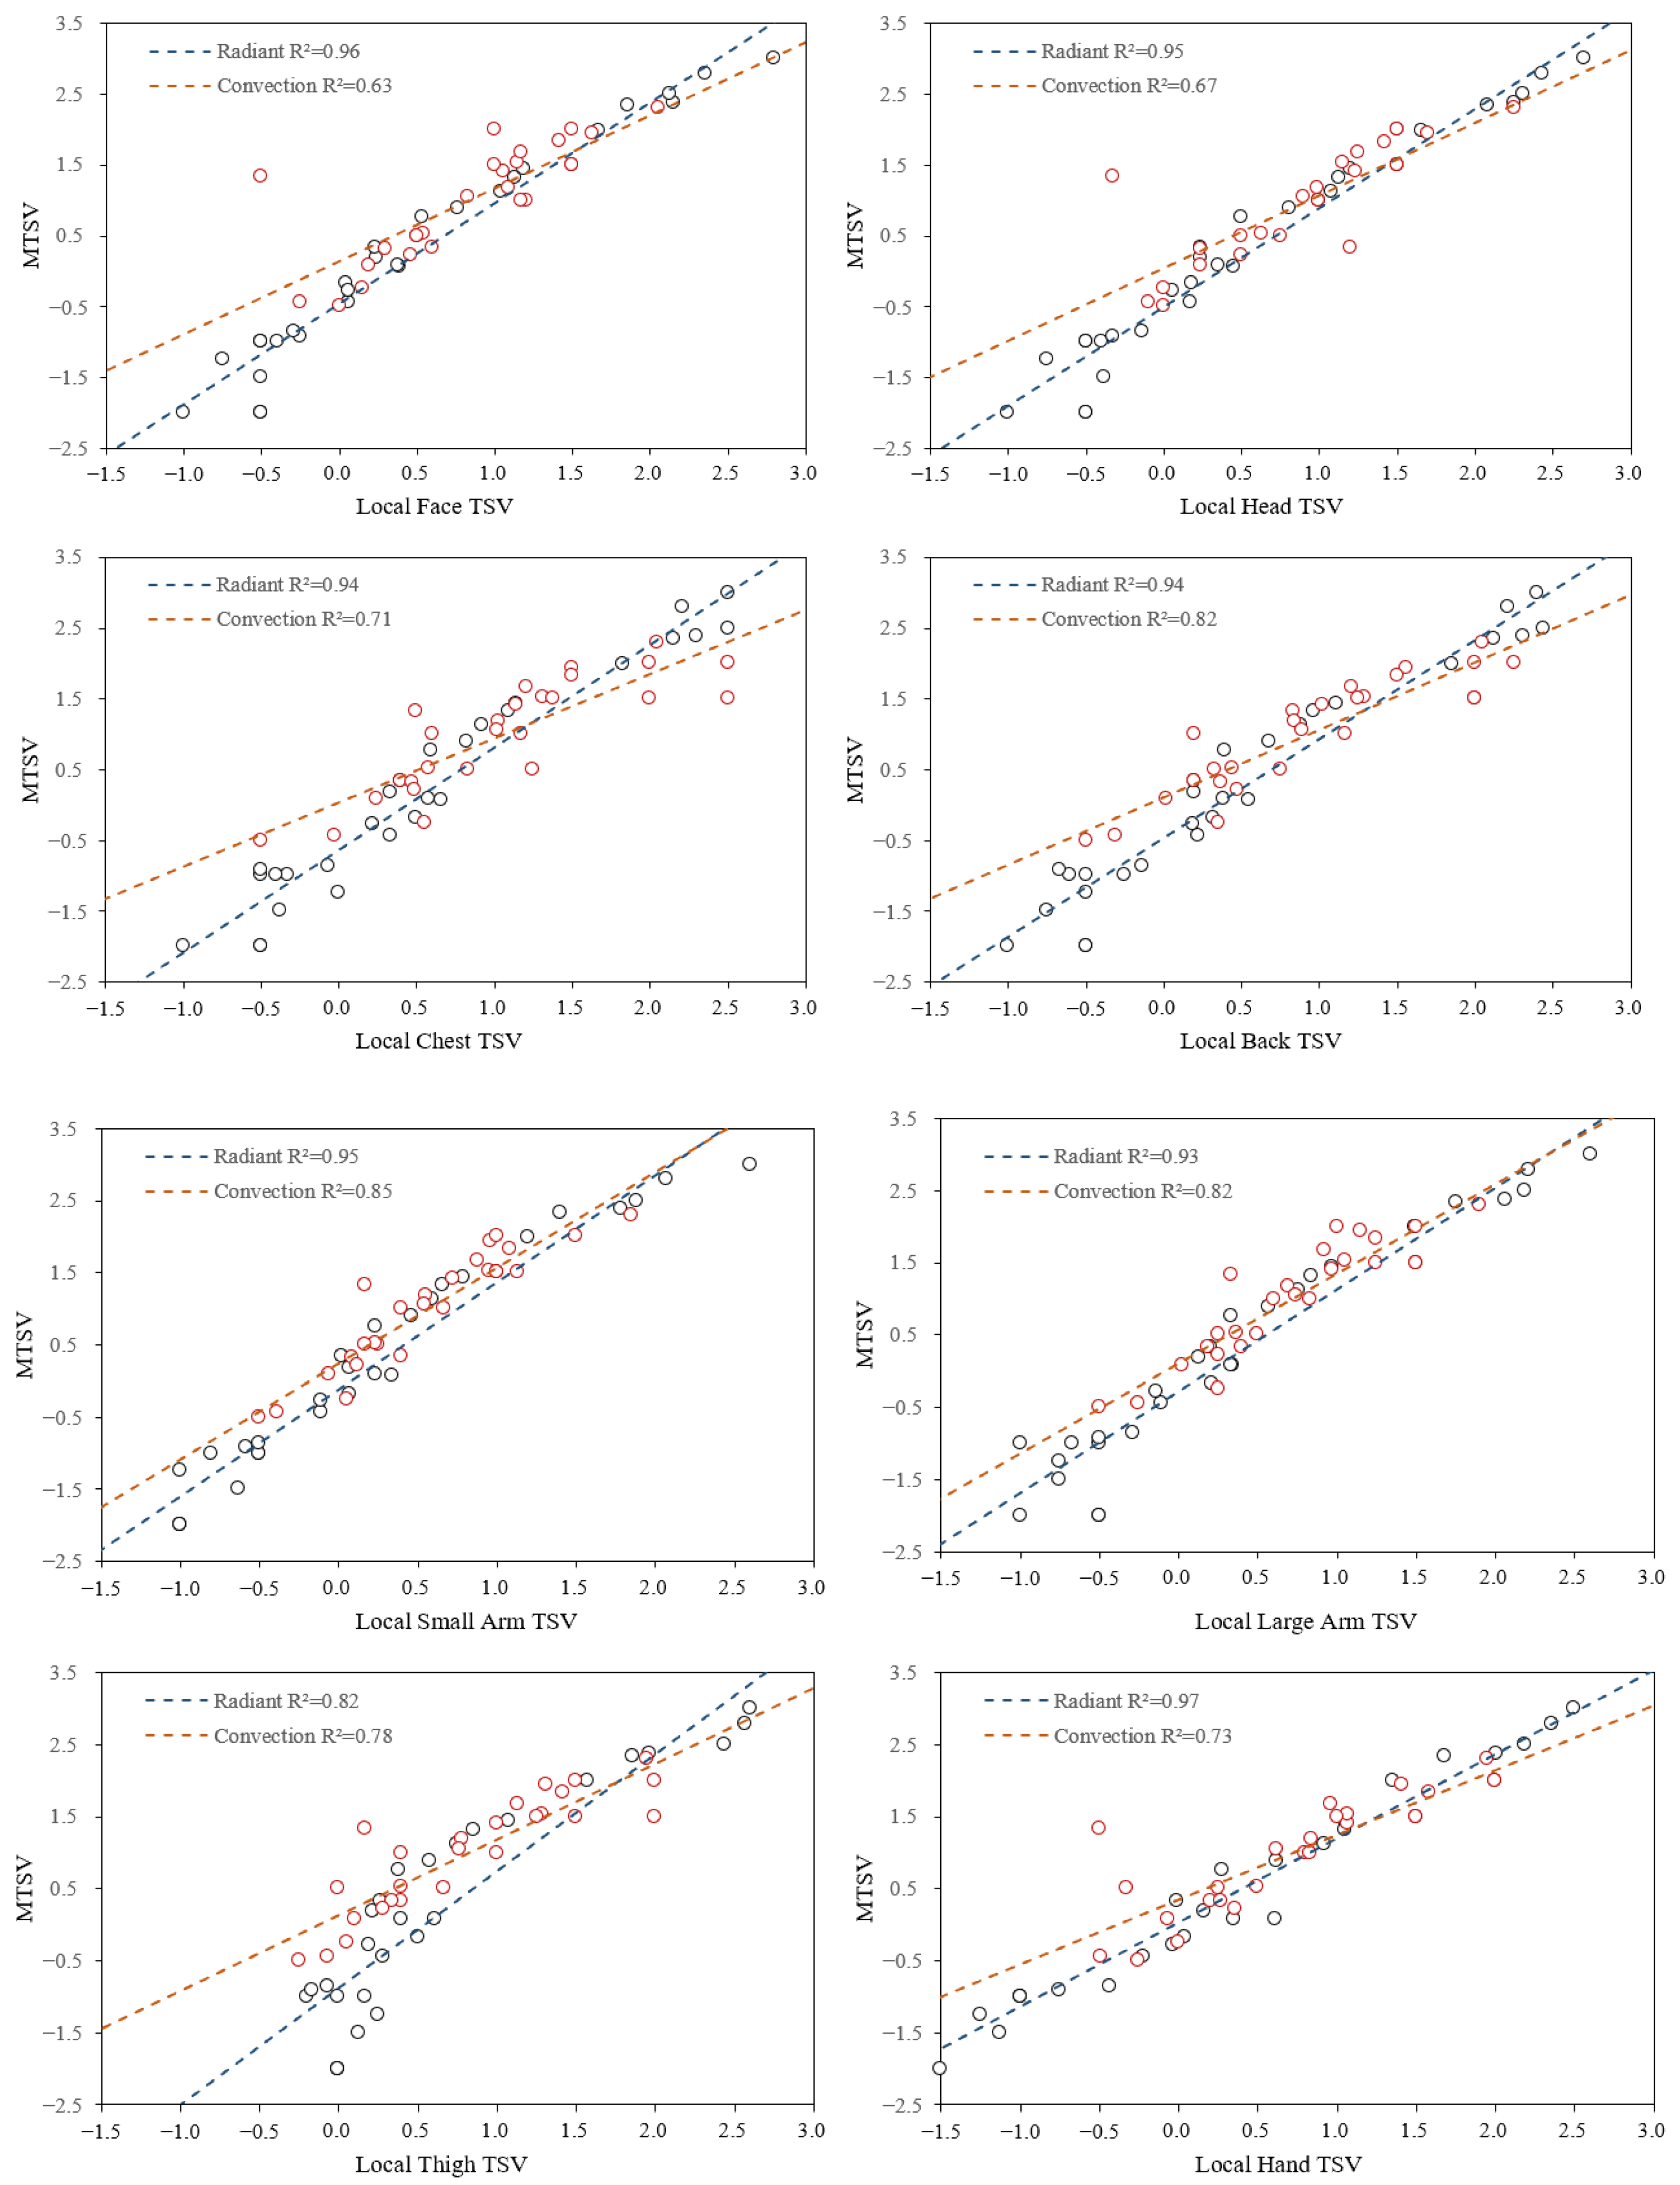
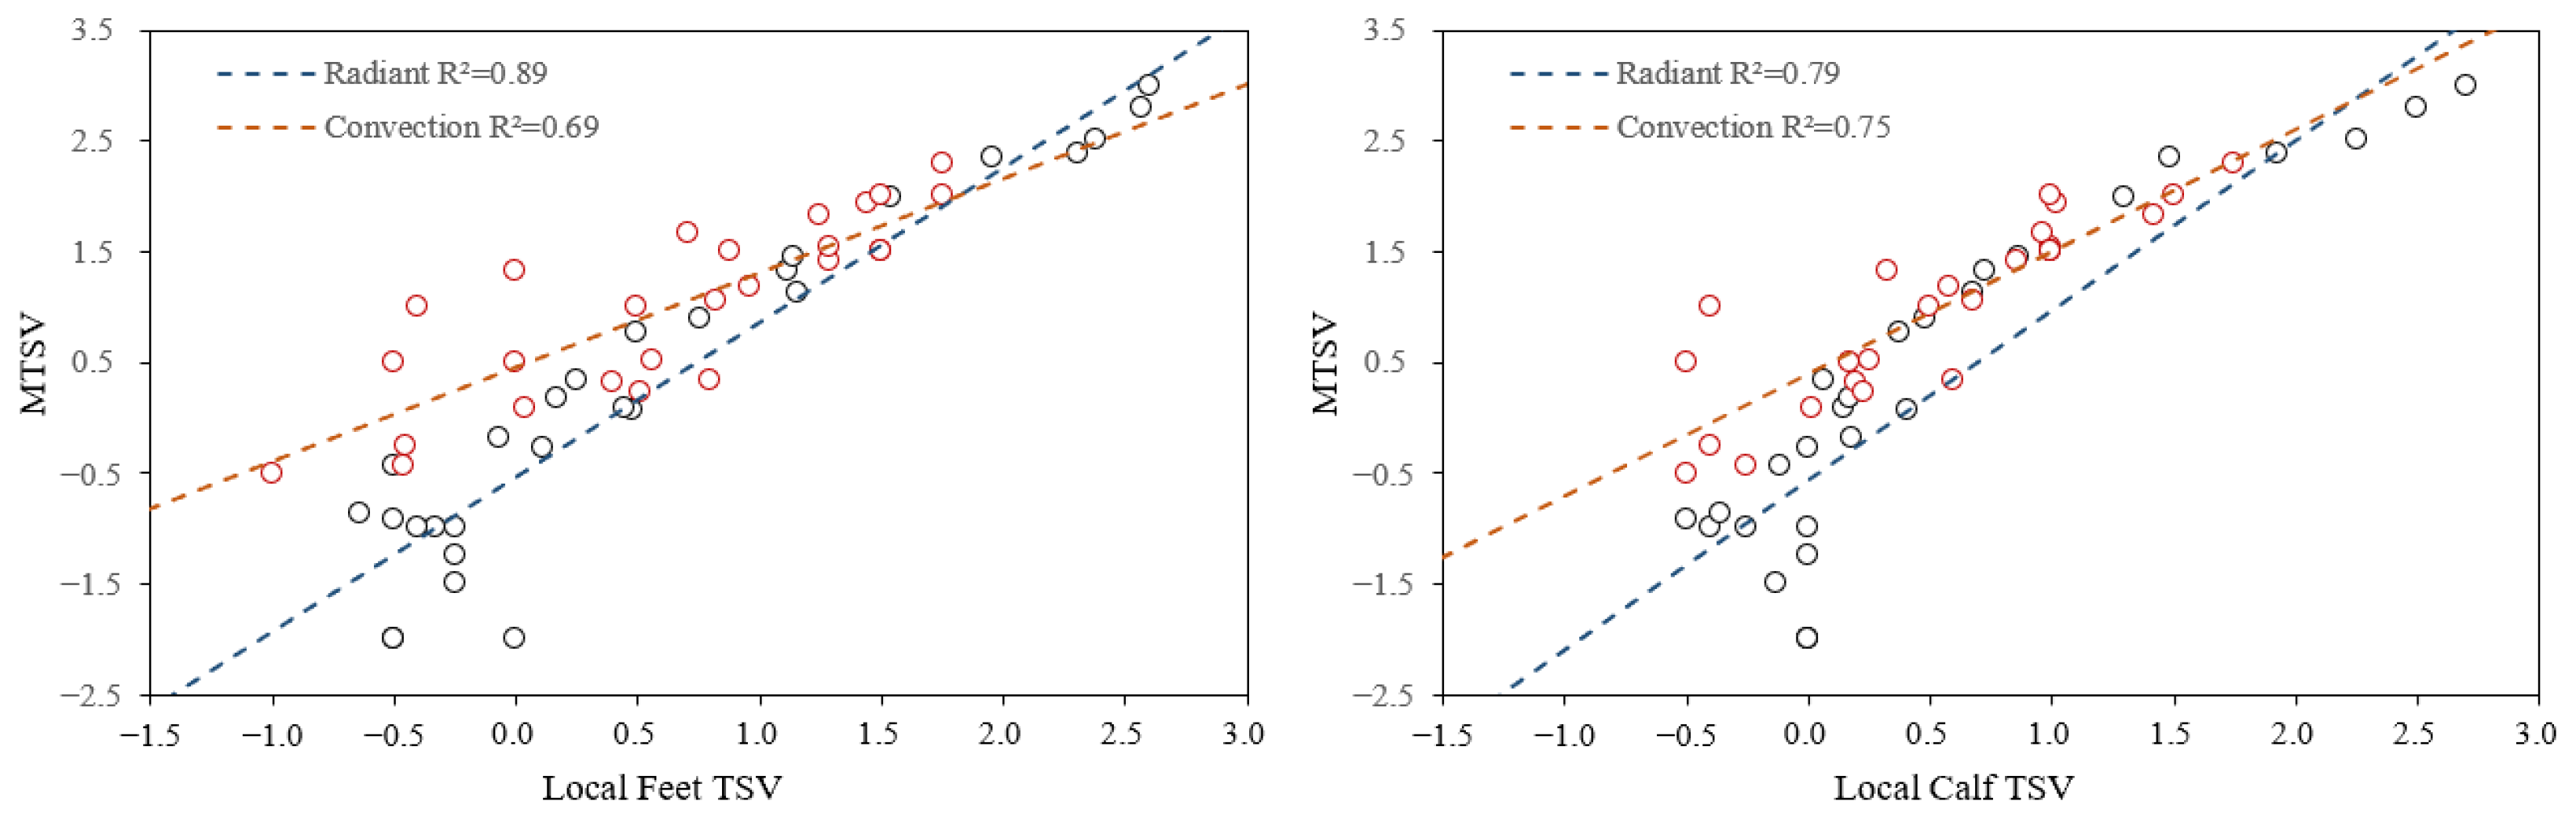
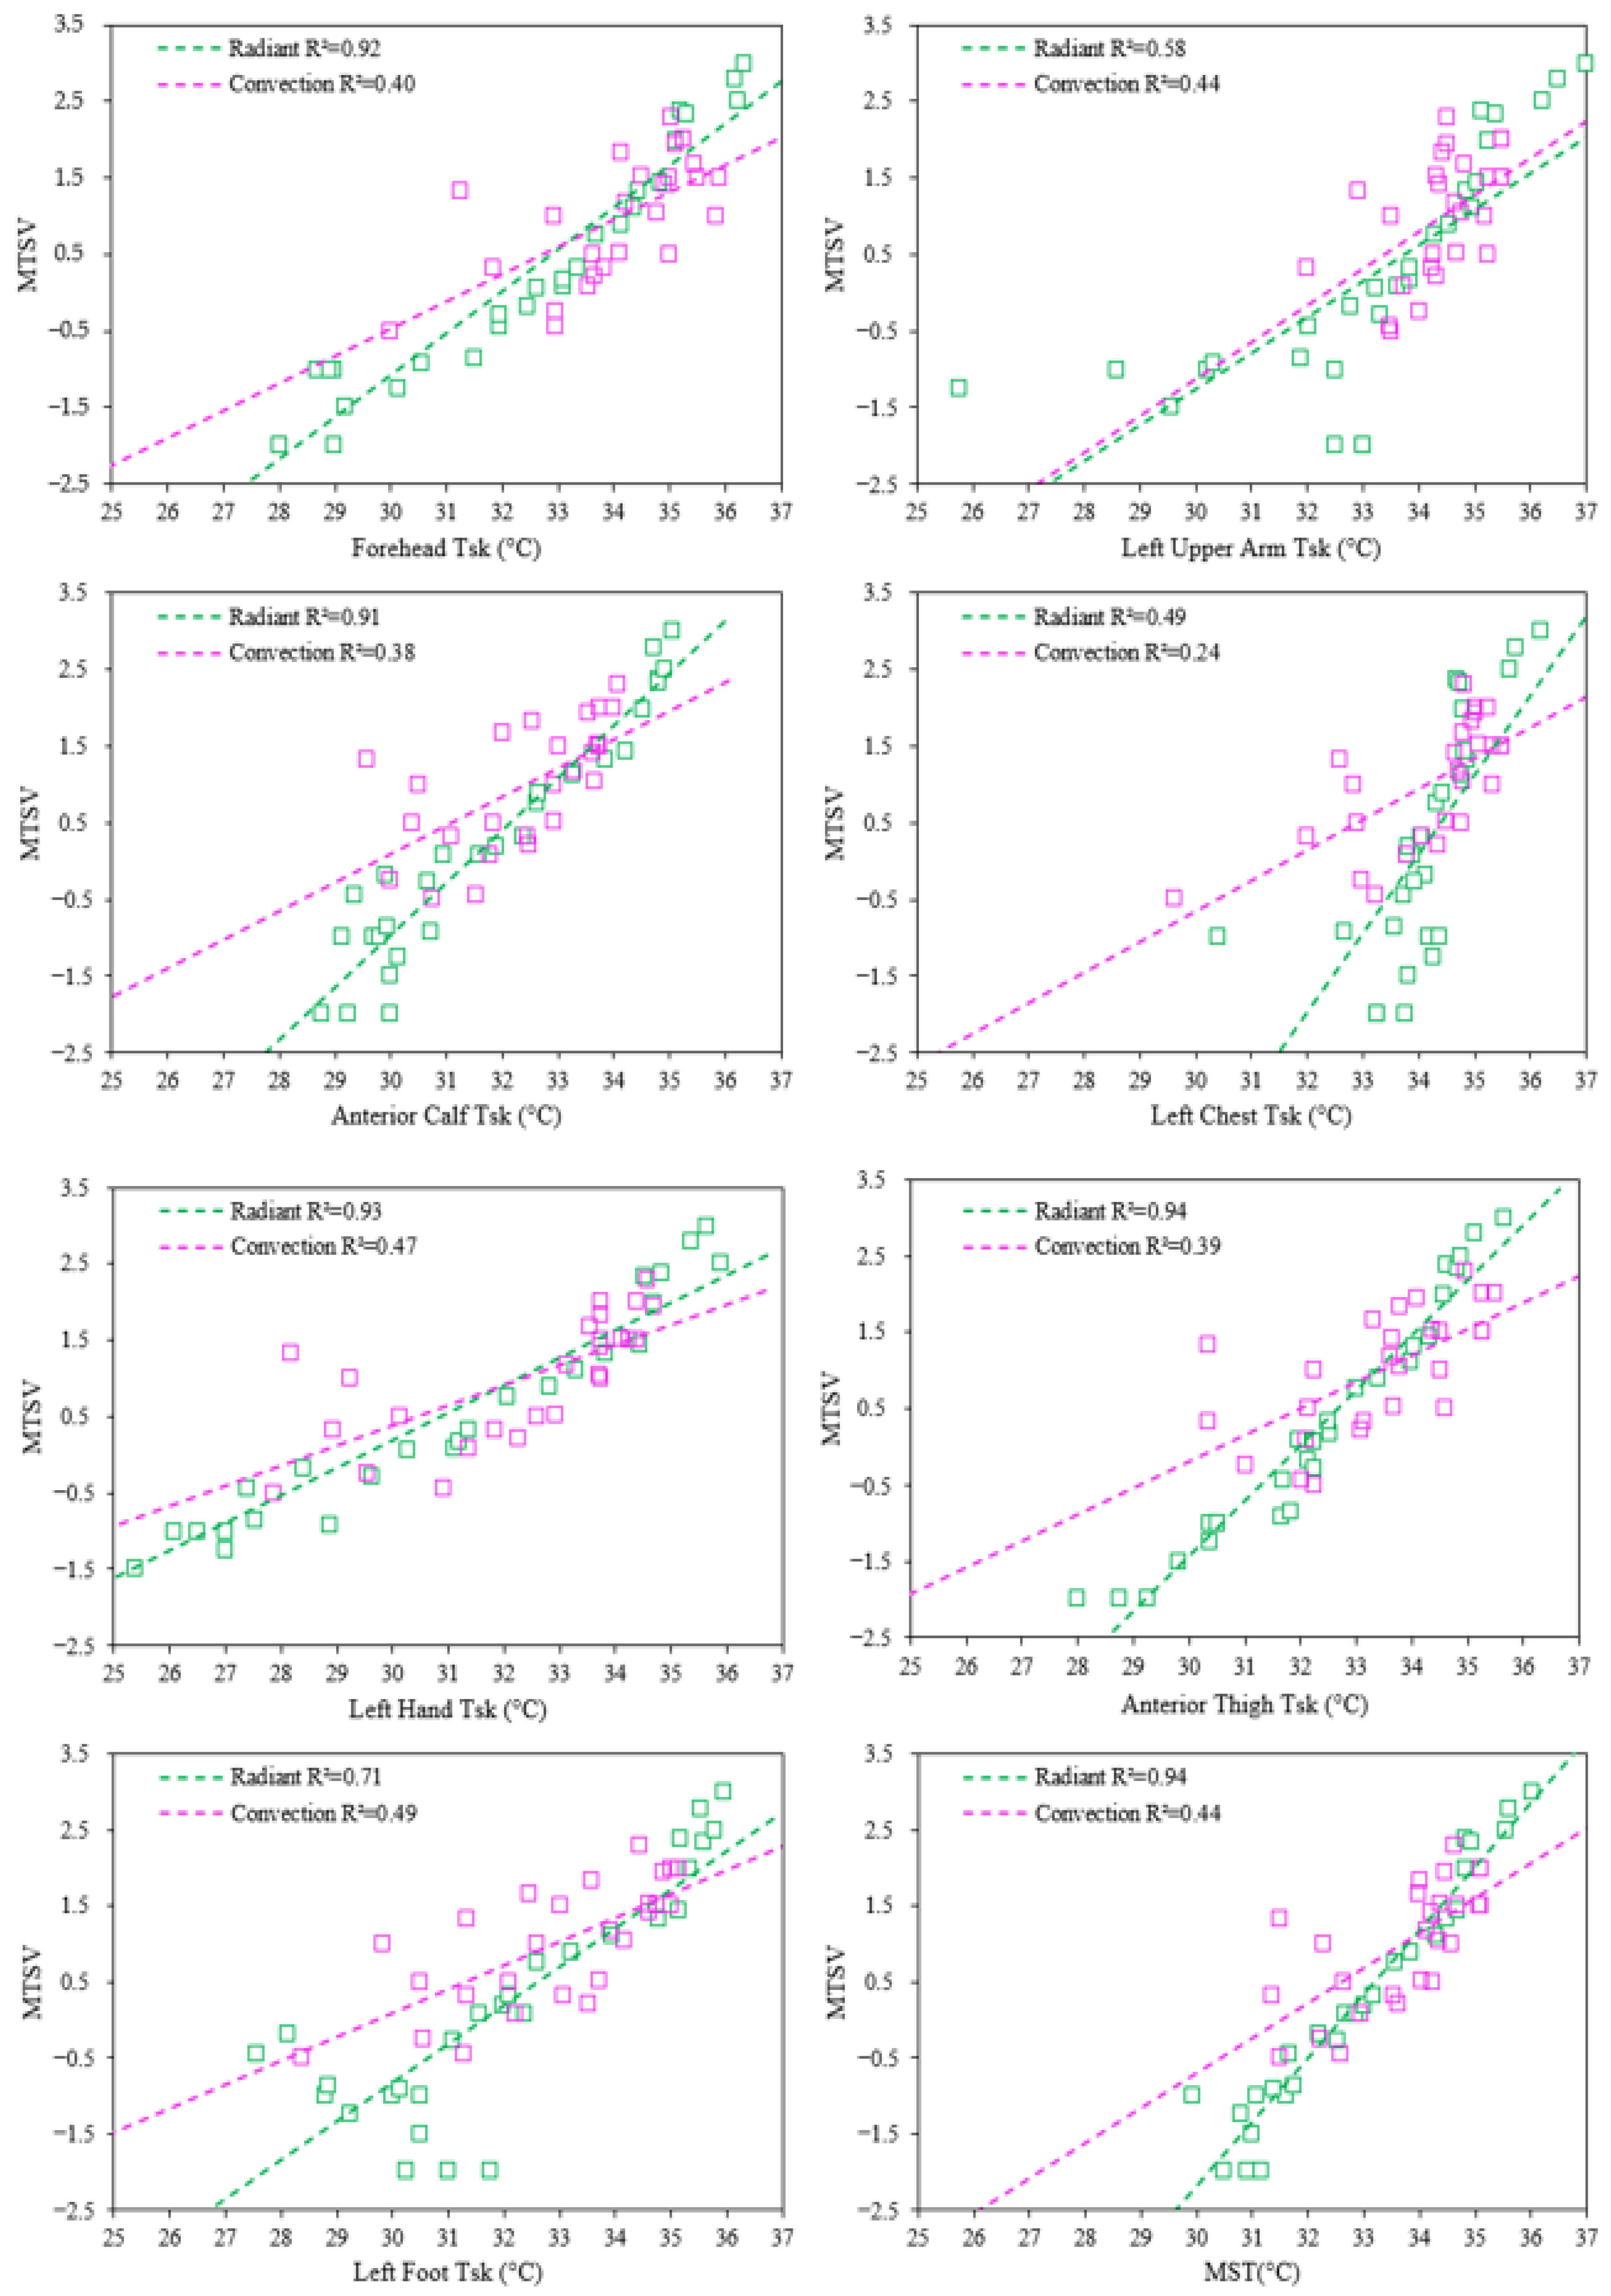
(2)
The overall thermal sensation under radiant conditions is more closely related to the local thermal sensation, which is evident in the skin temperature. The general thermal sensation under convective conditions has a weaker relationship with the local thermal sensation, and thermal comfort is associated with the stability of environmental factors, such as air velocity, temperature, and relative humidity.
(3)
During winter heating, natural ventilation, controllable radiant heating terminals, or distributed air supply systems can be used to provide residents with better thermal environment management to increase occupant comfort and lower energy use for heating.

Author Contributions

Conceptualization, Z.F.; methodology, Z.G.; software, Z.F.; validation, Z.G. and W.C.; formal analysis, Z.F.; investigation, Z.G. and Z.Z.; resources, H.W.; data curation, Z.Z.; writing—original draft preparation, Z.G.; writing—review and editing, Z.F. and H.W.; visualization, W.C.; supervision, Z.F.; project administration, H.W.; funding acquisition, Z.Z. All authors have read and agreed to the published version of the manuscript.

Funding

This research was funded by National Key R&D Program of China grant number [2018Yfd1101005].

Acknowledgments

The authors would like to thank all students who participated in the surveys.

Conflicts of Interest

The authors declare no conflict of interest.

References

  1. Fang, Z.; Feng, X.; Liu, J.; Lin, Z.; Mak, C.M.; Niu, J.; Tse, K.T.; Xu, X. Investigation into the differences among several outdoor thermal comfort indices against field survey in subtropics. Sustain. Cities Soc. 2019, 44, 676–690. [Google Scholar] [CrossRef]
  2. Luo, M.; Arens, E.; Zhang, H.; Ghahramani, A.; Wang, Z. Thermal comfort evaluated for combinations of energy-efficient personal heating and cooling devices. Build. Environ. 2018, 143, 206–216. [Google Scholar] [CrossRef] [Green Version]
  3. Zhong, H.; Wang, J.; Jia, H.; Mu, Y.; Lv, S. Vector field-based support vector regression for building energy consumption prediction. Appl. Energy 2019, 242, 403–414. [Google Scholar] [CrossRef]
  4. Li, B.; Yu, W.; Liu, M.; Li, N. Climatic strategies of indoor thermal environment for residential buildings in Yangtze River region, China. Indoor Built Environ. 2011, 20, 101–111. [Google Scholar] [CrossRef]
  5. Yin, P. Present situation and proposed approach of heating in Southern China. Heat. Vent. Air Cond. 2013, 43, 50–57. [Google Scholar]
  6. Wu, J.; Xu, Z.; Jiang, F. Analysis and development trends of Chinese energy efficiency standards for room air conditioners. Energy Policy 2018, 125, 368–383. [Google Scholar] [CrossRef]
  7. Sun, H.; Yang, Z.; Lin, B.; Shi, W.; Zhu, Y.; Zhao, H. Comparison of thermal comfort between convective heating and radiant heating terminals in a winter thermal environment: A field and experimental study. Energy Build. 2020, 224, 110239. [Google Scholar] [CrossRef]
  8. Bozkır, O.; Canbazoğlu, S. Unsteady thermal performance analysis of a room with serial and parallel duct radiant floor heating system using hot airflow. Energy Build. 2004, 36, 579–586. [Google Scholar] [CrossRef]
  9. Catalina, T.; Virgone, J.; Kuznik, F. Evaluation of thermal comfort using combined CFD and experimentation study in a test room equipped with a cooling ceiling. Build. Environ. 2009, 44, 1740–1750. [Google Scholar] [CrossRef]
  10. Hao, X.; Zhang, G.; Chen, Y.; Zou, S.; Moschandreas, D.J. A combined system of chilled ceiling, displacement ventilation and desiccant dehumidification. Build. Environ. 2007, 42, 3298–3308. [Google Scholar] [CrossRef]
  11. Imanari, T.; Omori, T.; Bogaki, K. Thermal comfort and energy consumption of the radiant ceiling panel system. Energy Build. 1999, 30, 167–175. [Google Scholar] [CrossRef]
  12. Tian, Z.; Love, J.A. A field study of occupant thermal comfort and thermal environments with radiant slab cooling. Build. Environ. 2008, 43, 1658–1670. [Google Scholar] [CrossRef]
  13. Lin, B.; Wang, Z.; Sun, H.; Zhu, Y.; Ouyang, Q. Evaluation and comparison of thermal comfort of convective and radiant heating terminals in office buildings. Build. Environ. 2016, 106, 91–102. [Google Scholar] [CrossRef]
  14. Hu, B.; Wang, R.; Xiao, B.; He, L.; Zhang, W.; Zhang, S. Performance evaluation of different heating terminals used in air source heat pump system. Int. J. Refrig. 2019, 98, 274–282. [Google Scholar] [CrossRef]
  15. Zhang, Y.; Chen, H.; Meng, Q. Thermal comfort in buildings with split air-conditioners in hot-humid area of China. Build. Environ. 2013, 64, 213–224. [Google Scholar] [CrossRef]
  16. Zhang, Q.; Yu, Z.; Cheng, H.; Liang, R. Field study on occupant thermal comfort in radiant floor heating system residential buildings of Suihua city in winter. J. Xi’an Univ. Archit. Tech. (Nat. Sci. Ed.) 2018, 50, 396–401. [Google Scholar]
  17. Mui, K.W.H.; Chan, W.T.D. Adaptive comfort temperature model of air-conditioned building in Hong Kong. Build. Environ. 2003, 38, 837–852. [Google Scholar] [CrossRef]
  18. Xu, C.; Li, S. Influence of perceived control on thermal comfort in winter, A case study in hot summer and cold winter zone in China. J. Build. Eng. 2021, 40, 102389. [Google Scholar] [CrossRef]
  19. Kumar, S.; Mathur, A.; Singh, M.K.; Rana, K.B. Adaptive thermal comfort study of workers in a mini-industrial unit during summer and winter season in a tropical country, India. Build. Environ. 2021, 197, 107874. [Google Scholar] [CrossRef]
  20. Takasu, M.; Ooka, R.; Rijal, H.B.; Indraganti, M.; Singh, M.K. Study on adaptive thermal comfort in Japanese offices under various operation modes. Build. Environ. 2017, 118, 273–288. [Google Scholar] [CrossRef]
  21. Wu, T.; Cao, B.; Zhu, Y. A field study on thermal comfort and air-conditioning energy use in an office building in Guangzhou. Energy Build. 2018, 168, 428–437. [Google Scholar] [CrossRef]
  22. Indraganti, M.; Ooka, R.; Rijal, H.B. Field investigation of comfort temperature in Indian office buildings: A case of Chennai and Hyderabad. Build. Environ. 2013, 65, 195–214. [Google Scholar] [CrossRef]
  23. ASHRAE. A. Standard; Thennal Environmental Conditions for Human Occupancy. American Society of Heating, Refrigerating and Air Conditioning Engineers (ASHRAE): Atlanta, GA, USA, 2017.
  24. JGJ. Technical Specification for Radiant Heating and Cooling; JGJ 142; Ministry of Housing and Urban-Rural Development of The People’s Republic of China: Beijing, China, 2012. (In Chinese)
  25. Mitchell, D.; Wyndham, C.H. Comparison of weighting formulas for calculating mean skin temperature. J. Appl. Physiol. 1969, 26, 616–622. [Google Scholar] [CrossRef] [PubMed]
  26. Choi, J.K.; Miki, K.; Sagawa, S.; Shiraki, K. Evaluation of mean skin temperature formulas by infrared thermography. Int. J. Biometeorol. 1997, 41, 68–75. [Google Scholar] [CrossRef]
  27. Huizenga, C.; Zhang, H.; Arens, E.; Wang, D. Skin and core temperature response to partial- and whole-body heating and cooling. J. Therm. Biol. 2004, 29, 549–558. [Google Scholar] [CrossRef] [Green Version]
  28. De Dear, R.; Ring, J.; Fanger, P. Thermal Sensations Resulting From Sudden Ambient Temperature Changes. Indoor Air 1993, 3, 181–192. [Google Scholar] [CrossRef]
  29. Zhao, R. Investigation of transient thermal environments. Build. Environ. 2007, 42, 3926–3932. [Google Scholar] [CrossRef]
  30. Alfano, F.R.D.; Dell’Isola, M.; Ficco, G.; Palella, B.I.; Riccio, G. On the measurement of the mean radiant temperature by means of globes: An experimental investigation under black enclosure conditions. Build. Environ. 2021, 193, 107655. [Google Scholar] [CrossRef]
  31. ISO 7726:1998; Ergonomics of the Thermal Environment–Instruments for Measuring Physical Quantities. International Standard Organization: Geneva, Switzerland, 1998.
  32. Lin, T.-P. Thermal perception, adaptation and attendance in a public square in hot and humid regions. Build. Environ. 2009, 44, 2017–2026. [Google Scholar] [CrossRef]
  33. Rijal, H.B.; Honjo, M.; Kobayashi, R.; Nakaya, T. Investigation of comfort temperature, adaptive model and the window-opening behaviour in Japanese houses. Arch. Sci. Rev. 2013, 56, 54–69. [Google Scholar] [CrossRef]
  34. Nicol, F.; Roaf, S. Pioneering new indoor temperature standards: The Pakistan project. Energy Build. 1996, 23, 169–174. [Google Scholar] [CrossRef]
  35. Rijal, H.; Yoshida, H.; Umemiya, N. Seasonal and regional differences in neutral temperatures in Nepalese traditional vernacular houses. Build. Environ. 2010, 45, 2743–2753. [Google Scholar] [CrossRef]
  36. Humphreys, M.; Rijal, H.; Nicol, J. Updating the adaptive relation between climate and comfort indoors; new insights and an extended database. Build. Environ. 2013, 63, 40–55. [Google Scholar] [CrossRef]
  37. Rupp, R.F.; Kim, J.; Ghisi, E.; de Dear, R. Thermal sensitivity of occupants in different building typologies: The Griffiths Constant is a Variable. Energy Build. 2019, 200, 11–20. [Google Scholar] [CrossRef]
  38. Arens, E.; Zhang, H.; Huizenga, C. Partial- and whole-body thermal sensation and comfort, Part II: Non-uniform environmental conditions. J. Therm. Biol. 2006, 31, 60–66. [Google Scholar] [CrossRef] [Green Version]
  39. Wang, Z.; Zhao, Z.; Lin, B.; Zhu, Y.; Ouyang, Q. Residential heating energy consumption modeling through a bottom-up approach for China’s Hot Summer–Cold Winter climatic region. Energy Build. 2015, 109, 65–74. [Google Scholar] [CrossRef]
  40. Zheng, Z.; Zhang, Y.; Mao, Y.; Yang, Y.; Fu, C.; Fang, Z. Analysis of SET* and PMV to evaluate thermal comfort in prefab construction site offices: Case study in South China. Case Stud. Therm. Eng. 2021, 26, 101137. [Google Scholar] [CrossRef]
  41. Antoniadou, P.; Papadopoulos, A.M. Occupants’ thermal comfort: State of the art and the prospects of personalized assessment in office buildings. Energy Build. 2017, 153, 136–149. [Google Scholar] [CrossRef]
  42. Wang, J.; Wang, S.; Xu, X.; Li, X.; He, P.; Qiao, Y.; Chen, Y. The diminishing effects of winter heating on air quality in northern China. J. Environ. Manag. 2023, 325, 116536. [Google Scholar] [CrossRef]
Figure 1. (a) Climate chamber schematic diagram. (b) Shaded window in the climate room. (c) Radiant floor heating and (d) convection heating for wall-mounted air conditioners.
Buildings 12 02232 g001aBuildings 12 02232 g001b
Figure 2. Experimental procedure.
Buildings 12 02232 g002
Figure 3. Disturbution of air temperature in different condition levels: (a) radiant and (b) convective heating.
Buildings 12 02232 g003
Figure 4. Indoor thermal parameter distribution: (a) air temperature, (b) relative humidity, (c) air velocity, and (d) mean radiant temperature.
Buildings 12 02232 g004
Figure 5. Distribution of the subjective thermal responses: (a) TSV, (b) HSV.
Buildings 12 02232 g005
Figure 6. The thermal sensation vote’s thermal preference distribution: (a) radiant and (b) convective heating.
Buildings 12 02232 g006
Figure 7. Relationships between the MTSV and Top: (a) radiation floor heating, (b) convection heating.
Buildings 12 02232 g007
Figure 8. Overall and local thermal sensory regression analysis.
Buildings 12 02232 g008aBuildings 12 02232 g008b
Figure 9. Thermal sensation and local skin temperature regression analysis.
Buildings 12 02232 g009
Table 1. Research findings of various heating terminals’ thermal comfort ranges.
Terminal TypeLocationThermal Comfort Range
Zhang et al. [15]Split Air-conditionersGuangzhou16.9–34.2 °C (80%);
20.6–30.5 °C (90%)
Qun et al. [16]Radiation floor heatingSuihua21.9–25.8 °C (80%)
Mui et al. [17]Air-conditionedHong Kong19.5–21.5 °C (90%)
Xu et al. [18]Split air conditionersNanjing Jiangsu8.1–25.6 °C (80%);
12.48–21.23 °C (90%)
Central heating systemsYangzhou, Jiangsu13.26–23.86 °C (80%);
15.91–21.21 °C (90%)
Sanjay et al. [19]Natural ventilationIndia22.7 °C
Marina et al. [20]Heating by air conditioningTokyo and Kanagawa23.5–26.6 °C (80%)
Wu et al. [21]Natural ventilationGuangzhou23.3 °C
Indraganti et al. [22]Air-conditionedHyderabad, India27.0 °C
Chennai, India26.1 °C
Table 2. Details on the subjects.
GenderAge (Year)Height (cm)Weight (kg)Body Surface Area
Male21–25171.2 (6.5)63.9 (10.3)1.75 (0.15)
Female21–24156.6 (4.9)44.6 (4.2)1.4 (0.08)
Average21–25163.9 (9.3)54.3 (12.4)1.58 (0.21)
Note: body surface area calculation formula is given by A = 0.202 W0.425H0.725.
Table 3. Subjective vote scale.
Subjective PerceptionSubjective Vote
TSVCold
(−3)
Cool
(−2)
Slightly cool (−1)Neutral
(0)
Slightly
warm (1)
Warm
(2)
Hot
(3)
HSVVery dry (−3)Dry
(−2)
Slightly dry (−1)Neutral
(0)
Slightly
wet (1)
Wet
(2)
Very wet (3)
Perception of air velocityVery small (−3)Small (−2)Slightly small (−1)Neutral
(0)
Slightly
big (1)
Big
(2)
Very big (3)
Satisfaction with temperatureSatisfactionDissatisfaction
Satisfaction with humiditySatisfactionDissatisfaction
Satisfaction with air velocitySatisfactionDissatisfaction
Temperature expectationPrefer coolerNo changePrefer warmer
Humidity expectationPrefer dryerNo changePrefer wetter
Air velocity expectationPrefer smallerNo changePrefer bigger
Table 4. Measurement devices and accuracy.
InstrumentTypeParameterMeasuring RangeAccuracySampling Rate (s)
Thermal comfort level recorderSSDZY-1Ta (°C)−20–80 °C±0.3 °C30 s
RH (%)0.01–99.9% RH±2% RH (10–90% RH)30 s
Tg (°C)−20–80 °C±0.3 °C30 s
Temperature and humidity automatic recording instrumentWSZY-1Ta (°C)−20–80 °C±0.3 °C30 s
RH (%)0.01–99.9% RH±2% RH30 s
Button-type thermometerDS1922LTskin (°C)−40–85 °C±0.5 °C30 s
Recorder of temperature and wind speed that is wirelessWFWZY-1Va (m/s)0.05–5 m/s5% ± 0.05% m/s30 s
Table 5. Relationship between A and Va [25].
Va<0.2 m/s0.2–0.6 m/s0.6–1.0 m/s
A0.50.60.7
Table 6. Descriptive statistics on the parameters affecting the interior environment.
Environmental ParametersMinimumMaximumAverageStandard Deviation
Radiant floor heatingTa (°C)11.7434.7426.684.22
RH (%)29.585.161.8211.76
Tg (°C)10.3635.926.694.26
Va (m/s)00.110.050.02
Convection heatingTa (°C)14.138.228.093.33
RH (%)15.977.247.7312.94
Tg (°C)16.34328.213.4
Va (m/s)00.890.120.13
Table 7. Summary of the acceptable temperature range.
Heating ConditionMTSVRange
Radiant flood heating−0.5–0.518.79–23.72
−1–116.32–26.19
Convection heating−0.5–0.520.1–25.93
−1–117.19–28.84
Table 8. Regression coefficients from the data.
Heating ConditionNσδTopσ2δTopbbadjσ2ERR
Radiant12853.019.060.1380.150.99
Convection14443.4111.630.2440.260.67
Publisher’s Note: MDPI stays neutral with regard to jurisdictional claims in published maps and institutional affiliations.

