1. Introduction
Nowadays, global climate change is becoming one of the greatest environmental challenges [
1]. It includes serious disruptions to the weather and climate patterns around the world, such as the impacts on rainfall, extreme weather events, and sea level rises, rather than just moderate temperature increases. One of the main reasons for the current environmental pollution problem is the excessive use of energy [
2,
3]. Across the entire world, buildings are major consumers of energy and major sources of greenhouse gas emissions. Around 30–40% of energy consumption and 30% of CO
2 emissions come from buildings [
4,
5,
6,
7]. Over the last 50 years, there has been a growing demand for houses and the energy necessary to run them due to a rapidly increasing world population [
8,
9]. According to the International Energy Agency (IEA), between 2012 and 2030, the building sector’s total energy consumption will increase by 4.74 quadrillion Btu (QBtu).
IEA reports indicate that space heating and cooling are responsible for 30% of all energy consumption [
7]. Passive cooling is considered part of an overall environmental design strategy that attempts to provide comfortable conditions in the interior of a building and to minimize buildings’ energy consumption [
10]. Previous research has reviewed passive cooling techniques for buildings [
10], examined the influence of environmental and building factors on the performance of passive cooling, and focused on improving passive cooling techniques [
11]. When incorporating passive cooling measures, thermal comfort should always be considered another important factor when evaluating the indoor environmental quality of buildings [
12,
13,
14,
15].
Over the last decade, the energy efficiency and thermal comfort of historical buildings have attracted increasing attention globally [
16,
17,
18]. In addition to the balance between energy and societal climate, the improvement of the energy efficiency of historical buildings should also take the building conversation and cultural heritage into consideration [
16]. Numerous previous studies have focused on the development of the numerical modeling of passive cooling techniques for historical buildings, the evaluation of air quality when using passive cooling techniques in historical buildings, and energy efficiency evaluations of heating systems in historical buildings; however, little research has systematically evaluated the passive cooling effect on thermal comfort [
19,
20,
21]. Ricciardi et al. and Diler et al. evaluated the thermal comfort of historical theaters and mosques [
12,
22]. However, historical residential buildings, which are more numerous than theaters or mosques and are more closely related to daily life, are not taken into consideration. For historical buildings, passive cooling strategies in terms of orientation, construction materials, openings, and shadings are limited to the local culture. Therefore, there is still a need to evaluate the effect of the passive cooling effect on the thermal comfort of historical buildings in hot–dry or hot–humid areas.
The purposes of this research are to explore the passive cooling features used in historic residential buildings, as well as to evaluate the effects of north-south orientation, natural ventilation, pitched roof, light color finishing, and window shading on the thermal comfort of these historic buildings. This study is expected to provide guidelines to assist architects in designing energy-efficient residential buildings, taking into account both the cultural heritage and thermal comfort of the buildings.
2. Research Methods
The developing world faces greater challenges than the developed world in terms of both the impact of climate change and the capacity to respond to it. These factors are even crucial for a country, such as Zanzibar, with high population growth and increasing energy demand. The Stone Town of Zanzibar forms a unique urban settlement due to a combination of geographical and historical circumstances. Due to its unique architecture and culture, it was declared a UNESCO World Heritage Site in 2000 and is one of the best manifestations of trade and maritime history on the East African Coast [
23,
24]. Therefore, historical residential buildings in Zanzibar were selected as the case study areas for the evaluation of the passive cooling technique and its effect on thermal comfort.
The study area was Stone Town, located in the urban historical site of Zanzibar; it has a humid tropical monsoon climate and is in a tropical region of East Africa with an equator line passing through it. Stone Town is a city of prominent historical and artistic importance in East Africa. Its unique architectural style mostly dates back to the 19th century, which reflects not only its once powerful role as the capital of an empire spanning two continents, but also the cultural fusion that it has encouraged and nurtured over the centuries. Several historical buildings in Stone Town can be found on the seafront, such as former palaces of the sultans, fortifications, and mosques.
In order to evaluate the thermal comfort of the historical buildings of Stone Town in Zanzibar, questionnaires and field surveys were applied regarding two buildings. The questionnaire design, selection of case study buildings, and physical measurement details in the field survey are presented in this section.
2.1. Questionnaire Survey
The questionnaire surveys were conducted over a series of four weeks in February, the summer season, in Stone Town, Zanzibar. The questionnaire survey was conducted three times a day, between 7 a.m. and 10 a.m., 12 p.m. and 3 p.m., and 5 p.m. and 9 p.m. The sample size of this study was 180, which accounts for 10% of the total population of Stone Town Historical City [
25]. All participants lived in Stone Town, Zanzibar.
Subjective thermal comfort data were recorded using a questionnaire designed with considerations given to ASHRAE Standard 55 [
26]. The questionnaire developed for this survey was divided into four main sections, as follows.
Part 1: Background and demography of the respondents. The first section consisted of general information about the participants, including their age, gender, and years of living in their current building.
Part 2: Building features. The second section covered several questions about the building’s features, such as openings (door, window types, and materials), the height of the building, wall and roof materials, and the use of different thermal environment control means (windows and local fan/air condition/shading devices).
Part 3: Indoor and outdoor environment information. The indoor environment information included temperature, relative humidity, air velocity, and satisfaction evaluations regarding indoor thermal environment quality and personal environmental control. The outdoor environment information data during the field survey period were obtained from the Zanzibar Meteorological Department, including factors such as temperature, air velocity, and sun radiation.
Part 4: Thermal comfort evaluation. Thermal comfort was rated on an ASHRAE 7-point scale with the following aspects: thermal sensation vote (TSV, −3: cold, −2: cool, −1: slightly cool, 0: neutrality, 1: slightly warm, 2: warm and 3: hot), humidity predicted vote (HPV, −3 much too dry, −2 too dry, −1 slightly dry, 0 just right, +1 slightly humid, +2 too humid, +3 much too humid), and draft perception vote (DPV indicates that the air is perceived to be: −3 much too still, −2 too still, −1 slightly still, 0 just right, +1 slightly right, +2 too breezy, +3 much too breezy). The McIntyre scale was used to assess thermal preferences; it is a 3-point scale. The questions asked were, “Would you like to have it warmer (1), no change (0), cooler (−1)?” or “At this moment, would you prefer to feel warmer, cooler, or no change?” The thermal acceptability vote was used to determine the judgment regarding the perception of the thermal environment. The question was, “At this moment, do you consider the thermal environment acceptable (0) or unacceptable (1)? Detailed questionnaires can be found in
Appendix A.
All the information collected by the questionnaire surveys was saved and analyzed in SPSS25.0.
2.2. Field Survey
To evaluate the thermal comfort level of the indoor environment in historical buildings, a field survey was carried out in two residential houses. The buildings were monitored for six consecutive days in February, as February is the hottest month and is the period in which the northeast monsoon wind blows relatively strongly. Each building was surveyed three times a day, between 7 a.m. and 10 a.m., 12 p.m. and 3 p.m., and 5 p.m. and 9 p.m., together with the questionnaire.
2.2.1. Selection of the Case Study Buildings
The criteria for selecting buildings for the field study were as follows:
The buildings selected were grouped inside the Stone Town Historical Area.
The buildings were built 200 to 270 years ago, around the middle of the 18th century.
The buildings had almost the same structure and building envelope and were constructed with coral stones but with different building forms (typology).
The buildings were easily accessible.
Architectural drawings of the apartments were available.
Finally, two historical residential buildings, named HRB1 (
Figure 1a) and HRB2 (
Figure 1b), were chosen for the case study. The floor plans of HRB1 and HRB2 are presented in
Figure 2 and
Figure 3.
HRB1 is a single-family residential house located in Shangani Ward and is 15 m from a main road. The building has a rectangular shape and a surface area of approximately 183.75 square meters. It is a three-story building; the ground floor is used as a shop, but it was not surveyed in this research, while the remaining upper two stories are used for residential purposes with a single family of four members. The first floor of this building is used as a living space, and the second floor is used for bedrooms (
Figure 2).
HRB2 is a multi-story building located in Malindi Ward. The building has a square shape and a surface area of approximately 360 square meters, which is two times the surface area of HRB1, with a 4 m-by-4 m courtyard accessible only by ground floor users. There are two dependent flats/units on the ground floor and another two flats/units on the first and second floors, which together give a total of four flats/units and four households in HRB2. Due to time and financial constraints, only one representative double-floor apartment was selected for the study. The first floor of this apartment is used as a living space, and the second floor is used for bedrooms (
Figure 3).
2.2.2. Physical Measurements
The indoor environmental parameters, such as air temperature and relative humidity, were measured using a thermohygrometer device (TES1341) for a measurement period of approximately 10 min at an interval of 1 min. Three sampling points were selected, which resulted in 18 sampling points for this study in each surveyed building. For HRB1, the thermohygrometers were hung on the wall in the living room (Point A), bedroom 2 (Point B), and outside (
Figure 2). For HRB2, the instruments were hung in the living room (Point C), bedroom 3 (Point D), and outside (
Figure 3). The thermohygrometers were placed at a height of 1.1 m above the floor, which represents the height of the neck of a seated occupant, and 1.5 m away from the wall. Other environmental parameters, such as air velocity and direction, were assumed to be the same as those measured by meteorological stations.
3. Results
The results of the questionnaires and field studies from the study period are given in this section.
3.1. Questionnaire Survey Results
A total of 159 of 180 samples were valid for the questionnaire survey. The gender proportion of the samples was as follows: female, 96 (60.37%), and male, 63 (39.6%).
3.1.1. Building Envelope Evaluation
A total of 100% of the respondents’ results showed that their buildings were built using coral stone, as shown in
Table 1. Stone coral was actually beneficial to the thermal conditions of the building. Their heavy structure cools indoor spaces by delaying heat transmission from the outside, but in the evening, they release heat to the interior space (as well as to the outside). More air movement via the opening of windows is helpful for decreasing indoor temperature at night and in the early morning.
Regarding openings, 26.41% of the occupants had between 1 and 7 openings, while 63.52% had between 7 and 14 openings, and the remaining 10.06% had >14 openings in their buildings. This shows the awareness of historical builders regarding natural ventilation. Nearly two-thirds (68.55%) of the respondents use louver/shutters; this kind of window can help to prevent sun rays from penetrating inside the building.
Regarding ceilings, the occupants’ replies showed that 68.55% of their buildings have traditional ceilings, which are mangrove ceilings; this type of ceiling is made up of earth and mangrove poles. A total of 20.75% of the respondents had changed the ceiling to a hardboard ceiling, and 10.69% had reinforced concrete ceilings.
Regarding roof type, a total of 83.64% (hip and pitched roof) of the surveyed buildings had a roof structure that acts as a barrier against heat entering the living space and also creates a space under the roof, as it is the most common and economical heat insulator in every building.
A range of sun shading devices were listed in the survey, in which the respondents indicated which shading method they used and specified a reason for using the shading. A total of 15.72% of the survey participants indicated that they used curtains and a verandah/balcony (CVB) as their choice of shading, and 10.69% indicated that they used a verandah/balcony (VB). A total of 73.58% indicated that they used curtains (C).
3.1.2. Indoor Environment Parameter Assessment
According to ASHRAE Standard 55, the factors required for the evaluation of thermal comfort include metabolic rate, clothing insulation, air temperature, radiant temperature, air speed, and humidity. The two personal parameters, such as clothing insulation value and metabolic rate, were estimated in accordance with ASHRAE Standard 55 and ISO 7730 [
26,
27]. In this study, we set the metabolic rate as 1.2 met, which represents sedentary activities (office, dwelling school, and laboratory), and the clothing insulation value as 0.5 Clo.
The overall indoor air temperature taken in each dwelling during the questionnaire survey ranged between 26 °C and 32 °C, and the indoor relative humidity ranged from 58.90% to 75.05%, with a mean value of 63.44%. Based on these data, the operative temperature
was calculated according to ASHRAE Standard 55 as:
where
is the averaged air temperature obtained from questionnaire,
is the mean radiant temperature, which is assumed to be equal to the air temperature, and
is a function of the average air speed. The air speeds were assumed to be the same as those measured by meteorological stations. The calculated operative temperature was 29.1 °C on average, which is outside the comfort zone limit of ASHRAE Standard 55.
The results of the evaluation of the indoor humidity perception vote (HPV) and the indoor draft perception vote (DPV) are presented in
Figure 4. Only 63.51% of 159 respondents voted for HPV within the three central categories, showing that the occupants did not have acceptable thermal conditions. A total of 26.42% of the residents felt that the environment was much too humid, which is understandable in such a humid area, with a relative humidity between 58.90% and 75.05%.
Regarding the DPV, a large portion (52.19%) of the subjects perceived the air to be too steady (−3 to −2), while 31.44% of the respondents felt that the air velocity was just right (−1, 0, +1), and only 16.35% felt that the velocity should be less. These results show that air movement and thermal conditions in their buildings were not acceptable.
3.1.3. Thermal Sensation Vote (TSV)
The results of the TSV evaluation showed that the majority (73.57%) of the respondents voted between “−1 slightly cool” and “+1 slightly warm”, while almost half (47.16%) of the respondents voted slightly warm. Linear regression was performed between thermal sensation and operative temperature to determine the strength of the relationship between them in residential buildings. The data are plotted in
Figure 5. The fitted regression equation for the subjects’ sensations versus the operative temperature was:
The coefficient of determination (R
2) between TSV and the operative temperature was 0.875, which means TSV correlated strongly with the operative temperature. The slope of the regression line, which indicates the subjects’ thermal sensitivity concerning the operative temperature, was high (0.65 unit/°C) compared with that in other warm places [
28,
29,
30]. This demonstrates that the residents of Stone Town, Zanzibar, are less tolerant of a wider range of temperatures.
The neutrality condition derived by solving the regression equation for zero (neutral) yielded an estimated neutrality of 27.40 °C, as shown in
Figure 5. A comfort band of 26.00–28.90 °C coincided with −1 and +1 sensation votes.
3.1.4. Thermal Preferences
Thermal preference was evaluated using the McIntyre scale (−1 (cooler), 0 (no change), +1 (warmer)). A total of 68.55% of the respondents preferred to be cooler in their buildings, and only 31.44% of the subjects indicated that no changes in the thermal environment were required. These results suggest that people prefer to feel cooler than neutral, which aligns well with previous results from studies regarding warm places [
28,
31]. The thermal acceptability results align well with those of thermal preference. A total of 68.55% of the participants judged that their thermal sensation was not acceptable, and 31.44% accepted the overall temperature of their building.
3.2. Field Survey Results
3.2.1. Passive Cooling Features
The passive cooling features of the two case study buildings (HRB1 and HRB2) regarding orientation, materials, and construction, and cooling and ventilation are presented in this subsection and are summarized in
Table 2.
Orientation
HRB1 is surrounded by four streets of 1.5 m to 2 m in width and is approximately 15 m from the Kenyatta main road. Being surrounded by higher buildings, HRB1 receives shade. The long axis of the building runs from west to east, which means the façade on the north–south axis is bigger than that on the west–east elevation axis. It has a good orientation toward the wind direction and deflects the dominant orientation of the sun in the east–west direction. None of the bedrooms are located on the west side, which is a disadvantaged side. Even though the living room is located with an eastern orientation, it does not receive much heating during the day because of the shading element (balcony on the first floor) along the whole length of the façade. Traditionally, balconies are used to protect walls from direct solar radiation and act as transitional spaces to inner living areas. No air conditioning (AC) was in operation during the investigation.
HRB2 is bounded by three streets about 1.5 m to 2 m wide on the northern, southern, and western sides of the plot. The eastern side has shared a wall with another building, but not the whole length of the building because in the middle there is a courtyard/air well, which prevents the building from being totally attached. The long axis of the building runs north to south, which is contrary to the recommendation of the best orientation for buildings in tropical climates. The living room, bedroom 1, and bedroom 2 of HRB2 are located on the west side; therefore, they heat up in the afternoon, although there is shade protection on the window to break up the sun rays and curtains for protection from solar heat gain in the living room and bedrooms. Bedroom 3 is well-oriented at the southern side of the building; this room also benefits from air movement and natural light through the courtyard/air shaft.
Materials and Construction
Natural, local building materials made from stone, wood, and soil were found to be used in this case study. Both HRB1 and HRB2 are constructed with coral rags laid in random gravel. The exterior walls of these buildings are very thick, with a 1 m thickness, and act as load bearing walls; the interior walls are 500 mm thick, with the exception of bathroom/kitchen walls, which are 200 mm thick; the thick stone walls act as thermal mass against heat penetration.
The exterior and interior walls of HRB1 are painted in white, which saves the cooling energy of the building [
32,
33,
34]. Similarly, the outside wall finish of HRB2 is rough with pale yellow paint, while the interior walls are painted white.
There is no insulation on the walls, windows, or roofs of HRB1 and HRB2 because they are expensive and difficult to maintain. HRB1 has a pitched roof of 32°, and the roof overhangs (600 mm), providing a sun shading effect to protect the walls. The existence of a ceiling also creates an attic space under the roof, as it is the most common and economical heat insulator that must be installed in every building. The roof overhangs can provide a sun shading effect to protect the walls. The floor slabs of this case study were found to be traditionally made of boriti poles (mangrove poles) with a lime–concrete cover laid over to form the floor above. The boritis or mangroves support the slab and help the walls remain upright. HRB2 has a flat roof; all rooms are prone to heat gain through the floor slab, even though the ceiling is painted with a whitewash.
Cooling and Ventilation
The living room, dining room, and bedroom 1 in HRB1 have provisions for cross-ventilation via four pairs of windows for bedroom 1, three pairs of windows for the living room with a jalousie door that opens up to provide maximum airflow inside the spaces, and lastly, two pairs of windows for the dining room; thus, it seems that the spaces inside the room are affected by the air flow.
Regarding HRB2, the living room and bedroom 1 have provisions for cross-ventilation via three pairs of windows for bedroom 1 (two openings on opposite and adjacent walls) and three pairs of windows for the living room (two openings on opposite and adjacent walls); thus, it seems that the spaces inside the room are affected by the air flow. The windows in HRB2 are all double-winged shuttered windows. Although the windows in most of the rooms have been designed to enhance cross-ventilation, in this case, there are some windows that are not open every day, e.g., the living room window with a southern orientation is not opened during the whole year; this is because of the furniture (showcase) kept in front of the window. Lattice windows are used on the west façades of this building to enhance cross-ventilation and daylight. The shading devices and shuttering of the windows in the case study building are 400 mm by 2000 mm in dimension on all sides of the building. The orientation for wind flow is quite challenging only on the northeastern side (blockage of air flow) because, on its eastern side, the building shares a common wall with another building, but the historical builders demonstrated common sense by introducing a 4 m-by-4 m courtyard/air well that allows air flow and natural daylight to enter the building.
3.2.2. Air Temperature and Humidity
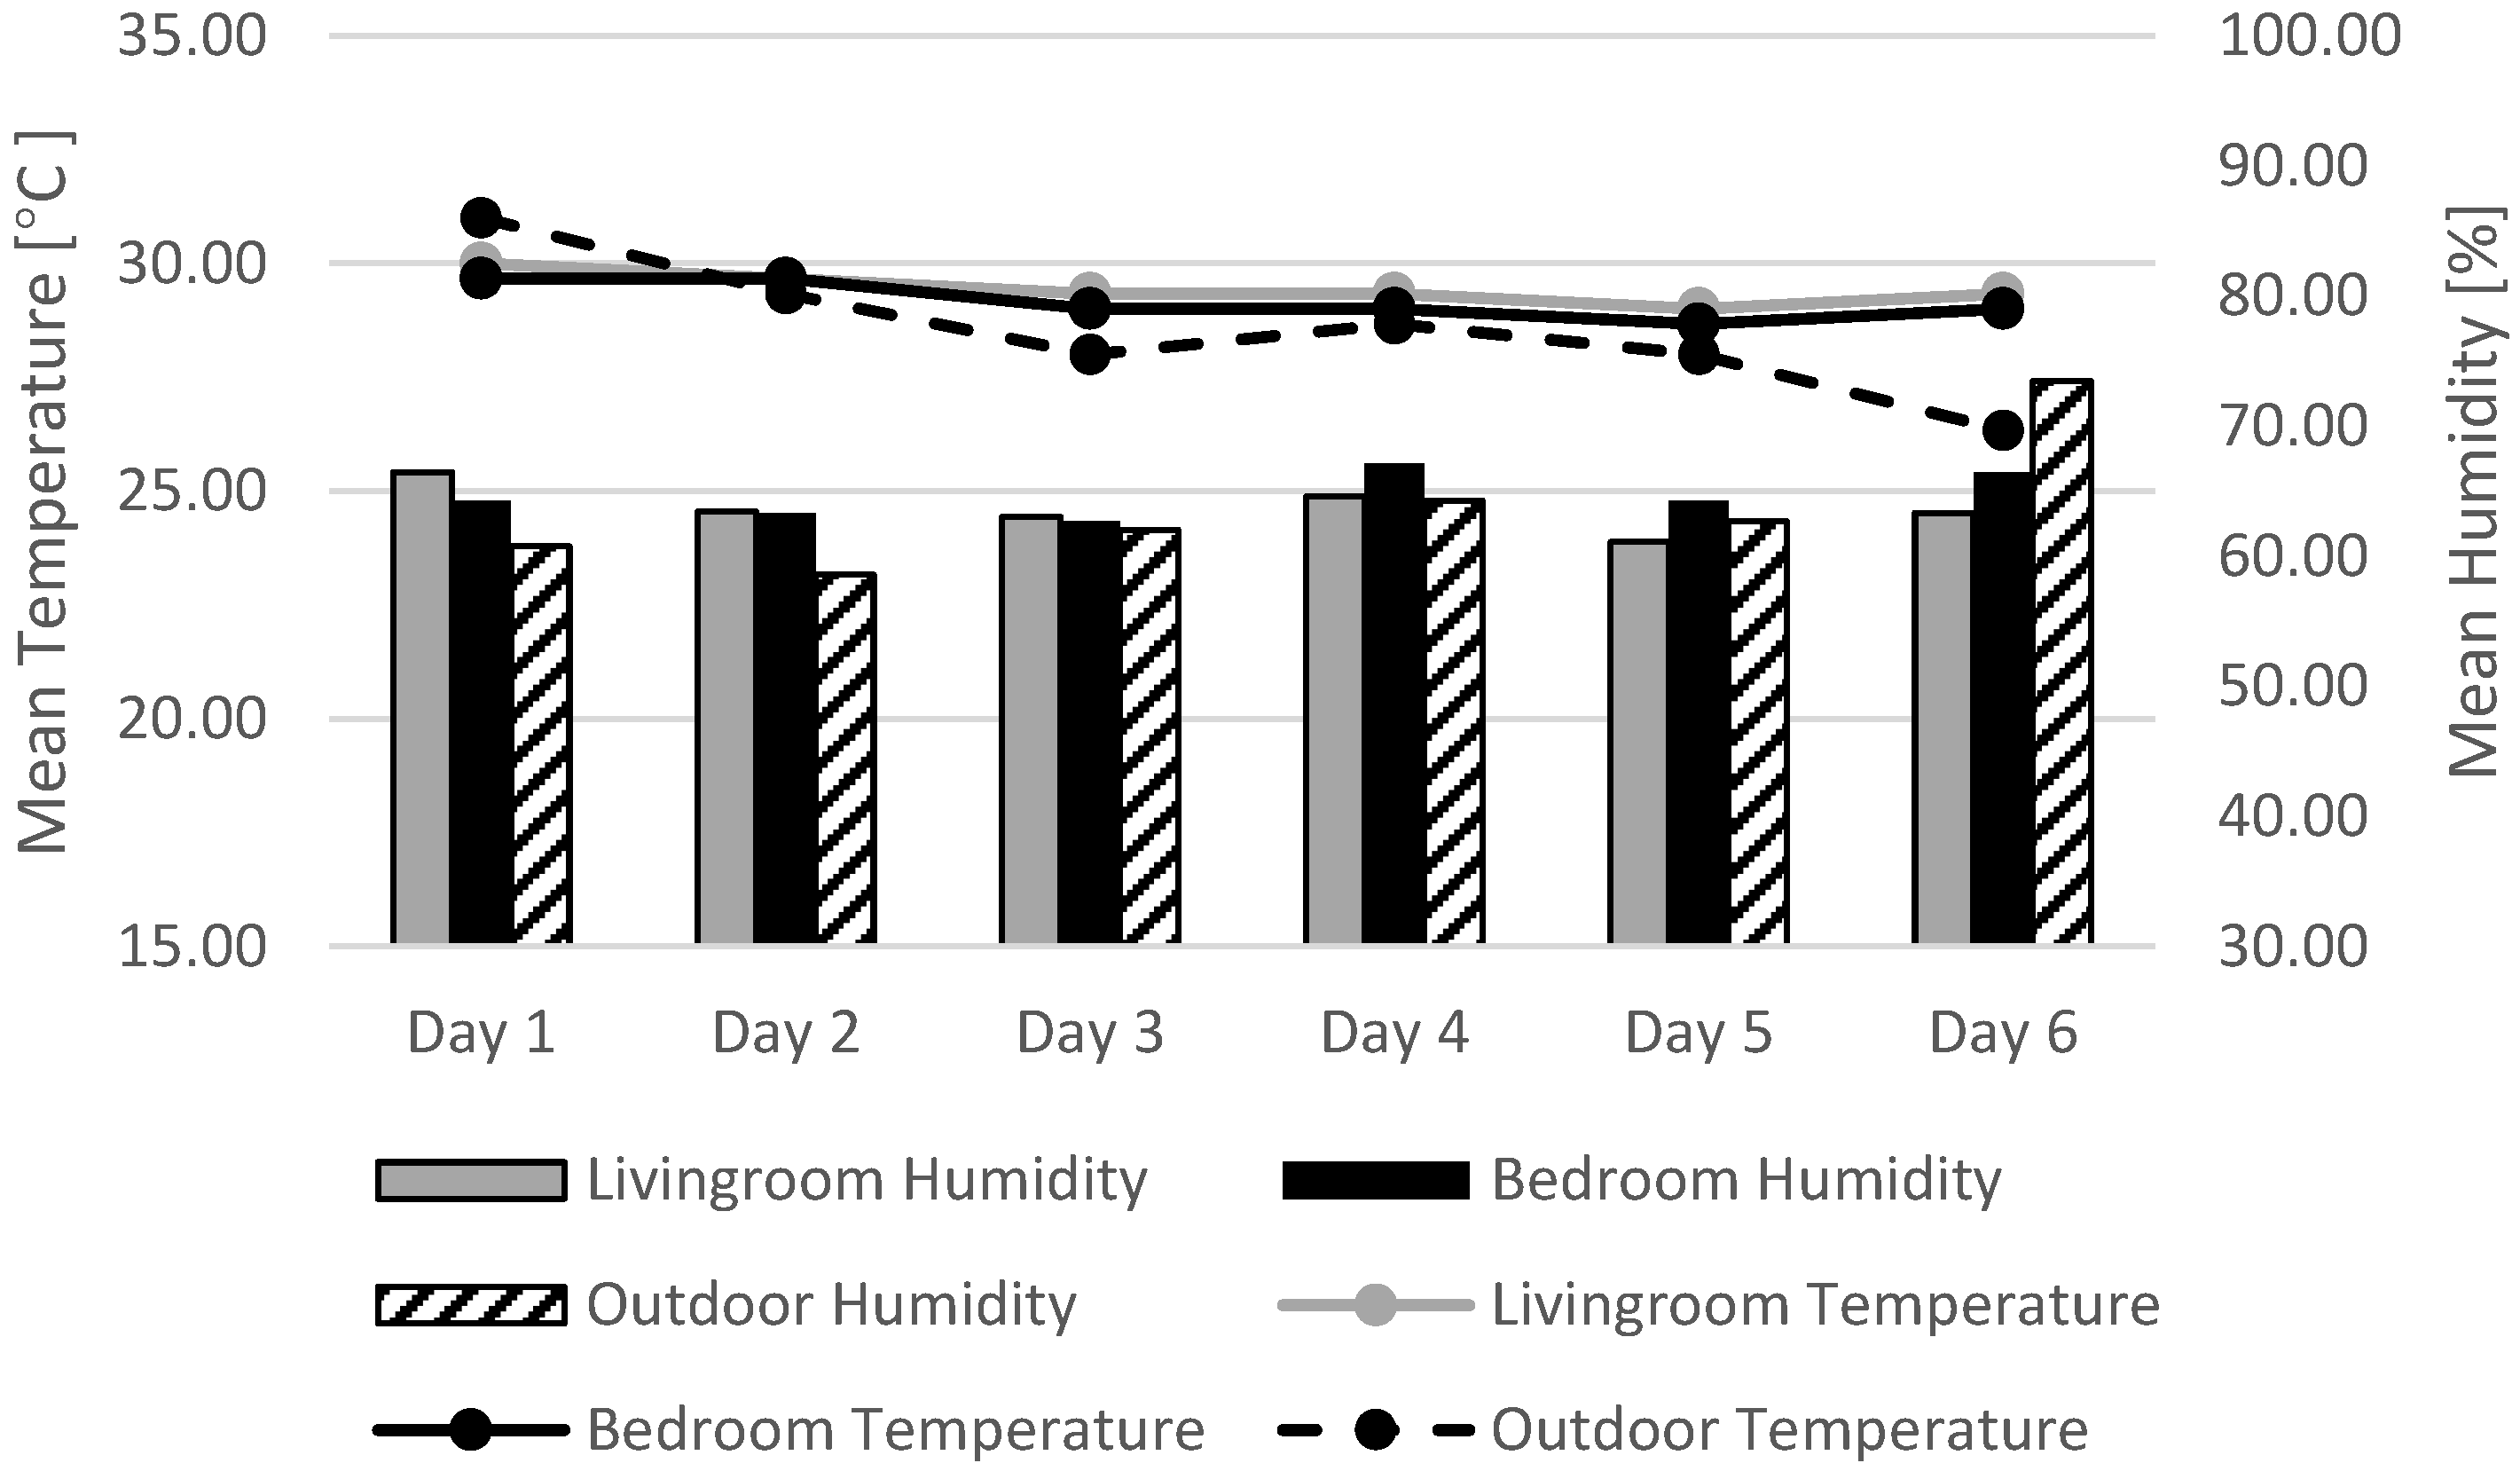
In general, the indoor air temperature in the occupied zone for HRB1 varied between 28 °C and 31 °C, with an average value of 29.2 °C, and the indoor relative humidity was between 57.0% and 70.3%, with a mean value of 62.41% (
Figure 6). For HRB2, the indoor air temperature as measured during the field survey varied between 26 °C and 29 °C, with a mean value of 28.16 °C (
Figure 7). The indoor relative humidity in the building ranged between 49.4% and 76%, with a mean value of 63.89%. As presented in
Section 3.2.1, the living room of HRB1 has six openings in three walls, which creates cross-ventilation. In bedroom 2, there is only one opening in the southern wall, and it is expected to have higher temperatures and humidity than in the living room. However, no significant differences between the temperature and relative humidity of the living room and bedroom 2 were found, as shown in
Figure 6. A possible reason for this could be the diverse surface areas of the two rooms. For HRB2, both the living room and bedroom 3 have openings in different directions, which creates cross-ventilation. However, the temperature and humidity in the bedroom were found to be slightly lower than in the living room. This is because the openings in the living room are covered by furniture that cannot be opened frequently. Another reason is that the living room faces west and absorbs more sun radiation than bedroom 3, which has a southern orientation. Therefore, orientation, surface area, and air flow are all important factors in indoor environments.
Figure 8 and
Figure 9 show the performance of both the living rooms and bedrooms in relation to the outdoor air temperature for HRB1 and HRB2. For HRB1, the outdoor air temperature value rose from 28.5 °C in the morning (07:00–10:00) to a peak of about 30.5 °C during the afternoon (12:00–15:00). The average temperature in the living room and bedroom was slightly different from that in the outdoors. This is because the indoor temperature rises as solar radiation increases. However, in the evening, the indoor temperature did not decrease as dramatically as the outdoor temperature, which means that, at night, the outdoor space is better than the indoor space. For HRB1, no significant change was found in the living room and bedroom temperatures, in contrast to the variation in the outdoor temperatures. However, for HRB2, the living room temperature was always higher than the outdoor temperature, while the bedroom (south) temperature was between 27.0 and 27.5 °C, which is much lower than the outdoor temperature.
3.2.3. Thermal Comfort Indices
The thermal-related input values for the calculation were determined via field measurements and are shown in
Table 3 for HRB1 and
Table 4 for HRB2. The calculations for the PMV and PPD were performed using a software comfort program that has been proposed by ISO 7730 [
27].
The PMV of HRB1 was found to vary between 1 to 1.6, with a mean value of 1.23. A total of 80% satisfaction falls within the range of [−1.23 < PMV < +1.23]. The PPD varied from 26.1% to 56.3%, with a mean value of 37.35%. This indicates that 37.35% of the occupants in this survey building were expected to be dissatisfied (discomfort) with the thermal environment.
For HRB2, the PMV was found to range between 0.7 and 1, with a mean value of 0.85. A total of 80% satisfaction falls within the range of [−0.85 < PMV < +0.85]. The PPD varied from 15.3% to 26.1%, with a mean value of 20.56%. This indicates that 20.56% of the occupants in this survey building were expected to be slightly dissatisfied (discomfort); the required PPD value should be less than 10%. Additionally, in this case, we learned that the value of the PMV fell within the range of (−1, 0, +1), which represents 80% satisfaction, but, unfortunately, the values obtained are not in the ideal range of an acceptable thermal environment for general comfort, which is between [−0.5 < PMV < +0.5] (neutral).
4. Discussion
4.1. Thermal Comfort
The thermal comfort evaluation of the historical residential buildings of Stone Town based on subjective and objective surveys is summarized in
Table 5.
The air temperature obtained from both the subjective and objective surveys was above 26 °C, which is higher than the comfort zone for summer conditions (23–26 °C). Similarly, the relative humidity, which was around 63% as obtained from the questionnaires and measurements, is also higher than the value in the comfort zone (50–60%). Referring to the results obtained for the PMV and PPD values in the field measurements, neither of the case study buildings are controlled within the specified acceptable thermal comfort range based on the ASHRAE Standard 55, which is [−0.5 < PMV < +0.5] with a PPD < 10%. Indeed, numerous thermal comfort studies carried out worldwide have revealed that the PMV-PPD index cannot evaluate thermal comfort under non-air-conditioned space without modification due to the ignorance of subjects’ adaptations. Although at least 20% of occupants are not satisfied with the current thermal environment, the TSV reflecting real thermal sensations indicates that the majority (73.57%) of the respondents’ thermal sensation votes are within the central three categories of the 7-point scale. It once again proves that the PMV-PPD index is not applicable to assess thermal comfort in naturally ventilated buildings. Therefore, in
Table 5, we add TSV with the purpose of reflecting the actual thermal satisfaction of occupants.
4.2. Passive Cooling Strategies
Based on the questionnaire and field survey results, passive cooling strategies implemented in the historical residential buildings in Stone Town include the north-south orientation (HRB1), natural ventilation (HRB1 and HRB2), pitched roof (HRB1), light color finishing (HRB1 and HRB2), and various types of shading. The majority (73.57%) of respondents’ TSV results are within the central three categories, which indicates that these passive techniques are beneficial for indoor thermal comfort in hot areas.
Similar results have been found in previous research in recent decades. Lapisa et al., and Ozarisoy indicated that the main façade the buildings with large area windows should avoid exposure to direct solar radiation [
35,
36]. In this study, bedroom 3 in HRB2 is facing south, while the living room is exposed to the worst orientation (west) to solar radiation. This is one of the possible reasons why the indoor temperature in bedroom 3 is much lower than that in the living room. Window shading is an optimal way to compensate for the non-ideal orientation in retrofitting historical buildings. Lapisa et al. confirmed that slope roofs can improve the thermal comfort effect of buildings, while high-slope roofs increase costs and cause potential safety problems in earthquakes [
35]. Therefore, the application of pitched roofs to historical buildings in developing countries such as Zanzibar in this study should take the cost, potential safety risk, and thermal comfort into consideration. Previous research found that solar radiation can be effectively reflected by using cool roofs and walls, thereby decreasing the heat gain in the interior [
35,
37]. The exterior walls of the two case study buildings in this research are painted in white or light yellow, which contributes to thermal comfort inside the buildings. This technique can be further implemented on roofs to improve thermal performance. Natural ventilation is the most efficient way to reduce energy demand and increase thermal comfort in a hot climate by providing a large amount of airflow [
36,
38,
39]. This technique is also implemented in the historical residential buildings in Stone Town, where a large number of openings and cross-ventilation can be found. However, large areas of openings will increase the potential energy demand for heating, so the decision making of the window areas should depend on the heating/cooling demand.
In addition, numerous studies have focused on the energy demand of residential buildings by using passive cooling strategies. Fernandez-Antolin et al. found that north-south orientation and light color finishing contribute to low cooling energy demand for residential buildings in Spain. This is consistent with the thermal comfort evaluation results obtained in this research, which implemented the same strategies [
40]. Pero et al. Proposed four main processes for passive building design, including site planning, building’s shape and envelope, window design, and renewable energy sources [
41]. These strategies are effective for new buildings. However, many are not applicable to the renovation of historical buildings, such as the orientation and building shape. In some cases, window openings and shadings are also restricted due to the local culture. Therefore, design strategies for improving the thermal comfort of historical residential buildings are proposed in the following subsections.
4.3. Design Strategies for Historical Residential Buildings
Three factors should be considered for the improvement of thermal comfort in historical residential buildings: (1) improve the thermal comfort conditions; (2) respect the local culture and history; and (3) reduce energy consumption.
Sun radiation is the main source of heat gain inside buildings; therefore, one of the best means by which to improve the thermal comfort of buildings is to create a quality building envelope using construction materials that help reduce the sun’s heat. For historical buildings, traditional building materials, such as lime plaster and lime wash, are suitable for solving the problem.
4.3.1. Lime Plaster
Lime plaster is generally made by heating lime rock (rock made of calcium carbonate, such as limestone or marble). Pure lime is white, lighter in weight than the original rock, and reacts violently with water. The lime plaster has the benefits of protecting masonry against weathering conditions, improving the thermal and acoustical performance.
Historical buildings in Stone Town were built hundreds of years ago, and damage is commonly detected nowadays. Lime plaster can improve the appearance of walls by hiding the imperfections of rough work, giving it an attractive texture compatible with the local environment.
The climate in Stone Town is hot and humid. Excessive humidity may enter the masonry in different ways and forms, such as the penetration of rainwater, fog, rising damp, and condensation, thereby leading to damage to the building’s structure. Thus, lime plaster has an important role in allowing the walls of the property to breathe by letting out excess humidity.
4.3.2. Wash Lime
White and light colors are beneficial in reducing cooling energy [
35,
37]. Although the two case study buildings already have light-colored paint on the walls, as presented in
Section 3.2.1, the indoor temperatures and thermal comfort are still under the requirements indicated by the ASHRAE; thus, wash lime is proposed. Wash lime is mostly applied to stone and brick walls and adobe. It is widely used due to its availability and low cost, making it a good choice for developing countries. In addition, wash lime can brighten up the exterior walls and form calcite crystals, which reflect the sun rays striking on the walls. A light color is preferred for wash lime, as indicated earlier.
5. Conclusions
A thermal comfort study of historical residential buildings in a tropical hot–humid climate was conducted in Zanzibar. A subjective survey was carried out among 159 occupants living in the historical site of Stone Town to investigate the passive cooling techniques used in historical residential buildings and the occupants’ subjective evaluations of indoor environmental parameters. The objective indoor environmental parameters were collected by field measurements from two case study buildings over six continuous days to evaluate the thermal comfort in the historical buildings.
Even with the use of passive cooling technologies, such as the use of sun shading devices and more openings to create better ventilation, thermal comfort was still not acceptable, according to international ASHRAE Standard 55. In the questionnaire survey, 73.57% of the participants voted within the three central categories of the thermal sensation vote, and 68.55% of the occupants stated that they would prefer to be cooler. This indicates that their thermal environment is not acceptable. In the field survey, the indoor temperatures and relative humidity, as well as the PMV–PPD values, of the two case study buildings were found to be higher than the acceptable limits for thermal comfort zones, which indicates the necessity of improving the thermal environment in these historical residential buildings that already take passive cooling into consideration.
Based on the analysis of passive cooling technologies (north-south orientation, natural ventilation, pitched roof, light color finishing, and window shading) and their positive and negative effects on the thermal environment in historical residential buildings, design strategies are proposed to improve the local thermal environment. The design strategies include the application of lime plaster and wash lime, which have the potential to reduce energy consumption, improve thermal comfort, and respect the local culture and history.
This research provides guidelines to assist architects in designing energy-efficient residential buildings while also taking into account cultural heritage and thermal comfort. The retrofitting of historical buildings should avoid the large destruction of historical buildings, construct as much as possible with local materials, and preserve coordination with the local environment. Further studies concerning thermal comfort should be performed in suburban areas over a longer period, or more historical residential buildings, in order to obtain a broader picture of thermal comfort phenomena in areas with different cultural and behavioral patterns.


