Next Article in Journal
Grey Correlation Analysis between Macro Mechanical Damage and Meso Volume Characteristics of SBS Modified Asphalt Mixture under Freeze-Thaw Cycles
Next Article in Special Issue
Real-Time Monitoring for Effects of Vibration and Temperature of Construction Site on Steel Assembly Bracing of Foundation Pit
Previous Article in Journal
An Integrated User Interface of Assessment and Optimization for Architectural Façade Shading Designs in Taiwan
Previous Article in Special Issue
Real-Time Monitoring for Monolithic Movement of a Heritage Curtilage Using Wireless Sensor Networks
 
 
Correction published on 4 July 2024, see Buildings 2024, 14(7), 2044.
Article

Polyethylene (PE) Waste Minimization Study of Cement Mortar with Adding PE Content under Different W/B Ratios

1
Department of Civil Engineering, National Kaohsiung University of Science and Technology, Kaohsiung 807618, Taiwan
2
Department of Civil and Environmental Engineering, National Kaohsiung University, Kaohsiung 811726, Taiwan
3
School of Architecture and Civil Engineering, Huizhou University, Huizhou 516007, China
*
Author to whom correspondence should be addressed.
Buildings 2022, 12(12), 2117; https://doi.org/10.3390/buildings12122117
Submission received: 16 October 2022 / Revised: 18 November 2022 / Accepted: 30 November 2022 / Published: 2 December 2022 / Corrected: 4 July 2024
(This article belongs to the Special Issue Applications of (Big) Data Analysis in A/E/C)

Abstract

:
Wastes can be effectively used in concrete and the characteristics of concrete can be maintained or enhanced, the economy of waste management can be greatly increased, and the pollution of the earth can be reduced. This study aimed to research the durability of cement mortar prepared using different W/B ratios and different percentages of waste PE content. The cement mortar was mixed with 0%, 1%, 2%, 3%, and 4% waste PE and 20% ground-granulated blast-furnace slag (GGBFS) in W/B ratios of 0.4, 0.5, and 0.6. The results sw that the slump and flow decrease as the waste PE content is increased and increase with increasing W/B ratio, and the setting time is shortened as the waste PE content is increased. In terms of hardened properties, the specimen strength is slightly decreased as the waste PE content is increased, but the hardened properties are better at a later age due to the pozzolanic reaction of slag, which can be verified by microscopic SEM.

Graphical Abstract

1. Introduction

Cement manufacturing can be identified as a major source of CO2 emissions, from production to emissions, making it the largest source of industrial emissions [1]. The cement industry is the second-largest source of CO2 emissions, accounting for 27% of CO2 emissions from the industrial sector and 8% of global CO2 emissions [2,3]. It is estimated that by 2050, cement production will increase by approximately 12–22% compared to 2014. Therefore, one way to reduce CO2 emissions is to replace cement with materials that use waste materials or industrial by-products to reduce CO2 emissions [4].
Blast-furnace slag is an industrial by-product of iron extraction. Depending on the cooling method, blast-furnace slag can be divided into air-cooled blast-furnace slag and ground-granulated blast-furnace slag (GGBFS), which is then dried and ground into a powder of comparable fineness to replace cement as a cementitious material [5]. While the chemical composition of GGBFS is very similar to that of Portland cement, its composition consists of varying proportions of lime and alumina. The cementitious properties of GGBFS are controlled by the type of ore, the type of flux used, and the contaminants in the charged coke. Magnesium, silicon, calcium, aluminum, and oxygen account for 95% of the total GGBFS content [6]. Therefore, proper use of ground-granulated blast-furnace slag (GGBFS) to replace cement can not only reduce cement use but also reduce slag emissions, and the properties of ground-granulated blast-furnace slag can also be used to improve its engineering properties.
In the 1950s, plastic or synthetic organic polymers were mass-produced and used. Although the rapid growth in the production of plastic man-made materials still does not surpass that of steel and cement materials widely used in civil construction, the impact of plastic waste on the environment and how to eliminate it is still an important issue that cannot be ignored [7]. The largest market for plastics is packaging, where the use of single-use containers has grown so rapidly that the proportion of solid waste generated from the use of these containers has increased from less than 1% in 1960 for middle- and high-income countries to more than 10% in 2005 [8].
The vast majority of monomers used to make plastics, such as ethylene and propylene, are derived from fossil hydrocarbons. None of the common plastics are biodegradable [9]. The only way to permanently eliminate plastic waste is through destructive heat treatment, such as combustion or pyrolysis, which often causes secondary pollution of the environment due to the subsequent emission of CO2. If such waste is buried in a landfill, it will only accumulate in the natural environment and will not decompose [9,10]. Therefore, the near-permanent contamination of the natural environment by plastic waste is a growing problem [11].
Disposable or single-use paper containers are often coated with a plastic film, such as polyethylene (PE), on the inner surface to meet waterproof or oil-proof requirements. Therefore, most single-use paper containers are regarded as plastic waste and not waste paper. Recycling is an effective way to reuse or regenerate waste into useful products, materials, or components, especially with regard to recycling waste made from composite materials such as lunch boxes and beverage cups [12,13,14]. With the continuous increase in plastic waste, the inclusion of recycled plastic waste in building materials, such as bricks and concrete, has been studied by researchers [15,16]. In addition, after recycled plastic waste is combined with wood and other plant fibers, it can also be used in plastic–wood building materials [17].
The cement in concrete consumes 2% of global energy in the production process, and every ton of cement produced will emit 0.85 tons of carbon dioxide [18,19]. Therefore, many researchers continue to investigate sustainable, environmentally friendly, and cost-effective alternatives. Recycled plastic waste can be transformed into a suitable shape or size and added to the concrete as an aggregate [20], which can reduce structural weight, increase design flexibility, reduce total construction costs, reduce the structural gravity load, and improve seismic performance. Due to its advantages, such as structural reaction under action and enhanced structural thermal insulation, it is one of the alternatives to decontaminate waste [16,21].
Plastic waste is incorporated into mortars and cements as aggregates, and most studies have focused on the microplastic and neoplastic range [11,22,23]. Taiwan has the second-highest density of convenience stores in the world [24], and most disposable food packaging contains plastic waste composed of polyethylene (PE) components [14], a high-quality material with good chemical stability, resistance to impact, and low temperature resistance. According to the Environmental Protection Agency, in Taipei City alone, food delivery packaging increased by 85% in May 2021 [24], perhaps due to the impact of the COVID-19 outbreak. Usually, recycled food packaging is composed of different polymers and complex materials, which makes the separation of each material difficult [24]. It is necessary to separate the PE components in the packaging container through processes such as buoyancy sorting before recycling for reuse. The focus of this study is to investigate the durability of recycled polyethylene (PE) plastic waste added to cement mortar and the benefits of PE waste reuse under different W/B ratios.
PE polymers are one of many fibers, whether they are polymers or metals, and they are widely used in concrete engineering because of their advantages [25,26,27,28]. The compressive strength and toughness of concrete can be improved by adding steel fibers due to the high modulus of elasticity and stiffness [25]. Although adding steel fibers to concrete can improve the properties of concrete, the fiber content must be high. This increases the structural gravity load of concrete and has a balling effect during mixing, thus reducing workability [29,30]. There have been many studies on the use of PE as a substitute for some natural aggregates in cementitious materials. Basha et al. found that the amount of recycled plastic aggregate leads to a decrease in compressive strength, flexural strength, elastic modulus, and adhesive strength but is useful for concrete thermal insulation [23]. By incorporating high-density polyethylene (HDPE) and low-density polyethylene (LDPE) into concrete, Rumsys et al. found that the compressive strength of concrete is decreased [31]. Yoo and Kim found that replacing steel fibers with PE fibers results in a decrease in compressive strength due to uneven dispersion of high aspect ratio PE fibers [32].
Single-use paper containers or tableware coated with polyethylene (PE) plastic films for waterproofing and oil stain prevention have become indispensable in people’s lives because of their low cost and convenience. After use, it is sent to a professional waste paper container treatment plant for recycling, and its plastic film can be reused. However, due to inaccurate recycling classification or high cost, it is mixed with waste paper and sent to general nonprofessional waste paper factories for processing. The separated plastic film will be identified as garbage and sent to incinerators for incineration, which increases the processing cost of waste paper factories, secondary air pollution, and energy consumption. In addition, in other studies related to the acquisition of plastic wastes to concrete, such as polyethylene terephthalate (PET), some researchers pointed out that the accumulation of this waste did not contribute to the improvement of concrete compressive strength [33,34,35,36,37,38,39]. However, the issue of the behavior of cement mortars containing PE wastes is new, and research in this context is limited. Research in this context should continue to highlight the important hardening and durability properties of concrete containing PE plastic wastes coating disposable containers. Therefore, this study used different W/B ratios and different contents of waste PE to make cement mortar, with the GGBFS content being fixed at 20%, to discuss the durability and the benefits of energy savings and carbon reduction. The preliminary study of cement mortar specimens was used to investigate the feasibility of waste reuse and to suggest the appropriate PE addition ratio for the reference of concrete mixture proportioning design, so as to achieve waste minimization by recycling PE film on the surface of disposable containers.

2. Experiment Plan

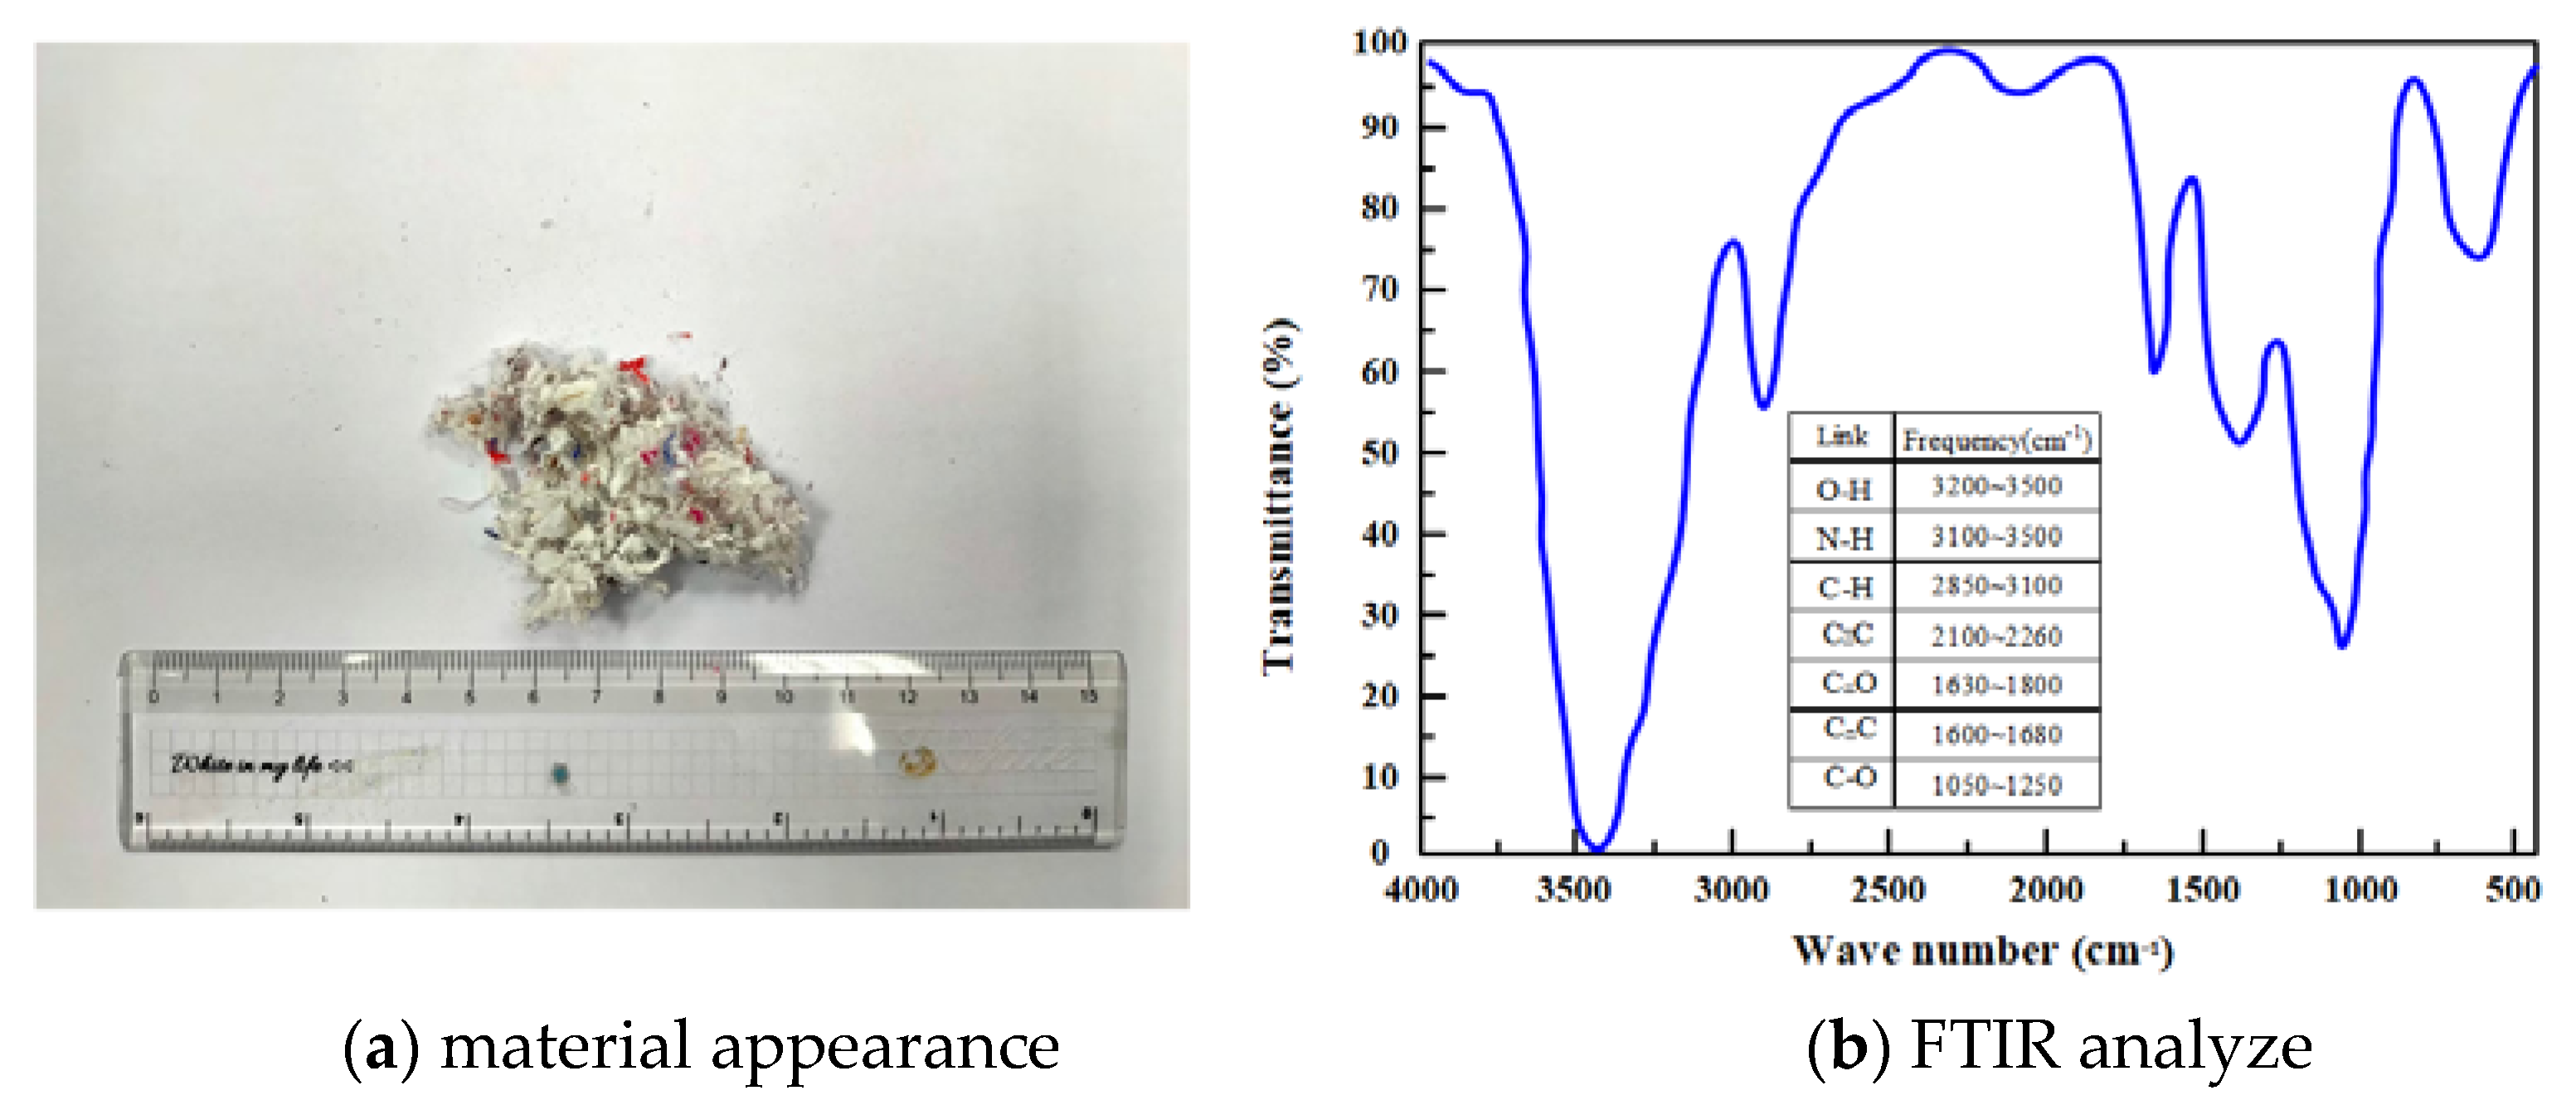
2.1. Experimental Materials

Cement: Portland Type I cement produced by Taiwan Cement Corporation was used; the properties of this cement conformed to ASTM C150, the specific gravity was 3.15, and the fineness was 3450 cm2/g. Waste PE: The waste PE was provided by the manufacturer, with a specific gravity of 0.92 and a water content of 8.2%. It had the appearance of spherical large granules. After it was decomposed by pulverization, it appeared as flocculent plastic fibers, as shown in Figure 1a, with a specific gravity of 0.92. Figure 1 shows the Fourier-transform infrared spectroscopy (FTIR) spectrum for waste PE. GGBFS: GGBFS was provided by CHC Resources, conforming to CNS12549, with a specific gravity of 2.9 and a fineness of 4000 cm2/g. The fine aggregate was derived from the river sand of the Ligang River, and the specific gravity was tested according to ASTM C127. The specific gravity was 2.65, and the water absorption was 1.48%. The chemical compositions of the test materials are shown in Table 1.

2.2. Test Variables and Mix Proportions

The tested fresh properties included the slump and flow. Cement mortar specimens were prepared and cured in saturated limewater. Their hardened properties, durability, and microscopic properties were discussed at the ages of 3, 7, 28, 56, and 91 days. The ratio of unit weight and the test methods and specifications are shown in Table 2 and Table 3.
For micro and component analysis, a scanning electron microscope (SEM) is used to generate secondary electrons by striking the specimen with an electron beam, and the cathode ray tube is used to observe the surface microstructure of the specimen. An energy-dispersive spectrometer (EDS) can be used for qualitative and quantitative analysis of the composition of the experimental specimen by scanning a high-energy focused electron beam on the surface of the specimen.

3. Results and Discussion

3.1. Slump

As shown in Table 4 and Figure 2, with a fixed GGBFS of 20%, 1% of waste PE, and W/B ratio of 0.4, 0.5, and 0.6, corresponding slumps of cement mortar were 1.5, 2.6, and 3.8 cm, respectively. The slump of cement mortar reveals an upward trend. Furthermore, the slump was 1.9~1.2 cm with a W/B ratio of 0.4 and 1~4% addition of waste PE fiber material, and it can be observed that the slump tends to decrease with the increase in the addition of waste PE fiber material. The slump is observed to increase with the W/B ratio. As the waste PE absorbs water, it absorbs the free water in the mortar; when the content of waste PE in the mortar increases, the slump decreases accordingly. Therefore, the slump increases as the W/B ratio increases and the waste PE content decreases, as shown in Table 4.
Regarding W/B = 0.4, the slump ratio of the specimen with 1% PE fiber material added to the control specimen without PE fiber material added was 0.79, as shown in Table 4. Still, the decreasing trend of the slump was slowed down with the increase in PE material added, and the maximum slump ratio was 0.63, which occurred in the specimen with 4% PE material added. Similarly, at W/B = 0.5 and 0.6 series, the slump also showed a decreasing trend with the increase in PE addition. Therefore, the effect of PE addition on the deterioration of fresh mix properties could be improved significantly by W/B. With 2% PE addition, the slump of W/B = 0.5 increased significantly from 1.3 cm to 2.5 cm compared with that of W/B = 0.4, which was 1.92 times. The results showed that the PE fiber material addition has little effect on the fresh mix properties. Therefore, the fresh mix property test results show that the cement mortar can be added with PE fiber material to achieve the impact of waste minimization.

3.2. Flow

As shown in Table 5 and Figure 3, with a W/B ratio of 0.4 and a fixed GGBFS content of 20%, the flow is 15.6~14.2 cm; with a W/B ratio of 0.5, the flow is 19.9~18.7 cm; with a W/B ratio of 0.6 and a GGBFS content of 20%, the flow value is 21.7~20.9 cm. The flow value is greatly increased with the W/B ratio, the mortar flow increases as the water consumption increases, and the overall workability of the mortar is enhanced.
With a W/B ratio of 0.5 and 0%, 1%, 2%, 3%, and 4% for the waste PE, the cement mortar shows flow values of 19.9, 19.7, 19.4, 18.9, and 18.7 cm, respectively. When the content is increased from 1% to 4%, the flow is reduced by 1~6%, meaning the flow is decreased as the content of waste PE is increased.

3.3. Setting Time

As shown in Table 6 and Figure 4, with a fixed furnace slag content of 20%, a W/B ratio of 0.4, and 1% waste PE, the initial setting time and final setting time of the cement mortar are 315 min and 382 min, respectively; when the W/B ratio is 0.5, the initial setting time is 387 min and the final setting time is 505 min; when the W/B ratio is 0.6, the initial setting time is 468 min and the final setting time is 625 min. This indicates that the setting time increases with the W/B ratio. As the total water consumption is increased with the W/B ratio, the hydration heat reaction slows down and the setting time increases.
When the W/B ratio is 0.5, the content of waste PE is 0%, 1%, 2%, 3%, and 4%, the slag content is 20%, the initial setting time is 401~356 min, and the final setting time is 518~474 min, meaning that the setting time is shortened with increasing content of waste PE.

3.4. Compressive Strength

As shown in Table 7 and Figure 5, at the age of 28 days, when the W/B ratio is 0.4, the content of GGBFS is 20%, the content of waste PE is 0%~4%, and the compressive strength is 54.1~48.9 MPa; when the W/B ratio is increased to 0.5, the compressive strength is 48.5~44.9 MPa (reduced by 8.2~10.4%); when the W/B ratio is increased from 0.5 to 0.6, the compressive strength is 37.2~34.7 MPa; the compressive strength is reduced by 11.9~16.6% when the W/B ratio is increased from 0.4 to 0.5 and reduced by 30.1~31.2% when the W/B ratio is increased from 0.5 to 0.6, indicating that the compressive strength is decreased with increasing W/B.
When the W/B ratio is 0.5 and the content of slag is 20% at the age of 3 days, the strength of the control group is 24.7 MPa, and the compressive strength is 23.0~20.3 MPa (reduced by 6.9~17.8%) for a waste PE content of 1~4%. At the age of 28 days, the strength of the control group is 48.5 MPa and the compressive strength is 47.8~44.9 MPa (reduced by 1.4~7.5%) for a waste PE content of 1~4%. At the age of 91 days, the strength of the control group is 59.1 MPa and the compressive strength is 57.4~53.8 MPa (reduced by 2.0~9.1%) for a waste PE content of 1~4%, meaning that the compressive strength is decreased as the waste PE fiber material content is increased. As the waste PE is fibrous, the balling phenomenon is likely to occur in the specimen when the specimen is compacted. As this leads to the formation of fiber agglomerates inside the specimen, the pores inside the specimen are enlarged, and the waste PE is relatively soft, which cannot provide effective compressive strength for the specimen. When the content increases, the compressive strength decreases.
When the W/B ratio is 0.5 and the substitution amount of GGBFS is 20%, at the age of 28 days, the strength is reduced by 1.4~3.5% for a waste PE content of 1~2%, and the strength is reduced by 5.4~7.3% for a waste PE content of 3~4%. At the age of 56 days, when the waste PE content is 1~2% and 3~4%, the compressive strength is reduced by 1.9~4.5% and 6.5~7.9%, respectively. When the waste PE content is 1~2% and the strength reduction is controlled within 5%, the waste can be effectively eliminated, and the economy of the waste is enhanced, with a reduction in waste generation and a reduction in environmental pollution.
The compressive strength of the PE fiber material added at 2% showed a decreasing trend at 28 days of age with W/B ratios of 0.4, 0.5, and 0.6 compared to the control specimen without PE fiber material. The ratios were 0.94, 0.96, and 0.94, respectively. The decrease in compressive strength of the PE material added at 2% could be controlled within 5%. However, at 56 days of age, the compressive strength development in the three different W/B series exceeded the compressive strength of the control specimens at 28 days of age. Therefore, although the hardening properties of the compressive strength tended to decrease with the addition of 2% PE material, the compressive strength at late ages was 58.1, 50.0, and 42.6 MPa with W/B ratios of 0.4, 0.5, and 0.6, respectively, by adding GGBFS, and all of them exceeded the compressive strength of the control specimens. In addition, with the addition of PE fiber material to 4% of the specimen, the compressive strength at 56 days of age was also the same. The test results showed that by adding PE material to eliminate the waste, the compressive strength could be no lower than the test value of the control specimen without PE material by adding GGBFS to extend the concrete curing age.

3.5. Flexural Strength

As shown in Figure 6, at the age of 28 days, for a GGBFS content of 20%, W/B ratios of 0.4, 0.5, and 0.6, and a waste PE content of 0~4%, the flexural strengths are 20.2~17.4 MPa, 18.1~15.5 MPa, and 12.3~9.9 MPa, respectively, meaning that the flexural strength is decreased with increasing W/B ratio.
At the age of 3 days, when the W/B ratio is 0.5 and the GGBFS content is 20%, the flexural strength is 7.7~5.3 MPa, indicating that the flexural strength decreases as the content increases (6.5~29.8%). At the age of 28 days, the flexural strength of the mortar without waste PE is 18.1 MPa, and as the waste PE content is increased to 4%, the flexural strength is 15.5 MPa (reduced by 14.1%). At the age of 91 days, the flexural strength of the mortar without waste PE is 26.3 MPa; the flexural strength of the mortar with 4% waste PE is 24.3 MPa, and when the waste PE content is increased from 1% to 4%, the flexural strength is reduced by 3.1~7.6%, indicating that the flexural strength is decreased with increasing waste PE content. At the age of 56 days, when the amount of substituted GGBFS is 20% and the waste PE content is 1~2%, the strength is 2.2~5.2%, but the strength is reduced by 9.5~10.3% when the waste PE content is 3~4%. At the age of 91 days, the strength is reduced by 3~5.3% for a waste PE content of 1~2%, and the strength is reduced by 6.5~7.6% for a waste PE content of 3~4%. This indicates that the strength reduction can be controlled to within 6% when the waste PE content is lower than 2%. This value is the closest to that of the control group; hence, the waste can be effectively eliminated to reduce environmental pollution.

3.6. Tensile Strength

As shown in Figure 7, at the age of 28 days, with a W/B ratio of 0.4, a GGBFS content of 20%, and a waste PE content of 0~4%, the tensile strength is 12.0~9.9 MPa; when the W/B ratio is increased to 0.5, the tensile strength is 11.2~8.6 MPa (reduced by 6.7~13.1%); when the W/B ratio is increased to 0.6, the tensile strength is 7.8~5.8 MPa, and the tensile strength is reduced by 35~41.4% in comparison to a W/B ratio of 0.4, meaning that the tensile strength is decreased with increasing W/B ratio.
At the age of 56 days, when the W/B ratio is 0.5, the GGBFS content is 20% and the tensile strength is 14.2~12.4 MPa for a waste PE content of 0~4%, indicating that the tensile strength is slightly decreased with the increased waste PE content; at the age of 91 days, the tensile strength is 16~14.3 MPa. As the waste PE is soft and the tensile strength cannot be effectively increased, the tensile strength is decreased with increasing waste PE content. Meanwhile, the tensile strength, flexural strength, and compressive strength show the same trend.

3.7. Ultrasonic Pulse Velocity

As shown in Figure 8, at the age of 28 days, with a W/B ratio of 0.4, GGBFS of 20%, and different percentages of waste PE, the ultrasonic pulse velocity is 4720~4501 m/s; the pulse velocity is 4386~4173 m/s for a W/B ratio of 0.5, which is reduced by 7.1~7.4% in comparison to that at a W/B ratio of 0.4; when the W/B ratio is 0.6, the pulse velocity is 3825~3611 m/s, which is reduced by 12.8~13.5% in comparison to that at a W/B ratio of 0.5, meaning that the ultrasonic pulse velocity is decreased with increasing W/B ratio.
At the age of 91 days, the control group shows a better ultrasonic pulse velocity of 4903 m/s; the ultrasonic pulse velocity is 4816 m/s for a waste PE content of 1%; and the ultrasonic pulse velocity is decreased to 4607 m/s for a waste PE content of 4%, which represents a 6.1% reduction in comparison to that for the control group. At the age of 56 days, when the substitution amount of GGBFS is 20% and the waste PE fiber material content is 1~2%, the ultrasonic pulse velocity is higher than 4500 m/s, meaning that the concrete quality is good.
When the waste PE content is increased, pores are formed as the specimen absorbs free water so that the ultrasonic pulse velocity is decreased. When the substitution amount of GGBFS is increased, the pulse velocity slowly increases at an earlier age; however, under the effect of pozzolanic reaction, the specimen pores are filled up at a later age, leading to a better density for the specimen, and the pulse velocity grows slowly at the later stage. The internal porosity of the specimen is increased with increasing W/B ratio, resulting in a decrease in the pulse velocity. Furthermore, the ultrasonic pulse velocity is decreased as the content of waste PE fiber material is increased.

3.8. Water Absorption Rate

As shown in Figure 9, at the age of 28 days, with W/B ratios of 0.4, 0.5, and 0.6, a GGBFS content of 20%, and a waste PE content of 1~4%, the water absorption rates are 5.2~6.1%, 8.7~10.5%, and 13.1~14.2%, respectively. The water absorption rate is increased with an increasing W/B ratio.
At the age of 28 days, with a W/B ratio of 0.5, a GGBFS content of 20%, and different percentages of waste PE added to the cement mortar, the water absorption rates are 8.7%, 9.0%, 9.4%, 9.9%, and 10.5%, respectively. The water absorption rate is increased with the waste PE content because the addition of waste PE induces the balling phenomenon, which increases the internal porosity of the specimen, and the water absorption rate is increased with PE fiber material content.
Pores are formed inside the specimen as the W/B ratio and waste PE content are increased so that the internal porosity of the specimen is increased. The hydration of GGBFS occurs slowly at an earlier age, so the specimen has a higher water absorption rate than the control group; however, under the effect of pozzolanic reaction, the specimen pores are filled up, and the specimen has a better density.

3.9. Resistivity

As shown in Table 8 and Figure 10, at the age of 28 days, for a W/B ratio of 0.4 and waste PE content of 1%, the resistivity is 26.6 kΩ-cm; for a W/B ratio of 0.5, the resistivity is 25.4 kΩ-cm (reduced by 4.5%); for a W/B ratio of 0.6, the resistivity is 20.9 kΩ-cm, which is reduced by 21.4% in comparison to that for a W/B ratio of 0.4, meaning that the resistivity is obviously decreased as the W/B ratio is increased for a waste PE content of 1%.
For a W/B ratio of 0.5 and a waste PE content of varying percentages, at the age of 3 days, the resistivity is 10~8.1 kΩ-cm, and the resistivity is reduced by 5~20% as the waste PE content is increased. At the age of 28 days, the resistivity of the specimen without waste PE is 26.3 kΩ-cm, and as the waste PE content is increased to 4%, the resistivity is 23.3 kΩ-cm (reduced by 11.4%), meaning that the resistivity is decreased with increasing waste PE content. At the age of 91 days, the resistivity of the control group is 38.9 kΩ-cm; the resistivity of the specimen with a waste PE content of 4% is 33.8 kΩ-cm, and when the PE material content is increased from 0 to 4%, the resistivity is reduced by 13.1%, meaning the specimen structure has a better density at the later age.
When the waste PE content is increased, fiber agglomerates are formed; hence, the resistivity is decreased; at the age of 28 days, the resistivity of various mix proportions is higher than 20 kΩ-cm, showing durability.

3.10. Resistance to Sulfate Attack

As shown in Figure 11, at the age of 28 days, with W/B ratios of 0.4, 0.5, and 0.6, GGBFS content of 20%, and waste PE content of 1~4%, the weight loss rates are −3.3~3.4%, −6.6~7.1%, and −9.2~10.2%, respectively. When the W/B ratio is increased, the resistance to sulfate attack is degraded, and the weight loss is increased. When the W/B ratio is low, the internal porosity of the specimen is reduced, the specimen is denser, and the resistance to sulfate attack is better.
At the age of 28 days, when the W/B ratio is 0.5, the weight loss rates for cement mortar specimens with a waste PE content of 0%, 1%, 2%, 3%, and 4% are −6.6%, −6.7%, −6.9%, −7.1%, and −7.1%, respectively, after five cycles, meaning that when the waste PE content is increased, the weight loss rate is increased, and the resistance to sulfate attack is degraded. This phenomenon was observed because the internal porosity of the material increases with the waste PE content, and the sulfate solution more easily erodes the specimen. When the W/B ratio and the waste PE content are increased, the internal porosity of the specimen and the weight loss rate are increased.

3.11. Microscopic Analysis

As shown in Figure 12, at the age of 7 days, for a W/B ratio of 0.5 and waste PE contents of 1%, 2%, 3%, and 4%, the number of fibers inside the cement mortar specimen is significantly increased. According to the EDS analysis, the main elements were O, Ca, C, and Si. The waste PE is found to increase the specimen porosity, verifying that the compressive strength is decreased with increasing waste PE content.

4. Conclusions

  • The slump and flow properties of a specimen decrease as the waste PE content is increased so that the overall workability is degraded; the slump is increased with increasing W/B ratio.
  • The setting time is shortened as the waste PE content is increased. When the W/B ratio is increased, the water consumption is increased so that the overall setting time is increased.
  • The compressive strength, flexural strength, and tensile strength decrease as the waste PE content is increased. For a waste PE content of 2%, the waste can be eliminated most effectively; meanwhile, the strength is decreased with increasing W/B ratio and increased with increasing age.
  • The ultrasonic pulse velocity is reduced by 6.9%~8.7% as the age and the waste PE content are increased. Since the waste PE fiber material absorbs the free water in cement mortar, it causes voids after cement mortar hardening and reduces the density of the specimen. Therefore, in the ultrasonic test, the ultrasonic wave speed showed a decreasing trend with the addition of PE material from 1% to 4%, and the decrease increased from 6.9% to 8.7%. With the addition of 20% GGBFS, which has the property of delaying the reaction of the Portland, the ultrasonic wave speed can exceed 4500 m/s at the age of 28 days only if the W/B ratio is 0.4. With the increase in the W/B ratio, the test results show that at the age of 56 days and 91 days, the amount of waste PE material added within 2%, although the density of the cement mortar specimen will be reduced, it can still meet the ultrasonic wave speed of 4500 m/s. The density requirement of wave speed is over 4500 m/s. The addition of 2% of waste PE material can be used as a reference for concrete mixture proportioning design, which is helpful to remove the waste PE material.
  • As the W/B ratio and waste PE content are increased, pores are formed inside the specimen, and the water absorption rate is increased. The specimen has a better density due to hydration at a later age, so the water absorption rate is decreased. Regardless of whether the cement mortar specimen has added waste PE fiber material or not, its water absorption rate will show a decreasing trend with the development of age, and because of the addition of 20% GGBFS, at a late age, it delays the hydration reaction of the Brahmin, so that the specimen shows a better dense condition internally at a late age. At the same age, for the series with a W/B ratio of 0.4, the effect of the addition of waste PE fiber material on the water absorption was minimal, and the same was true for W/B ratios of 0.5 and 0.6. The correlation between water absorption and the reaction time of hydration, i.e., the development of age, indicates that the addition of waste PE material is feasible as long as the hydration reaction is developed until the cement mortar meets the requirement of density.
  • The resistivity is decreased as the waste PE content and W/B ratio are increased. The resistivity shows the same trend as that for the ultrasonic pulse velocity. At the age of 28 days, the durability resistance test values of all specimens exceeded 20 kΩ-cm, indicating that although the addition of 20% GGBFS delayed the hydration effect, the resistance values met the requirement of compactness. Compared with the age of 28 days, the difference in resistance values between the PE materials added to the specimens at the same W/B was more minor. Still, at the late age of 91 days, the difference in resistance values between the PE materials added to the specimens at the same W/B was more significant. With the addition of PE materials, the resistance values decreased, indicating that the waste PE materials could not produce hydration. After a complete hydration reaction, the voids were formed. In addition, microscopic analysis by an electron microscope revealed that the PE fibers in the specimen made tangled masses, which was also the reason for the increase in voids.
  • The resistance to sulfate attack is degraded for increasing W/B ratio and waste PE content; however, with the pozzolanic reaction, as the specimen pores are filled with hydrates, the specimen has a better density, and the decrease in weight loss rate is not obvious at a later stage.
  • Under the condition of a W/B ratio of 0.4, the addition of 2% waste PE and 20% GGBFS in the mix proportion leads to better hardening properties and durability to achieve the goal of waste reuse. In addition, it suggests the appropriate PE addition ratio for the reference of concrete mixture proportioning design, so as to achieve waste minimization by recycling PE film on the surface of disposable containers.

Author Contributions

Conceptualization, H.-Y.W., K.-T.L., C.-C.H. and S.-L.T.; methodology, H.-Y.W.; formal analysis, K.-T.L. and S.-L.T.; resources, C.-C.H.; data curation, F.-L.W.; writing—original draft preparation, K.-T.L. and S.-L.T.; writing—review and editing, C.-C.H.; supervision, H.-Y.W. All authors have read and agreed to the published version of the manuscript.

Funding

This research received no external funding.

Data Availability Statement

Not applicable.

Conflicts of Interest

The authors declare no conflict of interest.

References

  1. Zhaurova, M.; Soukka, R.; Horttanainen, M. Multi-criteria evaluation of CO2 utilization options for cement plants using the example of Finland. Int. J. Greenh. Gas Control 2021, 112, 103481. [Google Scholar] [CrossRef]
  2. Andrew, R.M. Global CO2 emissions from cement production, 1928–2018. Earth Syst. Sci. Data 2019, 11, 1675–1710. [Google Scholar] [CrossRef]
  3. Jang, J.G.; Kim, G.M.; Kim, H.J.; Lee, H.K. Review on recent advances in CO2 utilization and sequestration technologies in cement-based materials. Constr. Build. Mater. 2016, 127, 762–773. [Google Scholar] [CrossRef]
  4. Abdulkareem, M.; Havukainen, J.; Horttanainen, M. How environmentally sustainable are fibre reinforced alkali-activated concretes. J. Clean. Prod. 2019, 236, 117601. [Google Scholar] [CrossRef]
  5. Islam, M.J.; Islam, K.; Shahjalal, M.; Khatun, E.; Islam, S.; Razzaque, A.B. Influence of different types of fibers on the mechanical properties of recycled waste aggregate concrete. Constr. Build. Mater. 2022, 337, 127577. [Google Scholar] [CrossRef]
  6. Ramakrishnan, K.; Pugazhmani, G.; Sripragadeesh, R.; Muthu, D.; Venkatasubramanian, C. Experimental study on the mechanical and durability properties of concrete with waste glass powder and ground granulated blast furnace slag as supplementary cementitious materials. Constr. Build. Mater. 2017, 156, 739–749. [Google Scholar] [CrossRef]
  7. Geyer, R.; Jambeck, J.R.; Law, K.L. Production and use, and fate of all plastics ever made. Sci. Adv. 2017, 3, e1700782. [Google Scholar] [CrossRef]
  8. Jambeck, J.R.; Geyer, R.; Wilcox, C.; Siegler, T.R.; Perryman, M.; Andrady, A.; Narayan, R.; Law, K.L. Plastic waste inputs from land into the ocean. Science 2015, 347, 768–771. [Google Scholar] [CrossRef]
  9. Barnes, D.K.A.; Galgani, F.; Thompson, R.C.; Barlaz, M. Accumulation and fragmentation of plastic debris in global environments. Philos. Trans. R. Soc. B Biol. Sci. 2009, 364, 1526. [Google Scholar] [CrossRef]
  10. Khalid, M.Y.; Arif, Z.U.; Ahmed, W.; Arshad, H. Recent trends in recycling and reusing techniques of different plastic polymers and their composite materials. Sustain. Mater. Technol. 2022, 31, e00382. [Google Scholar] [CrossRef]
  11. Ghuzlan, K.A.; Al-Khateeb, G.G.; Qasem, Y. Rheological properties of polyethylene/modified asphalt binder. Athens J. Τechnol. Eng. 2015, 2, 75–88. [Google Scholar] [CrossRef]
  12. Ferdous, W.; Manalo, A.; Siddique, R.; Mendis, P.; Zhuge, Y.; Wong, H.S.; Lokuge, W.; Aravinthan, T.; Schubel, P. Recycling of landfill wastes (tyres, plastics and glass) in construction—A review on global waste generation, performance, application and future opportunities. Resour. Conserv. Recycl. 2021, 173, 105745. [Google Scholar] [CrossRef]
  13. Triantafillopoulos, N.; Koukoulas, A.A. The future of single-use paper coffee cups: Current progress and outlook. BioResources 2020, 15, 7260–7287. [Google Scholar] [CrossRef]
  14. Dele, R. Application of plastics and paper as food packaging materials—An overview. Emir. J. Food Agric. 2013, 25, 177–188. [Google Scholar]
  15. Islam, J.; Shahjalal, M. Effect of polypropylene plastic on concrete properties as a partial replacement of stone and brick aggregate. Case Stud. Constr. Mater. 2021, 15, e00627. [Google Scholar] [CrossRef]
  16. Kumar, R.; Kumar, M.; Kumar, I.; Srivastava, D. A review on utilization of plastic waste materials in bricks manufacturing process. Mater. Today Proc. 2021, 46, 6775–6780. [Google Scholar] [CrossRef]
  17. Chanhoun, M.; Padonou, S.; Adjovi, E.C.; Olodo, E.; Doko, V. Study of the implementation of waste wood, plastics and polystyrenes for various applications in the building industry. Constr. Build. Mater. 2018, 167, 936–941. [Google Scholar] [CrossRef]
  18. Zhang, C.Y.; Han, R.; Yu, B.; Wei, Y.M. Accounting process-related CO2 emissions from global cement production under Shared Socioeconomic Pathways. J. Clean. Prod. 2018, 184, 451–465. [Google Scholar] [CrossRef]
  19. Adina, B.; Masek, O.; Oakey, J.E. CO2 capture technologies for cement industry. Energy Procedia 2009, 1, 133–140. [Google Scholar]
  20. Hopewell, J.; Dvorak, R.; Kosior, E. Plastics recycling: Challenges and opportunities. Philos. Trans. R. Soc. B Biol. Sci. 2009, 364, 2115–2126. [Google Scholar] [CrossRef]
  21. Yesilata, B.; Yusuf, I.; Paki, T. Thermal insulation enhancement in concretes by adding waste PET and rubber pieces. Constr. Build. Mater. 2009, 23, 1878–1882. [Google Scholar] [CrossRef]
  22. Abu-Saleem, M.; Zhuge, Y.; Hassanli, R.; Ellis, M.; Rahman, M.; Levett, P. Evaluation of concrete performance with different types of recycled plastic waste for kerb application. J. Build. Eng. 2021, 293, 123477. [Google Scholar] [CrossRef]
  23. Basha, S.I.; Ali, M.R.; Al-Dulaijan, S.U.; Maslehuddin, M. Mechanical and thermal properties of lightweight recycled plastic aggregate concrete. J. Build. Eng. 2020, 32, 101710. [Google Scholar] [CrossRef]
  24. Wang, C.H.; Lin, H.T. Quantification of food packaging generation and material loss from major retailers in Taipei, Taiwan. Waste Manag. 2022, 137, 139–149. [Google Scholar] [CrossRef]
  25. Taerwe, L.; Van Gysel, A. Influence of steel fibers on design stress-strain curve for high-strength concrete. J. Mech. Eng. 1996, 122, 695–704. [Google Scholar] [CrossRef]
  26. Kakemi, M.; Hannant, D.J. Effect of autoclaving on cement composites containing polypropylene, glass and carbon fibres. Cem. Concr. Compos. 1996, 18, 61–66. [Google Scholar] [CrossRef]
  27. Song, P.S.; Hwang, S.; Sheu, B.C. Strength properties of nylon- and polypropylene-fiber-reinforced concretes. Cem. Concr. Res. 2005, 35, 1546–1550. [Google Scholar] [CrossRef]
  28. Wang, W.; Wu, S.; Dai, H. Fatigue behaviour and life prediction of carbon fiber reinforced concrete under cyclic flexural loading. Mater. Sci. Eng. A 2006, 434, 347–351. [Google Scholar] [CrossRef]
  29. Hsie, M.; Tu, C.; Song, P.S. Mechanical properties of polypropylene hybrid fiber-reinforced concrete. Mater. Sci. Eng. A 2008, 494, 153–157. [Google Scholar] [CrossRef]
  30. Song, P.S.; Hwang, S. Mechanical properties of high-strength steel fiber-reinforced concrete. Constr. Build. Mater. 2004, 18, 669–673. [Google Scholar] [CrossRef]
  31. Rumšys, D.; Bačinskas, D.; Spudulis, E.; Meškėnas, A. Comparison of material properties of lightweight concrete with recycled polyethylene and expanded clay aggregates. Procedia Eng. 2017, 172, 937–944. [Google Scholar] [CrossRef]
  32. Yoo, D.Y.; Kim, M.J. High energy absorbent ultra-high-performance concrete with hybrid steel and polyethylene fibers. Constr. Build. Mater. 2019, 209, 354–363. [Google Scholar] [CrossRef]
  33. Saikia, N.; De Brito, J. Waste polyethylene terephthalate as an aggregate in concrete. Mat. Res. 2013, 16, 341–350. [Google Scholar] [CrossRef]
  34. Albano, C.; Camacho, N.; Hernadez, M.; Matheus, A.; Gutierrez, A. Influence of content and particle size of waste pet bottles on concrete behavior at different w/c ratios. Waste Manag. 2009, 29, 2707–2716. [Google Scholar] [CrossRef]
  35. Choi, Y.W.; Moon, D.J.; Chung, J.S.; Cho, S.K. Effect of waste PET bottles aggregate on properties of concrete. Cem. Concr. Res. 2005, 35, 776–781. [Google Scholar] [CrossRef]
  36. Frigione, M. Recycling of PET bottles as fine aggregate in concrete. Waste Manag. 2010, 30, 1101–1106. [Google Scholar] [CrossRef]
  37. Hanna, T.H.; Mosa, I.H. Effect of using waste polyethelene production on mechanical properties of concrete. J. Duhok Univ. 2012, 15, 37–42. [Google Scholar]
  38. Irwan, J.M.; Asyraf, R.M.; Othman, N.; Koh, H.B.; Annas, M.M.K.; Faisal, S.K. The mechanical properties of PET fiber reinforced concrete from recycled bottle wastes. Adv. Mat. Res. 2013, 795, 347–351. [Google Scholar] [CrossRef]
  39. Juki, M.I.; Muhamad, K.; Mahamad, M.K.A.; Boon, K.H.; Othman, N.; Kadir, A.A.; Roslan, M.A.; Khalid, F.S. Development of concrete mix design nomograph containing polyethylene terephthalate (PET) as fine aggregate. Adv. Mat. Res. 2013, 701, 12–16. [Google Scholar]
Figure 1. Material appearance and Fourier-transform infrared spectroscopy (FTIR) analysis of polyethylene.
Buildings 12 02117 g001
Figure 2. Slump of cement mortar with different W/B ratios and waste PE.
Buildings 12 02117 g002
Figure 3. Flow of cement mortar with different W/B ratios and waste PE.
Buildings 12 02117 g003
Figure 4. Setting time of cement mortar with different W/B ratios and waste PE.
Buildings 12 02117 g004
Figure 5. Compressive strength of cement mortar with different W/B ratios and waste PE.
Buildings 12 02117 g005
Figure 6. Flexural strength of cement mortar with different W/B ratios and waste PE.
Buildings 12 02117 g006
Figure 7. Tensile strength of cement mortar with different W/B ratios and waste PE.
Buildings 12 02117 g007
Figure 8. Ultrasonic velocity of cement mortar with different W/B ratios and waste PE.
Buildings 12 02117 g008
Figure 9. Water absorption rate of cement mortar with different W/B ratios and waste PE.
Buildings 12 02117 g009
Figure 10. Resistivity of cement mortar with different W/B ratios and waste PE.
Buildings 12 02117 g010
Figure 11. Resistance to sulfate attack of cement mortar with different W/B ratios and waste PE.
Buildings 12 02117 g011
Figure 12. SEM of cement mortar with different waste PE (×1000) (day 7, W/B ratio of 0.5).
Buildings 12 02117 g012aBuildings 12 02117 g012b
Table 1. Physical properties and chemical composition of test materials.
MaterialsChemical Contents (%)
SiO2Al2O3Fe2O3CaOMgOSO3K2ONa2OTiO2P2O5f-CaOC3SC2SC3AC4AFL.O.I
Cement19.64.43.162.54.92.2--0.50.110.75614792.5
PE42.5361.111.22.9-0.40.75.2 -----42
GGBFS33.514.70.441.26.40.60.30.20.50.01-----0.6
Table 2. Mixture proportions of cement mortar (unit: kg/m3).
W/BGGBFS (%)GGBFSCementPE (%)PESandWater
0.420172749002302375
113.8
227.7
341.5
455.4
0.515165800411
113.8
227.7
341.5
455.4
0.613558600439
113.8
227.7
341.5
455.4
Table 3. Test method and regulations.
No.Test ItemsTest Regulations
1SlumpASTM C143
2FlowASTM C230
3Setting timeASTM C403
4Compressive strengthASTM C109
5Flexural strengthASTM C348
6Tensile strengthASTM C190
7Water absorption rateASTM C1585
8Ultrasonic velocityASTM C597
9ResistivityASTM C876
10Resistance to sulfate attackASTM C1012
Table 4. Slump and slump ratio of cement mortar with different W/B ratios and waste PE (unit: cm).
RM (%)AM (%)W/B
GGBFSPE0.40.50.6
SlumpSR *SlumpSR *SlumpSR *
2001.91.002.81.004.11.00
11.50.792.60.933.80.92
21.30.682.50.893.70.90
31.30.682.30.823.50.85
41.20.632.10.753.40.83
* SR: Slump ratio of PE material added specimen to the control specimen without PE material added.
Table 5. Flow and flow ratio of cement mortar with different W/B ratios and waste PE (unit: cm).
RM (%)AM (%)W/B
GGBFSPE0.40.50.6
FlowFR *FlowFR *FlowFR *
20015.61.0019.91.0021.71.00
115.20.9719.70.9921.30.98
214.70.9419.40.9721.20.98
314.40.9218.90.9521.00.97
414.20.9118.70.9420.90.96
* FR: Flow ratio of PE fiber material added specimen to the control specimen without PE fiber material added.
Table 6. Setting time of cement mortar with different W/B ratios and waste PE.
W/BRM (%)AM (%)Initial SettingFinal Setting
GGBFSPEminmin
0.4200324394
1315382
334
2302365
3284
268
347
4268334
0.5200401518
1387
356
505
474
2375496
3367488
4356474
0.6200479633
1468625
2460617
3447
439
609
598
4439589
Table 7. Compressive strength of cement mortar with different W/B ratios and waste PE (unit: MPa).
W/BGGBFS (%)PE (%)3
Days
7
Days
28
Days
56
Days
91
Days
0.420026.536.354.159.865.3
125.135.652.459.064.4
224.334.251.058.161.9
323.633.750.457.362.5
422.532.448.955.660.0
0.520024.733.348.553.559.1
123.033.147.852.557.9
221.630.046.850.055.5
321.029.445.951.156.9
420.328.644.949.353.8
0.620020.027.137.245.750.4
119.025.435.344.050.2
218.424.735.142.648.2
317.624.234.642.047.6
417.023.534.740.346.6
Table 8. Resistivity of cement mortar with different W/B ratios and waste PE (unit: kΩ-cm).
W/BGGBFS (%)PE (%)3
Days
7
Days
28
Days
56
Days
91
Days
0.420011.715.826.635.639.0
111.015.426.834.838.8
210.414.425.234.037.3
39.614.024.633.836.4
48.913.224.033.335.7
0.520010.014.726.335.538.9
19.514.225.434.537.3
29.113.724.934.036.2
38.613.424.033.636.3
48.012.223.332.633.8
0.62008.413.221.632.835.4
18.012.120.933.235.2
27.712.120.932.634.9
37.211.520.031.833.8
46.911.619.430.932.2
Publisher’s Note: MDPI stays neutral with regard to jurisdictional claims in published maps and institutional affiliations.

