Article

Optimized Preparation of Porous Coal Gangue-Based Geopolymer and Quantitative Analysis of Pore Structure

1
School of Civil Engineering and Architecture, NingboTech University, Ningbo 315100, China
2
Zhejiang Engineering Research Center for Intelligent Marine Ranch Equipment, Ningbo 315100, China
3
School of Civil Engineering, University of South China, Hengyang 421001, China
*
Author to whom correspondence should be addressed.
Buildings 2022, 12(12), 2079; https://doi.org/10.3390/buildings12122079
Submission received: 7 October 2022 / Revised: 14 November 2022 / Accepted: 21 November 2022 / Published: 28 November 2022
(This article belongs to the Section Building Materials, and Repair & Renovation)

Abstract

:
The purpose of study is to optimize the preparation of porous coal gangue-based geopolymer and quantitatively analyze its pore structure to establish the relationship between pore structure and mechanical properties. Porous coal gangue-based geopolymers were prepared by using coal gangue as the raw material, Na2SiO3 and NaOH as activators, H2O2 as the foaming agent and carboxymethylcellulose sodium (CMC) as the surfactant. Then response surface methodology (RSM) was used to study effects of liquid-to-solid ratio, CMC content, H2O2 content and curing temperature on compressive strength. Finally, pore number, porosity, pore size distribution and pore structure parameters were analyzed by self-developed image analysis algorithm. RSM results demonstrate that H2O2 content has the greatest effect on mechanical strength, followed by liquid-to-solid ratio, curing temperature and CMC content. Quantitative analysis of pore structure indicate that with the increase in H2O2 content, porosity could increase and pore size and pore shape could become more regular, but mechanical properties sharply deteriorate.

1. Introduction

Porous geopolymer is a new type of environment-friendly and energy-saving material with a large number of pore structures [1,2,3]. It is prepared by introducing a large number of foams into a slurry of geopolymer through physical or chemical foaming methods. The basic concept of the geopolymer was first put forward by Davidovits in 1987 [4]. The ordinary geopolymer is synthesized by a geopolymerization reaction between an activator and raw material at room temperature. The raw material is usually natural minerals or industrial wastes which are rich in aluminosilicate such as metakaolin, fly ash, waste glass powder and biomass ash [5,6,7,8,9]. The porous geopolymer possesses excellent mechanical and chemical properties, which include good compressive strength and flexural strength, high acid resistance, good heat preservation and so on [10,11,12,13]. Based on the above superior properties, the research of a porous geopolymer has developed rapidly in recent decades. The research hotspots are mainly focused on the influences of different foaming agents, surfactants and foam stabilizers on the properties of the geopolymer. Bai and coworkers [14] used H2O2 and egg whites as foaming agent and surfactant, respectively, to prepare a porous geopolymer and discussed the effects of H2O2 and protein content on pore size. Considering the strong alkaline environment of geopolymer preparation, Hajimohammadi [15] chose aluminum powder as foaming agent of geopolymer and studied the method of increasing porosity by controlling the ratio of NaOH and Na2SiO3 instead of increasing the amount of blowing agent. Moreover, Medpelli et al. [16] innovatively put vegetable oil into a geopolymer slurry and mixed it together to synthesize a foaming geopolymer. The saponification reaction of the oil and alkali solution occurred at the maintain stage, which was the source of pores of the geopolymer. Furthermore, Papa [17] in 2016 found that a geopolymer could obtain a large number of narrow lamellar pores via the ice-templating method without adding a chemical foamer. According to the above investigation, it was found that there is no essential difference between a foaming geopolymer and an ordinary geopolymer. The molecular structure of the porous geopolymer remains unchanged. It is still a network structure composed of a silicon–oxygen tetrahedron and an aluminum–oxygen tetrahedron [18]. However, due to the porous characteristics of the foaming geopolymer it has great application prospects in the construction industry and wastewater treatment [19,20,21,22].
Coal gangue was selected as the raw material for preparation of the porous geopolymer in this paper. On one hand, coal gangue is mainly composed of aluminosilicate minerals, which account for more than 80% of total weight [23]. On the other hand, coal gangue is a large amount of solid waste produced in the process of coal mining and production [24]. Currently, with the rapid growth of coal gangue output, the stacking of coal gangue not only occupies land resources but also causes serious environment and safety problems [25,26,27]. Therefore, using coal gangue to prepare a porous geopolymer both solves the low utilization problem of the solid waste and protects the environment. The activated agent was prepared as a solution of water glass and NaOH in this work. It could dissolve activated silica and alumina in calcined coal gangue powder through a depolymerization reaction. H2O2 was chosen as the foaming agent to synthesize the porous geopolymer because it could generate a large amount of foam with a regular size. Furthermore, due to carboxymethylcellulose sodium (CMC) increasing the stability of the bubbles, it was selected as a foam stabilizer and surfactant in this work.
Previous studies demonstrate that the most researchers mainly carry out a single-factor method or orthogonal experiment to study the effects of different factors on the mechanical and chemical properties of geopolymers [28,29]. Only a few scholars have paid attention to the interaction of various factors affecting geopolymer performance, especially in the preparation of foamed geopolymer. Moreover, regarding pore structure analysis, most of the studies are based on experimental characterization such as mercury intrusion porosimetry and the nitrogen adsorption method [30,31,32,33,34]. However, testing of pore structure is complex and expensive. Some researchers such as Fang Xu [35] and Ning-ning Shao [36] applied Image Pro plus image analysis software to analyze pore structure parameters of their geopolymer. It is an effective method for pore structure analysis. However, Image Pro plus image analysis requires one to divide pores and the unfoamed matrix area by hand, and even photoshop software needs to be applied to process the images of the pore structure. It greatly increases the complexity of the pore structure analysis.
In order to deal with the above problems, response surface methodology (RSM) was introduced to design a synthetic experiment of a porous geopolymer in this work. RSM is a mathematical and statistical method that was proposed by Box and Wilson in 1951. It can be applied to find out the significance level of a single factor and the interaction of multiple factors; in addition, RSM could optimize the mix design of the material [37,38]. Under the conditions of calcined coal gangue content and water glass modulus, which are fixed, the effects of H2O2 content, curing temperature, CMC content and liquid-to-solid ratio on 7 d and 28 d compressive strength of the foamed geopolymer were studied. XRF, XRD and SEM were used to analyze and characterize the chemical composition, crystalline phase and microstructures of the porous geopolymer, respectively. Moreover, MATLAB 2016a was applied to achieve a novel image analysis algorithm, which can automatically collect pore structure parameters and quantitatively analyze them based on different amounts of foaming agent. The main pore structure parameters include roundness, average perimeter and average diameter. In addition, the impact of pore number, porosity, pore size distribution and pore structure parameters on compressive strength with 7 d and 28 d of curing age were investigated. This study combines RSM and automatic image analysis methodology to optimize the preparation of a porous coal gangue-based geopolymer, as well as quantitatively analyze pore structure information to establish the relationship between pore structure and mechanical property. This study could efficiently improve the mechanical performance of the porous geopolymer, save energy and reduce environmental problems caused by coal gangue.

2. Experiment and Method

2.1. Materials

The 325-mesh coal gangue powder used in the experiment was purchased from Hebei Jinghang Mineral Products Co. Ltd. (Shijiazhuang, China). However, due to the low activity of aluminosilicate in raw coal gangue powder, it cannot directly react with the strong alkaline activator to produce cementitious materials. Thus, it was necessary to activate the purchased coal gangue powder at a high temperature. A certain amount of coal gangue powder was weighed and dried in an electric heating oven. Then it was placed into a muffle furnace. After calcining at 800 °C for 3 h, metakaolin with pozzolanic activity was prepared. In this study, Na2SiO3 and NaOH were selected as the composite alkaline activators. Sodium silicate solution with a modulus of 3.341 was obtained from commercial suppliers. The purity of sodium hydroxide flakes was 99.31%, and they were purchased from commercial suppliers. The foaming agent and foam stabilizer were high-purity H2O2 and CMC (analytical reagent grade).

2.2. Experiment Design

Response surface methodology (RSM) is an efficient and economical design method for experiments that can scientifically reduce the number of tests based on the validity of the experimental results [38]. In our work, four different factors that may affect 7 d and 28 d compressive strength of the porous geopolymer were investigated by RSM. They include H2O2 content, liquid-to-solid ratio, CMC content and curing temperature. Based on previous single-factor experiments, the suitable mixing proportion of each different material was determined, and 29 groups of RSM experiments were designed by Design-Expert 11 software. The number of factors and levels for the experiment are listed in Table 1.

2.3. Preparation and Characterization of Porous Coal Gangue-Based Geopolymer

Firstly, NaOH flakes, water glass and deionized water were weighed to prepare alkali activator with designated molar ratio. After that, NaOH flakes and deionized water were slowly added to the water glass and mixed constantly until the NaOH flakes were adequately dissolved. The obtained activating agent was kept at room temperature for one day before using. The final modulus of the activating agent was 1.2. Secondly, according to the experiment designed by RSM, proper amounts of calcined coal gangue powder and deionized water were weighed, and the prepared alkali activator was added according to the liquid-to-solid ratio. After mechanical stirring for 5 min, H2O2 and CMC were added to the mixture and mixed at low speed for 3 min. Subsequently, geopolymer slurries were poured into molds (40 mm × 40 mm × 160 mm). The samples were cured at a temperature of 20 °C, 30 °C and 40 °C and relative humidity of 90%. All the molds of the samples were removed after 24 h, and the samples were kept at ambient temperature for 7 days and 28 days to obtain a porous coal gangue-based geopolymer. The preparation flow chart is shown in Figure 1.
Compression tests of the porous geopolymer sample with a curing age of 7 days and 28 days were carried out using an NYL-300 pressure tester. All the test results were averaged between six samples. The pore structure and surface morphology of samples were observed by scanning electron microscopy (ZEISS-SUPRA40). X-ray fluorescence spectrometer (Axios PW4400) was used to obtain the main chemical composition of calcined gangue powder. The chemical composition of calcined gangue powder are shown in Table 2.
As it can be seen from Table 2, the main chemical compositions of calcined gangue are SiO2 and Al2O3, which are the main sources of silicon–oxide and aluminum–oxide tetrahedrons. The molar ratio of SiO2 to Al2O3 in coal gangue is close to 1, and it can be used to prepare the porous geopolymer with excellent properties under suitable conditions.
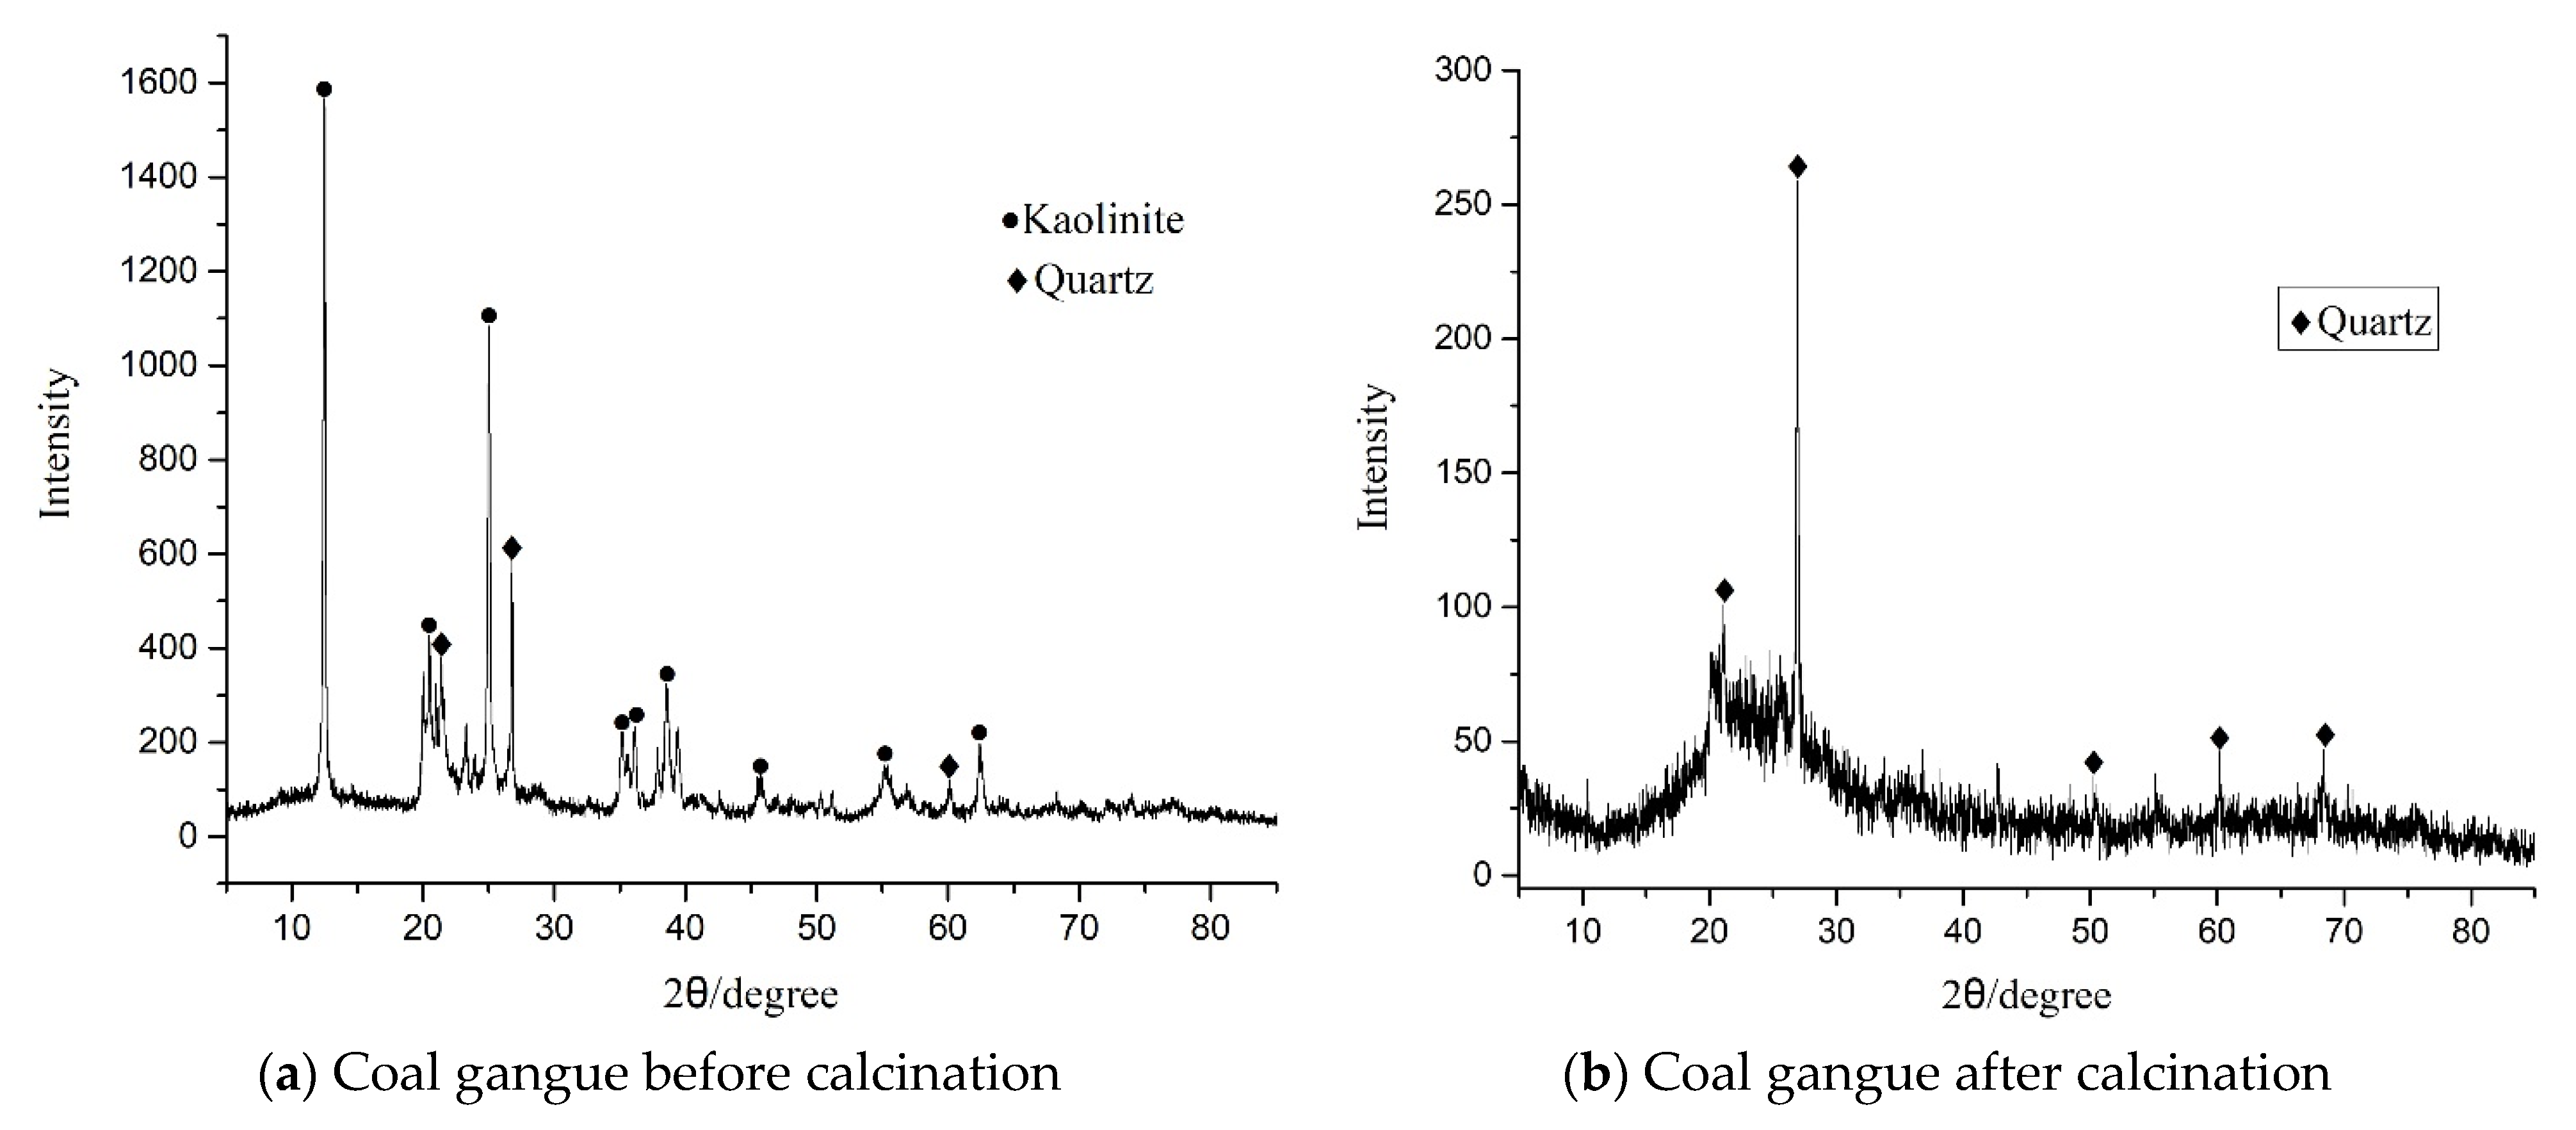
The crystalline phase data of the raw materials and porous coal gangue-based geopolymer were collected by X-ray diffraction (Bruker D8-Advance) with Cu Kα radiation in a scanning range of 5–90°. It can analyze crystalline phases by comparing diffraction patterns in the database of Jade 6.5 software. Figure 2 presents the XRD pattern of coal gangue before and after calcination.
Figure 2a indicates that the dominant phase of coal gangue includes kaolinite and quartz. Comparing Figure 2a,b, it can be obviously seen that there is a reflection peak in the range of 10–40° (2θ) from Figure 2b. It indicates that calcined gangue powder has a large number of amorphous structures. The main reason is that the kaolinite phase in coal gangue loses its internal bound water and forms a loose metakaolin structure when calcined at 800 °C for 3 h. In addition, some sharp diffraction peaks still can be found in Figure 2b, which are mainly stable quartz crystals.

2.4. Automatic Image Analysis Methodology for Quantitative Pore Structure Analysis

The automatic image analysis approach for quantitative pore structure analysis contains image preprocessing, pore size classification and pore segmentation. Through the image analysis method, we can efficiently and accurately acquire the information of objects in the image. Thus, this method has been widely used to analyze the pore structure information [36]. In this study, the quantitative pore structure analysis algorithm was designed by MATLAB. Firstly, the histogram of SEM images for porous geopolymer was readjusted for grayscale distribution. It makes the details of the picture more prominent. Secondly, the image subtraction algorithm was implemented after the histogram equalization. It reduced image noise and enhanced the quality of the defective picture. Then multilevel median filtering was performed to denoise the image further. After that, a binary image was obtained by the adaptive threshold segmentation method. Because threshold segmentation could produce image noise, the mathematics morphology was used to deal with this problem. Finally, the perimeter and area of the pores were calculated, and they were used to obtain the pore structure parameters such as roundness and diameter. Based on the above feature parameter, the pores were classified, and the number of pores and porosity were calculated automatically.

3. Results and Discussions

3.1. RSM Experiment Results and Analysis

The Box–Behnken method of RSM was applied to design 29 groups of experiments in this work. Five of them were central points, which were used to reduce experimental bias. RSM experiment design and experimental results are shown in Table 3.
Table 3 demonstrates that the range of the 7 d compressive strength for porous coal gangue-based geopolymer is about 1.8 MPa to 11.3 MPa, and the 28 d compressive strength range is approximately from 2.4 MPa to 13.2 MPa. The range of strength change is relatively large; thus, it is necessary to strictly control the amount of each factor in the formulation to prepare porous coal gangue-based geopolymer with high compressive strength. Moreover, it can be obviously seen that the compressive strength of the foaming geopolymer reaches the smallest value when the maximum content of H2O2 is used because the pore number and pore volume of the foaming geopolymer depend entirely on the oxygen generated by the decomposition of H2O2. With the rise of H2O2 content, the number of pores increases in the geopolymer sample, and compressive strength decreases. Furthermore, comparing the 7 d and 28 d compressive strength, it can be found that compressive strength of the geopolymer develops rapidly early on, while after that it has little change because coal gangue powder and the alkaline activator react gradually in the early stages. It produces a large amount of hydration products, which are composed of sodium aluminosilicate [23]. The hydrate gel is the main strength source for the porous coal gangue-based geopolymer in the first few days [39]. After 7 days of curing, most of the coal gangue powder is completely reacted with activator; thus, the strength of porous geopolymer increases slowly.
Moreover, RSM provides a second-order polynomial to express the relationship between factors and responses. The general response surface model is shown in the following equation [39]:
y = β 0 + i = 1 m β i x i + i < j m β i j x i x j + i = 1 m β i i x i 2 + ε
where xi and xj are independent variables; β0, βi, βij and βii are coefficients for regression equation; and ε is the error of regression in the equation.
According to the above RSM experimental data, compressive strength models of the porous geopolymer at 7 d and 28 d curing age were established. Table 4 presents two different models. In Table 4, A, B, C and D represent H2O2 content, curing temperature, CMC content and liquid-to-solid ratio, respectively.
The correlation coefficient R2 and adjusted R2 could assess the quality of model. It can be seen that R2 values of 7 d and 28 d compressive strength models, respectively, are 0.9895 and 0.9948 in Table 4. Both R2 values are close to 1, which shows that the reliability of the models is not only high but also that the bias is small [40]. Moreover, adjusted R2 values of the geopolymer at 7 d and 28 d curing age are 0.9790 and 0.9895, which demonstrates that the two compressive strength models with different curing ages can explain the response value change of 97.90% and 98.95% [37]. Furthermore, F values of different the models are 94.23 and 190.11, and the p value of both models is less than 0.0001, which indicates that the two established models are significant for the compressive strength [41].
Based on the above two models, regression analyses of the compressive strength of the geopolymer at 7 d and 28 d curing age were implemented by Design-Expert 11 software. The results are presented in Table 5.
In Table 5, the F value shows the influence degree of different factors on response. With the rise of the F value, the effect of the factors increases [42]. The p value represents the significance level of the factors. When the factor is significant in response, the p value is less than 0.05 [41]. Thus, it can be found that A (H2O2 content) and D (liquid-to-solid ratio) have the most significant effect on compressive strength of porous specimens at 7 d and 28 d of curing because the p value is less than 0.0001. Moreover, the p value of both B (curing temperature) and C (CMC content) is less than 0.05; therefore, these two factors attribute significant influence to the response value. The F value in Table 5 indicates that A (H2O2 content) has the greatest influence on compressive strength at the 7 d curing age; D (liquid-to-solid ratio) produces the second level effect; B (curing temperature) has a slight influence on the compressive strength of the foamed geopolymer; and C (CMC content) has minimal impact on compressive strength. For the 28 d compressive strength, there is a similar significance sequence. It is as follows: H2O2 content > liquid-to-solid ratio > curing temperature > CMC content. Moreover, it also can be seen from the above table that the content of H2O2 and liquid-to-solid ratio have an interactive effect on the compressive strength of the porous coal gangue-based geopolymer because the probability (p Value) is less than 0.05.
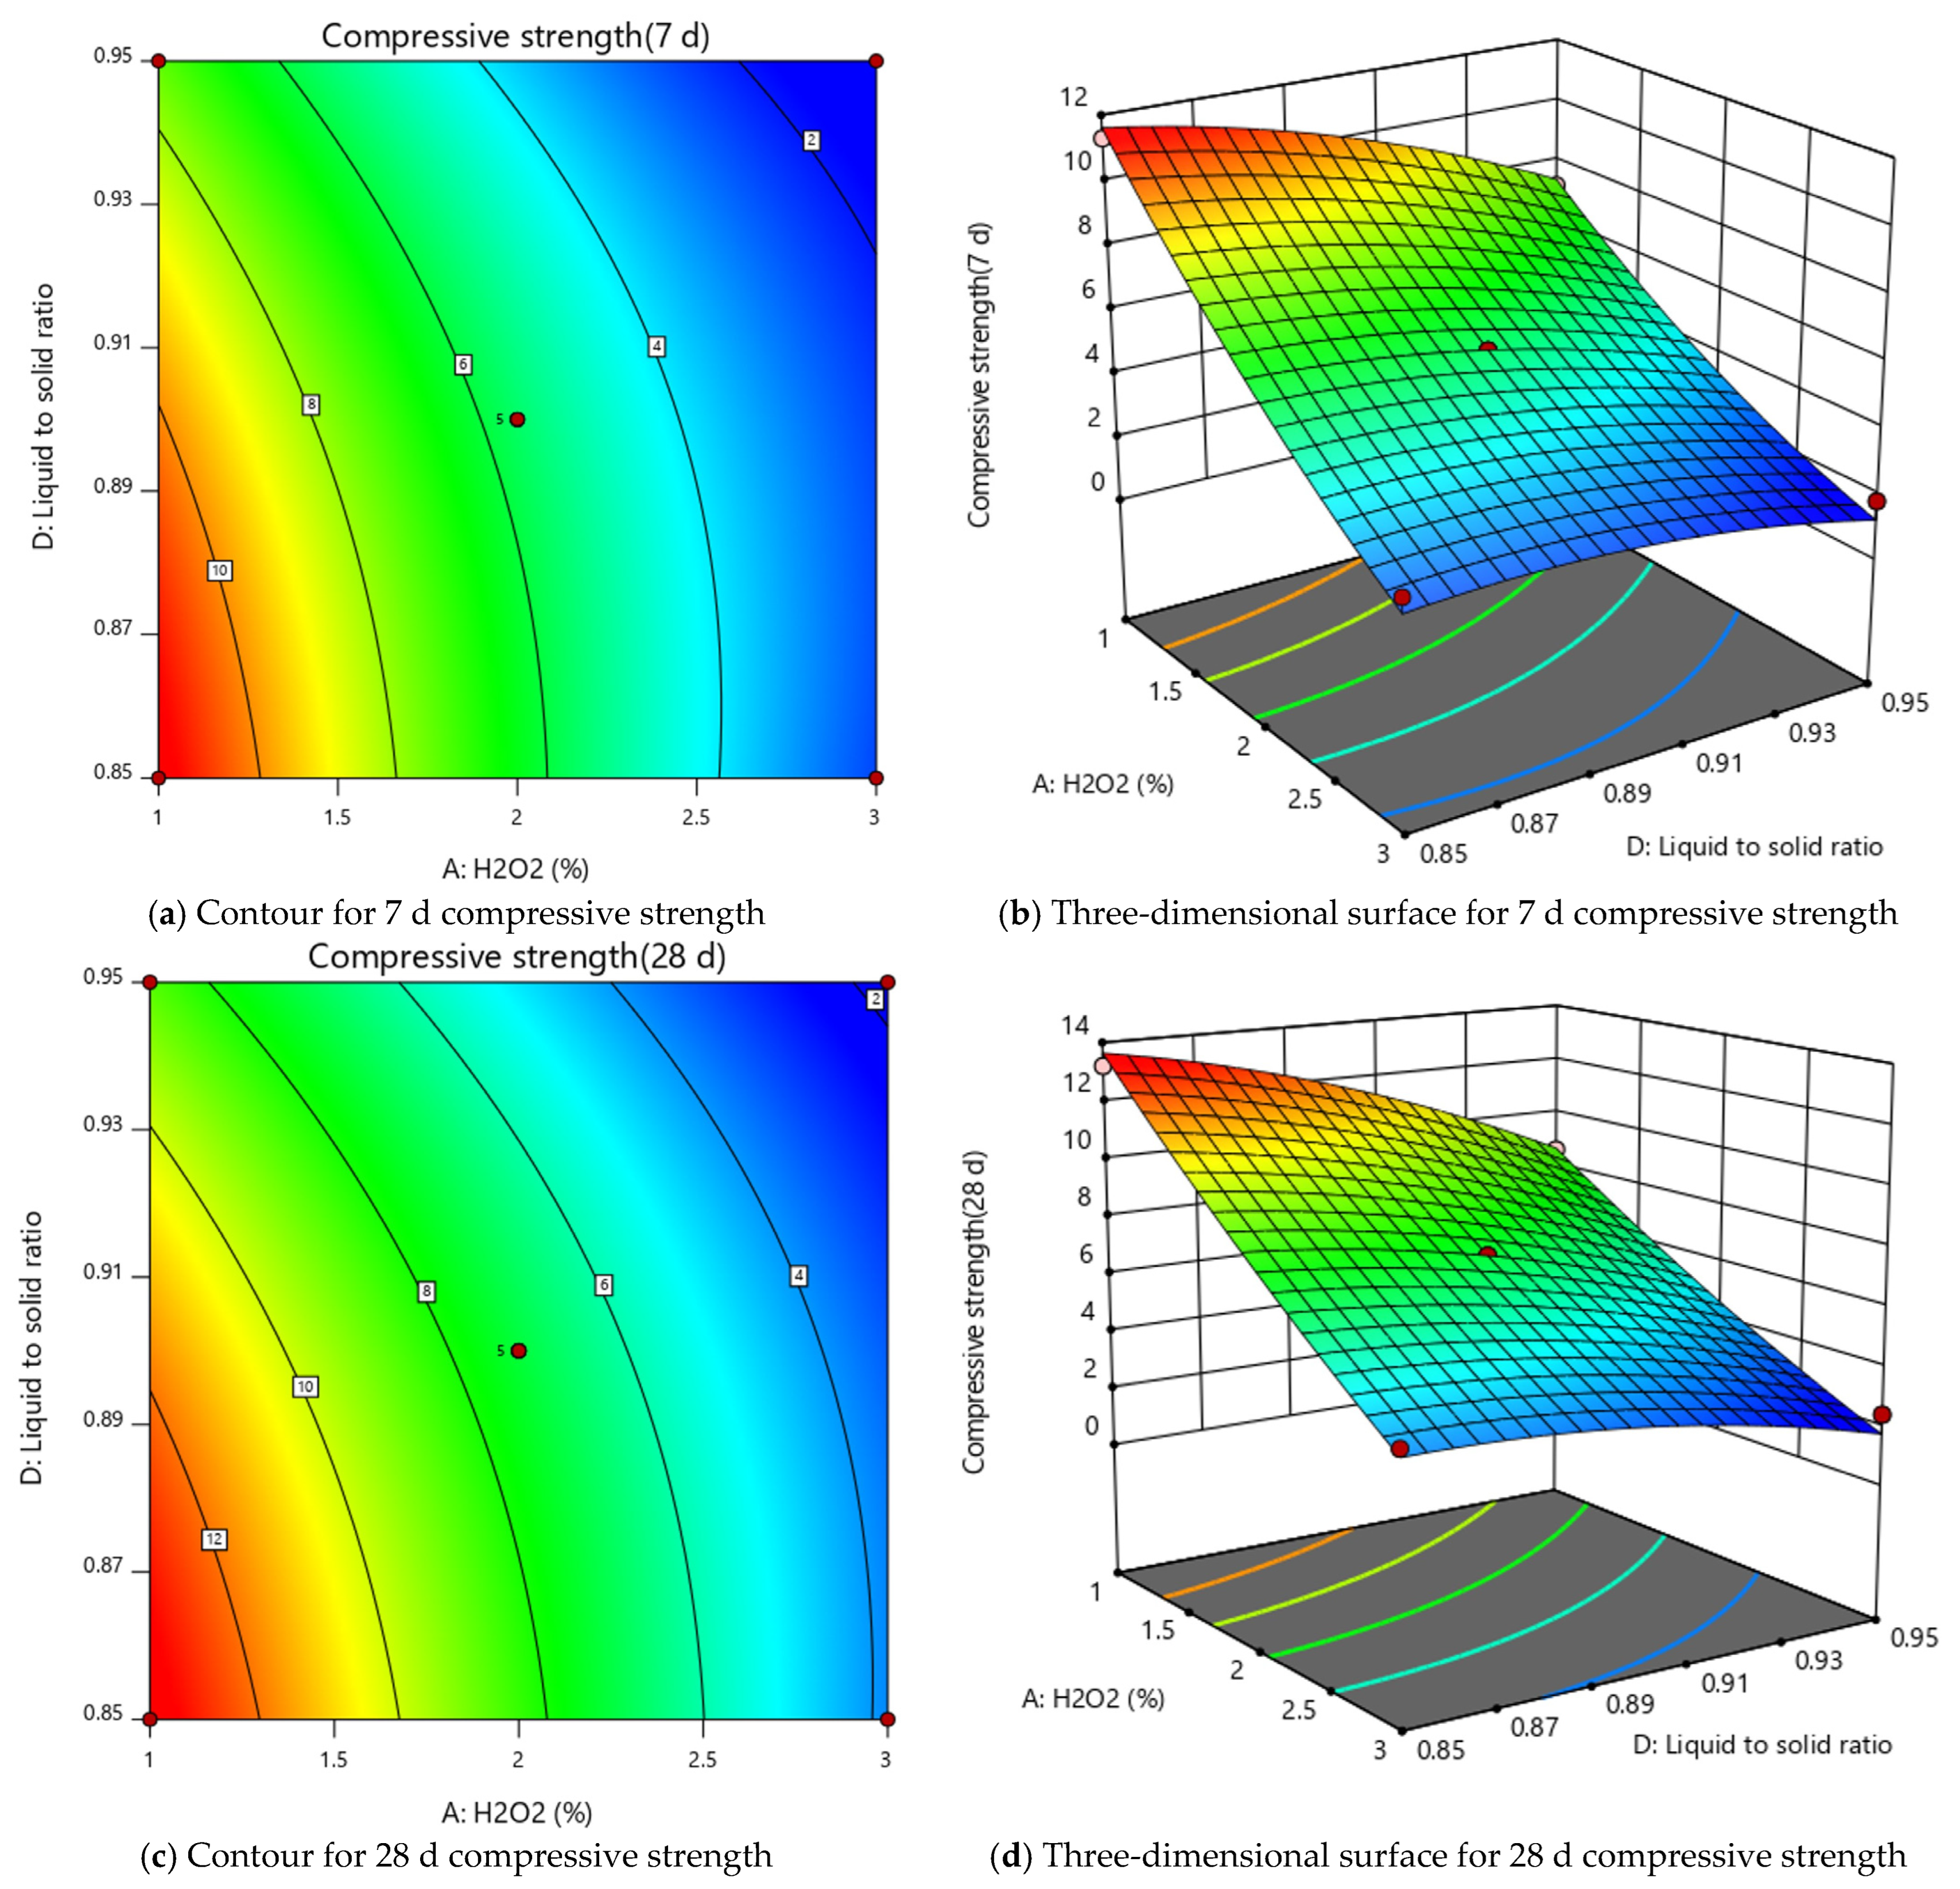
According to the above regression analysis, Figure 3 plots a contour diagram and response surface 3D diagram for the interaction impact between the liquid-to-solid ratio and H2O2 content on the compressive strength of the geopolymer at 7 d and 28 d curing age.
Figure 3 show that when the liquid-to-solid ratio is 0.85 and the H2O2 content is 1%, the compressive strength of the porous geopolymer at 7 days and 28 days reaches the maximum values at their respective curing age. Moreover, when the content of H2O2 is 3% and the liquid-to-solid ratio is 0.95, the 7 d and 28 d compressive strength of the geopolymer achieves the minimum value. Figure 3 indicates that when the H2O2 content remains unchanged, the compressive strength of the porous geopolymer decreases gradually with the increase in the liquid-to-solid ratio, or, when the liquid-to-solid ratio is unchanged, the amount of H2O2 increases, and the compressive strength decrease. Furthermore, it could be obviously seen that the H2O2 content has a stronger impact on compressive strength than the liquid-to-solid ratio because the change rate of compressive strength caused by H2O2 content is extraordinarily greater than the change rate of compressive strength caused by the liquid-to-solid ratio.

3.2. XRD and SEM Analysis

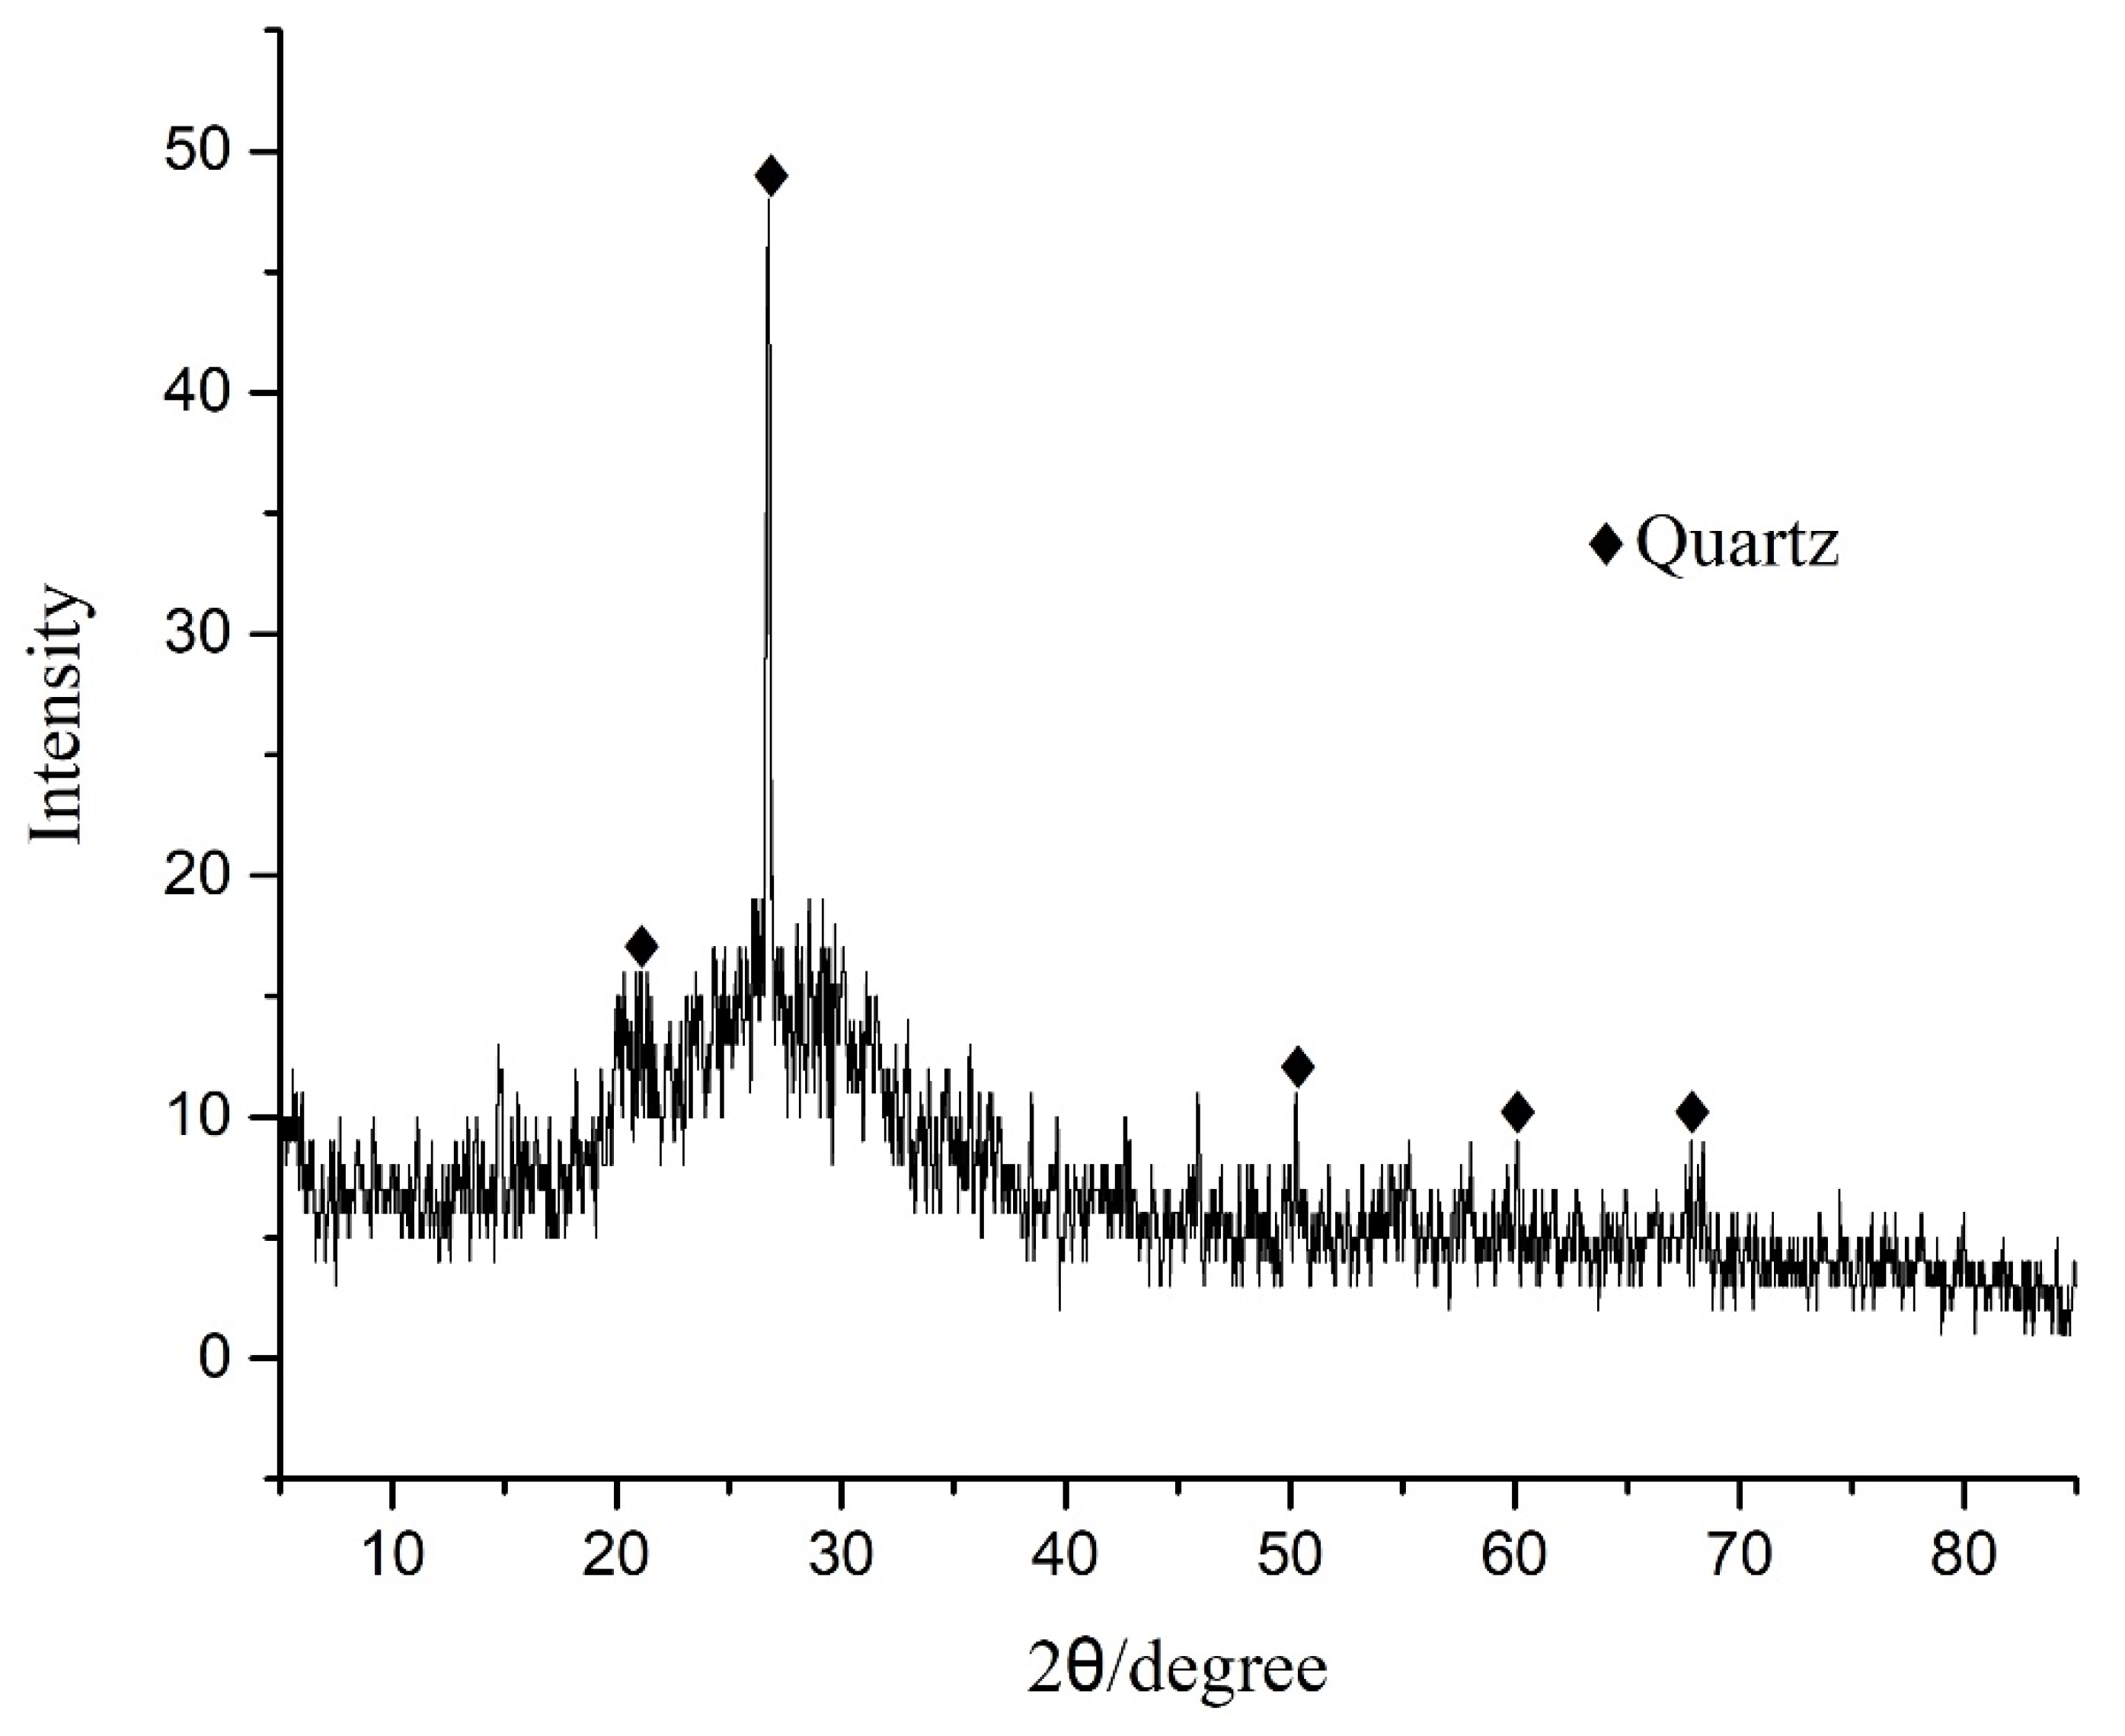
X-ray diffraction analysis was carried out to identify the crystalline phase of porous coal gangue-based geopolymer with the highest 28 d compressive strength in RSM experiment. The XRD pattern is presented in Figure 4.
Figure 4 illustrates that there is a broad diffraction peak at the range of 20–40° (2θ). It indicates that the porous coal gangue-based geopolymer is mainly composed of amorphous substances [43]. Moreover, the sharp reflection peaks in the XRD pattern represent quartz crystal. The crystal structure of quartz is not completely broken at 800 °C calcination, and its chemical properties are relatively stable, meaning it cannot react with the alkali activator. Thus, there is a small number of crystalline phases in a porous coal gangue-based geopolymer [44].
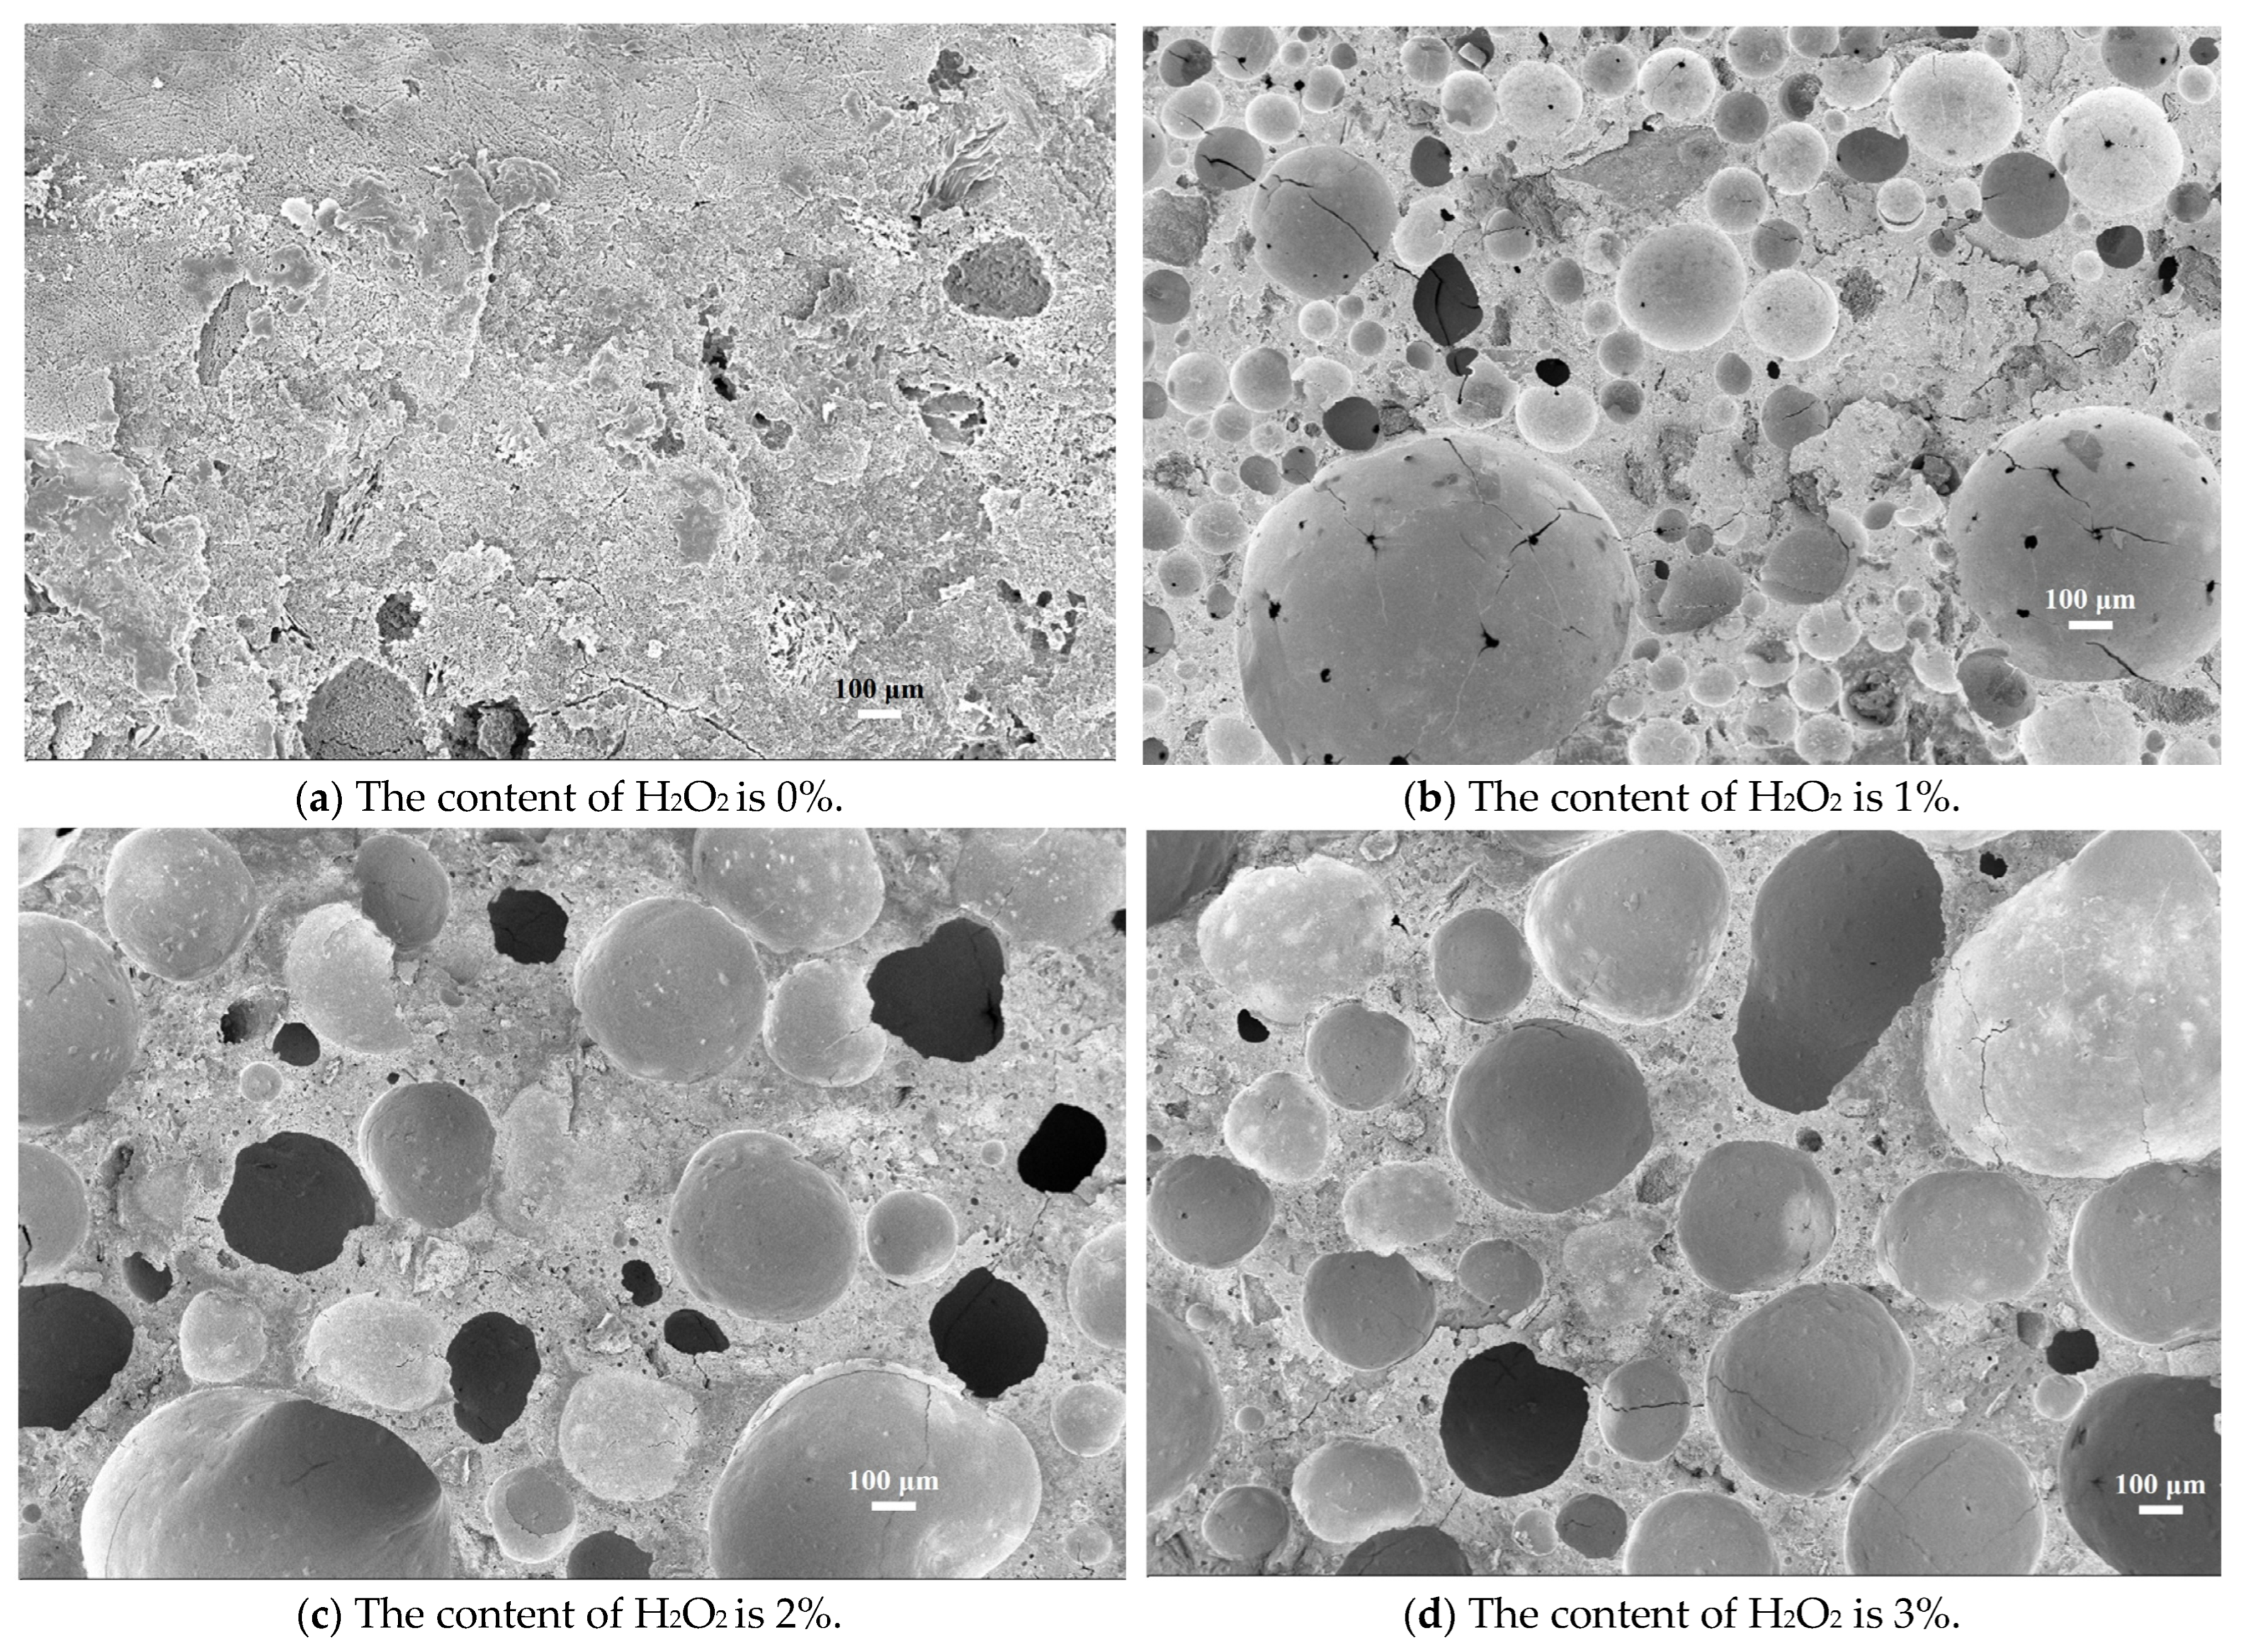
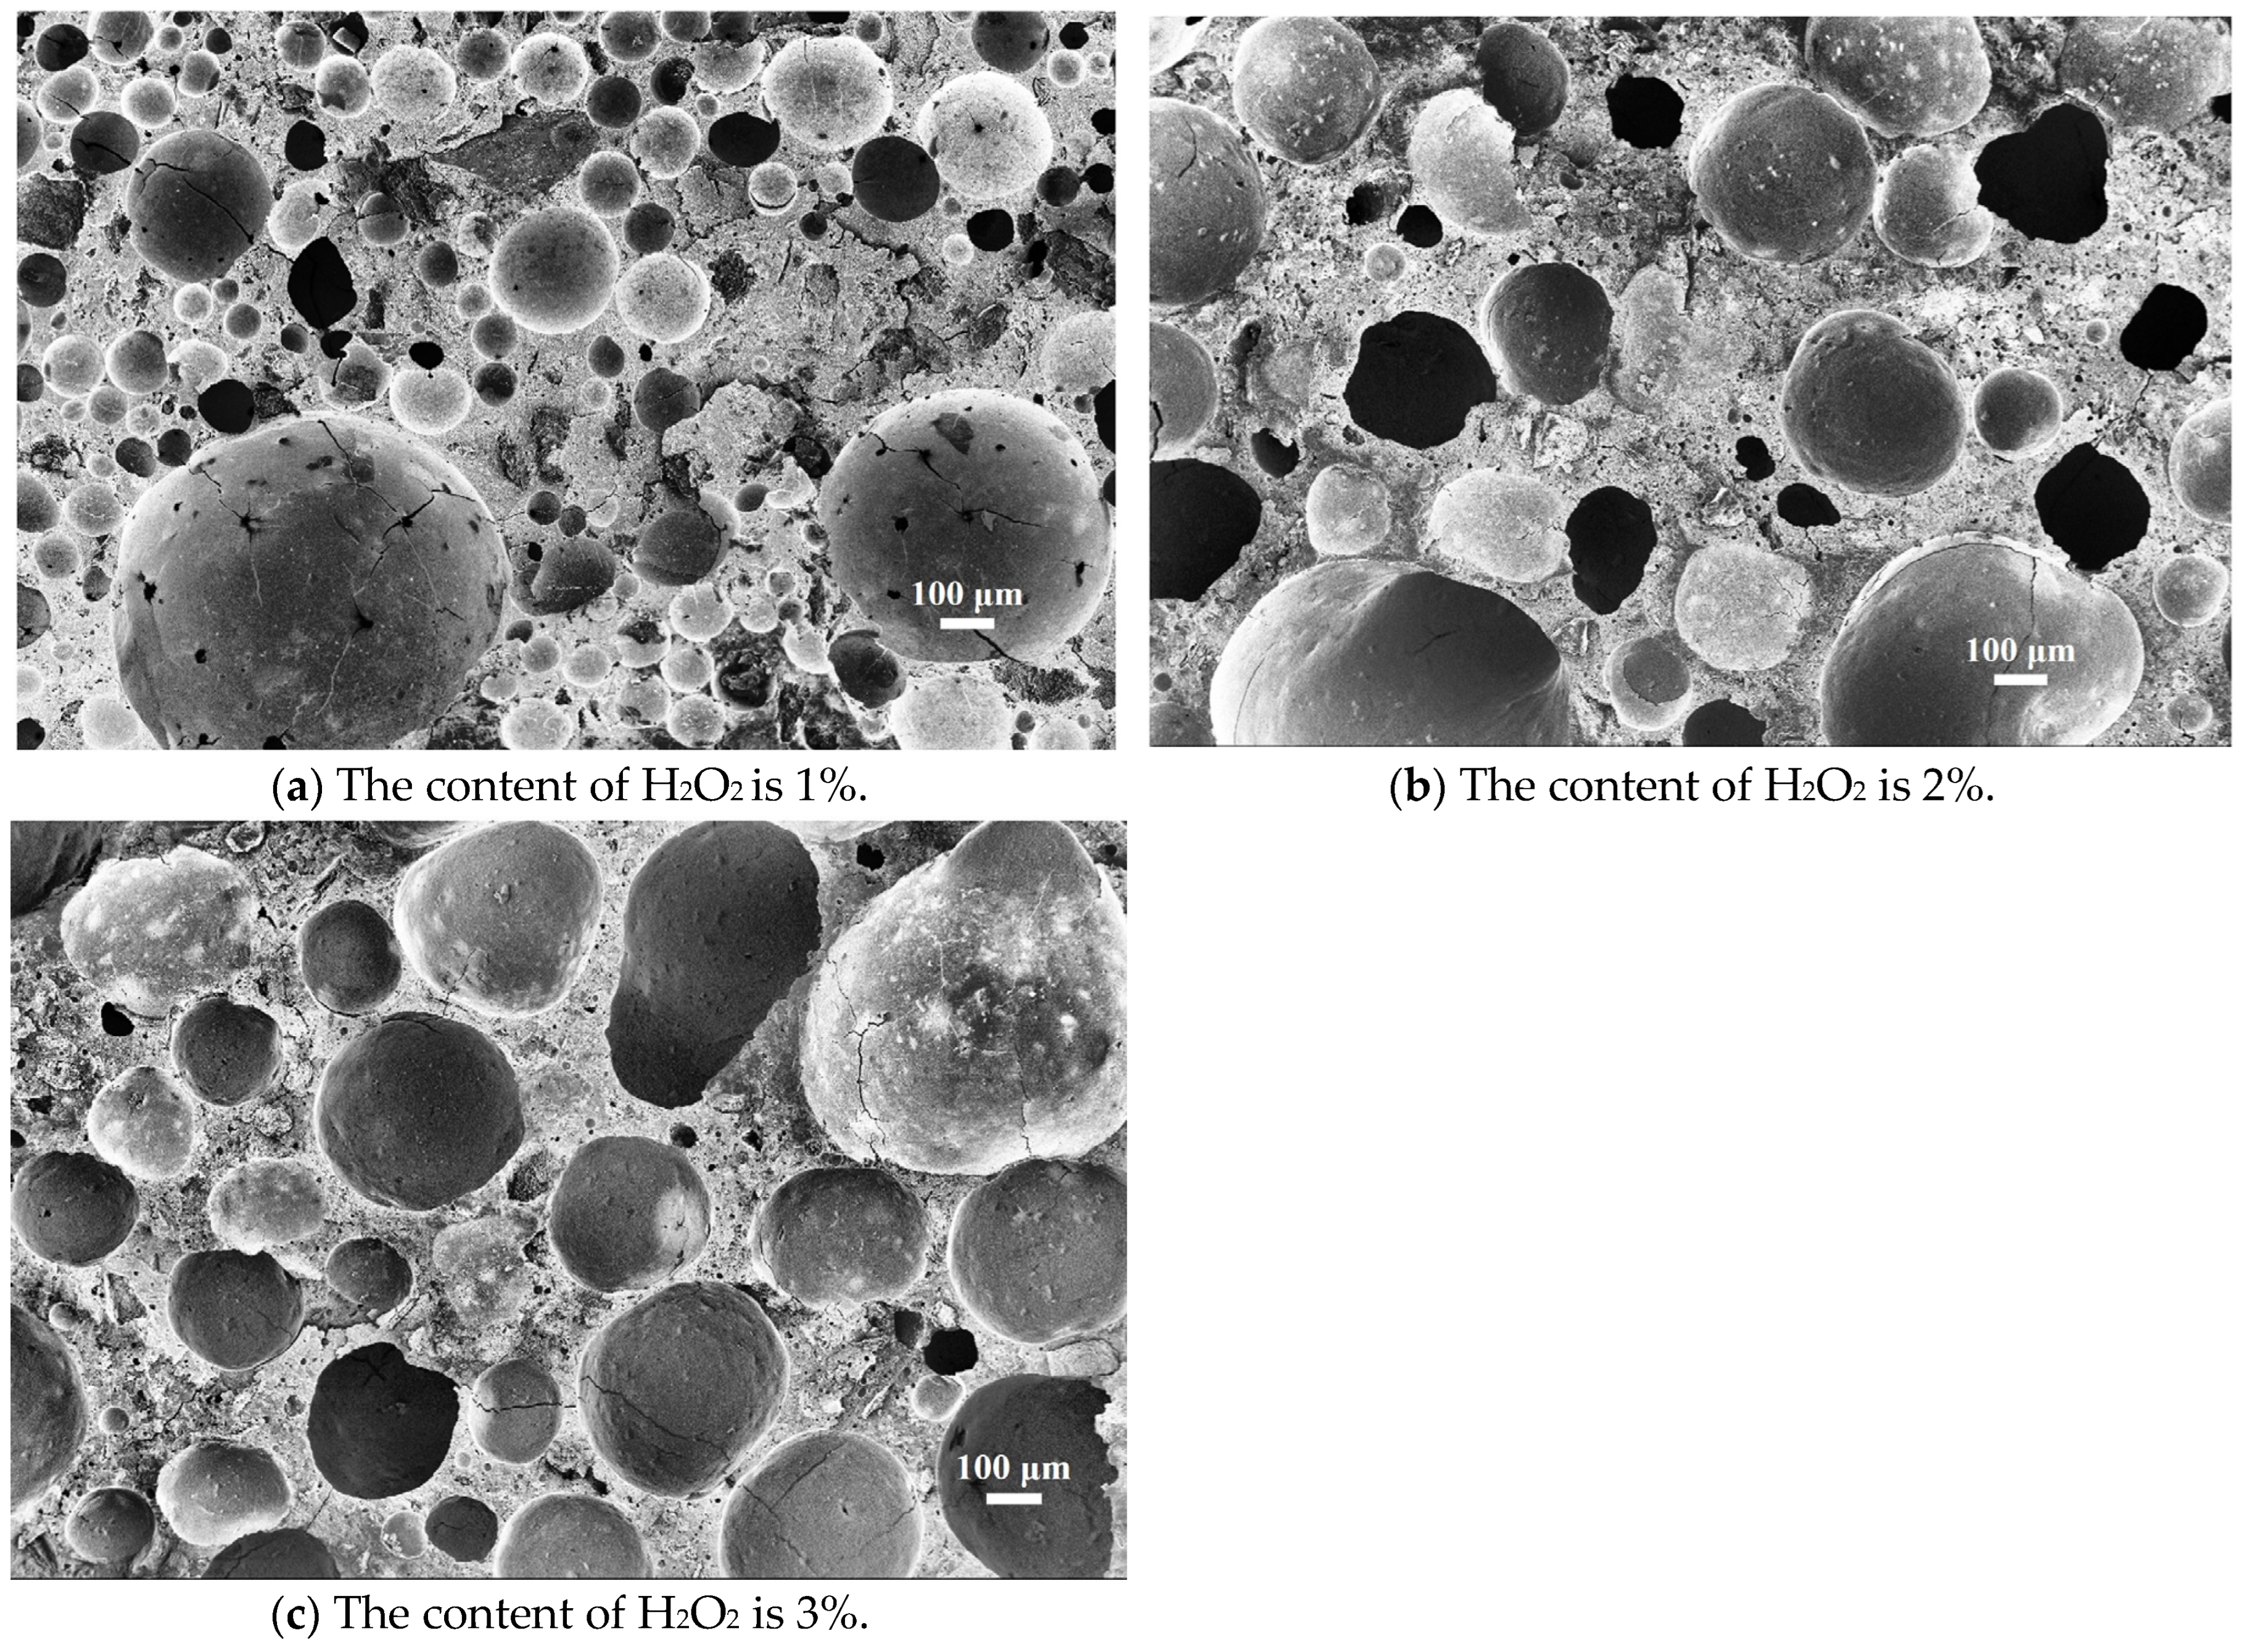
Based on the experiment designed by RSM, the mixing ratio of the foaming geopolymer with the highest compressive strength was obtained; the curing temperature was 30 °C, the CMC content was 1.5% and the liquid-to-solid ratio was 0.85. Different porosities of the geopolymer can be achieved by controlling the H2O2 content. The SEM image of the porous geopolymer with different amounts of the H2O2 is shown in Figure 5. The H2O2 content is 0, 1%, 2% and 3%, respectively.
Figure 5a indicates that when the H2O2 content is zero, only a few small pores may still appear in the specimen because a small amount of air is inevitably introduced into the geopolymer slurry during the mixing process. Figure 5b–d illustrate that using different contents of H2O2 as the foaming agent would generate various ellipsoidal or spherical voids in the geopolymer. Figure 5b shows that a foaming geopolymer with 1% H2O2 content has more pores than others and that the pore size is not uniform. However, compressive strength of the sample reached the maximum value. Figure 5c shows that the number of pores in a foaming geopolymer with 2% H2O2 content is greatly less than that of a geopolymer with 1% H2O2 content at the same magnification. However, the average size of the pore is larger, and the pore shape is more regular. Figure 5d demonstrates that the number of pores is at a minimum in a foaming geopolymer with 3% H2O2 content, but the pore diameter is the largest among all the samples, and the pore size is more uniform, i.e., most of pores can maintain a similar diameter. Under this condition, the compressive strength of the geopolymer reached the minimum value. The possible reason for this result is that the rise of H2O2 content can produce more oxygen in a slurry. In addition, the amount of water produced by the decomposition of H2O2 increases, which reduces the viscosity of the geopolymer slurry.
In addition, it makes the pressure around the pores decrease, which causes pore size and pore volume of the geopolymer to become larger. When these foamed geopolymers are compressed by external forces, the pore structure is easily ruptured, which ultimately leads to low compressive strength of the geopolymer [36].

3.3. Quantitative Pore Structure Analysis by Automatic Image Analysis Method

The recognization and segmentation of pores for porous coal gangue-based geopolymers with different amounts of H2O2 depend on the distribution of the grayscale in the histogram. If the grayscale of an image is concentrated in a narrow range, the contrast of the image is low. There is no clear boundary between objects and the background in the image. It makes target recognition and segmentation difficult. Histogram equalization can effectively improve image contrast. Thus, it was applied to enhance the quality of the SEM images. Histogram equalization could sharpen the details of low-resolution images and obtain clear pore boundaries. The enhanced porous geopolymer images with different H2O2 content are presented in Figure 6.
The above enhanced images were filtered to remove noise interference. After that, according to difference in grayscale of the pores and unfoamed matrix area, an appropriate threshold was automatically found by the adaptive threshold segmentation algorithm. It was applied to obtain a binary image of the porous geopolymer. Then pores were segmented according to their structural characteristics such as area, perimeter and roundness. However, some noise may be misidentified as pores in binary SEM images. Therefore, before segmentation of the pores, it is necessary to carry out a mathematics morphology operation to improve the recognition effect. Finally, the pore number of porous coal gangue-based geopolymers with different H2O2 contents is counted automatically. The results are shown in Figure 7.
Figure 7a shows that there are 115 pores in the porous geopolymer with 1% H2O2 content, Figure 7b shows the geopolymer specimen with 2% H2O2 content has 36 pores and the sample with 3% H2O2 content has 30 pores under the same magnification. The statistical results of the pore numbers indicate that, with the amount of H2O2 increase, the total number of pores is reduced dramatically due to adjacent pores produced by H2O2 having a greater probability to merge together to form pores with a larger size during the mixing process. Thus, the number of pores has dropped dramatically [36]. This can be especially seen as the H2O2 content increases from 1% to 2%. Moreover, the deformation degree of pores and pore sizes highly depends on pore structure parameters, which mainly include roundness, average perimeter and diameter, and so on. Roundness can be calculated by the following equation [45]:
Roundness = ( Perimeter ) 2 4 π ( Area )
where perimeter and area of pores can be obtained by image processing and analysis.
In order to compare the difference between automatic image analysis and experimental characterization of porosity, the porosity of the porous coal gangue-based geopolymer is calculated by the following formula:
ε = 1 ρ d r y ρ s o l i d
where ε is porosity, ρ d r y represents the dry density of the porous coal gangue-based geopolymer and ρ s o l i d represents the dry density of the coal gangue-based geopolymer.
Table 6 lists pore structure parameters, diameter distribution, porosity of quantitative pore structure analysis by automatic image analysis and total porosity calculated by the above formula, as well as compressive strength of porous coal gangue-based geopolymers at different H2O2 contents.
According to Table 6, it can be found that, although the porosities obtained by the image analysis are all smaller than those obtained by the formula calculation, with the increase in H2O2 content, the differences between the two gradually decrease. The reason for this is that image analysis mainly analyzes large pores, and when the H2O2 content increases, the number of large pores in the coal gangue-based geopolymer increases; thus, the accuracy of the image analysis is improved.
Moreover, Table 6 demonstrates that with the increase in H2O2 content, roundness, perimeter, diameter and porosity of the porous geopolymer are increased greatly. Because roundness represents the deformation degree of a pore, when its value is close to 1, the shape of a pore maintains a round appearance instead of deforming [15]. Table 6 shows that the coal gangue-based geopolymer with 3% H2O2 content has the most uniform shape of pores, followed by 2% and 1% H2O2 content, respectively. In Table 6, the diameter distribution indicates that most of the pores appear in the diameter range of 60 to 680 μm when the geopolymer has 1% H2O2 content. As the amount of H2O2 increases to 2%, the pore sizes are mainly distributed in the range of 80–610 μm. The sample with 3% H2O2 content has the pore size distribution between 120 and 600 μm. The above analysis indicates that porous geopolymers with low H2O2 content have wider pore size distribution than specimens with a high amount of H2O2. In general, with the increase in the foaming agent, the number of small pores decreases, and the number of pores with a large size increases, which results in the diameter distribution of pores being more concentrated in the range of large sizes.
Furthermore, Table 6 indicates the change of the foaming geopolymer strength induced by the variation of pore parameters. It can be obviously seen that an increase in the average perimeter and average diameter leads to a rise in porosity from 0% to 67.23%. When the geopolymer is without porosity, the 7 d compressive strength and 28 d compressive strength are 56.6 MPa and 57.4 MPa, respectively. When the geopolymer has 1% H2O2, the porosity increases to 30.16%, which results in the 7 d and 28 d compressive strength of the porous geopolymer to dramatically decrease to 11.3 MPa and 13.2 MPa, respectively. As the content of H2O2 continues to increase, the compressive strength keeps decreasing. However, the downward trend gradually slows down. When the geopolymer has 3% H2O2, the 7 d and 28 d compressive strength are 2.9 MPa and 4.1 MPa, respectively. The change of porosity is caused by pore parameters such as roundness, average perimeter and average diameter, which is main reason for the decrease in compressive strength [14].
In addition, pore structure parameters and pore size distribution can characterize the foaming homogeneity of the geopolymer. Table 6 reveals that the foaming homogeneity highly relies on the amount of H2O2 used in the preparation of a porous coal gangue-based geopolymer. With the increase in H2O2, foaming homogeneity is improved, and pore structure in the geopolymer become stable. This can be used to explain why the rate of compressive strength decreases with the increase in H2O2 content.

4. Conclusions

In this study, the combination method of RSM and automatic image analysis was innovatively proposed to optimize the preparation of a porous coal gangue-based geopolymer and quantitatively analyze its pore structure. It could be a novel approach for developing a porous coal gangue-based geopolymer with outstanding properties. The main conclusions are as follows:
RSM analysis shows that H2O2 content has the greatest influence on the porous coal gangue-based geopolymer, followed by the liquid-to-solid ratio, curing temperature and CMC content. The results also demonstrate that the interaction of the H2O2 content and the liquid-to-solid ratio has a significant effect on the compressive strength of the porous coal gangue-based geopolymer.
Automatic image analysis could be applied to quantitatively describe the pore structure characteristics of the porous coal gangue-based geopolymer. The reason for the difference between automatic image analysis and experimental results is that automatic image analysis cannot obtain micropore information of the porous coal gangue-based geopolymer very well; thus, the total porosity is less than that found by the experimental results. However, when the content of H2O2 increases, the accuracy of the image analysis is improved.
Quantitative pore structure analysis indicates that with the increase in H2O2 content, the number of small-sized pores decreases in the porous coal gangue-based geopolymer, while the number of macropores increased continuously. Although the pore number reduced, both pore size and pore shape became more uniform and regular. Pore size distribution shows that a porous coal gangue-based geopolymer with higher H2O2 content could have a more concentrated diameter distribution. Furthermore, with the increase in H2O2 content, the porosity of porous coal gangue-based geopolymer increases simultaneously. This is the main reason why the compressive strength of porous coal gangue-based geopolymer decreases greatly.

Author Contributions

Conceptualization, Writing and Supervision, R.W.; Methodology, J.W. and Q.S.; Formal analysis, R.W. and Q.S. All authors have read and agreed to the published version of the manuscript.

Funding

This study was supported by National Natural Science Foundation of China (No. 42207075).

Data Availability Statement

Some or all data and models that support the findings of this study are available from the corresponding author upon reasonable request.

Acknowledgments

The authors wish to acknowledge the financial support of National Natural Science Foundation of China (No. 42207075).

Conflicts of Interest

The authors declare no conflict of interest.

References

  1. Zhang, Z.; Provis, J.L.; Reid, A.; Wang, H. Geopolymer foam concrete: An emerging material for sustainable construction. Constr. Build. Mater. 2014, 56, 113–127. [Google Scholar] [CrossRef]
  2. Zhang, L.; Zhang, F.; Liu, M.; Hu, X. Novel sustainable geopolymer based syntactic foams: An eco-friendly alternative to polymer based syntactic foams. Chem. Eng. J. 2017, 313, 74–82. [Google Scholar] [CrossRef]
  3. Colombo, P.; Formia, A.; Antonaci, P.; Brini, S.; Tulliani, J.-M. Geopolymer technology for application-oriented dense and lightened materials. Elaboration and characterization. Ceram. Int. 2015, 41, 12967–12979. [Google Scholar]
  4. Davidovits, J. Geopolymers:Inorganic polymeric new materials. J. Therm. Anal. 1991, 37, 1633–1656. [Google Scholar] [CrossRef]
  5. Wan, Q.; Rao, F.; Song, S.; García, R.E.; Estrella, R.M.; Patiño, C.L.; Zhang, Y. Geopolymerization reaction, microstructure and simulation of metakaolin-based geopolymers at extended Si/Al ratios. Cem. Concr. Compos. 2017, 79, 45–52. [Google Scholar] [CrossRef]
  6. Rashidian-Dezfouli, H.; Rangaraju, P.R. Comparison of strength and durability characteristics of a geopolymer produced from fly ash, ground glass fiber and glass powder. Mater. Constr. 2017, 67, e136. [Google Scholar] [CrossRef] [Green Version]
  7. Ye, N.; Yang, J.; Liang, S.; Hu, Y.; Hu, J.; Xiao, B.; Huang, Q. Synthesis and strength optimization of one-part geopolymer based on red mud. Constr. Build. Mater. 2016, 111, 317–325. [Google Scholar] [CrossRef]
  8. Hassan, H.S.; Abdel-Gawwad, H.A.; Vásquez García, S.R.; Israde-Alcántara, I. Fabrication and characterization of thermally-insulating coconut ash-based geopolymer foam. Waste Manag. 2018, 80, 235–240. [Google Scholar] [CrossRef]
  9. Panda, B.; Paul, S.C.; Hui, L.; Tay, Y.W.D.; Tan, M.J. Additive manufacturing of geopolymer for sustainable built environment. J. Clean. Prod. 2017, 167, 281–288. [Google Scholar] [CrossRef]
  10. Graytee, A.; Sanjayan, J.G.; Nazari, A. Development of a high strength fly ash-based geopolymer in short time by using microwave curing. Ceram. Int. 2018, 44, 8216–8222. [Google Scholar] [CrossRef]
  11. Hlaváček, P.; Šmilauer, V.; Škvára, F.; Kopecký, L.; Šulc, R. Inorganic foams made from alkali-activated fly ash: Mechanical, chemical and physical properties. J. Eur. Ceram. Soc. 2015, 35, 703–709. [Google Scholar] [CrossRef]
  12. Davidovits, J. Geopolymer Chemistry and Applications; Institut Géopolymère: Saint-Quentin, France, 2008. [Google Scholar]
  13. Chindaprasirt, P.; Silva, P.; Sagoe-Crentsil, K.; Hanjitsuwan, S. Effect of SiO2 and Al2O3 on the setting and hardening of high calcium fly ash-based geopolymer systems. J. Mater. Sci. 2012, 47, 4876–4883. [Google Scholar] [CrossRef]
  14. Bai, C.; Colombo, P. High-porosity geopolymer membrane supports by peroxide route with the addition of egg white as surfactant. Ceram. Int. 2017, 43, 2267–2273. [Google Scholar] [CrossRef]
  15. Hajimohammadi, A.; Ngo, T.; Mendis, P.; Sanjayan, J. Regulating the chemical foaming reaction to control the porosity of geopolymer foams. Mater. Des. 2017, 120, 255–265. [Google Scholar] [CrossRef]
  16. Medpelli, D.; Seo, J.M.; Seo, D.K. Geopolymer with hierarchically meso-/macroporous structures from reactive emulsion templating. J. Am. Ceram. Soc. 2014, 97, 70–73. [Google Scholar] [CrossRef]
  17. Papa, E.; Medri, V.; Benito, P.; Vaccari, A.; Bugani, S.; Jaroszewicz, J.; Landi, E. Insights into the macroporosity of freeze-cast hierarchical geopolymers. RSC Adv. 2016, 6, 24635–24644. [Google Scholar] [CrossRef]
  18. Liew, Y.M.; Heah, C.Y.; Al Bakri, M.M.; Hussin, K. Structure and properties of clay-based geopolymer cements: A review. Prog. Mater. Sci. 2016, 83, 595–629. [Google Scholar] [CrossRef]
  19. Aguilar, R.A.; Díaz, O.B.; García, J.I.E. Lightweight concretes of activated metakaolin-fly ash binders, with blast furnace slag aggregates. Constr. Build. Mater. 2010, 24, 1166–1175. [Google Scholar] [CrossRef]
  20. Tang, Q.; Ge, Y.; Wang, K.; He, Y.; Cui, X.-M. Preparation and characterization of porous metakaolin-based inorganic polymer spheres as an adsorbent. Mater. Des. 2015, 88, 1244–1249. [Google Scholar] [CrossRef]
  21. Ge, Y.; Cui, X.; Kong, Y.; Li, Z.; He, Y.; Zhou, Q. Porous geopolymeric spheres for removal of Cu(II) from aqueous solution: Synthesis and evaluation. J. Hazard. Mater. 2015, 283, 244–251. [Google Scholar] [CrossRef]
  22. Siyal, A.; Shamsuddin, M.; Khan, M.; Rabat, N.E.; Zulfiqar, M.; Man, Z.; Siame, J.; Azizli, K.A. A review on geopolymers as emerging materials for the adsorption of heavy metals and dyes. J. Environ. Manag. 2018, 224, 327–339. [Google Scholar] [CrossRef] [PubMed]
  23. Han, J.; Ying, H.; Guo, M.; Zhao, P.; Liu, Q.; Liu, C.; Song, C.; Ji, N.; Lu, X.; Ma, D.; et al. Synthesis of zeolite SSZ-13 from coal gangue via ultrasonic pretreatment combined with hydrothermal growth method. Ultrason. Sonochem. 2019, 59, 104703. [Google Scholar] [CrossRef] [PubMed]
  24. Zhou, M.; Dou, Y.; Zhang, Y.; Zhang, Y.; Zhang, B. Effects of the variety and content of coal gangue coarse aggregate on the mechanical properties of concrete. Constr. Build. Mater. 2019, 220, 386–395. [Google Scholar] [CrossRef]
  25. Long, J.; Zhang, S.; Luo, K. Selenium in Chinese coal gangue: Distribution, availability, and recommendations. Resour. Conserv. Recycl. 2019, 149, 140–150. [Google Scholar] [CrossRef]
  26. Gao, Y.; Huang, H.; Tang, W.; Liu, X.; Yang, X.; Zhang, J. Preparation and characterization of a novel porous silicate material from coal gangue. Microporous Mesoporous Mater. 2015, 217, 210–218. [Google Scholar] [CrossRef]
  27. Moghadam, M.J.; Ajalloeian, R.; Hajiannia, A. Preparation and application of alkali-activated materials based on waste glass and coal gangue: A review. Constr. Build. Mater. 2019, 221, 84–98. [Google Scholar] [CrossRef]
  28. Heah, C.Y.; Kamarudin, H.; Bakri, A.; Bnhussain, M.; Luqman, M.; Nizar, I.K.; Ruzaidi, C.M.; Liew, Y.M. Study on solids-to-liquid and alkaline activator ratios on kaolin-based geopolymers. Constr. Build. Mater. 2012, 35, 912–922. [Google Scholar] [CrossRef]
  29. Xu, F.; Deng, X.; Peng, C.; Zhu, J.; Chen, J. Mix design and flexural toughness of PVA fiber reinforced fly ash-geopolymer composites. Constr. Build. Mater. 2017, 150, 179–189. [Google Scholar] [CrossRef]
  30. Belmokhtar, N.; El Ayadi, H.; Ammari, M.; Allal, L.B. Effect of structural and textural properties of a ceramic industrial sludge and kaolin on the hardened geopolymer properties. Appl. Clay Sci. 2018, 162, 1–9. [Google Scholar] [CrossRef]
  31. Borges, P.H.R.; Banthia, N.; Alcamand, H.; Vasconcelos, W.L.; Nunes, E.H.M. Performance of blended metakaolin/blastfurnace slag alkali-activated mortars. Cem. Concr. Compos. 2016, 71, 42–52. [Google Scholar] [CrossRef]
  32. Wang, L.; Huang, Y.; Zhao, F.; Huo, T.; Chen, E.; Tang, S. Comparison between the influence of finely ground phosphorous slag and fly ash on frost resistance, pore structures and fractal features of hydraulic concrete. Fractal Fract. 2022, 6, 598. [Google Scholar] [CrossRef]
  33. Huang, J.; Li, W.; Huang, D.; Wang, L.; Chen, E.; Wu, C.; Wang, B.; Deng, H.; Tang, S.; Shi, Y.; et al. Fractal analysis on pore structure and hydration of magnesium oxysulfate cements by First Principle, thermodynamic and microstructure-based methods. Fractal Fract. 2021, 5, 164. [Google Scholar] [CrossRef]
  34. Peng, Y.; Tang, S.; Huang, J.; Tang, C.; Wang, L.; Liu, Y. Fractal analysis on pore structure and modeling of hydration of magnesium phosphate cement paste. Fractal Fract. 2022, 6, 337. [Google Scholar] [CrossRef]
  35. Xu, F.; Gu, G.; Zhang, W.; Wang, H.; Huang, X.; Zhu, J. Pore structure analysis and properties evaluations of fly ash-based geopolymer foams by chemical foaming method. Ceram. Int. 2018, 44, 19989–19997. [Google Scholar] [CrossRef]
  36. Shao, N.; Zhang, Y.; Liu, Z.; Wang, D.-M.; Zhang, Z.-T. Fabrication of hollow microspheres filled fly ash based foam geopolymers with ultra-low thermal conductivity and relative high strength. Constr. Build. Mater. 2018, 185, 567–573. [Google Scholar] [CrossRef]
  37. Cai, L.; Wang, H.; Fu, Y. Freeze-thaw resistance of alkali-slag concrete based on response surface methodology. Constr. Build. Mater. 2013, 49, 70–76. [Google Scholar] [CrossRef]
  38. Zahid, M.; Shafiq, N.; Isa, M.H.; Gil, L. Statistical modeling and mix design optimization of fly ash based engineered geopolymer composite using response surface methodology. J. Clean. Prod. 2018, 194, 483–498. [Google Scholar] [CrossRef]
  39. Gao, Y.; Xu, J.; Luo, X.; Zhu, J.; Nie, L. Experiment research on mix design and early mechanical performance of alkali-activated slag using response surface methodology (RSM). Ceram. Int. 2016, 42, 11666–11673. [Google Scholar] [CrossRef]
  40. Li, Z.; Lu, D.; Gao, X. Optimization of mixture proportions by statistical experimental design using response surface method—A review. J. Build. Eng. 2020, 36, 102101. [Google Scholar] [CrossRef]
  41. Subasi, A.; Sahin, B.; Kaymaz, I. Multi-objective optimization of a honeycomb heat sink using Response Surface Method. Int. J. Heat Mass Transf. 2016, 101, 295–302. [Google Scholar] [CrossRef]
  42. He, P.; Zhang, Y.; Chen, H.; Liu, L.C. Development of an eco-efficient CaMoO4/electroconductive geopolymer composite for recycling silicomanganese slag and degradation of dye wastewater. J. Clean. Prod. 2019, 208, 1476–1487. [Google Scholar] [CrossRef]
  43. Wang, R.; Wang, J.; Song, Q. The effect of Na+ and H2O on structural and mechanical properties of coal gangue-based geopolymer: Molecular dynamics simulation and experimental study. Constr. Build. Mater. 2020, 268, 121081. [Google Scholar] [CrossRef]
  44. Bourret, J.; Prud’homme, E.; Rossignol, S.; Smith, D.S. Thermal conductivity of geomaterial foams based on silica fume. J. Mater. Sci. 2012, 47, 391–396. [Google Scholar] [CrossRef]
  45. Nambiar, E.; Ramamurthy, K. Air-void characterisation of foam concrete. Cem. Concr. Res. 2007, 37, 221–230. [Google Scholar] [CrossRef]
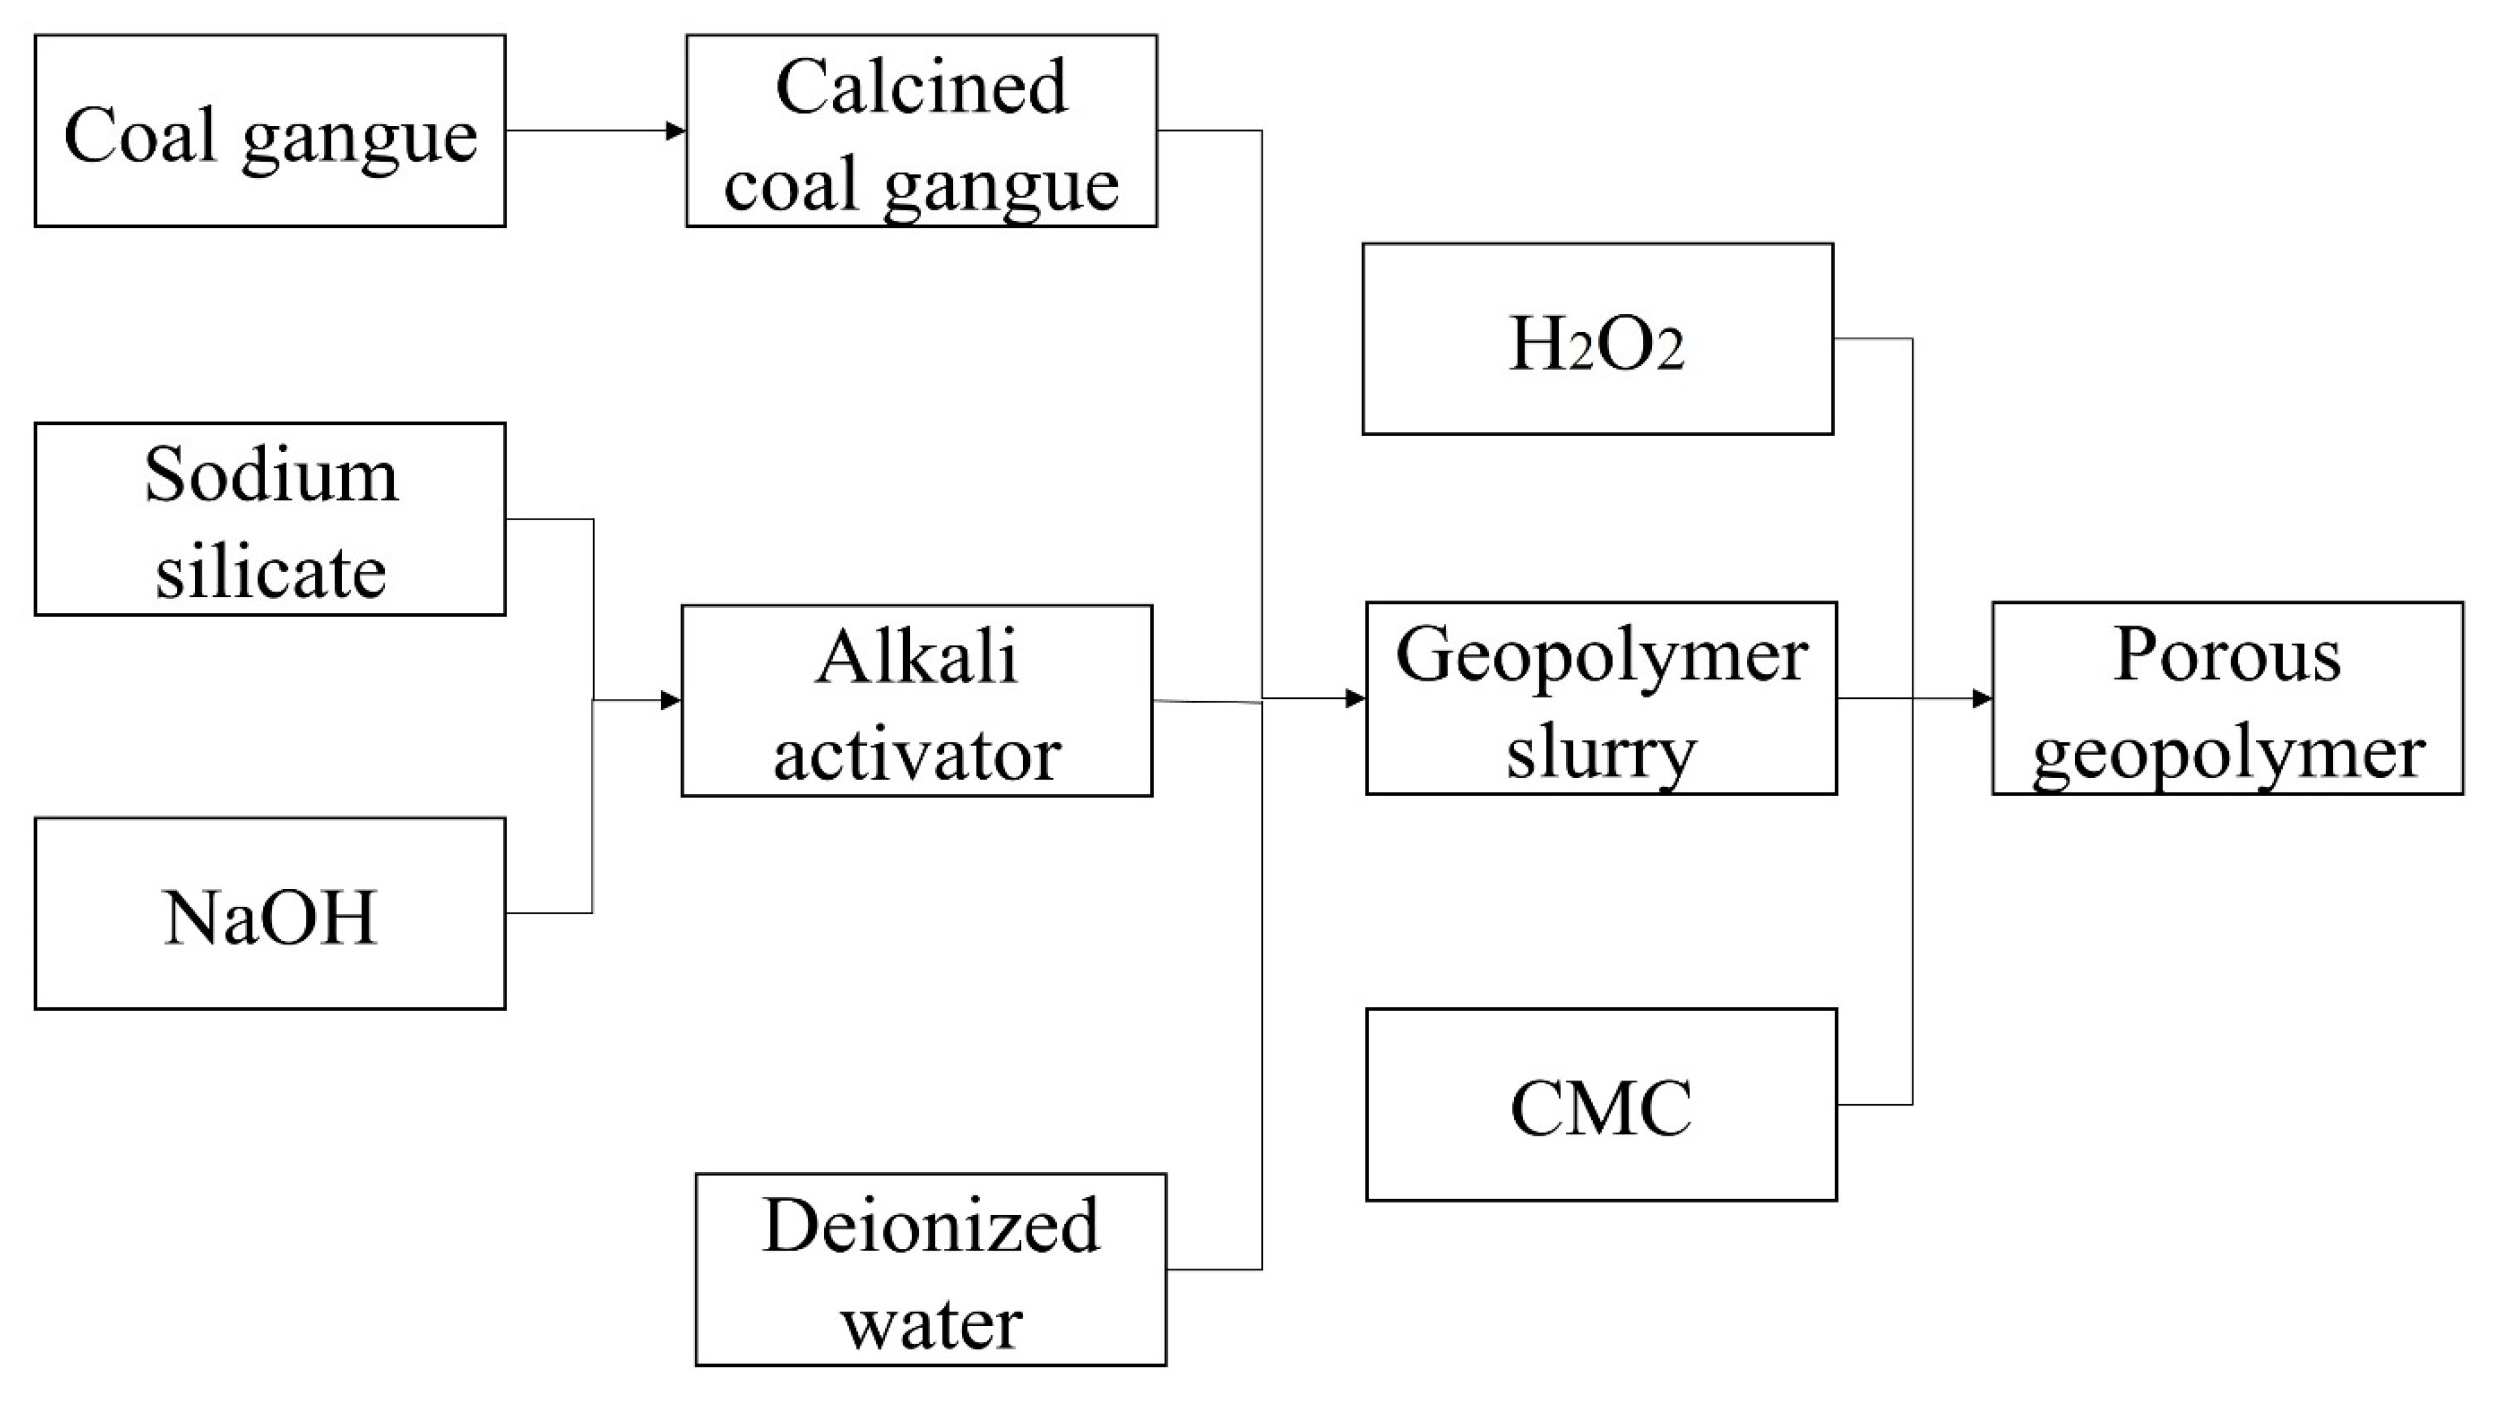
Figure 1. Preparation procedure of the porous geopolymer.
Buildings 12 02079 g001
Figure 2. XRD pattern of coal gangue before and after calcination at 800 °C.
Buildings 12 02079 g002
Figure 3. Interaction impact of the liquid-to-solid ratio and H2O2 on 7 d and 28 d compressive strength.
Buildings 12 02079 g003
Figure 4. XRD of sample with the highest 28 d compressive strength in the RSM experiment.
Buildings 12 02079 g004
Figure 5. SEM images for porous geopolymers at different contents of H2O2.
Buildings 12 02079 g005
Figure 6. Enhanced SEM images for porous geopolymers with different H2O2 content.
Buildings 12 02079 g006
Figure 7. Pore recognition results for geopolymers with different H2O2 contents.
Buildings 12 02079 g007
Table 1. Factors and Levels of RSM.
FactorCodeLevel of Code
−101
H2O2 contentA1%2%3%
Curing temperatureB203040
CMC contentC1%1.5%2%
Liquid-to-solid ratioD0.850.90.95
Table 2. Chemical composition of calcined coal gangue.
CompositionSiO2Al2O3Na2OMgOP2O5K2OSO3TiO2CaOFe2O3
Calcined gangue53.415%42.292%0.163%0.214%0.049%0.893%0.229%1.328%0.343%1.067%
Table 3. RSM experiment design and experiment results.
Experiment
Number
FactorCompressive Strength/MPa
H2O2 ContentCuring TemperatureCMC ContentLiquid-to-Solid Ratio7 d28 d
10−1105.87.0
2−110010.712.1
300005.67.2
4100−12.94.1
51−1002.12.9
611002.63.2
7010−17.08.2
8−100−111.313.2
910011.82.4
100−10−16.38.2
11001−17.28.8
1200005.67.2
130−1−105.46.9
1400005.67.2
15−101011.012.3
1601014.14.8
1710−102.43.0
1800−1−16.28.5
1900−113.84.5
200−1014.04.3
21−1−10010.311.2
2201107.57.9
23−10−1010.211.9
2401−106.97.5
2500005.67.2
2600113.75.2
27−10017.28.6
2810102.83.5
2900005.67.2
Table 4. Compressive strength model of porous geopolymer at 7 d and 28 d curing age.
ModelEquationR2Adjusted R2F Valuep Value
Compressive strength (7 d)5.60 − 3.84A + 0.4083B + 0.2583C − 1.36D + 0.0250AB − 0.1000AC + 0.7500AD + 0.0500BC − 0.1500BD − 0.2750CD + 0.6458A2 +
0.3208B2 + 0.3458C2 − 0.5792D2
0.98950.979094.23<0.0001
Compressive strength (28 d)7.20 − 4.18A + 0.2667B + 0.2000C − 1.77D − 0.1500AB + 0.0250AC + 0.7250AD + 0.0750BC + 0.1250BD + 0.1000CD + 0.3583A2 − 0.1667B2 + 0.1833C2 − 0.5917D20.99480.9895190.11<0.0001
Table 5. Regression analysis for compressive strength of geopolymer at different curing ages.
FactorCompressive Strength (7 d)Compressive Strength (28 d)
F Valuep ValueF Valuep Value
A1101.96<0.00012188.62<0.0001
B12.450.00338.890.0099
C4.980.04245.000.0421
D137.77<0.0001390.33<0.0001
AB0.01560.90250.93800.3492
AC0.24890.62560.02610.8741
AD140.002221.910.0004
BC0.06220.80660.23450.6357
BD0.56000.46660.65140.4331
CD1.880.19170.41690.5289
A216.830.00118.680.0106
B24.150.06091.880.1922
C24.830.04532.270.1539
D213.540.002523.670.0003
Table 6. Quantitative pore structure analysis information, calculated porosity and compressive strength at different amounts of H2O2.
H2O20%1%2%3%
Roundness-0.810.871.09
Average perimeter (μm)-1200.371470.661710.18
Average diameter (μm)-320.83410.78540.62
Diameter distribution(μm)-60–68080–610120–600
Porosity (image analysis)-30.16%51.36%67.23%
Porosity (experimental result)-41.12%60.46%75.97%
7 d compressive strength (MPa)56.611.34.52.9
28 d compressive strength (MPa)57.413.26.84.1
Publisher’s Note: MDPI stays neutral with regard to jurisdictional claims in published maps and institutional affiliations.