Article

Effect of the Openings on the Seismic Response of an Infilled Reinforced Concrete Structure

1
CERIS, Instituto Superior Técnico, Universidade de Lisboa, Av. Rovisco Pais 1, 1049-001 Lisboa, Portugal
2
RISCO, University of Aveiro, 3810-193 Aveiro, Portugal
3
CONSTRUCT-LESE, Faculdade de Engenharia, Universidade do Porto, 4200-465 Porto, Portugal
*
Author to whom correspondence should be addressed.
Buildings 2022, 12(11), 2020; https://doi.org/10.3390/buildings12112020
Submission received: 27 September 2022 / Revised: 27 October 2022 / Accepted: 14 November 2022 / Published: 18 November 2022
(This article belongs to the Section Building Structures)

Abstract

:
The seismic behavior of the infill masonry infill walls has a significant impact on the global response of reinforced concrete frame structures. One factor influencing its behavior is the existence of openings in the walls, such as doors and windows, which are crucial for the infill seismic performance. Although the numerical simulation of the seismic behavior of RC buildings with infill walls has evolved significantly in recent years in terms of micro- and macro-modelling, most of the existing studies are only related to infill walls without openings. Based on this motivation, four main objectives were defined for this research work: (i) present a simplified modeling approach and its calibration to simulate the seismic behavior of infill walls with central openings such as windows; (ii) evaluate the impact of the openings on the global seismic response of an RC building; (iii) study the impact of the irregular distribution of the infill walls (vertical and in-plane) on the global seismic response of an RC building; and (iv) study the impact of the central openings ratio (i.e., relative percentage between opening and infill wall area) on the global seismic response of an RC building structure. A four-story infilled RC building was used as a case study to perform parametric analyses investigating the impact of the masonry infill walls’ irregular distribution (vertical and in-plan) and their openings ratio. The results are discussed in terms of natural frequencies and vibration modes, initial lateral stiffness, and maximum lateral resistance. This study found that the openings caused a reduction in the natural frequencies of about 20% compared with the full infill (without openings). The openings did not modify the vibration modes. In addition, the openings reduced the initial stiffness by about 20% compared with the model without openings. The maximum strength increased about 50% with the infill walls, but this was reduced by the openings by 20%.

1. Introduction

1.1. Motivation and Literature Review

The southern European building stock has a large percentage of reinforced concrete (RC) frame structures, with or without shear RC walls (i.e., cores of stairwells and elevators, or others), filled with masonry infill walls made of clay bricks or lightweight concrete blocks. Until relatively recently, it was commonly accepted by the technical and scientific community, in the design stage, that the contribution of those panels concerning the building’s lateral stiffness and strength could be neglected. Only self-weight (i.e., dead loads) was considered during this process. Some of the existing seismic and structural codes, such as the current version of Eurocode 8 [1], do not provide any specification concerning the lateral effect of the infill walls on the global response of the building in the case of an earthquake.
There was also the idea that this assumption would increase the structure’s safety, particularly in the case of seismic analysis. There was an expectation that the infill panels can increase the load capacity of the buildings and consequently increase the global safety factor of the structure. More recently, and supported by evidence from post-earthquake scenarios, the codes started to suggest including the participation of the masonry infill walls in the global structural response.
Recent earthquakes have highlighted the importance of assessing the seismic vulnerability of the infilled RC structures considering the walls’ impact [2,3]. Their interaction with the RC elements and their poor seismic behavior (both in-plane and out-of-plane) was the cause of a significant portion of the casualties, structural damages, and collapses and economic losses [4].
Multiple studies stressed that the presence of the infill walls causes the modification of the RC buildings’ seismic response. Namely, it increases the lateral stiffness and strength and decreases the structure’s natural period, which may cause a rise in the expected seismic loadings [5,6]. In addition, the infill walls can contribute significantly to dissipating energy during an earthquake by the friction mobilized between cracks while maintaining their integrity. Moreover, the infill walls can introduce horizontal or vertical stiffness irregularities that can potentiate the development of different failure mechanisms [7,8]. For example, soft-story or short-column mechanisms were often observed in the earthquakes of Nepal and Mexico [9,10,11].
The contribution of the infill masonry to the building’s seismic performance may be favorable, depending on a series of phenomena, detailing aspects, and mechanical properties, such as the relative stiffness and strength, disposition of the walls (in-height and in-plan), workmanship, and openings [12,13].
The existence of openings such as windows and doors is an unavoidable issue in the architecture of buildings. Otherwise, the construction itself would no longer make sense. Intuitively, when subjected to seismic loading, it is understood that the horizontal forces are transferred from the top to the base of the wall along its plane (i.e., in-plane). When creating an opening, this loading transference forces a deviation in its path, causing a stress accumulation in the region around the opening [14]. At this stage, the infill walls’ in-plane behavior depends on their geometry.
The uncertainty associated with assessing the seismic behavior of structures is exacerbated when openings in masonry walls are considered, given the variability in geometry and position they may have. In general, openings reduce the stiffness and ultimate strength of the panel, and the capacity to dissipate energy [15,16]. In addition, openings can accelerate the wall’s collapse under out-of-plane seismic loadings since the arching effect is not mobilized as effectively as in the case of walls without openings.
Another significant aspect concerns the modification of the wall cracking pattern. Generally, this is closely linked to the resulting failure mode, depending on the position and size of the openings. In the first stage of a seismic event, cracks can be developed in the corners of the opening. Only after that, do cracks develop towards the compressed corners of the panel, which favors its rupture by shear failure. Shear failure is most observed when there are openings [17].
Kakaletsis and Karayannis [18] concluded that infill walls, even with eccentric openings, can cause an increase in the lateral strength, ductility, and ability to dissipate energy. From the experimental tests, the authors found a strength reduction of between 18.7% and 25.2% for window-type openings with a width between 25–50% of the length of the panel. They also found a strength reduction between 32% and 47.2% for door-type openings with a width varying in the same range (25–50%). Later, Zhai, et al. [19] performed in-plane tests on four full-scale infilled RC specimens with different sizes of central openings (windows). They concluded that the infill walls were responsible for the cracking development observed in the RC elements for lower displacement demands. The energy dissipation increased by about 40% because of the walls, but the openings only caused an increase of around 33%.

1.2. Research Significance and Objectives

Despite the unanimous understanding concerning the effect of masonry infill walls on the global response of RC buildings under seismic actions, several issues still need further investigation and discussion. In particular, the numerical simulation of the openings and their impact on the seismic behavior of the infill walls, e.g., strength reduction, strength degradation, and stiffness reduction, is not well studied. For both design and assessment of RC structures, there is a need for practical recommendations concerning the simplified approaches to simulate the openings.
In addition, the impact of the infill walls’ dispositions (both in-height and in-plan) has not yet been fully investigated. Although the numerical simulation of the walls’ seismic behavior has evolved significantly over recent years in terms of micro- [20] and macro-modeling [21], the majority of the existing studies are only related to infill walls without openings or, in some cases, do not consider infill walls at all. Masonry infill walls and openings (in external envelopes and internal partition walls) are often present in RC building structures.
Based on this motivation, four main objectives were defined: (i) present and calibrate of a simplified modeling approach to simulate the seismic behavior of infill walls with openings; (ii) evaluate the impact of the openings on the global seismic response of an RC building structure; (iii) study the impact of the irregular distribution of the infill walls (vertical and in-plan) on the global seismic response of an RC building structure; and (iv) study the impact of the opening ratio (i.e., relative percentage between opening and infill wall area) on the global seismic response of an RC building structure.
The novelty of this research work is related to the presentation of a calibration procedure in a simplified approach to simulate masonry infill walls with central openings (i.e., central windows). The modeling procedure and assumptions are discussed, and the calibration is performed by simulating two full-scale in-plane tests of infilled RC frame specimens. In addition, the impact of the irregular distribution of the openings along the building envelope and the ratio of the openings on the global seismic response of an RC building structure is investigated. This investigation will allow an understanding that the openings should not be neglected in the seismic design and seismic safety assessment of RC structures.
For this purpose, this work starts with a description of the numerical modeling strategy adopted for simulating masonry wall panels (with and without openings). The details and assumptions concerning the consideration of the openings are presented and discussed. Then, this paper presents the calibration of the modeling strategy, which was performed by simulating two full-scale in-plane experimental tests of infilled RC frame specimens. The calibration results are discussed in terms of force–displacement curves and cumulative energy dissipation. After that, a four-story infilled RC building is used as a case study to perform a parametric analysis. The parametric study investigates the impact of the masonry infill walls’ irregular distribution (vertical and in-plan) and their openings ratio. The results are discussed in terms of natural frequencies and vibration modes, initial lateral stiffness, and maximum lateral resistance.

2. Modeling Strategy and Calibration

This section aims to establish a strategy for numerical simulation of the seismic behavior of infilled RC frames with central openings, which was calibrated and validated with experimental results. The aim was to obtain an efficient model that is sufficiently rigorous and easy to apply in practice. The most relevant aspects of the numerical modeling are discussed, namely the materials simulation, the description of the hysteretic laws, and the assumptions on which the adopted modeling strategy is based. Then, this strategy was validated by simulating two in-plane full-scale tests. One of the tests was of an infilled RC frame, and the wall was built with hollow, horizontal brick units without openings. The second test used a similar RC frame but with a central opening (1150 × 1250 mm2). The experimental tests were conducted by Furtado et al. [22].

2.1. Description of the Numerical Modeling Strategy

The software used for simulating the seismic behavior of infilled RC frame structures was SeismoStruct [23]. This software can accurately reproduce the behavior of structures subjected to earthquake events. This software [23] allows the simulation of 2D and 3D frame models and the geometric and material nonlinearities. The software library contains several types of elements and material models that can be used to simulate infilled RC building structures.
For the present study, it was defined that the RC elements (i.e., beams and columns) were simulated through nonlinear force-based plastic beam–column element models. The advantages of this formulation are (i) the reduced computational time (since fiber integration is carried out for the two-member end sections only) and (ii) a complete control/calibration of the plastic hinge length (or spread of inelasticity), which allows local failures to be overcome [24]. Many models are available to capture the nonlinear material behavior of beam–column members, ranging from concentrated plasticity formulations to distributed plasticity formulations based on finite element methods. The former approach assumes that nonlinear behavior is concentrated, or lumped, at predetermined sections. The nonlinear behavior is assumed to be located at the center of the plastic hinge zone, which is generally located at each end of RC elements. The formulation adopted can be in terms of displacements or forces. The formulation based on forces presents better results in simulating the seismic behavior of RC elements.
For this study, it a force-based formulation with dumped plasticity was assumed. The plastic hinge length was assumed to be equal to the largest dimension of the RC cross-section, in agreement with the literature recommendations [25]. Moreover, each cross-section was discretized with 200 fibers to better represent the RC elements’ seismic response.
The Madas [26] proposal was adopted to simulate the uniaxial material models for simulating the concrete. This model follows the constitutive law proposed by Mander et al. [26]. The Menegotto–Pinto uniaxial material model [27] was adopted to capture the response of the reinforcing steel material in these analyses.
The modeling strategy adopted to simulate the infill masonry walls consists of using the double-strut macro-equivalent model proposed by Crisafulli [28]. This model was later calibrated by Smyrou et al. [29] for walls without openings. Six diagonal strut elements comprise the model, i.e., two parallel struts to carry axial loads across two opposite diagonal corners (Figure 1a), and a third strut to take the shear load from the top to the bottom of the panel (Figure 1b). The uniaxial material model adopted for the struts under axial load is presented in Figure 1a. A bilinear curve was adopted for the strut subjected to shear loadings (Figure 1b).

2.2. Calibration of the Modeling Strategy

2.2.1. Methodology

The calibration and validation of the modeling strategy were performed by simulating two lab tests performed by Furtado et al. [22]. The authors performed two in-plane tests of 2D, full-scale, infilled RC frames, one without openings (specimen Inf_12) and the other with a central opening (specimen Inf_14).
The geometric frame dimensions were defined as 4800 × 3300 m2 (length and width, respectively), representing those existing in the Portuguese building stock [30], and are shown in Figure 2. The specimen Inf_12 is a wall without openings, no strengthening, no reinforcement, and with no gaps in the wall–frame interface. The specimen Inf_14 was built with the same geometry and the remaining details. The only difference was the introduction of a central opening, of 1150 × 1250 mm2. The opening construction process was carried out according to typical construction practices. Moreover, an RC lintel on the top of the window was built, as shown in Figure 2. The cross-section of the RC lintel is 100 × 150 mm2. The longitudinal reinforcement used in the RC lintel comprises 3ø6 mm with a total length of 1650 mm.
The frame was designed for a medium-ductility class according to Eurocode 8 recommendations [1]. The columns’ cross-sections are 300 × 300 mm2 with longitudinal reinforcement of 4ø16 + 2ø12 and a transversal reinforcement of ø8//50 mm, along with the plastic regions, and ø8//150 mm in the remaining column extension. Concerning the beams, the cross-section is 300 × 500 mm2 with a longitudinal reinforcement of 5ø16 + 5ø16. The geometry and reinforcement detailing are shown in Figure 2.
Two infill panels were built with the same geometry and type of masonry unit (hollow clay horizontal brick units 150 mm thick). This masonry unit is usually found in Southern European countries. During the construction process, it was ensured that the panels were built aligned with the outer side of the RC frame.
The two specimens were subjected to in-plane tests. Each test consisted of applying a horizontal load with a hydraulic actuator (with a capacity of 500 kN and +/−150 mm stroke), as shown in Figure 3a. The in-plane load was applied at the top beam–column joint. The transmission of the horizontal force to the top beam was achieved using four high-strength rods (ø22 mm), tying two steel shapes at the top beam’s left and right extremities. This system allowed us to perform in-plane loading cycle reversals.
A steel reaction system was used as a reaction structure that supported the hydraulic actuator (Figure 3b). Both the RC frame specimen and reaction frame were fixed to the strong floor using prestressed steel bars to avoid sliding or overturning.
The loading protocol consisted of applying in-plane cyclic displacements (i.e., loading–unloading–reloading) at the top of the frame. The chosen nominal peak displacements of the frame top beam-column were 2.3 mm (drift equal to 0.1%), 4.6 mm (drift equal to 0.2%), and 6.9 mm (drift equal to 0.3%). These in-plane experimental tests are part of a research project investigating the out-of-plane seismic vulnerability of masonry infill walls. The main objective of these tests was to impose a low/medium level of damage caused by in-plane seismic loadings and perform an out-of-plane test up to the wall collapse. With this combined in-plane and out-of-plane test sequence, it was possible to investigate the effect of the previous damage caused by in-plane seismic loadings on the vulnerability of infill walls subjected to out-of-plane loading demands. Based on this motivation, the in-plane tests were not performed until the wall’s collapse. Only two half-cycles were repeated for each lateral deformation demand level.

2.2.2. Definition of the Modeling Parameters

The modeling of RC elements was performed using inelastic force-based plastic hinge frame elements, assuming a plastic-hinge length equal to the largest dimension of the RC cross-section, which was 500 mm [31,32].
The input parameters considered for defining the concrete uniaxial material model based on the Madas [26] proposal are compressive and tensile strength of 22 and 2.2 MPa, respectively. The concrete strain and elastic modulus were assumed as 3.5‰ and 22 GPa, respectively. The input parameters adopted for the uniaxial steel material model, using the Menegotto proposal [27], are: yielding stress of 526 MPa, elastic modulus 191 GPa, Ro equal to 20, a1 equal to 18.5, a2 equal to 0.15, a3 equal to 0.03 and a4 equal to 2. These input parameters were defined using the data results from the material characterization tests that are discussed in detail in [22].
The definition of the input material properties for defining the infill walls model was computed according to the recommendations of Crisafulli and Carr [33]. The parameters specified for the wall without opening were not affected by any reduction factor. However, in the case of the wall with a central opening, it is recommended to affect the value of the strut area and hence the panel’s stiffness, in proportion to the opening area. The opening percentage, in this case, was 15%, and it was verified that the most accurate simulation was obtained when it assumed a percentage of reduction of 20%. It should be underlined that the strategy suggested herein was only calibrated and validated for walls with central openings. The calibration and validation of reduction factors for walls with eccentric openings are needed.
Nevertheless, openings in infill panels constitute an important uncertainty in evaluating the behavior of infilled frames, which increases the importance of this research work. The input parameters used to simulate specimens Inf_12 and Inf_14 are presented in Table 1.

2.2.3. Validation of the Modeling Strategy

The validation of the strategy adopted to simulate the in-plane seismic behavior of infilled RC frames with and without openings is herein evaluated. The accuracy of the numerical approach adopted is discussed in terms of initial stiffness, maximum strength, and cumulative energy dissipation.
The force–displacement curve of the wall Inf_12 (without opening) is presented in Figure 4a. It can be observed that the numerical model captured well the initial specimen stiffness, with a difference of only −2.7%. For small displacements (i.e., up to 5 mm), the model captured the experimental response in both positive and negative loading branches relatively well. However, some minor differences can be noted for the last targe displacement concerning the maximum strength due to the wall strength degradation. A small strength drop in the numerical response can be seen in the positive loading branch. After that, the numerical response follows the experimental curve until reaching the same value of the peak load observed in the experimental curve. However, the maximum load reached by the numerical model was 255 kN, and it was reached for a top displacement of 6.9 mm, which is 11% higher than the experimental peak load (229.3 kN). In the negative loading direction, the opposite situation can be observed, i.e., the experimental peak load was 14% higher than the numerical response. First, it must be stated that the experimental force–displacement curve presents a slight asymmetry since, in the positive loading branch, the maximum strength was 229.3 kN, and in the negative loading branch was −266 kN. The authors could not find a visible explanation for this difference since the wall cracking pattern was similar in both loading directions. There was no visible sliding in the frame response, but the asymmetry may be linked with experimental issues that are not able to be captured by the numerical mode. Finally, the cumulative energy dissipation over the test presents a good match up to 6 mm, as shown in Figure 4b. The difference between the experimental and numerical response increases for displacements larger than 6 mm due to the asymmetry of the experimental response.
The simulation of the wall with openings, i.e., specimen Inf_14, approximates well the experimental response, as shown in Figure 5a. Again, the initial stiffness was well captured, proved by the minor difference of 2%. Once again, the results are somehow affected by the asymmetry observed in the experimental response. In the positive loading branch, the peak load of 134.5 kN was reached for a displacement of 8.3 mm. In the negative loading branch, the peak load of −152.6 kN was reached, 13.5% higher than that observed in the other loading branch. Therefore, the peak load reached by the numerical model was 18% and 3% higher than the experimental result in the positive and negative loading branches, respectively. The asymmetry of the experimental response curve can contribute to this difference, but it should underline the good global approximation of the numerical modeling. The same observation can be made in terms of cumulative energy dissipation, shown in Figure 5b, since the approximation is much better for low displacement demands and is not so good for displacements larger than 6 mm caused by the experimental asymmetry.

2.3. Preliminary Conclusions on Modeling Calibration
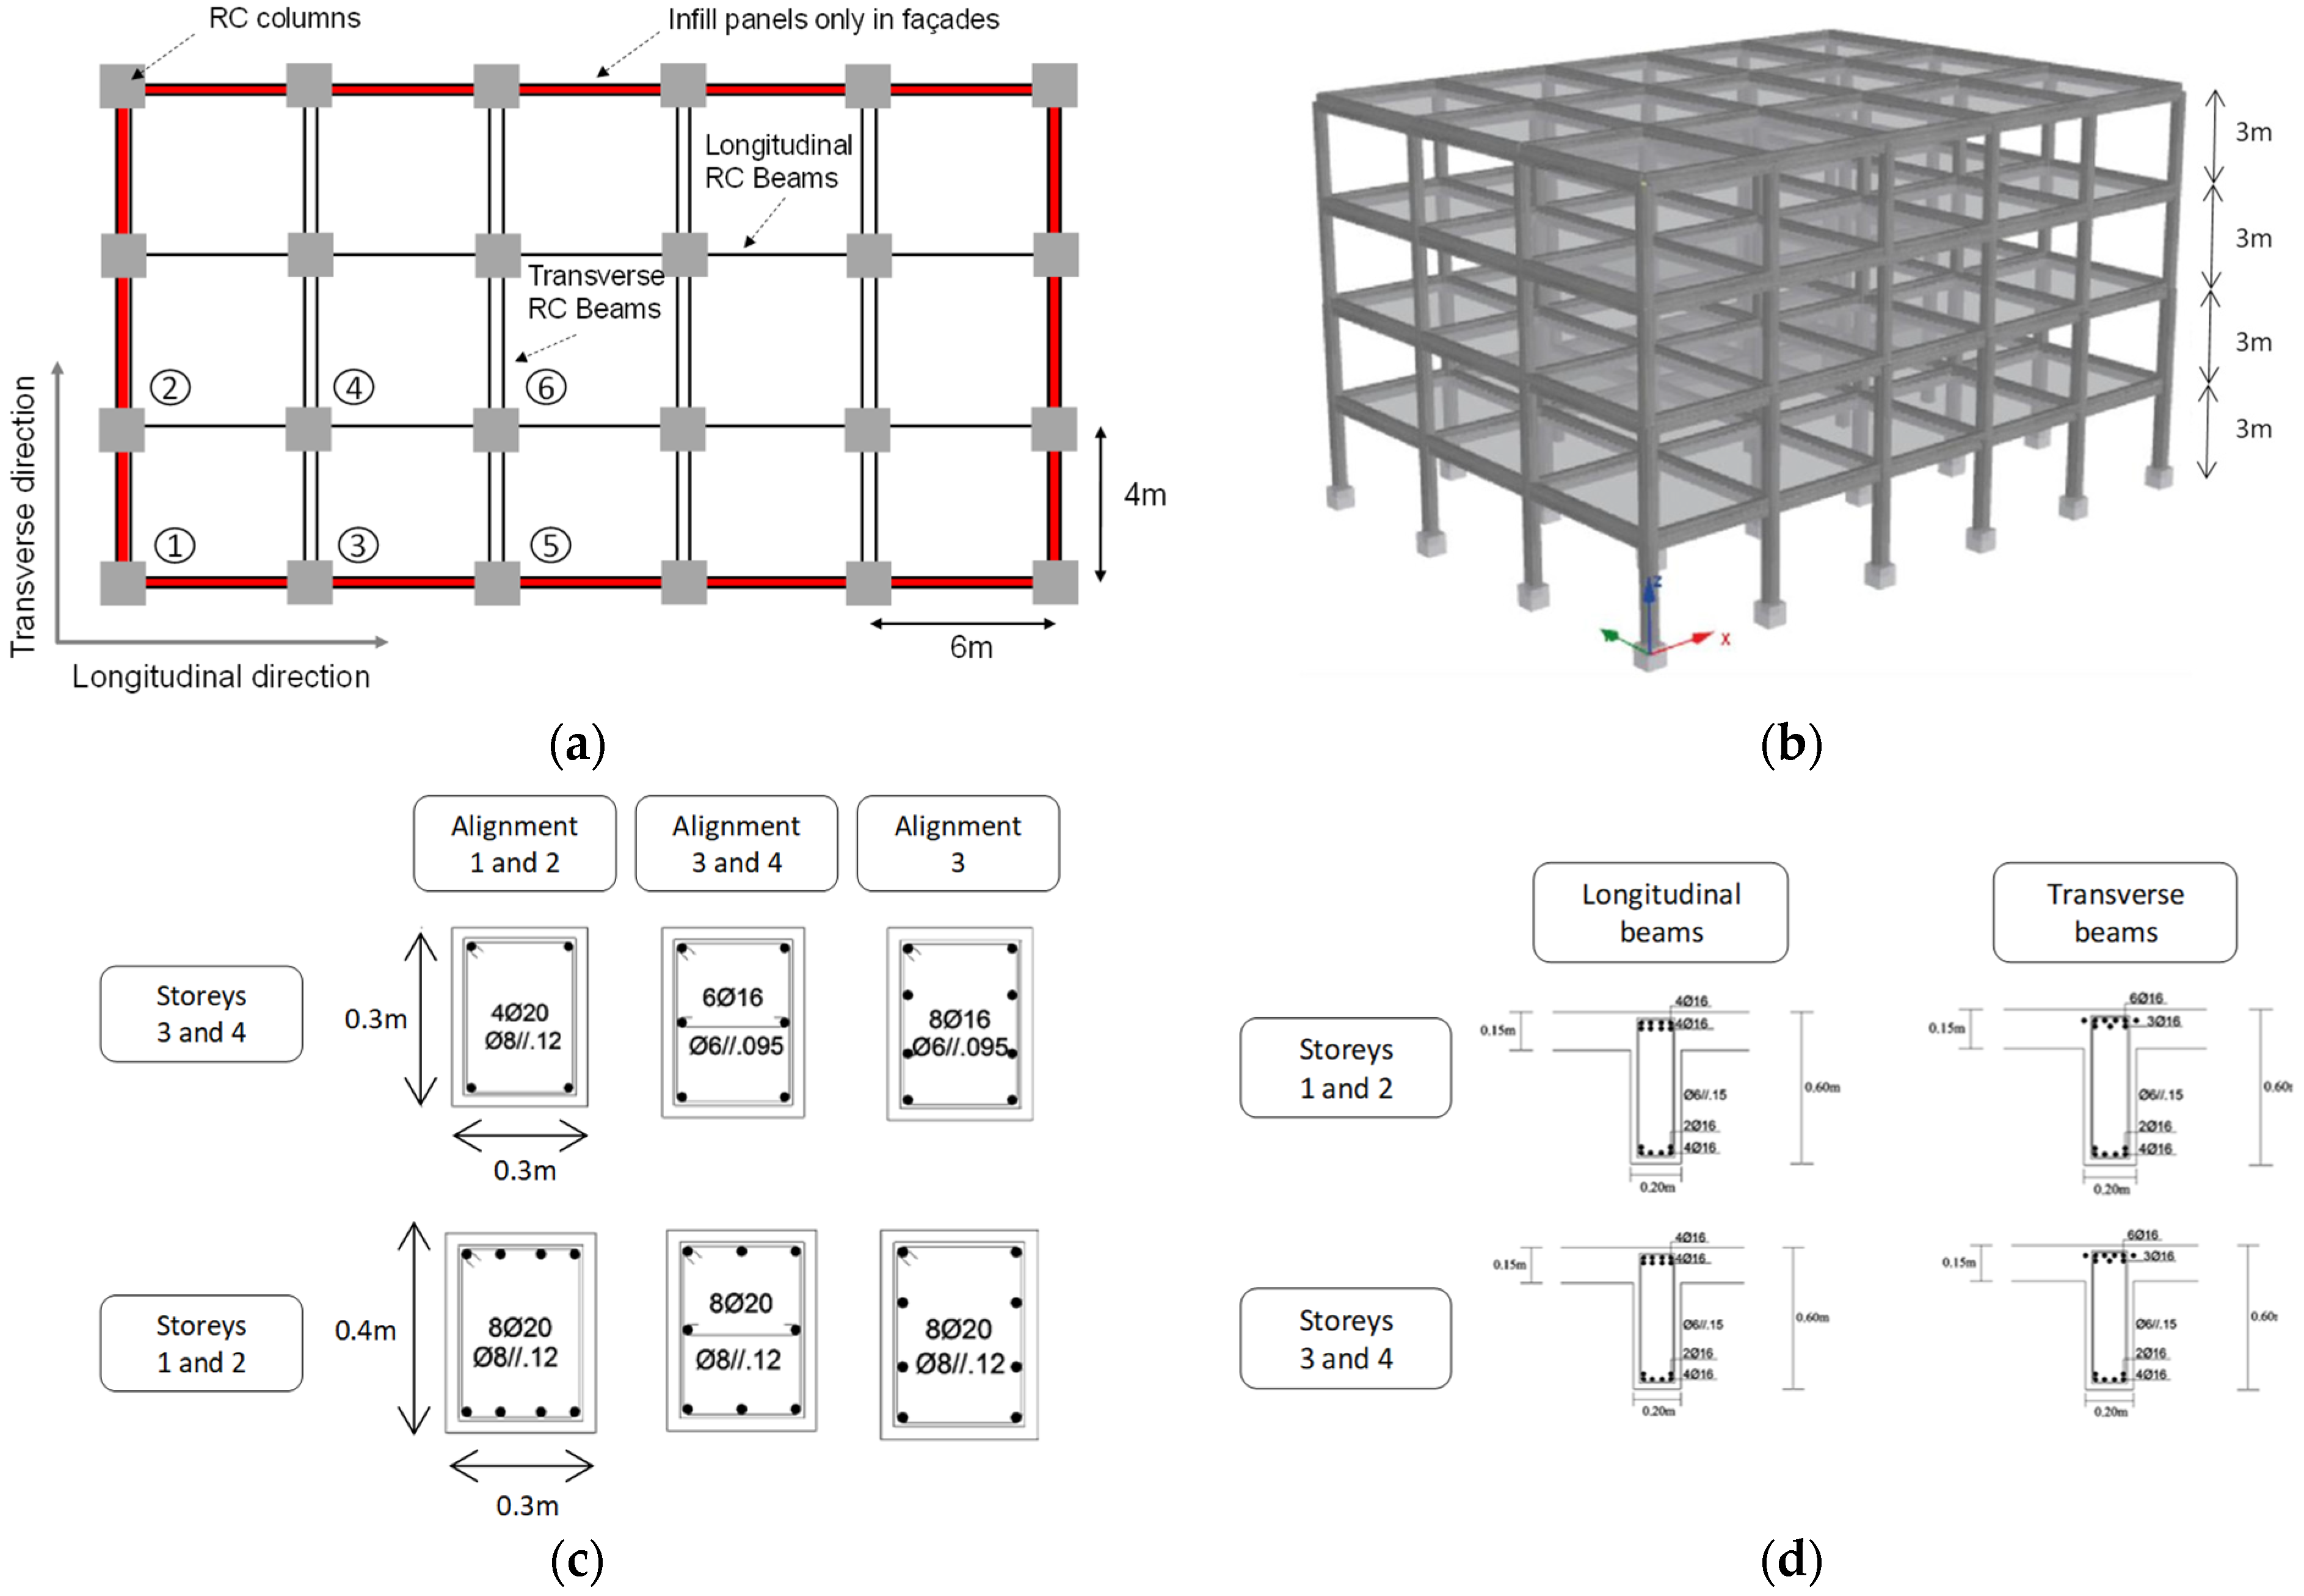
This section aims to present and validate the numerical modeling strategy to simulate the seismic behavior of infilled RC specimens with and without openings using simplified macro-models. Globally, a good agreement was found between the numerical prediction and the experimental response regarding initial stiffness and maximum strength. Some differences were noted concerning the cumulative energy dissipation due to the asymmetry observed in the experimental force–displacement curve. Future validations with other experimental data without asymmetry would be interesting to confirm the ability of this numerical modeling strategy.

3. Case Study

3.1. General Description

The building selected for this research work is a four-story RC structure designed by the Portuguese Civil Engineering Laboratory and is representative of the common RC structures that can be found in the Portuguese building stock [30] designed according to the Portuguese seismic code. The building has a frame-resisting system and is symmetric in both directions. The building plan is 20 × 15 m2 and has five bays, 6 m long, along the longitudinal direction and three bays, 5 m long, in its transverse direction, as shown in Figure 6a. The building inter-story height is 3 m, as shown in Figure 6b. The cross-section of the columns is: 400 × 300 mm2 (Stories 1 and 2) and 300 × 300 mm2 (Stories 3 and 4). The columns’ cross-section is presented in Figure 6c. All the beams have a rectangular section of 200 × 500 mm2, and their reinforcement detailing is shown in Figure 6d. The slab thickness was designed to be 150 mm thick.
The structure was designed without explicitly considering the infill walls’ presence, i.e., its own weight was only considered. The building’s structural design assumed a global vertical load of 6.15kN/m2 plus a variable load of 2.5 kN/m2. The concrete class is C25/30, and the steel reinforcement grade is A400 [34]. Three 3D models were generated in SeismoStruct [23], considering different configurations, namely: (i) “BF model” is the model that simulates a bare frame configuration (only infills’ gravity load was considered); (ii) “FI model” is the model that simulates the RC structure with infill walls without openings, shown in Figure 6e; and (iii) “PI model” is the model that simulates the RC structure with the walls with a central opening, shown in Figure 6f.
The infill walls’ properties were assumed to be the same as those studied in Section 2. For the model PI, an opening percentage per wall of 16.2% was assumed. The input parameters used to simulate the walls were the same as those reported in Section 2.2.2.

3.2. Modal Analyses

The study of the modal properties started by comparing the natural frequencies and vibration modes of model BF with those obtained by the Portuguese Civil Engineering Laboratory. The natural frequencies obtained are: 1st frequency of 1.45 Hz (longitudinal mode), 2nd frequency of 1.45 Hz (transverse mode) and 3rd frequency of 1.83 Hz (torsion mode). After performing the modal analysis of the BF model, the following frequencies were obtained: 1st frequency of 1.54 Hz (+6%); 2nd frequency of 1.61 Hz (+6%); and 3rd frequency of 1.87 Hz (+2%). The numerical model captured well the original frequencies and the respective vibration modes.
After validating the numerical model, the modal analysis of the model FI and PI was performed to assess the impact of the infill walls and the openings on the modal properties of the buildings. The presence of the walls modified the first two vibration modes of the building. Moreover, it can be observed that the frequencies increased 2.62 times (1st mode), 3.09 times (2nd mode), and 3.78 times (3rd mode). By comparison, the openings reduced the frequencies slightly compared with the FI configuration. The reduction was about 18%, 20% and 21%, in the 1st, 2nd, and 3rd modes, respectively. The comparison between the BF, FI, and PI frequencies is shown in Figure 7.
To evaluate the effect of infill walls in each direction, it is important to calculate the ratio between the frequencies obtained for the various models in both directions, removing the effect of changing the order of the modes. It can be seen that the presence of the infill walls causes an increase in the frequencies about +3.23 times in the longitudinal direction and 2.50 times in the transverse direction. The openings do not cause any change in the order of the modes. The frequency increment is higher in the longitudinal direction since infill panels have a higher area in this direction.

3.3. Nonlinear Pushover Analyses

A pushover analysis was independently performed for both directions of the models. It consisted of applying an adaptative pushover, monotonically increasing lateral load profile, and exploring the nonlinear response of the structure. In this way, it was intended to identify the critical zones where the concentration of large deformations and, therefore, nonlinear behavior of the material, are expected. Thus, this analysis aimed to capture possible stiffness and/or strength irregularities in-height and/or in-plan, anticipating possible important changes in the dynamic response of the structure in a nonlinear regime. Moreover, this type of analysis can predict the sequence with which the structural elements yield and/or collapse, and the evolution of the capacity curve of the structure.
Figure 7b,c shows the capacity curves of the three models (BF, FI, and PI) obtained by the pushover analysis. These curves are defined by the evolution of the shear force that develops at the base as a function of the displacement of the top of the structure. From the capacity curves, the increase in the maximum shear force of the FI model can be observed, which is justified by the greater load capacity that the walls confer to it. The maximum base shear of the FI model is 48% and 20% higher than that of the BF and PI models, respectively, in the longitudinal direction. The values are similar in the transverse direction. A similar conclusion can be established concerning the initial with respect to the initial stiffness (slope of the initial section of the curve), with a more significant increase in this parameter in the longitudinal direction, which is due to having a larger wall area in this direction. In the longitudinal direction, the FI model reached an initial stiffness that was 640% and 120% higher than that of the BF and PI models.
With the openings’ introduction, a reduction in the maximum shear force of 17% and 22% was observed in the longitudinal and transverse directions, respectively. Regarding the initial stiffness of each of the models, the reduction caused by the openings was slightly more pronounced in the longitudinal direction, where there was a 54% reduction, whereas the reduction in stiffness in the transverse direction was a little smaller, around 42%.

3.4. Nonlinear Dynamic Analyses

Nonlinear incremental dynamic analyses were performed to study, with more precision, the dynamic behavior of the models with and without walls. Six real seismic records were used and progressively scaled to obtain the corresponding evolution of the maximum inter-story drift ratio and the base shear, as a function of the PGA intensity level (Figure 8). Each of these earthquakes was characterized by two independent accelerograms (one in each direction, longitudinal and transverse), which were simultaneously scaled in both directions. The PGA value was obtained by a quadratic combination of the maximum acceleration of each of these accelerograms. The scaling of each earthquake was intended to capture all phases of the structure response, from the elastic domain through yielding to the structure’s global nonlinear behavior, which, from the software point of view, begins to manifest itself with difficulties in numerical convergence of the analyses.
The average curves of the maximum inter-story drift values derived by the model for each pga of each accelerogram are plotted in Figure 9a,b. Analysis of the curves shows that, for pga lower than 0.3 g, the most vulnerable models are the BF (longitudinal direction) and PI models in the transverse direction. It is possible to observe that the evolution of the inter-story drift ratio of the FI model is similar in both directions, i.e., it increases significantly for pga higher than 0.3 g. The seismic response of the models appears to be slightly different in the longitudinal and transverse directions. For pga higher than 0.4 g, the FI model obtained the highest inter-story drift, followed by the BF and PI models.
Concerning the evolution of the maximum base shear (plotted in Figure 9c,d), it is possible to observe that the FI model values were 80% and 25% higher than those of BF and PI in the longitudinal direction, and 35 and 20% in the transverse direction. It can be seen that the openings reduced the maximum base shear, as expected. Finally, it can be concluded that the infill walls may significantly increase the shear forces that the building structures’ foundations are subjected to during a seismic action. The assessment of existing building structures must be carefully undertaken to study the possible need to strengthen their foundations.

4. Parametric Study

A parametric study was performed to evaluate the impact of four different variables: the openings’ vertical and in-plan irregular distribution and the ratio of the openings. The results were determined in terms of natural frequencies, the evolution of maximum inter-story drift ratio, and base shear. For this, modal and nonlinear static pushover analyses were performed.

4.1. Effect of Irregular Vertical Distribution (Scenario A)

The first parametric study evaluated the effect of the irregular distribution of openings in height. This aspect is expected to have relevance to the dynamic response of buildings. Four different scenarios were studied: (A1) model with walls without openings (FI) and with Floor 1 without walls; (A2) model A2 with walls with openings (PI) and with Floor 1 without walls; (A3) walls with openings on Floors 1 and 3; (A4) walls with openings on Floors 2 and 4, as illustrated in Figure 10.
Modal analyses were performed in all four models and the results were found to be in accordance with expectation (Figure 11a). Specifically, model FI presents the highest values for the frequencies of various vibration modes because it is the most rigid model of those that were analyzed. Concerning the remaining models, it is worth noting the importance of the absence of walls in Story 1. Indeed, in models A1 and A2, where Floor 1 is without walls, the natural frequencies are always lower than in any other case, where Floor 1 is filled with masonry panels (A3 and A4). This effect should be further enhanced if the significant difference between the frequencies obtained varies between 44% and 95%. In conclusion, the vertical distribution of the openings impacts the dynamic structural characteristics. The magnitude of this effect will also depend on the relationship between the area of the openings and the infill panels.
The capacity curves of each model of Scenario A are presented in Figure 11b,c. The initial stiffness and maximum strength of the FI model are higher than those of the remaining models. Along the longitudinal direction, the importance of having infill panels at the level of Floor 1 is evident, independently of what happens on the upper floors. The models in which Floor 1 is without walls present lower initial stiffness than the models in which this does not occur. In the transverse direction, the relevance of the existence of a soft-story can also be noted.
In terms of maximum strength, the model again presents irregularities concentrated on Floor 1 due to the lack of infill walls (A1 and A2) or the existence of openings (A3). The difference between the first three cases and the fourth case is clear. It can be seen in Figure 11b that the first three cases (A1, A2, and A3) are 10% to 25% less resistant than the reference model (FI). By comparison, in the case where Floor 1 is with walls without openings, despite the irregular distribution of openings on the upper floors, the strength capacity of this model is approximately equal to that of the FI model.

4.2. Effect of In-Plan Irregular Distribution (Scenario B)

To analyze the torsion phenomena of the building, which may be triggered by the distribution of in-plan openings, parametric study B was dedicated to evaluating the effects that may be caused by varying the location of walls with openings on the same floor. Three base scenarios were proposed and are illustrated in Figure 12. Each scheme presented in Figure 12 is repeated throughout the height of the respective building, i.e., it represents the location of each wall on any of the floors of the model.
However, all scenarios show the in-plan distribution of two different wall models, without opening (FI) and with opening (PI). The first two, B1 and B2, are symmetric in relation to the two main directions, longitudinal and transverse. Scenario B3, in addition to the irregular in-plan distribution of the walls with openings, presents an asymmetric configuration.
The results of this study are particularly interesting, with special attention to the B3 scenario, due to the asymmetry it presents. Thus, following the modal analysis (Figure 13a) performed for each scenario, the first aspect to highlight is the fact that the first two vibration modes of model B3, translation according to transverse direction (1st mode) and according to the longitudinal direction (2nd mode), are not entirely “pure” in each of these directions, i.e., despite being predominantly vibration modes of translation, they present some torsion effects. This torsional effect derives from the eccentricity that exists between the center of mass and the center stiffness of the structure, which leads the floors to rotate around the center of stiffness when the building is subject to horizontal forces, whose resultant acts on the center of mass. This is a classic problem in analyzing structures subject to horizontal actions. In this case, the referred effect is caused by the asymmetric distribution of the masonry walls with openings. Regarding the first two scenarios, B1 and B2, the exchanges that occur between the first two modes can be justified by the change in the relationship between stiffnesses in both directions with the exchange of positions of the walls without opening (FI) with the walls with openings (PI).
Concerning the analysis of the capacity curves (Figure 13a–c, it is possible to observe that the highest initial stiffness was achieved in FI and B1 (similar value), followed by B3 (−32%) and B2 (−56%). In the maximum strength, minor differences can be detected, i.e., B2 about −18% and B3 about −7%.

4.3. Effect of Openings Ratio (Scenario C)

The models (Figure 14) used in this study were identified as C1, C2, C3, and C4, which correspond to percentages of openings of 25%, 35%, 50%, and 65%, respectively. Naturally, it is expected that, with the increase in the area of the openings, the response is expected to be closer to a scenario without walls (BF).
The modal analysis results are plotted in Figure 15a. It is possible to observe that the values obtained decrease with the increase in the opening ratio, evolving consistently towards the expected results, since it is expected that stiffness decreases as the area of the openings increases. Furthermore, it should be emphasized that, even in scenario C4, in which the openings present the maximum area corresponding to 65% of the panel area, the order of vibration modes remains unchanged. This demonstrates that, even with such a large opening area, the walls contribute to the dynamic response of the structure (remember that the first vibration mode of the building without masonry walls is longitudinal, according to the longitudinal direction, and the second transverse mode, according to the transverse direction).
The capacity curves extracted from the nonlinear pushover analysis are plotted in Figure 15b,c. It can be seen that the initial stiffness values decrease as the area of openings increases. This agrees with expectations and is consistent with the evolution of the natural frequencies obtained in the modal analyses.
Regarding the maximum base shear, the values decrease from FI to PI and from PI to C1, as expected; but from scenario C1 to C2 and from C2 to C3, these values increase, presenting peaks that have similarity with reality, and then decrease again from C3 to C4. This inconsistency is explained by the fact that the wall models used in scenarios C1, C2, C3, and C4 were not calibrated, in contrast to Section 2 of this work, in which the FI and PI models were calibrated based on experimental results.

5. Conclusions

The present work analyzed the influence of infill masonry panels and their openings on the seismic behavior of reinforced concrete frame structures. For this purpose, comparative analyses were performed between several scenarios (without infill walls, with an irregular distribution, e.g., vertical and horizontal, percentage of openings, among others), where the masonry, without and with openings, comprised the main variables for evaluating their effects.
This work’s first objective was to validate a macro-model’s efficiency in simulating the seismic behavior of a masonry infill panel with a central opening and the other with an opening. Two numerical models were built and calibrated based on two in-plane experimental tests. It was observed that, to simulate the behavior of the panel with an opening, it was necessary to reduce the value of some parameters that characterize the properties of the strut elements. The parameters that control the model’s response in terms of initial stiffness, ultimate strength, strength degradation, and energy dissipation capacity were identified. The most influential parameters were, for panel initial stiffness, Em; for maximum strength, fmθ; and for shear strength, τo and μ. This was in addition to the area of the idealized strut (Ams1/Ams2). Concerning the comparison between the responses of the panel with and without openings, reductions in the initial stiffness (22%), maximum strength (40%), and energy dissipation (36%) were found.
Then, a four-story RC building structure was studied considering three different situations: (i) without infills; (ii) with full infills along the building envelope but without openings; and (iii) with full infills along the building envelope but with openings. From the numerical analysis, it was observed that the introduction of masonry wall panels caused an increase in the values of the natural frequencies ranging from 2.5 and 3.78 times. In turn, the openings caused a reduction in the natural frequencies of about 20% compared with the full infill (without openings). The introduction of masonry walls caused a modification in the direction of the first two vibration modes. The openings did not reverse this situation. It was also observed that the infill walls without openings increased the lateral stiffness by between 248 and 640% compared with the bare frame model. The openings reduced the initial stiffness by about 20% compared with the model without openings. The maximum strength increased by about 50% with the infill walls, but the openings reduced it by 20%. After reaching the peak load, a quick strength degradation was observed. The collapse of the walls limits the global failure mechanism of the building, i.e., the possible soft-story mechanism can be developed if the infill walls of the same story reach their limit.
Finally, four parametric studies were performed to understand the influence of several variables on the response of an infilled reinforced concrete building subjected to a given seismic action. The following variables were studied: vertical irregularities in the distribution of openings in the masonry walls (Scenario A) and in-plan (Scenario B), and variation in the area of the openings (Scenario C). Each scenario was studied and the following conclusions can be drawn:
  • The vertical irregularity due to the distribution of openings changes the dynamic characteristics of the building structure, namely, the natural frequencies are reduced by 66%. It also modifies the initial stiffness values and maximum resistance by between 10 and 25%. It was also observed that the collapse mechanisms vary due to the openings.
  • The in-plane irregularity in the opening distribution caused similar effects to those observed in Scenario A. The conclusions are identical to the previous case. In particular, the irregular horizontal distribution of the opening increases the potential for the torsional phenomena of the building. Reductions in the initial stiffness by between 32% and 56%, and in the maximum strength by around 7–18%, were also observed.
  • The importance of the area of the openings was studied and it was found that this variable also influences the dynamic response of the building. The increase in the openings area makes the model response more similar to that without masonry infill walls. A relevant aspect to consider is the way in which the numerical input properties are defined for the masonry infill walls, since they cannot be directly extrapolated.
In future works, it is suggested to investigate reduction factors that can be used to simulate the seismic behavior of walls with eccentric openings.

Author Contributions

Conceptualization, A.F. and A.A.; methodology, A.F.; software, H.R.; validation, A.F., A.A. and H.R.; investigation, A.F.; writing—original draft preparation, A.F.; writing—review and editing, A.F. and H.R.; supervision, A.A.; project administration, A.A. All authors have read and agreed to the published version of the manuscript.

Funding

The first author is grateful for the Foundation for Science and Technology’s support through funding UIDB/04625/2020 from the research unit CERIS. This work was also financially supported by: Base Funding–UIDB/04708/2020 and Programmatic Funding–UIDP/04708/2020 of the CONSTRUCT–Instituto de I&D em Estruturas e Construções–funded by national funds through the FCT/MCTES (PIDDAC). This work was also supported by the Foundation for Science and Technology (FCT)–Aveiro Research Centre for Risks and Sustainability in Construction (RISCO), Universidade de Aveiro, Portugal [FCT/UIDB/ECI/04450/2020].

Institutional Review Board Statement

Not applicable.

Informed Consent Statement

Not applicable.

Acknowledgments

The authors would also like to express a special acknowledgement to the reviewers for their valuable suggestions that increased the manuscript quality.

Conflicts of Interest

The authors declare no conflict of interest.

References

  1. Eurocode 8: Design of Structures for Earthquake Resistance—Part 1-1: General Rules, Seismic Actions and Rules for Buildings, B; European Committee for Standardization: Brussels, Belgium, 2005.
  2. De Luca, F.; Verderame, G.M.; Gómez-Martínez, F.; Pérez-García, A. The structural role played by masonry infills on RC building performances after the 2011 Lorca, Spain, earthquake. Bull. Earthq. Eng. 2014, 12, 1999–2026. [Google Scholar] [CrossRef] [Green Version]
  3. Hermanns, L.; Fraile, A.; Alarcón, E.; Álvarez, R. Performance of buildings with masonry infill walls during the 2011 Lorca earthquake. Bull. Earthq. Eng. 2014, 12, 1977–1997. [Google Scholar] [CrossRef] [Green Version]
  4. Del Gaudio, C.; De Risi, M.T.; Scala, S.A.; Verderame, G.M. Seismic Loss Estimation in Pre-1970 Residential RC Buildings: The Role of Infills and Services in Low–Mid-Rise Case Studies. Front. Built Environ. 2020, 6, 589230. [Google Scholar] [CrossRef]
  5. Furtado, A.; Rodrigues, H.; Arêde, A. Effect of the infill panels in the floor response spectra of an 8-storey RC building. Structures 2021, 34, 2476–2498. [Google Scholar] [CrossRef]
  6. Asteris, P.G.; Chrysostomou, C.Z.; Giannopoulos, I.P.; Smyrou, E. Masonry infilled reinforced concrete frames with openings. In Proceedings of the ECCOMAS Thematic Conference—COMPDYN 2011: 3rd International Conference on Computational Methods in Structural Dynamics and Earthquake Engineering: An IACM Special Interest Conference, Programme, Antalya, Turkey, 23–25 May 2011; Available online: https://www.scopus.com/inward/record.uri?eid=2-s2.0-80054798067&partnerID=40&md5=3faf9c541e209ce7e4aa12f6607f3217 (accessed on 20 June 2021).
  7. Alinouri, H.; Danesh, F.A.; Beheshti-Aval, S.B. Effect of soft-storey mechanism caused by infill elimination on displacement demand in nonlinear static procedure using coefficient method. Struct. Des. Tall Spéc. Build. 2013, 22, 1296–1309. [Google Scholar] [CrossRef]
  8. Furtado, A.; De Risi, M.T. Recent Findings and Open Issues concerning the Seismic Behaviour of Masonry Infill Walls in RC Buildings. Adv. Civ. Eng. 2020, 2020, 9261716. [Google Scholar] [CrossRef] [Green Version]
  9. Alcocer, S.M.; Murià-Vila, D.; Fernández-Sola, L.R.; Ordaz, M.; Arce, J.C. Observed damage in public school buildings during the 2017 Mexico earthquakes. Earthq. Spectra 2020, 36 (Suppl. S2), 110–129. [Google Scholar] [CrossRef]
  10. Alcocer, S.M.; Arce, J.C.; Murià-Vila, D.; Fernández-Sola, L.R.; A Guardia, D. Assessment of the seismic safety of school buildings in Mexico: A first look. Earthq. Spectra 2020, 36 (Suppl. S2), 130–153. [Google Scholar] [CrossRef]
  11. Alberto, Y.; Otsubo, M.; Kyokawa, H.; Kiyota, T.; Towhata, I. Reconnaissance of the 2017 Puebla, Mexico earthquake. Soils Found. 2018, 58, 1073–1092. [Google Scholar] [CrossRef]
  12. Lafuente, M.; Genatios, C. On the Seismic-Resistant Behavior of Masonry Infill Walls with Concrete Frames. Bol. Tec-Nico/Tech. Bull. 1998, 36, 29–52. Available online: https://www.scopus.com/inward/record.uri?eid=2-s2.0-0346971113&partnerID=40&md5=29c3d267804199738e93dcf41ec98206 (accessed on 20 June 2021).
  13. Afefy, H.M.; Taher, S.F.; Khalil, A.A.; Issa, M.E. Nonlinear Response of Reinforced Concrete Infilled Frames under Lateral Dynamic Excitations. J. Eng. Appl. Sci. 2001, 48, 1149–1163. Available online: https://www.scopus.com/inward/record.uri?eid=2-s2.0-0035732848&partnerID=40&md5=77a23c6d107ca5779ddaf900efb7982b (accessed on 20 June 2021).
  14. Da Porto, F.; Donà, M.; Verlato, N.; Guidi, G. Experimental Testing and Numerical Modeling of Robust Unreinforced and Reinforced Clay Masonry Infill Walls, With and Without Openings. Front. Built Environ. 2020, 6, 591985. [Google Scholar] [CrossRef]
  15. Ahani, E.; Mousavi, M.N.; Ahani, A.; Kheirollahi, M. The Effects of Amount and Location of Openings on Lateral Behavior of Masonry Infilled RC Frames. KSCE J. Civ. Eng. 2019, 23, 2175–2187. [Google Scholar] [CrossRef]
  16. Sigmund, V.; Penava, D. Influence of Openings, with and without Confinement, on Cyclic Response of Infilled R-C Frames—An Experimental Study. J. Earthq. Eng. 2013, 18, 113–146. [Google Scholar] [CrossRef] [Green Version]
  17. Khoshnoud, H.R.; Marsono, K. Experimental study of masonry infill reinforced concrete frames with and without corner openings. Struct. Eng. Mech. 2016, 57, 641–656. [Google Scholar] [CrossRef]
  18. Kakaletsis, D.; Karayannis, C. Influence of Masonry Strenght and Openings on Infilled R/C Frames Under Cycling Load-ing. J. Earthq. Eng. 2008, 12, 197–221. [Google Scholar] [CrossRef]
  19. Zhai, C.; Kong, J.; Wang, X.; Chen, Z. Experimental and Finite Element Analytical Investigation of Seismic Behavior of Full-Scale Masonry Infilled RC Frames. J. Earthq. Eng. 2016, 20, 1171–1198. [Google Scholar] [CrossRef]
  20. Asteris, P.; Cotsovos, D.; Chrysostomou, C.; Mohebkhah, A.; Al-Chaar, G. Mathematical micromodeling of infilled frames: State of the art. Eng. Struct. 2013, 56, 1905–1921. [Google Scholar] [CrossRef]
  21. Asteris, P.; Cavaleri, L.; Di Trapani, F.; Tsaris, A. Numerical modelling of out-of-plane response of infilled frames: State of the art and future challenges for the equivalent strut macromodels. Eng. Struct. 2017, 132, 110–122. [Google Scholar] [CrossRef]
  22. Furtado, A.; Rodrigues, H.; Arêde, A. Experimental and numerical assessment of confined infill walls with openings and textile-reinforced mortar. Soil Dyn. Earthq. Eng. 2021, 151, 106960. [Google Scholar] [CrossRef]
  23. SeismoStruct—A Computer Program for Static and Dynamic Nonlinear Analysis of Framed Structures. Available online: http://www.seismosoft.com (accessed on 20 June 2021).
  24. Calabrese, A.; de Almeida, J.P.; Pinho, R.J.S.M. Numerical Issues in Distributed Inelasticity Modeling of RC Frame Elements for Seismic Analysis. J. Earthq. Eng. 2010, 14, 38–68. [Google Scholar] [CrossRef]
  25. Sadeghi, K. Nonlinear Numerical Simulation of Reinforced Concrete Columns Under Cyclic Biaxial Bending Moment and Axial Loading. Int. J. Civ. Eng. 2017, 15, 113–124. [Google Scholar] [CrossRef]
  26. Mander, J.B.; Priestley, M.J.N.; Park, R. Theoretical Stress-Strain Model for Confined Concrete. J. Struct. Eng. 1988, 114, 1804–1826. [Google Scholar] [CrossRef] [Green Version]
  27. Menegotto, M.; Pinto, P. Method of analysis for cyclically loaded reinforced concrete plane frames including changes in geometry and non-elastic behaviour of elements under combined normal force and bending. In Symposium on the Resistance and Ultimate Deformability of Structures Acted on by Well Defined Repeated Loads; International Association for Bridge and Structural Engineering: Zurich, Switzerland, 1973; pp. 15–22. [Google Scholar]
  28. Crisafulli, F.J. Seismic behaviour of reinforced concrete structures with masonry infills. In Civil Engineering; University of Canterbury: Christchurch, New Zealand, 1997. [Google Scholar]
  29. Smyrou, E.; Blandon, C.; Antoniou, S.; Pinho, R.; Crisafulli, F. Implementation and verification of a masonry panel model for nonlinear dynamic analysis of infilled RC frames. Bull Earthq. Sci. 2011, 9, 1519–1534. [Google Scholar] [CrossRef]
  30. Furtado, A.; Costa, C.; Arêde, A.; Rodrigues, H. Geometric characterisation of Portuguese RC buildings with masonry infill walls. Eur. J. Environ. Civ. Eng. 2016, 20, 396–411. [Google Scholar] [CrossRef]
  31. Rodrigues, H.; Varum, H.; Arêde, A.; Costa, A. A comparative efficiency analysis of different non-linear modelling strategies to simulate the biaxial response of RC columns. Earthq. Eng. Eng. Vib. 2012, 11, 553–566. [Google Scholar] [CrossRef] [Green Version]
  32. Furtado, A.; Rodrigues, H.; Arêde, A. Load-Path Influence in the Response of RC Buildings Subjected to Biaxial Horizontal Loadings: Numerical Study. Int. J. Civ. Eng. 2017, 16, 739–755. [Google Scholar] [CrossRef]
  33. Crisafulli, F.J.; Carr, A.J. Proposed macro-model for the analysis of infilled frame structures. Bull. N. Z. Soc. Earthq. Eng. 2007, 40, 69–77. [Google Scholar] [CrossRef]
  34. Carvalho, E.; Coelho, E. Análise Sísmica de Estruturas de Edifícios Segundo a Nova Regulamentação—Análise Estrutural de um Conjunto de 22 Edifícios; Lisbon, Portugal, 1984. [Google Scholar]
Figure 1. Modeling strategy adopted for the masonry infill walls: (a) under compression; and (b) under shear.
Buildings 12 02020 g001
Figure 2. RC frame geometry and reinforcement detailing.
Buildings 12 02020 g002
Figure 3. Test setup of the in-plane experimental tests: (a) detail of the hydraulic actuator; and (b) lateral view.
Buildings 12 02020 g003
Figure 4. Numerical simulation of the specimen Inf_12 (wall w/o opening): (a) force–displacement curves; and (b) cumulative energy dissipation.
Buildings 12 02020 g004
Figure 5. Numerical simulation of the specimen Inf_14 (wall w/ opening): (a) force–displacement curves; and (b) cumulative energy dissipation.
Buildings 12 02020 g005
Figure 6. Case study: (a) plan view; and (b) general view of the BF model; (c) columns’ cross-section; (d) beams’ cross-section; (e) FI model; and (f) PI model.
Buildings 12 02020 g006aBuildings 12 02020 g006b
Figure 7. Numerical results. (a) Natural frequencies. Capacity curve (pushover analysis): (b) longitudinal direction; and (c) transverse direction.
Buildings 12 02020 g007
Figure 8. Elastic spectrum (type 1).
Buildings 12 02020 g008
Figure 9. Nonlinear dynamic analyses: maximum inter-story drift ratio: (a) longitudinal and (b) transverse direction. Maximum base shear: (c) longitudinal and (d) transverse direction.
Buildings 12 02020 g009
Figure 10. Models under study in Scenario A.
Buildings 12 02020 g010
Figure 11. Parametric study A: (a) natural frequencies; (b) capacity curve (longitudinal direction); and (c) capacity curve (transverse direction).
Buildings 12 02020 g011
Figure 12. Models under study in Scenario B.
Buildings 12 02020 g012
Figure 13. Parametric study B: (a) natural frequencies; (b) capacity curve (longitudinal direction); and (c) capacity curve (transverse direction).
Buildings 12 02020 g013
Figure 14. Models under study in Scenario C.
Buildings 12 02020 g014
Figure 15. Parametric study C: (a) natural frequencies; (b) capacity curve (longitudinal direction); and (c) capacity curve (transverse direction).
Buildings 12 02020 g015
Table 1. Input material properties adopted for the masonry infill walls.
Input ParametersInf_12
(Panel w/o Opening)
Inf_14
(Panel w/ Opening)
Percentage of Reduction (%)
Strut
Elements
Em (Kpa)2,500,0002,000,00020
f (Kpa)47037620
ft (kPa)1001000
εm (%)0.000060.000060
εu (%)0.030.030
εcl (%)0.0030.0030
ε1 (%)0.000380.000380
ε2 (%)0.002950.002950
γun1.501.500
αre0.300.300
αch0.450.450
βa1.751.750
βch0.650.650
γplu0.600.600
γplr1.251.250
ex11.751.750
ex21.251.250
Shear
Elements
τo1008020
Μ0.700.70
τmax2002000
αs1.51.50
General propertiest (m)0.150.150
OOP failure drift (%)550
Ams1 (m2)0.190.1520
Ams2 (% of Ams1)504020
hz (% of vertical panel side)0.550.550
Ks (kN/m)151220
Self-weight (N/m3)98.584.415
Em is the elastic modulus; fmθ is the masonry compressive strength along its inclination; ft is the masonry tensile strength; εm is the maximum strain; εu is the ultimate strain; εcl is the closing strain; γun, αre, αch, βa, βch, γplu, γplr, ex1, ex2 are empirical parameters; μ is the friction coefficient; τmax is the maximum shear strength; αs is an empirical parameter; t is the wall thickness; Ams1 and Ams2 are the strut area and reduced strut area, respectively; Ks is the masonry stiffness; and hz is the vertical distance between struts.
Publisher’s Note: MDPI stays neutral with regard to jurisdictional claims in published maps and institutional affiliations.

